dart mining nl annual report 2013 for … · and development company that has discovered and is ......
TRANSCRIPT

DART MINING NLANNUAL REPORT 2013
For
per
sona
l use
onl
y

2
Contents
2012/13 – Highlights 1
2013/14 – Outlook 1
Chairman’s Report 2
Managing Director’s Report 3
Exploration Review 4
Unicorn Project 11
Community 15
Health and Safety 15
Board of Directors 16
Financial Report 17
Corporate Directory
INSIDE BACK COVER
About Dart Mining NLDart Mining NL (ASX:DTM) is a Melbourne-based exploration and development company that has discovered and is seeking to develop a new mineralised porphyry province in north east Victoria. The Dart province hosts molybdenum (Mo), copper (Cu), silver (Ag), zinc (Zn), tin (Sn) and gold (Au) mineralisation in porphyry igneous intrusions. It lies adjacent to the Gilmore suture with numerous intersecting splay faults. NSW is a proven host of world class porphyry mines associated with splay structures off the Gilmore Suture such as North Parkes, Cadia and Ridgeway, as is the Stockman Copper, Zinc, Silver and Gold VMS project in Victoria about 35km south of Dart Mining’s tenements.
The Unicorn Project, which is Dart Mining’s principal project, is a molybdenum (Mo), copper (Cu) and silver (Ag) Climax-style porphyry that has similar geological characteristics to the world class Henderson Climax-style primary Mo porphyry mine in Colorado USA. The Unicorn Project has a number of unique characteristics. It outcrops, has an extensive high grade zone from surface, is about 20km from the National Electricity Market infrastructure (hydro generation, switchyards and transmission lines), has road access, an existing logistics chain from mine to market, and has community and government support.
Dart Mining completed a detailed preliminary economic assessment (scoping study) for the Unicorn Project in October 2012. It yielded very favourable economic results and warranted the undertaking by Dart Mining of the proposed prefeasibility studies. The Prefeasibility Study for Unicorn is underway with a targeted completion date of Q1 2014.
Dart Mining’s tenements at June 30, 2013
Business PurposeEnhancing shareholder value through the exploration and development of gold and metal projects where Dart Mining can develop a competitive advantage.
Key Objectivesn Create wealth for our Shareholdersn Ensure safety, health and environment is a key focus along
with supporting the communities in which we operaten Identify a cornerstone investor that wants to secure
Molybdenum offtake and fund Unicorn through to development by investing in Unicorn at a project level
n Further explore Dart Mining’s North East Victorian tenements to identify further multi metal porphyry and high grade gold deposits
n Utilise Dart Mining’s strong cash position, its key broker network, and the current junior market downturn to identify opportunities for growth
n Strengthen our relationship with Government, community and stakeholders in the regions in which we operate
For
per
sona
l use
onl
y

1
Highlights & Outlook
n JORC Resource for Unicorn Project doubled to 203 million tonnes and upgraded to include Measured, Indicated and Inferred Resource
n Scoping study released showing very favorable project economics
n Red Kite agrees to invest up to $10m into Unicorn and Dart Mining
n Deep drilling identifies additional high grade zones below main JORC ore body
n Prefeasibility Metallurgy and Geotechnical drilling program completed
n Prefeasibility study underway with new Project Director appointed
2012/2013 – Highlights
2013/2014 – Outlook
n Undertake further metallurgical testing on the Unicorn ore body
n Commence environmental approval process for Unicornn Implement community engagement strategies as the EES
process gets underway n Complete Unicorn prefeasibility study by Q1 2014n Secure second tranche of Red Kite funding by meeting
required hurdlesn Intensify regional exploration within existing North
Eastern Victorian tenementsn Leverage strong cash position to broaden Dart Mining’s
footprint beyond NE Victoria by securing additional exploration projects
For
per
sona
l use
onl
y

2
Chairman’s Report
On behalf of the board of directors it gives me great pleasure to present the Dart Mining NL Annual Report for the year to June 2013, a year that has seen Dart achieve a number of significant milestones in the evaluation of Unicorn molybdenum-copper-silver project.”
Dear Shareholders,
Ongoing drilling has upgraded the initial Indicated and Inferred JORC Resource at Unicorn to a Measured, Indicated and Inferred Resource confirming that a higher grade zone of mineralisation outcrops from surface. Importantly a scoping study designed to look at the economics of developing a mine at Unicorn under a number of different scenarios was completed in October 2012. The results showed that there is clear potential for a development under consensus forecast metal market conditions and this has encouraged Dart to take the next steps in evaluating the project.
Financial markets have remained volatile and have been effectively closed to conventional capital raisings over the past year, despite this Dart Mining’s financial position has continued to strengthen. In March Dart Mining signed a funding package with the US metal trading and investment group RK Mine Finance (Red Kite). This provided a staged investment consisting of a small equity placement in Dart and the purchase by Red Kite of a royalty on future net sales revenue from the Unicorn project. (Further details have been provided elsewhere in this Annual Report.) The most pleasing aspect of this investment by Red Kite is that their extensive due diligence confirmed the potential of the Unicorn project to be developed into a long term metal producing mine.
The Red Kite funding has enabled Dart to commit to a Prefeasibility study on the Unicorn Project that will result in the selection of mining, processing, infrastructure and related technical requirements to take the project to the next stage. In addition Dart has recently submitted an EES referral to the Victorian Government that will set the environmental parameters necessary for the project.
Dart continues to be fully engaged with the local community near the project and in the town of Corryong and regularly conducts meetings with various interested parties and government. The Company is grateful for the consistent support for the unicorn project shown by the community.
Despite continuing weakness in molybdenum markets Dart remains of the view that the Unicorn project can make a successful mine and Dart needs to be ready to proceed with development as metal markets recover rather than stand back and so that other projects outside Australia get the early running.
I thank Dart’s employees and key contractors under the leadership of Managing Director Lindsay Ward, and my fellow Directors, for their vision and commitment that has enabled
Dart to make significant progress at Unicorn and look forward to reporting continuing progress by Dart Mining over the coming year.
Chris BainChairmanAugust 2013
“F
or p
erso
nal u
se o
nly

3
Managing Director’s Report
Dart Mining has achieved very important milestones over the past twelve months especially Red Kite’s (US-based metal merchant) up to $10M investment in the Unicorn project, of which $5.3M has been received. Much of the investment ($8.5M) is non-dilutive for shareholders and the investment decision was based on Red Kite detailed due diligence on the Unicorn project.
The ability for junior explorers to raise money over the past two years, and particularly the past six months, has been challenging. However, with Red Kite on board, Dart Mining for the first time since listing in 2007 has been able to continue its strong project development focus without immediate worries of raising additional capital.
Pleasingly, our Company has achieved a year without a safety or environmental incident and with the development of a new safety management system, Dart Mining is well placed to remain injury free for the next twelve months.
Dart Mining has continued to meet regularly with the community, local council, government departments and state government Ministers on Unicorn progress and with our endeavour to be in production from early 2017.
As the approvals process including an environmental effects statement moves forward, Dart Mining will need to work hard to keep the community informed of our development plans
Looking back over the past twelve months of exploration work, I think shareholders can be very pleased with the progress in advancing the company’s Unicorn deposit closer to development.”
“and provide opportunities for the community to have input. The benefits to the local, regional and state economies of a potential mine including the direct employment of 85 people will be significant and must be balanced against the environmental effects of mining.
The year ahead is focused on further de-risking the Unicorn project with Dart Mining planning to release the prefeasibility study in the first quarter of 2014. Dart Mining is also determined to identify further potential cornerstone investors as well as use the current downturn in the junior explorers market to identify opportunities to expand our north-east Victoria footprint.
I thank our shareholders, staff and fellow directors for their ongoing support and I look forward to moving a year closer to mining Unicorn by next year’s annual report.
Lindsay WardManaging DirectorAugust 2013
For
per
sona
l use
onl
y

4
Exploration Review
Tenement number Name Area km2
EL 4724 Buckland 212
EL 4726 Dart 680
EL 5131 Bunroy 166
EL 5132 Boebuck 126
EL 5058 Cudgewa 413
EL 5194 Mt. Alfred 95
Tenement Overview
Dart Mining owns a 100% beneficial interest in six granted tenements in north east Victoria. Each of the tenements are shown on the map with their names and areas listed in the table below.
For
per
sona
l use
onl
y

5
Scoping Study
Exploration Review
A scoping study (preliminary economic assessment) was completed in October 2012. The scoping study looked at three mining rates (5Mtpa / 7.5Mtpa / 10Mtpa) with ore being drilled and blasted, then moved by front end loader to in pit crushers for delivery to twin inclined ore passes using gravity to feed the ore down to a conveyor decline beneath the open pit. The crushed material is captured in twin apron feeders that progressively feed the ore onto a conveyor for transport to the processing plant.
Processing will use a conventional SAG, ball and pebble crushing comminution circuit, flotation, filtration concentrate storage, load-out and associated site infrastructure requirements. Separate molybdenum and copper/silver concentrates will be produced for sale.
The favourable project location compared to many other potential Australian resource projects, will enable Unicorn to be a residential mine and not a fly-in / fly-out operation, resulting in significant cost savings.
Key Scoping Study Financial Parameters
n Initial mine life of 14 years with strong potential to increase to 20 years
n 10Mtpa production gives best financial result due to economies of scale
n Pre-tax IRR 27% at a discount rate of 10%n Payback less than 2.5 yearsn NPV (100% equity) $255million based on initial 14 year
mine lifen Additional 6 year mine life could add approx
$50 - 70million NPVn $3.58 cash cost / lb Mo (net of credits) places Unicorn in
lowest cost quartilen Capital cost $304million with production targeted to
commence mid-2016
For
per
sona
l use
onl
y

6
Exploration Review
DUNRC001 was drilled outside the resource area to test a 3D IP anomaly to the west of the Unicorn deposit. The RC hole was suspended at 184.5m (due to heavy water) for diamond tail follow up (DUNDD011). Diamond tail DUNDD011 shows significant zinc mineralisation within sub-vertical fault zones and may represent a ring fracture system around the Unicorn Porphyry; similar distal base metal and silver mineralisation is a common feature of many porphyry deposits worldwide. The presence of dominant pyrrhotite over pyrite co-incident with the anomaly indicates a reduced fluid system with anomalous copper showing as minor chalcopyrite inclusions. The significant IP anomaly is likely to have resulted from intense pyrrhotite mineralisation (a magnetic sulphide) associated with zones of sphalerite in distal ring faults. Intersections of 10m @ 0.5% Zn and 4.93 g/t Ag (including 2m @ 13.55 g/t Ag) within the IP anomaly illustrate the style of mineralisation introduced along fault structures distal to the Unicorn Mo – Cu – Ag deposit (Table 2).
As part of the resource update a 62m saw cut channel sample (DUNCS001) was collected from an exposed gully on the west side of the deposit. Samples were collected over 2 metre intervals using a petrol powered diamond saw. The results from the 62m sample line were ustilised as part of the resource update assay information (Table 2). This sampling data illustrates the high grade nature of mineralisation at surface with up to 22m @ 0.09% MoEq1 within 62m @ 0.07% MoEq1. DUNDD010 (a diamond tail from DUNRC017) was also used in the resource update with highlights of 86.6m @ 0.07% MoEq1 below 261.4m including 28m @ 0.1% MoEq1 (Table 2).
Exploration Drilling – Unicorn Area
For
per
sona
l use
onl
y
7
Exploration Review
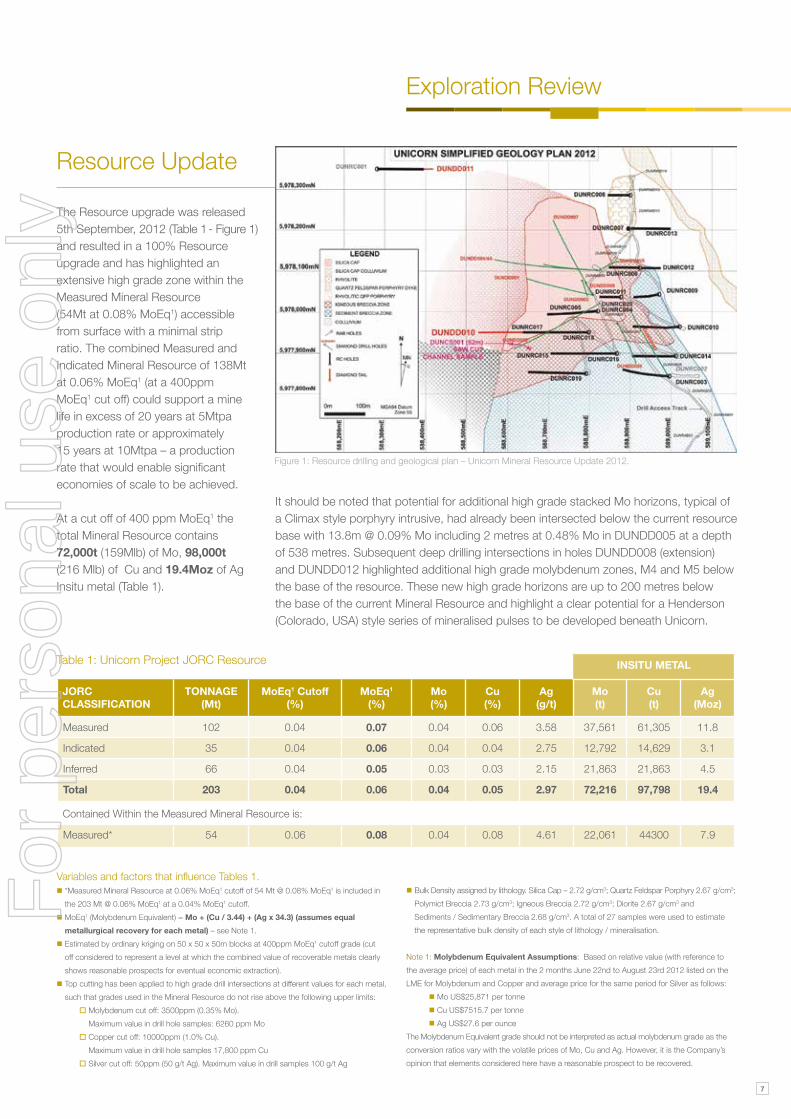
The Resource upgrade was released 5th September, 2012 (Table 1 - Figure 1) and resulted in a 100% Resource upgrade and has highlighted an extensive high grade zone within the Measured Mineral Resource (54Mt at 0.08% MoEq1) accessible from surface with a minimal strip ratio. The combined Measured and Indicated Mineral Resource of 138Mt at 0.06% MoEq1 (at a 400ppm MoEq1 cut off) could support a mine life in excess of 20 years at 5Mtpa production rate or approximately 15 years at 10Mtpa – a production rate that would enable significant economies of scale to be achieved.
At a cut off of 400 ppm MoEq1 the total Mineral Resource contains 72,000t (159Mlb) of Mo, 98,000t (216 Mlb) of Cu and 19.4Moz of Ag Insitu metal (Table 1).
Variables and factors that influence Tables 1.n *Measured Mineral Resource at 0.06% MoEq1 cutoff of 54 Mt @ 0.08% MoEq1 is included in
the 203 Mt @ 0.06% MoEq1 at a 0.04% MoEq1 cutoff.n MoEq1 (Molybdenum Equivalent) = Mo + (Cu / 3.44) + (Ag x 34.3) (assumes equal
metallurgical recovery for each metal) – see Note 1.n Estimated by ordinary kriging on 50 x 50 x 50m blocks at 400ppm MoEq1 cutoff grade (cut
off considered to represent a level at which the combined value of recoverable metals clearly shows reasonable prospects for eventual economic extraction).
n Top cutting has been applied to high grade drill intersections at different values for each metal, such that grades used in the Mineral Resource do not rise above the following upper limits:
o Molybdenum cut off: 3500ppm (0.35% Mo). Maximum value in drill hole samples: 6260 ppm Mo
o Copper cut off: 10000ppm (1.0% Cu). Maximum value in drill hole samples 17,800 ppm Cu
o Silver cut off: 50ppm (50 g/t Ag). Maximum value in drill samples 100 g/t Ag
Figure 1: Resource drilling and geological plan – Unicorn Mineral Resource Update 2012.
It should be noted that potential for additional high grade stacked Mo horizons, typical of a Climax style porphyry intrusive, had already been intersected below the current resource base with 13.8m @ 0.09% Mo including 2 metres at 0.48% Mo in DUNDD005 at a depth of 538 metres. Subsequent deep drilling intersections in holes DUNDD008 (extension) and DUNDD012 highlighted additional high grade molybdenum zones, M4 and M5 below the base of the resource. These new high grade horizons are up to 200 metres below the base of the current Mineral Resource and highlight a clear potential for a Henderson (Colorado, USA) style series of mineralised pulses to be developed beneath Unicorn.
INSITU METAL
JORC CLASSIfICATION
TONNAGE (Mt)
MoEq1 Cutoff(%)
MoEq1 (%)
Mo(%)
Cu(%)
Ag(g/t)
Mo(t)
Cu(t)
Ag(Moz)
Measured 102 0.04 0.07 0.04 0.06 3.58 37,561 61,305 11.8
Indicated 35 0.04 0.06 0.04 0.04 2.75 12,792 14,629 3.1
Inferred 66 0.04 0.05 0.03 0.03 2.15 21,863 21,863 4.5
Total 203 0.04 0.06 0.04 0.05 2.97 72,216 97,798 19.4
Contained Within the Measured Mineral Resource is:
Measured* 54 0.06 0.08 0.04 0.08 4.61 22,061 44300 7.9
Table 1: Unicorn Project JORC Resource
Resource Update
n Bulk Density assigned by lithology. Silica Cap – 2.72 g/cm3; Quartz Feldspar Porphyry 2.67 g/cm3; Polymict Breccia 2.73 g/cm3; Igneous Breccia 2.72 g/cm3; Diorite 2.67 g/cm3 and Sediments / Sedimentary Breccia 2.68 g/cm3. A total of 27 samples were used to estimate the representative bulk density of each style of lithology / mineralisation.
Note 1: Molybdenum Equivalent Assumptions: Based on relative value (with reference to the average price) of each metal in the 2 months June 22nd to August 23rd 2012 listed on the LME for Molybdenum and Copper and average price for the same period for Silver as follows:
n Mo US$25,871 per tonnen Cu US$7515.7 per tonnen Ag US$27.6 per ounce
The Molybdenum Equivalent grade should not be interpreted as actual molybdenum grade as the conversion ratios vary with the volatile prices of Mo, Cu and Ag. However, it is the Company’s opinion that elements considered here have a reasonable prospect to be recovered.
For
per
sona
l use
onl
y

8
Exploration Review
Further High Grade Zones M4 and M5 Intersected
The high grade M4 zone, just below the current base of the resource is yet to be included in the JORC Resource but may extend the open pit mine life subject to further resource definition drilling. With grades up to 22m @ 0.1% MoEq1 in M4 and 18m @ 0.09% Mo in M5, the depth potential of the deposit appears very positive. Interpretation of the deep drilling results further illustrates that Unicorn continues to show marked similarities to the Climax / Henderson style of mineralisation with multiple high grade stacked mineralised horizons. This, together with evidence of multiple intrusive pulses at Unicorn, confirms the potential to develop a long term resource base at depth.
A new high grade Mo horizon M5 has been intersected from 692m showing up to 18m at 0.09% Mo (including 12m @ 0.1% Mo) within a larger zone of 56m @ 0.06% Mo (Table 2). Deeper mineralisation at Unicorn would appear to be more like other primary molybdenum deposits as it does not show significant copper, consistent with the Climax-style porphyry model applied to the Unicorn deposit.
n M3 zone in DUNDD008 extended by 52m to 92m @ 0.07% MoEq1 including 18m @ 0.12% MoEq1 and 4m @ 0.22% MoEq1
n New M4 zone provides potential to extend open pit mine life to 20 years with 22m @ 0.1% MoEq1 including 12m @ 0.12% MoEq1
n New high grade zone “M5” intersected from approximately 690m to 750m from surface
n Narrow high grade base metals (plus silver) intersected between 500m and 654m
n Second deep hole DUNDD012 completed to a depth of 1194m ending in porphyry
n First anomalous gold at Unicorn intersected within sulphide veins hosted in low grade porphyry pulse
The Unicorn deep drilling program was designed to test the continuity of Unicorn’s mineralisation below the current JORC Resource. Two holes have been completed, one of which DUNDD012 was extended to 1194 metres below surface and ended in mineralised porphyry. The deep drilling has been very successful, confirming the extent of the M3 zone within the current JORC resource and intersecting several new zones of high grade molybdenum mineralisation (M4 and M5) including discrete zones of base metals and for the first time at Unicorn, indications of anomalous gold.
Deep Diamond Drill Program Completed
For
per
sona
l use
onl
y

9
Exploration Review
Hole No. Hole Dip Hole Azimuth (MGA Grid)
MGA East (m)
MGA North (m)
RL AHD (m)
Total Depth (m)
DUNDD008 -84 322 588,807 5,978,044 861 695.8
DUNDD010 -46.1 263.5 588,800.8 5,977,950.1 840.0 381.2
DUNDD011 -69.2 96.1 588,280.0 5,978,350.0 580.0 230.5
DUNDD012 -86.8 164.5 588,790.0 5,977,854.0 814 1,194.0
DUNCS001 -37.5 311.0 588,656.2 5,977,914.3 747.3 62
Table 2: Significant Assay Intervals – EXPLORATION DRILLING 2012
Narrow high grade base metals (plus silver) intersected between 500m and 654m
Assay data between 498 and 507m and corresponding with visible massive sulphide veining and brecciation is showing a zone of strong base metals and weak gold mineralisation - refer Table 2. These late stage (cool) base metal sulphide veins are composed of sphalerite and galena in a silica/carbonate host and have also been observed in the upper parts of the deposit, especially associated with the southern breccia system.
Anomalous gold has not previously been associated with mineralisation at Unicorn, so the intersection of 1m at 1.6 g/t Au (502 – 503m) is interesting and represents the highest grade gold intersection within drilling to date (Table 2).
Further high grade silver and also the first significant tungsten assay results have also been intersected near a major rock type change and fault zone below 620m. Tungsten is often associated with the deeper zones of porphyry Mo systems and is associated with hotter fluids, this is a further positive sign that additional high grade Mo pulses maybe present at depth within Unicorn.
While the intersection of strong base metal at approximately 500m in DUNDD012 is not economic, the elevated gold indicates that the fluids that circulated late in the history of the deposit carried low level gold mineralisation as well as Zn, Pb and Ag and represent an exploration target adjacent to the porphyry, already highlighted in soil and rock chip geochemistry programs for follow-up.
The M5 high grade zone below 690m in DUNDD012 represents the fifth known horizon of high grade mineralisation within Unicorn; it is some 200m below the new M4 zone and some 700m below surface. The 200m interval between M4 and this additional high grade zone remains poorly drill tested in the northern part of the deposit due to insufficient drilling. (refer Figure 2).
Figure 2: Composite Longsection looking east. Geological Interpretation of DUNDD008 (extension) and DUNDD012.
Collar co-ordinates are measured by GPS location.
For
per
sona
l use
onl
y

10
Exploration Review
Hole No. from (m)
To (m)
Significant Intersections(Zn)
Significant Intersections(Ag)
DUNDD011 202 212 10m @ 0.5% Zn 10m @ 4.93 ppm Ag
DUNDD011 208 210 Inc: 2m @ 2% Zn Inc: 2m @ 13.55 ppm Ag
DUNDD011 222 230.5 8.5m @ 0.3% Zn 8.5m @ 3.29 ppm Ag
Note 1: MoEq1 (Molybdenum Equivalent) = Mo + (Cu/3.44) + (Ag x34.3) (assumes equal metallurgical recovery for each metal) Analysis performed on 1/2 HQ or NQ core over nominal 2m intervals with the assay data length weighted over each reported interval. Mo, Cu and Ag are analysed by four acid digest methods (ALS Technique ME-MS61r).Mo > 50ppm trigger XRF follow up assay (ALS Technique XRF05).Samples are crushed, riffel split and pulverised prior to multi-element analysis at an accredited Australian Laboratory.
Note 2: Analysis performed on 1/2 HQ or NQ core over nominal 2m intervals with the assay data length weighted over each reported interval. Pb, Zn, Cu and Ag are analysed by four acid digest methods (ALS Technique ME-MS61r); Pb, Zn, Cu > 1% and Ag > 100ppm trigger OG62 ALS technique. Au by Au-AA22 for Au > 1ppm trigger Au-AA26 follow up assay (ALS Techniques)Samples are crushed, riffel split and pulverised prior to multi-element analysis at an accredited Australian Laboratory.
Hole No. from (m)
To (m)
MoEq%1 Significant Intersections(Mo)
Significant Intersections(Cu)
Significant Intersections(Ag)
DUNDD008 0.0 204.0 204m @ 0.05% MoEq 204m @ 0.03% Mo 204m @ 0.04% Cu 204m @ 3.70 ppm Ag
204 348 144m @ 0.04% MoEq 144m @ 0.03% Mo 144m @ 0.01% Cu 144m @ 1.14 ppm Ag
204 224 Inc: 20m @ 0.06% Mo Inc: 20m @ 0.01% Cu Inc: 20m @ 1.14 ppm Ag
348 440 92m @ 0.07% MoEq 92m @ 0.06% Mo 92m @ 2.47 ppm Ag
352 370 Inc: 18m @ 0.12% MoEq Inc: 18m @ 0.11% Mo Inc: 18m @ 4.74 ppm Ag
343 438 Inc: 4m @ 0.22% MoEq Inc: 4m @ 0.22% Mo
440 476 36m @ 0.04% MoEq 36m @ 0.03% Mo 36m @ 2.35 ppm Ag
476 498 22m @ 0.1% MoEq 22m @ 0.09% Mo 22m @ 1.54 ppm Ag
482 494 Inc: 12m @ 0.12% MoEq Inc: 12m @ 0.11% Mo Inc: 12m @ 1.71 ppm Ag
498 586 88m @ 0.04% MoEq 88m @ 0.03% Mo 88m @ 1.32 ppm Ag
518 522 Inc: 4m @ 0.12% MoEq Inc: 4m @ 0.12% Mo
574 586 Inc: 12m @ 0.06% MoEq Inc: 12m @ 0.05% Mo Inc: 12m @ 2.85 ppm Ag
586 695.8 109.8m @ 0.04% MoEq 109.8m @ 0.02% Mo 109.8m @ 0.03% Cu 109.8m @ 1.30 ppm Ag
DUNDD010 191.6 381.2 189.6m @ 0.05% MoEq 189.2m @ 0.03% Mo 189.2 @ 0.02% Cu 189.2m @ 3.94 ppm Ag
261.4 348 Inc: 86.6m @ 0.07% MoEq
261.4 262.4 Inc: 1m @ 0.45% MoEq Inc: 1m @ 0.12% Mo Inc: 1m @ 0.25% Cu Inc: 1m @ 72.0 ppm Ag
312 340 Inc: 28m @ 0.10% MoEq Inc: 28m @ 0.05% Mo Inc: 28m @ 0.09% Cu Inc: 28m @ 6.74 ppm Ag
DUNDD012 692 748 56m @ 0.06% MoEq 56m @ 0.06% Mo 56m @ 1.68 ppm Ag
692 698 Inc: 6m @ 0.11% MoEq Inc: 6m @ 0.1% Mo
692 706 Inc: 14m @ 4.10 ppm Ag
722 730 Inc: 8m @ 3.34 ppm Ag
730 748 Inc: 18m @ 0.09% MoEq Inc: 18m @ 0.09% Mo
DUNSC001* 0 62 62m @ 0.07% MoEq 62m @ 0.03% Mo 62m @ 0.05% Cu 62m @ 5.99 ppm Ag
38 48 Inc: 10m @ 0.1% Cu
40 62 Inc: 22m @ 0.09% MoEq Inc: 22m @ 0.04% Mo Inc: 22m @ 0.08% Cu Inc: 22m @ 7.27 ppm Ag
Hole No. from (m)
To (m)
Significant Intersections (Au)
Significant Intersections (Ag)
Significant Intersections (Pb)
Significant Intersections (Zn)
Significant Intersections (Cu)
DUNDD0122 498.8 504.0 5.2m @ 0.56 ppm Au 5.2m @ 32.60 ppm Ag 5.2m @ 2.53% Pb 5.2m @ 3.01% Zn 5.2m @ 0.07% Cu
498.8 500.0 Inc: 1.2m @ 56.8ppm Ag Inc: 1.2m @ 6.32% Pb Inc: 1.2m @ 6.47% Zn Inc: 1.2m @ 0.18% Cu
502.0 503.0 Inc: 1.0m @ 1.6 ppm Au
*DUNCS001 - 62m saw cut channel sample (2m sample interval) equivalent to an HQ diamond drill hole style sample.DUNDD010 is a diamond tail from DUNRC017 from 191.6m.
DUNDD011 is a diamond tail from DUNRC001 RC Pre-collar - tageting the 3D IP Anomaly adjacent to the Unicorn Deposit.
For
per
sona
l use
onl
y
11
Unicorn Project
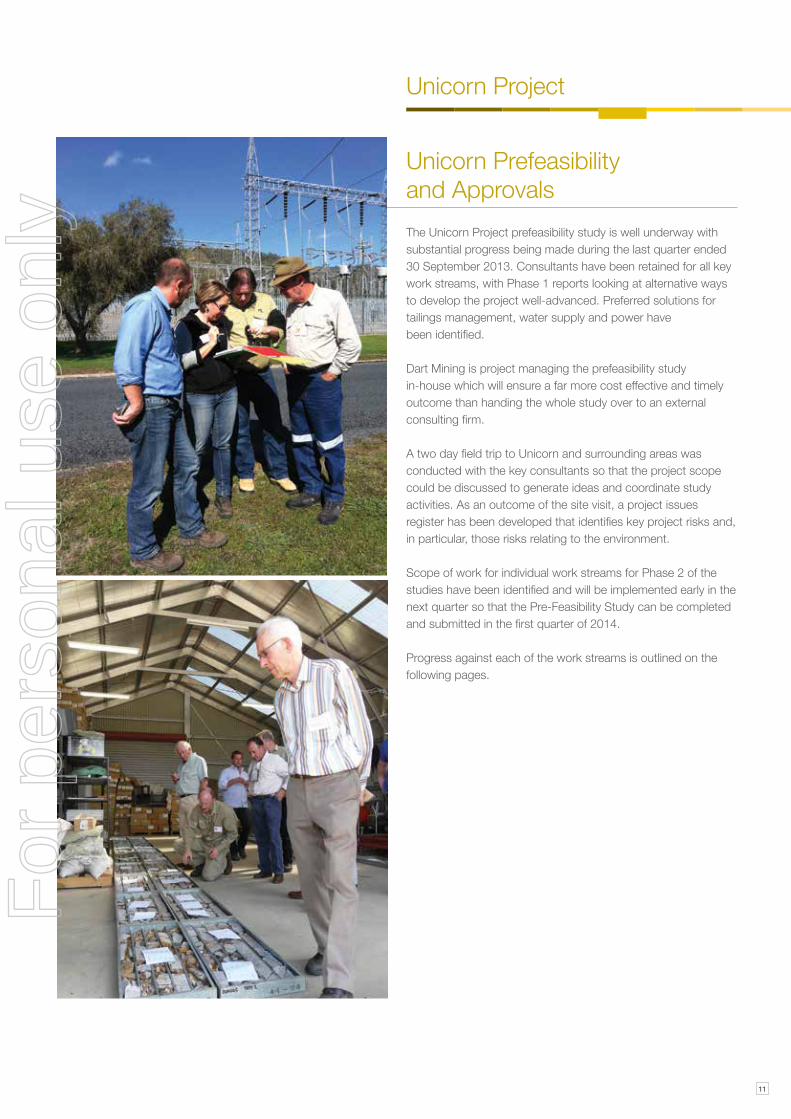
The Unicorn Project prefeasibility study is well underway with substantial progress being made during the last quarter ended 30 September 2013. Consultants have been retained for all key work streams, with Phase 1 reports looking at alternative ways to develop the project well-advanced. Preferred solutions for tailings management, water supply and power have been identified.
Dart Mining is project managing the prefeasibility study in-house which will ensure a far more cost effective and timely outcome than handing the whole study over to an external consulting firm.
A two day field trip to Unicorn and surrounding areas was conducted with the key consultants so that the project scope could be discussed to generate ideas and coordinate study activities. As an outcome of the site visit, a project issues register has been developed that identifies key project risks and, in particular, those risks relating to the environment.
Scope of work for individual work streams for Phase 2 of the studies have been identified and will be implemented early in the next quarter so that the Pre-Feasibility Study can be completed and submitted in the first quarter of 2014.
Progress against each of the work streams is outlined on the following pages.
Unicorn Prefeasibility and Approvals
For
per
sona
l use
onl
y

12
Unicorn Project
Environment and permitting – GHD
Based on the size, location and potential environmental impacts of the Unicorn project, Dart Mining is planning to complete an Environmental Effects Statement (EES). The initial phase of the EES process is the submittal of a Referral document which forms the basis for setting the scope of the EES.
In preparation for the EES, data generated from the ongoing base line environmental monitoring study, together with planned stream flow monitoring stations will provide data on run-off within the preferentially selected catchments. This work is essential to be able to calculate the total water supply for the operation from catchments rather than sourcing water from boreholes or direct from the Murray River.
At the same time as the EES is prepared, an Environmental Protection and Biological Conservation (EPBC) report will be lodged with the Commonwealth Government. This report is targeted at identifying if there are any threatened flora and fauna species within the project impact area. The Commonwealth may accept the EES process as being sufficient to meet Commonwealth regulatory needs or, in sensitive areas, the Commonwealth could decide to become more involved in the permitting process by demanding specific reporting to the Commonwealth.
Ecology – Biosis
A work program to identify existing flora, fauna and aquatic species was started in early June. This work included setting up automatic cameras (approximately 30) and hair traps that are left out in the bush for extended periods to help identify native animals. In addition to this, direct field investigations are underway to identify existing land and aquatic species, flora and determine biological diversity of the study area. This work is aimed at gathering early data to inform the EES process and the work program will be repeated again in Spring.
Areas that will be surveyed include the preferred tailings dam sites, proposed mining and processing plant areas and other possible areas of disturbance.
Engineering – Lycopodium
Lycopodium will manage the project schedule and consolidate all of the various consultant reports into a single Pre-Feasibility Study. In addition to this work Lycopodium will design the process plant and estimate and consolidate capital and operating costs.
Preliminary process plant layouts and alternative locations were investigated as part of Lycopodium phase 1 study with the preferred site being located in a valley at the base of Mt Unicorn. This will be the most practical and economical site and is the same site as identified in the Scoping Study.
Tailings – ATC Williams
Five potential locations for tailings storage have been identified as part of the prefeasibility study. A preferred site would have the capacity to store at least 200Mt of tailings; equivalent to a 20 year mine life and have the advantage of a significant catchment with potential to provide the majority of water for the process plant.
The Phase 2 tailings dam study will include the design and cost estimate of the wall structure and water recovery system. In addition, ways of diverting run-off from the catchment to bypass the tailings wall will be considered to maintain an environmental flow in the creeks below the tailings dam wall and divert water in periods of very high rainfall.
For
per
sona
l use
onl
y

13
Unicorn Project
Water – URS
The Phase 1 regional water study identified a number of alternative options to supply water to the mine and processing plant. These included bore fields within the Thowgla and Biggara valleys, direct pumping from the Murray River, and dewatering of fracture zones in and around Mt Unicorn.
However, the favoured option for a water supply is to examine, in detail, the potential for the catchment of the preferred tailings storage dam to provide the required water supply.
Power – Parsons Brinckerhoff
A number of options to supply around 40MW of power to the project were evaluated. These included connecting into the Snowy Mountain Khancoban substation, into the main NSW/Victorian HV connector, on-site power station fuelled with diesel, LNG or LPG and solar, wind or biomass. The favoured option is connecting into the Khancoban sub-station and following the existing route of HV and LV power lines to a location near the project site.
A number of permitting issues will need to be investigated in the Phase 2 studies including alternative power line routes and negotiating with the NSW and Victorian power authorities.
Mining – Mining Plus
Phase 1 work is continuing on identifying the preferred mining methodology. The Scoping Study identified that an open cut mine with twin ore passes and a decline was the preferred approach but it is prudent to investigate alternatives which might include a fixed crusher at the lower pit rim where the pit daylights and surface conveyor to an ore stockpile near the process plant.
Metallurgy – AMML
The metallurgical test program on ore from a representative bulk sample is progressing well. Initial testing suggests that grinding the ore to 80% passing 90µm, or slightly coarser, produces a rougher flotation recovery in excess of 90% for both Molybdenum and Copper which is in line with the scoping study. The test work has also shown that finer grinding will not increase recovery.
The test program will now move to the next stage of cleaning and separating the molybdenum concentrate from the copper concentrate with the objective to produce a molybdenum concentrate grade in excess of 50% Mo metal in the concentrate and a separate saleable Cu / Ag concentrate.
For
per
sona
l use
onl
y

14
Unicorn Project
n Five large diameter geotechnical / metallurgical holes have been completed
n Geotechnical drilling and logging of past and recently drilled holes completed
n Pre-feasibility metallurgical testing underway
The metallurgical drilling program was completed in February. Five large diameter (83.5mm PQ) diamond drill holes, to test the variability of the metallurgy across the deposit, were drilled to a depth of up to approximately 172 metres. Approximately 7 tonnes of samples from the four main ore types within Unicorn were shipped to the AMML laboratory in Gosford (NSW) to undergo a series of grinding, flotation and recovery optimisation testing. These studies will supply the key data to allow detailed plant and tailings dam design and allow pre-feasibility mine planning to commence.
Photo courtesy: AMML
Metallurgy and Geotechnical Drilling Program
These metallurgical holes were also geotechnically logged, a dedicated geotechnical hole drilled and previous diamond core re-logged by Coffey Mining to determine the safe angle for final high wall pit design. Initial indications from Coffey Mining are that overall batter angles of up to 55 degrees, consistent with the scoping study, can be used in prefeasibility mine design.
For
per
sona
l use
onl
y

15
Community & Health and Safety
Safety management is at the forefront and a key performance milestone for company management. In the last year Dart Mining has reviewed and updated its safety Management Policies and Procedures to allow for the ongoing changes that a small growing company goes through. Drug and Alcohol testing policies have been refined to ensure the safety of all staff and contractors with all new staff required to undergo medical testing to ensure their ongoing baseline fitness and wellbeing.
Total days since lost time due to incident or injury is 450 days as at 30th June 2013.
Dart Mining is committed to our local communities and to being a good corporate citizen and neighbour. We strive to ensure the local community is informed of our exploration, development and operating process through regular consultation – either small focused meetings or large town based meetings. Community members can contact Dart Mining staff either at the site office or through the Company’s website.
We have adopted a local supplier policy to give preference to hiring and sourcing equipment and services locally. Currently the majority of the Dart Mining team live in north-eastern Victoria and we aim to provide further opportunities for people in the region in the future. As we progress from exploration to development and to an operating mine we will work closely with the communities in which we operate and add value to the region economically and socially.
Dart Mining is a sponsor for the annual ‘Man From Snowy River Festival’ and also supports other key community wide development incentives within the region such as the proposed upgrade to the navigation facilities at the Corryong Airport to assist Air Ambulance landing access.
Community
Health and Safety
For
per
sona
l use
onl
y

16
Board of Directors
For more information about the directors’ qualifications and experience, please see page 18.
STEPHEN POKENON-EXECUTIVE DIRECTOR(age 51)
LINDSAy WARDMANAGING DIRECTOR (age 49)
.
RICHARD UDOVENyANON-EXECUTIVE DIRECTOR(age 52)
CHRISTOPHER BAINCHAIRMAN, NON-EXECUTIVE DIRECTOR (age 60)
DEAN TURNBULLEXECUTIVE DIRECTOR(age 44)
For
per
sona
l use
onl
y

17
Dart Mining NL
2013 Financial Report
Directors’ Report 18Corporate Governance Statement 27Auditor’s Independence Declaration 34Consolidated Statement of Profit or Loss and Other Comprehensive Income 35Consolidated Statement of Financial Position 36Consolidated Statement of Changes in Equity 37Consolidated Statement of Cash Flows 38Notes to the Financial Statements 39Directors’ Declaration 58Independent Auditor’s Report 59Additional Information for Listed Public Companies 61
CONTENTS
For
per
sona
l use
onl
y

18 Dart Mining NL 2013 ANNUAL REPORT
diREcTORs’ REPORT13Information on Directors
DART MINING NL ABN: 84 119 904 880 AND CONTROLLED ENTITIES
DIRECTORS' REPORT
The Directors of Dart Mining NL submit herewith the financial report of Dart Mining NL and its subsidiaries ("the Group") for the year
ended 30 June 2013.
The names and details of the Group’s directors in office during the financial year and until the date of this report are as follows. Directors
were in office for this entire period unless otherwise stated.
Names, qualifications, experience and special responsibilities
Christopher J Bain Chris Bain is a geologist and mineral economist. He has over 30 years experience in resources
having worked in underground mine geology in Mt Isa and Tasmania and exploration around Broken
Hill. Since joining the finance sector he has been instrumental in mining project divestitures and
acquisitions, evaluations and valuations, capital raisings including several initial public offerings and
ASX listings. Chris recently served as Chief Investment Officer of The Phillip Resources Fund and is
a member of the Australasian Institute of Mining and Metallurgy and the Australian Institute of
Company Directors.
Chairman
Appointed 26 May 2006
Mr Bain is currently a member of the Audit and Risk Management Committee.
Other current directorships of listed companies
PLD Corporation Limited
Former directorships of listed companies in last three years
None.
Lindsay J Ward Lindsay Ward is an experienced senior executive having worked in a broad range of industries
including ports, mining, mineral processing, rail haulage, electricity generation, transport and
logistics at both General Manager and CEO level. Prior to joining Dart Mining, Lindsay was General
Manager - Patrick Ports and Pacific National Bulk Rail, a business unit of Asciano Ltd. As an integral
part of this role, Lindsay was also the CEO of the Port of Geelong. Before joining Patrick Ports,
Lindsay was General Manager Production - Yallourn Energy, a Victorian based integrated mine and
power generator.
Managing Director and
Chief Executive Officer
Appointed 28 April 2011
Lindsay started his career in the Mining Industry, spending 15 years working with various mining
companies in WA, Queensland, NSW and Victoria in roles ranging from Mining Engineer through to
Other current directorships of listed companies
Metro Coal Ltd
Former directorships of listed companies in last three years
None.
Dean G Turnbull Dean Turnbull is a geology graduate from the Bendigo College of Advanced Education and has a
Postgraduate Honours degree in geology from the Key Centre for Ore Deposit and Exploration
Studies (CODES) at the University of Tasmania. Dean is an exploration and mine geologist
specialising in 3D geological and structural modelling, working on detailed geological models for
many Victorian mining centres. Positions previously held have spanned the spectrum from leading
grass roots green fields exploration to multi-rig Resource/Reserve drill outs and resource estimations
on large scale underground mining projects. Dean was instrumental in the discovery and
subsequent exploration of the Unicorn Porphyry Mo – Cu – Ag project and has built a knowledge
base in porphyry systems. Dean is a member of Australian Institute of Geoscientists.
Executive Director
Appointed 26 May 2006
Mr Turnbull is currently a member of the Audit and Risk Management Committee.
Other current directorships of listed companies
None.
Former directorships of listed companies in last three years
None.
companies in WA, Queensland, NSW and Victoria in roles ranging from Mining Engineer through to
Mine Manager and he has gained experience in gold and base metals exploration as well as a
detailed knowledge of the Victorian approvals process.
1
For
per
sona
l use
onl
y

19Dart Mining NL 2013 ANNUAL REPORT
diREcTORs’ REPORT13DART MINING NL ABN: 84 119 904 880 AND CONTROLLED ENTITIES
DIRECTORS' REPORT
Stephen G Poke Stephen Poke has over 32 years of hands on, technical and management experience in the drilling
services sector. Stephen has been involved in and managed some of Australia’s largest drilling
programs and has held executive positions with both local and multi-national drilling companies.
Stephen is currently General Manager of edrill Australia and edrill Fiji a leading drilling services
provider with drills operating along the Eastern Seaboard and the Asia Pacific.
Non-Executive Director
Appointed 15 June 2006
Mr Poke is currently the Chairman of the Audit and Risk Management Committee.
Other current directorships of listed companies
None.
Former directorships of listed companies in last three years
None.
Richard G Udovenya Richard Udovenya is a member of the law firm ResourcesLaw International, the legal advisers to
Dart Mining NL. He has almost 30 years’ legal experience in Australia and New Zealand and holds
a Bachelor of Laws, a Bachelor of Commerce and a Graduate Diploma in Applied Finance and
Investment (SIA). Richard is also a Fellow of the Financial Services Institute of Australia and a
Member of both the Australasian Institute of Mining and Metallurgy and the Australian Institute of
Company Directors. Richard’s focus is in the corporate, commercial law and corporate governance
areas. He is a director of, and legal advisor to, a number of Australian and international companies,
and has advised, and continues to advise, on resource projects in Australia, Africa and South
America.
Non-Executive Director
Appointed 15 June 2006
Other current directorships of listed companies
None.
Former directorships of listed companies in last three years
Uranex NL (ACN 115-111-763) (30 November 2007 to 27 August 2010)
Company Secretary
Mr Udovenya is currently the Chairman of the Remuneration Committee.
Shareholdings of directors and other key management personnel
Director & other key personnel
C J Bain
L J Ward
D G Turnbull
S G Poke
R G Udovenya
A J Draffin
J Eltham
Company Secretary
Andrew J Draffin Andrew Draffin is a partner of the accounting firm Draffin Walker & Co. He holds a Bachelor of
Commerce and is a member of the Institute of Chartered Accountants in Australia. Andrew is a
Director, Chief Financial Officer and Company Secretary of listed, unlisted and private companies
operating across a broad range of industries. His focus is on financial reporting, treasury
management, management accounting and corporate services, areas where he has gained over 16
years exeperience.
Appointed 1 June 2010
The interests of each Director and any other key management personnel, directly and indirectly, in the shares and options of the
Company at the date of this report are as follows:
Ordinary shares Options over ordinary shares
(unlisted)
1,853,332 3,000,000
2,000,000 -
4,459,179 1,000,000
2,903,749 3,000,000
423,955 3,000,000
100,000 -
- -
2
For
per
sona
l use
onl
y
20 Dart Mining NL 2013 ANNUAL REPORT
diREcTORs’ REPORT13DART MINING NL ABN: 84 119 904 880 AND CONTROLLED ENTITIES
DIRECTORS' REPORT
Corporate Information
Corporate structure
Principal Activities
Employees
The Group employed 10 employees as at 30 June 2013 (2012: 6 employees).
Operating Results
Dividend
Operating and Financial Review
Dart Mining NL is a company limited by shares that is incorporated and domiciled in Australia. Dart Mining NL has prepared a
consolidated financial report incorporating Dart Resources Pty Ltd, Mt Unicorn Holdings Pty Ltd and Mt View Holdings Pty Ltd all of which
were controlled by the Company during the financial year and are included in these financial statements.
The principal activities of the Group during the financial year was to continue with the development of its maiden project "Unicorn" and
continue exploration for base metals and gold in North-east Victoria whilst evaluating oportunities to expand its footprint to other regions
in Australia and abroad.
The profit of the Group after income tax for the year ending 30 June 2013 was $3,502,696 (2012 loss - $1,020,091)
No dividends in respect of the current financial year have been paid, declared or recommended for payment.
Group overview
Dart Mining NL was established in May 2006 with a mandate to explore for and developing base metals and gold properties in north-east
Victoria and southern New South Wales. Currently the Group focuses on one major project, the Unicorn Project, whilst pursuing
exploration of the Groups remaining tenements.
Exploration overview
Please refer to the Exploration Report for details of exploration activities undertaken during the financial year.
Financial Overview
Operating results for the year
- costs associated with managing the exploration program; and
-
Review of financial position
Cash flows
Capital Raising and Capital Structure
The profit for the consolidated entity after income tax was $3,502,696 (2012: loss $1,020,091).The profit recorded was largely attributed
to the successful completion by the Group in entering into a 2% Net Smelter Royalty which contributed $4.5mil before costs to the
revenue of the Group. The Group also accrued $876,733 in R&D Grants which further bolstered it's revenue. Expenses were consistent
with the expectation of the costs associated with the exploration programmes budgeted for, undertaken and reflect:
corporate overheads associated with statutory and regulatory requirements as a consequence of being listed on the Australian
Securities Exchange.
During the year, the Group shifted its primary focus towards the Unicorn project whilst maintaining a secondary focus on its exploration
programme in north-east Victoria. The Group raised capital throughout the year and entered into a Royalty Agreement which contributed
further funds outside traditional capital raisings. At the end of the financial year, a proportion of the funds raised during and in prior
financial years were held by the Group as cash investments for use in future financial periods. The Group strives to maximise the return
on these funds for exploration purposes by investing surplus funds and minimising expenditure on corporate overheads.
The cash flows of the Group consist primarily of payments to employees and suppliers used in advancing the Unicorn project together
with payments for exploration activities on the tenements held by the Group; and with the maintenance of the corporate head office which
manages existing projects as well as costs involved in investigating new exploration opportunities.
During the year under review, the Group raised $2,117,543 (net of capital raising costs) through the issue of 26,153,722 ordinary shares
(2012: $5,380,262).
Cash inflows primarily resulted from the Red Kite Royalty and capital raised during the reporting period.
3
For
per
sona
l use
onl
y

21Dart Mining NL 2013 ANNUAL REPORT
diREcTORs’ REPORT13DART MINING NL ABN: 84 119 904 880 AND CONTROLLED ENTITIES
DIRECTORS' REPORT
Summary of shares and options on issue
Significant Changes in State of Affairs
Events after the Reporting Period
Future Developments, Prospects and Business Strategies
At the date of this report, the Group has 207,091,315 ordinary shares and 18,823,048 unlisted options on issue. Details of the unlisted
options are as follows:
Issuing entity
Number of shares
under option
Class of
shares Exercise price Expiry date
Dart Mining NL 8,350,000 Ordinary 15 cents 31 December 2013
Dart Mining NL 100,000 Ordinary 18 cents 20 March 2017
Ordinary 22 cents 20 March 2017
Options holders do not have any rights to participate in any issues of shares or other interests in the Company.
Dart Mining NL 3,000,000 Ordinary
Dart Mining NL
During the year ended 30 June 2013, 2,555,000 ordinary shares of Dart Mining NL were issued on the exercise of options or rights
granted. No amounts are unpaid on any of the shares on issue.
For details of options issued to Directors and Executives as remuneration, refer to the Remuneration Report.
There have been no shares issued since the end of the financial year resulting from the exercise of options.
There were no significant changes in the state of affairs of the Group during the financial year other than shifting its primary focus towards
the Unicorn project from exploration.
There has been no matter or circumstance since 30 June 2013 which has significantly affected or may significantly affect the operations
of the consolidated entity, the results of those operations or the state of affairs of the consolidated entity in subsequent financial years.
15 cents 31 December 2015
31 December 2016Ordinary3,000,000 15 cents
OrdinaryDart Mining NL 4,273,048 11.1cents 7 May 2016
Dart Mining NL 100,000
Future Developments, Prospects and Business Strategies
Environmental Issues
The economic entity holds participating interests in a number of exploration tenements. The various authorities granting such tenements
require the tenement holder to comply with the terms of the grant of the tenement and all directions given to it under those terms of the
tenement. There have been no known breaches of the tenement conditions, and no such breaches have been notified by any
government agencies during the year ended 30 June 2013 or to the date of this report.
The Board of the Company believe they have been compliant with the continous disclosure requirements throughout the reporting period
and to the date of this report.
As the Group is listed on the Australian Securities Exchange, it is subject to the continuous disclosure requirements imposed by ASX
Listing Rules, which require immediate disclosure to the market of information that is likely to have a material effect on the price or value
of Dart Mining NL’s securities.
The Board of Directors intends to continue with the exploration of the Group’s tenements and focus on the Unicorn Project. Further
details of the Group’s prospects are included in the Exploration Report.
4
For
per
sona
l use
onl
y

22 Dart Mining NL 2013 ANNUAL REPORT
diREcTORs’ REPORT13DART MINING NL ABN: 84 119 904 880 AND CONTROLLED ENTITIES
DIRECTORS' REPORT
Directors' and Committee Meetings
HeldDirectors
C J Bain 13
L J Ward 13
D G Turnbull 13
S G Poke 13
R G Udovenya 13
HeldDirectors
C J Bain 4
S G Poke 4
R G Udovenya 4
The Company has entered into Deeds of Indemnity with the Directors and the Company Secretary, indemnifying them against certain
liabilities and costs to the extent permitted by law.
4 4
4 4
4 4
The Board of Directors established an Audit and Risk Management Committee on 9 May 2007. The charter for the Audit and Risk
Management Committee was adopted on 12 July 2007. The members of the committee consist of Stephen Poke (Chairman), Chris Bain
and Dean Turnbull.
The number of Directors’ and Committee meetings held during the year and the numbers of meetings attended by each Director and
Committee member were as follows:
Board of directors Audit and Risk Management Committee
Attended Held Entitled to attend Attended
13 13 3 3 3
13 13 - - -
13 12 3 3 3
13 11 3 3 2
13 13 - - -
Indemnification and Insurance of Directors and Officers
Remuneration Committee
Entitled to attend Attended
The Board of Directors established the Remuneration Committee on 5 December 2012. The charter for the Remuneration Committee
was adopted on 19 February 2013. The members of the committee consist of Richard Udovenya (Chairman), Stephen Poke and Chris
Bain, all of which are Non-Executive Directors.
Entitled to attend
Proceedings on Behalf of Company
The Company has also agreed to pay a premium in respect of a contract insuring the Directors and officers of the Company. Full details
of the cover and premium are not disclosed as the insurance policy prohibits the disclosure.
No person has applied for leave of Court to bring proceedings on behalf of the Company or intervene in any proceedings to which the
Company is a party for the purpose of taking responsibility on behalf of the Company for all or any part of those proceedings.
The company was not a party to any such proceedings during the year.
Non-audit Services
The Directors are satisfied that no non-audit services were provided during the year by the auditor (or by another person or firm on the
auditor’s behalf) thus the Board are satisfied that the auditor is compliant with the general standards of independence for auditors
imposed by the Corporations Act 2001.
Auditor’s Independence Declaration
The lead auditor’s independence declaration for the year ended 30 June 2013 has been received and can be found on page 17 of the
Financial Report.
5
For
per
sona
l use
onl
y
23Dart Mining NL 2013 ANNUAL REPORT
diREcTORs’ REPORT13DART MINING NL ABN: 84 119 904 880 AND CONTROLLED ENTITIES
DIRECTORS' REPORT
Details of Directors and other Key Management Personnel
C J Bain
L J Ward
D G Turnbull
S G Poke
R G Udovenya
A J Draffin
J Eltham
Remuneration Report - Audited
This remuneration report, which forms part of the Directors’ report, sets out information about the remuneration of the Group’s Directors
and other key management personnel for the financial year ended 30 June 2013. The prescribed details for each person covered by this
report are detailed below.
Directors and other key management personnel of the Group during and since the end of the financial year are as follows:
Remuneration philosophy
The Board of Directors of Dart Mining NL is responsible for determining and reviewing compensation arrangements for the Directors, the
Managing Director and other key management personnel after consideration is given to the recommendations of the Company's
Remuneration Committee. The Remuneration Committee's policy is to ensure that a remuneration package properly reflects the person’s
duties and responsibilities, with the overall objective of ensuring maximum stakeholder benefit from the retention of a high quality Board
and executive team. The Board of the Company reviews and adopts or amends the recomendations of the Remuneration Committee as
proposed. The officers of the Company are given the opportunity to receive their base emolument in a variety of forms, including cash,
fringe benefits such as motor vehicles and incentive rights. It is intended that the manner of payment chosen will be optimal for the
recipient without creating undue cost to the Group.
To assist in achieving these objectives, the Board intends to link the nature and amount of Directors’ and other key management
personnel’s emoluments to the Company’s financial and operational performance. It is the Board’s policy that employment contracts are
entered into with all senior executives. At the date of this report, executive remunerations is set at levels approved by the Board. The
Board has granted these guaranteed levels of remuneration which are not dependent on performance in order to ensure the Group’s
ability to retain quality personnel.
Revenue
Net Profit/(loss) after tax
Share price at start of year or period
Share price at end of year
Dividends
Basic earnings per share
Diluted earnings per share
30 June 2010 30 June 2009 30 June 2008
$42,893 $16,679 $106,379 $186,684
The Group’s earnings and movements in shareholders’ wealth since listing to 30 June 2013 is detailed in the following table:
30 June 2013 30 June 2012 30 June 2011
6c 11c 8c 18c 21c
($1,020,091) ($526,388) ($844,916) ($1,146,803) ($755,721)
- - - - -
10c 6c 11c 8c 18c
(0.68)c (0.51)c (2.62)c (1.77)c(1.32)c
(0.68)c (0.51)c (1.32)c (2.62)c (1.77)c
Employment Agreements are entered into with Executive Directors and specified executives. An employment contract with one Executive
Director is terminable by the Company providing six months notice or by the Executive providing three months notice, whilst another
employment contract with a specified executive is terminable by the Company by giving three months’ notice or by the Executive by
giving three months’ notice.
3,502,696 $5,488,826 $80,135
10c
1.81c
1.81c
7c
-
6
For
per
sona
l use
onl
y

24 Dart Mining NL 2013 ANNUAL REPORT
diREcTORs’ REPORT13 DART MINING NL ABN: 84 119 904 880 AND CONTROLLED ENTITIES
DIRECTORS' REPORT
Remuneration structure
Non-Executive Director remuneration
Structure
Senior executive remuneration
In accordance with the best practice corporate governance, the structure of Non-Executive and Executive Director remuneration is
separate and distinct.
Objective
The Board seeks to set aggregate remuneration at a level which provides the Group with the ability to attract and retain Directors of the
highest calibre, whilst incurring a cost which is acceptable to shareholders.
The Constitution and ASX Listing Rules specify that the aggregate remuneration of Non-Executive Directors shall be determined from
time to time by a general meeting of the Company's shareholders. An amount not exceeding the amount determined is then divided
between the Directors as agreed whilst maintaining a surplus amount that can be attributable to further Non-Executive Directors should
they be appointed at any time. The latest determination was sought and granted at the Company's last AGM whereby shareholders
approved an aggregate remuneration of $475,000 per year, an increase from the previous aggregate remuneration amount $200,000 per
year, which was set with the adoption of the Company's constitution on 22 June 2006.
The amount of aggregate remuneration sought to be approved by shareholders and the manner in which it is apportioned amongst
directors is reviewed annually. The Board considers advice from external consultants as well as the fees paid to Non-Executive Directors
of comparable companies when undertaking the annual review process.
Each Non-Executive Director receives a fee for being a Director of the Group. Directors who are called upon to perform extra services
beyond the Director’s ordinary duties may be paid additional fees for those services.
Non-Executive Directors have long been encouraged by the Board to hold shares in the Company. It is considered good governance for
Directors to have a stake in the company on whose board he or she sits.
The remuneration of Non-Executive Directors for the financial year ended 30 June 2013 is detailed in this report.
Objective
The Board aims to reward Executives with a level and mix of remuneration commensurate with their position and responsibilities within
the Company and so as to:
-
-
-
-
Structure
Service contracts were entered into with Executive Directors and Specified Executives.
Lindsay J Ward
-
-
-
-
-
-
reward Executives for Company, business unit and individual performance against targets set by reference to appropriate
benchmarks;
align the interests of Executives with those of shareholders;
link reward with the strategic goals and performance of the Company; and
ensure total remuneration is competitive by market standards.
In determining the level and make-up of executive remuneration, the Board obtained independent advice from external consultants on
market levels of remuneration for comparable executive roles. It is the Board’s policy that employment contracts are entered into with all
senior executives.
Service contracts
The terms of an employment agreement with Mr Ward include inter alia :
A remuneration package of $260,728 per annum, with annual reviews, together with reimbursement of all business related
expenses including motor vehicle running and maintenance expenses plus statutory annual leave entitlements;
2,000,000 incentive rights were issued and exercised during the financial year in accordance with the Company's Incentive Rights
Plan, which was approved by shareholders at the 2011 AGM of the Company, a further third and final tranche of 2,000,000 incentive
rights are due to be offered to Mr Ward in accordance with his employment contract during the next 12 months;
A restraint on Mr Ward to be engaged in the carrying on of any business the same as or substantially similar to or in competition
with Dart for a period of six months from the date of termination;
An obligation on Mr Ward to maintain confidentiality in respect of proprietary information obtained during employment. This
obligation continues after cessation of engagement with the Company;
The agreement is terminable by the Company on 6 months’ notice or by Mr Ward on 3 months’ notice being given or at the
conclusion of the contractual period being, the termination date of 2 May 2014, unless renewed or extended by mutual agreement in
writing not less than six months prior to termination date; and
A discretionary bonus may be payable by the Company. The basis for paying any discretionary bonus and any amount paid will be
decided by the Board in its sole discretion but will be related to the performance and success in promoting development of the
Company during the preceding year and to his fund-raising effort in raising equity capital for the Company.
7
For
per
sona
l use
onl
y

25Dart Mining NL 2013 ANNUAL REPORT
diREcTORs’ REPORT13DART MINING NL ABN: 84 119 904 880 AND CONTROLLED ENTITIES
DIRECTORS' REPORT
Dean G Turnbull
-
-
- An obligation on Mr Turnbull to maintain confidentiality in respect of proprietary information obtained during employment;
-
-
Andrew Draffin
The terms of an employment agreement with Mr Turnbull include inter alia :
A remuneration package of $180,809 per annum, with annual reviews, together with reimbursement of all business related
expenses including motor vehicle running and maintenance expenses plus statutory annual leave entitlements;
A restraint on Mr Turnbull undertaking additional part-time consulting or provision of other services which may conflict with the
activities of Dart without the approval of the Chairman which may not be unreasonably withheld. This restraint continues for 12
months after cessation of engagement with the Company;
The agreement is terminable by either party on 3 months’ notice being given.
The Company remunerates Draffin Walker Pty Ltd, a firm of Chartered Accountants of which Mr Draffin is a director and shareholder, for
secretarial, accounting and corporate compliance services. Fees received for the period under review totaled $44,175.00. Fees are
expected to be $60,000 for the 2013/2014 financial year subject to the number of corporate actions undertaken by the Company.
A bonus may be paid to Mr Turnbull at the sole discretion of the Board which is based on certain performance critera being
exceeded for any pre-determined period.
Long-term employee benefits
Annual leave
$
Total
$
Percentage of
share-based
payments
%
Remuneration of Directors and other Key Management Personnel for the Year Ended 30 June 2013
2013
Directors
Christopher J Bain 78,692 6,750 99,900
Short-term
benefits
Salaries, fees
and leave
$
Post
Employment
benefits
Superannuation
$
Share-
based
payments
Options/
Incentive
rights
$
- 185,342 53.90%
Lindsay J Ward 330,672 29,761 184,000 334 544,767 33.78%
Dean G Turnbull 214,266 14,618 - 23,876 252,760
- 152,950
0.00%
Stephen G Poke 50,538 4,154 99,900 - 154,592 64.62%
65.32%Richard G Udovenya 49,000 4,050 99,900
Bonuses
- 152,950 65.32%Richard G Udovenya 49,000 4,050 99,900
723,169 59,333 483,700 24,210 1,290,412
2,000,000 incentive rights were issued to Mr Lindsay Ward in accordance with the Company's Incentive Rights Plan on 24 August 2012.
The incentive rights were subsequently exercised on 24 August 2012 with an estimated value of $184,000.
Short-term
benefits
Salaries, fees
and leave
$
Post
Employment
benefits
Superannuation
$
Share-
based
payments
Options/
Incentive
rights
$
Long-term employee benefits
Annual leave
$
Total
$
Percentage of
share-based
payments
%2012
Directors
Christopher J Bain 60,436 5,439 - -
Lindsay J Ward 231,859 19,270 220,000 - 471,129
16,985 - 18,946 224,654
65,875 0.00%
46.70%
0.00%
Stephen G Poke 38,555 3,470 - - 42,025 0.00%
Dean G Turnbull 188,723
0.00%Richard G Udovenya 40,000 2,025 - - 42,025
559,573 47,189 220,000 18,946 845,708
Cash bonuses totalling $150,000 were granted to Executive Directors during the financial year ended 30 June 2013 which is included in
short-term benefits, salaries, fees and leave above (2012: NIL).
8
For
per
sona
l use
onl
y

26 Dart Mining NL 2013 ANNUAL REPORT
diREcTORs’ REPORT13F
or p
erso
nal u
se o
nly

27Dart Mining NL 2013 ANNUAL REPORT
CORPORATE GOvERNANCE STATEmENT13
Board of Directors
Role of the Board
-
-
-
The Board continually reviews its corporate governance practices and regularly monitors developments in good practice governance
both in Australia and overseas. Where international and Australian guidelines are not consistent, the good practice guidelines of
the ASX Corporate Governance Council has been adopted as the minimum base for corporate governance practices.
The Board has adopted a formal charter which allocates responsibilities between the Board and management of the Company
which is available from the corporate governance section of the Company's website at www.dartmining.com.au. The charter details
the composition, responsibilities and code of conduct under which the Board operates. The Board has resolved unanimously that
the Company will at all times aspire to “good practice” in Corporate Governance.
Unless otherwise indicated in this statement the practices specified in the charter have been followed throughout the reporting
period and will remain in force until amended by resolution of the Board.
The Board acknowledges its accountability to shareholders for creating shareholder value within a framework that protects the
rights and interests of shareholders and ensures the Company is properly managed. The Board aims to achieve these objectives
through the adoption and monitoring of strategies, plans, policies and performance as follows:
Providing input into, and approval of, the Group’s strategic direction; approval and monitoring of budgets and business plans;
and ensuring that appropriate resources are available, including capital management and budgeting for major capital
expenditure; Approving the Group’s systems of risk management, monitoring their effectiveness and maintaining a dialogue with the Group’s
auditors;
DART MINING NL ABN: 84 119 904 880 AND CONTROLLED ENTITIES
CORPORATE GOVERNANCE STATEMENT
The Board of Directors of Dart Mining NL (the Company) is committed to the principle of good practice in corporate governance.
The Board believes that genuine commitment to good corporate governance is essential to the performance and sustainability of the
Company’s business and as such depends upon the corporate culture, values and behaviours which underlies its day-to-day
activities.
Considering, approving and monitoring internal and external financial and other reporting, including reporting to shareholders, -
-
-
-
Board Processes
Composition of the Board
-
-
-
-
Considering, approving and monitoring internal and external financial and other reporting, including reporting to shareholders,
the ASX and other stakeholders;
Selection and evaluation of Directors, the Managing Director, and senior executives and planning for their succession;
Setting the Managing Director and Director's remuneration within shareholder approved limits and ensuring that the
remuneration and conditions of service of senior executives are appropriate;
Ensuring, and setting standards for, ethical behaviour and compliance with the Group’s own governing documents, including the
Group’s Code of Conduct and corporate governance standards.
The Board aims to perform its role and objectives through the adoption and monitoring of strategies, plans, policies and
performance; the review of the Managing Director and senior management's performance, conduct and reward; monitoring of the
major risks of the Company’s business; and by ensuring the Company has policies and procedures to satisfy its legal and ethical
responsibilities. The Board undertakes these tasks after considering recomendations made by the Company's two sitting
Committees, the Audit and Risk Managment Committee and the Remuneration Committee.
The Board determines the strategic direction of the Company and sets policies accordingly. In addition to maintaining oversight of
the Company’s executive management and operations, the Board monitors substantive issues such as ethical standards and social
and environmental responsibilities.
The names of the current Directors of the Company at the date of this statement are set out in the Directors’ Report accompaning
this financial report. The composition of the Board is determined using the following principles:
a maximum of twelve Directors and a minimum of three Directors;
a Non-Executive Director as Chairman;
a majority of Non-Executive Directors; and
a balance between independent and non-independent Directors.
10
For
per
sona
l use
onl
y

28 Dart Mining NL 2013 ANNUAL REPORT
CORPORATE GOvERNANCE STATEmENT13 DART MINING NL ABN: 84 119 904 880 AND CONTROLLED ENTITIES
CORPORATE GOVERNANCE STATEMENT
Meetings
Role of Chairman and Managing Director or Chief Executive Officer (CEO)
The Board is currently comprised of five Directors: three Non-Executive Directors and two Executive Directors. The Company’s
Constitution provides for a maximum of 12 directors. The Board periodically reviews its size as appropriate. The Managing Director,
who is appointed by the Board, attends all Board meetings.
Directors are considered to be independent if they are not major shareholders, are independent of management, and are free from
any business or other relationship that could materially interfere with their exercise of free and independent judgement. Messrs
Bain, Poke and Udovenya are considered to fall within this category.
Messrs Turnbull and Ward are considered to be non-independent Directors as they provide management services to the Company
and have significant shareholdings in the Company respectively.
The Board regards the present composition of Directors and Board Committees as a good balance at this stage of the Company's
development with the appropriate mix of expertise, experience and ability to represent the interests of all shareholders.
Future Director appointees will receive a formal letter of appointment setting out the responsibilities, rights, terms and conditions of
their appointment. Directors participate in a comprehensive induction which covers the operations, financial position, strategic and
risk management issues, as well as the operation of the Board and any sub-committees.
The Board meets on a regular basis to retain full and effective control and monitor executive management. During the financial year
to 30 June 2013, the full Board met 10 times. The Directors’ attendance at meetings is detailed in the Directors’ Report.
Members of the management team may attend meetings at the invitation of the Board.
The Chairman is an Independent Director elected by the full Board, having no association with the Company, nor is he a substantial
shareholder of the Company and he has not previously been an employee of the Company.
The Chairman is responsible for leading the Board, ensuring Directors are properly briefed in all matters relevant to their role and
responsibilities, facilitating Board discussions and managing the Board’s relationship with the Company’s senior executives.
Independent professional advice
responsibilities, facilitating Board discussions and managing the Board’s relationship with the Company’s senior executives.
The Managing Director is responsible for implementing the Group's strategies and policies. The Board Charter specifies that these
are separate roles to be undertaken by separate people.
Term of office
The Board reviews its performance and composition on an annual basis and aims to have members with high levels of intellectual
ability, experience, soundness of judgement and integrity to maximise its effectiveness and contribution. Directors serve a
maximum three-year term before being required to be re-elected by members. The Company's constitution provides that at least
one third (or the nearest whole number) of directors must retire at each Annual General Meeting, but are eligible for re-election at
that meeting. There is no compulsory retiring age.
In performing their duties, Directors have the right to seek independent, professional advice at the Company’s expense, in
furtherance of their duties as Directors, with the approval of the Chairman, which approval shall not be unreasonably withheld.
Board committees
The Company has a formally constituted Audit and Risk Management Committee and Remuneration Committee, both of which
reports to the Board of Directors. These committees are chaired by a Non-Executive Director and operates under a charter with
authority to examine and report on any matters concerning risk management within the company including, but not limited to,
operational, occupational health and safety, and financial matters.
11
For
per
sona
l use
onl
y
29Dart Mining NL 2013 ANNUAL REPORT
CORPORATE GOvERNANCE STATEmENT13DART MINING NL ABN: 84 119 904 880 AND CONTROLLED ENTITIES
CORPORATE GOVERNANCE STATEMENT
Code of business conduct
Conflicts of interest
The Board has adopted a Code of Conduct (the Code) and a policy “Behaviour Standards – Standards of Business Conduct” setting
out parameters for ethical behaviour and business practices which applies to all of the Company’s Directors, officers and
employees. The Code is included in the Board Charter and is available for review on the Company's website. The Code is regularly
reviewed and updated as necessary to ensure it reflects the highest standards of behaviour and professionalism necessary to
maintain confidence in the Group’s integrity. In summary, the Code requires that at all times all group personnel act with the utmost
integrity, objectivity and in compliance with both the letter and the spirit of the law and the Company's policies.
All Directors of the Company must keep the Board advised, on an ongoing basis, of any private interest that could potentially conflict
with the interests of the Company. Where the Board believes that a significant conflict exists, the Director or Directors concerned do
not receive the relevant board papers and is excused at the meeting whilst the item is considered. The Board has developed
procedures to assist Directors in disclosing potential conflicts of interest.
All Directors and executive officers of the Company are required to disclose to the Company any material transaction, commercial
relationship or corporate opportunity that reasonably could be expected to give rise to such a conflict.
Insider trading
Trading in shares by any Director or senior executive of the Company whether during a blackout period which incorporates the
periods between the close of each financial quarter and the release of quarterly, half yearly interim and full year results by the
Company and 30 Days prior to the Company's AGM or not requires the express written approval of the Chairman before any trading
is conducted or the entry into any share trading agreements in accordance with the Company's share trading policy.
Fair dealing and ethical standards
The Code requires all directors, officers and employees of the Company to behave honestly and ethically at all times with all people
and other organisations.
The Directors are satisfied that the Company has complied with its policies on ethical standards, including trading in securities. The Directors are satisfied that the Company has complied with its policies on ethical standards, including trading in securities.
Financial reporting
Reporting standards
The Company is committed to providing shareholders with clear, transparent, and high quality financial information in a timely
manner. The Company’s continuous disclosure policy underpins this approach.
The financial reports of the Company are produced in accordance with Australian International Financial Reporting Standards, other
authoritative pronouncements of the Australian Accountings Standards Board and the Corporations Act. The financial statements
and reports are subject to review every half year and the auditor issues an audit opinion accompanying the full year results for each
financial year.
12
For
per
sona
l use
onl
y

30 Dart Mining NL 2013 ANNUAL REPORT
CORPORATE GOvERNANCE STATEmENT13 DART MINING NL ABN: 84 119 904 880 AND CONTROLLED ENTITIES
CORPORATE GOVERNANCE STATEMENT
1.
2.
External auditors
The Company policy is to appoint external auditors who clearly demonstrate quality and independence. The performance of the
external auditor is reviewed annually, taking into consideration assessment of performance, existing value and tender costs.
An analysis of fees paid to the external auditors, including a breakdown of fees for non-audit services, is provided in Note 7 to the
financial statements. It is the policy of the external auditors to provide an annual declaration of their independence to the Board.
The external auditor is requested to attend the annual general meeting and be available to answer shareholder questions about the
conduct of the audit and the preparation and content of the audit report.
Management Certification
The Company requires that the Managing Director and Company Secretary make the following certifications to the Board:
that the Company’s financial reports are complete and present a true and fair view, in all material respects, of the financial
condition and operational results of the Company and Group and are in accordance with relevant accounting standards;
that the above statement is founded on a sound system of risk management together with internal compliance and control
which implements the policies adopted by the Board and that the Company’s risk management and internal compliance and
control is operating efficiently and effectively in all material respects.
Risk assessment
The Board is responsible for ensuring there are adequate policies in relation to risk management, compliance and internal control
systems. The Board has appointed an Audit and Risk Management Committee to advise it in these matters. In summary, the
Company's policies are designed to ensure strategic, operational, legal, reputation and financial risks are identified, assessed and
efficiently managed and monitored to enable achievement of the Company’s business objectives.
Considerable importance is placed on maintaining a strong control environment. There is an organisational structure with clearly
drawn lines of accountability and delegation of authority. Adherence to the Code of Conduct is required at all times and the Board
actively promotes a culture of quality and integrity.
Detailed control procedures cover management accounting, purchases and payments, financial reporting, capital expenditure
- monitor its compliance with all relevant legislation;
- continually assess and improve the impact of its operations on the environment;
- encourage employees to actively participate in the management of environmental and OH&S issues;
- work with industry peers to raise standards;
- use energy and other resources efficiently; and
-
Detailed control procedures cover management accounting, purchases and payments, financial reporting, capital expenditure
requests, project appraisal, environment, health and safety, IT security, compliance, and other risk management issues. There is a
systematic review and monitoring of key business operational risks by management which reports on current and future risks and
mitigation activities to the Board.
The Company recognises the importance of environmental and occupational health and safety (OH&S) issues and is committed to
the highest levels of performance with the systematic identification of environmental and OH&S issues to ensure they are managed
in a structured manner. This system allows the Company to:
encourage the adoption of similar standards by the entity’s principal suppliers and contractors with particular emphasis on
exploration contractors.
13
For
per
sona
l use
onl
y

31Dart Mining NL 2013 ANNUAL REPORT
CORPORATE GOvERNANCE STATEmENT13DART MINING NL ABN: 84 119 904 880 AND CONTROLLED ENTITIES
CORPORATE GOVERNANCE STATEMENT
Continuous disclosure and shareholder communication
All shareholders have the opportunity to elect to receive a copy of the Company’s annual report at the same time they receive by
post a copy of the Notice of the Annual General Meeting.
The Company is a disclosing entity under the Corporations Act and is subject to the continuous disclosure requirements under ASX
Listing Rules. Communications with shareholders and other stakeholders are given a high priority. In addition to statutory
disclosure documents such as Annual Reports and Quarterly activity reports, the Board is committed to keeping all stakeholders
informed of all material developments that affect the Company in a timely manner.
The Company has a formal policy and comprehensive procedures on continuous disclosure. Once the Board or management
becomes aware of information concerning the Company that would be likely to have a material effect on the price or value of the
Company’s securities (and which does not fall within the exceptions to the disclosure requirements contained in the Listing Rules),
that information is released to the ASX.
The Board has appointed the Company Secretary (or in his absence, the Chairman) as the person responsible for communication to
ASX. This role includes responsibility for ensuring compliance with the continuous disclosure requirements of ASX Listing Rules
and overseeing and co-ordinating information disclosure to the ASX. All Company announcements, presentations or other briefings
are posted on the Company’s website after release to the ASX.
Full use is made of annual general meetings to inform shareholders of current developments through appropriate presentations and
to provide opportunities for questions.
The Board also endorses full and regular communication with and between Directors, the Managing Director, senior management,
the external auditors, professional advisers, shareholders and other significant stakeholders. The Board also ensures the Company
Secretary maintains a good, open and frank relationship with the ASX and its designated company officers to ensure compliance
and full disclosure.
Diversity Policy
Diversity includes, but is not limited to, gender, age, ethnicity and cultural background. The company is committed to diversity and
recognises the benefits arising from employee and board diversity and the importance of benefiting from all available talent.
-
-
-
-
-
No. % No. %
- - - -
- - - - 1 8% 1 17%
The number of women employeed by the Group and their employment classification is as follows:
ensure that personnel responsible for recruitment take into account diversity issues when considering vacancies; and
create awareness in all employees of their rights and responsibilities with regards to fairness, equity and respect for all aspects
of diversity.
create a work environment that values and utilises the contributions of employees with diverse backgrounds, experiences and
perspectives;
The Board believes that they have been successful in implementing these objectives throughout the Groups workforce.
achieve a diverse and skilled workforce, leading to continuous improvement in the achievement of its corporate goals;
the development of clear criteria on behavioral expectations in relation to promoting diversity;
Women in senior management roles
Women employees in the company
recognises the benefits arising from employee and board diversity and the importance of benefiting from all available talent.
Accordingly, the company has established a diversity policy, which is available at www.dartmining.com.au.
This diversity policy outlines requirements for the Board to develop measurable objectives for achieving diversity, and annually
assess both the objectives and the progress in achieving those objectives. Accordingly, the Board has developed the following
objectives regarding gender diversity and aims to achieve these objectives as Director and senior executive positions become
vacant and appropriately qualified candidates become available:
30-Jun-13 30-Jun-12
Women on the Board
14
For
per
sona
l use
onl
y

32 Dart Mining NL 2013 ANNUAL REPORT
CORPORATE GOvERNANCE STATEmENT13 DART MINING NL ABN: 84 119 904 880 AND CONTROLLED ENTITIES
CORPORATE GOVERNANCE STATEMENT
Compliance with ASX Corporate Governance Council Good Practice Recommendations
Compiled Note
1.2 No 1
1.3 Yes
2.1 Yes
2.2 Yes
2.3 Yes
2.4 No 2
2.5 No 1
2.6 Yes
3.1
3.1.1 - Yes
3.1.2-
Yes
3.1.3-
Yes
3.2 Yes
These functions are set out under Role of the board and Role of management in this
statement.
1.1
The table below outlines each of the ASX Best practice Recommendations and the Company's compliance with those
recommendations. Where the Company has met the relevant recommendation during the reporting period, this is indicated by a
"Yes" in the relevant column. Where the Company has not met or complied with a recomendation this is indicated by a 'No" and an
accompanying note explaining the reasons why the Company has not met the recommendation.
Disclose the process for evaluating the performance of senior executives
Provide the information indicated in the Guide to reporting on Principle 1.
Establish a code of conduct to guide the directors, the chief executive officer (or
equivalent) and any other key executives as to:
Description
Formalise and disclose the functions reserved to the board and those delegated to senior
executives.
Provide the information indicated in the Guide to reporting on Principle 2.
Yes
Establish and disclose the diversity policy of the Company.
the practices necessary to maintain confidence in the Company's integrity;
the practices necessary to take into account legal obligations and
reasonable expectations of stakeholders;
the responsibilities and accountability of individuals for reporting and
investigating reports of unethical practices.
A majority of the board should be independent directors.
The chairperson should be an independent director.
The roles of chairperson and chief executive officer should not be exercised by the same
individual.
The Board should establish a nomination committee.
Disclose the process for evaluating the performance of its board, committees and
individual directors.
3.2 Yes
3.3 Yes
3.4 Yes
3.5 Yes
4.1 Yes
4.2
- No 3
- Yes
- Yes
- Yes
4.3 Yes
4.4 Yes
Establish and disclose the diversity policy of the Company.
only Non-Executive Directors
a majority of Independent Directors
an Independent Chairperson, who is not chairperson of the board
at least three members
Establish and disclose the measurable objectives for achieving gender diversity and
progress towards achieving those goals.
Disclose the proportion of women employees in the organisation, in senior executive
positions and on the Board.
Provide the information indicated in the Guide to reporting on Principle 3.
The Board should establish an audit committee.
Structure the audit committee so that it consists of:
Provide the information indicated in the Guide to reporting on Principle 4.
The audit committee should have a formal charter.
15
For
per
sona
l use
onl
y

33Dart Mining NL 2013 ANNUAL REPORT
CORPORATE GOvERNANCE STATEmENT13DART MINING NL ABN: 84 119 904 880 AND CONTROLLED ENTITIES
CORPORATE GOVERNANCE STATEMENT
5.1 Yes
5.2 Yes
6.1 Yes
6.2 Yes
7.1 Yes
7.2 Yes
7.3 Yes
7.4 Yes
8.1 Yes
8.2
- Yes
- Yes
- Yes
8.3 Yes
8.4 Yes
1 Recommendation 1.2: Disclose the process for evaluating the performance of senior executives.
The Company complies with all of the ASX Corporate Governance Principles and Recommendations with the following exceptions:
Structure the remuneration committee so that it consists of:
Establish and disclose written policies and procedures designed to ensure compliance with
ASX Listing Rule disclosure requirements to ensure accountability at a senior executive
level for that compliance.
Provide the information indicated in the Guide to reporting on Principle 5.
Design and disclose a communication strategy to promote effective communication with
the shareholders and encourage effective participation at general meetings - refer to
Continuous disclosure and shareholder communication as set out above.
Provide the information indicated in the Guide to reporting on Principle 6.
Establish and disclose policies for oversight and management of material business risks.
a majority of independent directors
an independent chairperson
at least three members
Clearly distinguish the structure of non-executive directors' remuneration from that of
executive directors and senior executives.
Provide the information indicated in the Guide to reporting on Principle 8.
Design and implement risk management and internal control systems to manage and
report on material business risks. Disclose reporting as to effectiveness of management of
material business risks.
Disclose whether the board as received assurance from the chief executive officer and
chief financial officer that the declaration provided in accordance with section 295A of the
Corporations Act is founded on a sound system of risk management and internal control
and that the system is operating effectively in all material respects in relation to financial
reporting risks.
Provide the information indicated in the Guide to reporting on Principle 7.
Establish a remuneration committee.
1
2
3
-
-
-
-
Recommendation 1.2: Disclose the process for evaluating the performance of senior executives.
The Remuneration Committee evaluates the performance of Senior Executives by comparing performance against pre-
determined performance criteria set and monitored by the Remuneration Committee. At the date of this report the
Remuneration Committee has not undertaken an evaluation of senior executives performance for the reporting period.
Recommendation 2.4: The Board should establish a Nomination Committee.
The functions to be performed by a nomination committee under the ASX Best Practice Recommendations are currently
performed by the full Board and this is reflected in the written policy setting out the responsibilities of the Board. Having regard
to the number of members currently comprising the Company’s Board, the Board does not consider it appropriate to delegate
these responsibilities to a sub-committee. These arrangements will be reviewed periodically by the board to ensure that they
continue to be appropriate to the Company’s circumstances.
Recommendation 4.2: Structure of the Audit Committee so that it consists of:
The Company's Audit and Risk Management Committee has one Executive Director as a member of the Committee and thus
fails recommendation 4.2 that the committee only consist of Non-Executive Directors.
only Non-Executive Directors;
a majority of Independent Directors;
an independent Chairperson, who is not Chairman of the Board;
at least three members.
16
For
per
sona
l use
onl
y

Consolidated statement of PRofit oR loss and otHeR ComPReHensive inComefoR tHe YeaR ended 30 JUne 2013
Consolidated statement of PRofit oR loss and otHeR ComPReHensive inComefoR tHe YeaR ended 30 JUne 2013
34 Dart Mining NL 2013 ANNUAL REPORT
AUdiTOR’s iNdEPENdENcE dEcLARATiON13F
or p
erso
nal u
se o
nly

35Dart Mining NL 2013 ANNUAL REPORT
13CONsOLidATEd sTATEmENT Of PROfiT OR LOss ANd OTHER COmPREHENsivE iNCOmEfOR THE YEAR ENdEd 30 JUNE 2013
CONsOLidATEd sTATEmENT Of PROfiT OR LOss ANd OTHER COmPREHENsivE iNCOmEfOR THE YEAR ENdEd 30 JUNE 2013
2013 2012
Note $ $
Continuing operations
Revenue 3 5,488,826 80,135 Employee benefits expense (778,615) (543,774)Exploration costs written off (582,362) (7,781)Depreciation and amortisation expense (348) (343)Other expenses (10,391) (13,956)Office expenses (9,412) (33,095)Administrative expenses (572,994) (459,052)Travel related expenses (32,008) (42,225)
Profit/ (loss) before income tax 4 3,502,696 (1,020,091)Income tax expense 5 - -
Profit/ (loss) for the year 3,502,696 (1,020,091)
Other comprehensive income:Items that will not be reclassified to profit or loss - - Items that may be reclassified subsequently to profit or loss - -
Other comprehensive income for the year - - Total comprehensive income for the year - -
Net profit/ (loss) attributable to:
Members of the parent entity 3,502,696 (1,020,091)Non-controlling interest - -
3,502,696 (1,020,091)
Total comprehensive income attributable to:
Members of the parent entity 3,502,696 (1,020,091)Non-controlling interest - -
DART MINING NL ABN: 84 119 904 880
AND CONTROLLED ENTITIES
CONSOLIDATED STATEMENT OF PROFIT OR LOSS AND OTHER COMPREHENSIVE INCOME
FOR THE YEAR ENDED 30 JUNE 2013
Consolidated Group
18
Non-controlling interest - - 3,502,696 (1,020,091)
Earnings per shareFrom continuing and discontinued operations
Basic earnings per share (cents) 8 1.81 (0.68)Diluted earnings per share (cents) 8 1.81 (0.68)
The accompanying notes form part of these financial statements.
18
The accompanying notes form part of these financial statements.
For
per
sona
l use
onl
y

36 Dart Mining NL 2013 ANNUAL REPORT
13CONsOLidATEd sTATEmENT Of fiNANCiAL POsiTiONAs AT 30 JUNE 2013
2013 2012
Note $ $
ASSETS
CURRENT ASSETS
Cash and cash equivalents 9 5,747,831 3,482,337
Trade and other receivables 10 1,048,240 139,975
Other assets 14 28,319 28,986
TOTAL CURRENT ASSETS 6,824,390 3,651,298
NON-CURRENT ASSETS
Property, plant and equipment 12 50,610 83,801
Other non-current assets 14 87,711 86,328 Deferred exploration and evaluation costs 13 10,661,717 7,833,200
TOTAL NON-CURRENT ASSETS 10,800,038 8,003,329 TOTAL ASSETS 17,624,429 11,654,627
LIABILITIES
CURRENT LIABILITIES
Trade and other payables 15 608,003 544,064
Provisions 16 30,367 21,109
TOTAL CURRENT LIABILITIES 638,370 565,173 TOTAL LIABILITIES 638,370 565,173
NET ASSETS 16,986,059 11,089,454
EQUITY
Issued capital 17 17,310,599 15,193,057
Reserves 26 336,448 60,080
Retained earnings (660,987) (4,163,683)TOTAL EQUITY 16,986,059 11,089,454
DART MINING NL ABN: 84 119 904 880
AND CONTROLLED ENTITIES
CONSOLIDATED STATEMENT OF FINANCIAL POSITION AS AT 30 JUNE 2013
Consolidated Group
19
TOTAL EQUITY 16,986,059 11,089,454
The accompanying notes form part of these financial statements.
19
The accompanying notes form part of these financial statements.
For
per
sona
l use
onl
y

37Dart Mining NL 2013 ANNUAL REPORT
13CONsOLidATEd sTATEmENT Of ChANgEs iN EqUiTyfOR ThE yEAR ENdEd 30 JUNE 2013
NoteOrdinary
share
capital
Option
Reserve
Accumulated
lossTotal
$ $ $ $
9,812,795 75,642 (3,143,592) 6,744,845
- - (1,020,091) (1,020,091)
- - - -
- - (1,020,091) (1,020,091)
Options and performance rights issued - 55,700 - 55,700
5,694,475 - - 5,694,475
(314,213) - - (314,213)
- (71,262) - (71,262)
5,380,262 (15,562) - 5,364,700
15,193,057 60,080 (4,163,683) 11,089,454
15,193,057 60,080 (4,163,683) 11,089,454
- - 3,502,696 3,502,696
- - - -
Comprehensive income
Profit for the year
Other comprehensive income for the year
Total transactions with owners and other transfers
Shares issued during the year
Comprehensive income
Transactions with owners, in their capacity as
owners, and other transfers
Total comprehensive income for the year
Capital raising costs
Other comprehensive income for the year
DART MINING NL ABN: 84 119 904 880
AND CONTROLLED ENTITIES
CONSOLIDATED STATEMENT OF CHANGES IN EQUITY FOR THE YEAR ENDED 30 JUNE 2013
Balance at 1 July 2011
Consolidated Group
Loss for the year
Balance at 30 June 2012
Balance at 1 July 2012
Fair value adjustments for options issued
- - - -
- - 3,502,696 3,502,696
Options and performance rights issued - 697,823 - 697,823
Options rights exercised - (230,620) - (230,620)
2,279,988 - - 2,279,988
(162,447) - - (162,447)
- (190,836) - (190,836)
2,117,541 276,368 - 2,393,909
17,310,599 336,448 (660,987) 16,986,059
Other comprehensive income for the year
Total comprehensive income for the year
Transactions with owners, in their capacity as
owners, and other transfers
Balance at 30 June 2013
Fair value adjustments for options issued
Capital raising costs
Shares issued during the year
Total transactions with owners and other transfers
The accompanying notes form part of these financial statements.
20
The accompanying notes form part of these financial statements.
For
per
sona
l use
onl
y

38 Dart Mining NL 2013 ANNUAL REPORT
13CONsOLidATEd sTATEmENT Of CAsh fLOwsfOR ThE YEAR ENdEd 30 JUNE 2013
Note 2013 2012
$ $
CASH FLOWS FROM OPERATING ACTIVITIES
Royalty Income 4,500,000 -
Interest received 95,301 69,465
Payments to suppliers and employees (995,721) (948,772)
Net cash provided by/(used in) operating activities 21a 3,599,580 (879,307)
CASH FLOWS FROM INVESTING ACTIVITIES
Payments for exploration costs (3,215,638) (1,795,225)
Purchase of property, plant and equipment (5,369) (61,063)
Cash amounts used as security deposit - (38,328)
Net cash provided by/(used in) investing activities (3,221,007) (1,894,616)
CASH FLOWS FROM FINANCING ACTIVITIES
Proceeds from issue of shares 2,049,368 5,474,392
Payment of share issue costs (162,447) (314,213)
Net cash provided by/(used in) financing activities 1,886,921 5,160,179
Net increase/(decrease) in cash held 2,265,494 2,386,256
Cash and cash equivalents at beginning of financial year 9 3,482,337 1,096,081 Cash and cash equivalents at end of financial year 9 5,747,831 3,482,337
DART MINING NL ABN: 84 119 904 880
AND CONTROLLED ENTITIES
CONSOLIDATED STATEMENT OF CASH FLOWS FOR THE YEAR ENDED 30 JUNE 2013
Consolidated Group
21
The accompanying notes form part of these financial statements.
21
The accompanying notes form part of these financial statements.
For
per
sona
l use
onl
y

39Dart Mining NL 2013 ANNUAL REPORT
NOTEs TO ThE FiNANciAL sTATEmENTs13
(a)
(b)
The income tax expense/(income) for the year comprises current income tax expense/(income) and deferred tax expense/(income).
The financial statements were authorised for issue on 3 September 2013 by the Directors of the Company.
Income Tax
The financial statements are general purpose financial statements that have been prepared in accordance with Australian Accounting Standards, Australian Accounting
Interpretations, other authoritative pronouncements of the Australian Accounting Standards Board and the Corporations Act 2001. The Group is a for-profit entity for financial
reporting purposes under Australian Accounting Standards.
Current income tax expense charged to profit or loss is the tax payable on taxable income. Current tax liabilities/(assets) are measured at the amounts expected to be paid
to/(recovered from) the relevant taxation authority.
In preparing the consolidated financial statements, all intragroup balances and transactions between entities in the Consolidated Group have been eliminated in full on
consolidation.
The consolidated financial statements incorporate the assets, liabilities and results of entities controlled by Dart Mining NL at the end of the reporting period. A controlled
entity is any entity over which Dart Mining NL has the ability and right to govern the financial and operating policies so as to obtain benefits from the entity’s activities.
DART MINING NL ABN: 84 119 904 880
AND CONTROLLED ENTITIES
NOTES TO THE FINANCIAL STATEMENTS FOR THE YEAR ENDED 30 JUNE 2013
The Directors of Dart Mining NL and its subsidiaries ("the Group") submit herewith the annual report of the Group for the financial year ended 30 June 2013. The separate
financial statements of the parent entity, Dart Mining NL, have not been presented within this financial report as permitted by the Corporations Act 2001.
Summary of Significant Accounting PoliciesNote 1
Basis of Preparation
Australian Accounting Standards set out accounting policies that the Australian Accounting Standards Board has concluded would result in financial statements containing
relevant and reliable information about transactions, events and conditions. Compliance with Australian Accounting Standards ensures that the financial statements and notes
also comply with International Financial Reporting Standards as issued by the IASB. Material accounting policies adopted in the preparation of the financial statements are
presented below and have been consistently applied unless stated otherwise.
Principles of Consolidation
Deferred income tax expense reflects movements in deferred tax asset and deferred tax liability balances during the year as well as unused tax losses.
Except for cash flow information, the financial statements have been prepared on an accruals basis and are based on historical costs, modified, where applicable, by the
measurement at fair value of selected non-current assets, financial assets and financial liabilities.
The result of subsidiaries acquired or disposed of during the year are included in the consolidated statement of comprehensive income from the effective date of acquisition
or up to the effective date of disposal, as appropriate. A list of controlled entities is contained in Note 11 to the financial statements.
(c)
i)
ii) Depreciation of property, plant and equipment
iii) Disposal
iv) Subsequent measurment
Property, plant and equipment is subsequently measured at amortised cost. Amortised cost is calculated as the amount at which the asset is measured at initial
recognition less any depreciation and or impairment.
Property, Plant and Equipment
Current tax assets and liabilities are offset where a legally enforceable right of set-off exists and it is intended that net settlement or simultaneous realisation and settlement
of the respective asset and liability will occur. Deferred tax assets and liabilities are offset where: (a) a legally enforceable right of set-off exists; and (b) the deferred tax
assets and liabilities relate to income taxes levied by the same taxation authority on either the same taxable entity or different taxable entities where it is intended that net
settlement or simultaneous realisation and settlement of the respective asset and liability will occur in future periods in which significant amounts of deferred tax assets or
liabilities are expected to be recovered or settled.
Property, plant and equipment are depreciated on a straight line basis at rates based upon the expected useful lives of these assets. The useful lives of these assets
are detailed in Note 12 to the financial statements.
The gain or loss arising on disposal or retirement of property, plant or equipment is determined as the difference between the sales proceeds and the carrying amount
of the asset and is recognised in profit and loss.
Except for business combinations, no deferred income tax is recognised from the initial recognition of an asset or liability, where there is no effect on accounting or taxable
profit or loss.
Deferred tax assets relating to temporary differences and unused tax losses are recognised only to the extent that it is probable that future taxable profit will be available
against which the benefits of the deferred tax asset can be utilised.
Where temporary differences exist in relation to investments in subsidiaries, branches, associates, and joint ventures, deferred tax assets and liabilities are not recognised
where the timing of the reversal of the temporary difference can be controlled and it is not probable that the reversal will occur in the foreseeable future.
Deferred tax assets and liabilities are calculated at the tax rates that are expected to apply to the period when the asset is realised or the liability is settled and their
measurement also reflects the manner in which management expects to recover or settle the carrying amount of the related asset or liability. With respect to non-
depreciable items of property, plant and equipment measured at fair value and items of investment property measured at fair value, the related deferred tax liability or
deferred tax asset is measured on the basis that the carrying amount of the asset will be recovered entirely through sale.
Current and deferred income tax expense/(income) is charged or credited outside profit or loss when the tax relates to items that are recognised outside profit or loss.
Acquisition
Items of property, plant and equipment are initially recorded at net of GST and depreciated as outlined below.
22
For
per
sona
l use
onl
y

40 Dart Mining NL 2013 ANNUAL REPORT
NOTEs TO ThE FiNANciAL sTATEmENTs13DART MINING NL ABN: 84 119 904 880
AND CONTROLLED ENTITIES
NOTES TO THE FINANCIAL STATEMENTS FOR THE YEAR ENDED 30 JUNE 2013
(d)
\
(e)
Classification and Subsequent Measurement
Financial instruments are subsequently measured at fair value, amortised cost using the effective interest method, or cost.
Financial instruments are initially measured at fair value plus transactions costs except where the instrument is classified ‘at fair value through profit or loss’ in which case
transaction costs are expensed to profit or loss immediately.
Financial Instruments
Initial Recognition and Measurement
Amortised cost is calculated as the amount at which the financial asset or financial liability is measured at initial recognition less principal repayments and any reduction for
impairment, and adjusted for any cumulative amortisation of the difference between that initial amount and the maturity amount calculated using the effective interest
method.
Fair value is determined based on current bid prices for all quoted investments. Valuation techniques are applied to determine the fair value for all unlisted securities,
including recent arm’s length transactions, reference to similar instruments and option pricing models.
Financial assets and financial liabilities are recognised when the entity becomes a party to the contractual provisions to the instrument. For financial assets, this is
equivalent to the date that the Company commits itself to either the purchase or sale of the asset (i.e. trade date accounting is adopted).
A regular review is undertaken of each area of interest to determine the appropriateness of continuing to carry forward costs in relation to that area of interest.
Exploration and Evaluation Assets
Costs of site restoration are provided over the life of the facility from when exploration commences and are included in the costs of that stage. Site restoration costs include
the dismantling and removal of mining plant, equipment and building structures, waste removal and rehabilitation of the site in accordance with the clauses of the mining
permits. Such costs are determined using estimates of future costs, current legal requirements and technology on an undiscounted basis.
Any changes in the estimates for the costs are accounted for on a prospective basis. In determining the costs of site restoration there is uncertainty regarding the nature
and extent of the restoration due to community expectations and future legislation. Accordingly the costs are determined on the basis that restoration will be completed
within one year of abandoning a site.
The effective interest method is used to allocate interest income or interest expense over the relevant period and is equivalent to the rate that discounts estimated future
In accordance with AASB 6 Exploration For and Evaluation of Mineral Resources, exploration and evaluation expenditure incurred is accumulated in respect of each
identifiable area of interest. These costs are only carried forward to the extent that they are expected to be recouped through the successful development of the area or
where activities in the area have not yet reached a stage which permits reasonable assessment of the existence of economically recoverable reserves.
Accumulated costs in relation to an abandoned area are written off in full against operating results in the year in which the decision to abandon the area is made.
When production commences, the accumulated costs for the relevant area of interest are amortised over the life of the area according to the rate of depletion of the
economically recoverable reserves.
(i)
(ii)
(iii)
Non-derivative financial liabilities other than financial guarantees are subsequently measured at amortised cost. Gains or losses are recognised in profit or loss
through the amortisation process and when the financial liability is derecognised.
Loans and receivables
Loans and receivables are non-derivative financial assets with fixed or determinable payments that are not quoted in an active market and are subsequently
measured at amortised cost.
Held-to-maturity investments
Financial Liabilities
Gains or losses are recognised in profit or loss through the amortisation process and when the financial asset is derecognised.
Gains or losses are recognised in profit or loss through the amortisation process and when the financial asset is derecognised.
Held-to-maturity investments are non-derivative financial assets that have fixed maturities and fixed or determinable payments, and it is the Group’s intention to hold
these investments to maturity. They are subsequently measured at amortised cost.
The Group does not designate any interests in subsidiaries, associates or joint venture entities as being subject to the requirements of accounting standards specifically
applicable to financial instruments.
The effective interest method is used to allocate interest income or interest expense over the relevant period and is equivalent to the rate that discounts estimated future
cash payments or receipts (including fees, transaction costs and other premiums or discounts) over the expected life (or when this cannot be reliably predicted, the
contractual term) of the financial instrument to the net carrying amount of the financial asset or financial liability. Revisions to expected future net cash flows will necessitate
an adjustment to the carrying amount with a consequential recognition of an income or expense item in profit or loss.
23
For
per
sona
l use
onl
y

41Dart Mining NL 2013 ANNUAL REPORT
NOTEs TO ThE FiNANciAL sTATEmENTs13DART MINING NL ABN: 84 119 904 880
AND CONTROLLED ENTITIES
NOTES TO THE FINANCIAL STATEMENTS FOR THE YEAR ENDED 30 JUNE 2013
Derecognition
(f)
Financial assets are derecognised when the contractual rights to receipt of cash flows expire or the asset is transferred to another party whereby the entity no longer has
any significant continuing involvement in the risks and benefits associated with the asset. Financial liabilities are derecognised when the related obligations are discharged,
cancelled or have expired. The difference between the carrying amount of the financial liability extinguished or transferred to another party and the fair value of
consideration paid, including the transfer of non-cash assets or liabilities assumed, is recognised in profit or loss.
Where it is not possible to estimate the recoverable amount of an individual asset, the Group estimates the recoverable amount of the cash-generating unit to which the
At the end of each reporting period, the Group assesses whether there is any indication that an asset may be impaired. The assessment will include the consideration of
external and internal sources of information including dividends received from subsidiaries, associates or jointly controlled entities deemed to be out of pre-acquisition
profits. If such an indication exists, an impairment test is carried out on the asset by comparing the recoverable amount of the asset, being the higher of the asset’s fair
value less costs to sell and value in use, to the asset’s carrying amount. Any excess of the asset’s carrying amount over its recoverable amount is recognised immediately
in profit or loss, unless the asset is carried at a revalued amount in accordance with another Standard (e.g. in accordance with the revaluation model in AASB 116). Any
impairment loss of a revalued asset is treated as a revaluation decrease in accordance with that other Standard.
In the case of financial assets carried at amortised cost, loss events may include: indications that the debtors or a group of debtors are experiencing significant financial
difficulty, default or delinquency in interest or principal payments; indications that they will enter bankruptcy or other financial reorganisation; and changes in arrears or
economic conditions that correlate with defaults.
For financial assets carried at amortised cost (including loans and receivables), a separate allowance account is used to reduce the carrying amount of financial assets
impaired by credit losses. After having taken all possible measures of recovery, if management establishes that the carrying amount cannot be recovered by any means, at
that point the written-off amounts are charged to the allowance account or the carrying amount of impaired financial assets is reduced directly if no impairment amount was
previously recognised in the allowance account.
When the terms of financial assets that would otherwise have been past due or impaired have been renegotiated, the Group recognises the impairment for such financial
assets by taking into account the original terms as if the terms have not been renegotiated so that the loss events that have occurred are duly considered.
Impairment of Assets
At the end of each reporting period, the Group assesses whether there is objective evidence that a financial asset has been impaired. A financial asset (or a group of
financial assets) is deemed to be impaired if, and only if, there is objective evidence of impairment as a result of one or more events (a “loss event”) having occurred, which
has an impact on the estimated future cash flows of the financial asset(s).
Impairment
In the case of available-for-sale financial assets, a significant or prolonged decline in the market value of the instrument is considered to constitute a loss event. Impairment
losses are recognised in profit or loss immediately. Also, any cumulative decline in fair value previously recognised in other comprehensive income is reclassified to profit or
loss at this point.
(g)
(h)
(i)
(j)
Employee Benefits
Provision is made for the Group’s liability for employee benefits arising from services rendered by employees to the end of the reporting period. Employee benefits that are
expected to be settled within one year have been measured at the amounts expected to be paid when the liability is settled.
Provisions are measured using the best estimate of the amounts required to settle the obligation at the end of the reporting period.
Cash and cash equivalents include cash on hand, deposits available on demand with banks, other short-term highly liquid investments with original maturities of 3 months
or less, and bank overdrafts. Bank overdrafts are reported within short-term borrowings in current liabilities in the statement of financial position.
Provisions are recognised when the group has a legal or constructive obligation, as a result of past events, for which it is probable that an outflow of economic benefits will
result and that outflow can be reliably measured.
Cash and Cash Equivalents
Provisions
The minimum lease payments of operating leases, where the lesser effectively retains substantially all of the risks and benefits of ownership of the leased item, are
recognised as an expense on a straight line basis. Contingent rentals are recognised as an expense in the financial year in which they are incurred.
Employee benefits payable later than one year have been measured at the present value of the estimated future cash outflows to be made for those benefits. In determining
the liability, consideration is given to employee wage increases and the probability that the employee may satisfy any vesting requirements. Those cash flows are
discounted using market yields on national government bonds with terms to maturity that match the expected timing of cash flows attributable to employee benefits.
Leases
Impairment testing is performed annually for goodwill, intangible assets with indefinite lives and intangible assets not yet available for use.
Where it is not possible to estimate the recoverable amount of an individual asset, the Group estimates the recoverable amount of the cash-generating unit to which the
asset belongs.
Operating Leases
Finance Leases
Leases are classified at their inception as either operating or finance leases based on the economic substance of the agreement so as to reflect the risks and benefits
incidental to ownership.
Leases which effectively transfer substantially the entire risks and benefits incidental to ownership of the leased item to the Group are capitalised at the present value of the
minimum lease payments and disclosed as property, plant and equipment under lease. A lease liability of equal value is also recognised. The consolidated entity has no
finance leases as at 30 June 2013.
24
For
per
sona
l use
onl
y

42 Dart Mining NL 2013 ANNUAL REPORT
NOTEs TO ThE FiNANciAL sTATEmENTs13DART MINING NL ABN: 84 119 904 880
AND CONTROLLED ENTITIES
NOTES TO THE FINANCIAL STATEMENTS FOR THE YEAR ENDED 30 JUNE 2013
(k)
(l)
a)
b)
(m)
The fair value determined at the grant date of the equity settled share based payment is expensed on a straight-line basis over the vesting period, based on the
Directors’ estimate of shares that will eventually vest.
Equity-settled share based payment transactions with other parties are measured at the fair value of the goods and services received, except where the fair value
cannot be estimated reliably, in which case they are measured at the fair value of the equity instruments granted, measured at the date the entity obtains the goods or
the counterparty renders the service.
Going Concern Basis
Transaction costs arising on the issue of equity instruments are recognised directly in equity as a reduction of the proceeds of the equity instrument to which the costs
relate. Transaction costs are costs that are incurred directly in connection with the issue of those equity instruments and which would not have been incurred had those
instruments not been issued.
The Group measures the cost of equity-settled transactions with employees and consultants by reference to the fair value of the equity instruments at the date at which they
are granted. The fair value is determined by using the Black-Scholes model, using the assumptions detailed in Note 22.
Issued Capital
Transaction costs on the issue of equity instruments
Share-based Payments
The ability of the Group to continue as a going concern for the twelve months from the date of this report is dependent on its ability to control its overhead costs and
Issued and paid up capital is recognised at the fair value of the consideration received by the Company.
The Group is involved in the exploration and evaluation of mineral tenements and as such expects to be cash absorbing until these tenements demonstrate that they
contain economically recoverable reserves.
As at 30 June 2013, the Group had a surplus of current assets over current liabilities of $6,186,020 (2012: $3,086,125) including cash reserves of $5,747,831 (2012:
$3,482,337).
The balance of these cash reserves broadly exceeds the Group’s planned expenditure budget including exploration activities for the 12 months to 31 August 2014 which is
based on the minimum spend required in order to maintain the Group’s existing tenements.
For the year ended 30 June 2013, the Group reported net cash inflows/(outflows) from operations and investing activities of $3,599,580 (2012: ($879,307)) and - $3,221,007
(2012: ($1,894,616)) respectively.These cash outflows were offset by net cash inflows from financing activities of $1,886,921 (2012: $5,160,179) resulting in total cash
inflows for the year of $2,265,494 (2012: $2,386,256).
Notwithstanding the above, the financial statements have been prepared on a going concern basis which contemplates the continuity of normal business activities and the
realisation of assets and settlement of liabilities in the ordinary course of business.
-
-
-
(n)
(o)
(p)
(q)
Trade and Other Receivables
Interest revenue is recognised using the effective interest method.
Trade and Other Payables
Trade and other receivables include amounts due from customers for goods sold and services performed in the ordinary course of business. Receivables expected to be
collected within 12 months of the end of the reporting period are classified as current assets. All other receivables are classified as non-current assets.
Revenue and Other Income
Trade and other payables represent the liabilities for goods and services received by the entity that remain unpaid at the end of the reporting period. The balance is
recognised as a current liability with the amounts normally paid within 30 days of recognition of the liability.
Trade and other receivables are initially recognised at fair value and subsequently measured at amortised cost using the effective interest method, less any provision for
impairment. Refer to Note 1(f) for further discussion on the determination of impairment losses.
Cash flows are presented on a gross basis. The GST components of cash flows arising from investing or financing activities which are recoverable from, or payable to, the
ATO are presented as operating cash flows included in receipts from customers or payments to suppliers.
Revenues, expenses and assets are recognised net of the amount of GST, except where the amount of GST incurred is not recoverable from the Australian Taxation Office
(ATO).
Goods and Services Tax (GST)
Receivables and payables are stated inclusive of the amount of GST receivable or payable. The net amount of GST recoverable from, or payable to, the ATO is included
with other receivables or payables in the statement of financial position.
All revenue is stated net of the amount of goods and services tax.
Revenue is measured at the fair value of the consideration received or receivable after taking into account any trade discounts and volume rebates allowed. When the
inflow of consideration is deferred, it is treated as the provision of financing and is discounted at a rate of interest that is generally accepted in the market for similar
arrangements. The difference between the amount initially recognised and the amount ultimately received is interest revenue.
the potential farm-out of participating interests in the group’s permits;
Having carefully assessed the likelihood of securing additional funding or entering into farm-out arrangements and the Group’s ability to effectively manage their
expenditures and cash flows from operations, the directors believe that the Group will continue to operate as a going concern for the foreseeable future and therefore it is
appropriate to prepare the financial statements on a going concern basis.
future equity or debt fund raisings; and
The ability of the Group to continue as a going concern for the twelve months from the date of this report is dependent on its ability to control its overhead costs and
exploration expenditures. The Group also has the ability potentially to generate additional funds from activities including:
successful development of existing tenements.
25
For
per
sona
l use
onl
y

43Dart Mining NL 2013 ANNUAL REPORT
NOTEs TO ThE FiNANciAL sTATEmENTs13DART MINING NL ABN: 84 119 904 880
AND CONTROLLED ENTITIES
NOTES TO THE FINANCIAL STATEMENTS FOR THE YEAR ENDED 30 JUNE 2013
(r)
(s)
(t)
(u) New Accounting Standards for Application in Future Periods
— AASB 9: Financial Instruments (December 2010) and AASB 2010–7: Amendments to Australian Accounting Standards arising from AASB 9 (December 2010).
The AASB has issued a number of new and amended Accounting Standards and Interpretations that have mandatory application dates for future reporting periods, some of
which are relevant to the Group. The Group has decided not to early adopt any of the new and amended pronouncements. The Group’s assessment of the new and
amended pronouncements that are relevant to the Group but applicable in future reporting periods is set out below:
Comparative Figures
Government Grants
Government grants are recognised at fair value where there is reasonable assurance that the grant will be received and all grant conditions will be met. Grants relating to
expense items are recognised as income over the periods necessary to match the grant to the costs they are compensating. Grants relating to assets are credited to
deferred income at fair value and are credited to income over the expected useful life of the asset on a straight-line basis.
In applying the Group’s accounting policies, management is required to make judgements, estimates and assumptions about the carrying values of assets and liabilities.
These estimates and assumptions are made based on past experience and other factors that are considered relevant. Actual results may differ from these estimates. All
estimates and underlying assumptions are reviewed on an ongoing basis. Revisions to accounting estimates are recognised in the period in which the estimate is revised if
the revision affects both current and future periods.
When required by Accounting Standards, comparative figures have been adjusted to conform to changes in presentation for the current financial year.
Critical Accounting Estimates and Judgments
Where the Group has retrospectively applied an accounting policy, made a retrospective restatement or reclassified items in its financial statements, an additional
statement of financial position as at the beginning of the earliest comparative period will be disclosed.
The following describes critical judgements that management has made in the process of applying the Group’s accounting policies and that have the most significant effect
on the amounts recognised in the financial statements:
Impairment of deferred exploration costs
The Group’s accounting policy for exploration expenditure results in some items being capitalised for an area of interest where it is considered likely to be recoverable in the
future or where the activities have not reached a stage which permits a reasonable assessment of the existence of reserves. Management is required to make certain
estimates and assumptions as to future events and circumstances, which may change as new information becomes available. If a judgement is made that recovery of a
capitalised expenditure is unlikely, the relevant amount will be written off to the income statement.
These Standards are applicable retrospectively and include revised requirements for the classification and measurement of financial instruments, as well as
recognition and derecognition requirements for financial instruments.
—
requiring financial assets to be reclassified where there is a change in an entity’s business model as they are initially classified based on: (a) the objective of the
entity’s business model for managing the financial assets; and (b) the characteristics of the contractual cash flows; and
simplifying the requirements for embedded derivatives;
simplifying the classifications of financial assets into those carried at amortised cost and those carried at fair value;
removing the tainting rules associated with held-to-maturity assets;
requiring an entity that chooses to measure a financial liability at fair value to present the portion of the change in its fair value due to changes in the entity’s
own credit risk in other comprehensive income, except when that would create an accounting mismatch. If such a mismatch would be created or enlarged, the
entity is required to present all changes in fair value (including the effects of changes in the credit risk of the liability) in profit or loss.
AASB 10: Consolidated Financial Statements, AASB 11: Joint Arrangements, AASB 12: Disclosure of Interests in Other Entities, AASB 127: Separate Financial
Statements (August 2011) and AASB 128: Investments in Associates and Joint Ventures (August 2011) (as amended by AASB 2012–10: Amendments to Australian
Accounting Standards – Transition Guidance and Other Amendments ), and AASB 2011–7: Amendments to Australian Accounting Standards arising from the
Consolidation and Joint Arrangements Standards (applicable for annual reporting periods commencing on or after 1 January 2013).
AASB 10 replaces parts of AASB 127: Consolidated and Separate Financial Statements (March 2008, as amended) and Interpretation 112: Consolidation – Special
Purpose Entities . AASB 10 provides a revised definition of "control" and additional application guidance so that a single control model will apply to all investees. This
Standard is not expected to significantly impact the Group's financial statements.
These Standards were mandatorily applicable for annual reporting periods commencing on or after 1 January 2013. However, AASB 2012–6: Amendments to
Australian Accounting Standards – Mandatory Effective Date of AASB 9 and Transition Disclosures (issued September 2012) defers the mandatory application date
of AASB 9 from 1 January 2013 to 1 January 2015. In light of this change to the mandatory effective date, the Group is expected to adopt AASB 9 and AASB 2010–7
for the annual reporting period ending 31 December 2015. Although the directors anticipate that the adoption of AASB 9 and AASB 2010–7 may have a significant
impact on the Group’s financial instruments, it is impracticable at this stage to provide a reasonable estimate of such impact.
The key changes made to accounting requirements include:
allowing an irrevocable election on initial recognition to present gains and losses on investments in equity instruments that are not held for trading in other
comprehensive income. Dividends in respect of these investments that are a return on investment can be recognised in profit or loss and there is no
impairment or recycling on disposal of the instrument;
removing the requirements to separate and fair value embedded derivatives for financial assets carried at amortised cost;
26
For
per
sona
l use
onl
y

44 Dart Mining NL 2013 ANNUAL REPORT
NOTEs TO ThE FiNANciAL sTATEmENTs13DART MINING NL ABN: 84 119 904 880
AND CONTROLLED ENTITIES
NOTES TO THE FINANCIAL STATEMENTS FOR THE YEAR ENDED 30 JUNE 2013
—
—
—
This Standard makes amendments to AASB 124: Related Party Disclosures to remove the individual key management personnel disclosure requirements (including
paras Aus29.1 to Aus29.9.3). These amendments serve a number of purposes, including furthering trans-Tasman convergence, removing differences from IFRSs,
and avoiding any potential confusion with the equivalent Corporations Act 2001 disclosure requirements.
AASB 12 contains the disclosure requirements applicable to entities that hold an interest in a subsidiary, joint venture, joint operation or associate. AASB 12 also
introduces the concept of a "structured entity", replacing the "special purpose entity" concept currently used in Interpretation 112, and requires specific disclosures in
respect of any investments in unconsolidated structured entities. This Standard will affect disclosures only and is not expected to significantly impact the Group's
financial statements.
To facilitate the application of AASBs 10, 11 and 12, revised versions of AASB 127 and AASB 128 have also been issued.
The revisions made to AASB 127 and AASB 128 are not expected to significantly impact the Group's financial statements.
This Standard is not expected to significantly impact the Group’s financial report as a whole because:
AASB 2012–2: Amendments to Australian Accounting Standards – Disclosures – Offsetting Financial Assets and Financial Liabilities (applicable for annual reporting
periods commencing on or after 1 January 2013).
AASB 2012–2 principally amends AASB 7: Financial Instruments: Disclosures to require entities to include information that will enable users of their financial
statements to evaluate the effect or potential effect of netting arrangements, including rights of set-off associated with the entity’s recognised financial assets and
recognised financial liabilities, on the entity’s financial position.
These Standards are expected to result in more detailed fair value disclosures, but are not expected to significantly impact the amounts recognised in the Group’s
financial statements.
AASB 2011–4: Amendments to Australian Accounting Standards to Remove Individual Key Management Personnel Disclosure Requirements (applicable for annual
reporting periods beginning on or after 1 July 2013).
AASB 2011-4 does not affect the related party disclosure requirements in AASB 124 applicable to all reporting entities, and some of these requirements require
similar disclosures to those removed by AASB 2011-4.
enhanced disclosures regarding all assets and liabilities (including, but not limited to, financial assets and financial liabilities) to be measured at fair value.
AASB 13: Fair Value Measurement and AASB 2011–8: Amendments to Australian Accounting Standards arising from AASB 13 (applicable for annual reporting
periods commencing on or after 1 January 2013).
inputs to all fair value measurements to be categorised in accordance with a fair value hierarchy; and
AASB 13 defines fair value, sets out in a single Standard a framework for measuring fair value, and requires disclosures about fair value measurement.
AASB 13 requires:
some of the disclosures removed from AASB 124 will continue to be required under s 300A of the Corporations Act, which is applicable to the Group; and
—
—
AASB 132 and Interpretation 2: Members’ Shares in Co-operative Entities and Similar Instruments to clarify the accounting treatment of any tax effect of a
distribution to holders of equity instruments; and
This Standard is not expected to significantly impact the Group’s financial statements.
AASB 101: Presentation of Financial Statements and
AASB 134: Interim Financial Reporting to clarify the requirements for presenting comparative information;
This Standard is not expected to significantly impact the Group’s financial statements.
AASB 2012–5: Amendments to Australian Accounting Standards arising from Annual Improvements 2009–2011 Cycle (applicable for annual reporting periods
commencing on or after 1 January 2013).
AASB 2012–3: Amendments to Australian Accounting Standards – Offsetting Financial Assets and Financial Liabilities (applicable for annual reporting periods
commencing on or after 1 January 2014).
AASB 1: First-time Adoption of Australian Accounting Standards to clarify the requirements in respect of the application of AASB 1 when an entity discontinues
and then resumes applying Australian Accounting Standards;
AASB 134 to facilitate consistency between the measures of total assets and liabilities an entity reports for its segments in its interim and annual financial
statements.
This Standard amends a number of Australian Accounting Standards as a consequence of the issuance of Annual Improvements to IFRSs 2009–2011 Cycle by the
International Accounting Standards Board, including:
AASB 116: Property, Plant and Equipment to clarify the accounting treatment of spare parts, stand-by equipment and servicing equipment;
This Standard adds application guidance to AASB 132: Financial Instruments: Presentation to address potential inconsistencies identified in applying some of the
offsetting criteria of AASB 132, including clarifying the meaning of “currently has a legally enforceable right of set-off” and that some gross settlement systems may be
considered equivalent to net settlement.
This Standard is not expected to significantly impact the Group’s financial statements.
27
For
per
sona
l use
onl
y

45Dart Mining NL 2013 ANNUAL REPORT
NOTEs TO ThE FiNANciAL sTATEmENTs13DART MINING NL ABN: 84 119 904 880
AND CONTROLLED ENTITIES
NOTES TO THE FINANCIAL STATEMENTS FOR THE YEAR ENDED 30 JUNE 2013
2013 2012
$ $
The following information has been extracted from the books and records of the parent and has been prepared in accordance with Australian Accounting Standards.
STATEMENT OF FINANCIAL POSITION
ASSETS
Current Assets 6,848,942 3,630,598
Non-current Assets 10,800,038 8,003,329
TOTAL ASSETS 17,648,980 11,633,927
LIABILITIES
Current Liabilities 652,049 543,842
TOTAL LIABILITIES 652,049 543,842
NET ASSETS 16,996,931 11,090,085
EQUITY
Issued Capital 17,310,599 15,193,058
Retained earnings 336,448 60,080
Reserve (650,117) (4,163,053)
TOTAL EQUITY 16,996,930 11,090,085
STATEMENT OF PROFIT OR LOSS AND OTHER COMPREHENSIVE INCOME
Total profit/ (loss) 3,512,936 (1,020,091)
Total comprehensive income 3,512,936 (1,020,091)
Note 2013 2012
(a) Revenue from continuing operations $ $
— (i) 4,500,000 -
— 876,733 -
5,376,733 -
R&D Grant
Sales revenue
Royalty
Note 2
Revenue and Other Income
Parent Information
Consolidated Group
Note 3
5,376,733 -
— 111,992 80,134
— 101 1
112,093 80,135
5,488,826 80,135
2013 2012
$ $
582,362 7,781
377,568 149,438
348 343
(i) As previously announced, RK Mine Finance has agreed to purchase up to a 3% Net Smelter Return Royalty (NSR) in the
Unicorn Project for cash of $8.5million and new equity of $1.5million, to be paid over two tranches. The first tranche of
$4.5million for the purchase of a 2% NSR was received in May 2012, the second tranche will be received subject to certain
conditions precedent contained in the agreement between the Company and RK Mine Finance and the satisfactory
compliance of those conditions by the Company on or before October 2014.
Write-off of capitalised exploration expenditure
Share-based payments
Depreciation
Profit/ (loss) before income tax from continuing operations includes the following specific expenses:
other revenue
Profit/ (Loss) for the YearNote 4
Consolidated Group
Total revenue
Other revenue
interest received
28
For
per
sona
l use
onl
y

46 Dart Mining NL 2013 ANNUAL REPORT
NOTEs TO ThE FiNANciAL sTATEmENTs13DART MINING NL ABN: 84 119 904 880
AND CONTROLLED ENTITIES
NOTES TO THE FINANCIAL STATEMENTS FOR THE YEAR ENDED 30 JUNE 2013
2013 2012
(a) $ $
3,502,694 (1,020,092)
1,050,809 (306,027)
147,936 52,348 - -
(1,327,209) (630,683)- -
- 884,362 - -
128,464 -
- -
(b)
3,169,404 1,031,855
- 884,362
128,464 -
(12,975) 1,253,187
3,284,893 3,169,404
2013 2012
$ $
Short-term employee benefits 723,169 559,573
Post-employment benefits 59,333 47,189
Share-based payments 483,700 220,000
Long-term employee benefits 24,210 18,946
1,290,412 845,708
Effect of unused tax losses and tax offsets not recognised as deferred tax
Income tax expense
Refer to the Remuneration Report contained in the Directors’ Report for details of the remuneration paid or payable to each member of the Group’s key management personnel
(KMP) for the year ended 30 June 2013.
Key Management Personnel Compensation
The prima facie tax on profit from ordinary activities before income tax is reconciled to the income tax
Tax losses not brought to account
Tax losses brought forward
Current year tax losses
Total KMP compensation
The totals of remuneration paid to KMP of the company and the Group during the year are as follows:
Note 6
Tax Expense
Consolidated Group
Note 5
(Derecognition)/ Recognition of tax losses - prior years
Utilisation of tax losses brought forward
Tax losses carried forward
Profit / (Loss) from continuing operations
Income tax expense (benefit) calculated at 30%
Effect of non-deductible expenses
Effect of deductible temporary differences
Utilisation of tax losses brought forward
1,290,412 845,708
KMP Options and Rights Holdings
Balance at
beginning of
year
Options
acquired
through Rights
Exercised
during the year
Lapsed during
the year
Balance at end
of year
- - - - -
- - - - -
- - - - -
- - - - -
- - - - -
- - - - -
Balance at
beginning of
year
Options
acquired
through Rights
Exercised
during the year
Lapsed during
the year
Balance at end
of year
75,000 - (75,000) - -
- - - - -
22,500 - (22,500) - -
42,083 - (42,083) - -
19,250 - - (19,250) -
158,833 - (139,583) (19,250) -
Richard G Udovenya
30 June 2013
30 June 2012
Christopher J Bain
Stephen G Poke
Dean G Turnbull
Stephen G Poke
Lindsay J Ward
Christopher J Bain
Richard G Udovenya
Lindsay J Ward
Dean G Turnbull
The number of listed options over ordinary shares held during the financial year by each KMP of the Group is as follows:
Total KMP compensation
29
For
per
sona
l use
onl
y

47Dart Mining NL 2013 ANNUAL REPORT
NOTEs TO ThE FiNANciAL sTATEmENTs13DART MINING NL ABN: 84 119 904 880
AND CONTROLLED ENTITIES
NOTES TO THE FINANCIAL STATEMENTS FOR THE YEAR ENDED 30 JUNE 2013
Balance at
beginning of
year
Incentive
rights granted
as
remuneration
during the year
Incentive
rights
exercised,
lapsed or
excluded
Balance at end
of year
Christopher J Bain 1,000,000 2,000,000 - 3,000,000
Lindsay J Ward - 2,000,000 (2,000,000) -
Dean G Turnbull 1,000,000 - - 1,000,000
Stephen G Poke 1,000,000 2,000,000 - 3,000,000
Richard G Udovenya 1,000,000 2,000,000 - 3,000,000 4,000,000 8,000,000 - 10,000,000
30 June 2012
Balance at
beginning of
year
Incentive
rights granted
as
remuneration
during the year
Incentive
rights
exercised,
lapsed or
excluded
Balance at end
of year
Christopher J Bain 1,000,000 - - 1,000,000
Lindsay J Ward - 2,000,000 (2,000,000) -
Dean G Turnbull 1,000,000 - - 1,000,000
Stephen G Poke 1,000,000 - - 1,000,000
Richard G Udovenya 1,000,000 - - 1,000,000 4,000,000 2,000,000 (2,000,000) 4,000,000
KMP Shareholdings
Shares
acquired
Shares
acquired via
exercise of
Options &
The number of unlisted options and incentive rights over ordinary shares held during the financial year by each KMP of the Group is as follows:
The number of ordinary shares in Dart Mining NL held by each KMP or their nominee, of the Group during the financial year is as follows:
30 June 2013
30 June 2013
acquired
through Share
Purchase Plan
Options &
Incentive
Rights
Shares
disposal
Net Change
other
Balance at end
of year
- - - - 1,853,332
- 2,000,000 (2,000,000) - 2,000,000
- - (363,321) - 4,459,179
- - - - 2,903,749
- - - - 423,955
- 2,000,000 (2,363,321) - 11,640,215
30 June 2012
Shares
acquired
through Share
Purchase Plan
Shares
acquired via
exercise of
Options &
Incentive
Rights
Shares
disposal
Net Change
other
Balance at end
of year
150,000 75,000 - - 1,853,332
- 2,000,000 - - 2,000,000
100,000 22,500 - - 4,822,500
100,000 42,083 (1,095,000) - 2,903,749
45,455 - - - 423,955
395,455 2,139,583 (1,095,000) - 12,003,536
Other KMP Transactions
2013 2012
$ $
Remuneration of the auditor for:
— 25,800 26,250
25,800 26,250
Lindsay J Ward
Stephen G Poke
Richard G Udovenya
Christopher J Bain
Consolidated Group
Dean G Turnbull
Auditors’ RemunerationNote 7
auditing or reviewing the financial report
For details of loans to KMP, refer to Note 24: Related Party Transactions.
For details of other transactions with KMP, refer to Note 24: Related Party Transactions.
There have been no other transactions involving equity instruments other than those described in the tables above.
-
Richard G Udovenya
Balance at beginning of year
1,853,332
Dean G Turnbull
Lindsay J Ward
Christopher J Bain
Stephen G Poke
4,822,500
2,903,749
423,955
4,700,000
Balance at beginning of year
1,628,332
12,003,536
2,000,000
3,856,666
378,500
10,563,498
30
For
per
sona
l use
onl
y
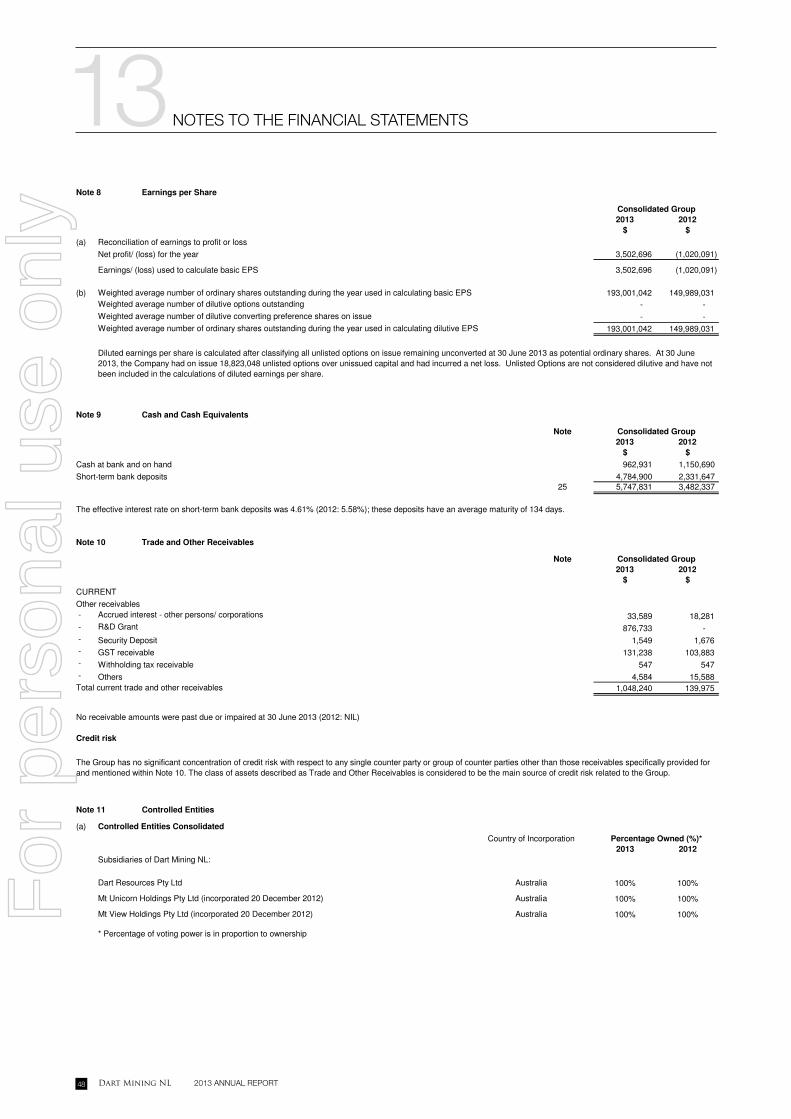
48 Dart Mining NL 2013 ANNUAL REPORT
NOTEs TO ThE FiNANciAL sTATEmENTs13DART MINING NL ABN: 84 119 904 880
AND CONTROLLED ENTITIES
NOTES TO THE FINANCIAL STATEMENTS FOR THE YEAR ENDED 30 JUNE 2013
2013 2012
$ $
(a)
3,502,696 (1,020,091)
3,502,696 (1,020,091)
(b) 193,001,042 149,989,031
- -
- -
193,001,042 149,989,031
Note
2013 2012
$ $
962,931 1,150,690
4,784,900 2,331,647
25 5,747,831 3,482,337
Note
2013 2012
The effective interest rate on short-term bank deposits was 4.61% (2012: 5.58%); these deposits have an average maturity of 134 days.
Earnings/ (loss) used to calculate basic EPS
Net profit/ (loss) for the year
Note 8
Reconciliation of earnings to profit or loss
Earnings per Share
Weighted average number of dilutive converting preference shares on issue
Consolidated Group
Weighted average number of ordinary shares outstanding during the year used in calculating dilutive EPS
Weighted average number of dilutive options outstanding
Cash at bank and on hand
Note 9
Diluted earnings per share is calculated after classifying all unlisted options on issue remaining unconverted at 30 June 2013 as potential ordinary shares. At 30 June
2013, the Company had on issue 18,823,048 unlisted options over unissued capital and had incurred a net loss. Unlisted Options are not considered dilutive and have not
been included in the calculations of diluted earnings per share.
Consolidated Group
Short-term bank deposits
Trade and Other Receivables
Cash and Cash Equivalents
Weighted average number of ordinary shares outstanding during the year used in calculating basic EPS
Note 10
Consolidated Group
2013 2012
$ $
- 33,589 18,281
- 876,733 -
- Security Deposit 1,549 1,676
- GST receivable 131,238 103,883
- Withholding tax receivable 547 547
- 4,584 15,588
1,048,240 139,975
Credit risk
(a)
2013 2012
Subsidiaries of Dart Mining NL:
100% 100%
100% 100%
100% 100%Australia
Country of Incorporation
Total current trade and other receivables
Australia
Mt View Holdings Pty Ltd (incorporated 20 December 2012)
Accrued interest - other persons/ corporations
Others
R&D Grant
AustraliaDart Resources Pty Ltd
Mt Unicorn Holdings Pty Ltd (incorporated 20 December 2012)
* Percentage of voting power is in proportion to ownership
Note 11 Controlled Entities
No receivable amounts were past due or impaired at 30 June 2013 (2012: NIL)
Percentage Owned (%)*
Controlled Entities Consolidated
CURRENT
Other receivables
The Group has no significant concentration of credit risk with respect to any single counter party or group of counter parties other than those receivables specifically provided for
and mentioned within Note 10. The class of assets described as Trade and Other Receivables is considered to be the main source of credit risk related to the Group.
31
For
per
sona
l use
onl
y
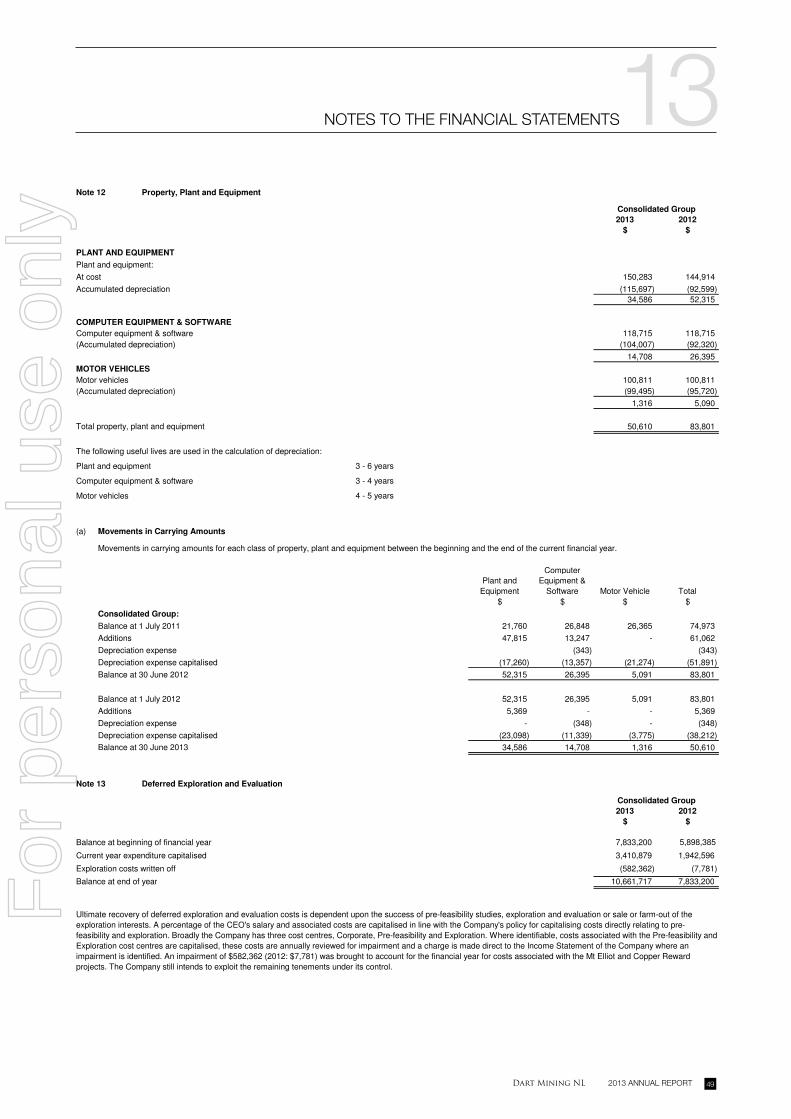
49Dart Mining NL 2013 ANNUAL REPORT
NOTEs TO ThE FiNANciAL sTATEmENTs13DART MINING NL ABN: 84 119 904 880
AND CONTROLLED ENTITIES
NOTES TO THE FINANCIAL STATEMENTS FOR THE YEAR ENDED 30 JUNE 2013
2013 2012
$ $
150,283 144,914
(115,697) (92,599)
34,586 52,315
118,715 118,715
(104,007) (92,320)
14,708 26,395
100,811 100,811
(99,495) (95,720)
1,316 5,090
50,610 83,801
Plant and equipment 3 - 6 years
Computer equipment & software 3 - 4 years
Motor vehicles 4 - 5 years
(a)
Computer
Consolidated Group
Property, Plant and EquipmentNote 12
Movements in Carrying Amounts
Total property, plant and equipment
Motor vehicles
MOTOR VEHICLES
(Accumulated depreciation)
Movements in carrying amounts for each class of property, plant and equipment between the beginning and the end of the current financial year.
COMPUTER EQUIPMENT & SOFTWARE
At cost
Plant and equipment:
Accumulated depreciation
PLANT AND EQUIPMENT
Computer equipment & software
(Accumulated depreciation)
The following useful lives are used in the calculation of depreciation:
Plant and
Equipment
Computer
Equipment &
Software Motor Vehicle Total
$ $ $ $
21,760 26,848 26,365 74,973
47,815 13,247 - 61,062
(343) (343)
(17,260) (13,357) (21,274) (51,891)
52,315 26,395 5,091 83,801
52,315 26,395 5,091 83,801
5,369 - - 5,369
- (348) - (348)
(23,098) (11,339) (3,775) (38,212)
34,586 14,708 1,316 50,610
2013 2012
$ $
Balance at beginning of financial year 7,833,200 5,898,385
Current year expenditure capitalised 3,410,879 1,942,596
Exploration costs written off (582,362) (7,781)
Balance at end of year 10,661,717 7,833,200
Balance at 30 June 2012
Additions
Balance at 30 June 2013
Depreciation expense
Balance at 1 July 2011
Consolidated Group:
Depreciation expense capitalised
Depreciation expense capitalised
Depreciation expense
Consolidated Group
Deferred Exploration and Evaluation
Additions
Ultimate recovery of deferred exploration and evaluation costs is dependent upon the success of pre-feasibility studies, exploration and evaluation or sale or farm-out of the
exploration interests. A percentage of the CEO's salary and associated costs are capitalised in line with the Company's policy for capitalising costs directly relating to pre-
feasibility and exploration. Broadly the Company has three cost centres, Corporate, Pre-feasibility and Exploration. Where identifiable, costs associated with the Pre-feasibility and
Exploration cost centres are capitalised, these costs are annually reviewed for impairment and a charge is made direct to the Income Statement of the Company where an
impairment is identified. An impairment of $582,362 (2012: $7,781) was brought to account for the financial year for costs associated with the Mt Elliot and Copper Reward
projects. The Company still intends to exploit the remaining tenements under its control.
Note 13
Balance at 1 July 2012
32
For
per
sona
l use
onl
y

50 Dart Mining NL 2013 ANNUAL REPORT
NOTEs TO ThE FiNANciAL sTATEmENTs13DART MINING NL ABN: 84 119 904 880
AND CONTROLLED ENTITIES
NOTES TO THE FINANCIAL STATEMENTS FOR THE YEAR ENDED 30 JUNE 2013
2013 2012
$ $
28,319 28,986
28,319 28,986
— 62,211 60,828
— 25,500 25,500
87,711 86,328
2013 2012
$ $
531,033 438,583
76,970 105,481
608,003 544,064
(i) Trade creditors are non-interest bearing and are usually settled on 30 day terms.
(ii) Other creditors are non-interest bearing and have an average term of 30 days.
2013 2012
CURRENT $ $
Consolidated Group
CURRENT
Sundry payables and accrued expenses
Note 15
Unsecured liabilities
Provisions
Consolidated Group
Trade payables
Other receivables
NON-CURRENT
Bond Security for company credit cards
Trade and Other Payables
Other AssetsNote 14
Prepayments
CURRENT
Consolidated Group
Terms and conditions relating to the above financial instruments:
Bond Security for exploration tenement licences
Note 16
CURRENT $ $
21,109 33,312
9,258 48,086
- (60,289)
30,367 21,109
2013 2012
$ $
17,310,599 15,193,057
17,310,599 15,193,057
(a) Ordinary Shares
No. $ No. $
At the beginning of the reporting period 180,937,593 15,193,057 119,838,316 9,812,795
Shares issued during the year 26,153,722 2,279,988 61,099,277 5,694,475
- (162,446) - (314,213)
At the end of the reporting period 207,091,315 17,310,599 180,937,593 15,193,057
The funds were raised to primarily fund the next stage of development of the Unicorn Project while $800,000 before costs related to the sale of a 2% Net Smelter Returns
Royalty to RK Mine Finance (see note 3(i))
During the year ended 30 June 2013, the Company issued 23,598,722 fully paid ordinary shares for a consideration of $1,887,201, after costs, through three share
placements ultilising the provisions of ASX listing rule 7.1 and 7.1A.
Less transaction costs arising from issue of shares
Consolidated Group
The company has authorised share capital amounting to 207,091,315 ordinary shares.
Note 17
20122013
Balance at 30 June 2013
The Company granted 2,000,000 incentive rights to its Managing Director in accordance with his employment contract. Each incentive right on exercise carries the right to
one fully paid ordinary share in Dart Mining NL. The incentive rights were exercised in August 2012 and 2,000,000 fully paid ordinary shares were issued with a fair value at
grant date of $0.092 per share totalling $184,000.
Consolidated Group
207,091,315 (2012: 180,937,593) fully paid ordinary shares
Issued Capital
Additional provisions
Opening balance at 1 July 2012
Amounts used
Short-term Employee Benefits
In addition, the Company granted 435,000 incentive rights to its employees and 120,000 incentive rights to a contractor. Each incentive right on exercise carries the right to
one fully paid ordinary share in Dart Mining NL. The incentive rights were exercised during December 2012 and 555,000 fully paid ordinary shares were issued with a fair
value at grant date of $0.084 per share totalling $46,620.
33
For
per
sona
l use
onl
y

51Dart Mining NL 2013 ANNUAL REPORT
NOTEs TO ThE FiNANciAL sTATEmENTs13DART MINING NL ABN: 84 119 904 880
AND CONTROLLED ENTITIES
NOTES TO THE FINANCIAL STATEMENTS FOR THE YEAR ENDED 30 JUNE 2013
(b)
(c) Share Options
Securities No. of options Exercise price Escrow period
Unlisted 3,000,000 15 cents -
Unlisted 3,000,000 15 cents -
Unlisted 4,273,048 11.1 cents -
Expiry Date Securities No. of options Exercise price Escrow period
Unlisted 8,350,000 15 cents -
Unlisted 100,000 18 cents -
Unlisted 100,000 22 cents -
Unlisted 3,000,000 15 cents -
Unlisted 3,000,000 15 cents -
Unlisted 4,273,048 11 cents -
Under the terms of the exploration tenement licences held by the Group, the Group has a commitment to meet a minimum expenditure requirement in order to keep its rights
current. The minimum expenditure requirement is not recognised as a liability in the statement of financial position of the Group as the Group may relinquish its right to a
particular tenement thereby removing the requirement to meet the minimum expenditure requirement.
At the end of the financial year, there were 18,823,048 (2012: 8,550,000) unlisted options on issue
Terms and condition of contributed equity
20 March 2017
31 December 2015
31 December 2013
Ordinary shares
Ordinary shares have the right to receive dividends as declared and, in the event of the winding up of the Company, to participate in the proceeds from the sale of all
surplus assets in proportion to the number of and amounts paid up on shares held. Ordinary shares entitle their holder to one vote, either in person or by proxy, at a
meeting of the Company.
The issued capital of the Company quoted on the ASX comprises 207,901,315 (2012: 180,937,593) ordinary shares.
Options over ordinary shares
31 December 2016
7 May 2016
During the financial year, the Company issued 6,000,000 unlisted options to Non-Executive Directors subsequent to shareholder approval being granted and 4,273,048
unlisted options as part of the Red Kite Royalty and Equity subscription agreement.
31 December 2016
Expiry Date
Expenditure Commitments
7 May 2016
Note 18
31 December 2015
20 March 2017
2013 2012
Note $ $
(a)
Not longer than 1 year 256,500 794,700
Between 1 and 5 years 256,500 794,700
Longer than 5 years 1,359,450 -
Committed at the reporting date but not recognised as liabilities 1,872,450 1,589,400
(b) Operating leases
Leases as lessee
Non-cancellable operating lease rentals are payable as follows:
Not longer than 1 year 2,872 10,791
Between 1 and 5 years - 2,872
Longer than 5 years - -
Committed at the reporting date but not recognised as liabilities 2,872 13,663
Consolidated Group
particular tenement thereby removing the requirement to meet the minimum expenditure requirement.
The Group entered is a party to a operating lease with an initial term of 2 years. The lease relates to its exploration office at Corryong, North East Victoria and has one year
remaining.
Contingent Liabilities and Contingent Assets
No contingent liabilities or contingent assets existed at reporting date except under tenement licences in Victoria where the Group is required to rehabilitate each licence area to
its original state subsequent to any exploration works. Rehabilitation costs are estimated to be no more than $60,000.
Exploration expenditure
Note 19
34
For
per
sona
l use
onl
y

52 Dart Mining NL 2013 ANNUAL REPORT
NOTEs TO ThE FiNANciAL sTATEmENTs13DART MINING NL ABN: 84 119 904 880
AND CONTROLLED ENTITIES
NOTES TO THE FINANCIAL STATEMENTS FOR THE YEAR ENDED 30 JUNE 2013
2013 2012
$ $
(a)
3,502,695 (1,020,091)
348 343
377,568 149,438
582,362 7,781
(908,265) (94,446)
667 (11,502)
34,946 101,373
9,258 (12,203)
3,599,579 (879,307)
(b)
Cash balance comprises:
962,931 1,150,690
4,784,900 2,331,647
5,747,831 3,482,337
(c) Financing facility
Non-cash flows in profit
Exploration cost written off
Share-based payments
Reconciliation of cash
Cash on hand and at call
Term deposits
The Group has no available finance facilities at balance date.
Consolidated Group
(Increase) in trade and term receivables
(Decrease)/Increase in trade payables and accruals
Decrease/(increase) in other assets
Changes in assets and liabilities:
Increase/(decrease) in provisions
Cash flow from operations
Note 20
Cash Flow Information
Depreciation
The Group’s activities consist of base metal and gold exploration currently in one geographic region, North-East Victoria. There are no other significant classes of business,
either singularly or in aggregate. Internal monthly management reports are provided to the Group’s Managing Director that consolidate operations in one segment. Therefore the
Group’s activities are classed as one business segment and therefore operating results and financial information are not separately disclosed in this note.
Operating Segments
Note 21
Profit/ (loss) after income tax
Reconciliation of Cash Flow from Operations with Profit after Income Tax
(d) Non-cash financing and investing activities
The aggregate share-based payments for the financial year are set out below:
2013 2012
$ $
(ii) 184,000 220,000
(iii) 36,540 -
(iv) 299,700 -
(129,420) (55,000)
(i),(v) & (vi) 177,583 55,700
(190,836) (71,262)
377,567 149,438
(i) In prior year, the Company granted 3,550,000 options to unrelated third parties in lieu of services provided to the Company.
(i0
(ii)
(iii)
(iv) The Company granted 6,000,000 options to Non-Executive Directors subsequent to shareholder approval during the financial year ending 30 June 2013.
Share-based PaymentsNote 22
Fair value of incentive rights granted to employees
There were no non-cash financing or investing activities during the financial year.
Fair value of options to be granted to Non-Executive Directors
Fair value of granted options which is classified as exploration cost by nature and capitalised during the financial year
Fair value of incentive rights granted to Managing Director
Consolidated Group
Details of share-based payments
The Company granted 2,000,000 incentive rights, following share holder approval of the Company's Incentive Rights Plan, to its Managing Director. Each incentive right on
exercise carries the right to one fully paid ordinary share in Dart Mining NL. The incentive rights were exercised in August 2012 and 2,000,000 fully paid ordinary shares
were issued with a fair value at grant date of $0.092 per share totalling $184,000.
Expense arising from share-based payments
Fair value of options granted as share based payments
Fair value adjustment of options issued as at 30 June 2012
The Company granted 435,000 incentive rights, following share holder approval of the Company's Incentive Rights Plan, to its employees. Each incentive right on exercise
carries the right to one fully paid ordinary share in Dart Mining NL. The incentive rights were exercised in December 2012 and 435,000 fully paid ordinary shares were
issued with a fair value at grant date of $0.084 per share totalling $36,540.
35
For
per
sona
l use
onl
y

53Dart Mining NL 2013 ANNUAL REPORT
NOTEs TO ThE FiNANciAL sTATEmENTs13DART MINING NL ABN: 84 119 904 880
AND CONTROLLED ENTITIES
NOTES TO THE FINANCIAL STATEMENTS FOR THE YEAR ENDED 30 JUNE 2013
(v)
(vi)
Executive options
Grant date Number Vesting date Expiry date Exercise price
Fair value at
grant date
Christopher J Bain 1,000,000 26 Nov 2010 31 Dec 2013 15c 0.629c
Dean G Turnbull 1,000,000 26 Nov 2010 31 Dec 2013 15c 0.629c
Stephen G Poke 1,000,000 26 Nov 2010 31 Dec 2013 15c 0.629c
Richard G Udovenya 1,000,000 26 Nov 2010 31 Dec 2013 15c 0.629c
Christopher J Bain 1,000,000 05 Nov 2012 31 Dec 2015 15c 4.600c
Stephen G Poke 1,000,000 05 Nov 2012 31 Dec 2015 15c 4.600c
Richard G Udovenya 1,000,000 05 Nov 2012 31 Dec 2015 15c 4.600c
Christopher J Bain 1,000,000 05 Nov 2012 31 Dec 2016 15c 5.390c
Stephen G Poke 1,000,000 05 Nov 2012 31 Dec 2016 15c 5.390c
Richard G Udovenya 1,000,000 05 Nov 2012 31 Dec 2016 15c 5.390c
No executive options were exercised during the financial year.
Number Vesting date Expiry date Exercise price
Fair value at
grant date
Bernhard R Hochwimmer 1,000,000 26 Nov 2010 31 Dec 2013 15c 0.629c
26 Nov 2010
Share-based payment options held at the end of the reporting year were as follows:
26 Nov 2010
The Company granted 4,273,048 options to RK Mine Finance, as part consideration for the Red Kite Royalty and Equity Subscription Agreement, the issue utilised the
provisions of ASX listing rules 7.1 and 7.1A.
05 Nov 2012
Grant date
Grantee
05 Nov 2012
05 Nov 2012
The following table shows options over unissued shares held by the former director (resigned 30 May 2011) of the Company at 30 June 2013.
05 Nov 2012
05 Nov 2012
26 Nov 2010
The Company granted 120,000 incentive rights, in accordance with the Company's Incentive Rights Plan, to a contractor. Each incentive right on exercise carries the right
to one fully paid ordinary share in Dart Mining NL. The incentive rights were exercised in December 2012 and 120,000 fully paid ordinary shares were issued with a fair
value at grant date of $0.084 per share totalling $10,080.
26 Nov 2010
These shares were issued as compensation to key management personnel of the Group. Further details are provided in the directors’ report.
05 Nov 2012
26 Nov 2010
Grantee
Bernhard R Hochwimmer 1,000,000 26 Nov 2010 31 Dec 2013 15c 0.629c
Third Party Options
Number Vesting date Expiry date Exercise price
Fair value at
grant date
3,350,000 07 Nov 2011 31 Dec 2013 15c 1.420c
100,000 20 Mar 2012 20 Mar 2017 18c 4.500c
100,000 20 Mar 2012 20 Mar 2017 22c 3.630c
4,273,048 07 May 2013 06 May 2016 11.1c 4.490c
.
Risk-free interest rate
20 Mar 2012
Exercise price
07 May 2013
07 Nov 2011
20 Mar 2012
Expected volatility
The total fair value of the unexercised share options granted during the financial year was $467,203.Options were priced using the Black-Scholes model. Where relevant, the
expected life used in the model has been adjusted based on management’s best estimate of the effects of non-transferability and exercise restrictions. Expected volatility is based
on the historical share price volatility of the Company over the reporting period.
Share price at grant date
Option life
26 Nov 2010
Grant date
Dividend yield
36
For
per
sona
l use
onl
y
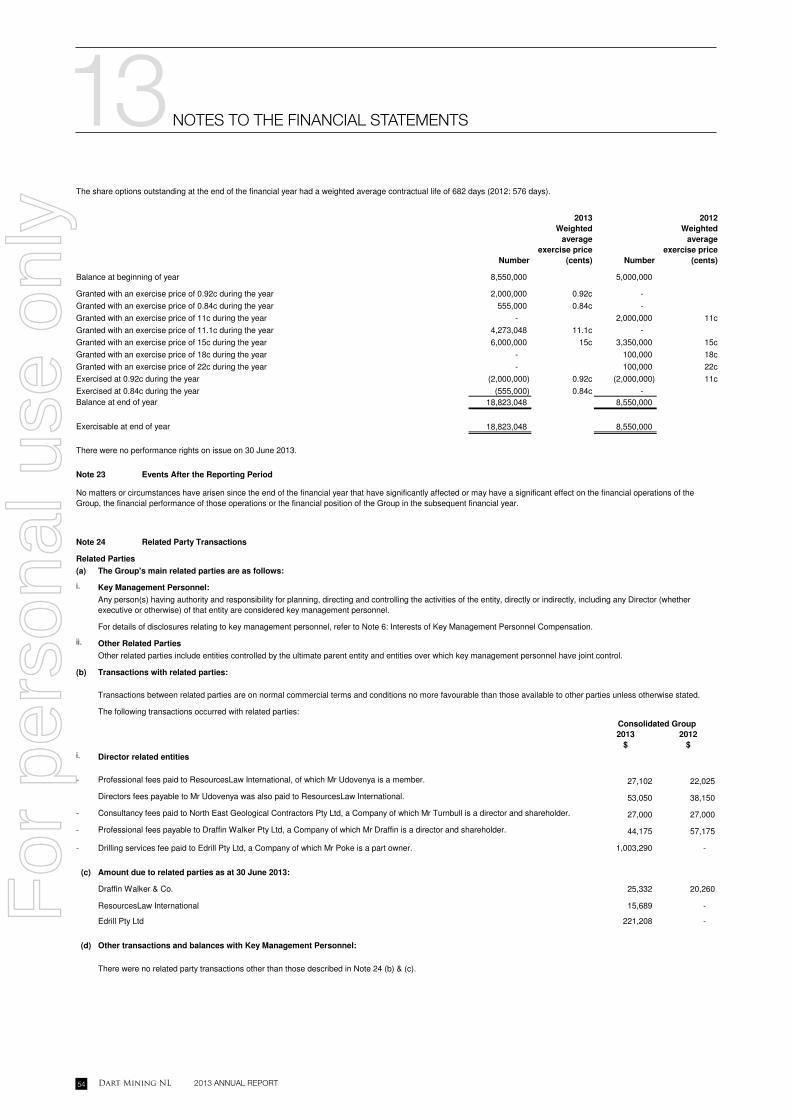
54 Dart Mining NL 2013 ANNUAL REPORT
NOTEs TO ThE FiNANciAL sTATEmENTs13DART MINING NL ABN: 84 119 904 880
AND CONTROLLED ENTITIES
NOTES TO THE FINANCIAL STATEMENTS FOR THE YEAR ENDED 30 JUNE 2013
Number
2013
Weighted
average
exercise price
(cents) Number
2012
Weighted
average
exercise price
(cents)
8,550,000 5,000,000
2,000,000 0.92c -
555,000 0.84c -
- 2,000,000 11c
4,273,048 11.1c -
6,000,000 15c 3,350,000 15c
- 100,000 18c
- 100,000 22c
(2,000,000) 0.92c (2,000,000) 11c
(555,000) 0.84c -
18,823,048 8,550,000
18,823,048 8,550,000
(a)
i.
The Group's main related parties are as follows:
Related Party Transactions
No matters or circumstances have arisen since the end of the financial year that have significantly affected or may have a significant effect on the financial operations of the
Group, the financial performance of those operations or the financial position of the Group in the subsequent financial year.
Related Parties
Note 23
Balance at end of year
Exercised at 0.84c during the year
Granted with an exercise price of 0.84c during the year
Granted with an exercise price of 11c during the year
The share options outstanding at the end of the financial year had a weighted average contractual life of 682 days (2012: 576 days).
Balance at beginning of year
Granted with an exercise price of 11.1c during the year
Granted with an exercise price of 0.92c during the year
Exercised at 0.92c during the year
Granted with an exercise price of 18c during the year
Granted with an exercise price of 22c during the year
Events After the Reporting Period
Note 24
There were no performance rights on issue on 30 June 2013.
Exercisable at end of year
Granted with an exercise price of 15c during the year
i.
ii.
(b)
2013 2012
$ $
i.
- 27,102 22,025
53,050 38,150
- 27,000 27,000
- 44,175 57,175
- 1,003,290 -
(c) Amount due to related parties as at 30 June 2013:
Draffin Walker & Co. 25,332 20,260
ResourcesLaw International 15,689 -
Edrill Pty Ltd 221,208 -
(d) Other transactions and balances with Key Management Personnel:
For details of disclosures relating to key management personnel, refer to Note 6: Interests of Key Management Personnel Compensation.
Other related parties include entities controlled by the ultimate parent entity and entities over which key management personnel have joint control.
Other Related Parties
Consolidated Group
The following transactions occurred with related parties:
Director related entities
Key Management Personnel:
Any person(s) having authority and responsibility for planning, directing and controlling the activities of the entity, directly or indirectly, including any Director (whether
executive or otherwise) of that entity are considered key management personnel.
Transactions between related parties are on normal commercial terms and conditions no more favourable than those available to other parties unless otherwise stated.
Transactions with related parties:
Professional fees payable to Draffin Walker Pty Ltd, a Company of which Mr Draffin is a director and shareholder.
Drilling services fee paid to Edrill Pty Ltd, a Company of which Mr Poke is a part owner.
Professional fees paid to ResourcesLaw International, of which Mr Udovenya is a member.
Directors fees payable to Mr Udovenya was also paid to ResourcesLaw International.
There were no related party transactions other than those described in Note 24 (b) & (c).
Consultancy fees paid to North East Geological Contractors Pty Ltd, a Company of which Mr Turnbull is a director and shareholder.
37
For
per
sona
l use
onl
y

55Dart Mining NL 2013 ANNUAL REPORT
NOTEs TO ThE FiNANciAL sTATEmENTs13DART MINING NL ABN: 84 119 904 880
AND CONTROLLED ENTITIES
NOTES TO THE FINANCIAL STATEMENTS FOR THE YEAR ENDED 30 JUNE 2013
2013 2012
Note $ $
Financial Assets
9 5,747,831 3,482,337 - -
1,048,240 139,975 - -
Other non-current receivables 87,711 86,328
Total Financial Assets 6,883,781 3,708,640
Financial Liabilities
— 15 608,003 544,064
Total Financial Liabilities 608,003 544,064
Specific Financial Risk Exposures and Management
a. Credit risk
Trade and other payables
The Group does not have any significant credit risk exposure to any single counterparty or any group of counterparties having similar characteristics. The credit risk on
liquid funds and derivative financial instruments is limited as the counterparties are banks with high credit ratings assigned by international credit rating agencies.
The totals for each category of financial instruments, measured in accordance with AASB 139 as detailed in the accounting policies to these financial statements, are as follows:
The Group’s financial instruments consist mainly of deposits with banks, receivables and trade and other payables.
Financial Risk Management
Cash and cash equivalents
Other receivables
The carrying amount of financial assets recorded in the financial statements, net of any allowances for losses, represent the Group’s maximum exposure to credit risk.
Consolidated Group
The main risks the Group is exposed to through its financial instruments are credit risk, liquidity risk and market risk consisting of interest rate risk and foreign currency risk.
There have been no substantive changes in the types of risks the Group is exposed to, how these risks arise, or the Board’s objectives, policies and processes for managing or
measuring the risks from the previous period.
Financial liabilities at amortised cost
Credit risk refers to the risk that a counterparty will default on its contractual obligations resulting in financial loss to the Group. The Group has adopted a policy of only
dealing with creditworthy counterparties as a means of mitigating the risk of financial loss from defaults. The Group’s exposure to credit risks are continuously monitored
and controlled by counterparty limits that are reviewed and approved by management on a regular basis.
Note 25
b. Liquidity risk
The following tables details the Group's remaining contractual maturity for its financial liabilities and financial assets:
Consolidated Group
2013
$
2012
$
2013
$
2012
$
2013
$
2012
$
2013
$
2012
$
Financial liabilities due for payment
608,003 544,064 - - - - 608,003 544,064
608,003 544,064 - - - - 608,003 544,064
Consolidated Group
2013
$
2012
$
2013
$
2012
$
2013
$
2012
$
2013
$
2012
$
Financial Assets - cash flows realisable
5,747,831 3,482,337 - - - - 5,747,831 3,482,337
- - 87,711 86,328 - - 87,711 86,328
- - - - - - -
1,046,691 138,299 - 1,676 - - 1,046,691 139,975
6,794,522 3,620,636 87,711 88,004 - - 6,882,232 3,708,640
6,186,519 3,076,571 87,711 88,004 - - 6,882,232 3,708,640
Net (outflow) / inflow on
financial instruments
Held-to-maturity investments
Other non-interest bearing
receivables
Cash and cash equivalents
Trade, term and loans
receivables
Total anticipated inflows
Trade and other payables
Over 5 years
Total contractual
outflows
Ultimate responsibility for liquidity risk management rests with the Board of Directors, who have built an appropriate liquidity risk management framework for the
management of the Group’s short, medium and long term funding and liquidity management requirements. The Group manages liquidity risk by maintaining adequate
reserves and banking facilities by continuously monitoring forecast and actual cash flows together with matching profiles of financial assets and liabilities.
Over 5 years
The carrying amount of financial assets recorded in the financial statements, net of any allowances for losses, represent the Group’s maximum exposure to credit risk.
Within 1 Year Total
TotalWithin 1 Year 1 to 5 years
1 to 5 years
38
For
per
sona
l use
onl
y

56 Dart Mining NL 2013 ANNUAL REPORT
NOTEs TO ThE FiNANciAL sTATEmENTs13DART MINING NL ABN: 84 119 904 880
AND CONTROLLED ENTITIES
NOTES TO THE FINANCIAL STATEMENTS FOR THE YEAR ENDED 30 JUNE 2013
c. Market Risk
i. Interest rate risk
Interest rate sensitivity analysis
Profit Equity
Year ended 30 June 2013 $ $
29,178 29,178
Profit Equity
Year ended 30 June 2012 $ $
3,946 3,946
d. Fair Values
The fair values of financial assets and financial liabilities are determined as follows:
-
The Directors consider that the carrying amounts of financial assets and financial liabilities recorded at cost less any accumulated impairments in the financial statements
approximates their fair values.
Fair value estimation
+/- 0.5% in interest rates
The fair values of financial assets and financial liabilities are presented in the following table and can be compared to their carrying amounts as presented in the statement of
financial position. Fair value is the amount at which an asset could be exchanged, or a liability settled, between knowledgeable, willing parties in an arm’s length transaction.
There have been no changes in any of the methods or assumptions used to prepare the above sensitivity analysis from the prior year.
The Group currently holds no amounts of borrowed funds.
The Group’s exposure to market risk primarily consists of financial risks associated with changes in interest rates as detailed below. As the level of risk is low, the Group
does not use any derivatives to hedge its exposure. Market risks are managed through cash flow forecasts and sensitivity analysis on a regular basis.
The Group is exposed to interest rate risks as it holds funds at both fixed and variable interest rates. This risk is managed through the use of cash flow forecasts
supplemented by sensitivity analysis.
Consolidated Group
Consolidated Group
Other financial assets and financial liabilities are determined in accordance with generally accepted pricing models.
+/- 0.5% in interest rates
A sensitivity analysis has been determined based on the exposure to interest rates at reporting date with the stipulated change taking place at the beginning of the financial
year and held constant throughout the reporting period. A 50 basis point increase or decrease is used when reporting interest rate risk internally to key management
personnel and represents management’s assessment of the possible change in interest rates.
These sensitivities assume that the movement in a particular variable is independent of other variables.
Note
Carrying
Amount Fair Value
Carrying
Amount Fair Value
Consolidated Group $ $ $ $
Financial assets
Cash and cash equivalents (i) 5,747,831 5,747,831 3,482,337 3,482,337
Trade and other receivables (i) 87,711 87,711 86,328 86,328
Other non-interest bearing receivables (i) 1,046,691 1,046,691 139,975 139,975
Total financial assets 6,882,232 6,882,232 3,708,640 3,708,640
Financial liabilities
Trade and other payables (i) 608,003 608,003 544,064 544,064
Total financial liabilities 608,003 608,003 544,064 544,064
(i)
financial position. Fair value is the amount at which an asset could be exchanged, or a liability settled, between knowledgeable, willing parties in an arm’s length transaction.
Differences between fair values and carrying amounts of financial instruments with fixed interest rates are due to the change in discount rates being applied by the market since
their initial recognition by the Group. Most of these instruments, which are carried at amortised cost (i.e. term receivables, held-to-maturity assets), are to be held until maturity
and therefore the fair value figures calculated bear little relevance to the Group.
2013
Cash and cash equivalents, trade and other receivables and trade and other payables are short-term instruments in nature whose carrying amount is equivalent to fair
value. Trade and other payables excludes amounts provided for annual leave, which is outside the scope of AASB 139.
Fair values derived may be based on information that is estimated or subject to judgment, where changes in assumptions may have a material impact on the amounts estimated.
Areas of judgment and the assumptions have been detailed below. Where possible, valuation information used to calculate fair value is extracted from the market, with more
reliable information available from markets that are actively traded. In this regard, fair values for listed securities are obtained from quoted market bid prices. Where securities
are unlisted and no market quotes are available, fair value is obtained using discounted cash flow analysis and other valuation techniques commonly used by market participants.
The fair values disclosed in the above table have been determined based on the following methodologies:
2012
39
For
per
sona
l use
onl
y

57Dart Mining NL 2013 ANNUAL REPORT
NOTEs TO ThE FiNANciAL sTATEmENTs13DART MINING NL ABN: 84 119 904 880
AND CONTROLLED ENTITIES
NOTES TO THE FINANCIAL STATEMENTS FOR THE YEAR ENDED 30 JUNE 2013
Level 1 Level 2 Level 3 Total
Financial assets: $ $ $ $
Cash and cash equivalents
- cash on hand and fixed interest deposits - 5,747,831 - 5,747,831
- 5,747,831 - 5,747,831
Level 1 Level 2 Level 3 Total
Financial assets: $ $ $ $
Cash and cash equivalents
- cash on hand and fixed interest deposits - 3,482,337 - 3,482,337
- 3,482,337 - 3,482,337
2013 2012
$ $
Balance at beginning of financial year 60,080 75,642
3,000,000 options granted at a fair value of 4.60 cents per option to Non-Executive Directors on 5 November 2012 138,000 -
3,000,000 options granted at a fair value of 5.39 cents per option to Non-Executive Directors on 5 November 2012 161,700
4,273,048 options granted at a fair value of 4.49 cents per option 167,503
3,350,000 options granted at a fair value of 1.42 cents per option to an unrelated third party on 7 November 2011 - 47,570
100,000 options granted at a fair value of 4.50 cents per option to an unrelated third party on 20 March 2012 - 4,500
100,000 options granted at a fair value of 3.63 cents per option to an unrelated third party on 20 March 2012 - 3,630
Fair value adjustments for options issued as at 30 June 2013 (190,835) (71,262)
Note 26
The financial instruments recognised at fair value in the statement of financial position have been analysed and classified using a fair value hierarchy reflecting the significance of
the inputs used in making the measurements. The fair value hierarchy consists of the following levels:
2012
Consolidated Group
2013
- quoted prices in active markets for identical assets or liabilities (Level 1)
- inputs other than quoted prices included within Level 1 that are observable for the asset or liability, either directly (as prices) or indirectly (derived from prices) (Level 2);
and
- inputs for the asset or liability that are not based on observable market data (unobservable inputs) (Level 3).
Financial Instruments Measured at Fair Value
Consolidated Group
Reserves
Options Reserve
Fair value adjustments for options issued as at 30 June 2013 (190,835) (71,262)
336,448 60,080
At the date of this report no Incentive Rights are on issue therefore no fair value can be attributed to them resulting in the adjustment.
The reserve arises on the grant of share options to third parties and executives as equity-based payments.
Company DetailsNote 27
Melbourne VIC 3000
395 Collins Street
Melbourne VIC 3000
Dart Mining NL
Level 2
The principal places of business are:
395 Collins Street
Dart Mining NL
Level 2
The registered office of the company is:
Balance at end of financial year
40
For
per
sona
l use
onl
y

58 Dart Mining NL 2013 ANNUAL REPORT
DiREcTORs’ DEcLARATiON13F
or p
erso
nal u
se o
nly

59Dart Mining NL 2013 ANNUAL REPORT
INdEPENdENT AUdITOR’s REPORT13F
or p
erso
nal u
se o
nly

60 Dart Mining NL 2013 ANNUAL REPORT
INdEPENdENT AUdITOR’s REPORT13F
or p
erso
nal u
se o
nly

61Dart Mining NL 2013 ANNUAL REPORT
AddiTiONAL iNfORmATiON fOR LisTEd PUbLic cOmPANiEs131. Shareholding
a. Distribution of Shareholders
No. of Holders No. of Ordinary
Shares
49 7,502
100 389,105
270 2,369,743
753 29,990,035
280 174,334,930
1,452 207,091,315
b.
c.
Shareholder
Number of Ordinary
Fully Paid Shares
Held
% Held
of Issued
Ordinary Capital
18,933,930 9.15%
d. Voting Rights
e.
Name
Number of Ordinary
Fully Paid Shares
Held
% Held
of Issued
Ordinary Capital
1. 15,670,331 7.57%
2. 8,741,814 4.22%
3. 6,045,000 2.92%
4. 5,840,562 2.82%
Category (size of holding)
Number
R. Simpson, E. Simpson and M. Simpson
1 – 1,000
1,001 – 5,000
5,001 – 10,000
The names of the substantial shareholders listed in the holding company’s register are:
The number of shareholdings held in less than marketable parcels is 185 (2012: 152) with a combined total of
597,397 securities (2012: 453,465)
100,001 – and over
10,001 – 100,000
DART MINING NL ABN: 84 119 904 880
AND CONTROLLED ENTITIES
ADDITIONAL INFORMATION FOR LISTED PUBLIC COMPANIES
The following information is current as at 21 August 2013:
MR RUSSELL SIMPSON & MRS ELIZABETH
SIMPSON & MS MEREDITH SIMPSON <RIMERED
SUPER FUND A/C>
JP MORGAN NOMINEES AUSTRALIA LIMITED
<CASH INCOME A/C>
W & E MAAS HOLDINGS PTY LIMITED
CITICORP NOMINEES PTY LIMITED
20 Largest Shareholders — Ordinary Shares
All shares carry one vote per share without restriction.
5. 4,500,000 2.17%
6. 4,459,179 2.15%
7. 3,600,000 1.74%
8. 3,263,599 1.58%
9. 3,250,600 1.57%
10. 3,250,483 1.57%
11. 3,200,000 1.55%
12. 2,900,000 1.40%
13. 2,666,666 1.29%
14. 2,425,000 1.17%
15. 2,365,371 1.14%
16. 2,225,000 1.07%
17. 2,181,546 1.05%
18. 2,000,000 0.97%
18. 2,000,000 0.97%
19. 1,668,962 0.81%
20. 1,500,000 0.72%
20. 1,500,000 0.72%
85,254,113 41.17%
TESANEER PTY LTD
NATIONAL NOMINEES LIMITED
GONCANG PTY LTD <DGA SUPERANNUATION
FUND A/C>
MR RUSSELL MCLARTY SIMPSON & MRS
ELIZABETH VERNON SMPSON & MS MEREDITH
HILARY SIMPSON <RIMERED S/F A/C>
SPECIALISED ALLOYS SERVICES PTY LTD
B HOCHWIMMER & ASSOCIATES PTY LTD
<HOCHWIMMER SUPER FUND A/C>
STRATH DEE PTY LTD
MR MICHAEL ANDREW PAJMON
LINDSAY WARD
MR JAMES VINCENT CHESTER GUEST
MR ROBERT CHARLES SEAWRIGHT
GRANITE HILLS (VICTORIA) PTY LTD
J BARLOW CONSULTANTS PTY LTD
MR ERROL GIUSEPPE ROBERTSON
MR ANDREW MATTHEW CAMERON & MRS
GWENETH MARSH CAMERON & MRS FIONA
CRICHTON BARCLAY < EST LATE HUGH L
CAMERON A/C>
MR PHILIP ALAN KENNETH NAYLOR & MRS
ANDREA NAYLOR <CALLAHORN SUPER FUND
A/C>
NORTH EAST GEOLOGICAL CONTRACTORS
PTY LTD
FINOOK PTY LTD <B & A JAMES SUPER FUND
A/C>
44
For
per
sona
l use
onl
y

62 Dart Mining NL 2013 ANNUAL REPORT
AddiTiONAL iNfORmATiON fOR LisTEd PUbLic cOmPANiEs13 DART MINING NL ABN: 84 119 904 880
AND CONTROLLED ENTITIES
ADDITIONAL INFORMATION FOR LISTED PUBLIC COMPANIES
f.
The following unlisted options are on issue and remain outstanding at the date of this report
— 8,350,000 options exercisable on or before 31 December 2013 at an exercise price of 15 cents;
— 100,000 options exercisable on or before 20 March 2017 at an exercise price of 18 cents;
— 100,000 options exercisable on or before 20 March 2017 at an exercise price of 22 cents;
— 3,000,000 options exercisable on or before 31 December 2015 at an exercise price of 15 cents;
— 3,000,000 options exercisable on or before 31 December 2016 at an exercise price of 15 cents; and
— 4,273,048 options exercisable on or before 7 May 2016 at an exercise price of 11.1 cents.
— 1,000,000 options exercisable on or before 30 August 2016 at an exercise price of 11.1 cents.
2.
3.
4. Registers of securities are held at the following addresses
Link Administration Services Pty Ltd
Level 12, 680 George Street, Sydney NSW 2000
5. Stock Exchange Listing
6. Other Disclosures
Options on issue
Quotation has been granted for all the ordinary shares of the company on all Member Exchanges of the
Australian Securities Exchange Limited.
The name of the company secretary is Andrew Draffin.
The address of the principal registered office in Australia is Level 2, 395 Collins Street, Melbourne VIC 3000.
Telephone (03) 9621 1299.
45
For
per
sona
l use
onl
y

63
NotesF
or p
erso
nal u
se o
nly

64
NotesF
or p
erso
nal u
se o
nly

Easy Access to InformationSee our website at www.dartmining.com.au for regular ASX announcements, quarterly reports and financial reports. Additionally, shareholders or interested parties can register to receive emailed updates shortly after the Company makes any general or significant announcements.
Corporate Directory
PRODUCED BY MRGRAPHICS.COM.AU
Competent Person’s StatementInformation in this report that relates to a statement of Exploration Results and Mineral Resources of the Company is based on information compiled by Dean Turnbull B.App.Sc.(Geol) Hons. M. AIG. Mr Turnbull is a Director and full time employee of Dart Mining NL and has sufficient experience relevant to the style of mineralisation and type of deposits under consideration and to the activity he has undertaken to qualify as a competent person as defined in the 2004 Edition of the “Australasian Code for Reporting of Mineral Resources and Ore Reserves” (or “JORC Code”). Mr Turnbull has provided written consent to the inclusion in the report of the matters based on his information in the form and context in which it appears.
Dart Mining NLABN – 84 119 904 880
Board of DirectorsC J Bain, L Ward, R G Udovenya, S G Poke, D G Turnbull
Managing Director L Ward
Registered OfficeLevel 2, 395 Collins Street Melbourne VIC 3000
LawyersResourcesLaw International, Melbourne
AuditorsMSI Ragg Weir, Hawthorn
BankersBendigo BankANZ Bank
Stock Exchange ListingThe company’s shares are listed on Australian Securities Exchange Limited. ASX Code: DTM
Share RegistryLink Market Services, Melbourne
For
per
sona
l use
onl
y

Dart Mining NLLevel 2, 395 Collins Street Melbourne VIC 3000Telephone: +61 3 9621 1299Facsimile: +61 3 9620 0070Email: [email protected]: www.dartmining.com.auF
or p
erso
nal u
se o
nly