danske bank: meeting the new age · danske bank: meeting the new age ... global head of wealth...
TRANSCRIPT

Danske Bank: Meeting the new age
1 June 2016
Tonny Thierry AndersenExecutive Board memberGlobal Head of Wealth Management

Expenses (DKK bn)Net profit* (DKK bn)
*Before goodwill impairments ** Restated to reflect new business unit structure
Loan loss ratio (bps)
The steady improvement in financial results continues
- Driven by a strong cost focus and improvements in credit quality
4.9
Q116
7.1
20142013
13.0
17.7
2015 Q116
5.3
2015
23.2
21.8
2014
24.0
22.6
2013
23.8
ReportedRestated**-3
0
20
27
20142013 Q1162015

Danske Bank is closing the gap to peers
- And well on track to meet ROE target of above 12.5% in 2018*
13.213.8
12.712.8 13.1
5.0
3.6
20132012 Q1 2016
11.7***
2015
11.6**
2014
8.6**
Danske BankPeer average1)Return on equity (%)
1) Includes Nordea, SEB, Handelsbanken, Swedbank and DNB *At the latest **Before goodwill impairments charges **SEB figure excludes goodwill impairment and other one-off items Note: Figures are reported return on equity

Strong capital build up despite capital distributions
- CET1 at 15.0% after deducting for share buy-back of DKK 9bn
CET1 capital ratios and targets (%)
2.8
Q1 2016
15.0
2015
16.1
2014 Q1 2016 fully loaded
14.7
11.9
15.1
2013
14.7
Expected requirement
in 2019: 11.9%*
CET1 target
At least13%
Regulatory min. CET1 required*Excess capital
* Expected fully phased-in minimum CET1 requirement in 2019: min. CET1 requirement 4.5%, capital conservation buffer 2.5%, SIFI requirement 3%, countercyclical buffers 0.5% and CET1 component of Pillar II requirement.

Total payout ratio1
; %
Significant increase in payouts based on increased dividends and
share buy-backs
1. Based on year-end communicated distributions
2015
96%
46%
51%
2014
81%
43%
38%
2013
28%
2008 - 2012
0%
Dividend payout ratioShare buyback

Outlook for full-year 2016
1. Before goodwill impairment charge. Note: This guidance is subject to uncertainty and depends on economic conditions, including developments in monetary policy at central banks
Impairments
Expected at a low level
Expenses
Expected below the 2015 level1
Net profit
Expected in line with 2015 level1

Introducing Wealth Management

Wealth Management’s contribution to Group financials
Q1 2016 figures
Income & net fee income (share of group)*
4%
Lending & deposits (share of group)*
17%
46%
7%
Other Danske BankWealth Management
Facts
1,992 FTEs work in Wealth
~1.351bn DKK in AuM
Pre-tax return on equity at 25,6%
~95% of income in the Nordic countries

* Amongst wealthy personal customers
3
3
0 1
5
6
7
8
2 4 5 6 7 8 9
4
10 11 122
DenmarkFinland
Sweden
Norway
Austria
Germany
Portugal
Ireland
Italy
SpainUnited Kingdom
Belgium
France Switzerland Luxembourg
Netherlands
Yearly average growth in Wealth 2014-2020*, (%)
Yearly average growth in Wealth, %, 2008-2014*
Wealth Management is an attractive market

* Amongst wealthy personal customers
Aggregated
wealth*
Bn DKK
Market
share
2,9001,900 1,500 1,350
~3%~14%
~27%
~5%
And we see growth potential

In order to execute our vision we have identified four key enablers
Leading
Value Propositions
& Customer Experiences
1
23
Go-to-Market
Excellence
4
Winning People
& Culture
Operational
Excellence

Key focus: Digitalisation

12
2005 20202000 20152010 2025
Traditional consumers Digital nativesTransitionals
Within a few years a new breed of customer will dominate
— the ”digital natives”
13
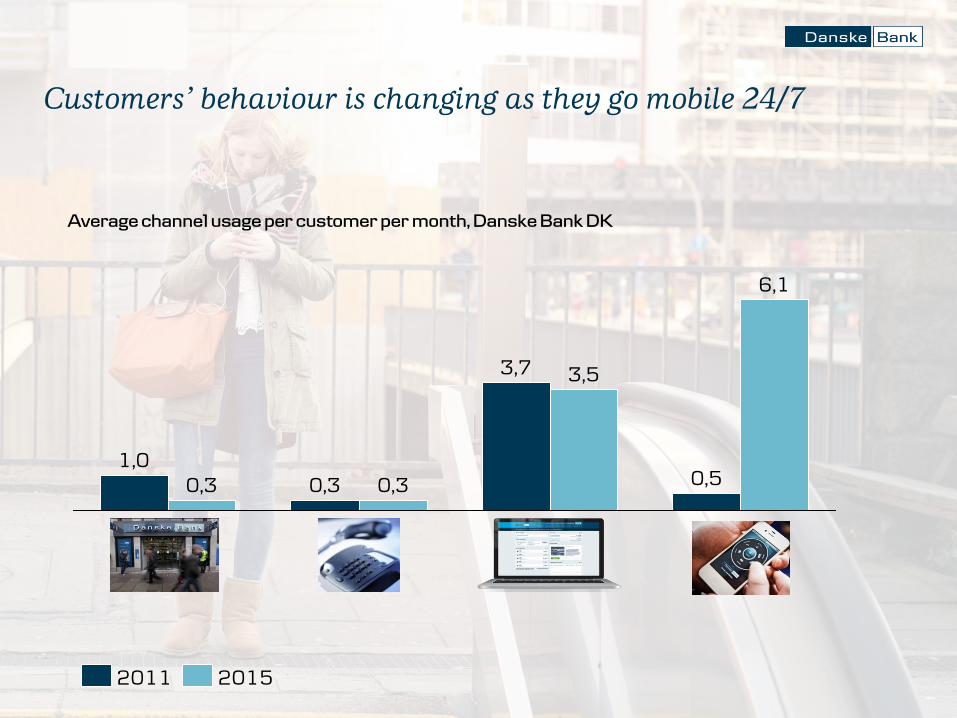
6,1
0,5
3,53,7
0,30,30,31,0
20152011
Average channel usage per customer per month, Danske Bank DK
Customers’ behaviour is changing as they go mobile 24/7

14
3,000
2,400
1,800
1,200
600
0
3,600
2006 2016
Active users; ’000
Onlinebank
Mobilbank
MobilePay
MobilePay is an example of exponential growth

15
March2016
May ’13
Jan ‘15 May ‘16
P2P
MobilePayOnline
June ‘15
POS with Dansk
Supermarked
MobilePayterminals
June ‘15
Receipts
The MobilePay family has gradually been expanded to build a
multisided platform
Invoice

16
“You don’t need a digital
strategy to succeed in this
World, you need a business
strategy for the digital age”

17
Project
X
Don’t be afraid to disrupt yourself

Everything that can be
digitized, will be
digitized, but...

Q&A session
www.danskebank.com/ir

Disclaimer
This presentation does not constitute or form part of and should not be construed as, an offer to sell or issue or the solicitation of an offer to buy or acquire securities of Danske Bank A/S in any jurisdiction or an inducement to enter into investment activity. No part of this presentation, nor the fact of its distribution, should form the basis of, or be relied on in connection with, any contract or commitment or investment decision whatsoever
This presentation contains forward-looking statements that reflect management’s current views with respect to certain future events and potential financial performance. Although Danske Bank believes that the expectations reflected in such forward looking statements are reasonable, no assurance can be given that such expectations will prove to have been correct. Accordingly, results could differ materially from those set out in the forward-looking statements as a result of various factorsmany of which are beyond Danske Bank’s control
This presentation does not imply that Danske Bank has undertaken to revise these forward-looking statements, beyond what is required by applicable law or applicable stock exchange regulations if and when circumstances arise that will lead to changescompared to the date when these statements were provided
Equity Story