dan - wfp remote access secure...
TRANSCRIPT

◙DAN
.:: emergency needs assessment branch
SSttrreennggtthheenniinngg EEmmeerrggeennccyy NNeeeeddss AAsssseessssmmeenntt CCaappaacciittyy ((SSEENNAACC))
GGuuaatteemmaallaa::
MMaarrkkeett PPrrooffiillee ffoorr EEmmeerrggeennccyy FFoooodd SSeeccuurriittyy
AAsssseessssmmeennttss
DDeecceemmbbeerr 22000055

2

3
Guatemala: Market Profile for Emergency Food Security Assessments
Prepared by: Mario Zappacosta, Global Information and Early Warning Service, Commodities and Trade Division, Food and Agriculture Organization of the United Nations (FAO) December 2005 © World Food Programme, Emergency Needs Assessment Branch (ODAN) This market profile was prepared under the umbrella of the “Strengthening Emergency Needs Assessment Capacity” (SENAC) project. The SENAC project aims to reinforce WFP’s capacity to assess humanitarian needs in the food sector during emergencies and the immediate aftermath through accurate and impartial needs assessments. The Guatemala market profile is one of the eleven pilot exercises undertaken in 2005 which will serve to develop a standard template for WFP’s future market information for Emergency Food Security Assessments. For any queries on this document or the SENAC Project, please contact: [email protected]
United Nations World Food Programme Headquarters: Via C.G. Viola 68, Parco de’ Medici, 00148, Rome, Italy This document has been produced with the financial assistance of the European Union. The views expressed herein can in no way be taken to reflect the official opinion of the European Union.

4

5
Guatemala: Market Profile for Emergency Food Security Assessments _________________________________________________ December 2005

6
Table of Contents
Executive Summary ............................................................................................................ 7 Introduction......................................................................................................................... 9 The economic situation and the agricultural sector .......................................................... 10 Food consumption and the principal vulnerable groups ................................................... 11 National production of basic grains: total amount, main seasons and geographic location........................................................................................................................................... 13 Trade ................................................................................................................................. 14 Food aid ............................................................................................................................ 15 Regions and Main Food Markets...................................................................................... 15 Market structure for the main staple food: maize, beans and rice .................................... 17 National storage capacity.................................................................................................. 22 Food price developments .................................................................................................. 22 Transport infrastructures................................................................................................... 24 Market information and communication systems............................................................. 25 Trade regulations .............................................................................................................. 26 Main indicators and information sources.......................................................................... 27 References......................................................................................................................... 30

7
Executive Summary Guatemala is the largest and most populous of the Central American countries, with about 57 percent of the population living in poverty and 22 percent in extreme poverty. Indigenous groups represent more than 80 percent of rural people. Despite its declining importance, agriculture still plays a key role in the Guatemalan economy, accounting for almost one fourth of Gross Domestic Product, employing approximately two thirds of the economically active population and producing over half the country’s total export earnings. The major crops are maize and beans for domestic consumption and coffee, sugar and bananas for export. Guatemala has a total area of 10.8 million hectares, of which only 20 percent is arable land with permanent crops; the rest is forest or permanent pasture land in mountain areas. Land tenure is a critical problem because most people, especially members of indigenous groups, lack property rights and land ownership is very unevenly distributed. Approximately 70 percent of the total agricultural area is devoted to basic grains, in particular to maize and bean crops. The key departments that produce basic grains are Petén, Alta Verapaz and Jutiapa. Despite an ongoing process of crop diversification with the introduction of new export products, such as cardamom and sesame, most piedmont “bocacosta” areas are still largely characterized by coffee plantations. Cash crops such as sugarcane, bananas, plantains and African palm are essentially cultivated on the Pacific coast. Guatemala has the third highest level of chronic malnutrition in the world. Most food insecure and vulnerable villages are concentrated in western and north western departments, where the local population is almost entirely indigenous and infant malnutrition is very pronounced. These areas are characterized by subsistence farming on steep hillsides, high levels of poverty, limited access to land and high deforestation rates. Almost every year, insufficient local agricultural production forces these people to migrate seasonally to neighbouring coffee and sugarcane plantations or to engage in petty trade activities with Mexico. Other highly food insecure areas are located in the eastern departments, along the “drought corridor” that runs between the Motagua River and the border with El Salvador and Honduras. Food markets are present in all departments and their importance is directly correlated to the size of local population and to the quality of road access. The main food markets are concentrated along the Inter American Highway that goes from Jutiapa in the East to Guatemala City and Chimaltenango in the centre to Quetzaltenango, Totonicapán and Huehuetenango in the west. Other important markets are Esquintla and Retalhuleu in the southern piedmont region, Flores and Cobán in the north, and San Marcos in the western highlands. The northern departments of Petén and Alta Vera Paz, the eastern departments of Jalapa and Jutiapa and all Pacific coastal departments usually generate a surplus of basic grains

8
that is sold in traditionally deficit areas such as the capital city and the departments of San Marcos, Totonicapán, Huehuetenango, Quetzaltenango and Sololá in the western highlands and the southern piedmont regions. Marketing channels from production to final consumption involve several stakeholders such as assemblers, transporters, intermediaries, traders, wholesalers, retailers and the food processing industry. Average monthly farm-gate prices of white maize show a pronounced seasonality due to the fact that farmers usually sell the bulk of their production surplus during the few months following the harvest. On the contrary, prices of black beans have a lower seasonality because of their more evenly distributed production throughout the year as a consequence of three (instead of only two in the case of maize) growing seasons. Market information flows quite smoothly among the major stakeholders participating in the food chain. In particular, intermediaries and transporters seem to play a crucial role in the continuous process of information transfer between farmers in food producing areas and wholesalers and retailers that operate in urban areas. Market information becomes more scarce and difficult to obtain in the case of farmers and markets in remote areas with limited road access. The rapid reaction of markets to the crisis induced by the passage of tropical storm “Stan” at the beginning of October 2005 is an interesting example of how different stakeholders obtain market information and use it to define their strategies. The most important institutions to be consulted to obtain information for monitoring and analysing the functioning of food markets in Guatemala are the Unit of Policy and Strategic Information of the Ministry of Agriculture, through its Infoagro service; the Inter-institutional Food Security and Nutrition Information Group (GIISAN) (an active network on food security issues that embraces public sector ministries and institutes, bi-lateral and multi-lateral international agencies, universities, NGOs and special projects such as MFEWS); and the National Institute of Statistics (INE).

9
Introduction The purpose of this study is to develop a market profile for Guatemala with an aim to strengthening food security assessment capacity in the country. The study is part of an on-going programme of work under the markets-related theme of the Strengthening Emergency Needs Assessment Capacity (SENAC) project conducted by the World Food Programme. The profile describes the structure and functioning of domestic food markets, with emphasis on principal components of the national diet, namely maize, beans and rice. The profile is based on both a desk review of relevant literature and data and on the main findings of the country visit. During the country visit (from October 19 to 29, 2005), the following food markets have been visited: Guatemala City, Esquintla, Jutiapa, El Progreso, Quetzaltenango, Nueva Concepción, San Marcos and San Pedro. Interviews with market agents, such as producers, traders, processors, wholesalers, retailers and transporters, as well as national and international institutions involved in food marketing and food aid delivery have been crucial for collecting important first-hand information. After an overview of the Guatemalan economic situation and agricultural sector, the study analyses the national food consumption, the location of the most food insecure groups, the local production of basic grains, and the flows of trade and food aid. Drawing essentially on the information collected during the field work, the following sections provide a detailed description of structure of maize, beans and rice markets, the role of national marketing institutions and the analysis of price seasonality and integration. The analysis of food markets functioning is completed by providing information on transport infrastructures, the local information and communication system and the trade regulations. Finally, a list is provided of the main indicators (along with the analytical approach and principal sources of information) that should be monitored in order to analyse the impact of a food emergency on Guatemalan markets.

10
The economic situation and the agricultural sector Guatemala is the largest and most populous of Central American countries, with a total population close to 12 million. Almost 55 percent of the population resides in rural areas, of which more than 80 percent are indigenous people. In 2003, Guatemala was ranked 117th out of 177 countries in the United Nations Human Development Index, behind all the others Latin American countries except Haiti. This unsatisfactory result is due to the fact that, although per capita income is relatively high compared to other Central American countries (but with a very high degree of income inequality), several Guatemalan indicators, such as malnutrition, life expectancy, infant and maternal mortality, public spending on social services, access to health facilities and illiteracy rates, are the worst in Latin America. According to the latest survey carried out by the Government, it is estimated that about 57 percent of the population is living in poverty and 22 percent in extreme poverty. Three-quarters of the rural population are poor and poverty is highly correlated with geographical isolation and ethnic exclusion. Rural poverty is mainly concentrated in the western highlands and in the departments of Alta and Baja Verapaz. In Quiché and Huehuetenango, for example, the poverty rate reaches almost 80 percent and the extreme poverty rate is 37 percent. Since 1999, growth rates of Gross Domestic Product (GDP) per capita have declined and remained low, falling below the population growth rate during 2001-2003, with negative repercussions on the most vulnerable groups. The deceleration of the economy in the period 2001-2003 was due to the unfavorable domestic environment for investments and to the negative effect on terms of trade as a consequence of the collapse in the world price of coffee. From 1999 to 2002, export revenues from coffee registered almost a 50 percent reduction. In addition, the recession in the United States, the main trading partner, negatively affected the demand for Guatemalan exports, in particular for the offshore assembly for re-export “maquila” sector. In 2004, the overall outlook for economic growth improved and the GDP growth rate reversed its declining trend, reaching 2.7 percent. Due to the recent implementation of national anti-corruption measures and a favorable international context, the prospects for 2005 and 2006 are also positive, with a GDP growth forecast of 3.2 percent. Despite its declining importance, agriculture still plays a key role in the Guatemalan economy. It accounts for almost one fourth of GDP, employs approximately two thirds of the economically active population and produces over half of the country’s total export earnings. The major crops are maize and beans for domestic consumption and coffee, sugar and bananas for export. Guatemala has a total area of 10.8 million hectares (ha), with only 20 percent of arable land and permanent crops and the rest being forests and permanent pastures in mountain (volcanic) areas. The climate is tropical; hot and humid in the lowlands and cool in the highlands. In general, there are two growing seasons per year linked to the rainfall pattern:

11
planting of the first ‘de primera’ season goes from April to May with harvesting from August to September, while planting of the second ‘de postrera’ season goes from August to November and harvesting from November to March. In the highlands, where temperatures are lower, there is only one season (from February/March to November/December), especially in the case of maize which is essentially grown for self-consumption. Land tenure is a critical problem in Guatemala. Approximately 40 percent of the economically active rural population, especially within indigenous groups, does not own land. In addition, land is very unevenly distributed: about 90 percent of the farms (with an average size of 1.5 ha) occupy only 16 percent of the agricultural land, while only 2.5 percent of them (with an average size of 200 ha) control nearly 65 percent of the land. The use of irrigation is very limited (approximately 130 000 ha) and is concentrated in the most fertile valleys, especially on the South Coast, for the production of cash and export crops such as vegetables and sugarcane. Approximately 70 percent of total agricultural area is devoted to basic grains, in particular to maize and beans. The bulk of commercial production of basic grains takes place in the municipalities of La Libertad, San Luis and Sayaxché in the south of the Petén Department, where yields are well above the national average. Coffee plantations still characterize piedmont ‘bocacosta’ areas, where a process of production diversification is underway with the introduction of new export crops such as cardamom and sesame. The main crops grown in the Pacific coastal areas are sugarcane, bananas, plantains and African palm. They represent an important source of seasonal employment for people coming from neighboring departments, especially from the highlands. It is estimated that sugarcane plantations generate more than 200 000 jobs during the harvest period from November to April. Communities in the western and north-western highlands, mostly formed by indigenous people, produce basic grains for their own consumption and sell their labor to coffee plantations in Mexico and El Salvador and to sugarcane plantation on the coast.
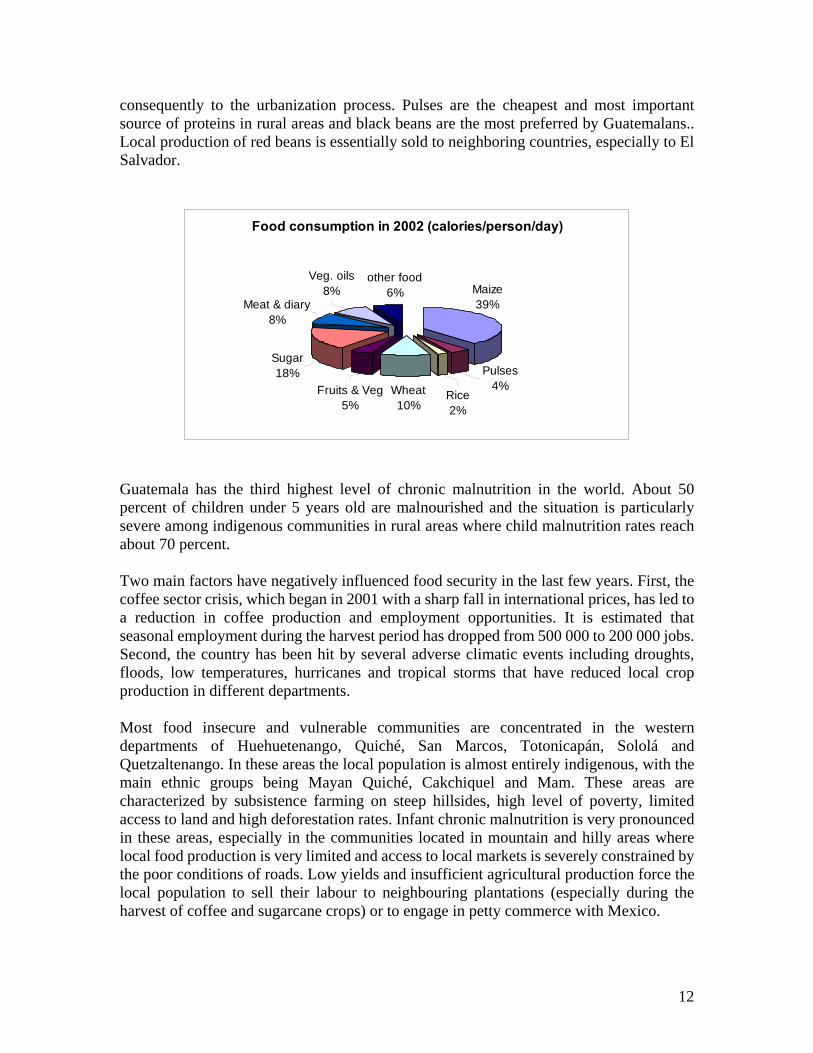
Food consumption and the principal vulnerable groups Basic grains such as maize, wheat, rice and pulses are the main source of calories for the majority of Guatemalans, representing more than 55 percent of total daily intake. Maize is the main component of the diet and the main source of carbohydrates and proteins, with an average annual consumption of about 91 kg per capita. Human consumption represents the major market for white maize production. Locally-produced yellow maize is also used for human consumption, while imported yellow maize is essentially used to prepare poultry and other animal feeds. Consumption of wheat and wheat products, such as bread and pasta, is second in importance with an average annual value of 32 kg per capita. However, in urban areas wheat product consumption is estimated to be more than double that in rural households. National wheat production is marginal and has low baking quality, consequently wheat consumption relies entirely on imports. Rice is the third component of the local diet and its average consumption is only 5 kg per year and per capita, the lowest among Central American countries. As in the case of wheat, rice consumption levels are highly correlated to income, the higher the income the greater the consumption, and
12
consequently to the urbanization process. Pulses are the cheapest and most important source of proteins in rural areas and black beans are the most preferred by Guatemalans.. Local production of red beans is essentially sold to neighboring countries, especially to El Salvador.
Food consumption in 2002 (calories/person/day)
Maize39%
Veg. oils8%
other food6%
Meat & diary8%
Rice2%
Sugar18%
Fruits & Veg5%
Wheat10%
Pulses4%
Guatemala has the third highest level of chronic malnutrition in the world. About 50 percent of children under 5 years old are malnourished and the situation is particularly severe among indigenous communities in rural areas where child malnutrition rates reach about 70 percent. Two main factors have negatively influenced food security in the last few years. First, the coffee sector crisis, which began in 2001 with a sharp fall in international prices, has led to a reduction in coffee production and employment opportunities. It is estimated that seasonal employment during the harvest period has dropped from 500 000 to 200 000 jobs. Second, the country has been hit by several adverse climatic events including droughts, floods, low temperatures, hurricanes and tropical storms that have reduced local crop production in different departments. Most food insecure and vulnerable communities are concentrated in the western departments of Huehuetenango, Quiché, San Marcos, Totonicapán, Sololá and Quetzaltenango. In these areas the local population is almost entirely indigenous, with the main ethnic groups being Mayan Quiché, Cakchiquel and Mam. These areas are characterized by subsistence farming on steep hillsides, high level of poverty, limited access to land and high deforestation rates. Infant chronic malnutrition is very pronounced in these areas, especially in the communities located in mountain and hilly areas where local food production is very limited and access to local markets is severely constrained by the poor conditions of roads. Low yields and insufficient agricultural production force the local population to sell their labour to neighbouring plantations (especially during the harvest of coffee and sugarcane crops) or to engage in petty commerce with Mexico.

13
Other highly food insecure areas are in the eastern region of the country. The whole department of Jalapa, the north of Chiquimula and the south of Zacapa are located in the “drought corridor” that runs between the Motagua River and the border with El Salvador and Honduras. These areas are characterized by frequent dry spells and irregular rains that seriously affect local crop production.
National production of basic grains: total amount, main seasons and geographic location Maize is the most important annual crop and is mainly grown in pure stands, with 25-30 percent grown in association with other crops, such as beans, sorghum, sesame or pumpkins. As reported by the 2003 Agricultural National Census, in marketing year 2002-2003, national production was slightly above one million metric tonnes (mt) with a planted area of about 650 000 ha. About 85 percent of production is white maize, followed by 14 percent of yellow maize and the rest being other colored varieties (red, black) plus sweet and feed maize. Maize is mainly rain-fed, with two growing seasons which follow the precipitation pattern: planting of the first ‘de primera’ season goes from May to June, with the arrival of first rains, to harvesting in September to November, while the second ‘de postrera’ season planting goes from October to November with harvesting from January to April. However, in the central and western highlands, where the use of local varieties is very common, there is usually only one season per year, with plantings in February to March and harvesting in October toNovember. About 60-65 percent of the national maize production takes place during the first season, with the bulk of the harvest being commercialized in October. Farmers cultivating less than 10 ha produce about 50 percent of national production and sell about half of their production to the market. More than two thirds of maize production is concentrated in the tropical lowlands (up to 1 400 msl) and the rest is grown on the highlands (from 1 500 to 3 000 msl). In particular, key producing departments for white maize are the Petén (21 percent), Alta Verapaz (10 percent ), Jutiapa (8 percent ), Quiché (6 percent) and Retalhuleu (6 percent ). On the contrary, more than 60 percent of yellow maize production, which is essentially used for self-consumption, is produced in the highlands of the western and north-western departments of Quiché, Huehuetenango, Alta Verapaz, San Marco and Quetzaltenango. Guatemala is the only country in Central America where wheat crop production had some importance in the past. Until the mid-1980s, annual production averaged 50 000 mt on about 30 000 ha. Since then, production and planted area have steadily decreased and the wheat crop has been gradually substituted with more profitable crops such as vegetables. From 2000 to 2004, wheat production reached its minimum levels with about 10 000 mt on less than 5 000 ha. In the marketing years 2003-2004 and 2004-2005, national paddy production averaged 35 000 MT. The main producing departments are Izabal, Alta Verapaz, Jutiapa, San Marcos and Petén, which represent more than 70 percent of total output. Rice is cultivated as a

14
monoculture crop in tropical humid and very humid areas; the majority is obtained during the main rain-fed main season, with planting in April to May and harvesting in September to November. A smaller second season crop is essentially irrigated and its season goes from November to April. National production of beans in the marketing year 2002-2003 was about 95 000 MT. About 80 percent of national production is represented by black bean varieties; the rest are red beans. Production is obtained during two growing seasons: the first season represents about 35 percent of annual production and goes from April to September; the second season with about 65 percent of production goes from August to January. About 60 percent of bean crop is cultivated in pure stand, while the rest is associated with maize or sorghum. Key producing departments are Petén in the north (27 percent of national production) and the eastern departments of Jutiapa, Chiquimula y Santa Rosa (36 percent of national production).
Trade The overall effects of declining national cereal production, the boom of the poultry sector and demographic growth has been an increasing dependence on imports of cereals to partially meet the country’s food needs. Total imports of cereals (maize, wheat and rice) have increased from an average amount of 330 000 mt at the beginning of the 1990s to more than one million mt in the last two years. In the 2003-2004 marketing year, Guatemala imported 532 000 mt of maize, 427 000 mt of wheat and 57 000 mt of paddy. Yellow maize represents the bulk of maize imports, while in the last ten years white maize imports have been on average only 18 000 mt per year, with a peak of 62 000 mt in 2001-2002. Imported cereals mainly originate from the United States and only a marginal amount come from neighbouring Central American countries such as Mexico, El Salvador and Nicaragua. Yellow and white maize, wheat and rice are directly imported by the private sector, namely the feed concentrate and maize flour industries, the baking sector and the rice millers. Commercial imports of beans are relatively insignificant. From 2000 to 2003, they ranged from 5 000 mt to 8 000 mt. However, a growing amount of imports is attributed to the agro-food industry which buys low-quality broken beans from the United States and Mexico to prepare canned products. Un-registered cross-border trade takes place with all neighbouring countries. Depending on the season and on local food availability, a certain amount of basic grain is informally traded with Mexico, El Salvador, Honduras and Costa Rica. A common situation is that transporters from these countries buy Guatemalan agricultural products, such as maize, beans, watermelons, pineapples and cattle, and then cross the border through some “blind spots” where there is no formal customs control. An official estimate of un-registered trade flows is not available, but it is widely believed to be quite substantial.

15
Food aid Food aid donations decreased significantly during the 1995-1997 years from the levels of the early 1990s, and increased again after 1998 due principally to emergencies resulting from Hurricane Mitch and a subsequent drought. The bulk of food aid is composed of yellow maize, wheat, rice and beans. The total of these donations since 1990, including commodities donated for Hurricane Mitch and drought emergencies, have been approximately 8 percent of the combined national production of maize, sorghum, rice, wheat and beans. The United States government is the main supplier through Public Law 480 Title I and Title II programs, providing approximately 92 percent of all food donations to Guatemala since 1990. Black and red beans, corn/soy blend, rice and vegetable oils are usually distributed directly to beneficiaries in low-income areas, while yellow maize, wheat and soybean meal and oil are locally sold as part of the monetization program. This program seeks to avoid disrupting local marketing systems and the financial resources generated are then used to fund development project. However, it is reported that monopolies that partially control wheat and yellow maize markets in Guatemala have often hampered negotiations and lowered prices. In fact, the prices achieved from monetizing commodities have frequently been below the prices of the local market.
Regions and Main Food Markets Food markets are present in all departments and their importance is directly correlated to the size of the local population and to the quality of road access. The main markets are concentrated along the Inter American Highway that goes from Jutiapa in the east to Guatemala City and Chimaltenango in the centre up to Quetzaltenango, Totonicapán and Huehuetenango in the west. Other important food markets are Esquintla and Retalhuleu in the southern piedmont region, Flores and Cobán in the north, and San Marcos in the western highlands.
Regions Main food markets North Flores, Sayaxche, Cobán Western highlands Quetzaltenango, Huehuetenango, San Marcos, San Pedro,
Santa Cruz del Quiché Central highlands Totonicapán, Sololá, Chimaltenango Metropolitan Guatemala City East Jutiapa, Chiquimula, El Progreso, Jalapa, Puerto Barrios,
Zacapa Southern coast Esquintla, Retalhuleu, Mazatenango, Ciudad Tecún Umán,
Quilapa The northern region includes the departments of Petén and Alta Verapaz. In the southern lowlands of Petén, agriculture is the main activity with production of basic grains (with very high yields) and cattle for export. On the contrary, northern Petén and Alta Verapaz

16
are characterized by subsistence farming with soils with forestry vocation and low population density. In general, isolation and lack of infrastructure have prevented the growth of an export-oriented agriculture. The western and central highlands are characterized by small-scale (minifundios) farms producing subsistence maize and beans crops as well as some market-oriented producers of vegetables and coffee. Farm size is progressively shrinking over time due to demographic growth; this phenomenon induces the adoption of alternative livelihood strategies such as seasonal or long-term migration. Migrants usually move toward banana and sugarcane plantations on the southern coast or to Chiapas (Mexico) to harvest coffee.
Flores
Sayaxché
Cobán
Puerto Barrios
Jalapa
Jutiapa
Chiquimula
Quilapa
San Marcos
RetalhuleuMazatenango
Sololá
Guatemala City
Chimaltenango
MEXICO
BELIZE
HONDURAS
EL SALVADOR
PETÉN
IZABAL
CHIQUIMULAJALAPA
HUEHUETENANGO
ESQUINTLA SANTA ROSA
SAN MARCOS
SUCHITEPEQUEZ
SOLOLÁ
RETALHULEU
El Progreso
Esquintla JUTIAPA
EL PROGRESO
GUATEMALA
BAJA VERAPAZ
Santa Cruz del Quiché
Huehuetenango
Totonicapán
Quetzaltenango
ZACAPAZacapa
Salamá
ALTA VERAPAZ
QUICHÉ
Puerto Quetzal
Main Markets of Basic Grains by Region
The Metropolitan region is highly dependent on the economic activities of the capital city and its surroundings. The main sources of income are the ‘maquila’ textile industries and the production of cash crops such as vegetables and flowers. The country’s largest food markets are located in the capital city and include the old market “La Terminal” and the recently built “Central Wholesale Market” (Central de Mayoreo or CENMA). The east is characterized by a mixture of subsistence small-scale farms and large-scale plantations. The main market-oriented crops are melons, watermelons, banana, plantain and coffee; these crops represent an important source of seasonal and permanent

17
employment. The region is traversed by an important road that links the capital city with the Atlantic coast and justifies the nearby establishment of several food industries, breweries and hotels. The southern coast is dominated by large-scale export oriented farms, mostly dedicated to sugar production. During the harvest season from November to April, the sugar industry employs about 200 000 people, who come from almost all parts of the country. Other crops that also offer some seasonal job opportunities are African palm, banana and plantain plantations and, to a lesser extent, basic grains and fruits.
Market structure for the main staple food: maize, beans and rice When comparing maize production with apparent consumption at local level, the northern departments of Petén and Alta Vera Paz, the eastern departments of Jalapa and Jutiapa and all Pacific coastal departments generate some surplus. An average amount of 370 000 mt per year of white maize is sold outside the area of production. Traditional deficit areas are the capital city and departments of San Marcos, Totonicapán, Huehuetenango, Quetzaltenango and Sololá in the western highlands and the piedmont ‘bocacosta’ regions. It is estimated that the annual maize deficit is about 95 000 mt per year in the capital city and about 100 000 mt per year in the western highlands. A surplus of beans is generated in the department of Petén and in the eastern part of the country, i.e. the departments of Chiquimula, Jalapa, Jutiapa and in the north of Santa Rosa.

18
Flores
Sayaxché
Cobán
Puerto Barrios
Jalapa
Jutiapa
Chiquimula
Quilapa
San Marcos
RetalhuleuMazatenango
Sololá
Guatemala City
Chimaltenango
MEXICO
BELIZE
HONDURAS
EL SALVADOR
PETÉN
IZABAL
CHIQUIMULAJALAPA
HUEHUETENANGO
ESQUINTLA SANTA ROSA
SAN MARCOS
SUCHITEPEQUEZ
SOLOLÁ
RETALHULEU
El Progreso
Caribbean Sea
Esquintla JUTIAPA
EL PROGRESO
GUATEMALA
BAJA VERAPAZ
Santa Cruz del Quiché
Huehuetenango
Totonicapán
Quetzaltenango
ZACAPAZacapa
Domestic flowsExports
Imports
Domestic flowsExports
Imports
Salamá
ALTA VERAPAZ
QUICHÉ
Puerto Quetzal
National Food Distribution of Basic Grains
Apart from some differences in the geographical location of surplus areas, the structure and functioning of the maize and beans markets are quite similar. In fact, the majority of stakeholders, from farmers to retailers, buys and sells both products using the same marketing channels. On the contrary, the structure of the rice market is quite different from other basic grains and will be analyzed separately. In the main maize and bean-producing departments of Petén and Alta Vera Paz in the north, in Pacific coastal regions in the south and in eastern departments, producers save part of their production for self-consumption and sell the rest at farm-gate to local intermediaries that visit farms at harvesting time. Usually these intermediaries manage small quantities of production and are involved in trading maize and beans only for a couple of months per year. Especially in the Petén, farmers sell the bulk of their maize and beans production to local community assemblers that usually are local farmers with small trucks and are able to transport the product to wholesalers in nearby urban centers and to the capital city. When assemblers lack their own transportation means, they sell the product to larger regional intermediaries that are responsible for the transfer to urban wholesalers in the capital city. At the same time, surplus areas are periodically visited by regional intermediaries and transporters coming from deficit areas or from neighboring countries, such as El Salvador and Costa Rica. These intermediaries manage larger quantities than local transporters and buy local production either directly from farmers at farm-gate (especially in more remote

19
areas with difficult access to markets) or from local assemblers. The department of Guatemala, which includes the capital city, is the main deficit area of the country, with the highest demand for basic grains. In Guatemala City, wholesalers of maize and beans are located in three main markets: the “21a calle”, the “Central de Mayoreo” and the market “La Terminal”. They essentially buy maize and beans from northern, southern (mainly white maize) and eastern (mainly black beans) producing areas and sell them to the agro-food industry, local retailers and supermarkets as well as to national intermediaries and transporters that transfer them to wholesalers and retailers in small urban centers in deficit areas or abroad where, depending on the level of local supply, attractive price differentials may arise. Large urban assemblers and wholesalers, in particular those located in the capital city, have the capacity to speculate on the commodity market and take advantage of maize production seasonality, buying products at harvest when supply is high and prices are low, storing them for a few months and selling them when retail prices are more attractive. National production of yellow maize is very limited (only 180 000 mt in 2003) and, in the last three years, the feed industry imported on average about 530 000 mt per year. Commercial maize imports are regulated by an agreement among white maize producers (organized in the National Coordinating Committee of Basic Grains Producers – CONAGRAB - which represents some 3 200 small-scale producers), the agro-food industry (essentially the feed poultry sector) and the Ministry of Economy. In this framework, the industrial sector agrees to buy domestically-produced yellow maize in order to be granted preferential import tariffs (5 percent within the quota compared to 35 percent outside the quota) on a quota that is established every year on estimated requirements. The quota has no restrictions on timing for the imports, only that imported maize can not be sold as grain. As a consequence of this agreement, the purchase of local production of yellow maize by the feed industry increased substantially in the last years.

20
It is estimated that the national industry of white maize flour buys about 25 000 mt of national product (representing only 3 percent of total production) and imports almost an equivalent amount from the United States and Mexico. The beans processing industry produces about 10 000 mt of canned products and only 15 percent of its requirements are covered by the national production while the rest is imported from Mexico and the United States, mainly as low-quality broken beans. About one third of the industrial production is exported as refried beans to neighboring countries and to the United States (especially to supply expatriate communities from Central American countries). Regarding the rice market chain, a total of about 60 millers buy the whole local production to be processed. The majority of mills are located in the industrial surroundings of Guatemala City and in the department of Jutiapa, especially around the town of El Progreso. Millers have drying, milling and packaging facilities as well as laboratories to analyse paddy characteristics (humidity, purity, percentage of broken kernels, whiteness of polish, milling yields and presence of contaminants such as weed seeds). Sales take place in different ways: directly from farmers, through farmers associations that work as assemblers in rural areas or via intermediaries and transporters. Because local production only meets about 40 percent of national demand, millers need to import between 70 000 mt and 80 000 mt of paddy per year. With very little amounts coming from El Salvador, these imports almost entirely originate from the United States.
Production Surplus markets Deficit/capital city markets Deficit/peripheral markets
Consumers
Consumers Consumers
Intermediaries from deficit
markets & abroad (transporters)
Local intermediaries (assemblers)
Retailers
Retailers/ supermarkets
Marketing channels for maize and beans in Guatemala
Main channel
Minor channel
Small rural/urban wholesalers
Farmers
Farmers
Farmers
Farmers
Foreign markets/ consumers
Industry
Imports
Retailers/ supermarkets
Large urbanwholesalers
Small urban wholesalers
National transporters
Informal cross-border exports
Regional transporters

21
Milled rice is sold directly by millers to wholesalers, supermarkets and retailers in urban areas or to regional and national intermediaries that supply deficit and remote areas. Very limited amounts of processed rice are imported and exported to neighboring countries. An important stakeholder in the rice market chain is the Guatemalan Rice Association (in Spanish, Asociación Guatemalteca del Arroz, Arrozgua). Founded in 1997, Arrozgua includes rice producers and the largest millers of the country (which are, at the same time, paddy importers) and manages about 50 percent of national production. Associated producers own farms of medium (from 14 to 70 ha) to large size (up to 280 ha), while small farmers (with less than 14 ha) are represented by one cooperative and three Peasant Associative Business Firms (in Spanish, Empresas Asociativas Campesinas). The main goal of Arrozgua is to administer the tariff contingent. Every year, Arrozgua, the Ministry of Agriculture and the Chambers of Industry and Commerce establish the volume of paddy to be imported in order to cover the national deficit (in 2004 it was estimated at 69 000 mt) and fix a guaranteed price to be paid to national producers. The government grants tariff exemptions (the tariff applied goes from 0 to 2 percent, instead of 32 percent) on the imports of rice to millers in proportion to the acquired quantities of local production at the guaranteed price. In addition, millers agree to import only paddy (and not milled rice) and the imports within the tariff contingent are allowed only from January to the end of July in order to not interfere with national markets during the harvest. Unregistered cross-border imports of paddy and milled rice take place with all
Farmers
Assemblers/ farmers associations
Local intermediaries &
transporters
Millers
Consumers
Wholesalers
Retailers/ supermarkets
Marketing channels for rice in Guatemala
Main channel
Minor channel
Imports (paddy)
Exports (white rice)
Regional & national
intermediaries
Formal/informal imports

22
neighbouring countries. In particular, Arrogua estimates that every year about 12 000 mt of milled rice originating from the United States illegally enters Guatemala from Mexico, passing through some “blind spots” where there is no formal customs control.
National storage capacity The National Institute for Agricultural Marketing (INDECA), a governmental body that initially operated the price regulation mechanism, manages public silos and warehouses in about 40 sites in the country, representing a total storage capacity for basic grains of approximately 47 000 mt. Some small and medium farmers owns metal silos with a capacity between 800 and 2 500 kg and their overall storage capacity is estimated at 3 000 mt. The national agro-food industry that processes white maize into flour and tortillas has a storage capacity of about 46 000 mt and has its own services for drying, cleaning and treating the grains. Regarding the poultry industry that imports yellow maize, its storage capacity is estimated at about 85 000 mt. Silos and warehouses storing rice have a total capacity of about 60 000 mt of paddy. In addition, in Puerto Quetzal private trading companies have the capacity to store about 70 000 mt of basic grains.
Food price developments Average monthly farm-gate prices of white maize show a pronounced seasonality (see graphs). Every year, white maize prices reach their highest level in July to August, during the lean period just before the start of the harvest of the first season crop, and reach their lower level from October to February, when the bulk of annual production is available in the main markets. The explanation of this trend relies on the fact that the majority of farmers tends to sell their production surplus during the few months following the harvest. This strategy is due to the immediate need to repay debts that were contracted during the growing season and to face imminent households expenses as well as to the limited storage capacity of small farmers which does not allow them to retain the product and sell it when the price is higher. Farm-gate prices of white maize are very similar in eastern and southern producing areas, while they are on average about 10 percent lower in the north. In 2004, higher prices of white maize at the farm-gate were registered in southern producing areas, with a maximum price of 82 Q/100 pounds paid in July and an annual average of 70 Q/100 pounds. On the contrary, lower prices were paid in the north, where the maximum price was 74.5 Q/100 pounds and the average of 60.5 Q/100 pounds. This is mainly due to the higher transportation costs that transporters have to face to move the product from the Petén and Alta Vera Paz departments to the wholesaler markets in the capital city (the distance is between 620 and 700 kilometres). In addition, lower prices are justified by the high humidity of the grains (the high relative humidity of the Petén, above 80 percent on average, hampers the drying process) and by the risk of robbery during transport. Farm-gate prices vary substantially also within the municipalities in the Petén department depending on the distance of farms to the main paved road and the status of secondary and

23
Prices of black beans (1st season crop)produced in the East
100
150
200
250
300
350
Jan-03 May-03 Sep-03 Jan-04 May-04 Sep-04
Que
tzal
es/4
6 kg
bag
Retail Wholesale Transporter Farm-gate
Prices of white maize (1st season crop)produced in the North
25
35
45
55
65
75
85
95
105
115
125
Jan-03 May-03 Sep-03 Jan-04 May-04 Sep-04
Que
tzal
es/4
6 kg
bag
Retail Wholesale Transporter Farm-gate
Black beans prices (1st season) paid by Capital City wholesalers to national intermediaries
100
150
200
250
300
350
Jan-0
1
May-01
Sep-01
Jan-0
2
May-02
Sep-02
Jan-0
3
May-03
Sep-03
Jan-0
4
May-04
Que
tzal
es/4
6 kg
bag
North East
White maize prices (1st season crop)paid at farm-gate in different locations
40
45
50
55
60
65
70
75
80
85
Jan-03 May-03 Sep-03 Jan-04 May-04 Sep-04
Que
tzal
es/4
6 kg
bag
North East South
tertiary unpaved and gravel roads. It is reported that this difference in producer prices may reach up to 40 percent. Compared to white maize, the price of black beans shows lower seasonality due to the better distributed production throughout the year as a consequence of the three growing seasons. Peaks in wholesaler prices are usually reached just before the harvest of the two main seasons, specifically between August and September for the first season crop and between December and January for the second season crop. Comparing prices at different stages of the market chain, it is evident that margins seem to be quite stable over time and are more related to economic and structural rather than contingent reasons. On average, in the case of both white maize and black beans, transporters charge about 14 Q/100 pounds to cover their costs, including transport, fuel, risks, interest on capital, labour and profit. A consistent difference exists when considering the mark-up applied on farm-gate prices: it is about 24 percent for white maize and only 10 percent for black beans. White maize wholesalers have lower margins, with about only 12 Q/100 pounds, while the margin of black beans wholesalers is more than double, with an average value of about 26 Q/100 pounds. However, both types of wholesalers apply the same mark-up of about 16-18 percent on transporters’ selling price. Margins of retailers are

24
very high in the case of black beans (with an average mark-up of about 40 percent compared to only 21 percent for maize’s retailers), as a consequence of value-added activities such as cleaning and grading for size and colour uniformity as well as bagging and labelling. Basic grains markets, especially in urban areas, seem to react quickly to emergency-induced crisis. The passage of tropical storm “Stan” at the beginning of October 2005 and its impact on the western and southern areas of the country provided a useful case to understand how price markets react before, during and after a crisis. With the diffusion of the first news about the imminent storm, food prices started to climb almost everywhere in the country. Wholesalers had to face a rapidly growing demand for basic grains because consumers started to prepare their emergency food supply. This consumers’ strategy applied not only to the areas expecting to be affected by the storm, but also to the other markets in areas without an imminent danger as a consequence of a general perceived risk, the limited information on the passage of the storm and a sort of mass panic that pushed consumers to overstock their supplies. Interruptions of the main roads and bridges caused by mudslides hampered the normal mechanism of supply in the affected areas, creating shortages in these markets and suddenly increasing food prices. Tensions on markets were also amplified by official declarations on the magnitude of damages and on the probability of a severe food shortage at national level in the near future. Wholesalers’ and retailers’ speculation added another element to the increase in prices. For example, in the capital city, the wholesalers’ price of white maize went from 85 Q to 130 Q for a 46 kg bag, while the price of black beans passed from 290 Q to 330 Q for a 46 kg bag. After about two weeks, when road communications were substantially improved, even if not yet completely restored, and transporters were able to supply the areas affected by the storm, local markets started to return to their normal prices.
Transport infrastructures Given that the domestic distribution system for basic grains is entirely based on trucks, the status of transport infrastructures is crucial for market efficiency. The Guatemalan national road system consists of about 15 000 kilometres of roads, of which more than one third is paved. Although maintenance of paved roads is above the regional average, the country has a low density of classified roads, with an estimated 13 percent of the population lacking access to either paved or unpaved roads. Most paved roads connect ports and main towns to the capital city. A branch of the Pan American Highway crosses the country from east to west, from the border with El Salvador to the Mexican border. Other main paved roads pass through departmental capitals and link the main ports with the capital city. Rural areas are in general served by gravel or sand roads, where access may become difficult especially during the rainy season (from May to November). Problems of access are reported also in n northern departments, including Alta Verapaz, Izabal and Petén, due to the lower density of roads and their poor conditions.

25
The Guatemalan railroad network was once the largest and most important of Central America with more than 900 kilometres of track connecting the ports on Atlantic and Pacific coasts, the capital city, El Salvador and Mexico. Built at the beginning of the 1900s, the system was abandoned in 1996 after years of little maintenance, loss of traffic due to the opening of new roads and highways and invasions by squatters. After the destruction caused by Hurricane Mitch in late 1998, the system wasprivatized and a rehabilitation project was started in 1999. The line between Guatemala City and the Atlantic ports of Puerto Barrios and Puerto Santo Tomas has been reopened for freight service, hauling cement, imported coil and bar steel, sugar from Cuba, native coffee and other goods. Two principal ports handle the vast majority of Guatemala’s seaborne trade. Puerto Quetzal is the main port on the Pacific coast; it primarily handles bulk cargoes and is the main point for sugar exports. Puerto de Santo Tomas de Castilla is the main port on the Atlantic coast and is ranked fifth in terms of total tonnage in Central America. Both ports are connected with the capital city by a well-maintained, two-lane paved highway. Due to the greater distance, costs of transportation from Puerto de Santo Tomas are about double the costs from Puerto Quetzal to the capital city. A third minor port is Puerto Barrios, also on the Atlantic Ocean and very close to Puerto de Santo Tomas, handling mostly banana exports.
Market information and communication systems Since 1999, the Ministry of Agriculture established an Information Centre called INFOAGRO within the Unit of Policy and Strategic Information (Unidad de Politicas e Información Estrategica, UPIE). Its principal functions are the collection and dissemination of information relative to agriculture, forestry and watershed management. INFOAGRO publishes (on hard copy and on-line) average monthly wholesale and retail prices of the main commodities for the main markets of the capital city. It also provides transporters and producers prices, differentiated according to the growing season (first or second) and to the production area of the commodity (north, east or south). Formed in November 2003, the Inter-institutional Food Security and Nutrition Information Group (Grupo Interinstitucional de Información sobre Seguridad Alimentaria y Nutricional – GIISAN) has become the most active network initiative on food security issues in Guatemala. The GIISAN currently embraces public sector ministries and institutes, bi-lateral and multi-lateral international agencies, universities, NGOs and special project activities such as the Mesoamerican Food Security Early Warning System (MFEWS). Since January 2005, the GIISAN has published a bi-monthly bulletin to coordinate and disseminate critical food security information among a wider audience. The Group also supported the formation of a working-group to improve community-level food security monitoring systems among participant agencies with a view to advancing the development of a functioning and effective food security early warning system. As a result of the visit to some markets, it seems that market information flows quite smoothly among the main stakeholders participating in the food chain from production to consumption. Intermediaries and transporters play a crucial role in the continuous process

26
of information transfer between farmers in food producing areas and wholesalers and retailers that operate in urban areas. They are responsible for the transfer, almost on a daily basis, of information on prevalent food prices in national and Central American markets, on the status of harvesting operations and on possible food shortages or surpluses in certain areas. Market information becomes more scarce and difficult to obtain in the case of farmers and markets in remote areas with limited road access. The rapid reaction of markets to the crisis induced by the passage of tropical storm “Stan” at the beginning of October 2005 is an interesting example of how different stakeholders obtain market information and use it to define their strategies. In the last few years, the fast and widespread diffusion of mobile phone technology is having a major impact on the integration of food markets, at national and regional level. By using mobile phones, traders, wholesalers and retailers are able to access and share information at a limited cost and in a very quick manner.
Trade regulations In May 2005 the Guatemalan Congress ratified the Dominican Republic-Central American Free-Trade Agreement (DR-CAFTA). The agreement will be in effect from January 1, 2006 and will consolidate free trade between Guatemala and the United States. The DR-CAFTA will immediately permit free access to the Guatemalan market to more than half of United States farm exports that currently enter the country, including beef, wheat, cotton, soybeans, processed food, vegetables, some fruits and wine. Guatemalan vegetables, fruits, ornamental plants and other “non-traditional” exports to the United States will become duty-free. Guatemala also obtained an increase of its sugar quota. The DR-CAFTA contains special considerations to protect some “sensitive” products such as basic grains. In fact, they are granted a longer adjustment period in order to ease the transition to the new trade regime. During this period, a mechanism of free tariff import quotas has been established based on current imports; these quotas will be gradually phased-out over a period of maximum 20 years, when tariffs will be still applied to extra quota imported quantities. White maize has been considered Guatemala’s most sensitive product, for which free access will be granted in over 20 years, while tariffs on rice (both paddy and milled) and black beans will be phased out in 18 and 15 years respectively. Yellow maize, essentially imported by the feed industry, will reach a zero import tariff in 2015. Considerable free trade quotas have been granted especially in the cases of yellow maize (525 000 mt) and broken black beans (unlimited quantity from 2006) which are imported by local agro-industries and are not directly used for human consumption.

27
Products US free trade quota
Quota annual growth
Tariff (above quota)
Phasing out period
White maize 20 400 mt +400 mt 20% 20 years Yellow maize 525 000 mt +25 000 mt 35% 10 years Rice (paddy) 54 600 mt +6 200 mt 29.2% 18 years Rice (milled) 10 500 mt +500 mt 29.2% 18 years Black beans 53 mt +3 mt 20% 10 years Black beans (broken) unlimited - 0% -
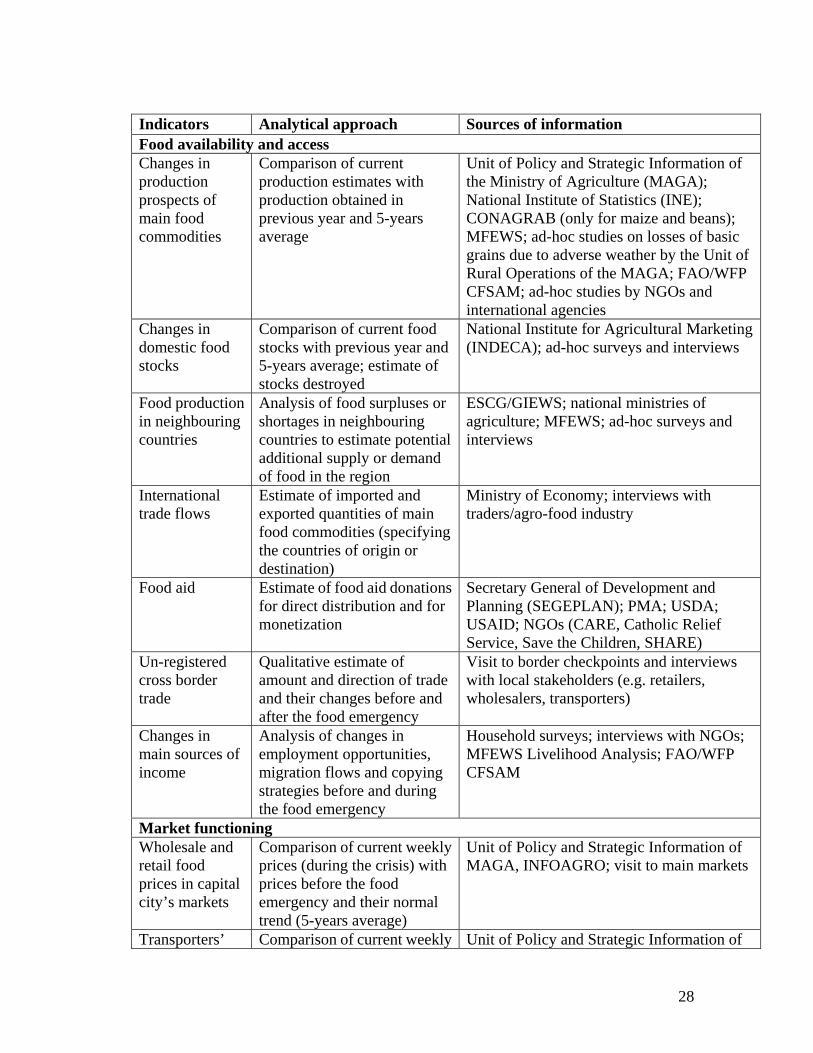
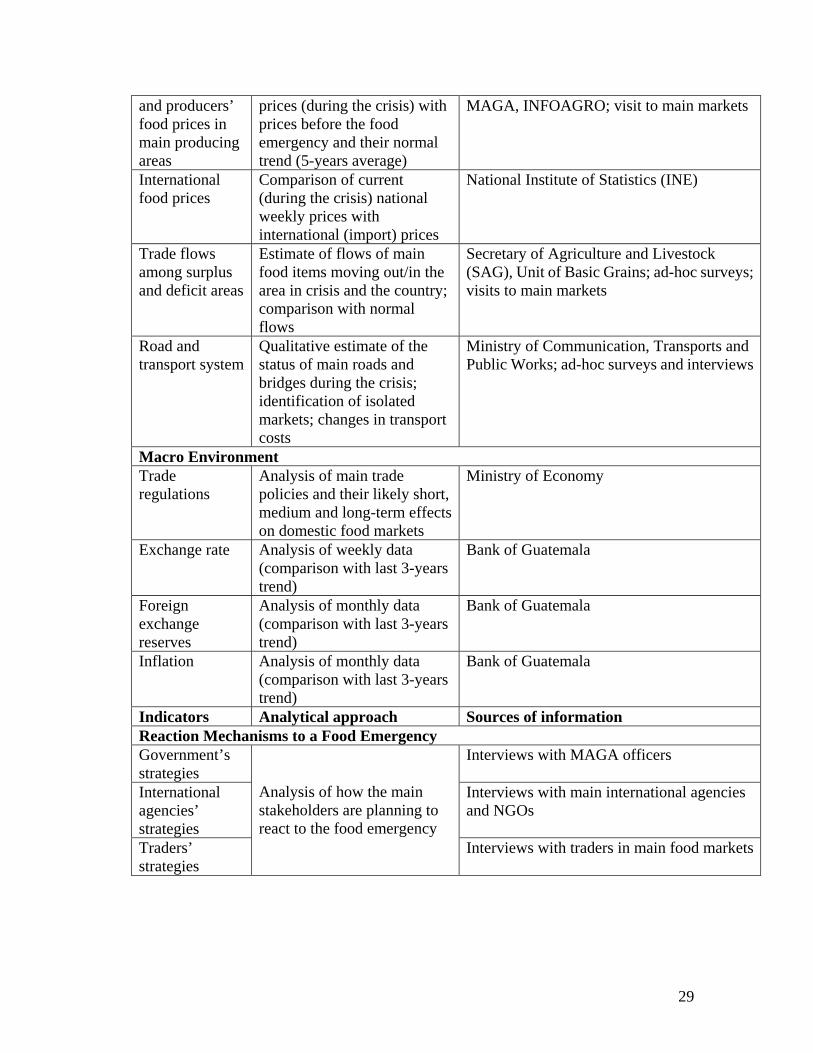
Main indicators and information sources The following table provides a list of the main indicators that should be monitored and collected to analyse the impact of a food emergency on Guatemalan markets. The proposed indicators are grouped into four categories: Food Availability and Access; Market Functioning; Macro Environment; and Reaction Mechanisms to a Food Emergency. The analytical approach and the principal sources of information are provided for each indicator.
28
Indicators Analytical approach Sources of information Food availability and access Changes in production prospects of main food commodities
Comparison of current production estimates with production obtained in previous year and 5-years average
Unit of Policy and Strategic Information of the Ministry of Agriculture (MAGA); National Institute of Statistics (INE); CONAGRAB (only for maize and beans); MFEWS; ad-hoc studies on losses of basic grains due to adverse weather by the Unit of Rural Operations of the MAGA; FAO/WFP CFSAM; ad-hoc studies by NGOs and international agencies
Changes in domestic food stocks
Comparison of current food stocks with previous year and 5-years average; estimate of stocks destroyed
National Institute for Agricultural Marketing (INDECA); ad-hoc surveys and interviews
Food production in neighbouring countries
Analysis of food surpluses or shortages in neighbouring countries to estimate potential additional supply or demand of food in the region
ESCG/GIEWS; national ministries of agriculture; MFEWS; ad-hoc surveys and interviews
International trade flows
Estimate of imported and exported quantities of main food commodities (specifying the countries of origin or destination)
Ministry of Economy; interviews with traders/agro-food industry
Food aid Estimate of food aid donations for direct distribution and for monetization
Secretary General of Development and Planning (SEGEPLAN); PMA; USDA; USAID; NGOs (CARE, Catholic Relief Service, Save the Children, SHARE)
Un-registered cross border trade
Qualitative estimate of amount and direction of trade and their changes before and after the food emergency
Visit to border checkpoints and interviews with local stakeholders (e.g. retailers, wholesalers, transporters)
Changes in main sources of income
Analysis of changes in employment opportunities, migration flows and copying strategies before and during the food emergency
Household surveys; interviews with NGOs; MFEWS Livelihood Analysis; FAO/WFP CFSAM
Market functioning Wholesale and retail food prices in capital city’s markets
Comparison of current weekly prices (during the crisis) with prices before the food emergency and their normal trend (5-years average)
Unit of Policy and Strategic Information of MAGA, INFOAGRO; visit to main markets
Transporters’ Comparison of current weekly Unit of Policy and Strategic Information of
29
and producers’ food prices in main producing areas
prices (during the crisis) with prices before the food emergency and their normal trend (5-years average)
MAGA, INFOAGRO; visit to main markets
International food prices
Comparison of current (during the crisis) national weekly prices with international (import) prices
National Institute of Statistics (INE)
Trade flows among surplus and deficit areas
Estimate of flows of main food items moving out/in the area in crisis and the country; comparison with normal flows
Secretary of Agriculture and Livestock (SAG), Unit of Basic Grains; ad-hoc surveys; visits to main markets
Road and transport system
Qualitative estimate of the status of main roads and bridges during the crisis; identification of isolated markets; changes in transport costs
Ministry of Communication, Transports and Public Works; ad-hoc surveys and interviews
Macro Environment Trade regulations
Analysis of main trade policies and their likely short, medium and long-term effects on domestic food markets
Ministry of Economy
Exchange rate Analysis of weekly data (comparison with last 3-years trend)
Bank of Guatemala
Foreign exchange reserves
Analysis of monthly data (comparison with last 3-years trend)
Bank of Guatemala
Inflation Analysis of monthly data (comparison with last 3-years trend)
Bank of Guatemala
Indicators Analytical approach Sources of information Reaction Mechanisms to a Food Emergency Government’s strategies
Interviews with MAGA officers
International agencies’ strategies
Interviews with main international agencies and NGOs
Traders’ strategies
Analysis of how the main stakeholders are planning to react to the food emergency
Interviews with traders in main food markets

30
References ARROZGUA (2004), Convenio de comercialización del grupo sub-sectorial de trabajo del
arroz (GST-Arroz), Guatemala.
European Union (2002), Guatemala Country Strategy Paper 2002-2006, Brussels.
Fuentes López M.R. et al. (2005), Maíz para Guatemala. Propuesta para la reactivación de la cadena agroalimentaria del maíz blanco y amarillo, FAO, Ciudad de Guatemala.
IFAD (2003), Republic of Guatemala: Country Strategic Opportunities Paper, Rome.
Instituto Nacional de Estadistica (INE) (2003), IV Censo Agropecuario, Ciudad de Guatemala.
MAGA (2005), El maíz blanco, MAGActual – la revista del Ministerio de Agricultura, Ganadería y Alimentación, n.9, March/April.
MAGA (2005), Producción de arroz, MAGActual – la revista del Ministerio de Agricultura, Ganadería y Alimentación, n.11, July/August.
Martinez L.R. (2003), A integrated assessment of the dry bean subsector in Central America, Departments of Agricultural Economics, Michigan State University.
MFEWS/USAID (2005), Perfiles de medios de vida de Guatemala, Ciudad de Guatemala.
Programa Nacional de Competitividad (PRONACOM) (1999), Diagnostico del subsector frijol en Guatemala, Informe final, Ciudad de Guatemala.
Todd J. et al. (2004), CAFTA and the rural economies of Central America: a conceptual framework for policy and program recommendations, IADB, Washington DC.
United Nations (2003), Situación de la seguridad alimentaria y nutricional de Guatemala, Ciudad de Guatemala.
United Nations/CEPAL (2003), Istmo centroamericano: los retos de la sustentabilidad en granos básicos, Mexico.
United Nations/CEPAL (2004), Centroamérica: resultados de las negociaciones en el CAFTA sobre productos agropecuarios sensibles, Mexico.
United Nations/CEPAL (2005), Guatemala: evolución económica durante 2004 y perspectivas para 2005, Mexico.
World Bank (2003), GUAPA: Guatemala Poverty Assessment, The World Bank, Washington DC.
31
World Bank (2004), Guatemala: drivers of sustainable rural growth and poverty reduction in Central America, Volumes I & II, The World Bank, Washington DC.
World Bank (2005), Country Assistance Strategy for the Republic of Guatemala, The World Bank, Washington DC.
World Bank (2005), Guatemala - country economic memorandum: challenges to higher economic growth, The World Bank, Washington