dallas isd’s value-added model school effectiveness index (sei) classroom effectiveness index...
TRANSCRIPT

Dallas ISD’s Value-Added Model
School Effectiveness Index (SEI)
Classroom Effectiveness Index (CEI)
Data Analysis, Reporting, and Research Services

2
Why Dallas ISD Uses Indices
To gauge students’ progress in relation to their peers
To hold schools and teachers accountable for the improvement of all students, both those who are not passing and those who are
To reward improvement, not just passing rates

3
Objectives of this Segment
Explain the Indices (SEIs and CEIs) without complex formulas and statistics Basics of value-added models Computation of the Indices
Address common concerns

4
Passing Rates
Passing rates are important Demonstrate efforts of schools and teachers Main components of state (AEIS) and federal (AYP)
accountability systems Reflect a necessary minimum standard of
achievement Passing rates are insufficient
Innate student differences are ignored Performance alone tells little about growth and
effect of instruction “Setting the bar” fails to challenge proficient and
excellent students

5
Value-Added Measures
Measures based on value-added models address these issues By factoring in characteristics that may
impact students’ learning (gender, ethnicity, language proficiency, socio-economic status, etc.)
By measuring a student’s change in performance relative to her peers’
By creating comparison measures for all students, every year

6
What is “Value-Added”?
A value-added model measures the “academic value” added to students after a year of instruction
Components: Previous level of achievement (academic
value at the end of the prior school year) Current level of achievement (academic
value at the end of this school year) Difference (change, growth, gain, etc.)

7
Value-added “Growth”
A note to which we will return…
In the Dallas ISD,
“Growth” ≠
Current score – Previous score

8
Are the Indices “Fair”?
“Our (My) students were struggling students to start with. That’s why they didn’t do as well as other students.”
“Most of our (my) students were limited English proficient. We (I) can’t be compared to schools (teachers) that had only non-LEP students!”
“Our (My) students didn’t pass, but they did much better than last year. Shouldn’t that count?”

9
Are the Indices “Fair”?
“Our (My) students had high scores last year. They didn’t have much room to ‘grow,’ not like students with low scores.”
“We (I) had many of our (my) students for only a few months. How can we (I) be held accountable for their progress?”

10
Fairness Variables
These questions are valid A value-added model for accountability
does address these fairness issues Compare students with the same previous
level of achievement Compare students with the same
demographic characteristics Evaluate change in achievement without
regard to arbitrary standards Include only students at the school/in the
classroom for most of school year

11
Fairness Variables
Student performance controlled for: Previous level of achievement Gender Ethnicity English-language proficiency Free or reduced-price lunch status Neighborhood family income Neighborhood education level Neighborhood poverty index
12
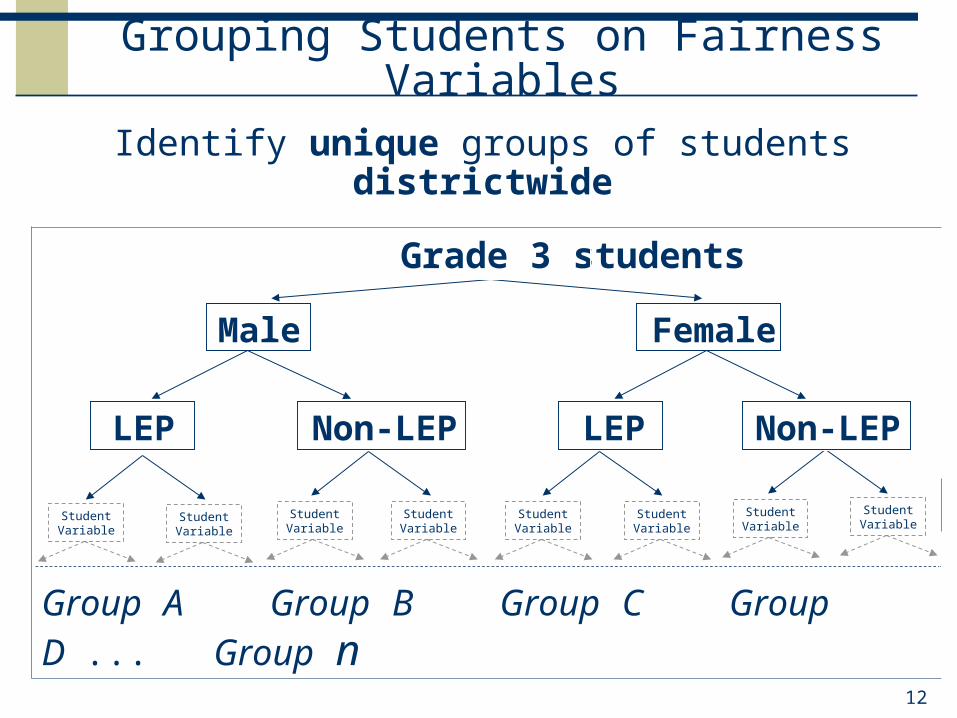
Grouping Students on Fairness Variables
Identify unique groups of students districtwide
Grade 3 students
Male Female
LEP Non-LEP LEP Non-LEP
Group A Group B Group C Group D ... Group n
StudentVariable
StudentVariable
StudentVariable
StudentVariable
StudentVariable
StudentVariable
StudentVariable
StudentVariable

13
Criteria for “Eligibility”
Continuously enrolled: in attendance for a minimum number of instructional days
For measures based on the TAKS, not retained in either of last two years
Appropriate scores from last year and current year
(CEIs) Received instruction in all six-week grading periods

14
Value-added “Growth”
Growth ≠ Current score – Previous score Computation of “growth”
For each unique group, determine the expected score on the current year test
Evaluate a student’s performance based on how far from expected it was
Potential consequences: Student’s score “falls” above expectation Student’s score “rises” below expectation

15
0
5
10
15
20
25
30
35
40
45
50
0 5 10 15 20 25 30 35 40 45 50
# Items Correct (one prior-year test)
# It
ems
Cor
rect
(cu
rren
t-ye
ar te
st)
Value-Added GrowthStudents in a Group with 40% of Items Correct Last Year
District students that started with 40% of items correct, on average got 50% of items correct this year.
Students scoring above the district average exceed expectation
Students scoring below the district average did not meet expectation
50% Correct
40% Correct

16
0
5
10
15
20
25
30
35
40
45
50
0 5 10 15 20 25 30 35 40 45 50
# Items Correct (one prior-year test)
# It
ems
Cor
rect
(cu
rren
t-ye
ar te
st)
Value-Added GrowthStudents In a Group with 80% of Items Correct Last Year
District students that started with 80% of items correct, on average got 70% of items correct this year.
Students scoring above the district average exceed expectation
Students scoring below the district average did not meet expectation
70% Correct
80% Correct

17
Value-Added GrowthTwo Entities with Passing Rate Increase (20% to 30%)
0
5
10
15
20
25
30
35
40
45
50
0 5 10 15 20 25 30 35 40 45 50
# Items Correct (one prior-year test)
# Ite
ms
Cor
rect
(cur
rent
-yea
r tes
t)
“Fail” “Fail”
“Pass” “Pass”
“Fail” “Pass”
“Pass” “Fail”
School/Teacher A: All but two students exceeded expectation = high Index
School/Teacher B: All students failed to meet expectation = low Index
Student starting with 20 items correct

18
0
5
10
15
20
25
30
35
40
45
50
0 5 10 15 20 25 30 35 40 45 50
Value-Added GrowthTwo Entities with Passing Rate Decrease (80% to 70%)
School/Teacher D: 6/10 students exceeded expectation = high Index
School/Teacher C: Only 1/10 students exceeded expectation = low Index
Student starting with 40 items correct

19
Indicators
CEIs TAKS Norm-referenced Assessment of Course Performance (ACPs)
SEIs, above plus graduation rate SAT/PSAT/ACT participation PSAT averages Percentage passing AP exams Percentage enrolled in AP courses

20
Summary: Indices
Measure amount of academic progress after receiving a year of instruction
High Indices indicate more progress than similar students across the district
Provide an additional tool to determine progress
Cannot be used in isolation from other tools: they don’t tell how to effect the change, just provide evidence

21
Contact
Evaluation & Accountability
972-925-3503
http://www.dallasisd.org/eval/
Data Analysis, Reporting, and Research Services 972-925-6446
MyData Portal: https://portal.dallasisd.org/mydata
Teaching & Learning
Curriculum Central: https://portal.dallasisd.org/curriculum