dairybase level 2 physical detail questionnaire training guide · physical detail questionnaire...
TRANSCRIPT

`
DairyBase Level 2
Physical Detail Questionnaire
Training Guide
April 2015

L2 Training Guide – April, 2015 2
Table of contents:
INTRODUCTION ..................................................................................................................................... 5
SECTION 9 – FARM DESCRIPTION........................................................................................................... 7
9.1 FARM DAIRY.............................................................................................................. 7
9.2 RAINFALL FOR SEASON ................................................................................................. 7
SECTION 10 – PHYSICAL DESCRIPTION ................................................................................................... 8
10.1 DISTANCE FROM FARM DAIRY TO FURTHEST PADDOCK (KM) ................................................... 8
10.2 % OF FARM AT A DIFFERENT HEIGHT/ALTITUDE TO FARM DAIRY .............................................. 8
10.3 AVERAGE DIFFERENCE IN HEIGHT BETWEEN FARM DAIRY AND HILL PADDOCKS (M) ....................... 9
SECTION 11 – STOCK DESCRIPTION ...................................................................................................... 10
11.1 COW LIVEWEIGHT (KG) DEC 1 ...................................................................................... 10
11.2 HERD BW/RELIABILITY .............................................................................................. 11
11.3 HERD PW/RELIABILITY ............................................................................................... 11
11.4 NITROGEN APPLIED ................................................................................................... 12
SECTION 12 – MILK PRODUCTION ........................................................................................................ 12
12.1 LITRES OF MILK FED TO CALVES ..................................................................................... 13
12.2 DISCARDED MILKSOLIDS (KG) ....................................................................................... 14
12.3 AVERAGE DAILY MILKSOLIDS PER COW FOR 10 DAYS AT PEAK (KG) ......................................... 14
12.4 LAST DAY OF 10 DAY PEAK ........................................................................................... 15
12.5 MILK SOLIDS TO 31 DEC SOLD TO FACTORY ...................................................................... 16
12.6 AVERAGE DAILY MILK SOLIDS PER COW FOR LAST 10 DAYS IN DECEMBER (KG) .......................... 16
SECTION 13 – DAYS IN MILK (DIM) ...................................................................................................... 17
13.1 NUMBER OF COWS CALVING ........................................................................................ 18
13.2 DATE WHEN 50% OF COWS CALVED ............................................................................... 18
13.3 DAYS IN MILK PER COW .............................................................................................. 19
13.4 DAYS IN MILK – SPRING/AUTUMN - COW DRYING OFF & WASTAGE CALENDAR ...................... 20
SECTION 14 – YOUNG STOCK GRAZED ON EFFECTIVE (MILKING) AREA ................................................ 22
14.1 RISING ONE-YEAR OLDS .............................................................................................. 22
14.2 RISING TWO-YEAR OLDS .............................................................................................. 23
SECTION 15 – GRAZING OFF DRY COWS ............................................................................................... 23
15.1 NUMBER OF COWS .................................................................................................... 24
15.2 TOTAL DAYS GRAZED AWAY FROM MILKING AREA .............................................................. 25
L2 Training Guide – April, 2015 3
15.3 KGDM/COW/DAY OFFERED ......................................................................................... 25
15.4 AVERAGE MJME/KGDM ........................................................................................... 26
15.5 UTILISATION % ......................................................................................................... 26
SECTION 16 – CROPS GRAZED & FEED HARVESTED ON EFFECTIVE AREA .............................................. 27
16.1 AREA HARVESTED FOR HAY & SILAGE (HA) ............................................................................ 27
16.2 HARVEST CROP (HA) .................................................................................................. 28
16.3 FEED EXPORTED (TDM) ............................................................................................. 28
16.3 SUMMER CROP GRAZED BY DAIRY COWS (HA) .................................................................. 29
16.4 WINTER CROP GRAZED BY DAIRY COWS (HA) .................................................................... 30
SECTION 17 – IMPORTED SUPPLEMENTS FED OUT ON EFFECTIVE AREA DURING SEASON ................... 30
17.1 IMPORTED SUPPLEMENTS FED OUT ON EFFECTIVE AREA DURING SEASON ................................. 30
SECTION 18 – IRRIGATION ................................................................................................................... 33
18.1 AVERAGE IRRIGATION INTERVAL (DAYS) .......................................................................... 33
18.2 HECTARES IRRIGATED ................................................................................................. 33
18.3 DAYS OF THE SEASON IRRIGATED ................................................................................... 34
18.4 TOTAL METERED WATER (M3) – PREFERRED ..................................................................... 34
18.5 OR INSTANTANEOUS FLOW RATE (L/SEC/HA) ................................................................... 35
18.6 OR FLOW RATE (BORE/BORDERDYKE) (L/SEC) .................................................................. 35
SECTION 19 – GENERAL COMMENTS E.G. MAJOR FLOOD, DRIED OFF EARLY, FIRST YEAR CONVERSION
19.1 GENERAL COMMENTS ................................................................................................. 36
SECTION 20 – FERTILISERS AND SOILS .................................................................................................. 36
20.1 SOIL TEST INFORMATION ............................................................................................ 36
20.1.1 SOIL TEST PH ....................................................................................................... 36
20.1.2 OLSEN P (AVE) ..................................................................................................... 37
20.1.3 QUICK TEST MG – MAGNESIUM .............................................................................. 37
20.1.4 QUICK TEST K – POTASSIUM ................................................................................... 38
20.1.5 SOIL TEST SULPHATE S ........................................................................................... 39
20.2 FERTILISER APPLICATION RECORD .................................................................................. 39
20.2.1 NITROGEN (N) ..................................................................................................... 39
20.2.2 PHOSPHORUS (P) ................................................................................................. 40
20.2.3 POTASSIUM (K) (KG/HA) ....................................................................................... 40
20.2.4 SULPHUR (S) (KG/HA) .......................................................................................... 41
20.2.5 MAGNESIUM (MG) (KG/HA) .................................................................................. 41
20.2.5 LIME (KG/HA) ...................................................................................................... 42
SECTION 21 – CALVING AND MATING .................................................................................................. 43
21.1 PLANNED START OF CALVING ........................................................................................ 43

L2 Training Guide – April, 2015 4
21.2 PLANNED START OF MATING (PSM) .............................................................................. 43
21.3 DATE AB FINISHED .................................................................................................... 43
21.4 DATE BULL WITHDRAWN FROM HERD ............................................................................. 44
21.5 NUMBER MA COWS CONFIRMED EMPTY ......................................................................... 44
21.6 NUMBER OF COWS CALVED AT 21 DAYS .......................................................................... 44
21.7 NUMBER OF COWS CALVED AT 42 DAYS .......................................................................... 45
21.8 NUMBER OF COWS CALVED AT 63 DAYS .......................................................................... 46
21.9 NUMBER OF COWS INDUCED ........................................................................................ 46
21.10 NUMBER OF COWS SUBMITTED IN 21 DAYS FROM PSM ................................................. 47
21.11 NUMBER OF COWS TREATED FROM ANOESTRUS ........................................................... 47
21.12 6-WEEK IN-CALF RATE (% OF HERD IN CALF AT 6 WEEKS) ................................................ 48
SECTION 22 – MASTITIS AND LAMENESS ............................................................................................. 48
22.1 AVERAGE BULK SOMATIC CELL COUNT (FOR SEASON) .......................................................... 48
22.2 COWS LAME ............................................................................................................ 49
22.3 COWS TREATED FOR MASTITIS IN FIRST 6 WEEKS FROM PSC ................................................. 49
SECTION 23 – WASTAGE AND REPLACEMENTS .................................................................................... 50
23.1 NUMBER OF COWS AND R2 HEIFERS AT THE START OF SEASON ............................................. 50
23.2 NUMBER OF R2 HEIFERS AT THE START OF SEASON ............................................................ 51
23.3 NUMBER OF R2 HEIFERS AT THE START OF SEASON AND STILL IN THE HERD AT THE END OF SEASON 51
23.4 NUMBER OF COWS AND R2 HEIFERS MILKING AT 1 DEC ...................................................... 52
23.5 NUMBER OF REPLACEMENT CALVES REARED ..................................................................... 53

L2 Training Guide – April, 2015 5
Introduction
This guide has been prepared to aid the data collector in understanding
how the data should be collected, where the data can be collected from, the
importance of the data collected and how it is used.
The Level 2 questionnaire is the set of information that will allow a farmer
to analyse the physical aspects of the farm business in more detail and use the
relevant benchmarks that are established.
Objectives;
To efficiently collect essential farm information to enable the generation of
DairyBase Physical Detail Reports A & B.
To have the farmer engaged and self-managing with the desire to collect
and use the information on an ongoing basis.
Ensure farmer gains value from information through an on-farm analysis.
When time is limited, concentrate on the following ESSENTIAL areas in
this order as these have the biggest impact on the pasture eaten:
Cow LWT
Young stock grazed on effective area
Grazing off dry cows
Imported supplements fed out
Advise dairy farmers to have the information mentioned in the “Level 2
resource checklist” (Appendix 1) Appendix 1available before the interview.
This will save time when completing the L2 questionnaire.
It is important to take time to complete or review the level 1 questionnaire
prior to completing the level 2 Questionnaire.

L2 Training Guide – April, 2015 6
The next IMPORTANT areas to focus on influence the pasture eaten
calculation but have less influence unless really extreme:
Physical Description
Litres of milk fed to calves
Discarded milksolids
Days in Milk
Finally the remaining areas should be collected. They are benchmarked or
compared against industry targets but do not influence the pasture eaten
calculations. The Irrigation section (average irrigation interval, hectares
Irrigated, days of season irrigated, volume of water applied) is compulsory for
Irrigated farms so must be collected. Sections 9 to 19 provide information
necessary to generate the “Physical detail report A”, where key performance
indicators (KPI’s) are benchmarked against other farms. Sections 20-23 provide
information necessary to generate the “Physical detail report B”, where KPI’s
are compared with industry targets.

L2 Training Guide – April, 2015 7
Section 9 – Farm description
9.1 Farm dairy
Type of dairy shed used and number of cups.
Relevance:
This information adds context to the farm description.
The number of cups is used for the efficiency KPI of “Milking cups per
FTE”.
Recommendation:
If the analysis includes more than one shed record each shed details
separately.
If the shed type is not Rotary or Herringbone e.g. Robotic milker or walk
through, then use “Other” and make a not in the comments section as to
what the shed type is
9.2 Rainfall for season
This is the Rainfall recorded on the farm for the current season. This can
be entered for an individual farm where known, otherwise the current full
season’s total rainfall supplied by NIWA will be displayed.
Relevance:
It provides further information about the farm and the season.
It is particularly relevant if the recorded farm rainfall is significantly
different from the area average.
The reports provide a comparison with the NIWA 10 year average so the
seasonal rainfall compared with the 10 year average gives an indication
of whether the seasonal rainfall is higher or lower than average.

L2 Training Guide – April, 2015 8
Recommendation:
Only enter data here if the client has recorded the actual rainfall for the
farm. If data provided is just a guess at the average seasonal rainfall do
not enter it as it will preclude the NIWA data being used.
Section 10 – Physical description
These values influence the maintenance requirements of the cow and
are used in the energy calculations.
10.1 Distance from farm dairy to furthest paddock (km)
This is the distance from the Farm Dairy to the furthest paddock. It is a
measure of the furthest distance milking cows walk on a regular basis.
Relevance:
Used (in conjunction with frequency of milking and farm altitude) to
estimate the energy a cow uses during the year for walking.
This is important information for calculating pasture eaten.
Recommendation:
This should be recorded in kilometres.
It can be taken from a farm map or may be measured using the
odometer on a farm bike or ute.
Consider the frequency with which cows walk to the the furthest paddock
as well as what that distance is, e.g. if the cows only graze the furthest
paddock 2 or 3 times during the milking season do not use this distance
as the furthest paddock as it is not a regular walk.
10.2 % of farm at a different height/altitude to farm dairy
This is the percentage of the farm that is at a different altitude to the farm
dairy.

L2 Training Guide – April, 2015 9
Relevance:
This information adds context to the farm description as it gives an
indication of the contour of the farm.
It is used to estimate the amount of energy used by milking cows for
walking and the amount of pasture eaten by the herd.
Recommendation:
20 % or more of the farm at a different altitude is significant and will have
an impact on the energy required for walking and, therefore, on pasture
eaten.
This is not easy to measure so estimation is often required
10.3 Average difference in height between farm dairy and hill
paddocks (m)
This is the average difference in height between the farm dairy and highest
hill paddocks.
Relevance:
It is used to estimate the amount of energy used by milking cows for
walking and the amount of pasture eaten by the herd. Height travelled by
a cow has more impact than the distance on flat as it requires more
energy.
Recommendation:
An average difference in height of 20 metres is significant and will have
an impact on the energy required for walking and in the estimation of
pasture eaten.
This is not easy to measure so an approximate value is often required.
Where farms are terraced it may be necessary to calculate how often the
cows are climbing and adjust the average height to reflect this e.g. the
farm dairy and 20% of the farm is on river flats and 80% of the farm is on
terrace flats 60 metres above the dairy – in this case the average height
should be recorded as 60 metres.

L2 Training Guide – April, 2015 10
Section 11 – Stock description
Values from this section appear in the report under ‘Physical description’ and
are used in energy calculations, as well as being a useful indicators in their own
right
11.1 Cow Liveweight (kg) Dec 1
This is the average cow liveweight (LWT) at the beginning of December. At
this time the impact of pregnancy, as well as the effects on body condition/
liveweight of calving and early lactation are at their lowest.
Relevance:
This information adds context to the farm description as it gives an
indication of the relative size of the cows farmed.
It contributes to the KPI’s ‘Liveweight/ha’ and ‘Milksolids as % of
liveweight’.
Essential for calculating pasture eaten.
If this is underestimated then the amount of feed required for the cows
will be understated.
Recommendation:
Refer to the table in the level 2 questionnaire for information to assist
with estimating cow liveweights.
Some Meat companies now supply live weights as well as carcase
weights so check kill sheets for any December/January culls to get an
indication of a herds average cow Liveweight.
A herds average cow liveweight can be estimated by using the herd LWT
BV in conjunction with the formula as stated on the Level 2
questionnaire. The herd LWT BV can be obtained from a ‘Traits
Evaluations’ report from MINDA (it needs to be requested in advance as
not a standard report generated from MINDA).

L2 Training Guide – April, 2015 11
11.2 Herd BW/Reliability
The herd BW is the herds’ LIC Breeding Worth or CRV equivalent, as
shown on herd records at the start of season. The reliability is a measure
of the amount of information that has contributed to the calculation of the
BW.
It should include data for all rising 2 year olds and mixed age cows to calve
(or planned to be milked) at the start of the season.
Relevance:
This information adds context to the farm description as it gives an
indication of the genetic merit of the herd.
The BW for a herd gives an indication of the herd’s likely worth for
breeding. It is based on the recorded ancestry information and herd test
information for the herd.
The higher the reliability the more accurate the BW estimate.
Recommendation:
This information is on reports or documents printed at the start of the
season. It is updated regularly so requesting a report during the season
will not show the BW at the start of the season.
Check that the data source includes all rising 2 year olds. Early season
reports may not include the rising 2 year olds as some farms tag them as
they calve. If no better data is available record this but make a note in
the comments section.
An estimate can be made from a report later in the season – make a
note in the comments section if this is the case.
11.3 Herd PW/Reliability
The herd PW is the herds’ LIC Production Worth or CRV equivalent, as
shown on herd records at the start of season. The reliability is a measure
of the amount of information that has contributed to the calculation of the
PW. It should include data for all rising 2 year olds and mixed age cows to
calve (or planned to be milked) at the start of the season.

L2 Training Guide – April, 2015 12
Relevance:
This information adds context to the farm description as it gives an
indication of the Production potential of the herd.
The PW for a herd is based initially on the recorded ancestry information
for the herd. The more herd test data the less influenceaAncestry
information has.
The higher the reliability the more accurate the PW estimate.
Recommendation:
This information is on reports or documents printed at the start of the
season. It is updated regularly so requesting a report during the season
will not show the PW at the start of the season.
Check that the data source includes all rising 2 year olds. Early season
reports may not include the rising 2 year olds as some farms tag them as
they calve. If no better data is available record this but make a note in
the comments section, or check an early season herd test report as this
should include most of the R2 heifers.
An estimate can be made from a report alter in the season – make a
note in the comments section if this is the case.
11.4 Nitrogen Applied
See Section 20 – Fertiliser and Soils page 26
Section 12 – Milk production
This section captures all milk output from the herd (except colostrum), whether
saleable or not. This gives greater accuracy when estimating the energy
requirements for a herd. Per cow daily production at peak and at end of
December are used to calculate monthly drop off from peak which can be an
indicator of feed quality and/or quantity over that period.

L2 Training Guide – April, 2015 13
12.1 Litres of milk fed to calves
This is the quantity of milk produced by the herd that could have gone to
the factory or been sold elsewhere, but was fed to calves. Colostrum is
excluded from this estimate.
Relevance:
Used to identify all milk outputs from the farm.
Contributes to the calculation of pasture eaten.
Recommendation:
Includes sick cow milk and saleable milk taken from vat and fed to both
replacement & non-replacement calves.
Do not include colostrum milk as the energy required by a cow to
produce colostrum is already included in the pasture eaten calculation.
Ensure that sick cow milk recorded here as fed to calves is not recorded
against discarded milksolids as well.
For a 25% replacement rate, with calves fed for 8 weeks, approximately
25% of their feed will come from colostrum so adjust number of days fed
out of the vat. E.g. 8 weeks x 75% = 6 weeks from the vat (and or sick
cow milk).
As a guide use:
o 200 litres to raise a Friesian calf (excluding colostrum)
o 160 litres to raise a Jersey calf (excluding colostrum)
The information can be entered directly into Litres of milk fed to calves
OR the calculator can be used with number of calves reared (spring and
autumn), estimated litres of milk fed per day and number of days fed
milk
Do not spend too much time on this as milk fed to calves needs to be
very high before it impacts on the pasture eaten calculation. An estimate
is adequate for this if good data cannot be obtained quickly.
Some farmers sell milk to calf rearers and cheesemakers etc. If this milk
production is significant it should be added to the level 1 milk
production. If not significant (< 1%) then include them here as otherwise

L2 Training Guide – April, 2015 14
amount of total milk production is understated. Make sure to record how
this is treated in the farm notes area on DairyBase.
12.2 Discarded milksolids (kg)
This is discarded milksolids that is disposed of and not fed to calves. It is
information that contributes to identifying all milk outputs from the farm.
Relevance:
Used to identify all milk outputs from the farm.
Contributes to the calculation of pasture eaten.
Recommendation:
If discarded milk is fed to calves only count treated cows from date
calves stopped being fed so you do not double count discarded milk that
was included in calf milk.
Refer to animal treatment records for number of cows treated and
withholding period.
Use average if different treatments have different withholding lengths
e.g. 150 cows X 6 days X 1.6 kgMS = 1440 kgMS.
Do not spend too much time on this as discarded milk needs to be very
high before it impacts on the pastureeaten calculation. An estimate is
adequate for this if good data cannot be obtained quickly.
12.3 Average daily milksolids per cow for 10 days at peak (kg)
This is the average daily per cow production over 10 days during the peak
period when the highest daily per cow production is achieved.
Relevance:
Used as the KPI ‘10 day peak per cow’ and for calculating ‘Monthly
production drop : Peak to 31 Dec’.
Shows the productivity of the herd during the peak which may give an
indication of feeding levels, herd condition score, calving pattern, herd
health and genetic merit.

L2 Training Guide – April, 2015 15
Recommendation:
Take into consideration that the peak may occur before all cows have
calved and while milk may also be going to the calves (in this case also
include the kilograms of milksolids in milk fed to calves). For this reason
the daily milk statements should only be used as a starting point e.g.:
o Take the relevant 10 day milksolids from Dairy statements
o Add Milk fed to calves (from the vat/sick cow milk) and discarded
milk
o Divide by 10 to get dairy total milksolids at peak
o Divide by average number of cows contributing to the vat over the
10 day period
It is the average daily per cow production over the peak period
o eg if the peak of milksolids production is on 5 Oct then average
the milksolids production from 5 days before and 5 days after the
peak date should be used. Then divide it by the average number
of cows milked during this period.
Herd test information from this period may also be helpful starting point.
This is a useful KPI on its own but it is not used in the calculation of
pasture eaten so if good data is not available quickly, an estimate should
be made and a note made in the comments section.
12.4 Last day of 10 day peak
This is the last day of the 10 day period during which the peak occurred
Relevance:
• Used as the KPI ‘10 day peak per cow’ and for calculating ‘Monthly
production drop : Peak to 31 Dec’.
Recommendation:
• If peak was on 10 October then the last day of 10 day peak would be 15
October i.e. 5 days after peak.
• Farmers will generally know this information.
L2 Training Guide – April, 2015 16
• Don’t rely solely on factory statements as the peak can occur before all
cows are calved and milk is still being used to feed calves.
• This contributes to a useful KPI but it is not used in the calculation of
Pasture Eaten so if good data is not available quickly, an estimate should
be made and a note made in the comments section.
12.5 Milk solids to 31 Dec sold to factory
This is the milk production for the seasonal year to 31 December (June 1
to December 31).
Relevance:
For spring calving herds the amount of milk produced before the end of
December reflects the impact of stocking rated, calving pattern, feeding
levels and herd condition. This can help identify opportunities or
strengths for a farm system
Recommendation:
Refer to December dairy company statement under season to date
production or dairy company website 1 June to 31 December production.
12.6 Average daily milk solids per cow for last 10 days in
December (kg)
This is the average daily milksolids per cow for the last 10 days of
December.
Relevance:
Used for calculating the KPI ‘Monthly production drop : Peak to 31 Dec’.
Recommendation:
Use the milk statement for December (or the daily milk dockets) to
identify the milk production for last 10 days in December. Divide this by
the average number of cows contributing to the vat for the same period.

L2 Training Guide – April, 2015 17
This contributes to a useful KPI but it is not used in the calculation of
Pasture Eaten so if good data is not available quickly, an estimate
should be made and a note made in the comments section.
Section 13 – Days in milk (DIM)
Days in Milk is the average number of days for the season that each cow in
the herd is in milk. Number of cows to calve each season (spring/autumn),
midpoint of calving and the removal of cows from the milking herd are
important factors in determining average Days in Milk for a herd.
Midpoint of calving (i.e. the date 50% of herd is calved) plus 5 days is used
to derive an average mean calving date. A profile of cows leaving the
milking herd (dry, culls, deaths) is established. The difference between the
mean calving date and the date each cow finishes milking is used to
calculate total cow milking days. Total Cow milking days / number of cows
at planned start of calving (spring/autumn) gives days in milk per cow for
the herd.
Relevance:
Used as part of the calculation of energy used for walking in the pasture
eaten calculation.
The weighted average DIM for each calving period is used to calculate
DIM for the season.
This is a useful benchmarked KPI.
Recommendation:
Do not spend too much time on this as Days in milk needs change
considerably before it impacts on the pasture eaten calculation. An
estimate is adequate for this if good data cannot be obtained quickly.

L2 Training Guide – April, 2015 18
13.1 Number of cows calving
This is the number of cows to calve (or intended to be milked) at planned
start of calving (PSC) for the production year (1 June to 31 May).
In the case of spring calving herds record the number of cows to calve
between 1 June to 31 December under Days in Milk - Spring.
For autumn calving herds, record under Days in milk – Autumn, the
number of cows to calve between 1 January and 31 May for the year
prior to the start of the production season. (if the production season is
2013-2014 use the autumn calving data from Autumn 2013) .
Relevance:
Used as a starting point to calculate Days in Milk per cow in conjunction
with cows removed from the milking herd (or in milk each
fortnight/month) and mean calving date (derived from mid-point).
Recommendation:
Information can be obtained from calving report.
Include any carry over cows that are intended to be milked for the
season.
Use peak when numbers increase a lot more from PSC – level 1.
13.2 Date when 50% of cows calved
This is the date when 50% of the herd has calved (also known as the mid-
point of calving).
Relevance:
This is used to estimate the herd mean calving date (by adding 5 days)
which is used in the calculation of days in milk.
Recommendation:
Information can be obtained from the MINDA or CRV Calving Rate
Reports (The planned start of calving date must be entered to get this
MINDA/CRV report.). The most accurate mid-point for the herd is

L2 Training Guide – April, 2015 19
estimated from the mean calving date on the calving rate report. Take 5
days off the mean to get the mid calving date.
The herd fertility Focus report also has this information.
If there is not good data available estimate it (it is usually between 2 ½
and 3 ½ weeks from PSC). Make notes in the comments section of any
assumptions and ensure client understands the implications of any
assumptions.
If yellow notebook is being used, count cows until you reach 50% of
cows and use that calving date.
13.3 Days in milk per cow
Days in milk can be entered directly if the values given are reliable. It can
be estimated using the Days in milk calculator in DairyBase, or calculated
manually. Where there is no information at all, an approximation can be
made and steps taken to ensure the farmer understands the implications of
this approximation on the reports.
Relevance:
Used as part of the calculation of energy used for walking in the pasture
eaten calculation
The weighted average DIM for each calving period is used to calculate
DIM for the season
This is a useful benchmarked KPI
Recommendation:
Where there is no good data readily available an estimate can be made
for Days in milk (see manual calculation methods).
Farms with MINDA Pro or good electronic monitoring and up to date
records can often generate an accurate Days in milk directly from their
own reports.
Often what the farmer perceives as their days in milk is different from
the actual. It is not the difference in days between the planned start of
calving and the drying of date for the herd.

L2 Training Guide – April, 2015 20
In simple cases the calculation table can be used to estimate days in
milk figures.
For Non-standard calving numbers/dates or if the autumn calving
numbers and dates are different the following autumn please contact
DairyBase.
13.4 Days in Milk – Spring/Autumn - Cow Drying Off & Wastage
Calendar
The Days in Milk calculation table allows calculation of DIM by using the
date and number of animals removed from the milking herd during the
season for each period (Spring and autumn)
Click “calc” to display
the Days in Milk
calculator

L2 Training Guide – April, 2015 21
Relevance:
Allows for a profile of cows leaving the milking herd to be easily
established.
Used with the mid-point of calving and number of cows calving to
calculate the average days in milk for the herd.
Recommendation:
Cows culled and died information can be gained from the MINDA
Removed Animals Report. Sort by Removal Date.
The LIC DairyBase report can be used for this information.
Only enter removal event up to the last date animals are dried off
otherwise it is possible to double count the removal of cows (i.e. cows
that may have been dried off and then later culled/died).
13.5 Number of carryover cows at the start of the season (1st June)
This measure refers to the number of cows that calved in spring of the
previous season still in-milk at the beginning of the current season (1st
June). This measure enables DairyBase to assess the frequency of
farms with extended lactations.
Use “Add New” to add
lines for each animal
removal event
Enter the date of each
removal event and the
number of animals
removed from the milking
herd
Click “Calculate” once
all removal events up
to the final drying off
date have been
entered
Can just make cows to
calve the number at PSC
and not worry about the
losses before calving
L2 Training Guide – April, 2015 22
13.6 Number of carryover cows at the end of the season (31st May)
This measure refers to the number of cows that calved in spring of the
current season still in-milk on 31st May. This measure enables DairyBase
to assess the frequency of farms with extended lactations.
Section 14 – Young stock grazed on effective (milking) area
This is the number of young stock that are grazed ON the effective milking
area.
Relevance:
This information is used to estimate the feed eaten by young stock
grazed on the milking area which is then added to the feed eaten by
milking cows so Total feed eaten on the milking area can be calculated.
An estimate is made of the hectares required to provide this feed.
Essential for calculating Effective young stock area.
Essential for calculating Pasture eaten.
Recommendation:
Always confirm that the information provided relates to the young stock
that are grazed ON the milking area.
14.1 Rising one-year olds
Rising one year olds are defined as animals from 3 months of age
(weaning) to 10 months of age. The number of animals and the number of
months on the effective milking area should be recorded.
Relevance:
Identifies the amount eaten by Rising one year olds on the effective
milking area.
Essential for calculating effective young stock area.
Essential for calculating pasture eaten.
Recommendation:

L2 Training Guide – April, 2015 23
Can only be on the effective area for 7 months maximum (3-10 months)
If older than 10 months then record the extra as rising two-year olds:
e.g. if animals 3 to 11 months of age are grazed on farm, the number of
animals is entered in “Rising one-year olds” for a period of 7 months,
and in “Rising two-year olds” for a period of 1 month.
14.2 Rising two-year olds
Rising two year olds are defined as animals from 11 months of age
(weaning) to 10 months of age. The number of animals and the number of
months on the effective milking area should be recorded.
Relevance:
Identifies the amount eaten by rising two year olds on the effective
milking area.
Essential for calculating effective young stock area.
Essential for calculating pasture eaten.
Recommendation:
Remember to include carry over cows or other dry stock (bulls) that may
be on the effective milking area during the year.
Include Rising two year old heifers that come home early (prior to 22
months of age – after 22 months of age they are considered part of the
herd to calve).
e.g. if animals 20 months to 23 months of age are grazed on farm, the
number of animals is entered in “Rising two-year olds” for a period of 2
months, after 22 months they are considered part of the herd that is to
be milked.
Section 15 – Grazing off dry cows
This records the number of dry cows grazed away from the effective milking
area, the total number of days the cows were away for. The amount of feed
offered and the average MJME/Kg DM and utilisation are also recorded.

L2 Training Guide – April, 2015 24
This information is used to identify the amount of feed eaten by dry cows
that is not grown on the effective milking area.
Relevance:
Essential for calculating pasture eaten
Used in the calculation of the KPI “Grazing off dry cows eaten” and
“Imported supplements & grazing eaten”
Recommendation:
Remember to include Rising two year old heifers after 22 months of age
if they are still away at grazing
Where different mobs of cows go away to grazing (or come home) at
different times record the groups separately using the Add New button
15.1 Number of cows
This is the number of dry cows grazed away from the milking area from 1
June to 31 May, including in-calf heifers over 22 months of age.
Relevance:
Essential for calculating Pasture eaten
Used in the calculation of the KPI “Grazing off dry cows eaten” and
“Imported supplements & grazing eaten”
Recommendation:
Remember to include in-calf heifers over the age of 22 months
Where different mobs of cows go away to grazing (or come home) at
different times record the groups separately using the Add New button
Carry over cows that are away at grazing all year should not be included
as cows grazed off – they are considered to be young (dry) stock grazed
off and so are not required for any pasture eaten (on the milking area)
calculations

L2 Training Guide – April, 2015 25
15.2 Total days grazed away from milking area
This is the number of days the dry cows are away from the milking area
from June 1 to 31 May, includes in-calf heifers over 22 months of age.
Relevance:
Essential for calculating pasture eaten.
Used as part of the calculation to identify the amount of feed eaten by
dry cows that was not grown on the effective area.
Used in the calculation of the KPI “Grazing off dry cows eaten” and
“Imported supplements & grazing eaten”.
Recommendation:
If cows are gradually sent or brought back between grazing and milking
platform use average length of time for herd or record the different mobs
separately.
Important to consider cows grazed off at the beginning of year from 1
June to calving and cows grazed off following drying off prior to 31 May.
Check when R2 heifers come back home.
15.3 kgDM/cow/day offered
This is the kgDM of feed offered while cows are grazed off, including grass and
supplement.
Relevance:
Used as part of the calculation to identify the amount of feed eaten by
dry cows that was not grown on the effective area.
Used in the calculation of the KPI “Grazing off dry cows eaten” and
“Imported supplements & grazing eaten”.
Recommendation:
Refer to table in questionnaire. Did cows hold condition or gain weight?
To estimate the amount of feed offered refer to table in questionnaire

L2 Training Guide – April, 2015 26
E.g. To verify the amount of feed offered ask the question “did the
cows hold condition or gained weight?” Use the table as a guide
to then estimated feed offered.
Consider the Kg DM per cow per day offered in conjunction with the
utilisation to ensure the correct intake per cow is estimated
15.4 Average MJME/kgDM
This should reflect the average MJME (Mega Joules of Metabolisable Energy)
per Kg DM of all feeds eaten at grazing including supplement.
Relevance:
Used as part of the calculation to identify the amount of feed eaten by
dry cows that was not grown on the effective area
Used in the calculation of the KPI “Grazing off dry cows eaten” and
“Imported supplements & grazing eaten”
Has a significant influence on the Pasture eaten calculation
Recommendation:
Use 11ME for pasture.
Use a weighted average of the feeds offered, e.g. fFeed offered is 3 kg
DM silage and 7 kg DM pasture the average ME of the feed would be ((3
*10.5)+(7*11)) ÷ 10 kg DM = 10.85 MJME.
15.5 Utilisation %
This should reflect the Percentage of feed offered that is actually eaten.
Relevance:
Used in conjunction with Kg DM offered per cow per day to calculate
actual feed eaten per cow per day.
Used as part of the calculation to identify the amount of feed eaten by
dry cows that was not grown on the effective area.
Used in the calculation of the KPI “Grazing off dry cows eaten” and
“Imported supplements & grazing eaten”.
L2 Training Guide – April, 2015 27
Can have a significant influence on Pasture eaten calculation.
Recommendation:
Use 85% for pasture unless very wet.
Use the guidelines in DairyNZ Facts and Figures for NZ Dairy farmers
page 22-23.
Section 16 – Crops grazed & feed harvested on effective
area
16.1 Area harvested for hay & silage (ha)
This is the area of the milking area that was harvested for pasture or lucerne
Hay & Silage.
Relevance:
Used to calculate Percent of farm harvested for hay & silage.
Recommendation:
If more than one cut is taken from same area count each cut separately
e.g. 10ha X 3 cuts = 30ha.
Can estimate area harvested if the tonnes of silage or number of bales of
hay harvested is known e.g.:
100 15 bale equivalents of baleage were known
100 bales x 15 bale eq * 15 kg DM per bale eq = 22500 kg DM
harvested (or 22.5 tonnes)
The average silage crop at harvesting is between 2-3 Tonnes of
DM per ha, so 22.5 T DM ÷ 2.5 T DM per ha = 9 ha
Page 26 DairyNZ Facts and Figures for New Zealand Dairy Farmers has
some useful data for calculating the quantity of feed in a stack or in bales
Ask if the harvested pasture was a heavy crop (3 T DM per ha) or light
crop (less than 2 T DM per ha)

L2 Training Guide – April, 2015 28
16.2 Harvest crop (ha)
Harvest crop (ha) reports the crops grown on the effective milking area that
are harvested by machines, such as maize or cereal crops. Harvested crops
are not grazed directly by animals.
Relevance:
Used to calculate Percent of Farm area used to grow harvested crops.
Recommendation:
Only include harvested crops that are grown on the defined Milking area.
Crops grown on support land or areas that are not grazed by in milk
cows during the year should be omitted.
16.3 Feed Exported (TDM)
This is feed that was grown and harvested on the milking platform that was
not fed out in the year it is grown. Feed can be exported to another year or
another place.
Relevance:
Used to calculate the KPI “Feed exported”.
Contributes to the calculation for the KPI Pasture eaten.
Recommendation:
Feed harvested off the milking area that is put in to storage is deemed to
be “Feed exported” ie it is exported to another season.
Feed taken from the milking area and sold or fed out elsewhere, (eg
support block), is deemed to be Feed exported ie it is exported to
another place.
If all feed harvested from the milking area in a year is fed out again on
the milking area in that same season then no feed home grown feed is
exported.
Where a particular feed type is on hand at start, some is grown on the

L2 Training Guide – April, 2015 29
milking area, some is also imported/purchased from elsewhere, and
some is still on hand at the end, assume the following:
Feed on hand at start is eaten first
Then feed grown on the milking area
Then feed imported/purchase from elsewhere
This means that the feed on hand at the end will be coming from the
purchased feed first and exported feed last
o Eg Farmer has 130 T DM silage on hand at the start, grows 150 T
DM on the milking area during the season, purchased 20 T DM
and has 150 T DM on hand at the end of the year. Record this as
follows
130 T DM on hand is imported feed fed
130 T DM feed exported
150 T DM feed on hand at end ( made up of 130 T DM
exported feed and 20 T DM of the purchased feed not fed)
If the farmer is able to provide for each feed type exact data about the
source and destination for each lot of feed then record the data as
provided
16.3 Summer crop grazed by dairy cows (ha)
This is the hectares of the effective milking area that was used to grow
summer crops that were grazed by the stock (herd and young stock) during
the season. Eg Turnips, chicory.
Relevance:
Used to calculate Percent of Farm area used to grow grazed summer
crops.
Recommendation:
Only include crops grown on the effective milking area that are grazed by
cows or young stock on the milking area.
L2 Training Guide – April, 2015 30
16.4 Winter crop grazed by dairy cows (ha)
This is Hectares of effective milking area that are used to grow winter crops.
Relevance:
Used to calculate Percent of Farm area used to grow winter crop.
Recommendation:
Only include winter crop area which is grazed in the season you are
collecting information for.
Paddocks which may be out for planting for the following season should
be excluded.
Areas in winter crop that are out of the milking rotation for the whole year
should not be included. Ie are not grazed by in milk cows at all during the
year. These areas should be deducted from the effective milking area
and added to the Support Block area.
Section 17 – Imported supplements fed out on effective
area during season
17.1 Imported supplements fed out on effective area during season
This identifies the amount of feed (in tonnes of dry matter), that is eaten by
stock, (the herd and any young stock), while they are on the effective area,
that was not grown on the effective area in the season being analysed. This
includes:
Feed fed out on the milking area that has come from another location.
Feed fed out on the milking area that comes from another season (ie
supplements on hand at the start of the season that are fed out during
the year).
Relevance:
Essential for calculating Pasture Eaten.
Used in the calculation of the following KPI’s under Feed Eaten on the

L2 Training Guide – April, 2015 31
Physical detail report:
- Pasture & Crop eaten MJME/ha.
- Pasture & Crop eaten t DM/ha.
- Imported supplements eaten t DM/ha.
- Imported supplements eaten kg DM/cow.
- Imported supplements & grazing eaten kg DM/cow.
- Average utilisation imported supplement.
- Average ME imported supplements MJ/kgDM.
Recommendation:
Feed made on the milking area, that is not fed out in the season it is
made, needs to be entered under feed exported.
Feed made on the milking area and fed elsewhere (ie on a support
block) needs to be entered under feed exported.
Feed made on the milking area and sold needs to be entered under
feed exported.
Where there is feed on hand at the start of the season, assume this is
fed out first as imported feed.
If possible, where there is purchased/imported feed and home grown
feed of the same type, assume home grown supplements are all fed out
first in the season that they are grown, (to minimise Feed exported)
Where feed is imported and not all fed out in the same season only enter
the amount fed.
Where there are feeds imported that are not on the list, enter them under
Other or select a similar type feed and amend the MJME and the
utilisation eg cotton seed meal can be entered under soybean meal.
Where feeds are entered under a different heading eg cotton seed meal
instead of soybean meal, make a note in the comments section and in
farm notes.
Refer to imported supplements table for DM%, MJME and utilisation of
feeds.
Refer to DairyNZ Facts and Figures for New Zealand Dairy Farmers
Page 19-23 for further information regarding feed values and wastage.
L2 Training Guide – April, 2015 32
Many farmers will have this information in a Dairy diary. Alternately their
cash book may provide information of feed purchased and contractors
used to make feed.
Always check the utilization and MJME of each feed as a small variation
can have a significant impact on Pasture eaten, particularly if the amount
of imported feed is relatively large.
Always check that the feed information is for tonnes of dry matter and
not wet matter. Feeds such as PKE, Grain, Concentrates, molasses,
Proliq, and by-products (Broll or Brewers Grain) are often sold as wet
tonnes.
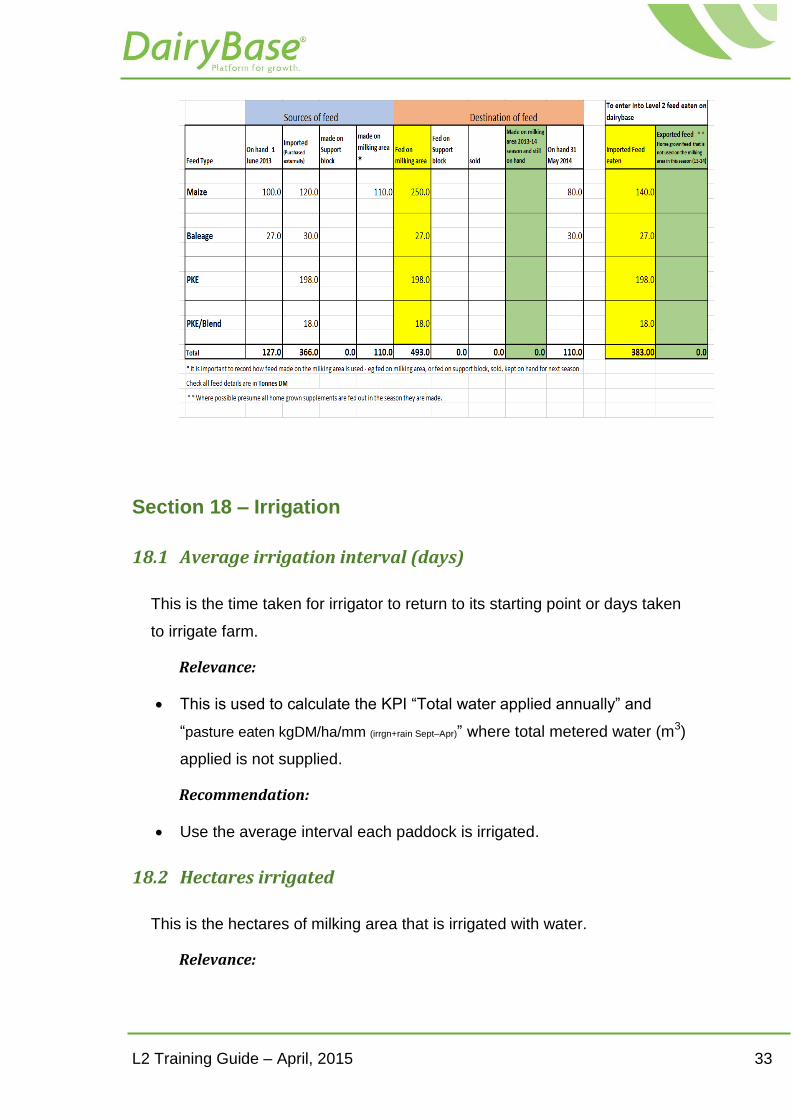
A template for a table to assist with identifying where feed has come
from, where it has gone and what imported feed was actually eaten
during the year has been developed for Dairybase contractors. The
completed example below demonstrates how to use the table. Deal with
each feed one at a time:
John has 100 t DM maize silage at the start of the season. He feeds 30 t DM in
the spring and then the rest in Feb/March. He grows 5ha of maize silage on the
farm (22tDM/ha) and buys in another 120 t DM from a local contractor. At the
end of the year he has 80 t DM maize silage left in the stack for next spring.
No grass silage was made on farm this year to replace the 27 t DM (150
bales/12Beq) they had at the start of the year to feed over winter so they
bought another 30 t DM from BOP for next winter.
220 t PKE was bought and fed with the maize throughout the year.
When the R2 heifers came home early from their grazing (1st April) John bought
20 t PKE/blend product to help put on weight.
L2 Training Guide – April, 2015 33
Section 18 – Irrigation
18.1 Average irrigation interval (days)
This is the time taken for irrigator to return to its starting point or days taken
to irrigate farm.
Relevance:
This is used to calculate the KPI “Total water applied annually” and
“pasture eaten kgDM/ha/mm (irrgn+rain Sept–Apr)” where total metered water (m3)
applied is not supplied.
Recommendation:
Use the average interval each paddock is irrigated.
18.2 Hectares irrigated
This is the hectares of milking area that is irrigated with water.
Relevance:
L2 Training Guide – April, 2015 34
This is used to calculate the KPI “Total water applied annually” and
pasture eaten kgDM/ha/mm"(irrgn+rain Sept–Apr) and “Percent of effective area
irrigated %”.
Recommendation:
This must be equal to or less than effective milking area.
Effluent sprayed area is not considered to be irrigated. Only include
effluent sprayed areas if they are also irrigated with water.
18.3 Days of the season irrigated
This is the number of days that irrigation occurs on the effective milking area.
Relevance:
This is used to calculate the KPI “Total water applied annually” and
“pasture eaten kgDM/ha/mm (irrgn+rain Sept–Apr).”
Recommendation:
Refer to water meter records
If water pumped from a well refer to electricity records which may
indicate days pump in use
Some Regional Councils require detailed irrigation records. This
information is ideal for answering this question
18.4 Total metered water (m3) – preferred
This is the total metered water (m3) applied to the milking area during the
season.
Relevance:
This is used to calculate the KPI “Total water applied annually” and
“pasture eaten kgDM/ha/mm (irrgn+rain Sept–Apr)”.
Recommendation:
This is taken from the water meter.
This is the preferred measurement to use.

L2 Training Guide – April, 2015 35
Only irrigation applied to milking area is of interest and reported so if
total metered water includes irrigation for other areas this needs to be
considered and deducted.
Some Regional Councils require detailed irrigation records. If available,
use this information to answer this question.
18.5 OR Instantaneous flow rate (l/sec/ha)
This is the Instantaneous flow rate (l/sec/ha) for irrigation applied to the
milking area during the season.
Relevance:
This is used to calculate the KPI “Total water applied annually” and
“pasture eaten kgDM/ha/mm (irrgn+rain Sept–Apr)” in conjunction with
days of season irrigated, hectares irrigated and average irrigation
interval where total metered water is not able to be supplied directly
Recommendation:
Only use this metric if total metered water (m3) is not available
18.6 OR Flow rate (bore/borderdyke) (l/sec)
This is the flow rate (l/sec) for bore or Borderdyke irrigation applied to the
milking area during the season.
Relevance:
This is used to calculate the KPI “Total water applied annually” and
“pasture eaten kgDM/ha/mm (irrgn+rain Sept–Apr)” in conjunction with
days of season irrigated, hectares irrigated and average irrigation
interval where total metered water is not able to be supplied directly
Recommendation:
Only use this metric if total metered water (m3) is not available
Section 19 – General comments e.g. major flood, dried off
L2 Training Guide – April, 2015 36
early, first year conversion – Optional
19.1 General comments
This area is used to record major events/decisions that influenced the year’s
production and results.
Relevance:
Adds context to the information contained in the DairyBase report.
Recommendation:
Include information relating to any feed made or imported that is carried
over to add clarity the imported feeds fed out KPI.
Record any major events like floods or drought.
Information such as “First year of conversion” can be useful.
Section 20 – Fertilisers and soils
20.1 Soil Test Information
Relevance:
Provides information about the soil fertility of the effective milking area
Recommendation:
If there are soil test results for more than one area of the farm use a
weighted average, e.g. for a 100 ha farm with four different samples for
Sulphate-S
20 ha = 5
30 ha = 7
10 ha = 3
40 ha = 4
The average Sulphate-S = ((20x5) + (30x7) + (10x3) + (40*4)) ÷
(20+30+10+40) = 5
20.1.1 Soil test pH
L2 Training Guide – April, 2015 37
This is the average soil PH for the milking area. This is a measure of soil
acidity and is from soil test data measured at 75mm.
Relevance:
This is used for the KPI “Soil pH”.
This KPI is for the farmer’s information only. It does not contribute to
benchmarks.
Recommendation:
If there are soil test results for more than one area of the farm use a
weighted average.
Use soil test results.
20.1.2 Olsen P (ave)
This is the average soil Olsen P for the milking area. This is a measure of
Phosphorus (P) available for the plant and is from soil test data measured at
75mm deep.
Relevance:
This is used for the KPI “Olsen P”.
This KPI is for the farmer’s information only. It does not contribute to
benchmarks.
Recommendation:
If there are soil test results for more than one area of the farm use a
weighted average.
Use soil test results.
20.1.3 Quick Test Mg – Magnesium
L2 Training Guide – April, 2015 38
This is the average soil Magnesium for the milking area. This is a measure of
Magnesium (Mg) available for the plant and is from soil test data measured
at 75mm.
Relevance:
This is used for the KPI “Quick test Mg - Magnesium (average)”.
This KPI is for the farmer’s information only. It does not contribute to
benchmarks.
Recommendation:
If there are soil test results for more than one area of the farm use a
weighted average .
Use soil test results for Quick Test Mg – Magnesium (MAF values).
If the MAF value is not available conversions are available via the
fertiliser company.
20.1.4 Quick Test K – Potassium
This is the average soil potassium for the milking area. This is a measure of
This is a measure of Potassium (K) available for the plant and is from soil
test data measured at 75mm.
Relevance:
This is used for the KPI “Quick test K - Potassium (average)”.
This KPI is for the farmer’s information only. It does not contribute to
benchmarks.
Recommendation:
If there are soil test results for more than one area of the farm use a
weighted average .
Use soil test results for Quick Test K – Potassium (MAF values).
If the MAF value is not available conversions are available via the
fertiliser company.

L2 Training Guide – April, 2015 39
20.1.5 Soil test Sulphate S
The Soil test Sulphate S is a measure of Sulphate (S) available immediately for
the plant and is from soil test data measured at 75mm. This is recorded for the
effective milking area.
Relevance:
This is used for the KPI “Sulphate-S (average)”.
This KPI is for the farmer’s information only. It does not contribute to
benchmarks.
Recommendation:
If there are soil test results for more than one area of the farm use a
weighted average.
Use soil test results for Sulphate-S (MAF values).
If the MAF value is not available conversions are available via the
fertiliser company.
20.2 Fertiliser application record
This is all fertiliser applied to the effective milking area, including fertiliser
applied to crop areas.
20.2.1 Nitrogen (N)
This is the Kilograms of Nitrogen (N) applied to the milking area for the
season. It excludes natural application through cow urea or effluent
application.
Relevance:
Used for the KPI “Nitrogen applied for year”
Contributes to benchmarks
Recommendation:
Use fertiliser statements/spreading statements from the fertiliser
company.

L2 Training Guide – April, 2015 40
Ensure that the amounts applied are for the Effective milking area only
(exclude applications to support blocks and non-dairy areas) .
Ensure that it is the nitrogen component that is recorded and not the
amount of product (eg 1 Tonne of Urea is only 0.46 Tonne of N).
The information can be entered as total Kg N applied using the fertiliser
calculator or as N per ha (from Fertiliser company data).
20.2.2 Phosphorus (P)
This is the amount of Phosphorus (P) applied to the effective milking area.
Relevance:
Used for the KPI “Phosphorus applied for year”.
This KPI is for the farmer’s information only. It does not contribute to
benchmarks.
Recommendation:
Use fertiliser statements/spreading statements from the fertiliser
company
Ensure that the amounts applied are for the Effective milking area only
(exclude applications to support blocks and non-dairy areas)
The information can be entered as total Kg P applied using the fertiliser
calculator or as P per ha (from Fertiliser company data)
20.2.3 Potassium (K) (Kg/Ha)
This is the amount of Potassium (K) applied to the effective milking area.
Relevance:
Used for the KPI “Potassium applied for year”.
This KPI is for the farmer’s information only. It does not contribute to
benchmarks.
Recommendation:

L2 Training Guide – April, 2015 41
Use fertiliser statements/spreading statements from the fertiliser
company.
Ensure that the amounts applied are for the Effective milking area only
(exclude applications to support blocks and non-dairy areas).
The information can be entered as total Kg K applied using the fertiliser
calculator or as K per ha (from Fertiliser company data).
20.2.4 Sulphur (S) (Kg/Ha)
This is the amount of Sulphur (S) applied to the effective milking area.
Relevance:
Used for the KPI “Sulphur applied for year”.
This KPI is for the farmer’s information only. It does not contribute to
benchmarks.
Recommendation:
Use fertiliser statements/spreading statements from the fertiliser
company.
Ensure that the amounts applied are for the Effective milking area only
(exclude applications to support blocks and non-dairy areas).
The information can be entered as total Kg S applied using the fertiliser
calculator or as S per ha (from Fertiliser company data).
20.2.5 Magnesium (Mg) (Kg/ha)
This is the amount of Magnesium (Mg) applied to the effective milking area.
Relevance:
Used for the KPI “Magnesium applied for year”.
This KPI is for the farmer’s information only. It does not contribute to
benchmarks.
Recommendation:
L2 Training Guide – April, 2015 42
Use fertiliser statements/spreading statements from the fertiliser
company.
Ensure that the amounts applied are for the Effective milking area only
(exclude applications to support blocks and non-dairy areas).
The information can be entered as total Kg Mg applied using the fertiliser
calculator or as Mg per ha (from Fertiliser company data).
20.2.5 Lime (kg/ha)
This is the amount of lime applied to the effective milking area.
Relevance:
Used for the KPI “Lime applied for year” .
This KPI is for the farmer’s information only. It does not contribute to
benchmarks.
Recommendation:
Lime is likely to be applied in tonnes/ha. Check the correct units have
been entered.
Use fertiliser statements/spreading statements from the fertiliser
company.
Ensure that the amounts applied are for the Effective milking area only
(exclude applications to support blocks and non-dairy areas).
20.2.6 Fertiliser calculator
If a specific product is not listed in the DairyBase fertiliser calculators,
record the manufacturer, name of the product and composition (if
available) and send this information to the DairyBase support centre so
the product is added to the list of fertilisers in DairyBase.

L2 Training Guide – April, 2015 43
Section 21 – Calving and Mating
Most of this information can be found in the InCalf Fertility Focus report.
21.1 Planned start of calving
This is the Planned Start of Calving (PSC) for mixed age cows.
Relevance:
Used for the KPI “Planned Start of Calving (PSC)”.
This KPI is for the farmer’s information only. It does not contribute to
benchmarks.
Recommendation:
Use the planned start of calving date for the mixed age cows (and not
the R2 heifers).
Available from an InCalf Fertility Focus report.
21.2 Planned start of mating (PSM)
This is the Planned Start of Mating (PSM) for mixed age cows.
Relevance:
Used for the KPI “Planned Start of Mating (PSM)”.
This KPI is for the farmer’s information only. It does not contribute to
benchmarks.
Recommendation:
Use the date for mixed age cows only, (not yearling mating’s).
Available from the mating report or InCalf Fertility Focus report.
21.3 Date AB finished
This is the date that AB finished for the season.
Relevance:

L2 Training Guide – April, 2015 44
Used for the KPI “Length of AB”.
This KPI is for the farmer’s information only. It does not contribute to
benchmarks.
Recommendation:
If no AB used, enter date bull withdrawn
Available from mating report or from InCalf Fertility Focus Report page 2
21.4 Date bull withdrawn from herd
This is the date the bull/bulls are withdrawn from the herd.
Relevance:
Used for the KPI “Length of total mating”.
This KPI is for the farmer’s information only. It does not contribute to
benchmarks.
Recommendation:
If the bull is left with herd for the remainder of season enter the date
which matches culling criteria for calving date.
21.5 Number MA cows confirmed empty
This is the number of cows confirmed empty before next calving.
Relevance:
Used for the KPI “Empty rate”.
This KPI is for the farmer’s information only. It does not contribute to
benchmarks.
This KPI is compared with industry Targets.
Recommendation:
Note this is the number of cows confirmed empty (not necessarily culled
empty)
21.6 Number of cows calved at 21 days after PSC of the herd

L2 Training Guide – April, 2015 45
(spring calving cows)
This is the number of cows and R 2 heifers calved 21 days (3 weeks) from
PSC.
Relevance:
This is compared with the total cows and R 2 Heifers to calve to give the
KPI “% Calved by week 3”.
This KPI is for the farmer’s information only. It does not contribute to
benchmarks.
This KPI is compared with industry Targets and can be used to identify
calving and mating issues on farm.
Recommendation:
This information is available from a calving report or as a % from the
InCalf Fertility Focus Report
It can be recorded as the number of cows calved or as a %. It is not
necessary to record both
21.7 Number of cows calved at 42 days after PSC of the herd
(spring calving cows)
This is the number of cows and R 2 heifers calved 42 days (6 weeks) from
PSC.
Relevance:
This is compared with the total cows and R 2 Heifers to calve to give the
KPI “% Calved by week 6”.
This KPI is for the farmer’s information only. It does not contribute to
benchmarks.
This KPI is compared with industry Targets and can be used to identify
calving and mating issues on farm.
Recommendation:
L2 Training Guide – April, 2015 46
This information is available from a calving report or as a % from the
InCalf Fertility Focus Report.
It can be recorded as the number of cows calved or as a %. It is not
necessary to record both.
21.8 Number of cows calved at 63 days after PSC of the herd
(spring calving cows)
This is the number of cows and R 2 heifers calved 63 days (9 weeks) from
PSC.
Relevance:
This is compared with the total cows and R 2 Heifers to calve to give the
KPI “% Calved by week 9”.
This KPI is for the farmer’s information only. It does not contribute to
benchmarks.
This KPI is compared with industry Targets and can be used to identify
calving and mating issues on farm.
Recommendation:
This information is available from a calving report or as a % from the
InCalf Fertility Focus Report.
It can be recorded as the number of cows calved or as a %. It is not
necessary to record both.
21.9 Number of cows induced
This is the Number of cows induced (or % from Incalf Fertility Focus Report).
Relevance:
Used for the KPI “% Cows induced to calve”.
This KPI is for the farmer’s information only. It does not contribute to
benchmarks.

L2 Training Guide – April, 2015 47
Recommendation:
Can be found on the InCalf Fertility Focus report, if it has been recorded.
It can be recorded as the number of cows induced or as a %. It is not
necessary to record both.
21.10 Number of cows mated at least once in 21 days from PSM
This is the number of cows mated once, within 21 days from Planned Start of
Mating (PSM).
Relevance:
Used for the KPI “3-week submission rate” which can assist in identifying
herd reproductive issues for a farm.
This KPI is for the farmer’s information only. It does not contribute to
benchmarks.
This KPI is compared with industry Targets.
Recommendation:
This is the number of cows, not number of matings.
This information is available from a Submission Rate Report or the InCalf
Fertility Focus Report.
It can be recorded as the number of cows mated or as a %. It is not
necessary to record both.
21.11 Number of cows treated from anoestrus
This is the number of cows treated once or more for anoestrus (or % from
the InCalf Fertility Focus Report).
Relevance:
Used for the KPI “% Cows treated for non-cycling” which can assist in
identifying herd reproductive issues for a farm.
This KPI is for the farmer’s information only. It does not contribute to
benchmarks.
Recommendation:

L2 Training Guide – April, 2015 48
This is the number of cows treated once or more (and not the number of
treatments).
This can be found on the InCalf Fertility Focus report, if it has been
recorded.
This data is not always recorded for herd records so it may be necessary
to look at vet invoices for the appropriate months.
It can be recorded as the number of cows treated for anoestrus or as a
%. It is not necessary to record both.
21.12 6-week in-calf rate (% of herd in calf at 6 weeks)
This is the % of the herd vetted as in calf from the first 6 weeks of mating.
Relevance:
Used for the KPI “6-week in-calf rate, Actual (A) or Estimated (E)”.
This KPI is for the farmer’s information only. It does not contribute to
benchmarks.
This KPI is compared with industry Targets and can be used to identify
calving and mating issues on farm.
Recommendation:
Obtain either from dated pregnancy diagnosis data, or as % from the
InCalf Fertility Focus Report.
If the data is not based on pregnancy test results the InCalf report will
state this so record the data as estimated (E) not Actual (A).
It is not the 6 week calving rate.
Section 22 – Mastitis and Lameness
22.1 Average bulk milk somatic cell count (for season)
L2 Training Guide – April, 2015 49
This is the Average Daily Bulk Milk Somatic Cell Count for the season as
recorded by the Dairy Company.
Relevance:
This information is used in the KPI “Average bulk milk SCC” and can be
used to assist in identifying issues with Somatic Cell Count on the farm.
This KPI is for the farmer’s information only. It does not contribute to
benchmarks.
This KPI is compared with industry Targets.
Recommendation:
This information can be obtained from final dairy company statement of
the year or from the dairy company website.
It is the daily average bulk somatic cell count for the year (not the
Monthly average or 10 day average).
Herd test Somatic cell count data is not indicative of the herd bulk
Somatic cell count and should not be used.
22.2 Cows lame
This is the number of cows treated one or more times for lameness during
the season. This KPI is for the farmer’s information only and it is not
benchmark but compared against industry targets.
Relevance:
This information is used in the KPI “Cows treated for lameness” and can
be used to assist in identifying issues with lameness on the farm..
Recommendation:
Refer to animal treatment records or Health Detail Form.
Record only the number of cows treated one or more times eg one cow
treated 3 times counts as one cow.
Treatment includes one or more of the following: removal from the herd,
treatment with antibiotics, trimming/ individual care of hooves.
22.3 Total number of cases of clinical mastitis during the season
L2 Training Guide – April, 2015 50
This is the total number of clinical cases of mastitis in the season. A “case”
is defined as the initiation of a course of treatment (note farmers usually
record at a cow and quarter basis).
Relevance:
This information is used in the KPI “Total cases of clinical mastitis during
the season” and can be used to assist in identifying issues with mastitis
on the farm.
This KPI is for the farmer’s information only. It does not contribute to
benchmarks.
This KPI is compared with industry targets.
Recommendation:
Refer to animal treatment records, health detail form, Fonterra Dairy
Diary or equivalent.
Section 23 – Wastage and replacements
23.1 Number of cows and R2 heifers at the start of season
This is the number of in-calf cows and rising 2 year old heifers on hand at the
start of calving that are intended to be milked.
Relevance:
This information contributes to the KPI “Cows milked 1 Dec as % of
opening cows”.
This KPI is for the farmer’s information only. It does not contribute to
benchmarks.
This KPI is compared with industry targets.
This information measures the wastage of the whole herd (Cows and R 2
heifers to calve) from calving through to the beginning of December,
(the peak lactation period for seasonal farms).
Recommendation:

L2 Training Guide – April, 2015 51
The closing Livestock on Hand in financial statements for the year prior
to the one being analysed, (if balance date is 31 May), can provide this
information.
Information can be obtained from herd summary report.
This number should be the same as or more than Peak cows milked,
(unless more cows were purchased after the start of calving).
Check against Cows removed from herd data to verif.y
23.2 Number of R2 heifers at the start of season
This is the number of in-calf R 2 heifers on hand at the start of calving that
are intended to be milked.
Relevance:
This information is compared with “Number of R2 heifers at the start of
season and still in the herd at the end of season” to measure wastage of
animals in that age group.
Contributes to the KPI “1st calvers on farm end of season %”.
Contributes to the KPI “Percent herd entering as heifers”.
These KPI’s are for the farmer’s information only. They do not contribute
to benchmarks.
This KPI is compared with industry targets.
Recommendation:
Information can be obtained from herd summary report.
The closing Livestock on Hand in financial statements for the year prior
to the one being analysed, (if balance date is 31 May), can provide this
information.
Exclude R 2 heifers on hand at the start of the season that are intended
for sale (i.e. not intended to be part of the milking herd).
23.3 Number of R2 heifers at the start of season and still in the
herd at the end of season

L2 Training Guide – April, 2015 52
This is the number of R 2 heifers that entered the herd at the start of the
season that are still in the herd at the end of the season and intended to be
milked as 3 year olds.
Relevance:
This information is compared with “Number of R2 heifers at the start of
season” to measure wastage of animals in that age group.
Contributes to the KPI “1st calvers on farm end of season %”.
This KPI is for the farmer’s information only. It does not contribute to
benchmarks.
This KPI is compared with industry Targets.
Recommendation:
This information can be obtained from Herd Summary Report (this is
dependent on the information in MINDA being up to date).
A search of MINDA for animals on hand by birth year can provide this
information.
23.4 Number of cows and R2 heifers milking at 1 Dec
This is the number of Cows/2 year old heifers in milk at December 1.
Relevance:
This information contributes to the KPI “Cows milked 1 Dec as % of
opening cows”.
This information is for the farmer’s information only. It does not
contribute to benchmarks.
This KPI is compared with industry targets.
This information measures the wastage of the whole herd (Cows and R 2
heifers to calve) from calving through to the beginning of December,
(the peak lactation period for seasonal farms).
Recommendation:
Information can be obtained from Herd test data on or near the 1st
December.
L2 Training Guide – April, 2015 53
This number should usually be the same as or less than Peak cows
milked. If it is higher, review the Peak cows milked or see below.
If it is higher due to the addition to the herd of in milk cows after the start
of calving, then make a note in the comments section.
Check against Cows removed from herd data to verify.
23.5 Number of replacement calves reared
This is the number of replacement calves reared, to enter the herd in 2 years’
time. It is the number of Rising 1 year olds on hand at the end of the season.
Relevance:
Can be used to calculate replacement rate.
This information is for the farmer’s information only. It does not
contribute to benchmarks.
Recommendation:
This information can be obtained from Herd Summary Report (this is
dependent on the information in MINDA being up to date).
The closing Livestock on Hand stock in financial statements for the year
being analysed (if balance date is 31 May) can also provide this
information (this is a useful source if the data is being collected several
months after the season end).
Exclude heifer calves reared and sold before the end of the season as
either weaners or rising one year olds.
L2 Training Guide – April, 2015 54
APPENDICES
Appendix 1: Level 2 resource checklist
General
Farm map
Supplementary feed records or invoices of feed purchased
Animal removal report
Herd summary report or stock reconciliation
Group profile report
Financial statements
Final herd test summary
MINDA DairyBase report: Farmers need to ring MINDA (LIC) and ask for
a DairyBase level 2 report for the season data is being collected for. The
farmer’s participant code and pin are needed to get this report.
DairyBase report from MINDA will be available in their LIC online
account. Farmers can download and print this report before the interview
with a DairyBase data collector.
Milk production
Annual dairy company final production statement (or access to dairy
company website)
Milk kept out of the vat (including discarded milk, either for calf rearing or
sold)
December dairy company production statement (or access to dairy
company website)
Dairy company production statement for month peak production/cow
achieved(or access to dairy company website)
Dairy company SCC report (or access to dairy company website)
Feed
Grazing records (to calculate the number of young stock grazed on the
milking area) and cows wintered off.
Supplements purchased and fed out on the effective dairy area
Supplements made on the effective area and where it has gone
Cash manager or equivalent for feed purchased and quantities
Fonterra Dairy Diary (Fonterra Dairy Co)

L2 Training Guide – April, 2015 55
Fertiliser
Soil test reports
Fertiliser statement/application record
Calving and mating – Request LIC ‘DBQ’ report for a summary of LIC
information held
Yellow notebook or Calving report
InCalf Fertility Focus report
Mating report
Submission Rate report
Pregnancy test results
Animal Health
Health detail report or health treatment records
Irrigation
Flow rate/volume used
Irrigation days and interval

L2 Training Guide – April, 2015 56
Sou
rces
of
feed
Des
tin
atio
n o
f fe
ed
Fee
d T
ype
(C
he
ck t
hat
all f
ee
d d
eta
ils a
re in
ton
ne
s o
f D
M)
On
han
d o
n
1 J
un
e
Imp
ort
ed
(Pu
rch
ase
d
ext
ern
ally
)
mad
e o
n
Sup
po
rt
blo
ck
mad
e o
n
milk
ing
are
a
*
Fed
on
milk
ing
are
a
Fed
on
Sup
po
rt
blo
ck
Sold
Mad
e o
n m
ilkin
g
are
a d
uri
ng
the
curr
en
t se
aso
n
and
sti
ll o
n h
and
On
han
d o
n
31
May
Imp
ort
ed
Fee
d e
ate
n
Exp
ort
ed
fe
ed
(Ho
me
gro
wn
fe
ed
that
is n
ot
use
d o
n
the
milk
ing
are
a in
this
se
aso
n)*
*
Mai
ze
Bal
eage
PK
E
PK
E/B
len
d
Tota
l
* It
is im
po
rtan
t to
re
cord
ho
w f
ee
d m
ade
on
th
e m
ilkin
g ar
ea
is u
sed
- e
g fe
d o
n m
ilkin
g ar
ea,
or
fed
on
su
pp
ort
blo
ck, s
old
, ke
pt
on
han
d f
or
ne
xt s
eas
on
* *
Wh
ere
exa
ct d
eta
il is
no
t p
rovi
de
d, p
resu
me
all
fee
d o
n h
and
is f
ed
fir
st, t
he
n h
om
e g
row
n s
up
ple
me
nts
mad
e d
uri
ng
the
se
aso
n a
nd
th
en
pu
rch
ase
d/i
mp
ort
ed
fe
ed
To e
nte
r in
to L
eve
l 2 f
ee
d e
ate
n
on
dai
ryb
ase
Appendix 2: Feed Table Template

L2 Training Guide – April, 2015 57
Appendix 3: Obtaining information from MINDA
MINDA software: The below table categorises the DairyBase information available from MINDA based
on the MINDA reports they are obtained from. Basic instructions on how to run a report
and examples of each report have been obtained from the MINDA08 user manual.
Report group Report name Information available
Event Reports
Health detail - Number of sick cows
- Number of treated lame cows
- Number of cows treated mastitis first 6 weeks
Herd summary report - Age profile of herd
Herd Reports Removed Animals - Deaths & culls
Calving Reports
Calving rate - Number cows calving in spring
- Date when 50% cows calved
- Cows calved at 21, 42, 63 days
Reproductive Analyses
Submission rate report - Cows submitted in 21 days from PSM
- Cows submitted to end AB
Fertility Focus Report - Cows calved at 21, 42, 63 days
- Cows submitted in 21 days from PSM
- MT rate
Obtaining information from existing sources

L2 Training Guide – April, 2015 58

L2 Training Guide – April, 2015 59

L2 Training Guide – April, 2015 60

L2 Training Guide – April, 2015 61
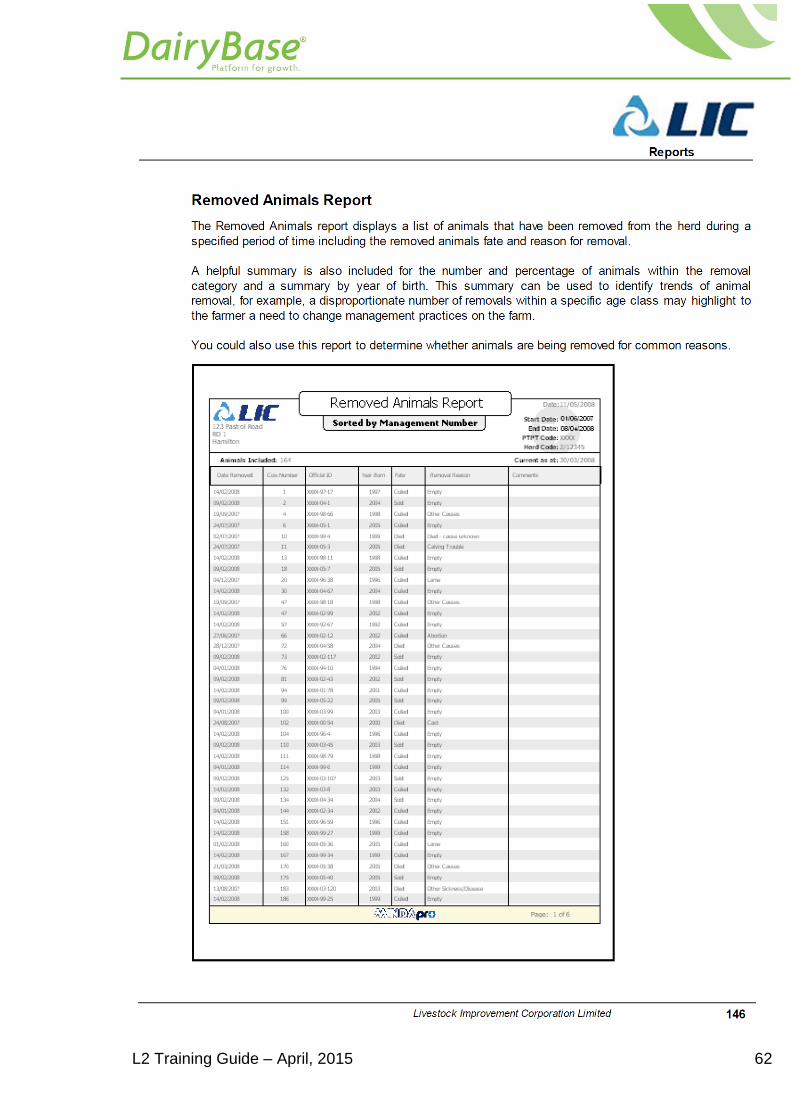
L2 Training Guide – April, 2015 62

L2 Training Guide – April, 2015 63

L2 Training Guide – April, 2015 64

L2 Training Guide – April, 2015 65

L2 Training Guide – April, 2015 66

L2 Training Guide – April, 2015 67

L2 Training Guide – April, 2015 68

L2 Training Guide – April, 2015 69
Appendix 4: DairyBase report from MINDA
DairyBase report from MINDA:
The DairyBase report from MINDA can help to complete some of the questions
of the DairyBase level 2 questionnaire. However, this is not a standard report
from MINDA. To obtain a DairyBase report from MINDA farmers should:
1. Ring MINDA (LIC) and ask for a DairyBase level 2 report for the season
data is being collected for. The farmer’s participant code and pin are
needed to get this report.
2. The DairyBase report from MINDA will be available in their LIC online
account (farmers can download and print this report before the visit to
collect DairyBase data).
Some of the considerations that should be taken into account when using the
DairyBase report from MINDA to complete DairyBase level 2 questionnaire are:
It corresponds to the season data is being collected for.
If the herd was dry-off within 14 days of the last herd test.
If the values reported for breeding worth and production worth include
R2 heifers calving in that season.
When using the DairyBase report from MINDA confirm with the farmer the
values in it before copying them into the level 2 questionnaire.

L2 Training Guide – April, 2015 70
Check that the data source includes all rising 2 year olds calving in
that season. Early season reports may not include the rising 2 year
olds as some farms tag them as they calve. If no better data is
available record this but make a note in the comments section.
Make sure it corresponds to the season data is being collected for
This value can be used to estimate average cow livewegth using
the formula indicated in the DairyBase level 2 questionnaire
If the mean calving date is reported subtract 5 days from the mean
calving date and use that result instead of this value
If the last herd test date was less than 14 days from the herd
dry-off date then use the “days in milk” value and ignore the
information in the “days in milk table” of this report. If the last herd
test date was more than 14 days from the herd dry-off date then
ignore the “days in milk” value and uset the information in the
“days in milk table” of this report (DIM are estimated using the
DairyBase DIM calculator).
Check that there is no double counting of cows culled or dead that
have already been recorded as dried off and that the total number
of cows matches the number of cows at the start of the season

L2 Training Guide – April, 2015 71
DairyBase
Private Bag 3221
Hamilton 3240
Tel: 07 858 3890
Fax: 07 858 3765
Email: [email protected]
http://www.dairynz.co.nz/farm/dairybase/