dairy business of the year winners - university of tasmania · 2015 anz dairy business of the year...
TRANSCRIPT
2015 ANZ Dairy Business of the Year Awards 0
Dairy Business of the
Year Winners
Bill & Jill Chilvers
with Grant & Kim Archer
– ‘Oakdene’
Share Dairy Farmer
of the Year Winners
Grant & Kim Archer

2015 ANZ Dairy Business of the Year 1
2015 ANZ Dairy Business of the Year
& Fonterra Share Dairy Farmer of the Year
Field Day & Farm Walk
Thursday 30th April 2015
Bill & Jill Chilvers with Grant & Kim
Archer at ‘Oakdene’
Program
10:00 a.m. – Morning Tea
10:30 a.m. – Welcome DairyTas
10:40 a.m. – Judges’ Comments Lesley Irvine, TIA & Nigel
Brock, 2014 DBOY Winner
10:50 a.m. – Farm Walk Grant & Kim Archer, Bill &
Jill Chilvers, and Lesley Irvine,
TIA
12:30 p.m. – BBQ Lunch
2015 ANZ Dairy Business of the Year 2
2015 ANZ Dairy Business of the Year -
Sponsors
The ANZ Tasmanian Dairy Business of the Year Awards are organised by the TIA Dairy
Centre and DairyTas. The Award has been made possible by the generous support of the
following:
CORPORATE SPONSOR
Australia and New Zealand Banking Group Ltd
GOLD SPONSORS
Dairy Australia Roberts Ltd Agri Tech
Elphinstone Stevens Pty Ltd My State Limited – Tasmanian Perpetual Trustees
The Australian Dairyfarmer
ADDITIONAL AWARD SPONSORS
Fonterra – Share Dairy Farmer of the Year Award GHD – Sustainability Award
Van Diemen’s Land – Farm Safety Award Cadbury – Young Farmer Encouragement Award
TRADE DISPLAY SPONSOR
TasHerd Pty Ltd
ACKNOWLEDGEMENTS
Data for this award has been collected and analysed using the Dairy Farm Monitor Project
This booklet has been prepared by Alison Hall and Lesley Irvine, TIA Dairy Centre
Disclaimer: This publication has been prepared for the general information of dairy farmers in Tasmania. TIA and the University of Tasmania do not accept any liability for damage caused by, or economic loss arising
from reliance upon information or material contained in this publication.
2015 ANZ Dairy Business of the Year 3

2015 ANZ Dairy Business of the Year 4
Table of Contents 2015 ANZ Dairy Business of the Year .................................................................................................... 1
Field Day & Farm Walk Tuesday April 15th, 2014............................................................................ 1
2015 ANZ Dairy Business of the Year - Sponsors ............................................................................ 2
2015 ANZ Dairy Business of the Year Awards ................................................................................. 5
2015 ANZ Dairy Business of the Year Winners – Bill & Jill Chilvers with Grant & Kim
Archer, ‘Oakdene’ ................................................................................................................................... 6
The Business........................................................................................................................................ 6
The Team ............................................................................................................................................. 7
The System .......................................................................................................................................... 8
Pasture Management .......................................................................................................................... 8
Keys to Success ................................................................................................................................... 8
Judges’ Comments – 2015 ANZ Dairy Business of the Year Award ........................................... 12
Finalists Profiles .................................................................................................................................... 15
2015 Fonterra Share Dairy Farmer of the Year Winners – Grant & Kim Archer, share farming
for Bill & Jill Chilvers ........................................................................................................................... 18
Judges’ Comments – 2015 Fonterra Share Dairy Farmer of the Year .......................................... 20
Share Dairy Farmer – Finalists Profiles ............................................................................................. 22
Milk Production & Milk Price ............................................................................................................ 23
Dairy Benchmarking............................................................................................................................. 24
Introduction ...................................................................................................................................... 24
Tasmanian Dairy Farm Performance ............................................................................................ 24
Herd Size ............................................................................................................................................ 24
Seasonal Conditions ......................................................................................................................... 27
Regional Overview & Farm Analysis ............................................................................................. 30
Farm Income ..................................................................................................................................... 30
Operating Costs ................................................................................................................................ 31
Earnings Before Interest & Tax (EBIT) ....................................................................................... 32
Return on Assets & Equity ............................................................................................................. 32
Risk ..................................................................................................................................................... 33
Cost of Production – Tasmania...................................................................................................... 34
Table of Participants…...…………………………………………………………………36
2015 ANZ Dairy Business of the Year 5
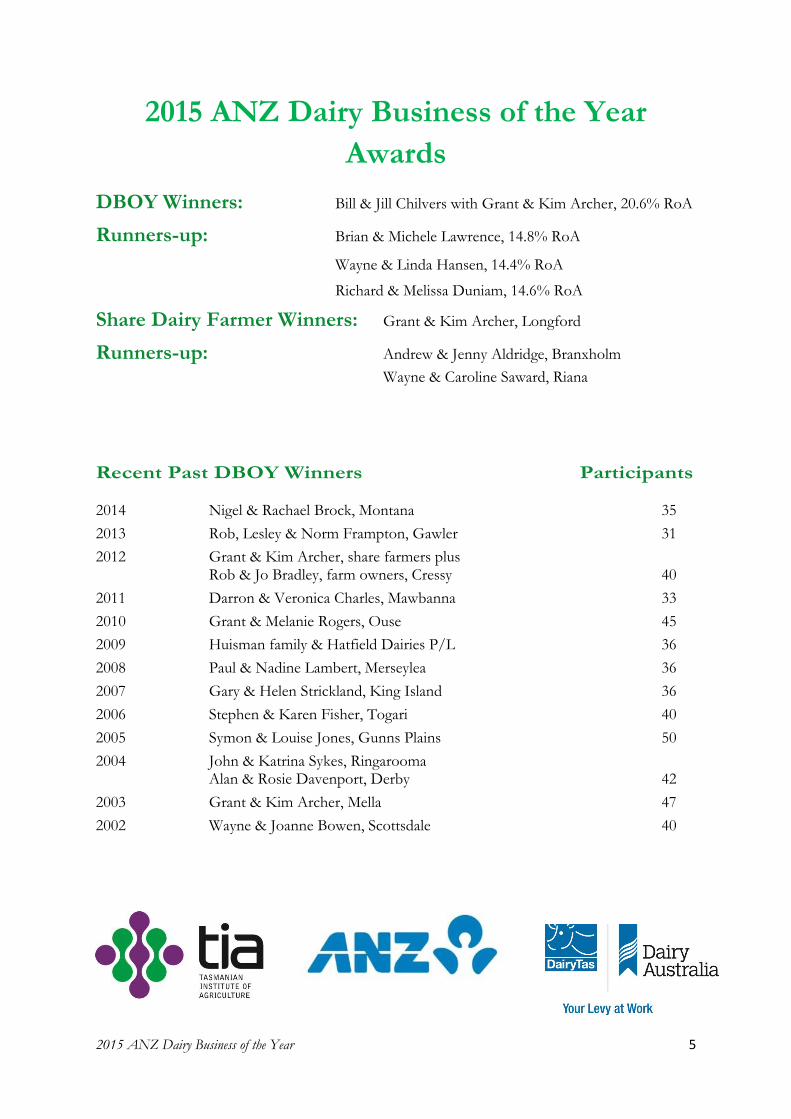
2015 ANZ Dairy Business of the Year
Awards
DBOY Winners: Bill & Jill Chilvers with Grant & Kim Archer, 20.6% RoA
Runners-up: Brian & Michele Lawrence, 14.8% RoA
Wayne & Linda Hansen, 14.4% RoA
Richard & Melissa Duniam, 14.6% RoA
Share Dairy Farmer Winners: Grant & Kim Archer, Longford
Runners-up: Andrew & Jenny Aldridge, Branxholm
Wayne & Caroline Saward, Riana
Recent Past DBOY Winners Participants
2014 Nigel & Rachael Brock, Montana 35
2013 Rob, Lesley & Norm Frampton, Gawler 31
2012 Grant & Kim Archer, share farmers plus Rob & Jo Bradley, farm owners, Cressy 40
2011 Darron & Veronica Charles, Mawbanna 33
2010 Grant & Melanie Rogers, Ouse 45
2009 Huisman family & Hatfield Dairies P/L 36
2008 Paul & Nadine Lambert, Merseylea 36
2007 Gary & Helen Strickland, King Island 36
2006 Stephen & Karen Fisher, Togari 40
2005 Symon & Louise Jones, Gunns Plains 50
2004 John & Katrina Sykes, Ringarooma Alan & Rosie Davenport, Derby 42
2003 Grant & Kim Archer, Mella 47
2002 Wayne & Joanne Bowen, Scottsdale 40
2015 ANZ Dairy Business of the Year 6
2015 ANZ Dairy Business of the Year
Winners – Bill & Jill Chilvers with Grant &
Kim Archer, ‘Oakdene’
There was great interest from the dairy
industry when a proposed dairy conversion
was touted for a property at Symmons
Plains. Whether it was because it was going
to be one of the most southern of the
northern dairy farms; or whether it was
because it was located directly beside the
Midlands highway making the dairy visible
to anyone travelling this north-south route;
or whether it was because a lot of people
were sceptical that dairy farming could be
successful in this region – whatever the
reason, everyone was talking about it.
Remarkably, just 3 years after starting as a
dairy farm, the Oakdene property has
become one of the most profitable dairy
enterprises in Tasmania, and, rightly so, we
are still talking about it.
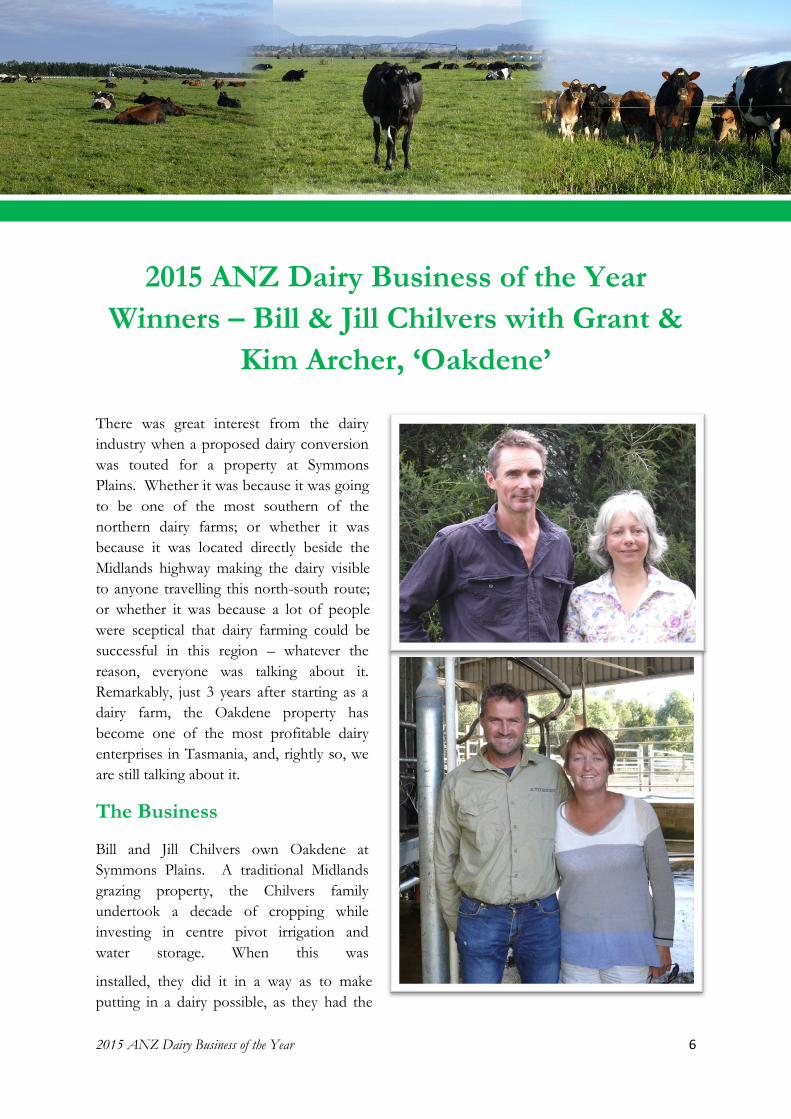
The Business
Bill and Jill Chilvers own Oakdene at
Symmons Plains. A traditional Midlands
grazing property, the Chilvers family
undertook a decade of cropping while
investing in centre pivot irrigation and
water storage. When this was
installed, they did it in a way as to make
putting in a dairy possible, as they had the
2015 ANZ Dairy Business of the Year 7
foresight to see this could be a viable option
for the property in the future.
Grant and Kim Archer moved to Longford
in 2007 so their children could go to school
in Launceston. They owned a dairy farm at
Mella, and had been developing one of their
team to take on a management role at the
farm once they moved. Grant and Kim
knew Rob and Jo Bradley, who are members
of the Chilvers family, and were managing a
property at Cressy which had un-used dairy.
Grant and Kim established a 50:50 share
farming arrangement with Rob and Jo
Bradley and started milking cows on the
property in 2008. Following success with
this enterprise, discussions began with Bill
and Jill Chilvers to convert part of their
1600 hectare Oakdene property into a dairy
farm. The Chilvers and Archers also
decided on a 50:50 share farming agreement.
With the centre pivot irrigation already in
place, the additional dairy conversion cost
approximately $1.3 million. The first
milking season was 2011/12 and 870 cows
were milked on the 243 hectare milking
platform, of which 225 hectares was
irrigated.
Obviously technical expertise is an
important part of business success but share
farming success is also reliant on both
parties in the business being able to work
effectively together. For the Chilvers and
Archers, this has been achieved by ensuring
there are regular, honest and open
discussions focusing on the ‘big picture’ of
growing a profitable dairy business.
The Team
As 50:50 share farmers, the Archers are
responsible for employing the whole team
involved in the dairy enterprise at Oakdene.
They employ four full-time team members,
one of whom is a manager, and employ
casuals who assist with milking on weekends
and when other team members are on
holiday. In 2013/14, the manager was
Steven Saltmarsh who had worked with the
Archers for six years, including managing
the Cressy dairy farm. The Archer’s have
established workplace health and safety
policies including an induction process for
new team members. They have also
recently implemented twice-annual reviews
with staff, conducted by an outside party, to
get feedback on how everyone feels about
their own involvement in the business, how
effectively everyone is working together and
ideas for improvement.
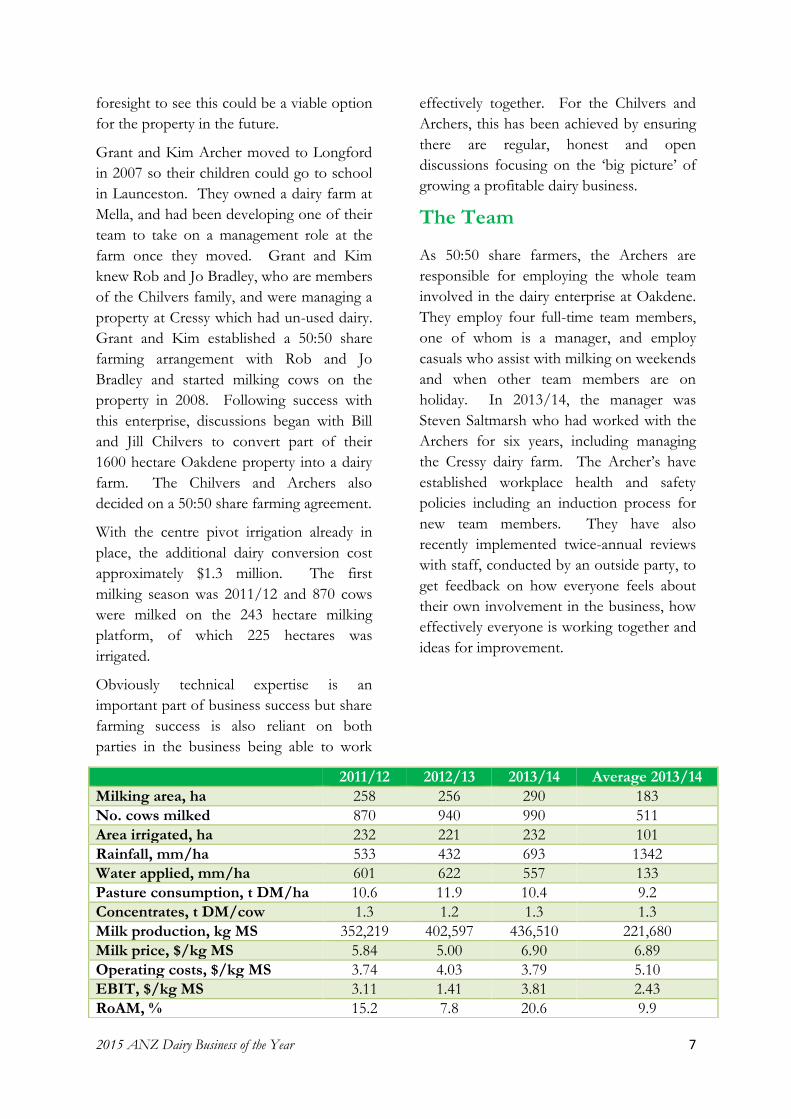
2011/12 2012/13 2013/14 Average 2013/14
Milking area, ha 258 256 290 183
No. cows milked 870 940 990 511
Area irrigated, ha 232 221 232 101
Rainfall, mm/ha 533 432 693 1342
Water applied, mm/ha 601 622 557 133
Pasture consumption, t DM/ha 10.6 11.9 10.4 9.2
Concentrates, t DM/cow 1.3 1.2 1.3 1.3
Milk production, kg MS 352,219 402,597 436,510 221,680
Milk price, $/kg MS 5.84 5.00 6.90 6.89
Operating costs, $/kg MS 3.74 4.03 3.79 5.10
EBIT, $/kg MS 3.11 1.41 3.81 2.43
RoAM, % 15.2 7.8 20.6 9.9
2015 ANZ Dairy Business of the Year 8
The System
The Archers believe very strongly in farming
to suit the environment and despite moving
to a lower rainfall area (550 mm at
Symmons Plains compared to 1,100 mm at
Mella), it is still possible achieve very good
pasture yields with almost 100% irrigation.
Always focussed on costs, Grant and Kim
have bred their cows to be efficient pasture
harvesters – pasture being the most cost
effective feed. They have a cross-bred herd
with a target mature cow liveweight of 450
kg. In 2013/14 per cow production was 441
kg MS. A 3-in-2 milking routine (3 milkings
in 2 days) is practiced on this farm for two-
thirds of the year – during peak milk
production through to the end of AI cows
are milked twice-a-day.
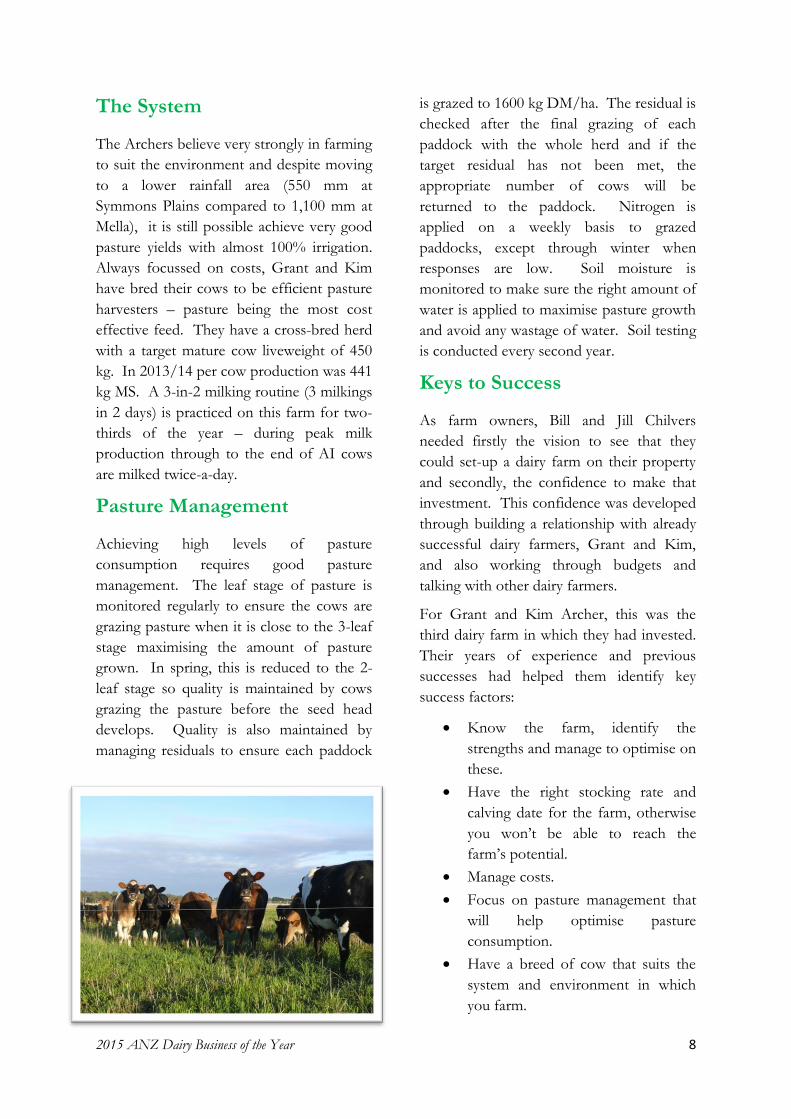
Pasture Management
Achieving high levels of pasture
consumption requires good pasture
management. The leaf stage of pasture is
monitored regularly to ensure the cows are
grazing pasture when it is close to the 3-leaf
stage maximising the amount of pasture
grown. In spring, this is reduced to the 2-
leaf stage so quality is maintained by cows
grazing the pasture before the seed head
develops. Quality is also maintained by
managing residuals to ensure each paddock
is grazed to 1600 kg DM/ha. The residual is
checked after the final grazing of each
paddock with the whole herd and if the
target residual has not been met, the
appropriate number of cows will be
returned to the paddock. Nitrogen is
applied on a weekly basis to grazed
paddocks, except through winter when
responses are low. Soil moisture is
monitored to make sure the right amount of
water is applied to maximise pasture growth
and avoid any wastage of water. Soil testing
is conducted every second year.
Keys to Success
As farm owners, Bill and Jill Chilvers
needed firstly the vision to see that they
could set-up a dairy farm on their property
and secondly, the confidence to make that
investment. This confidence was developed
through building a relationship with already
successful dairy farmers, Grant and Kim,
and also working through budgets and
talking with other dairy farmers.
For Grant and Kim Archer, this was the
third dairy farm in which they had invested.
Their years of experience and previous
successes had helped them identify key
success factors:
Know the farm, identify the
strengths and manage to optimise on
these.
Have the right stocking rate and
calving date for the farm, otherwise
you won’t be able to reach the
farm’s potential.
Manage costs.
Focus on pasture management that
will help optimise pasture
consumption.
Have a breed of cow that suits the
system and environment in which
you farm.
2015 ANZ Dairy Business of the Year Awards 9
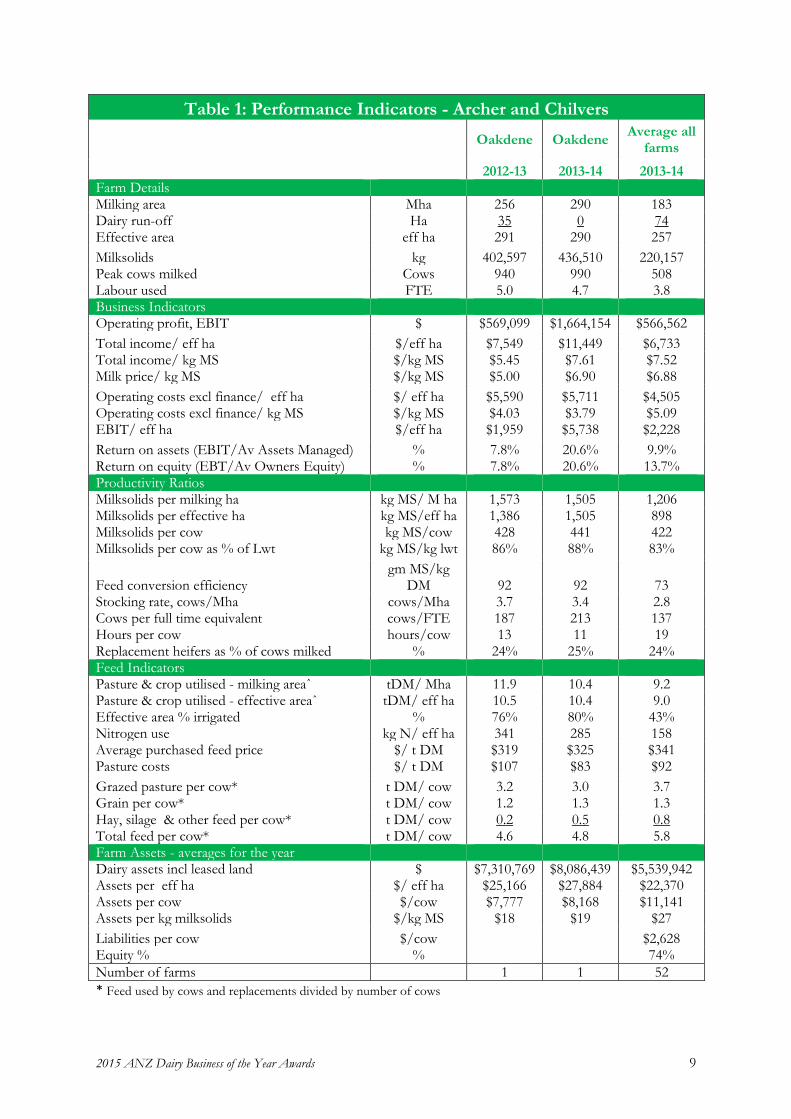
Table 1: Performance Indicators - Archer and Chilvers
Oakdene Oakdene Average all
farms
2012-13 2013-14 2013-14
Farm Details Milking area Mha 256 290 183 Dairy run-off Ha 35 0 74 Effective area eff ha 291 290 257 Milksolids kg 402,597 436,510 220,157 Peak cows milked Cows 940 990 508 Labour used FTE 5.0 4.7 3.8 Business Indicators Operating profit, EBIT $ $569,099 $1,664,154 $566,562 Total income/ eff ha $/eff ha $7,549 $11,449 $6,733 Total income/ kg MS $/kg MS $5.45 $7.61 $7.52 Milk price/ kg MS $/kg MS $5.00 $6.90 $6.88 Operating costs excl finance/ eff ha $/ eff ha $5,590 $5,711 $4,505 Operating costs excl finance/ kg MS $/kg MS $4.03 $3.79 $5.09 EBIT/ eff ha $/eff ha $1,959 $5,738 $2,228 Return on assets (EBIT/Av Assets Managed) % 7.8% 20.6% 9.9% Return on equity (EBT/Av Owners Equity) % 7.8% 20.6% 13.7% Productivity Ratios Milksolids per milking ha kg MS/ M ha 1,573 1,505 1,206 Milksolids per effective ha kg MS/eff ha 1,386 1,505 898 Milksolids per cow kg MS/cow 428 441 422 Milksolids per cow as % of Lwt kg MS/kg lwt 86% 88% 83%
Feed conversion efficiency gm MS/kg
DM 92 92 73 Stocking rate, cows/Mha cows/Mha 3.7 3.4 2.8 Cows per full time equivalent cows/FTE 187 213 137 Hours per cow hours/cow 13 11 19 Replacement heifers as % of cows milked % 24% 25% 24% Feed Indicators Pasture & crop utilised - milking areaˆ tDM/ Mha 11.9 10.4 9.2 Pasture & crop utilised - effective areaˆ tDM/ eff ha 10.5 10.4 9.0 Effective area % irrigated % 76% 80% 43% Nitrogen use kg N/ eff ha 341 285 158 Average purchased feed price $/ t DM $319 $325 $341 Pasture costs $/ t DM $107 $83 $92 Grazed pasture per cow* t DM/ cow 3.2 3.0 3.7 Grain per cow* t DM/ cow 1.2 1.3 1.3 Hay, silage & other feed per cow* t DM/ cow 0.2 0.5 0.8 Total feed per cow* t DM/ cow 4.6 4.8 5.8 Farm Assets - averages for the year Dairy assets incl leased land $ $7,310,769 $8,086,439 $5,539,942 Assets per eff ha $/ eff ha $25,166 $27,884 $22,370 Assets per cow $/cow $7,777 $8,168 $11,141 Assets per kg milksolids $/kg MS $18 $19 $27 Liabilities per cow $/cow $2,628 Equity % % 74%
Number of farms 1 1 52
* Feed used by cows and replacements divided by number of cows
2015 ANZ Dairy Business of the Year 10
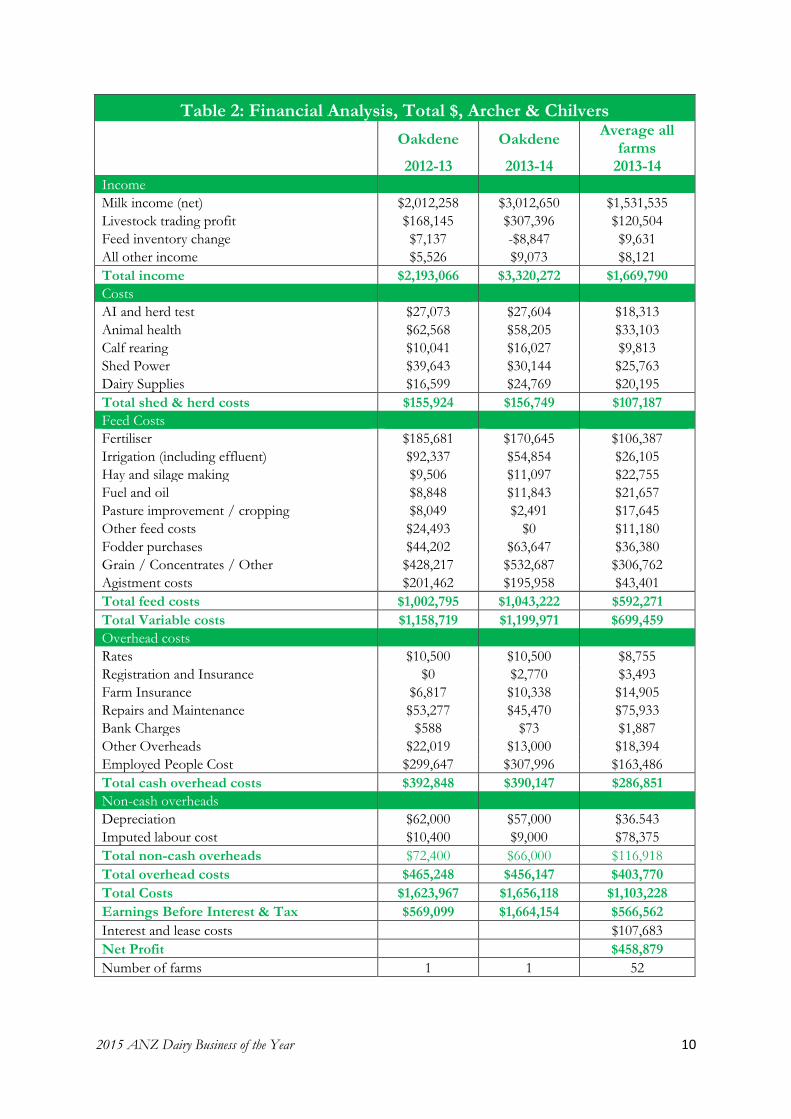
Table 2: Financial Analysis, Total $, Archer & Chilvers
Oakdene Oakdene Average all
farms
2012-13 2013-14 2013-14
Income
Milk income (net) $2,012,258 $3,012,650 $1,531,535
Livestock trading profit $168,145 $307,396 $120,504
Feed inventory change $7,137 -$8,847 $9,631
All other income $5,526 $9,073 $8,121
Total income $2,193,066 $3,320,272 $1,669,790
Costs
AI and herd test $27,073 $27,604 $18,313
Animal health $62,568 $58,205 $33,103
Calf rearing $10,041 $16,027 $9,813
Shed Power $39,643 $30,144 $25,763
Dairy Supplies $16,599 $24,769 $20,195
Total shed & herd costs $155,924 $156,749 $107,187
Feed Costs
Fertiliser $185,681 $170,645 $106,387
Irrigation (including effluent) $92,337 $54,854 $26,105
Hay and silage making $9,506 $11,097 $22,755
Fuel and oil $8,848 $11,843 $21,657
Pasture improvement / cropping $8,049 $2,491 $17,645
Other feed costs $24,493 $0 $11,180
Fodder purchases $44,202 $63,647 $36,380
Grain / Concentrates / Other $428,217 $532,687 $306,762
Agistment costs $201,462 $195,958 $43,401
Total feed costs $1,002,795 $1,043,222 $592,271
Total Variable costs $1,158,719 $1,199,971 $699,459
Overhead costs
Rates $10,500 $10,500 $8,755
Registration and Insurance $0 $2,770 $3,493
Farm Insurance $6,817 $10,338 $14,905
Repairs and Maintenance $53,277 $45,470 $75,933
Bank Charges $588 $73 $1,887
Other Overheads $22,019 $13,000 $18,394
Employed People Cost $299,647 $307,996 $163,486
Total cash overhead costs $392,848 $390,147 $286,851
Non-cash overheads
Depreciation $62,000 $57,000 $36.543
Imputed labour cost $10,400 $9,000 $78,375
Total non-cash overheads $72,400 $66,000 $116,918
Total overhead costs $465,248 $456,147 $403,770
Total Costs $1,623,967 $1,656,118 $1,103,228
Earnings Before Interest & Tax $569,099 $1,664,154 $566,562
Interest and lease costs $107,683
Net Profit $458,879
Number of farms 1 1 52

2015 ANZ Dairy Business of the Year 11
Table 3 - Financial Analysis, $ per kg Milksolids, Archer & Chilvers
Oakdene Oakdene Average all
farms
2012-13 2013-14 2013-14
Income
Milk income (net) $/kgMS $5.00 $6.90 $6.88
Livestock trading profit $/kgMS $0.42 $0.70 $0.55
Feed inventory change $/kgMS $0.02 -$0.02 $0.05
All other income $/kgMS $0.01 $0.02 $0.05
Total income $/kgMS $5.45 $7.61 $7.52
Costs
AI and herd test $/kgMS $0.07 $0.06 $0.08
Animal health $/kgMS $0.16 $0.13 $0.15
Calf rearing $/kgMS $0.02 $0.04 $0.04
Shed Power $/kgMS $0.10 $0.07 $0.13
Dairy Supplies $/kgMS $0.04 $0.06 $0.10
Total Herd & Shed Costs $/kgMS $0.39 $0.36 $0.50
Feed Costs
Fertiliser $/kgMS $0.46 $0.39 $0.47
Irrigation (incl effluent) $/kgMS $0.23 $0.13 $0.12
Hay and silage making $/kgMS $0.02 $0.03 $0.10
Fuel and oil $/kgMS $0.02 $0.03 $0.11
Pastures & forage $/kgMS $0.02 $0.01 $0.10
Other feed costs $/kgMS $0.06 $0.00 $0.05
Fodder purchases $/kgMS $0.11 $0.15 $0.16
Grain / Conc / Other $/kgMS $1.06 $1.22 $1.28
Agistment costs $/kgMS $0.50 $0.45 $0.17
Total Feed Costs $/kgMS $2.49 $2.39 $2.56
Total Variable costs $/kgMS $2.88 $2.75 $3.06
Overhead costs
Rates $/kgMS $0.03 $0.02 $0.05
Registration and Insurance $/kgMS $0.00 $0.01 $0.02
Farm Insurance $/kgMS $0.02 $0.02 $0.08
Repairs and Maintenance $/kgMS $0.13 $0.10 $0.35
Bank Charges $/kgMS $0.00 $0.00 $0.01
Other Overheads $/kgMS $0.05 $0.03 $0.10
Employed People Cost $/kgMS $0.74 $0.71 $0.71
Total cash overhead costs $/kgMS $0.98 $0.89 $1.32
Non-cash overheads
Depreciation $/kgMS $0.15 $0.13 $0.21
Imputed people cost $/kgMS $0.03 $0.02 $0.50
Total non-cash overheads $/kgMS $0.18 $0.15 $0.71
Total Overhead costs $/kgMS $1.16 $1.04 $2.03
Total Costs $/kgMS $4.03 $3.79 $5.09
Earnings Before Int & Tax $/kgMS $1.41 $3.81 $2.43
Interest and lease costs $/kgMS $0.52
Net Profit $/kgMS $1.92
Number of farms 1 1 52

2015 ANZ Dairy Business of the Year 12
Judges’ Comments – 2015 ANZ Dairy
Business of the Year Award
Judges
Nigel Brock – Dairy farmer & 2014 DBOY
Winner
Lesley Irvine – TIA Dairy Centre
The finalists of the 2015 ANZ Dairy
Business of the Year Award were:
Bill and Jill Chilvers with Grant and
Kim Archer
Richard and Melissa Duniam
Currajong Tas with Wayne and
Linda Hansen and Duncan and Sally
Sadler
Brian and Michele Lawrence.
These finalists were selected from all the
entrants in the Award based on their Return
on Assets Managed (RoAM) and Earnings
Before Interest and Tax (EBIT) per hectare.
The finalists were then visited by the judges
to look over the business financials, discuss
how the farm was managed and view the
farm operation. Each finalist was scored on
their business, pasture, herd, people and
environmental management. Finalists were
given a point score out of 100 points, with
the Award going to the finalist achieving the
highest score.
The judges would like to congratulate all the
finalists of the 2015 Dairy Business of the
Year Award for their achievement and thank
them for their time in taking part in the
judging process. Special congratulations to
the winners of the 2015 ANZ Dairy
Business of the Year Award – Bill and Jill
Chilvers with Grant and Kim Archer.
Business Management
The finalists in the 2015 DBOY Awards
were very diverse in terms of business
structures, demonstrating there are many
ways to invest in the dairy industry and
achieve high financial returns. The winners,
Bill and Jill Chilvers converted part of their
cropping and grazing farm to dairy under
the management of Grant and Kim Archer
in a 50:50 share farming arrangement. Brian
and Michele Lawrence also undertook a
dairy conversion on a grazing property as
owner-operators. Richard and Melissa
Duniam own one dairy farm and lease two
other dairy farms. Currajong Tas has been
showcased as an example of a long-standing
business relationship; current equity partners
and managers, Wayne and Linda Hansen,
started in the business owned, at the time,
by Duncan and Sally Sadler, through an
apprenticeship. Over the years, Wayne and
Linda have invested in the business as share
farmers. In a recent re-structuring of the
business, the Sadlers and Hansens took on a
new business partner, Nathan Lawrence,
2015 ANZ Dairy Business of the Year 13
who had completed his apprenticeship with
Wayne and Linda; creating a dairy business
with three equity partners. Each of the
finalists demonstrated great understanding
of their business and were also willing to
involve consultants to assist them in
identifying and analysing options to improve
their business. Monitoring and managing
costs was an important aspect of the finalists
financial management.
Three of the finalists are regular, long-term,
participants in business benchmarking and
use the information provided to assist them
in making decisions that improve
profitability.
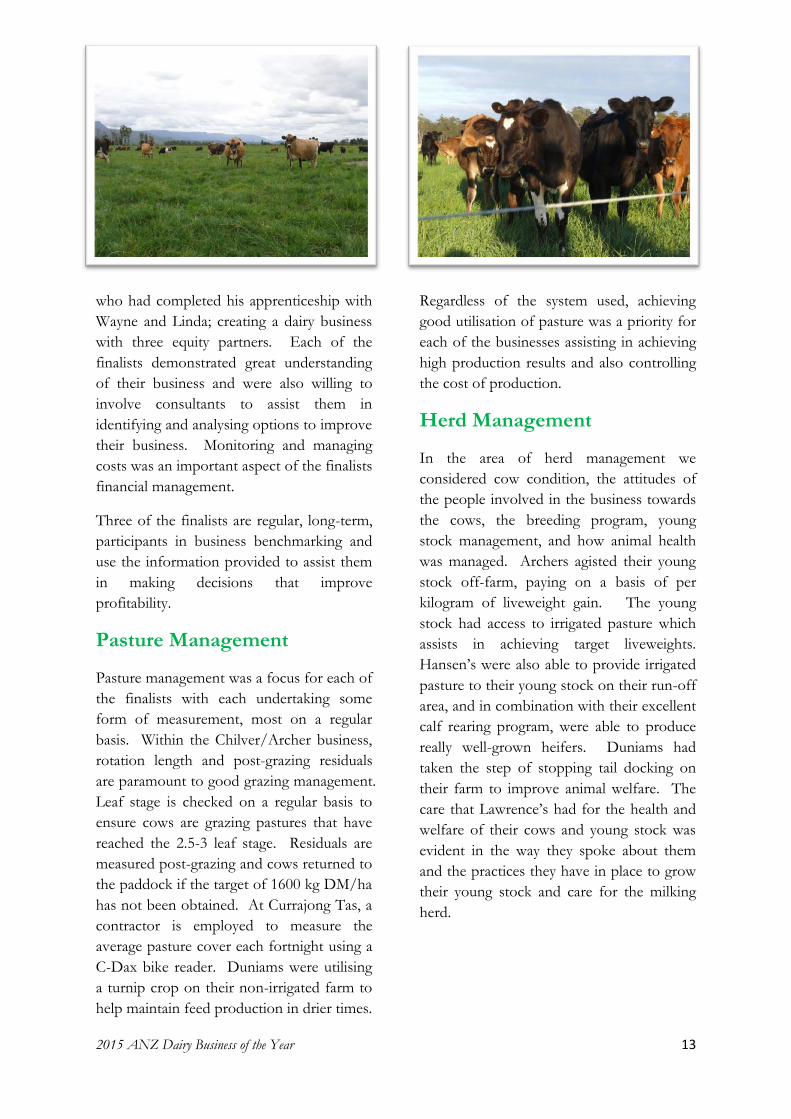
Pasture Management
Pasture management was a focus for each of
the finalists with each undertaking some
form of measurement, most on a regular
basis. Within the Chilver/Archer business,
rotation length and post-grazing residuals
are paramount to good grazing management.
Leaf stage is checked on a regular basis to
ensure cows are grazing pastures that have
reached the 2.5-3 leaf stage. Residuals are
measured post-grazing and cows returned to
the paddock if the target of 1600 kg DM/ha
has not been obtained. At Currajong Tas, a
contractor is employed to measure the
average pasture cover each fortnight using a
C-Dax bike reader. Duniams were utilising
a turnip crop on their non-irrigated farm to
help maintain feed production in drier times.
Regardless of the system used, achieving
good utilisation of pasture was a priority for
each of the businesses assisting in achieving
high production results and also controlling
the cost of production.
Herd Management
In the area of herd management we
considered cow condition, the attitudes of
the people involved in the business towards
the cows, the breeding program, young
stock management, and how animal health
was managed. Archers agisted their young
stock off-farm, paying on a basis of per
kilogram of liveweight gain. The young
stock had access to irrigated pasture which
assists in achieving target liveweights.
Hansen’s were also able to provide irrigated
pasture to their young stock on their run-off
area, and in combination with their excellent
calf rearing program, were able to produce
really well-grown heifers. Duniams had
taken the step of stopping tail docking on
their farm to improve animal welfare. The
care that Lawrence’s had for the health and
welfare of their cows and young stock was
evident in the way they spoke about them
and the practices they have in place to grow
their young stock and care for the milking
herd.

2015 ANZ Dairy Business of the Year 14
People Management
Each of the finalists employ staff and all
highlighted the importance of providing
opportunity for growth within the business.
With three dairy farms, Duniams employ a
reasonably large team of people. They
organise annual training events for the
whole team in addition to providing
opportunity for individuals to attend
training events specific to their own
requirements. The team leaders on each of
the leased farms provide a fortnightly report
to the Duniams and the performance of
each farm is discussed amongst the whole
team at their annual get-together. The
Duniams are also in the process of assisting
one of their employees to take on a share
farming role on one of the leased farms.
The Lawrence’s have a goal of making their
farm an enjoyable workplace for the whole
team. They undertake an annual review
with each team member and provide
opportunities for them to develop skills in
their area of interest. Workplace health and
safety is a priority in this business and a
large amount of time has been invested in
this area. General safety information is
provided to each team member along with
their pay; a whiteboard is situated in the
staff room to record any safety issues and
formal team meetings are conducted when
an issue needs discussing – a written record
of these meetings are kept. If information
needs to be shared with the team, or the
Lawrence’s would like some feedback on an
issue, the information is left in the staff
room with a jar of lollies, to encourage
people to read it and provide the feedback.
The Lawrence’s also undertake various
audits and are implementing an ‘everything
has its place’ policy where they are painting
yellow lines around the dairy and sheds to
indicate where equipment should be stored
when not in use.
We believe that the stand out lesson from all
the finalists was the high level of open
communication between people within the
business. Clear direction and communicated
outcomes have enabled each farm to
operate efficiently.
Environmental Management
This area covers effluent management,
protecting the natural resources on the farm
and the general farm aesthetics. Effluent
was utilised effectively on each of the farms
and regular soil testing was undertaken to
target nutrients where they were required.
The Hansen’s had one of the most
challenging environmental situations with
two rivers flowing through their property
that are prone to flooding. Despite this,
both sides of the rivers have been fenced,
and re-fenced when necessary, to prevent
cows accessing the riparian zones. Tree
planting with centre pivot irrigation can be
challenging but Chilvers and Lawrences
have been working on doing this outside of
the pivot circles to provide both wind
protection and improve aesthetics on their
farms. Irrigation scheduling and monitoring
of the water table level is also undertaken on
the Chilvers property.
2015 ANZ Dairy Business of the Year Awards 15
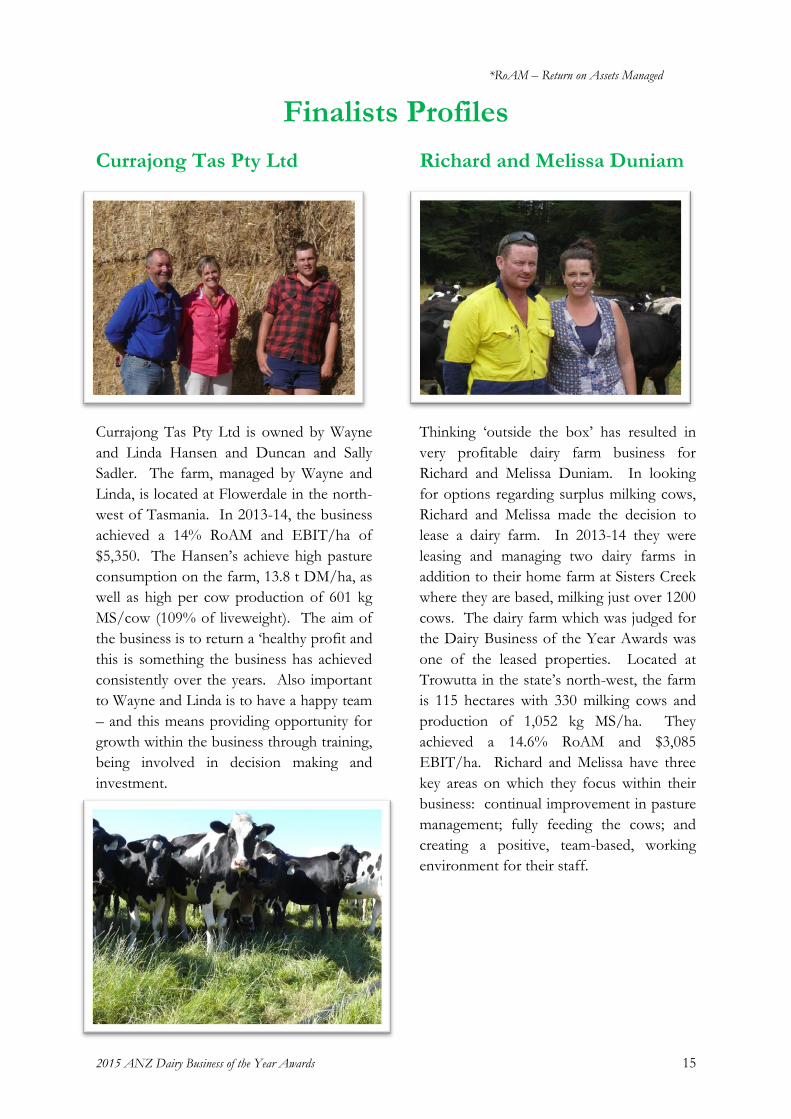
Finalists Profiles
Currajong Tas Pty Ltd
Currajong Tas Pty Ltd is owned by Wayne
and Linda Hansen and Duncan and Sally
Sadler. The farm, managed by Wayne and
Linda, is located at Flowerdale in the north-
west of Tasmania. In 2013-14, the business
achieved a 14% RoAM and EBIT/ha of
$5,350. The Hansen’s achieve high pasture
consumption on the farm, 13.8 t DM/ha, as
well as high per cow production of 601 kg
MS/cow (109% of liveweight). The aim of
the business is to return a ‘healthy profit and
this is something the business has achieved
consistently over the years. Also important
to Wayne and Linda is to have a happy team
– and this means providing opportunity for
growth within the business through training,
being involved in decision making and
investment.
Richard and Melissa Duniam
Thinking ‘outside the box’ has resulted in
very profitable dairy farm business for
Richard and Melissa Duniam. In looking
for options regarding surplus milking cows,
Richard and Melissa made the decision to
lease a dairy farm. In 2013-14 they were
leasing and managing two dairy farms in
addition to their home farm at Sisters Creek
where they are based, milking just over 1200
cows. The dairy farm which was judged for
the Dairy Business of the Year Awards was
one of the leased properties. Located at
Trowutta in the state’s north-west, the farm
is 115 hectares with 330 milking cows and
production of 1,052 kg MS/ha. They
achieved a 14.6% RoAM and $3,085
EBIT/ha. Richard and Melissa have three
key areas on which they focus within their
business: continual improvement in pasture
management; fully feeding the cows; and
creating a positive, team-based, working
environment for their staff.
*RoAM – Return on Assets Managed

2015 ANZ Dairy Business of the Year 16
Brian & Michele Lawrence
With two consecutive years as finalists,
Brian & Michele are demonstrating
consistently high profitability as they
continue to develop their dairy farm
conversion. The farm is located at Meander
in the central-north of Tasmania. Brian and
Michele purchased and converted the
property in 2006-07. In 2013-14, they
milked 900 cows on the 250 hectare milking
platform producing 1,624 kg MS/ha. Brian
and Michele believe in keeping their system
as simple as possible. They want to breed a
type of cow that suits the environment and
system which they farm, so they aim to have
moderate sized cows with moderate
production. In 2013-14, the cross-bred herd
produced an average of 453 kg MS/cow,
which is 94% of their liveweight. The other
key focus for Brian & Michele is their farm
team. They want everyone involved in their
business to enjoy coming to work and
therefore aim to create an environment that
is safe, efficient, flexible to people’s needs,
and provides opportunity for growth. In
2013-14, Brian & Michele achieved a 14.8%
RoAM and EBIT/ha of $6,708/ha.

2015 ANZ Dairy Business of the Year 17

2015 ANZ Dairy Business of the Year 18
2015 Fonterra Share Dairy Farmer of the
Year Winners – Grant & Kim Archer, share
farming for Bill & Jill Chilvers
Grant and Kim Archer began their dairy
farming career in Mella, near Smithton.
Over a 20 year period, they progressed from
being employed on Grant’s parents farm to
a 33% share farming agreement, a 50%
share farming agreement and then
ownership of the farm. Even after they
bought the farm, they continued to keep
surplus heifer calves, leasing them out if
they weren’t required in their milking herd.
In 2007, after owning the farm for 5 years,
they moved to Longford. Plenty of
planning had gone in to this move and they
had employed a manager in the lead-up to
the move to work with them on the farm
and learn the Archer’s farming system.
Within 6 months of moving, Grant and Kim
had taken on a 50% share farming position
with Rob and Jo Bradley at Cressy. They
employed Steven Saltmarsh and Jaimie
Clarke to manage the farm. The first year,
they milked 370 cows made-up of surplus
cows from their Mella property as well as
heifers they had purchased in anticipation of
expanding their business. The second year
on the Cressy property they milked 440
cows. The following season, they took on
share farmers Leigh and Kellie Schuuring at
their Mella property. Leigh and Kellie
brought 600 of their own cows into the
business which meant the Archer’s could
take more of their own cows to Cressy and
milk as many as they could there – 500 cows
and they still owned another 700 cows
which they leased out. At this time, Bill and
Jill Chilvers approached the Archer’s about
a 50% share farming agreement on their
1600 hectare property at Symmons Plains,
on which they planned to set-up a 230
hectare dairy farm. In 2011/12 they
brought back all their leased cows in order
to milk 870 on the Chilver’s Symmons
Plains farm and 450 cows on the Bradley’s
Cressy farm. The following season, a new 54
bale rotary dairy was built on the Cressy
farm and with some cow purchases and
extra young stock, they milked 880 cows. In
the 2013/2014 season 1870 cows were
milked on both farms. In managing multiple
dairy farms, not only has the growth of their
dairy herd been critical but also the growth
of their team. Having highly competent
operational managers is critical in
maintaining high profitability across all of
the businesses.

2015 ANZ Dairy Business of the Year Awards 19
Table 5: Key Performance Indicators for Grant & Kim Archer Farm Details 2013-14
Milking area, ha 290
Effective area, ha 290
Production, kg MS 436,510
Peak cows milked 990
Labour used, FTE 4.7
Business Indicators
EBIT, $ $782,185
Return on Assets, % 37.7%
Productivity Ratios
Kg MS/milking ha 1,505
Kg MS/cow 441
Stocking rate, cows/ha 3.4
Cows per FTE 213
Hours/cow 11
Replacement heifers, % of cows milked 25%
Secondary Performance Indicators Feed Indicators
Pasture and crop utilised, milking area 10.4
Irrigation, % milking area 80%
Nitrogen, units kg N/ha 285
Pasture costs, $/t DM $46
Grain per cow, t DM/cow 1.3
Farm Assets
Total dairy assets, $ $2,074,058
2015 ANZ Dairy Business of the Year 20
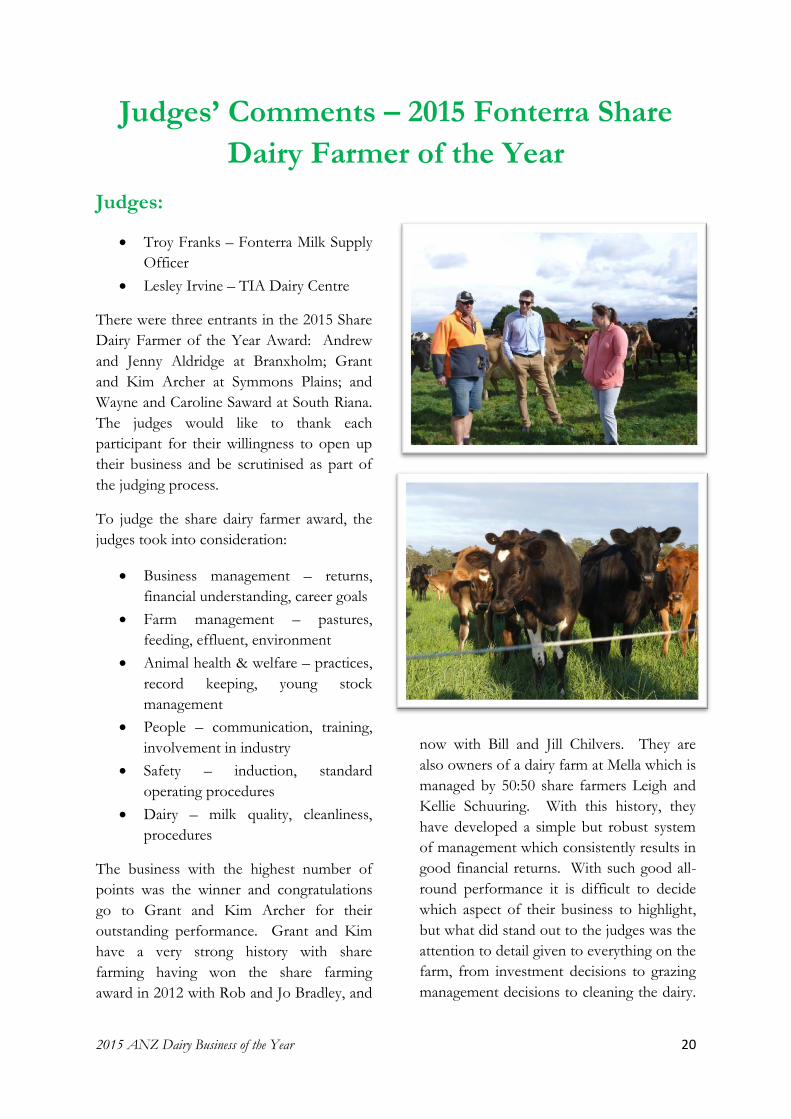
Judges’ Comments – 2015 Fonterra Share
Dairy Farmer of the Year
Judges:
Troy Franks – Fonterra Milk Supply
Officer
Lesley Irvine – TIA Dairy Centre
There were three entrants in the 2015 Share
Dairy Farmer of the Year Award: Andrew
and Jenny Aldridge at Branxholm; Grant
and Kim Archer at Symmons Plains; and
Wayne and Caroline Saward at South Riana.
The judges would like to thank each
participant for their willingness to open up
their business and be scrutinised as part of
the judging process.
To judge the share dairy farmer award, the
judges took into consideration:
Business management – returns,
financial understanding, career goals
Farm management – pastures,
feeding, effluent, environment
Animal health & welfare – practices,
record keeping, young stock
management
People – communication, training,
involvement in industry
Safety – induction, standard
operating procedures
Dairy – milk quality, cleanliness,
procedures
The business with the highest number of
points was the winner and congratulations
go to Grant and Kim Archer for their
outstanding performance. Grant and Kim
have a very strong history with share
farming having won the share farming
award in 2012 with Rob and Jo Bradley, and
now with Bill and Jill Chilvers. They are
also owners of a dairy farm at Mella which is
managed by 50:50 share farmers Leigh and
Kellie Schuuring. With this history, they
have developed a simple but robust system
of management which consistently results in
good financial returns. With such good all-
round performance it is difficult to decide
which aspect of their business to highlight,
but what did stand out to the judges was the
attention to detail given to everything on the
farm, from investment decisions to grazing
management decisions to cleaning the dairy.

2015 ANZ Dairy Business of the Year 21
The attitude is much more ‘everything needs
to be done well’ rather than ‘she’ll be right’.
Andrew and Jenny Aldridge have big goals
for their business and are steadily working
towards them. They are aiming to have a
simple, low cost system on their farm able
to give them consistent, good financial
returns. Andrew and Jenny have a young
team working with them and have
developed some really effective people
procedures through both their own
experience and also using Dairy Australia’s
Employment Starter Kit (ESKi). The
milking herd and young stock management
was very good and Andrew and Jenny were
working with the farm owners to improve
some of the environmental management
aspects of the farm business.
Wayne and Caroline Saward moved to the
Sustainable Agriculture Fund dairy farm at
South Riana at the start of the 2013-14
season. They have a long history with share
farming and view themselves are career
share farmers. The pastures and cow
condition on the farm were excellent.
Wayne and Caroline also showed strength in
the area of people management, providing
training to help people grow within the
business and developing steps to help team
members share in their successes. They also
have a very positive relationship with
Sustainable Agriculture Fund manager,
Wolfie Wagner, and meet regularly to review
and discuss budgets and farm operations.

2015 ANZ Dairy Business of the Year 22
Share Dairy Farmer – Finalists Profiles
Andrew and Jenny Aldridge
Andrew and Jenny Aldridge are 50% share
farmers on the Aldridge family dairy farm at
Branxholm in north-east Tasmania. They
milk 380 cows on the 150 hectare milking
area. Andrew and Jenny have been
managing the farm for five years, increasing
from a 20% share to the 50% share two
seasons ago. During this time, they have
lifted milk production on the farm from
94,000 kg MS to 150,000 kg MS in 2013-14.
Andrew and Jenny are aiming for a low cost,
low input system and have a focus on
improving pasture management to achieve
pasture consumption of 12 t DM/ha. They
are continuing to grow herd size with a
target of milking 450 cows.
Wayne and Caroline Saward
Wayne and Caroline Saward started their
share farming career in 1997 and have
managed farms from Circular Head to the
north-east. 2013-14 was their first year of
managing the Sustainable Agriculture Fund
dairy farm at Riana in Tasmania’s north-
west. The farm is 240 hectares with 790
milking cows. They achieved 1,416 kg
MS/ha for the season. Wayne and Caroline
aim to achieve the most production they can,
profitably. They also have a focus on
ensuring the people that work on the farm
enjoy the work but also have time for
activities outside of work. To achieve this,
they have a set-roster for the whole year so
that people know when they are working –
any swapping of work days is organised by
the individuals involved. Wayne and
Caroline have monthly meetings with Wolfie
Wagner, the Sustainable Agriculture Fund
Manager, to discuss farm finances and how
they are tracking against their budget for
income and expenses. They have found this
to be a positive exercise and appreciate the
effort that is put in to address their business
needs and provide opportunity for growth
within the business.
2015 ANZ Dairy Business of the Year 23
2.99 2.89
3.68 3.23
3.14
3.28
2.88
3.38
4.36
3.60
4.15
4.35 4.38
6.33
5.51
4.66
5.49 5.40
5.01
6.88
5.90
$0.00
$1.00
$2.00
$3.00
$4.00
$5.00
$6.00
$7.00
$8.00
0
100
200
300
400
500
600
700
800
900
1000
Mil
k p
rice,
$/
kg
mil
kso
lid
s
Mil
k p
rod
ucti
on
, M
L
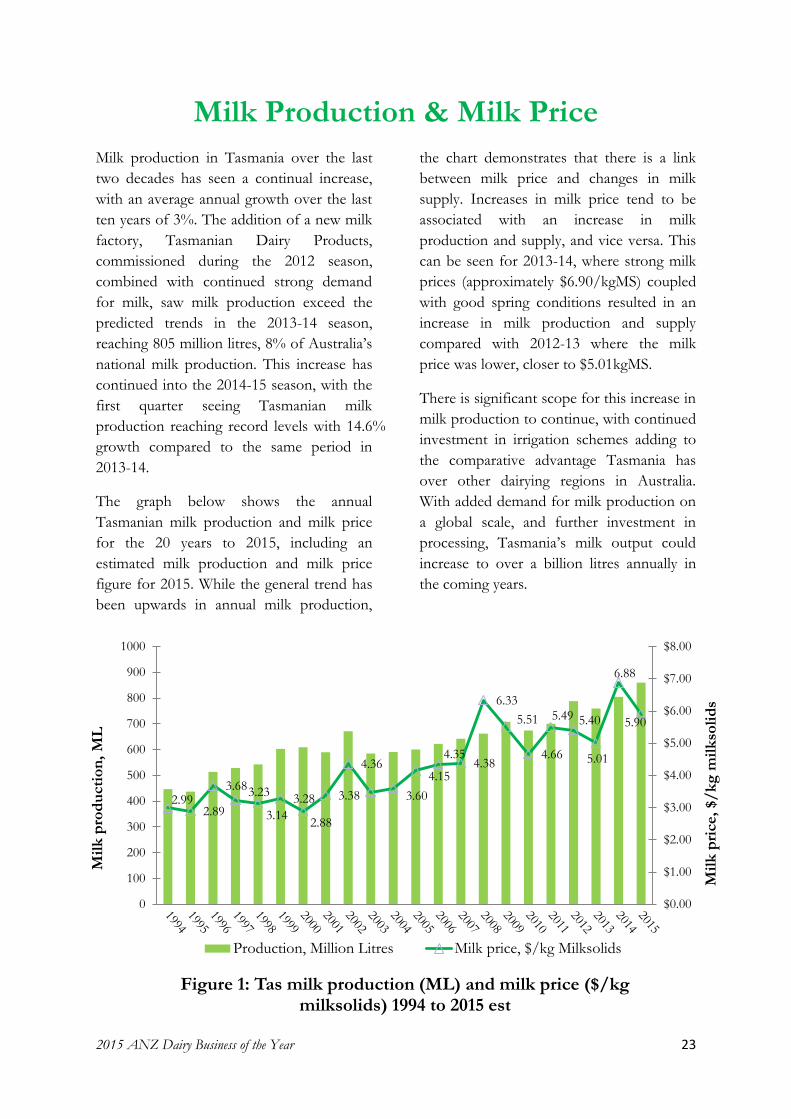
Figure 1: Tas milk production (ML) and milk price ($/kg milksolids) 1994 to 2015 est
Production, Million Litres Milk price, $/kg Milksolids
Milk Production & Milk Price
Milk production in Tasmania over the last
two decades has seen a continual increase,
with an average annual growth over the last
ten years of 3%. The addition of a new milk
factory, Tasmanian Dairy Products,
commissioned during the 2012 season,
combined with continued strong demand
for milk, saw milk production exceed the
predicted trends in the 2013-14 season,
reaching 805 million litres, 8% of Australia’s
national milk production. This increase has
continued into the 2014-15 season, with the
first quarter seeing Tasmanian milk
production reaching record levels with 14.6%
growth compared to the same period in
2013-14.
The graph below shows the annual
Tasmanian milk production and milk price
for the 20 years to 2015, including an
estimated milk production and milk price
figure for 2015. While the general trend has
been upwards in annual milk production,
the chart demonstrates that there is a link
between milk price and changes in milk
supply. Increases in milk price tend to be
associated with an increase in milk
production and supply, and vice versa. This
can be seen for 2013-14, where strong milk
prices (approximately $6.90/kgMS) coupled
with good spring conditions resulted in an
increase in milk production and supply
compared with 2012-13 where the milk
price was lower, closer to $5.01kgMS.
There is significant scope for this increase in
milk production to continue, with continued
investment in irrigation schemes adding to
the comparative advantage Tasmania has
over other dairying regions in Australia.
With added demand for milk production on
a global scale, and further investment in
processing, Tasmania’s milk output could
increase to over a billion litres annually in
the coming years.
2015 ANZ Dairy Business of the Year 24
Dairy Benchmarking
Introduction
The Tasmanian dairy industry has a long
history of benchmarking, with dairy farmers
having the opportunity to submit their
figures and benchmark their business
performance on an annual basis for over 30
years. Since 2011, the Tasmanian Institute of
Agriculture (TIA), with support of Dairy
Australia funding, have been using software
developed by the Victorian Department of
Primary Industries (now the Department of
Economic Development, Jobs, Transport
and Resources) as part of the Dairy Farm
Monitor Project (DFMP). All business
information is analysed using the DFMP
software and reports are produced, enabling
year to year comparisons of business
performance, and now also enabling
comparisons between Tasmanian farms and
other states and dairying regions of Australia.
Tasmanian Dairy Farm
Performance
There were 52 farms providing information
about their farm business as part of the
2013-14 benchmarking program, with a
relatively even spread of farms across the
major dairying regions in the state.
Table 5 shows several of the key
performance indicators, KPI’s, (average per
farm) for the 52 participants in the
benchmarking program:
Herd Size
Tasmania continues to have the largest
average herd size compared with other dairy
regions, and is continuing to increase. This
suggests that the majority of farmers are
seeing some benefit from increasing herd
numbers. Analysis of the benchmarking data
over the last 7 years supports the conclusion
that the larger farms tend to have a higher
return on assets than smaller farms.
However, a large amount of variation in
evident in return on assets for farms that are
in the same herd size category. In addition
to between herd size categories, confirming
that increasing herd and farm size is not
linked directly with increased profitability.
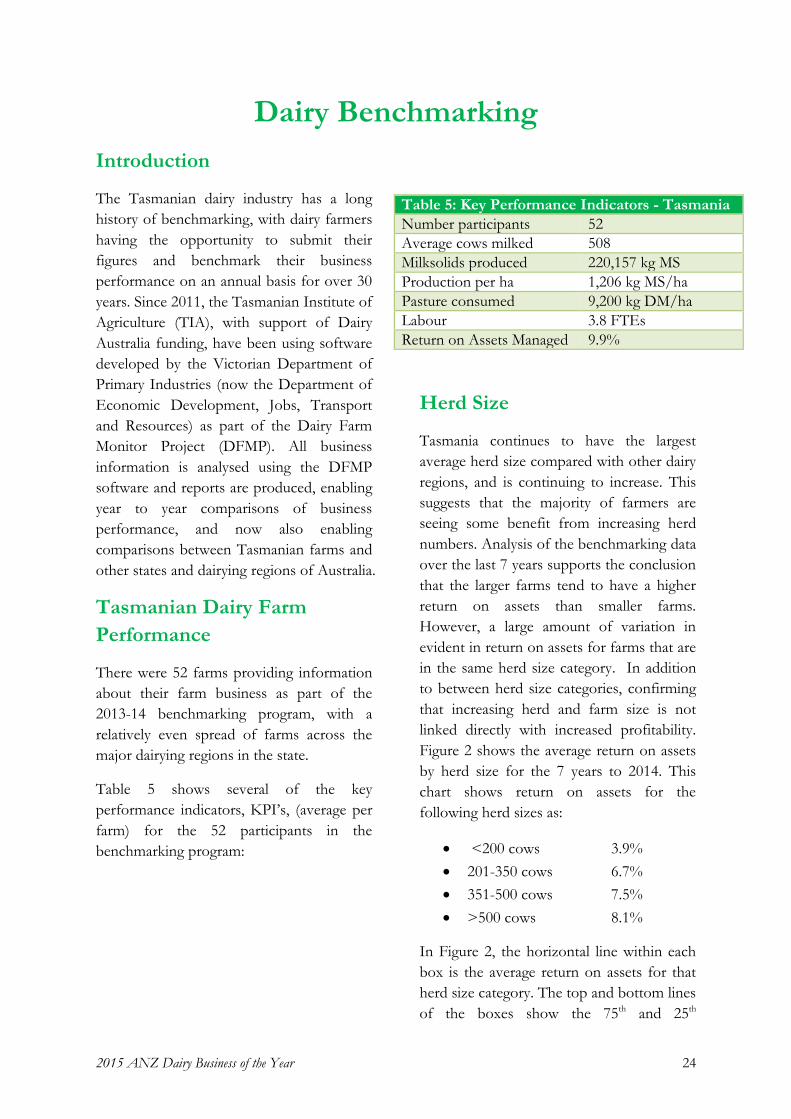
Figure 2 shows the average return on assets
by herd size for the 7 years to 2014. This
chart shows return on assets for the
following herd sizes as:
<200 cows 3.9%
201-350 cows 6.7%
351-500 cows 7.5%
>500 cows 8.1%
In Figure 2, the horizontal line within each
box is the average return on assets for that
herd size category. The top and bottom lines
of the boxes show the 75th and 25th
Table 5: Key Performance Indicators - Tasmania
Number participants 52
Average cows milked 508
Milksolids produced 220,157 kg MS
Production per ha 1,206 kg MS/ha
Pasture consumed 9,200 kg DM/ha
Labour 3.8 FTEs
Return on Assets Managed 9.9%
2015 ANZ Dairy Business of the Year 25
percentile of farms respectively, and the
small horizontal lines on the top and bottom
of the vertical lines show the maximum and
minimum of return on assets for farms in
the corresponding category. As the chart
illustrates, though there is a large range of
return on assets between farms with similar
herd numbers, the average return on assets
does increase as herd size increases. The
chart also shows that the average return on
assets for farms with less than 200 cows
(RoA 3.9%) is substantially lower than the
average return on assets for farms with over
500 cows (RoA 8.1%).
However, there are farms in the smaller
herd size categories that are performing very
well in terms of return on assets. This was
more evident in the 2013-14 benchmarking
program, where perhaps the greatest
diversity was seen with regards to the scale
and size of farming operations and business
structure.
-10
-5
0
5
10
15
20
25
30
Ret
urn
on
ass
ets
%
Herd size, cows
Figure 2: Return on assets % vs Herd size, cows
<200 n = 28
201-350 n = 35
351-500 n = 57
>500 n = 60

2015 ANZ Dairy Business of the Year Awards 26
Feed Consumption
Figure 3 presents the contribution of different feed sources to the total metabolisable energy (ME) consumed on farm, for the 52 participants in Tasmanian benchmarking. This also included feed consumed by dry cows and young stock.
From the participants in the 2013-14 benchmarking, almost 80% of the diet was forage based, with 65% grazed pasture. Figure 4 shows the average estimated home grown feed production per cow, for the 52 participants. Figures 3 and 4 are calculated using the Victorian Department of Primary Industries Pasture Consumption Calculator. This involves first a calculation of the total energy required on the farm, which is a factor of stock numbers held on the farm,
stock weights, distance stock walk to the dairy on average and milk production. From the total farm energy requirements over the year, the energy imported to the farm as feed is subtracted. This leaves the estimate for total energy produced on farm, which is then divided into grazed and conserved feed depending on the amount of fodder production recorded.
The amount of home grown feed produced per cow will be dependent on numerous factors, with water availability, fertiliser application rates and grazing management being central. The total home grown feed produced in 2013-14 is estimated at 5.8 t DM/cow in total, with 3.7 t DM/cow as pasture grazed directly, 0.8 t DM/cow conserved, and a total of 1.3 t DM/cow of concentrates.
0%
10%
20%
30%
40%
50%
60%
70%
Pasturegrazed
Concentrates Silage Hay OtherPro
po
rtio
n o
f M
E C
on
sum
ed
(%
)
Figure 3: Proportion of ME Consumed (%)
0.0
1.0
2.0
3.0
4.0
5.0
6.0
7.0
Total Feedconsumed
Grazed pasture Concentrates ConservedfeedP
rop
ort
ion
of
feed
co
nsu
med
per
co
w (
t D
M/
co
w)
Figure 4: Proportion of feed consumed, t / cow
2015 ANZ Dairy Business of the Year Awards 27
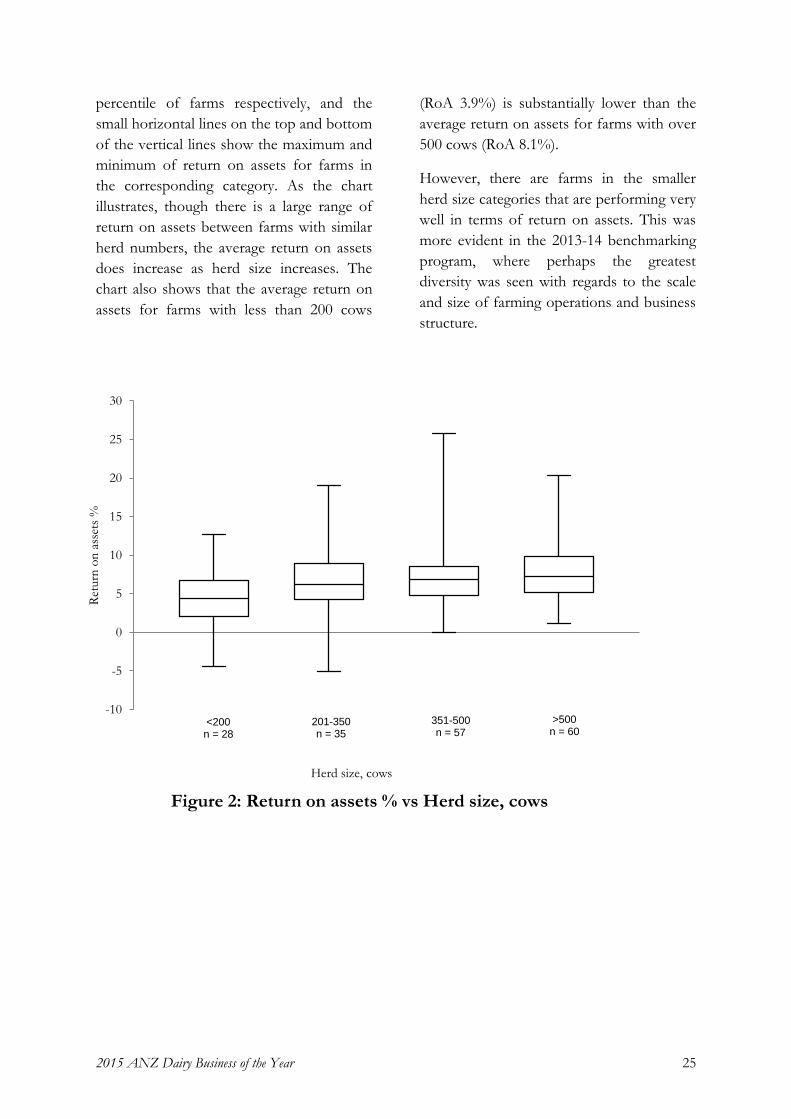
Seasonal Conditions
The 2013-14 season began with a mild
winter which maintained good pasture
growth rates in the lead-up to the main
calving period, during spring. This was
followed by a wetter than average spring
which resulted in low pasture growth rates,
and subsequently lower than average
conserved forage. In addition to a relatively
poor spring, rainfall during the summer
months from December to February was
lower than average, resulting in low growth
rates on dryland areas in particular and
added pressure on conserved feed. Autumn
rainfall was higher than average which
helped maintain milk production through
this period and also reduced the impact of
low levels of conserved forage. Despite
some challenging seasonal conditions during
2013-14, Tasmanian milk production
reached a record high of 804.5 million litres.
0
50
100
150
200
250
300
350
Jul Aug Sep Oct Nov Dec Jan Feb Mar Apr May Jun
Rai
nfa
ll (m
m /
mo
nth
)
Figure 5: Monthly rainfall for 2013-14 compared with historical average
Statewide Average annual rainfall
2015 ANZ Dairy Business of the Year 28
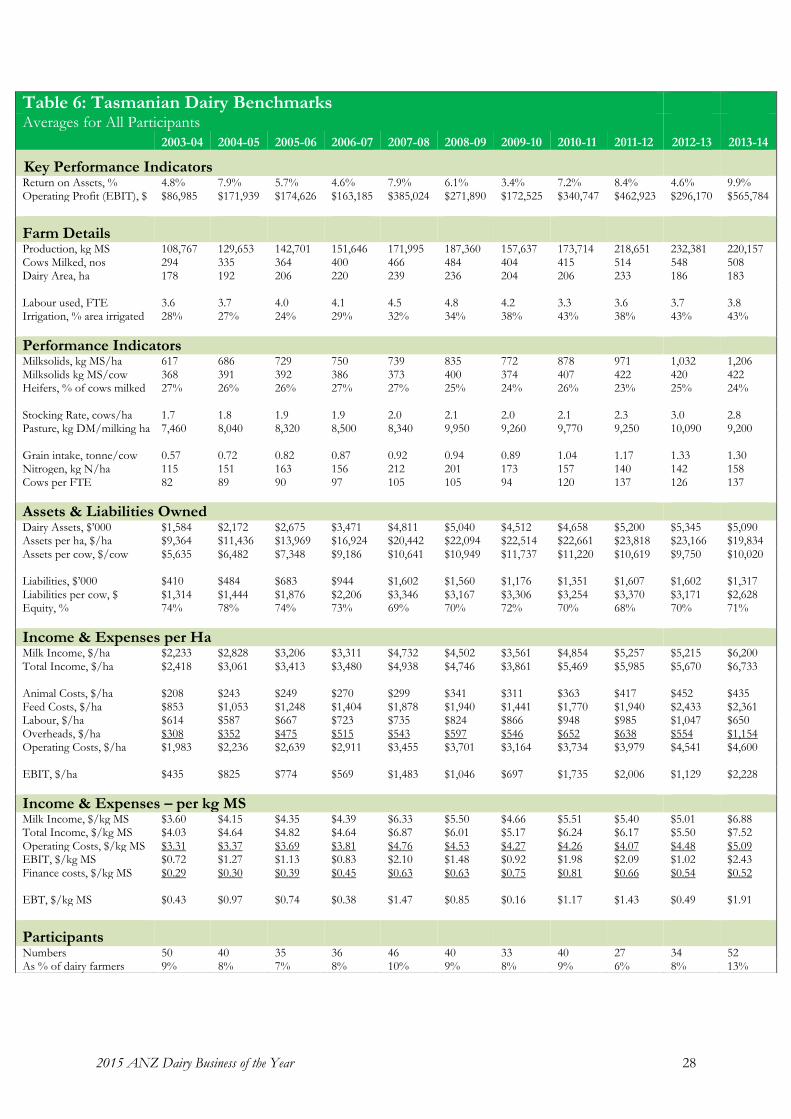
Table 6: Tasmanian Dairy Benchmarks
Averages for All Participants
2003-04 2004-05 2005-06 2006-07 2007-08 2008-09 2009-10 2010-11 2011-12 2012-13 2013-14
Key Performance Indicators Return on Assets, % 4.8% 7.9% 5.7% 4.6% 7.9% 6.1% 3.4% 7.2% 8.4% 4.6% 9.9% Operating Profit (EBIT), $ $86,985 $171,939 $174,626 $163,185 $385,024 $271,890 $172,525 $340,747 $462,923 $296,170 $565,784
Farm Details
Production, kg MS 108,767 129,653 142,701 151,646 171,995 187,360 157,637 173,714 218,651 232,381 220,157 Cows Milked, nos 294 335 364 400 466 484 404 415 514 548 508 Dairy Area, ha 178 192 206 220 239 236 204 206 233 186 183 Labour used, FTE 3.6 3.7 4.0 4.1 4.5 4.8 4.2 3.3 3.6 3.7 3.8 Irrigation, % area irrigated 28% 27% 24% 29% 32% 34% 38% 43% 38% 43% 43%
Performance Indicators Milksolids, kg MS/ha 617 686 729 750 739 835 772 878 971 1,032 1,206 Milksolids kg MS/cow 368 391 392 386 373 400 374 407 422 420 422 Heifers, % of cows milked 27% 26% 26% 27% 27% 25% 24% 26% 23% 25% 24% Stocking Rate, cows/ha 1.7 1.8 1.9 1.9 2.0 2.1 2.0 2.1 2.3 3.0 2.8 Pasture, kg DM/milking ha 7,460 8,040 8,320 8,500 8,340 9,950 9,260 9,770 9,250 10,090 9,200 Grain intake, tonne/cow 0.57 0.72 0.82 0.87 0.92 0.94 0.89 1.04 1.17 1.33 1.30 Nitrogen, kg N/ha 115 151 163 156 212 201 173 157 140 142 158 Cows per FTE 82 89 90 97 105 105 94 120 137 126 137
Assets & Liabilities Owned Dairy Assets, $’000 $1,584 $2,172 $2,675 $3,471 $4,811 $5,040 $4,512 $4,658 $5,200 $5,345 $5,090 Assets per ha, $/ha $9,364 $11,436 $13,969 $16,924 $20,442 $22,094 $22,514 $22,661 $23,818 $23,166 $19,834 Assets per cow, $/cow $5,635 $6,482 $7,348 $9,186 $10,641 $10,949 $11,737 $11,220 $10,619 $9,750 $10,020 Liabilities, $’000 $410 $484 $683 $944 $1,602 $1,560 $1,176 $1,351 $1,607 $1,602 $1,317 Liabilities per cow, $ $1,314 $1,444 $1,876 $2,206 $3,346 $3,167 $3,306 $3,254 $3,370 $3,171 $2,628 Equity, % 74% 78% 74% 73% 69% 70% 72% 70% 68% 70% 71%
Income & Expenses per Ha Milk Income, $/ha $2,233 $2,828 $3,206 $3,311 $4,732 $4,502 $3,561 $4,854 $5,257 $5,215 $6,200 Total Income, $/ha $2,418 $3,061 $3,413 $3,480 $4,938 $4,746 $3,861 $5,469 $5,985 $5,670 $6,733 Animal Costs, $/ha $208 $243 $249 $270 $299 $341 $311 $363 $417 $452 $435 Feed Costs, $/ha $853 $1,053 $1,248 $1,404 $1,878 $1,940 $1,441 $1,770 $1,940 $2,433 $2,361 Labour, $/ha $614 $587 $667 $723 $735 $824 $866 $948 $985 $1,047 $650 Overheads, $/ha $308 $352 $475 $515 $543 $597 $546 $652 $638 $554 $1,154 Operating Costs, $/ha $1,983 $2,236 $2,639 $2,911 $3,455 $3,701 $3,164 $3,734 $3,979 $4,541 $4,600 EBIT, $/ha $435 $825 $774 $569 $1,483 $1,046 $697 $1,735 $2,006 $1,129 $2,228
Income & Expenses – per kg MS Milk Income, $/kg MS $3.60 $4.15 $4.35 $4.39 $6.33 $5.50 $4.66 $5.51 $5.40 $5.01 $6.88 Total Income, $/kg MS $4.03 $4.64 $4.82 $4.64 $6.87 $6.01 $5.17 $6.24 $6.17 $5.50 $7.52 Operating Costs, $/kg MS $3.31 $3.37 $3.69 $3.81 $4.76 $4.53 $4.27 $4.26 $4.07 $4.48 $5.09 EBIT, $/kg MS $0.72 $1.27 $1.13 $0.83 $2.10 $1.48 $0.92 $1.98 $2.09 $1.02 $2.43 Finance costs, $/kg MS $0.29 $0.30 $0.39 $0.45 $0.63 $0.63 $0.75 $0.81 $0.66 $0.54 $0.52 EBT, $/kg MS $0.43 $0.97 $0.74 $0.38 $1.47 $0.85 $0.16 $1.17 $1.43 $0.49 $1.91
Participants
Numbers 50 40 35 36 46 40 33 40 27 34 52 As % of dairy farmers 9% 8% 7% 8% 10% 9% 8% 9% 6% 8% 13%

2015 ANZ Dairy Business of the Year 29
X
$120,504 $0.55 /kg MS
$17,751 $0.10 /kg MS
$1,669,790 $7.52 /kg MS $61,230 $0.27 /kg MS
$45,958 $0.23 /kg MS
$592,271 $2.56 /kg MS
$970,332 $3.06 /kg MS
$970,332 $4.46 /kg MS
$75,933 $0.35 /kg MS
$241,630 $1.21 /kg MS
$39,552 $0.21 /kg MS
$47,433 $0.26 /kg MS
$404,547 $2.03 /kg MS
$565,784 $2.43 /kg MS
$107,683 $0.52 /kg MS
$458,102 $1.92 /kg MS
$5,539,983 $27 /kg MS
$449,428 $2 /kg MS
$5,090,554 $25 /kg MS $1,317,154 $6 /kg MS $3,773,401 $19 /kg MS
Profit Map 2013-14
Averages for all participants
Return on assets managed
$1,531,535
Earnings before
interest and tax (EBIT)
Feed costs
Shed costs
220,157 kg MS
Livestock Trading profit
Production
508 cows
Price
Total overhead costs
Repairs
Herd costs
Depreciation
Other Overheads
Other Income
Gross margin
Assets leased
Assets managed
9.9%
Net profit
Gross Farm Income
$6.88 /kg MS
Milk income
Variable costs
Total variable costs
Overheads
Assets owned
Return on equity
13.7%
Interest and lease costs
Paid & Unpaid Labour
Liabilitiesminus equals
plus
equals
Equity
2015 ANZ Dairy Business of the Year 30
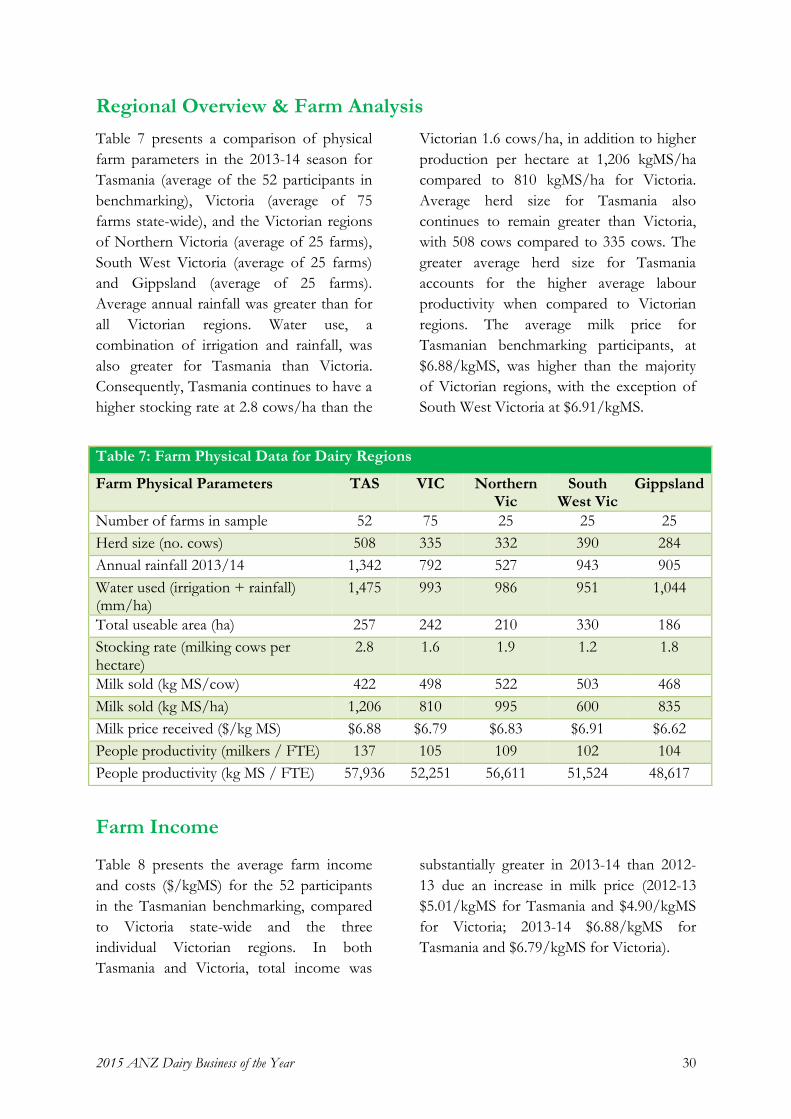
Regional Overview & Farm Analysis
Table 7 presents a comparison of physical
farm parameters in the 2013-14 season for
Tasmania (average of the 52 participants in
benchmarking), Victoria (average of 75
farms state-wide), and the Victorian regions
of Northern Victoria (average of 25 farms),
South West Victoria (average of 25 farms)
and Gippsland (average of 25 farms).
Average annual rainfall was greater than for
all Victorian regions. Water use, a
combination of irrigation and rainfall, was
also greater for Tasmania than Victoria.
Consequently, Tasmania continues to have a
higher stocking rate at 2.8 cows/ha than the
Victorian 1.6 cows/ha, in addition to higher
production per hectare at 1,206 kgMS/ha
compared to 810 kgMS/ha for Victoria.
Average herd size for Tasmania also
continues to remain greater than Victoria,
with 508 cows compared to 335 cows. The
greater average herd size for Tasmania
accounts for the higher average labour
productivity when compared to Victorian
regions. The average milk price for
Tasmanian benchmarking participants, at
$6.88/kgMS, was higher than the majority
of Victorian regions, with the exception of
South West Victoria at $6.91/kgMS.
Farm Income
Table 8 presents the average farm income
and costs ($/kgMS) for the 52 participants
in the Tasmanian benchmarking, compared
to Victoria state-wide and the three
individual Victorian regions. In both
Tasmania and Victoria, total income was
substantially greater in 2013-14 than 2012-
13 due an increase in milk price (2012-13
$5.01/kgMS for Tasmania and $4.90/kgMS
for Victoria; 2013-14 $6.88/kgMS for
Tasmania and $6.79/kgMS for Victoria).
Table 7: Farm Physical Data for Dairy Regions
Farm Physical Parameters TAS VIC Northern Vic
South West Vic
Gippsland
Number of farms in sample 52 75 25 25 25
Herd size (no. cows) 508 335 332 390 284
Annual rainfall 2013/14 1,342 792 527 943 905
Water used (irrigation + rainfall) (mm/ha)
1,475 993 986 951 1,044
Total useable area (ha) 257 242 210 330 186
Stocking rate (milking cows per hectare)
2.8 1.6 1.9 1.2 1.8
Milk sold (kg MS/cow) 422 498 522 503 468
Milk sold (kg MS/ha) 1,206 810 995 600 835
Milk price received ($/kg MS) $6.88 $6.79 $6.83 $6.91 $6.62
People productivity (milkers / FTE) 137 105 109 102 104
People productivity (kg MS / FTE) 57,936 52,251 56,611 51,524 48,617

2015 ANZ Dairy Business of the Year 31
Operating Costs
Table 8 shows a comparison of operating
costs between Tasmania and the Victorian
regions. Total operating costs for the 52
Tasmanian farms participating in the
benchmarking were substantially lower than
those for all Victorian regions and Victoria
as a whole, at $5.05/kg MS compared to
$5.42/kg MS for Victoria. This difference is
largely due to the lower cost of purchased
feed and agistment for Tasmanian farms, at
$1.61/kg MS compared to $1.90/kg MS for
Victoria. The majority of overhead costs for
Tasmanian farms were lower than for
Victorian farms, with the exception of
employed labour costs, which were greater
for Tasmania at $0.71/kgMs compared to
$0.48/kgMS for Victorian farms.
Table 8: Income and Costs by Region, $/kg MS
Farm costs, $/kg MS TAS VIC Northern Vic
South West Vic
Gippsland
Income
Feed inventory change $0.05 $0.15 $0.10 $0.21 $0.15
Other farm income $0.05 $0.10 $0.12 $0.05 $0.12
Livestock trading profit $0.55 $0.41 $0.41 $0.38 $0.48
Milk income (net) $6.88 $6.79 $6.83 $6.91 $6.62
Total income $7.52 $7.44 $7.46 $7.54 $7.33
Variable Costs
Shed cost $0.23 $0.22 $0.21 $0.23 $0.21
Herd cost $0.23 $0.28 $0.27 $0.25 $0.31
Home grown feed cost $0.95 $1.00 $1.17 $0.96 $0.88
Purchased feed and agistment $1.61 $1.90 $1.96 $1.94 $1.79
Total variable costs $3.02 $3.39 $3.61 $3.37 $3.19
Overhead Costs
All other overheads $0.16 $0.25 $0.23 $0.26 $0.27
Repairs and maintenance $0.35 $0.33 $0.29 $0.41 $0.28
Depreciation $0.21 $0.21 $0.19 $0.24 $0.21
Employed labour $0.71 $0.48 $0.46 $0.47 $0.49
Imputed labour $0.51 $0.76 $0.66 $0.77 $0.86
Total overhead costs $2.03 $2.03 $1.83 $2.14 $2.11
Total operating costs, $/kg MS $5.05 $5.42 $5.44 $5.51 $5.30
EBIT, $/kg MS $2.43 $2.02 $2.02 $2.03 $2.03

2015 ANZ Dairy Business of the Year 32
Earnings Before Interest & Tax (EBIT)
When assessing whole farm business
performance, Earnings Before Interest and
Tax, EBIT, is used to analyse individual
farms and compare different farms. EBIT
excludes interest and lease costs, so it is also
equivalent to the profit that would be
achieved at 100% equity. An increase in milk
price for the 2013-14 season saw a
substantial increase in EBIT/kg MS
compared to 2012-13 for participants in the
Tasmanian benchmarking, and Victoria.
Average EBIT/kg MS for Tasmanian farms
for 2013-14 was $2.43/kg MS, compared to
$1.02/kg MS in 2012-13. Victorian farms
EBIT/kg MS also increased, from $0.09 in
2012-13 to $2.02 in 2013-14. Figure 6
presents the operating profit, EBIT/kg MS
for Tasmania, Victoria state-wide and
Victorian regions for the 2013-14 season.
Return on Assets & Equity
Return on Assets (RoA) is EBIT expressed
as a percentage of total farm assets, and is
thus an indicator of the earning power of
total assets, irrespective of capital structure.
RoA can also be used as an indicator of the
overall efficiency of use of the resources
that are involved in the production system
and can be compared with returns achieved
elsewhere in the economy. In the Tasmanian
benchmarking program, the Return on
Assets Managed (RoAM) is used, as it takes
into account leased land as an asset in the
farming business.
Return on equity is the net farm income
(EBIT less interest and lease charges)
expressed as a percentage of the owners’
equity, and is a measure of the owners’ rate
of return on their investment. Items not
accounted for in net farm income are loan
principle repayments and tax.
2.43
2.02 2.02 2.03 2.03
0
0.5
1
1.5
2
2.5
3
Tasmania Victoria Northern Vic South West Vic Gippsland
EB
IT (
$ p
er
kg
MS
)
Figure 6: Operating Profit, $ per kg MS
2015 ANZ Dairy Business of the Year 33
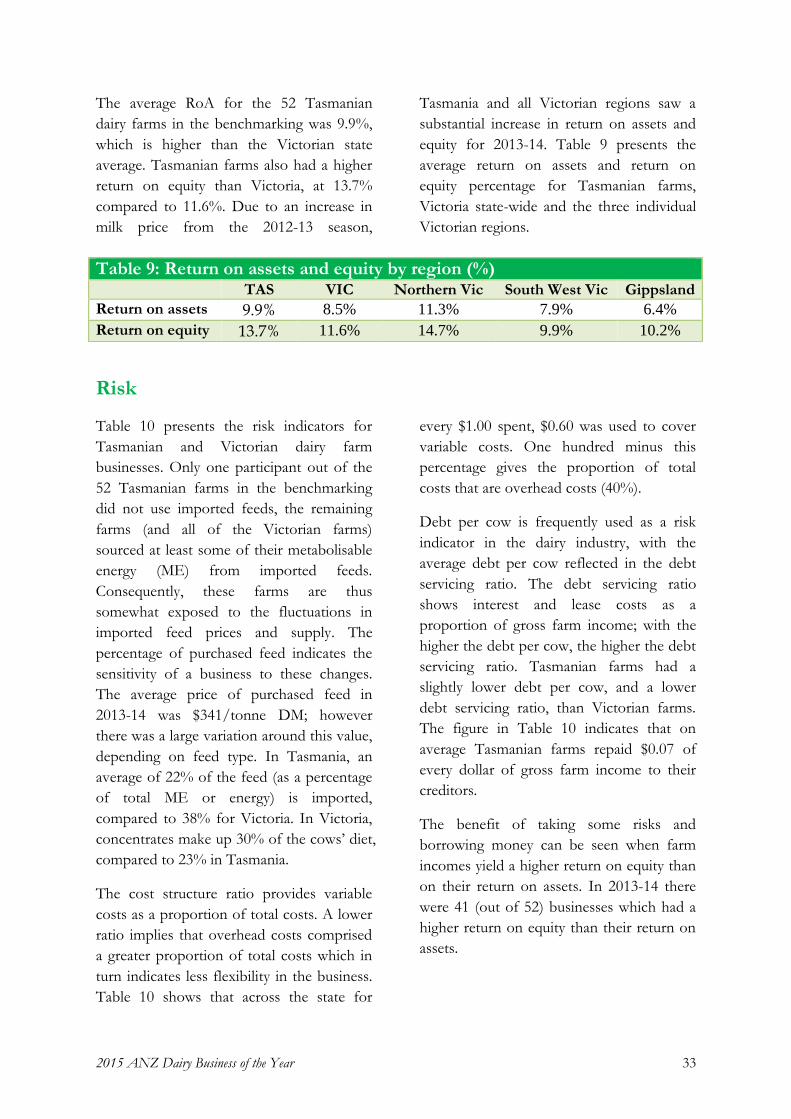
The average RoA for the 52 Tasmanian
dairy farms in the benchmarking was 9.9%,
which is higher than the Victorian state
average. Tasmanian farms also had a higher
return on equity than Victoria, at 13.7%
compared to 11.6%. Due to an increase in
milk price from the 2012-13 season,
Tasmania and all Victorian regions saw a
substantial increase in return on assets and
equity for 2013-14. Table 9 presents the
average return on assets and return on
equity percentage for Tasmanian farms,
Victoria state-wide and the three individual
Victorian regions.
Risk
Table 10 presents the risk indicators for
Tasmanian and Victorian dairy farm
businesses. Only one participant out of the
52 Tasmanian farms in the benchmarking
did not use imported feeds, the remaining
farms (and all of the Victorian farms)
sourced at least some of their metabolisable
energy (ME) from imported feeds.
Consequently, these farms are thus
somewhat exposed to the fluctuations in
imported feed prices and supply. The
percentage of purchased feed indicates the
sensitivity of a business to these changes.
The average price of purchased feed in
2013-14 was $341/tonne DM; however
there was a large variation around this value,
depending on feed type. In Tasmania, an
average of 22% of the feed (as a percentage
of total ME or energy) is imported,
compared to 38% for Victoria. In Victoria,
concentrates make up 30% of the cows’ diet,
compared to 23% in Tasmania.
The cost structure ratio provides variable
costs as a proportion of total costs. A lower
ratio implies that overhead costs comprised
a greater proportion of total costs which in
turn indicates less flexibility in the business.
Table 10 shows that across the state for
every $1.00 spent, $0.60 was used to cover
variable costs. One hundred minus this
percentage gives the proportion of total
costs that are overhead costs (40%).
Debt per cow is frequently used as a risk
indicator in the dairy industry, with the
average debt per cow reflected in the debt
servicing ratio. The debt servicing ratio
shows interest and lease costs as a
proportion of gross farm income; with the
higher the debt per cow, the higher the debt
servicing ratio. Tasmanian farms had a
slightly lower debt per cow, and a lower
debt servicing ratio, than Victorian farms.
The figure in Table 10 indicates that on
average Tasmanian farms repaid $0.07 of
every dollar of gross farm income to their
creditors.
The benefit of taking some risks and
borrowing money can be seen when farm
incomes yield a higher return on equity than
on their return on assets. In 2013-14 there
were 41 (out of 52) businesses which had a
higher return on equity than their return on
assets.
Table 9: Return on assets and equity by region (%) TAS VIC Northern Vic South West Vic Gippsland
Return on assets 9.9% 8.5% 11.3% 7.9% 6.4%
Return on equity 13.7% 11.6% 14.7% 9.9% 10.2%

2015 ANZ Dairy Business of the Year Awards 34
Table 10: Risk Indicators by Region TAS VIC Northern
Vic South
West Vic Gippsland
Cost structure (proportion of total costs that are variable costs)
60% 63% 66% 61% 60%
Debt service ratio (finance costs as % of income)
7% 9% 7% 9% 9%
Debt per cow $3,171 $3,977 $3,489 $4,476 $3,964
Equity percentage (ownership of total assets managed)
71% 62% 59% 60% 66%
Percentage of feed imported (as a % of total ME)
22% 38% 43% 38% 32%
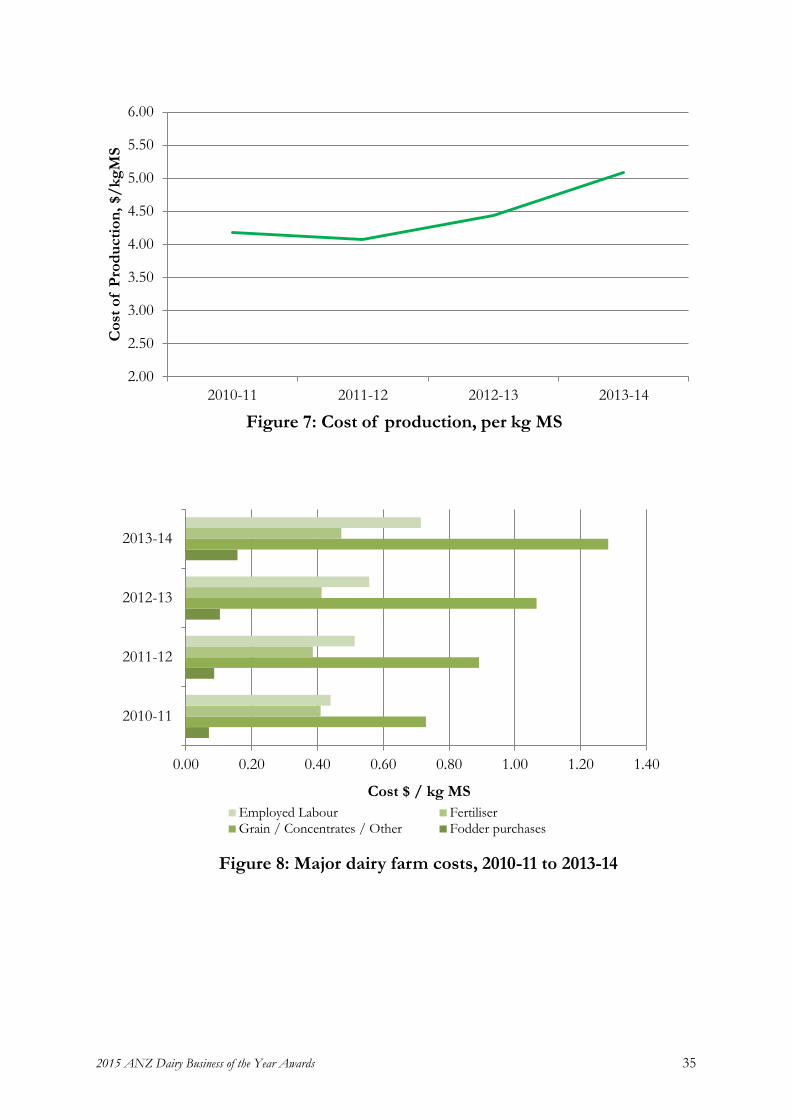
Cost of Production – Tasmania
The cost of production for Tasmanian dairy
farms has continued to increase over the last
four seasons, as shown in Figure 7, due
predominately to an increase in several key
variable and overhead costs. Variable costs
are those costs directly associated with
production, such as animal health,
supplementary feeding, fertiliser, agistment
costs and so on. Overhead costs are
relatively unresponsive to small changes in
the scale of operation of a business, and
includes costs such as depreciation,
administration, repairs and maintenance.
Figure 8 presents the three major variable
costs and major overhead costs that have
increased from 2010-11 to 2013-14. These
are made up of grain and concentrate
purchases, hay and silage purchases, fertiliser
and labour. These four areas have seen a
marked increase over this period. Of the
total variable costs for 2013-14
($3.06/kgMS), grain and concentrate
purchases made up 42%. Of total overhead
costs for 2013-14 ($2.03/kgMS), labour
costs made up 35%. As a percentage of total
costs for the 2013-14 season, at $5.09/kgMS,
labour costs made up the largest portion at
35%, with grain and concentrate purchases
25%, fertiliser 23% and hay and silage
purchases 8% - together accounting for 91%
of the total costs for Tasmanian dairy
businesses.
2015 ANZ Dairy Business of the Year Awards 35
2.00
2.50
3.00
3.50
4.00
4.50
5.00
5.50
6.00
2010-11 2011-12 2012-13 2013-14
Co
st o
f P
rod
ucti
on
, $/
kg
MS
Figure 7: Cost of production, per kg MS
0.00 0.20 0.40 0.60 0.80 1.00 1.20 1.40
2010-11
2011-12
2012-13
2013-14
Cost $ / kg MS
Figure 8: Major dairy farm costs, 2010-11 to 2013-14
Employed Labour FertiliserGrain / Concentrates / Other Fodder purchases

2015 ANZ Dairy Business of the Year 36
Performance Indicators for All Participants 2013-14
Ranked by Return on Assets %
Farm Eff area
% eff area
irrigated
Cows milked
Labour Pasture
utilisation Milksolids production
Milk price
COP, excl
interest EBIT
Assets, owned &
leased
Return on
assets
Return on
equity
ha % nos cows/ FTE
kg DM/Mha
kg MS/ Mha
kg MS/ cow
$/kg MS $/kg MS $/Mha $/Mha % %
1 110 0% 365 170 12,127 1,409 425 $7.10 $4.27 $4,662 $22,104 21.1% 27.1%
2 290 80% 990 213 10,425 1,505 441 $6.90 $3.79 $5,738 $27,884 20.6% 20.6%
3 400 55% 700 124 12,380 1,841 526 $7.02 $4.03 $6,864 $39,406 17.4% 25.1%
4 266 80% 702 154 13,087 1,520 402 $6.69 $4.15 $6,357 $41,062 15.5% 16.6%
5 115 0% 330 134 9,755 1,052 366 $6.95 $4.63 $3,189 $20,853 15.1% 49.6%
6 411 12% 424 117 8,341 898 481 $7.40 $5.04 $2,469 $16,763 14.7% 16.7%
7 174 21% 282 161 6,946 881 331 $6.36 $4.00 $2,325 $16,007 14.5% 12.0%
8 218 77% 478 93 11,214 2,316 601 $6.92 $5.28 $5,558 $38,549 14.4% 15.5%
9 435 96% 896 212 11,725 1,624 453 $7.26 $4.02 $6,498 $45,324 14.3% 15.5%
10 143 44% 390 95 8,452 907 330 $7.11 $5.15 $2,726 $19,129 14.3% 82.3%
11 86 64% 246 100 11,179 1,311 458 $6.66 $4.35 $3,896 $28,304 13.8% 21.3%
12 139 0% 465 144 11,523 1,393 417 $6.97 $5.03 $3,073 $22,794 13.5% 16.3%
13 190 12% 500 173 9,081 1,103 419 $6.85 $4.54 $2,911 $21,629 13.5% 16.2%
14 468 17% 1,100 183 7,151 867 339 $6.73 $4.49 $2,860 $21,519 13.3% 27.9%
15 259 74% 755 247 9,354 1,249 428 $7.31 $5.02 $3,431 $25,980 13.2% 13.0%
16 344 26% 520 124 7,082 1,037 537 $7.08 $5.41 $2,444 $19,680 12.4% 19.1%
17 502 42% 850 136 10,177 1,649 458 $6.57 $4.45 $4,359 $35,352 12.3% 23.6%
18 508 24% 730 90 8,056 1,347 554 $7.36 $5.35 $3,882 $34,656 11.2% 20.6%
19 427 33% 663 114 9,353 1,100 432 $7.85 $5.36 $3,739 $33,433 11.2% 13.1%
20 300 67% 930 179 10,102 1,380 445 $6.86 $5.23 $2,797 $25,862 10.8% 10.9%
21 370 43% 790 150 10,774 1,592 534 $7.22 $5.55 $3,494 $33,388 10.5% 17.8%
22 330 35% 450 125 4,343 642 402 $7.02 $4.00 $1,843 $17,895 10.3% 12.0%
23 60 42% 220 299 13,584 2,142 467 $6.63 $4.78 $3,776 $37,447 10.1% 15.7%
24 194 69% 368 101 7,983 950 387 $6.38 $4.51 $2,483 $25,697 9.7% 10.3%
25 138 80% 385 139 11,301 1,230 441 $6.70 $3.79 $4,216 $43,920 9.6% 10.0%
26 241 48% 334 89 7,906 1,396 623 $7.35 $5.83 $3,284 $35,048 9.4% 9.9%
27 130 25% 307 116 10,820 1,013 379 $6.92 $5.09 $2,434 $26,113 9.3% 6.8%
28 176 40% 451 186 8,914 840 289 $6.45 $3.38 $2,725 $29,438 9.3% 9.4%
29 106 19% 125 139 6,186 459 356 $6.96 $4.54 $2,121 $23,706 8.9% 11.4%
30 430 67% 900 149 11,425 1,449 483 $7.17 $5.42 $3,195 $35,714 8.9% 11.8%
31 435 0% 430 94 6,155 1,589 554 $6.72 $5.12 $3,955 $45,768 8.6% 9.5%
32 226 46% 360 93 9,621 960 400 $7.48 $5.70 $2,764 $32,584 8.5% 5.2%
33 240 79% 790 169 9,937 1,416 430 $6.96 $5.22 $2,654 $31,338 8.5% 8.5%
34 559 59% 1,325 237 8,296 754 310 $6.70 $4.49 $2,144 $26,030 8.2% 8.2%
35 173 49% 380 112 9,855 1,021 395 $6.47 $5.63 $2,051 $25,126 8.2% 14.6%
36 178 46% 235 130 7,445 684 390 $6.73 $5.30 $1,876 $23,610 7.9% 8.3%
37 430 28% 680 144 8,645 1,155 424 $7.30 $4.88 $3,023 $38,719 7.8% 11.5%
38 128 35% 245 127 10,030 1,303 426 $6.78 $5.03 $2,701 $34,739 7.8% 8.1%
39 55 73% 168 158 8,721 914 299 $6.20 $3.67 $2,195 $28,295 7.8% 7.8%

2015 ANZ Dairy Business of the Year 37
Farm Eff area
% eff area
irrigated
Cows milked
Labour Pasture
utilisation Milksolids production
Milk price
COP, excl
interest EBIT
Assets, owned &
leased
Return on
assets
Return on
equity
ha % nos cows/ FTE
kg DM/Mha
kg MS/ Mha
kg MS/ cow
$/kg MS $/kg MS $/Mha $/Mha % %
40 315 32% 443 117 9,600 1,026 361 $6.15 $4.81 $2,878 $36,900 7.7% 12.3%
41 248 65% 460 89 10,328 1,673 655 $7.72 $6.19 $3,737 $48,480 7.7% 12.9%
42 239 57% 596 69 11,640 1,646 525 $7.42 $6.05 $3,171 $48,655 6.5% 4.7%
43 200 35% 710 211 7,791 1,537 433 $6.72 $5.82 $1,847 $29,397 6.3% 6.3%
44 120 0% 157 66 6,483 435 333 $7.18 $6.06 $701 $11,278 6.2% 6.2%
45 430 24% 470 98 8,939 1,322 473 $6.53 $5.44 $1,804 $32,688 5.5% 6.3%
46 92 39% 144 86 11,908 631 338 $6.53 $5.91 $965 $20,423 4.7% 4.4%
47 166 76% 489 184 9,270 1,354 458 $6.71 $5.78 $1,530 $35,414 4.3% 2.0%
48 431 44% 502 104 7,228 991 377 $6.81 $5.80 $1,513 $46,119 3.3% 1.6%
49 89 68% 269 97 10,865 661 218 $6.76 $7.12 $575 $21,484 2.7% 2.7%
50 173 23% 126 76 2,801 433 254 $6.09 $6.42 $55 $34,068 0.2% -0.9%
51 135 0% 210 97 7,480 809 270 $6.78 $7.47 -$171 $36,247 -0.5% -7.5%
Avg 255 42% 507 137 9,290 1,185 422 $6.89 $5.07 $2,969 $30,432 10.0% 13.9%
Note: Performance indicators in above table are calculated on a per milking ha (Mha) basis while in the body of the report these indicators are expressed per effective ha. The data presented in this table may not reflect averages presented elsewhere in this booklet, as not all farms that entered their information have been included in this table. Please note, however, that the exclusion of these farms has had minimal impact on the figures presented.