daffodils are what they eat: nutritional aspects of soils · daffodils are what they eat:...
TRANSCRIPT
DAFFODILS ARE WHAT THEY EAT:
NUTRITIONAL ASPECTS OF SOILS
Dick Wolkowski
Extension Soil Scientist
Department of Soil Science
University of Wisconsin - Madison
Basic concepts of soil fertility
How plants absorb nutrients
Determining nutrient need
• movement to the root surface
• absorption into plant
Essential plant nutrients• categories
• effect of soil characteristics
Liming
Sources of nutrients to plants
Soil solution
- ionic form
- low concentration
- highly buffered
Contributors to the soil solution
- exchange sites on clay and organic matter
- organic matter and microorganisms
- soil rocks and minerals
- atmosphere and precipitation
- fertilizer and other additions
Movement of ions from soils to roots
• Root interception
• Mass flow
• Diffusion
NO3-
Ca2+
Ca2+
NO3-
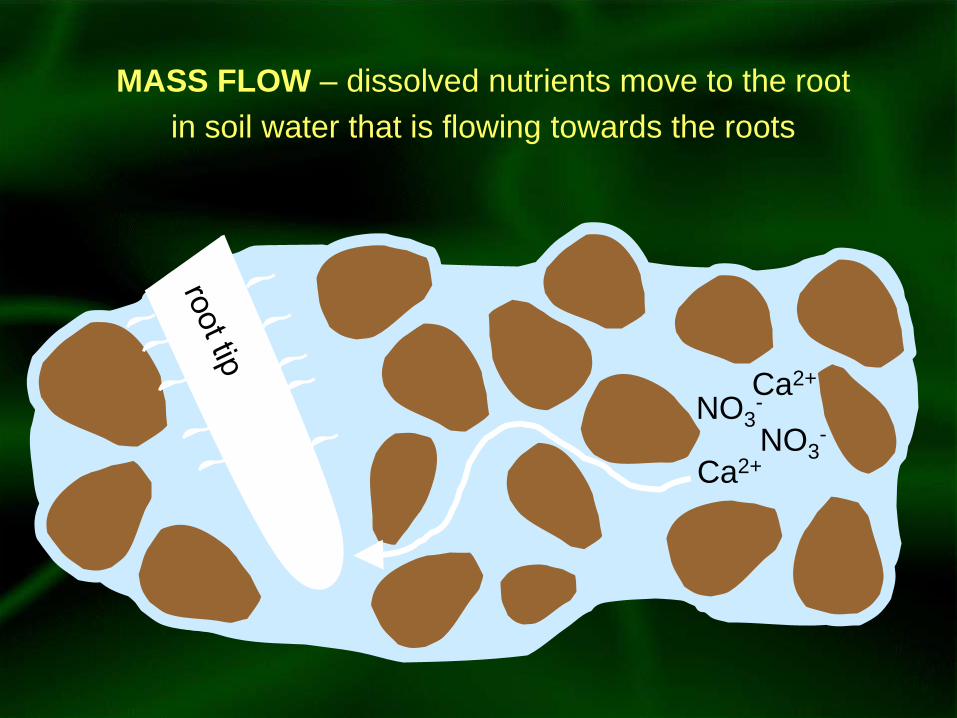
MASS FLOW – dissolved nutrients move to the root
in soil water that is flowing towards the roots
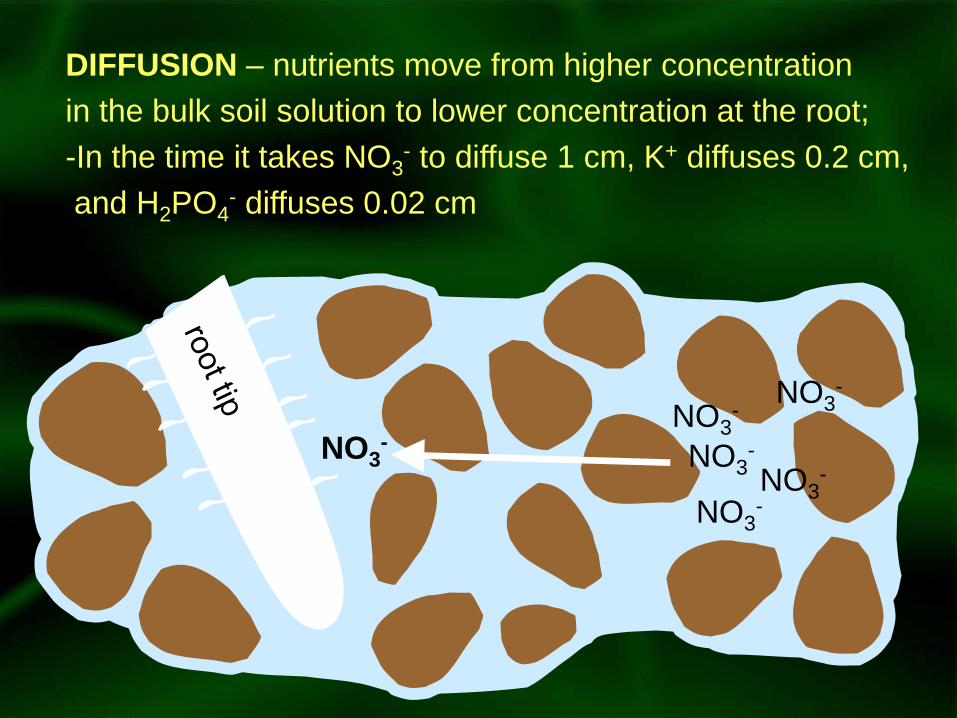
DIFFUSION – nutrients move from higher concentration
in the bulk soil solution to lower concentration at the root;
-In the time it takes NO3- to diffuse 1 cm, K+ diffuses 0.2 cm,
and H2PO4- diffuses 0.02 cm
NO3-
NO3-
NO3-
NO3-
NO3-
NO3-
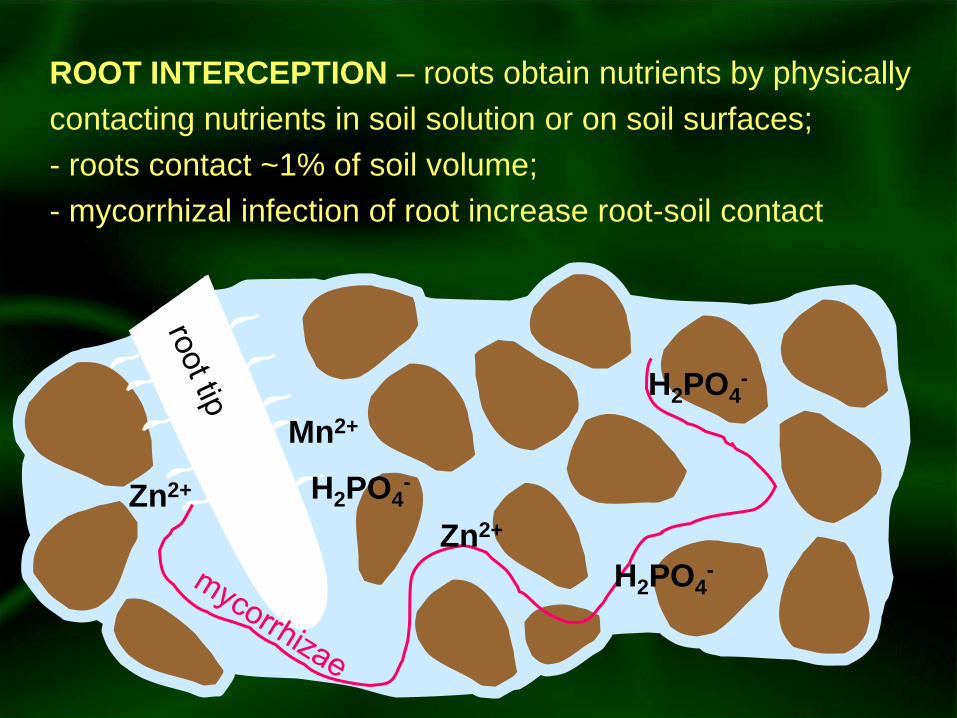
ROOT INTERCEPTION – roots obtain nutrients by physically
contacting nutrients in soil solution or on soil surfaces;
- roots contact ~1% of soil volume;
- mycorrhizal infection of root increase root-soil contact
Zn2+
Zn2+
Mn2+
H2PO4-
H2PO4-
H2PO4-
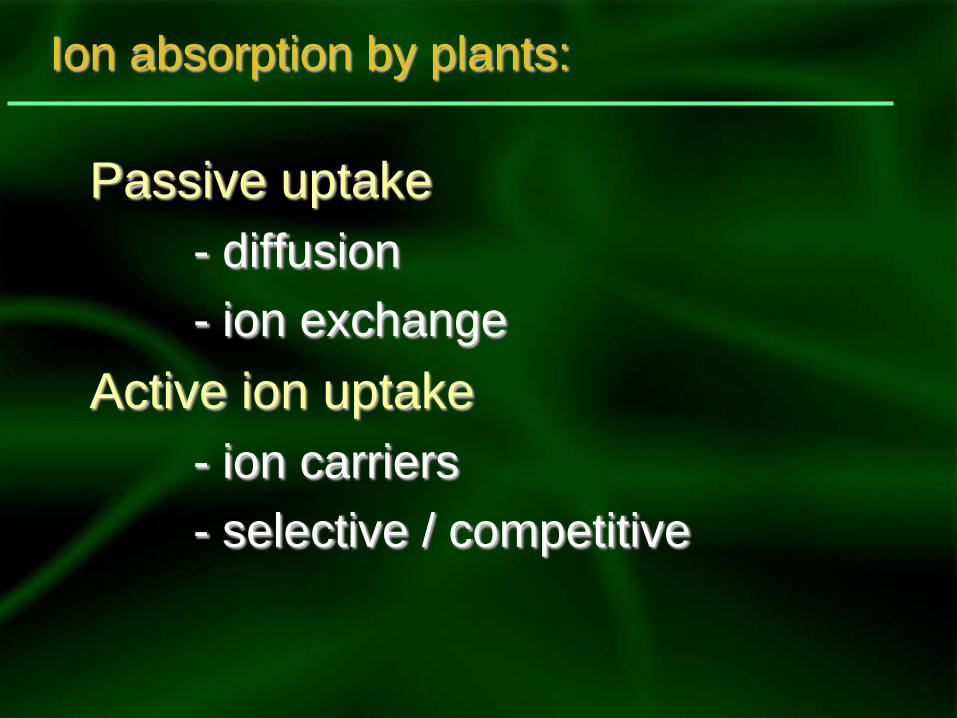
Ion absorption by plants:
Passive uptake
- diffusion
- ion exchange
Active ion uptake
- ion carriers
- selective / competitive
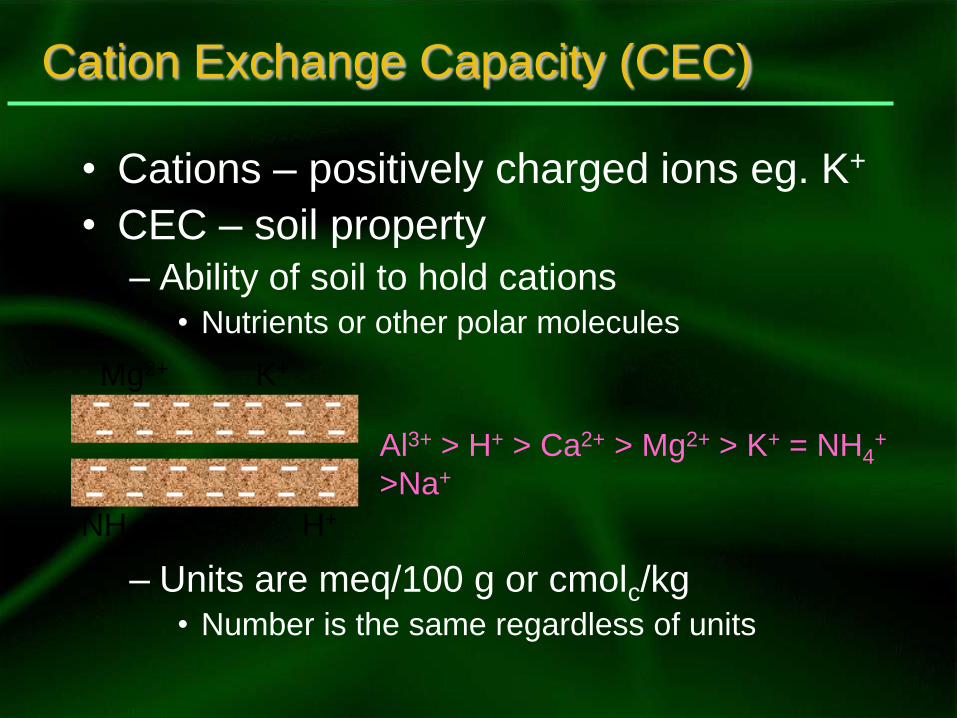
Cation Exchange Capacity (CEC)
• Cations – positively charged ions eg. K+
• CEC – soil property
– Ability of soil to hold cations• Nutrients or other polar molecules
– Units are meq/100 g or cmolc/kg• Number is the same regardless of units
K+
H+
Mg2+
Ca2+NH4+
Al3+ > H+ > Ca2+ > Mg2+ > K+ = NH4+
>Na+
Importance of CEC
• Nutrient retention
• Control levels of waste disposal
• Control levels of herbicide
• Act as buffer
• Nutrient availability
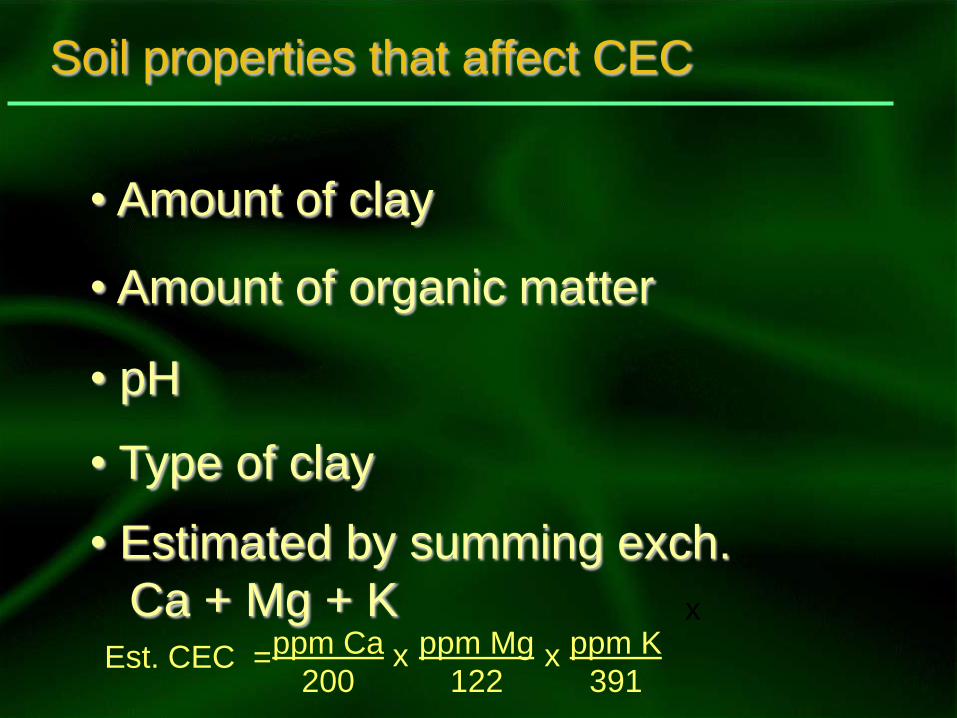
Soil properties that affect CEC
• Amount of clay
• Amount of organic matter
• pH
• Type of clay
• Estimated by summing exch.
Ca + Mg + KEst. CEC =ppm Ca
200
ppm Mg
122
ppm K
391x
x
x
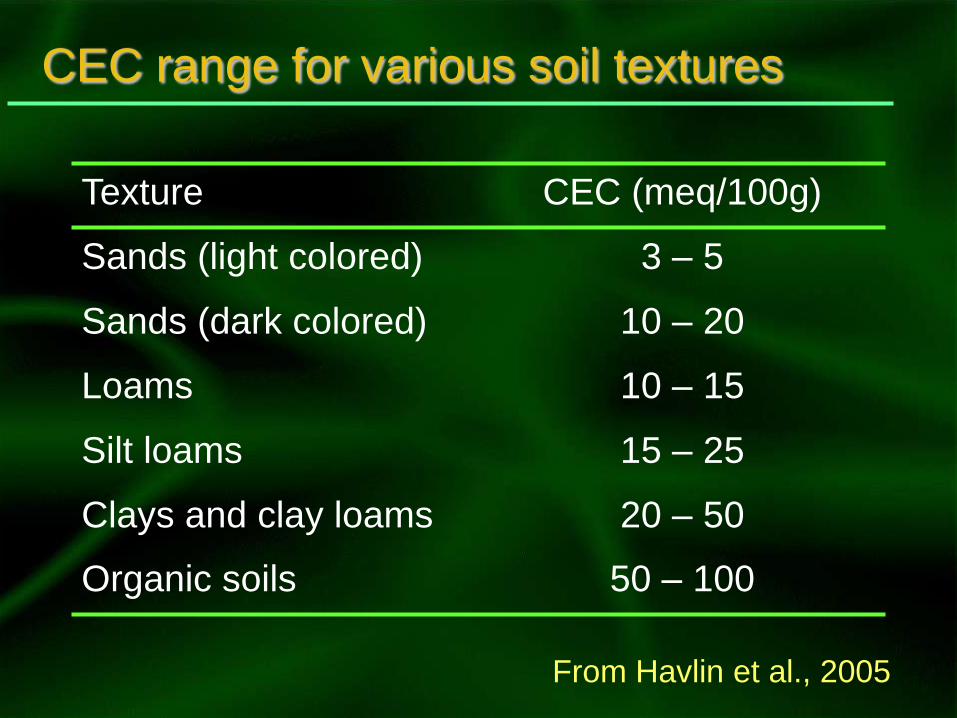
CEC range for various soil textures
Texture CEC (meq/100g)
Sands (light colored) 3 – 5
Sands (dark colored) 10 – 20
Loams 10 – 15
Silt loams 15 – 25
Clays and clay loams 20 – 50
Organic soils 50 – 100
From Havlin et al., 2005
Determining nutrient need
• Visual symptoms
• Soil testing
• Plant analysis
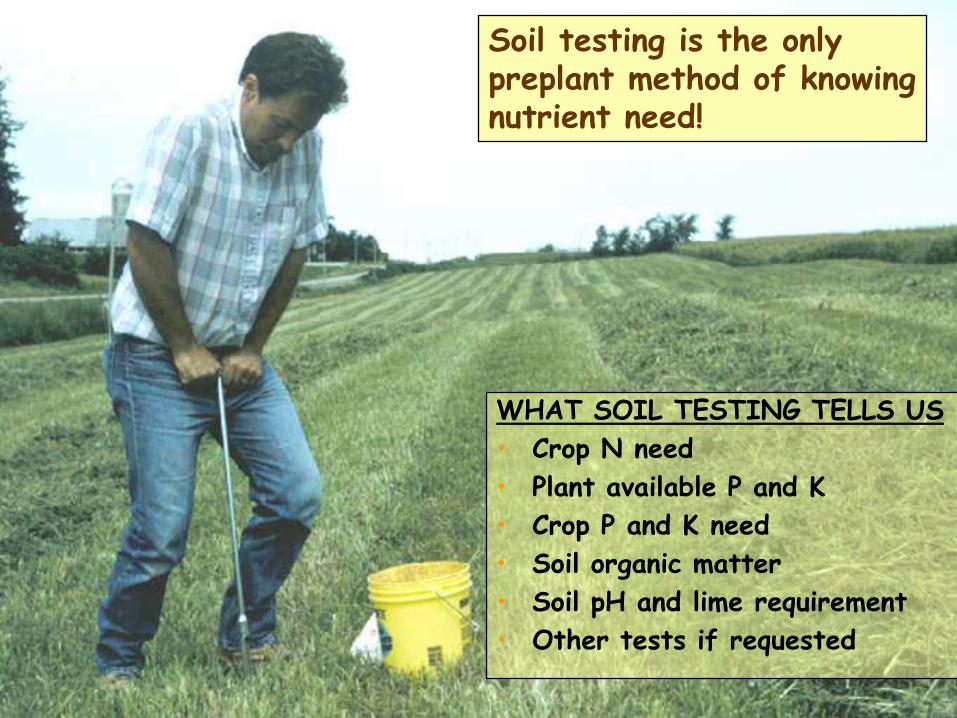
WHAT SOIL TESTING TELLS US
• Crop N need
• Plant available P and K
• Crop P and K need
• Soil organic matter
• Soil pH and lime requirement
• Other tests if requested
Soil testing is the onlypreplant method of knowingnutrient need!
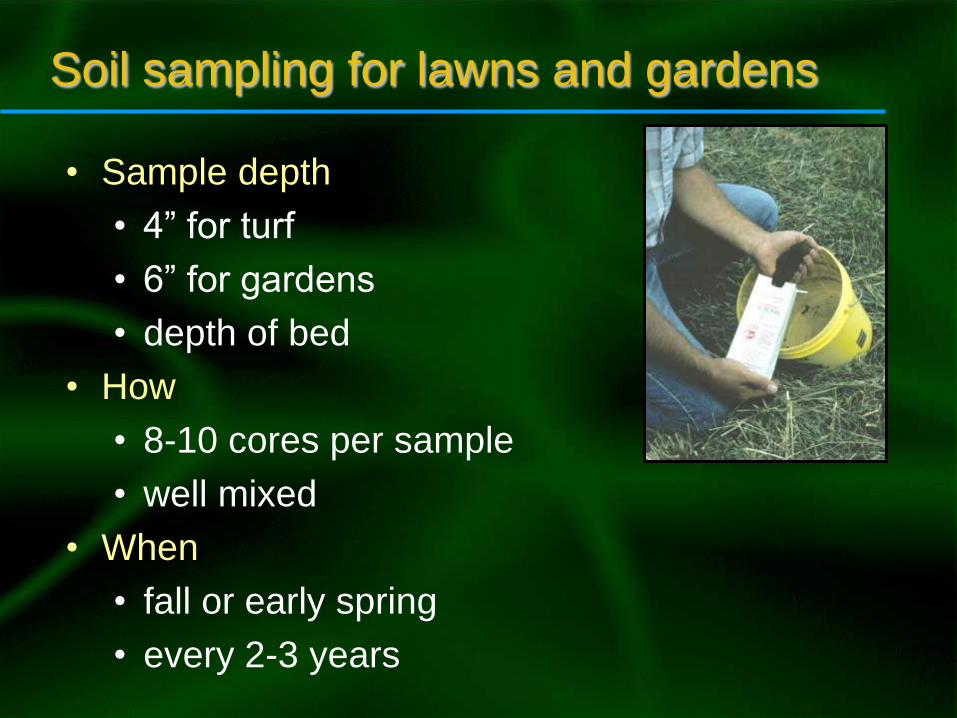
Soil sampling for lawns and gardens
• Sample depth
• 4‖ for turf
• 6‖ for gardens
• depth of bed
• How
• 8-10 cores per sample
• well mixed
• When
• fall or early spring
• every 2-3 years
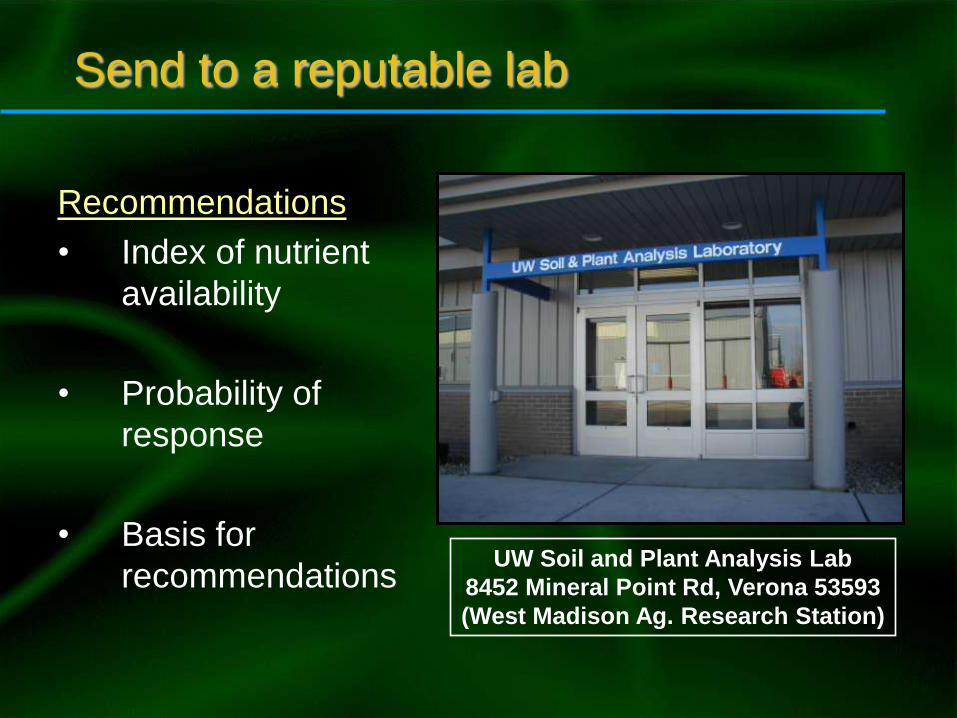
Send to a reputable lab
Recommendations
• Index of nutrient
availability
• Probability of
response
• Basis for
recommendationsUW Soil and Plant Analysis Lab
8452 Mineral Point Rd, Verona 53593
(West Madison Ag. Research Station)
Goals of nutrient management
•Maximize economic return
•Avoid environmental risks due to above-optimum use
•Rate, source, method, timing
Common soil test results
• Many soils have excessive P and K levels– Un-managed applications
– Not detrimental
– Adding more not beneficial
• pH may need modification– Raise with lime
– Lower with elemental sulfur
• Over-application of N– Delays maturity
– Excessive vegetative growth
– Possible leaching of nitrate
Plant analysis
• ―Snapshot‖ of nutrient status of plant sampled
• Multi-nutrient
• Useful for nutrients for which soil tests do not exist
• Identify deficiencies, toxicities, imbalances
• Routinely or when problems occur
Limitations of plant analysis
• Interpretation difficulties• plant parts
• stage of growth
• not well calibrated for horticultural plants
• Inter-relationship with other factors
• Progressive deficiencies
• Sample contamination/deterioration
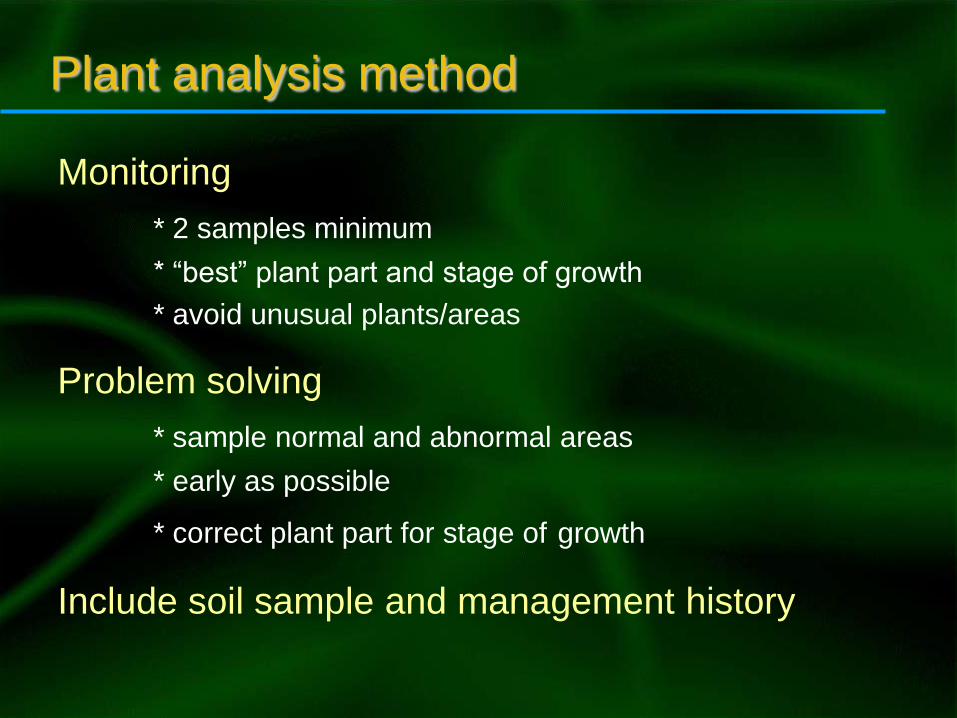
Plant analysis method
Monitoring
* 2 samples minimum
* ―best‖ plant part and stage of growth
* avoid unusual plants/areas
Problem solving
* sample normal and abnormal areas
* early as possible
* correct plant part for stage of growth
Include soil sample and management history
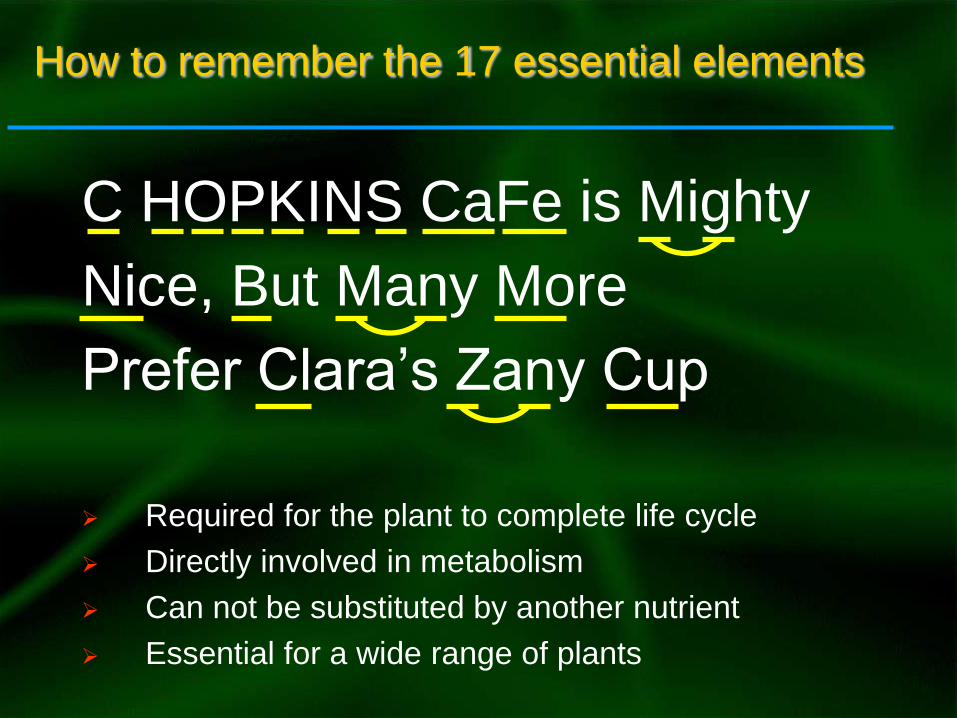
How to remember the 17 essential elements
C HOPKINS CaFe is Mighty
Nice, But Many More
Prefer Clara’s Zany Cup
Required for the plant to complete life cycle
Directly involved in metabolism
Can not be substituted by another nutrient
Essential for a wide range of plants
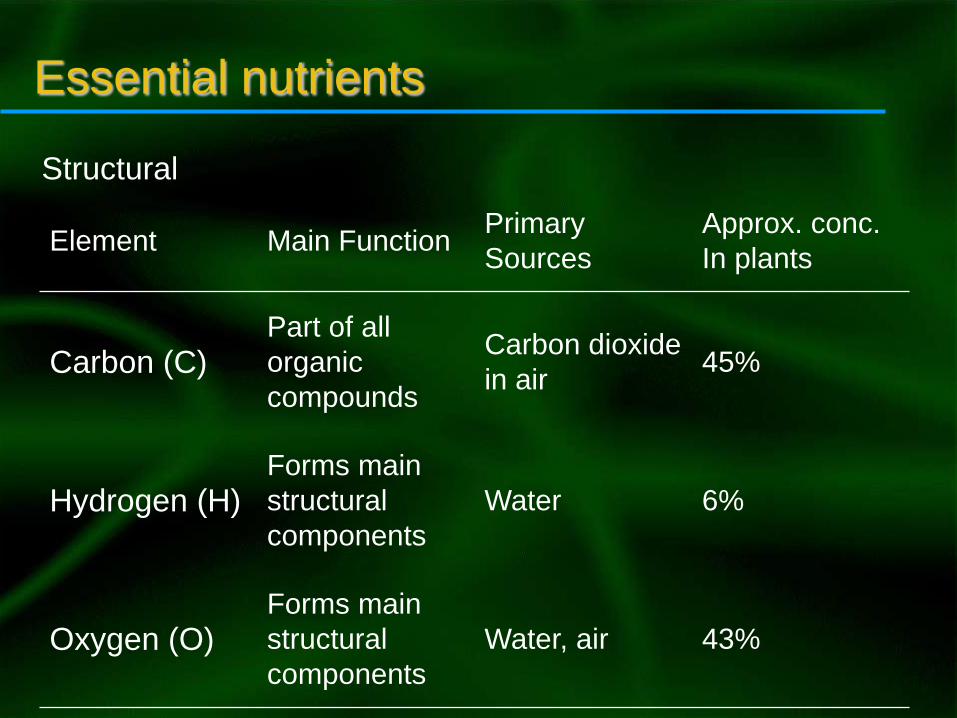
Essential nutrients
Element Main FunctionPrimary
Sources
Approx. conc.
In plants
Carbon (C)Part of all
organic
compounds
Carbon dioxide
in air45%
Hydrogen (H)Forms main
structural
components
Water 6%
Oxygen (O)Forms main
structural
components
Water, air 43%
Structural
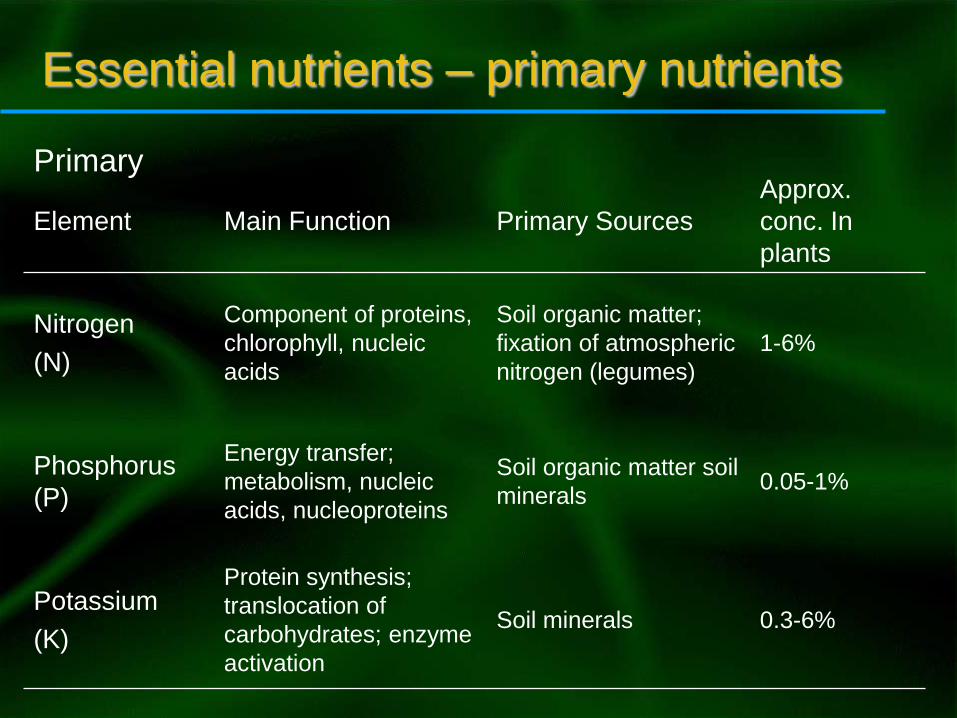
Essential nutrients – primary nutrients
Element Main Function Primary Sources
Approx.
conc. In
plants
Nitrogen
(N)
Component of proteins,
chlorophyll, nucleic
acids
Soil organic matter;
fixation of atmospheric
nitrogen (legumes)
1-6%
Phosphorus
(P)
Energy transfer;
metabolism, nucleic
acids, nucleoproteins
Soil organic matter soil
minerals0.05-1%
Potassium
(K)
Protein synthesis;
translocation of
carbohydrates; enzyme
activation
Soil minerals 0.3-6%
Primary
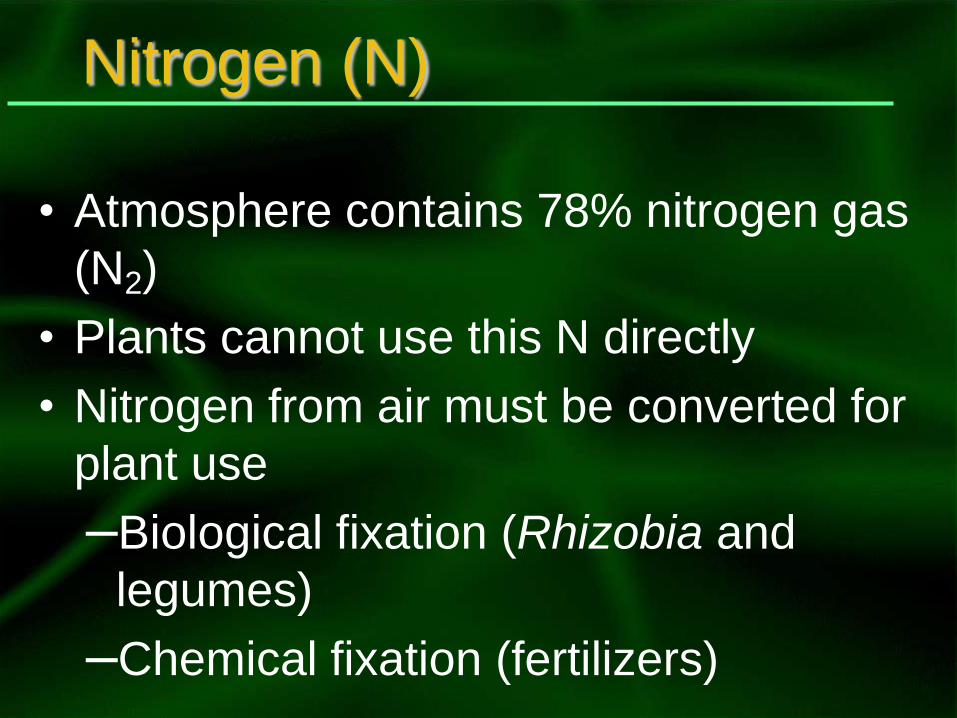
Nitrogen (N)
• Atmosphere contains 78% nitrogen gas
(N2)
• Plants cannot use this N directly
• Nitrogen from air must be converted for
plant use
–Biological fixation (Rhizobia and
legumes)
–Chemical fixation (fertilizers)
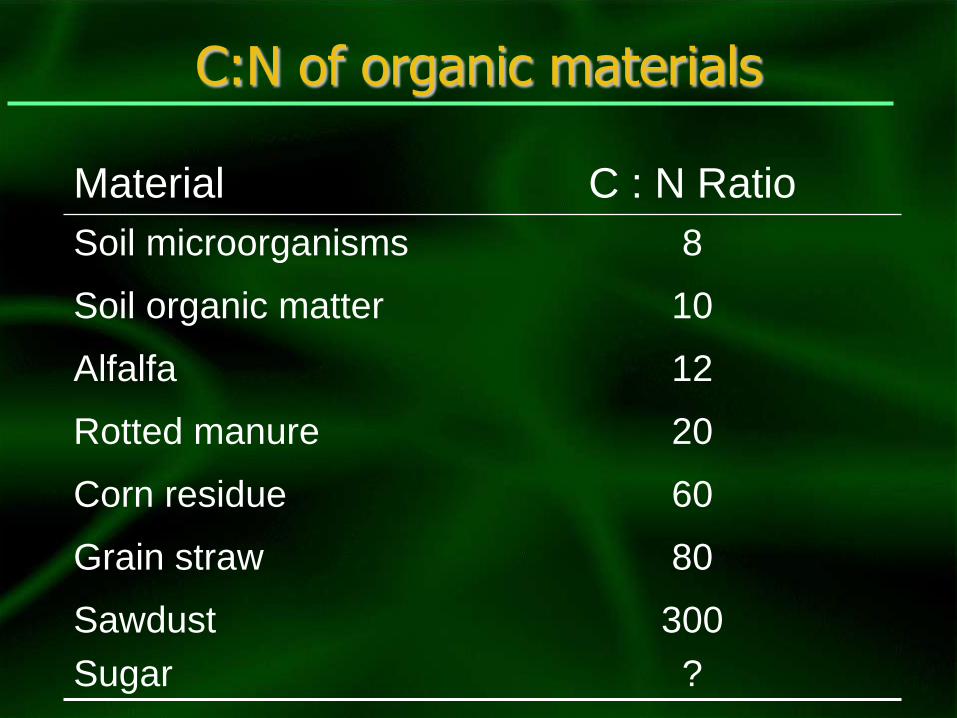
C:N of organic materials
Material C : N Ratio
Soil microorganisms 8
Soil organic matter 10
Alfalfa 12
Rotted manure 20
Corn residue 60
Grain straw 80
Sawdust
Sugar
300
?
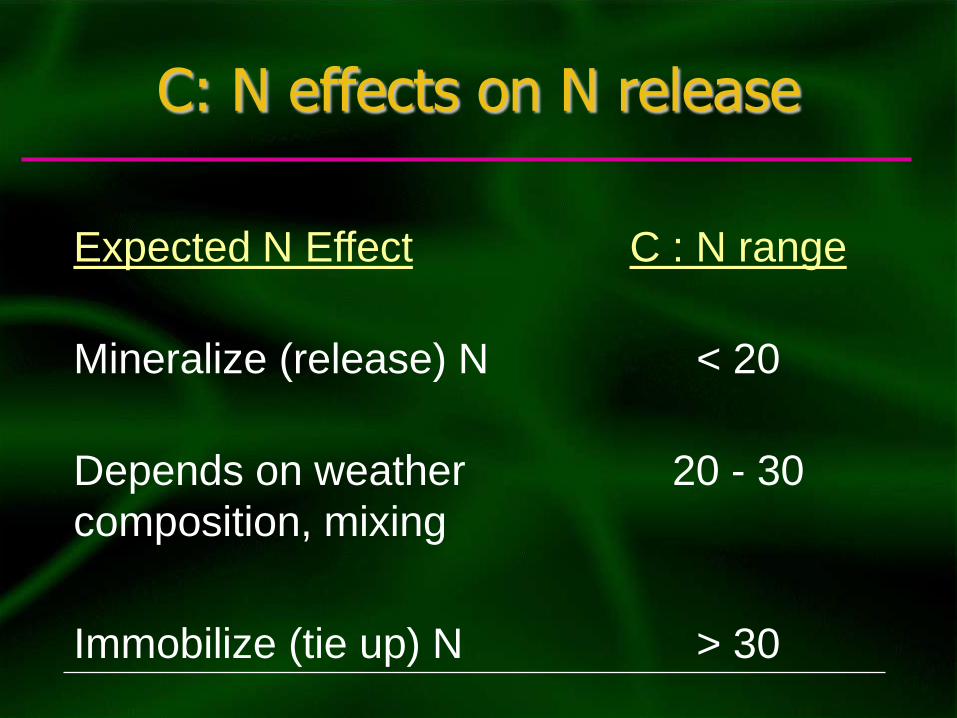
C: N effects on N release
Expected N Effect C : N range
Mineralize (release) N < 20
Depends on weather
composition, mixing
20 - 30
Immobilize (tie up) N > 30
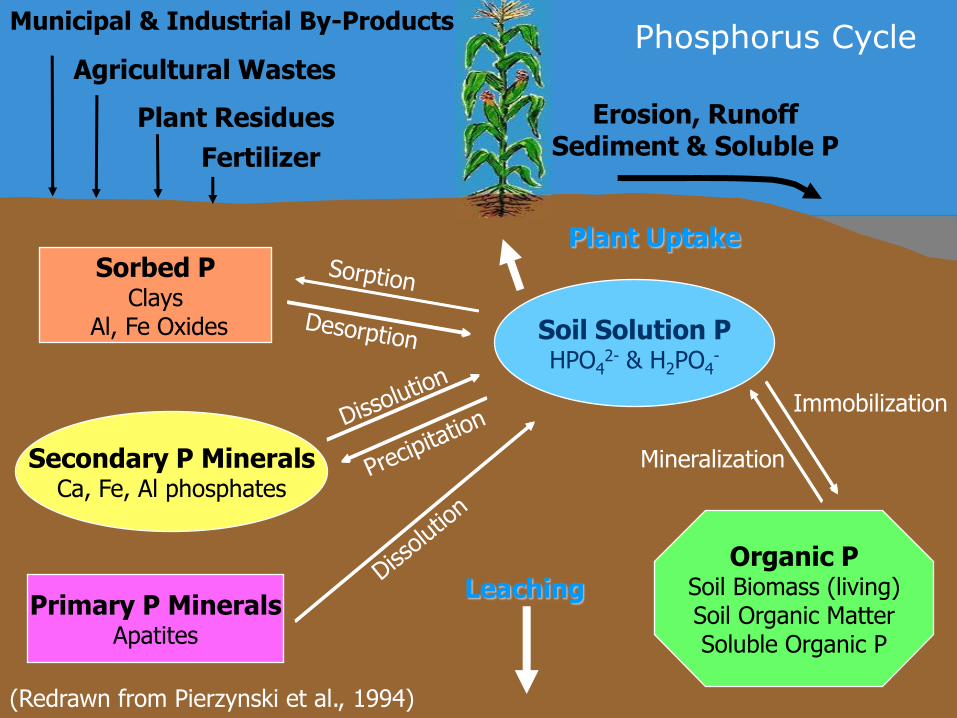
(Redrawn from Pierzynski et al., 1994)
Soil Solution PHPO4
2- & H2PO4-
Sorbed PClays
Al, Fe Oxides
Primary P MineralsApatites
Secondary P MineralsCa, Fe, Al phosphates
Organic PSoil Biomass (living)Soil Organic MatterSoluble Organic P
Immobilization
Mineralization
Leaching
Plant Uptake
Erosion, RunoffSediment & Soluble PFertilizer
Plant Residues
Agricultural Wastes
Municipal & Industrial By-ProductsPhosphorus Cycle
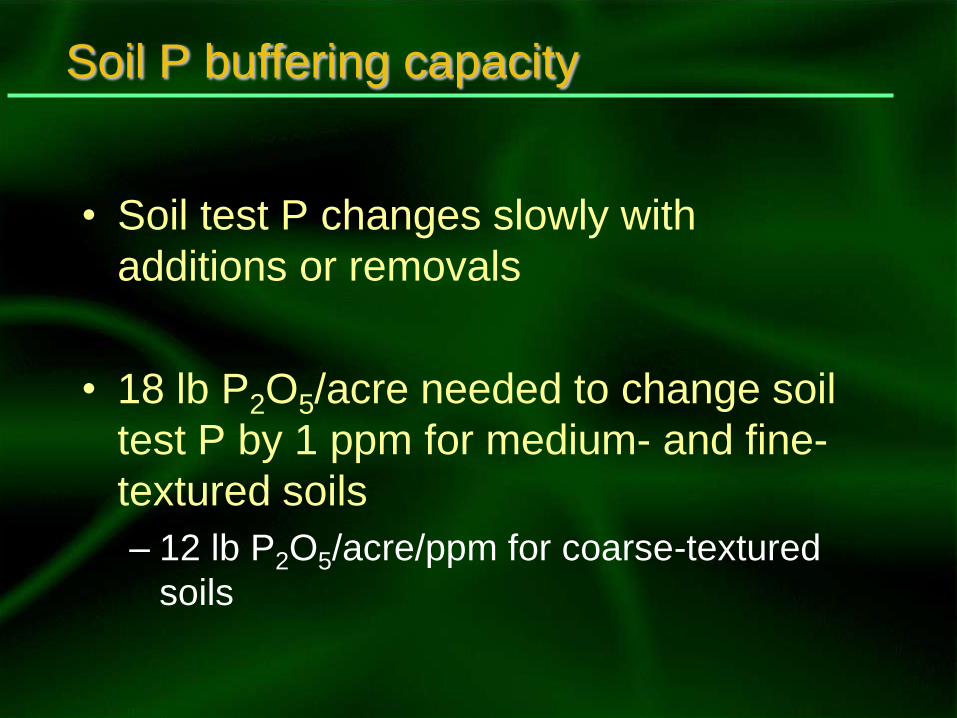
Soil P buffering capacity
• Soil test P changes slowly with
additions or removals
• 18 lb P2O5/acre needed to change soil
test P by 1 ppm for medium- and fine-
textured soils
– 12 lb P2O5/acre/ppm for coarse-textured
soils
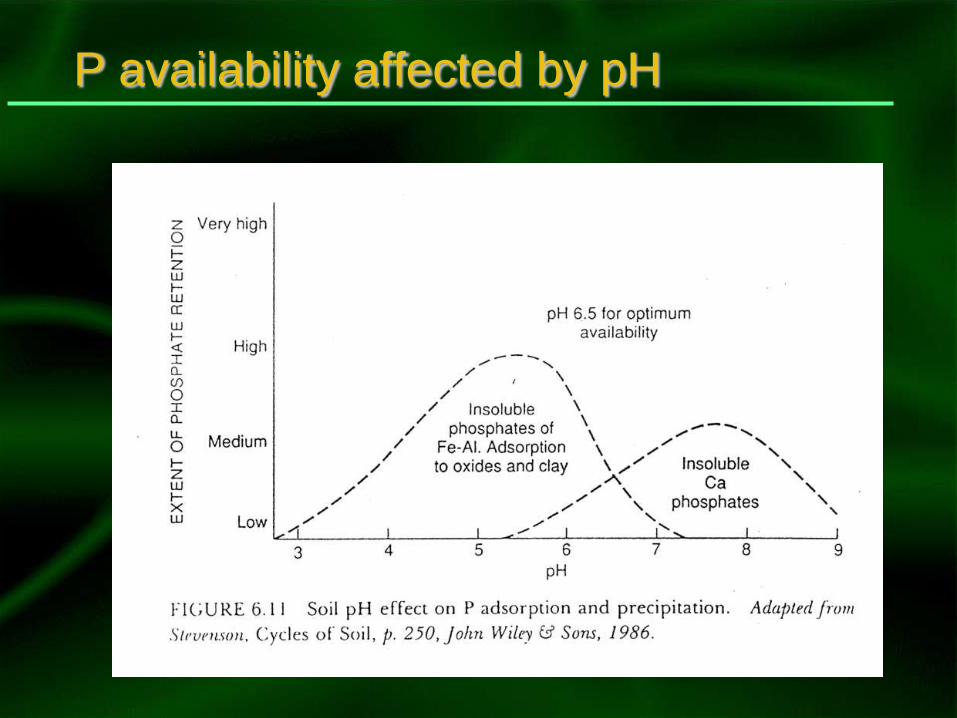
P availability affected by pH
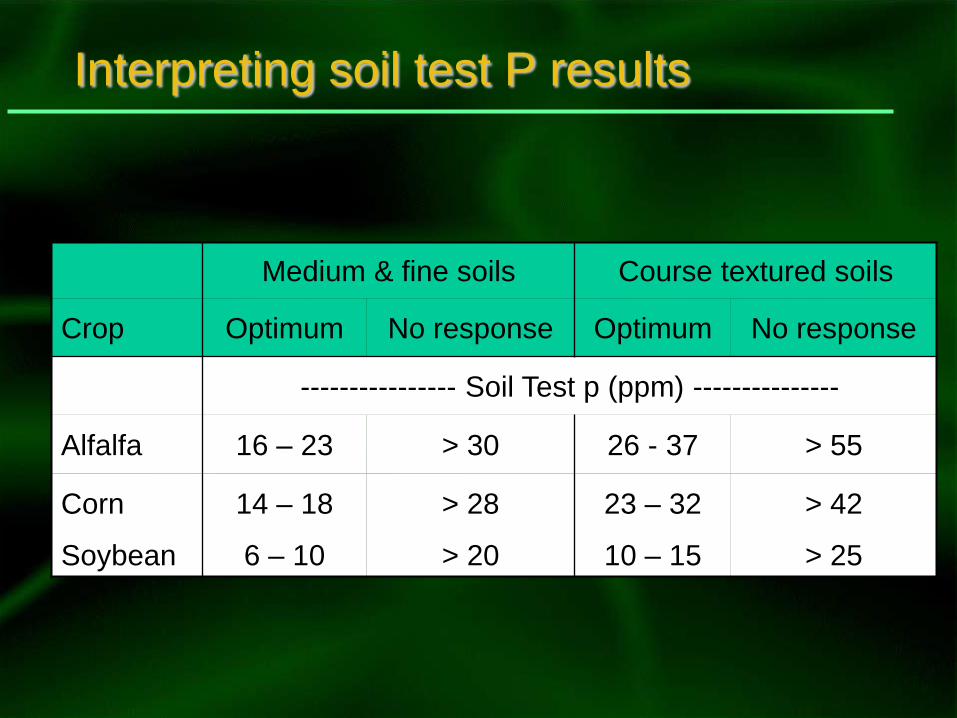
Interpreting soil test P results
Medium & fine soils Course textured soils
Crop Optimum No response Optimum No response
---------------- Soil Test p (ppm) ---------------
Alfalfa 16 – 23 > 30 26 - 37 > 55
Corn 14 – 18 > 28 23 – 32 > 42
Soybean 6 – 10 > 20 10 – 15 > 25
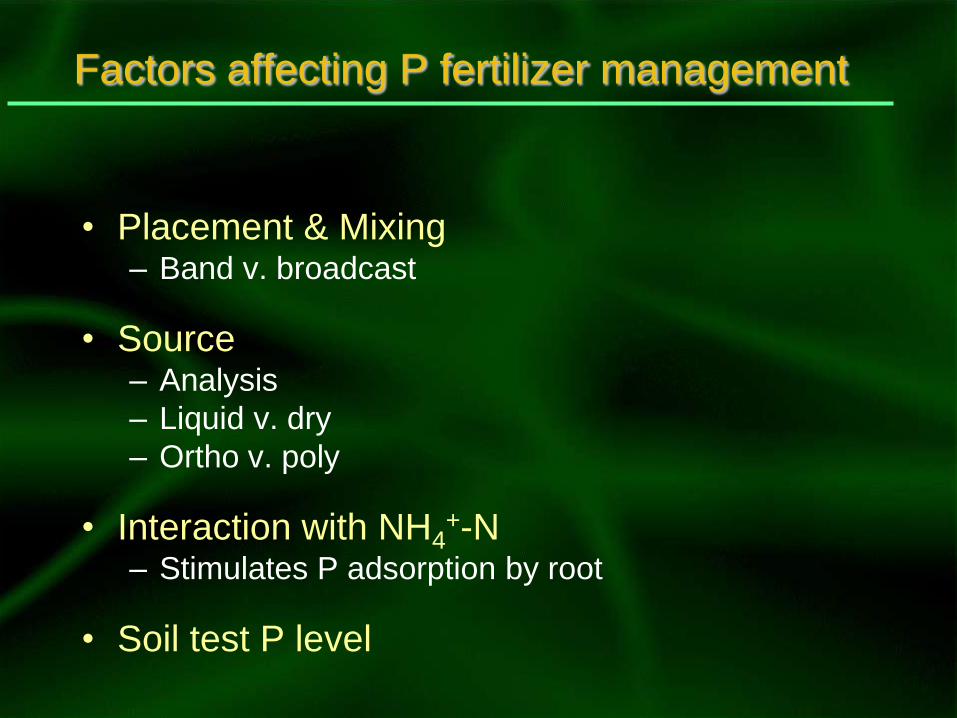
Factors affecting P fertilizer management
• Placement & Mixing– Band v. broadcast
• Source– Analysis
– Liquid v. dry
– Ortho v. poly
• Interaction with NH4+-N
– Stimulates P adsorption by root
• Soil test P level
Havlin et al., 2001
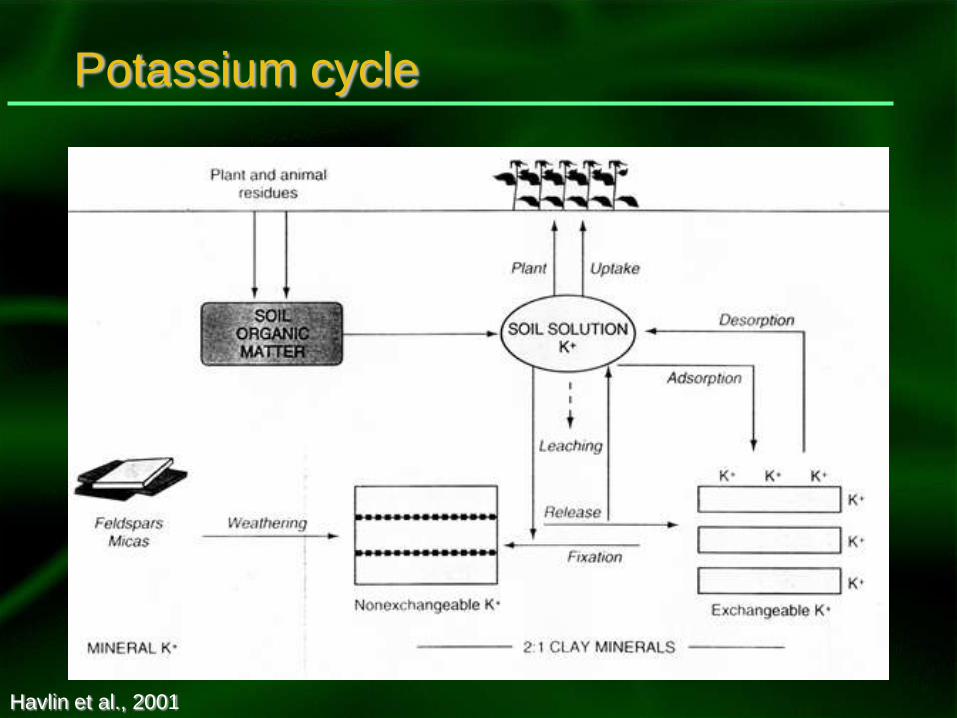
Potassium cycle
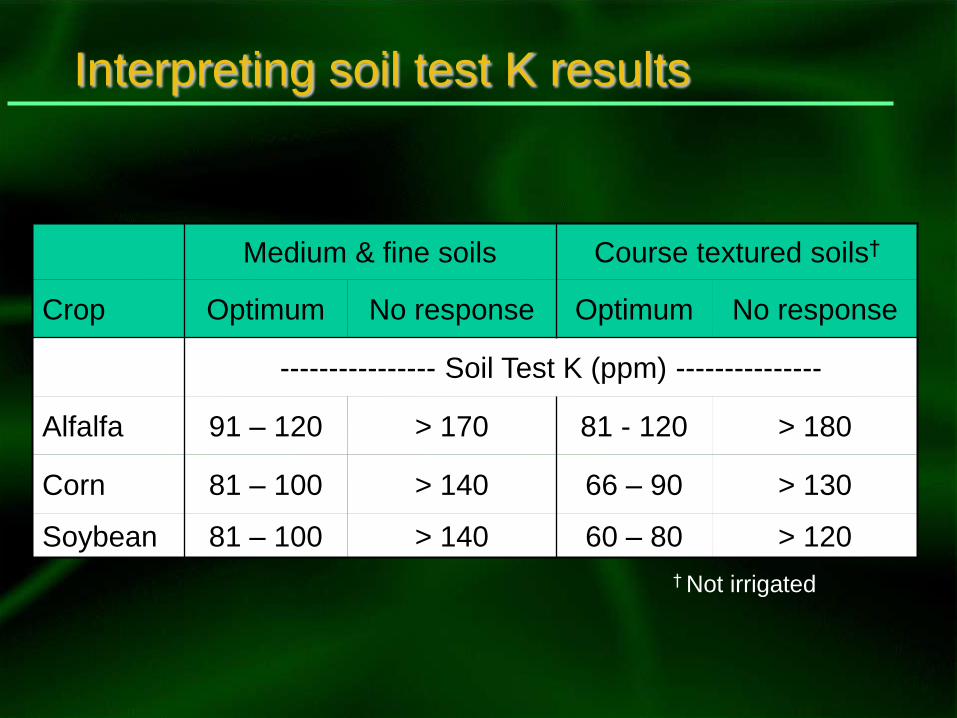
Interpreting soil test K results
Medium & fine soils Course textured soils†
Crop Optimum No response Optimum No response
---------------- Soil Test K (ppm) ---------------
Alfalfa 91 – 120 > 170 81 - 120 > 180
Corn 81 – 100 > 140 66 – 90 > 130
Soybean 81 – 100 > 140 60 – 80 > 120
† Not irrigated
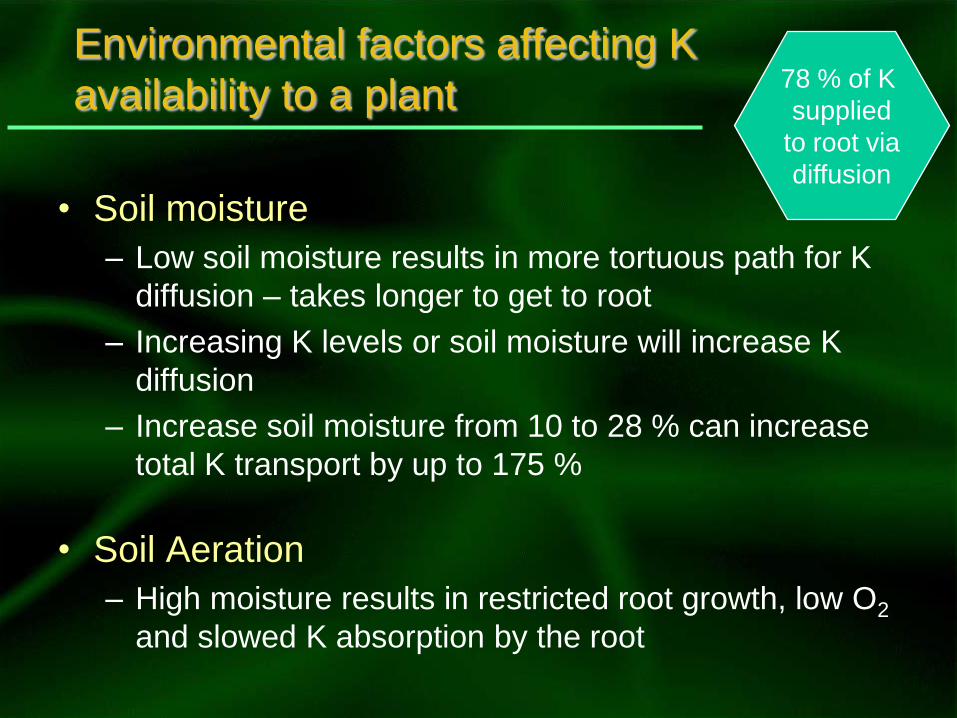
Environmental factors affecting K
availability to a plant
• Soil moisture
– Low soil moisture results in more tortuous path for K
diffusion – takes longer to get to root
– Increasing K levels or soil moisture will increase K
diffusion
– Increase soil moisture from 10 to 28 % can increase
total K transport by up to 175 %
• Soil Aeration
– High moisture results in restricted root growth, low O2
and slowed K absorption by the root
78 % of K
supplied
to root via
diffusion
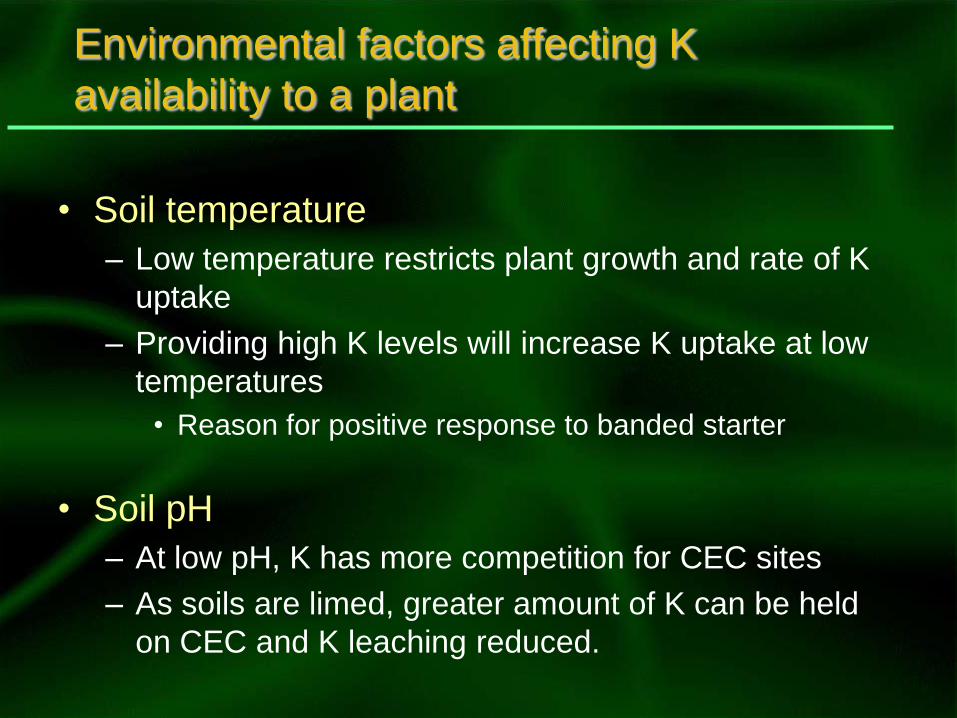
Environmental factors affecting K
availability to a plant
• Soil temperature
– Low temperature restricts plant growth and rate of K
uptake
– Providing high K levels will increase K uptake at low
temperatures
• Reason for positive response to banded starter
• Soil pH
– At low pH, K has more competition for CEC sites
– As soils are limed, greater amount of K can be held
on CEC and K leaching reduced.
Environmental factors affecting K
availability to a plant
• Leaching
– K leaching can occur on course textured or
muck soils particularly if irrigated
– Large fall K applications to sandy or muck
soils discouraged
Element Main Function Primary Sources
Approx.
conc. In
plants
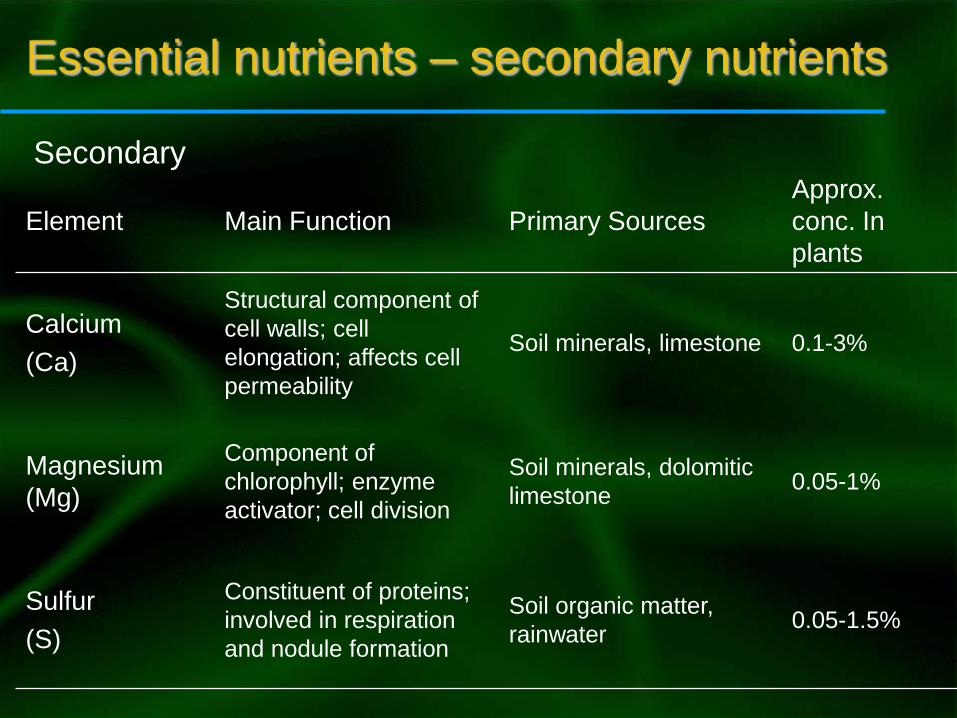
Calcium
(Ca)
Structural component of
cell walls; cell
elongation; affects cell
permeability
Soil minerals, limestone 0.1-3%
Magnesium
(Mg)
Component of
chlorophyll; enzyme
activator; cell division
Soil minerals, dolomitic
limestone0.05-1%
Sulfur
(S)
Constituent of proteins;
involved in respiration
and nodule formation
Soil organic matter,
rainwater0.05-1.5%
Secondary
Essential nutrients – secondary nutrients
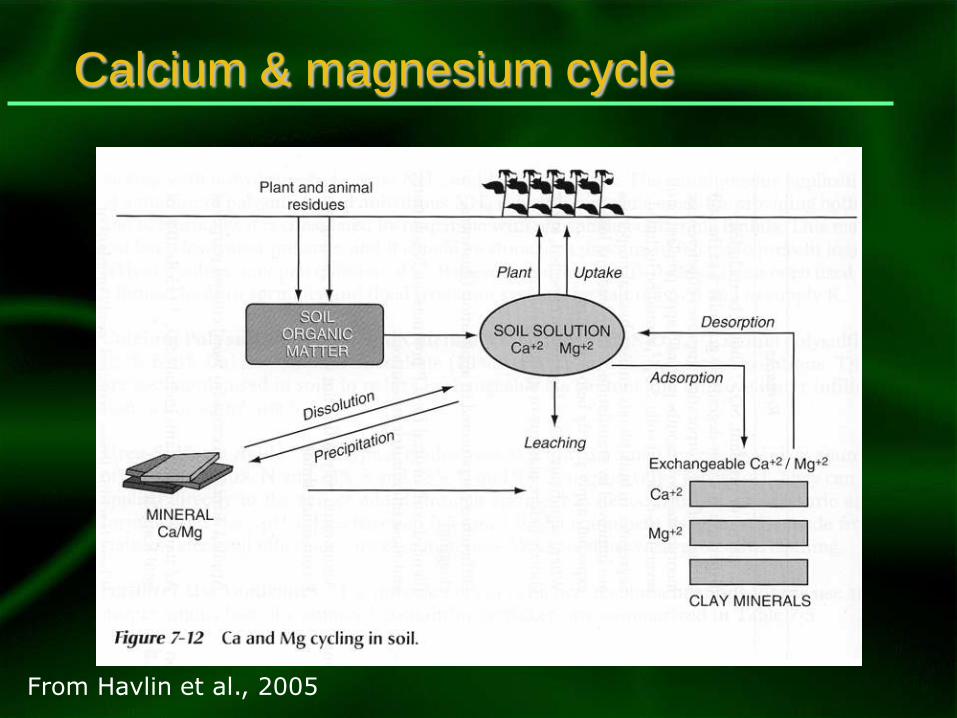
Calcium & magnesium cycle
From Havlin et al., 2005
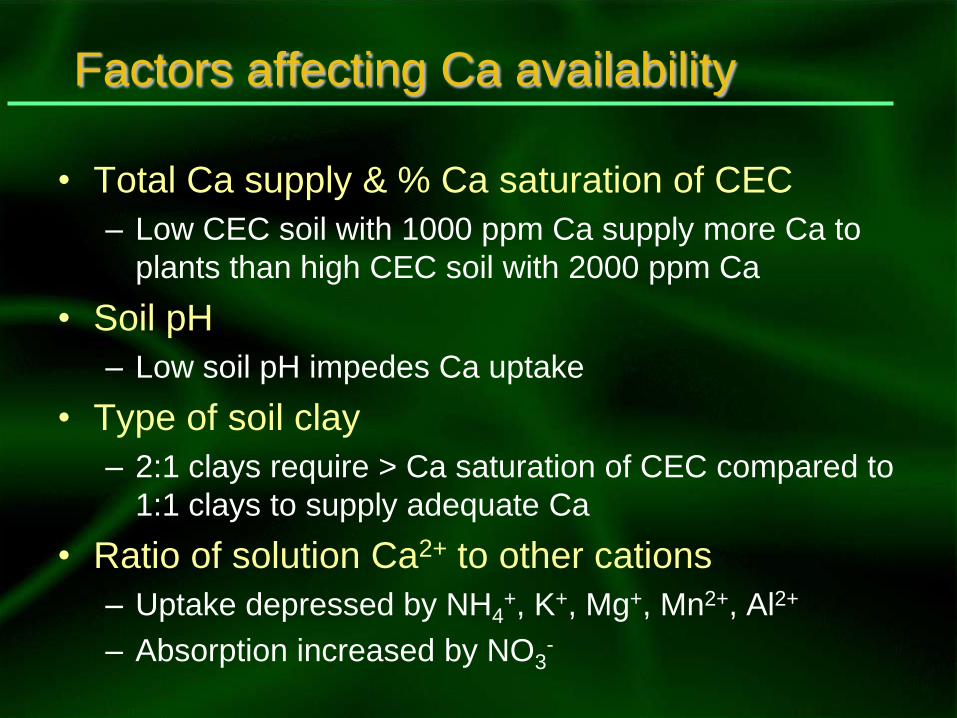
Factors affecting Ca availability
• Total Ca supply & % Ca saturation of CEC
– Low CEC soil with 1000 ppm Ca supply more Ca to
plants than high CEC soil with 2000 ppm Ca
• Soil pH
– Low soil pH impedes Ca uptake
• Type of soil clay
– 2:1 clays require > Ca saturation of CEC compared to
1:1 clays to supply adequate Ca
• Ratio of solution Ca2+ to other cations
– Uptake depressed by NH4+, K+, Mg+, Mn2+, Al2+
– Absorption increased by NO3-
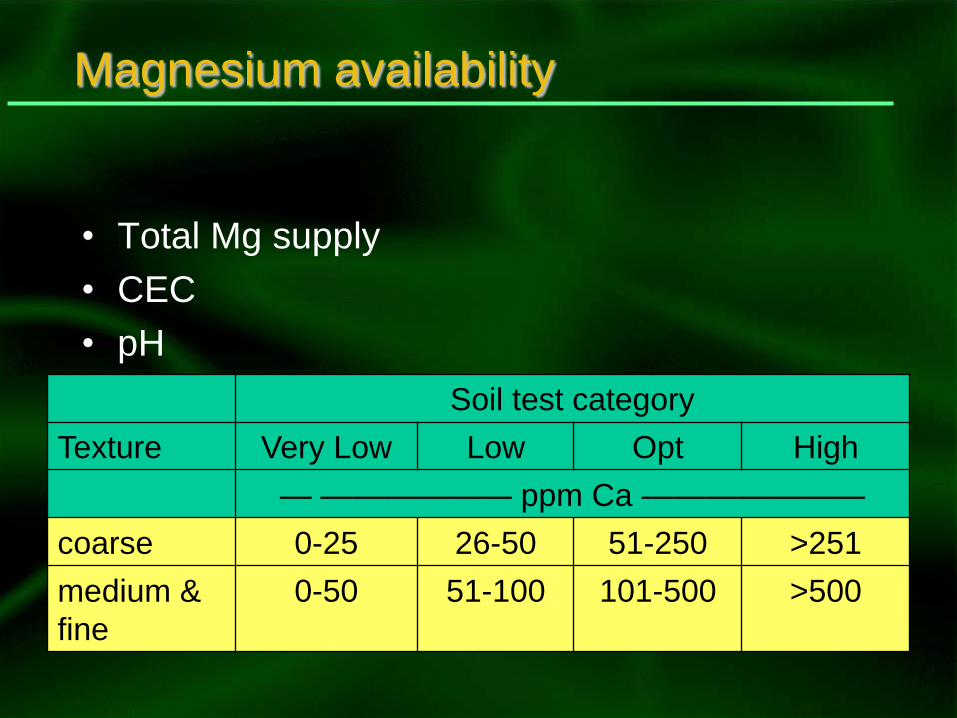
Magnesium availability
• Total Mg supply
• CEC
• pH
Soil test category
Texture Very Low Low Opt High
— —————— ppm Ca ———————
coarse 0-25 26-50 51-250 >251
medium &
fine
0-50 51-100 101-500 >500
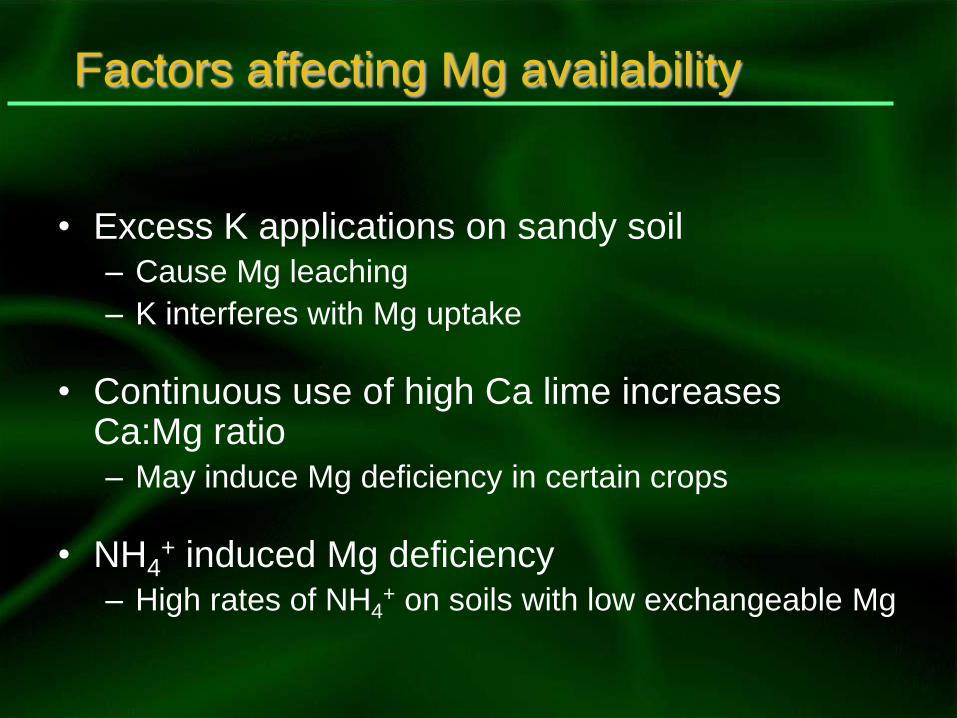
Factors affecting Mg availability
• Excess K applications on sandy soil– Cause Mg leaching
– K interferes with Mg uptake
• Continuous use of high Ca lime increases Ca:Mg ratio – May induce Mg deficiency in certain crops
• NH4+ induced Mg deficiency
– High rates of NH4+ on soils with low exchangeable Mg
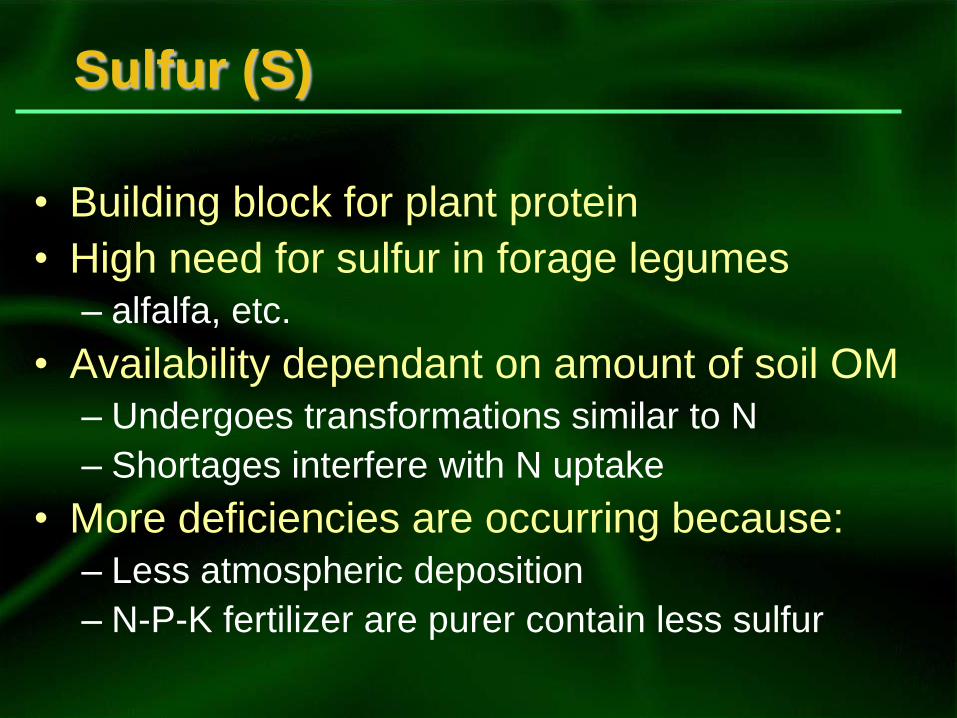
Sulfur (S)
• Building block for plant protein
• High need for sulfur in forage legumes
– alfalfa, etc.
• Availability dependant on amount of soil OM
– Undergoes transformations similar to N
– Shortages interfere with N uptake
• More deficiencies are occurring because:
– Less atmospheric deposition
– N-P-K fertilizer are purer contain less sulfur
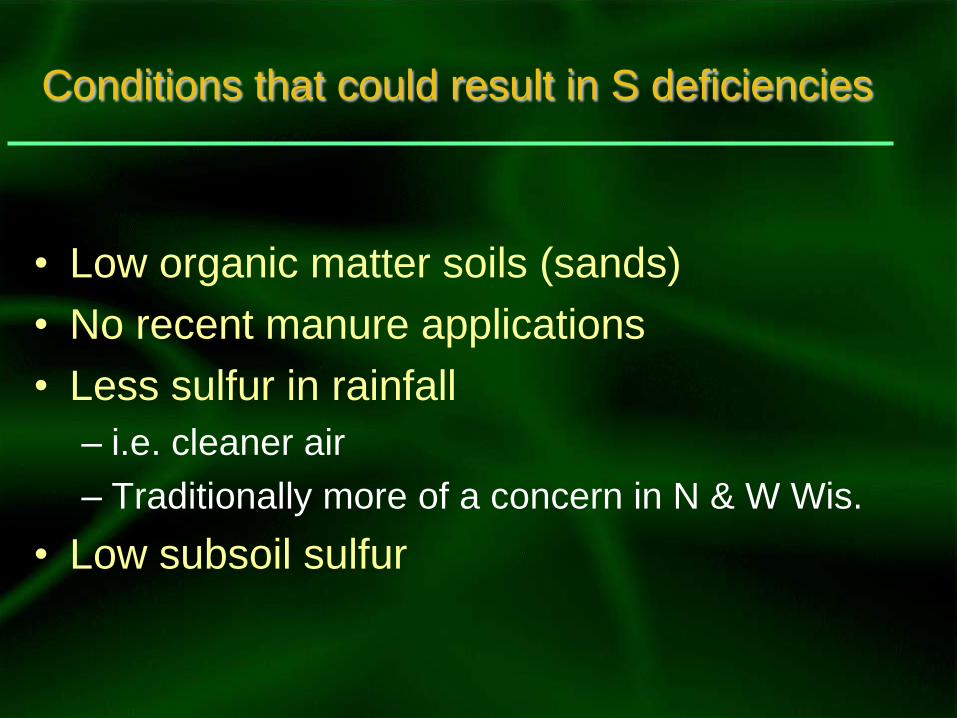
Conditions that could result in S deficiencies
• Low organic matter soils (sands)
• No recent manure applications
• Less sulfur in rainfall
– i.e. cleaner air
– Traditionally more of a concern in N & W Wis.
• Low subsoil sulfur
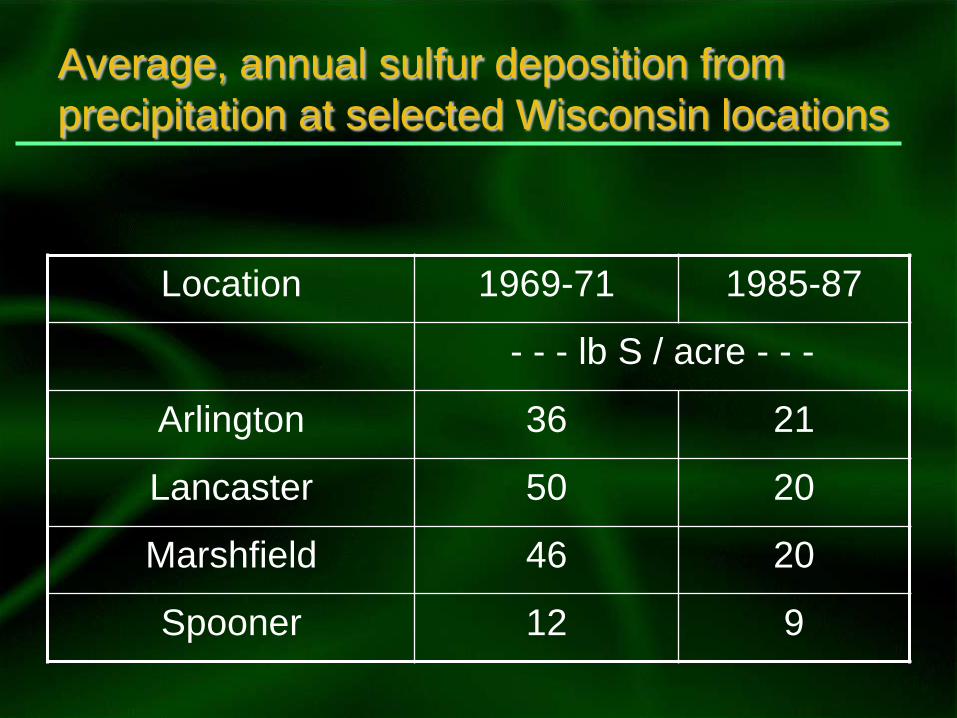
Average, annual sulfur deposition from
precipitation at selected Wisconsin locations
Location 1969-71 1985-87
- - - lb S / acre - - -
Arlington 36 21
Lancaster 50 20
Marshfield 46 20
Spooner 12 9
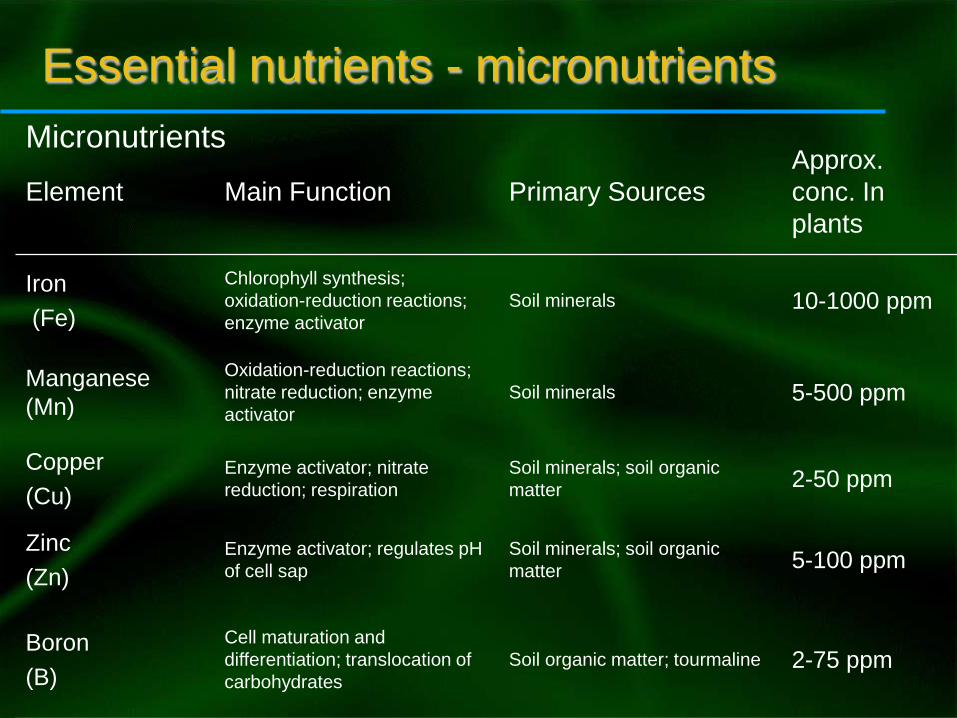
Element Main Function Primary Sources
Approx.
conc. In
plants
Iron
(Fe)
Chlorophyll synthesis;
oxidation-reduction reactions;
enzyme activator
Soil minerals 10-1000 ppm
Manganese
(Mn)
Oxidation-reduction reactions;
nitrate reduction; enzyme
activator
Soil minerals 5-500 ppm
Copper
(Cu)
Enzyme activator; nitrate
reduction; respiration
Soil minerals; soil organic
matter2-50 ppm
Zinc
(Zn)
Enzyme activator; regulates pH
of cell sap
Soil minerals; soil organic
matter5-100 ppm
Boron
(B)
Cell maturation and
differentiation; translocation of
carbohydrates
Soil organic matter; tourmaline 2-75 ppm
Micronutrients
Essential nutrients - micronutrients
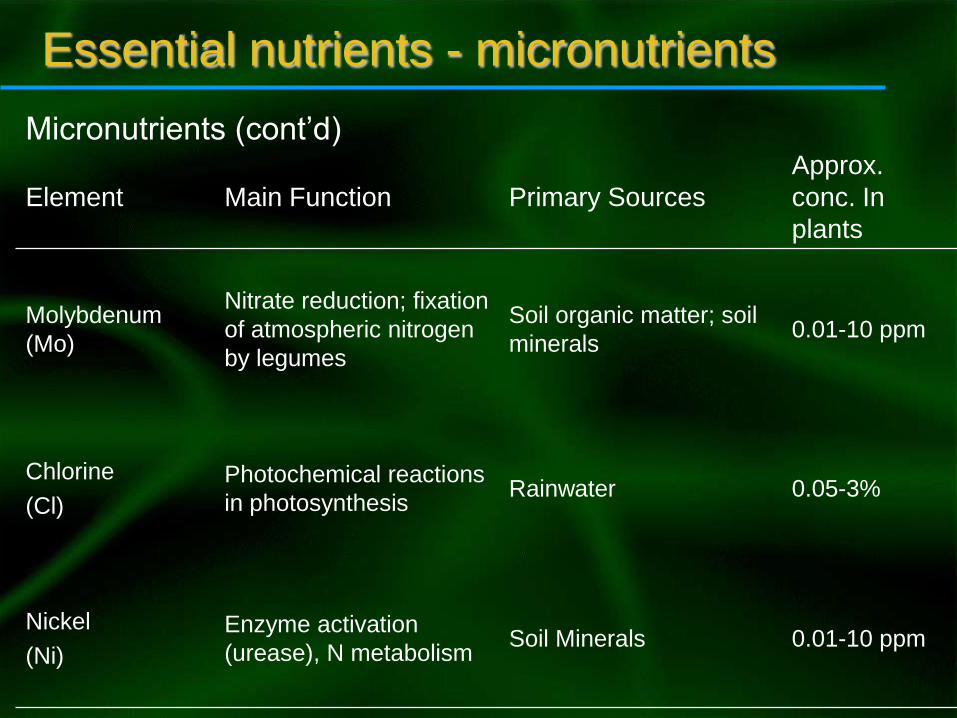
Element Main Function Primary Sources
Approx.
conc. In
plants
Molybdenum
(Mo)
Nitrate reduction; fixation
of atmospheric nitrogen
by legumes
Soil organic matter; soil
minerals0.01-10 ppm
Chlorine
(Cl)
Photochemical reactions
in photosynthesisRainwater 0.05-3%
Nickel
(Ni)
Enzyme activation
(urease), N metabolismSoil Minerals 0.01-10 ppm
Micronutrients (cont’d)
Essential nutrients - micronutrients
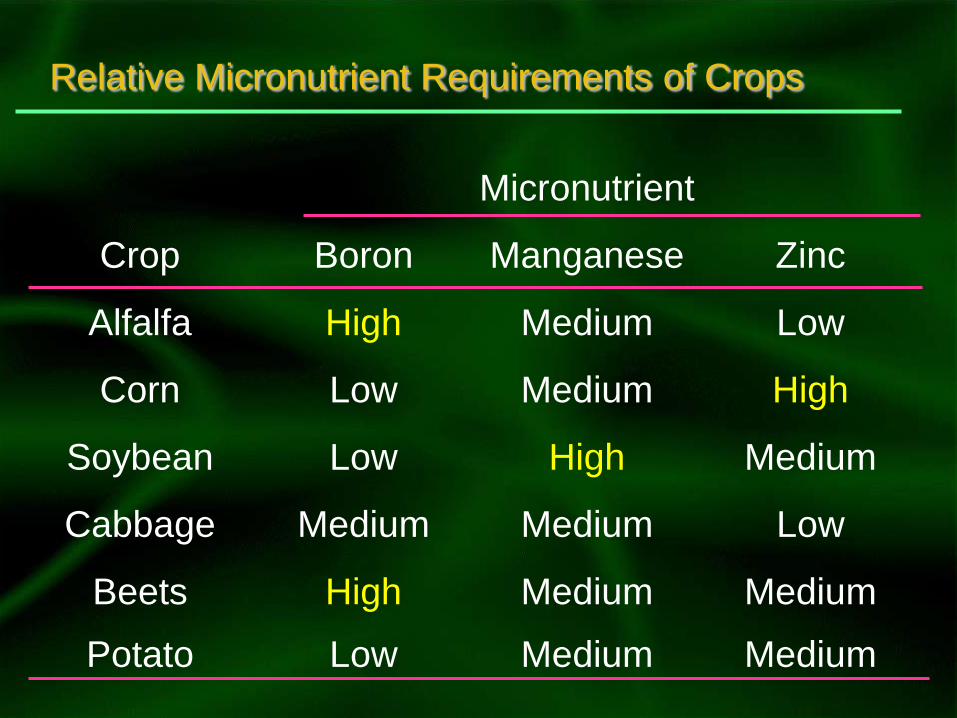
Relative Micronutrient Requirements of Crops
Micronutrient
Crop Boron Manganese Zinc
Alfalfa High Medium Low
Corn Low Medium High
Soybean Low High Medium
Cabbage Medium Medium Low
Beets High Medium Medium
Potato Low Medium Medium
Micronutrient fertilizers
• Apply only when:
- Soil test is low
- Deficiency symptoms on plant
- Plant analysis indicates deficiency
- High crop requirement
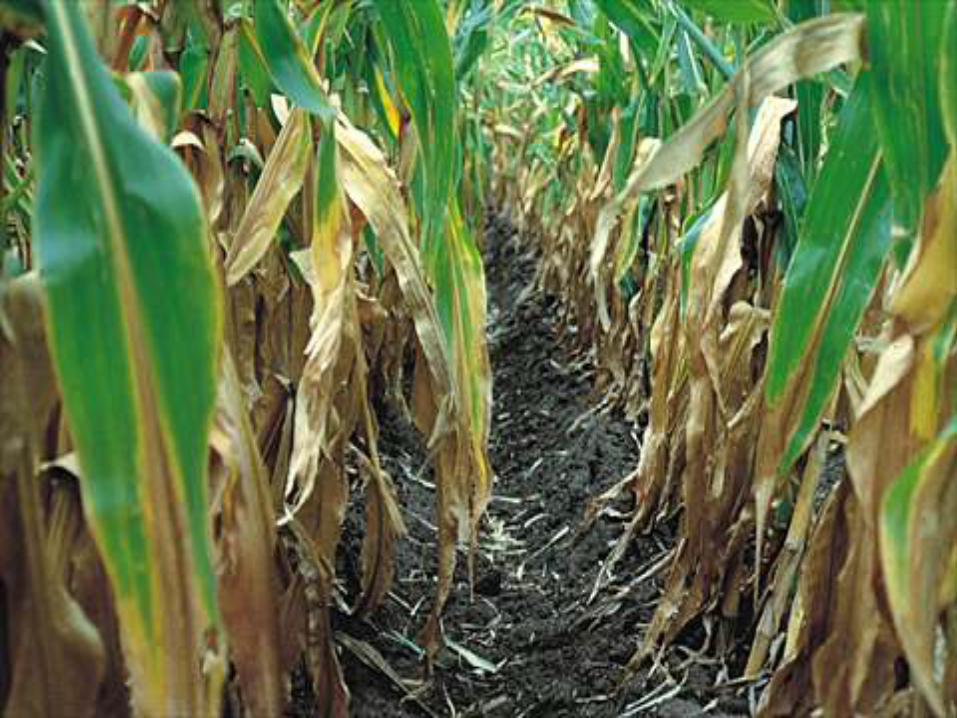
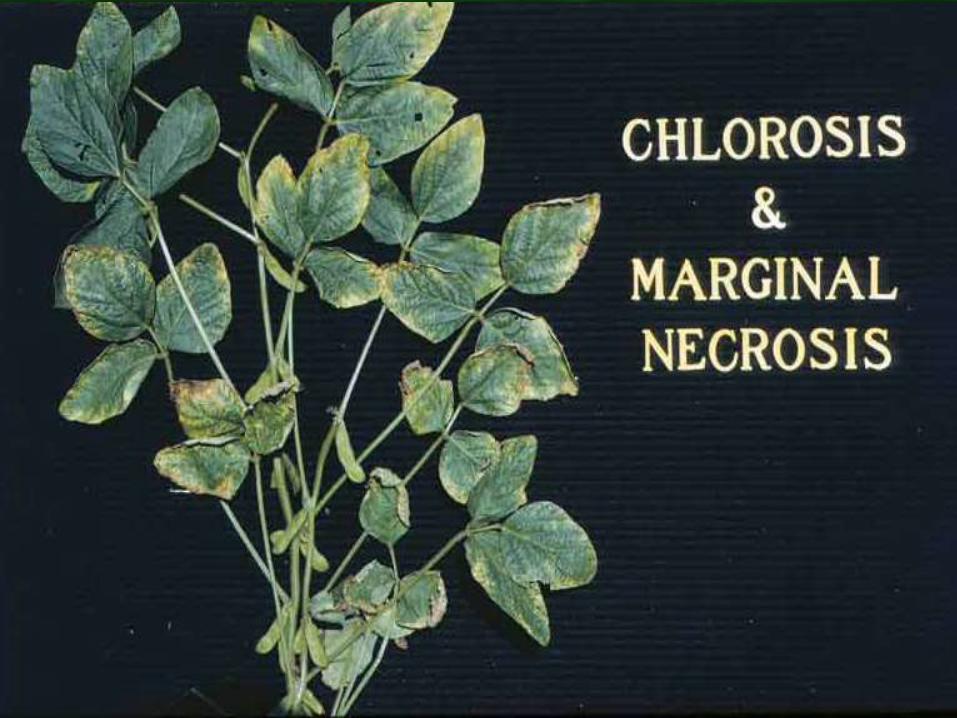
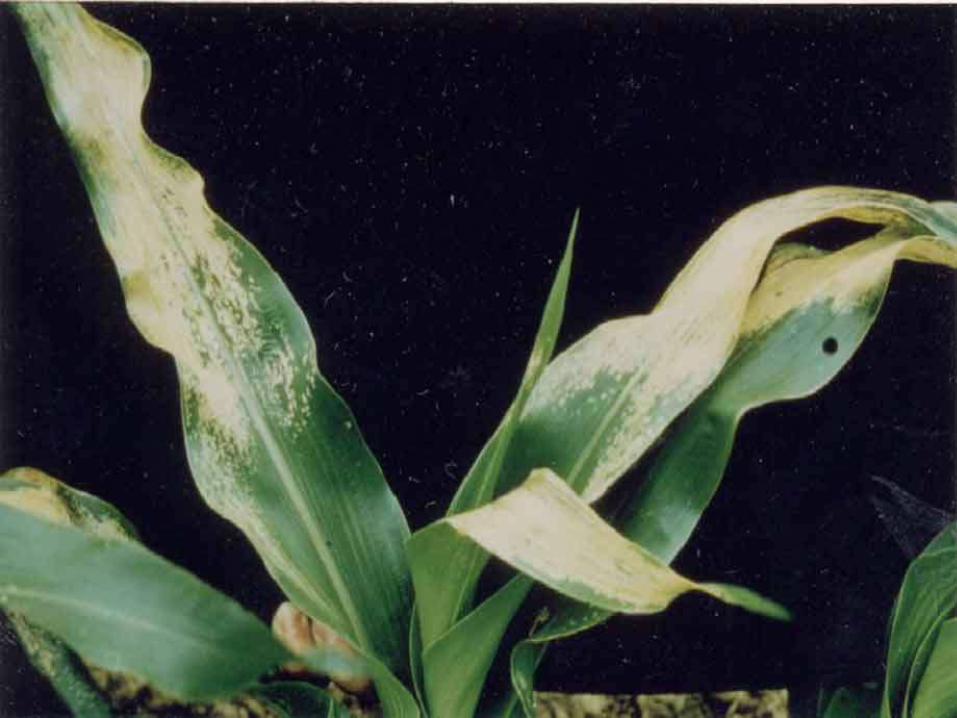
Plants let us know when they’re sick
• Specific appearance of symptom and
plant position
• More likely on some soil types
• Plants have different sensitivities
• Symptoms not always nutrient related
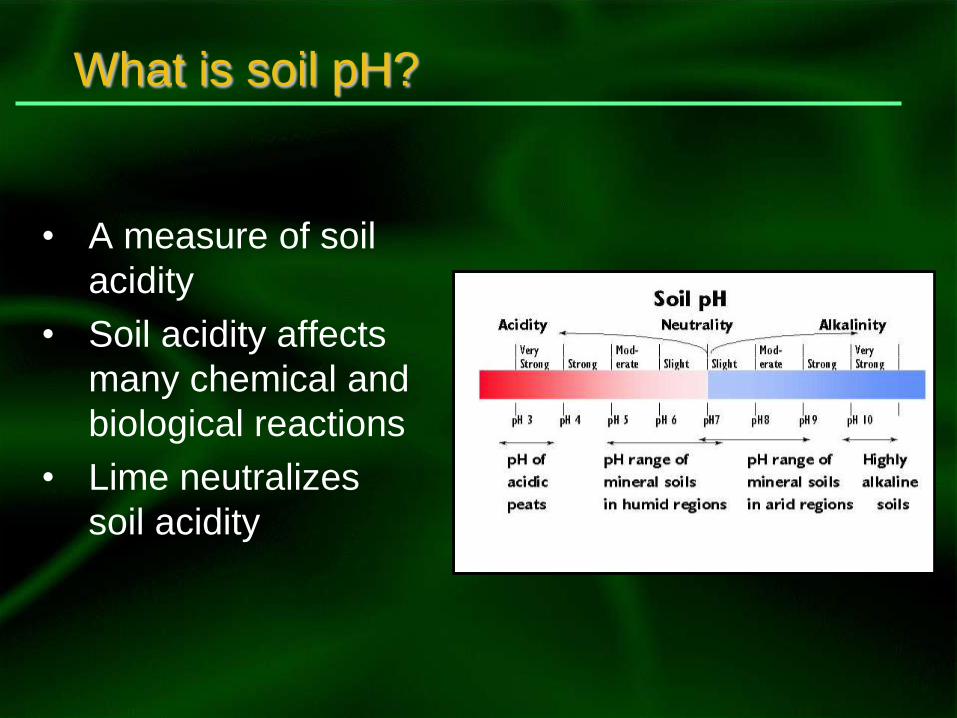
What is soil pH?
• A measure of soil
acidity
• Soil acidity affects
many chemical and
biological reactions
• Lime neutralizes
soil acidity
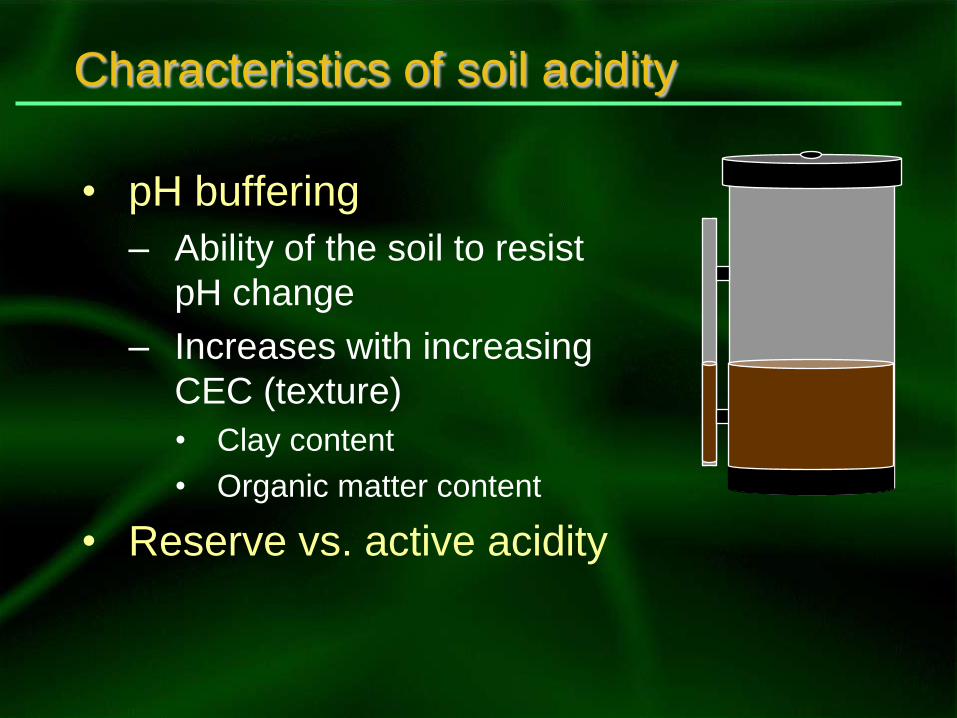
Characteristics of soil acidity
• pH buffering
– Ability of the soil to resist
pH change
– Increases with increasing
CEC (texture)
• Clay content
• Organic matter content
• Reserve vs. active acidity
How a soil becomes acid
• Use of acid-forming fertilizers
• Removal of basic cations
– Ca2+, Mg2+, K+
– Older soils tend to have more basic
cations leached and have lower pH
• Respiration by plant roots
Beneficial effects of liming
• Crop yield improvement
• Nutrient availability effects
• Improved microbial activity
• Improved legume fixation
• Ca and Mg addition
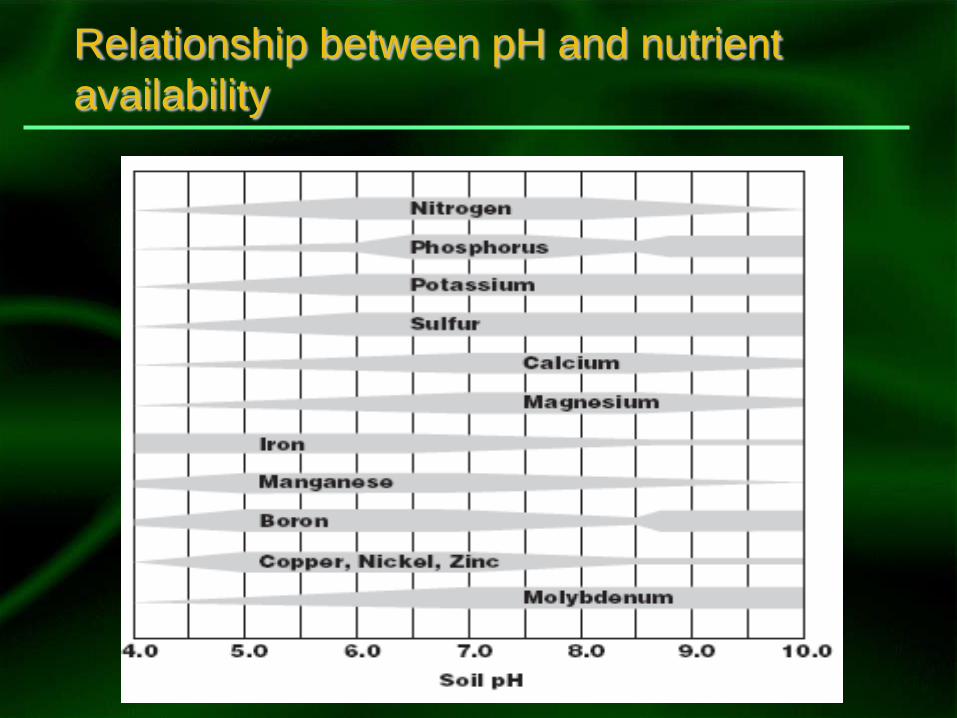
Relationship between pH and nutrient
availability
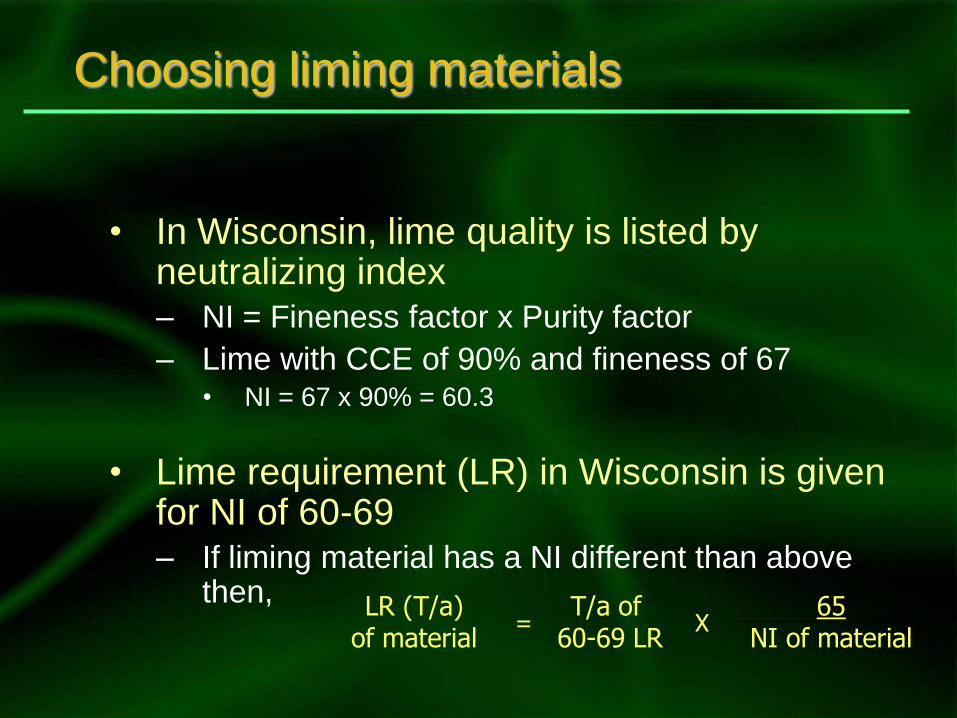
Choosing liming materials
• In Wisconsin, lime quality is listed by neutralizing index– NI = Fineness factor x Purity factor
– Lime with CCE of 90% and fineness of 67• NI = 67 x 90% = 60.3
• Lime requirement (LR) in Wisconsin is given for NI of 60-69– If liming material has a NI different than above
then,LR (T/a)
of materialT/a of
60-69 LR65
NI of materialX=
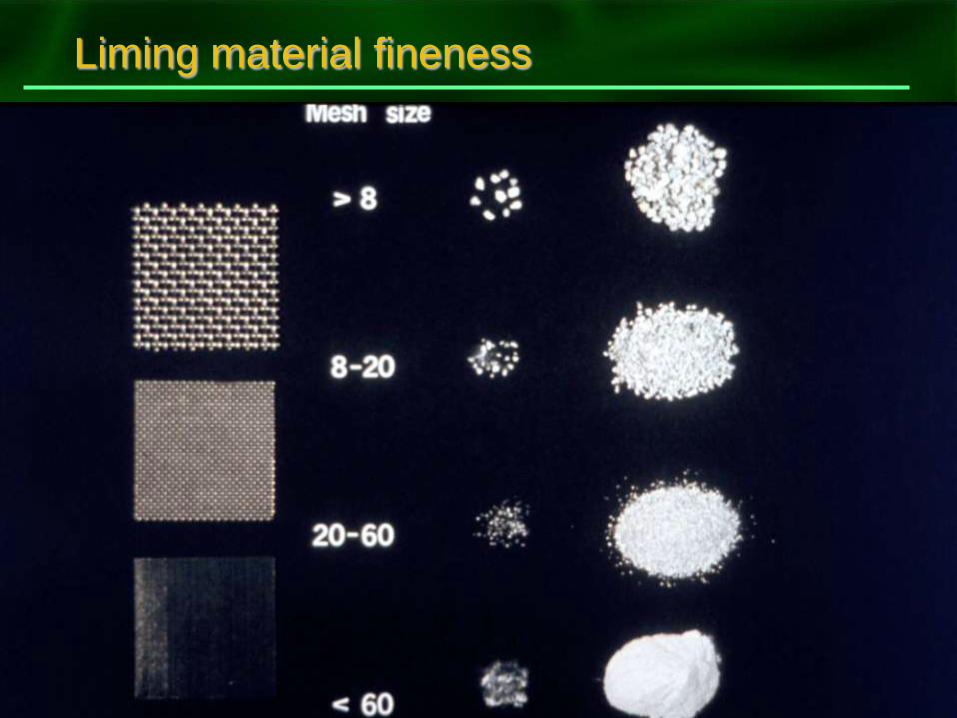
Liming material fineness
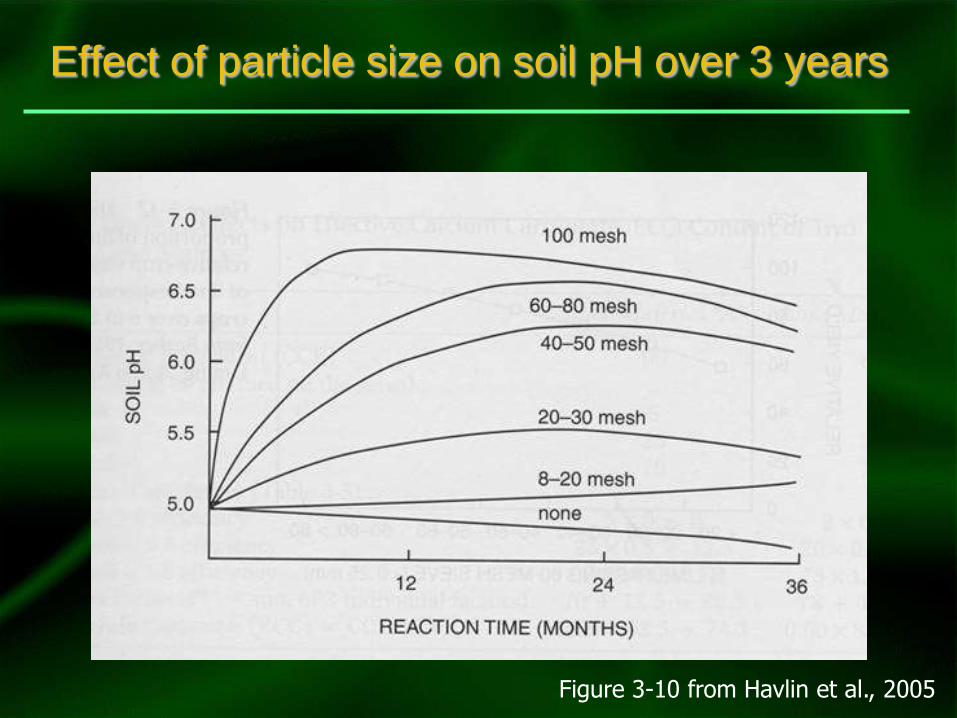
Effect of particle size on soil pH over 3 years
Figure 3-10 from Havlin et al., 2005
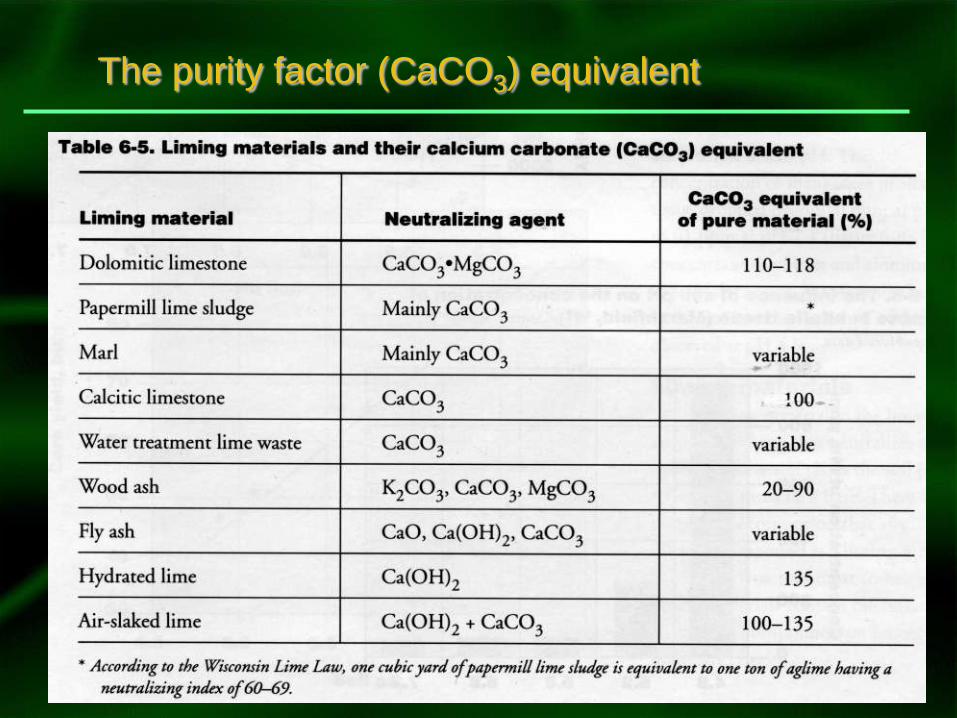
The purity factor (CaCO3) equivalent

UW Department of
Soil Science