daarel burnette ii - education week · pdf filedaarel burnette ii staff writer, ... parent...
TRANSCRIPT


Daarel Burnette IIStaff writer, Education Week
Follow Daarel on Twitter: @Daarel
Related Story: “ESSA Brings User-Friendly Makeover of State Report Cards”

ESSA and State Report Cards
Expert Presenters:
David StewartFormer school accountability executive, New York City Department of Education; founder, Tembo; former vice president, product development, Grow Network/McGraw-Hill
Cindi WilliamsStrategic advisor, Learning Heroes; principal, HCM Strategists;former director of communications for the U.S. Program,Bill & Melinda Gates Foundation; and former senior advisor to the secretary and deputy assistant secretary for communications, U.S. Department of Education

An on-demand archive of this webinar will be available at
www.edweek.org/go/webinarin less than 24 hrs.

LEARNING HEROES: DECK NAME • 5
LEARNING HEROES: DECK NAME •
November 2017
A PARENT- FRIENDLY SCHOOL REPORT
CARD PROTOTYPE

Synthesize parent insights from deep research
Support the field in using those insights to better communicate
with parents
Create and disseminate research-based parent
communications and tools with partners
Our Approach
6

Unprecedented Parent-Focused
Research
Since 2015, with a focus on low-
income parents and parents of
color, Learning Heroes has
conducted unprecedented
research:
70+ qualitative interviews
and focus groups across 25
states
8 quantitative surveys with
data from thousands of
parents nationally
6 ethnography sessions with
dozens of parents
3 live tests of our tools with
parents, teachers and children*Dark blue states
represent locations
where qualitative
research was
conducted.
7

8

9
StrategicObjectives
Parents gain an accurate picture of
how their children are doing
academically and developmentally
Parents understand what it means for
their children to be prepared for
success in and out of high school
Parents know what actions they can
take to support their child’s academic
and developmental success

Parents are anxious…
10
Parents Are Anxious…
All Parents Spanish Dominant

11
…But Not About Academics
All Parents Spanish Dominant

61%
38%
65%
34%
58%
42%
55%
44%
52%47%
58%
41%
All parents Whites Spanish
dominant
African
Americans
All Hispanics English
dominant
My child doing well academically inschool
My child being happy/not overly stressed byschool
WHICH ISMOREIMPORTANT TOYOU REGARDINGYOUR CHILD?
12
Parents Prioritize Happiness Over Academic
Success

Parents saying their child is achieving at or above grade level
2015 NAEP reporting Grade 4 student performance at or above proficient in
this area
An Astounding Disconnect: 9 in 10 Parents
Think Their Child Is At Or Above Grade Level
89%
88%
90%
88%
36%
46%
18%21%
READING
All parents White HispanicAfrican
American
91% 91% 89%
90%
40%
51%
19%
26%
MATH
All
parents
HispanicWhite African
American
13

“When I first looked at
this I didn’t understand
what the percent was
and if that was good or
bad so that statement
kind of helped you
understand what the
whole goal of this page
is.”
“I would want to know
how to interpret this
score. What does this
really mean, and how do I
understand this? If I
should be alarmed I
would be, but if I don’t
need to, I won’t be.”
“[I’m] wondering what
student satisfaction
means… I’d want to look at
the definition, I’d like to go in
and see exactly what they’re
testing and not assume.”
“When it just says
‘Experienced 78%,’ I don’t
understand what that’s
saying.”
PARENTS NEEDCONTEXT
Numbers aren’t enough.
Numbers Alone
Mean Nothing to
Parents
14
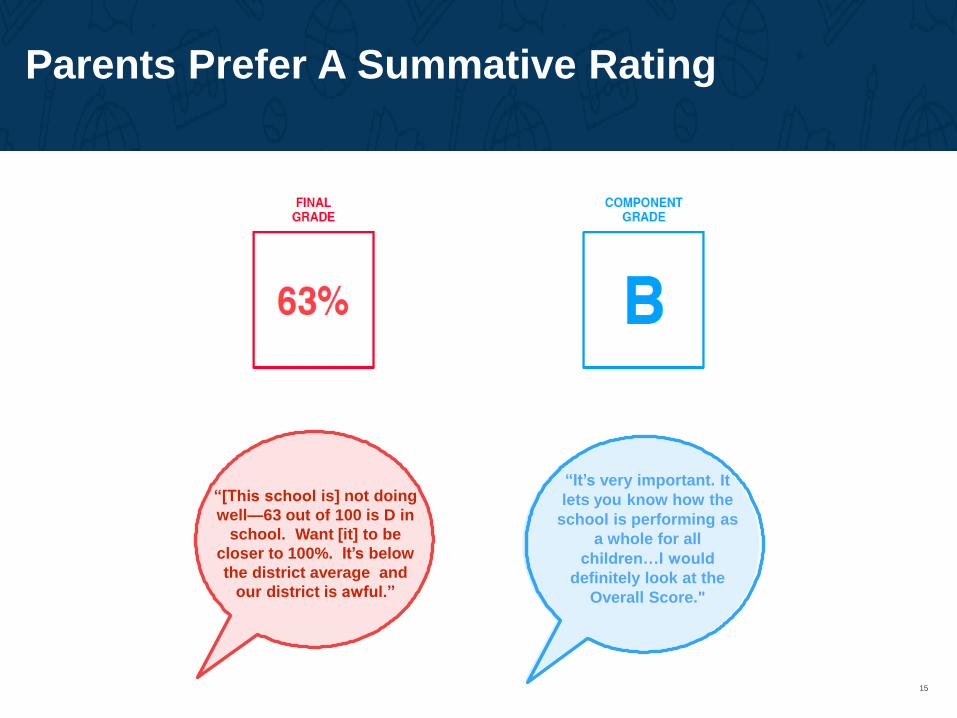
“[This school is] not doing
well—63 out of 100 is D in
school. Want [it] to be
closer to 100%. It’s below
the district average and
our district is awful.”
“It’s very important. It
lets you know how the
school is performing as
a whole for all
children…I would
definitely look at the
Overall Score."
Parents Prefer A Summative Rating
15

Parents Value Academic and Non-Academic Information
Need to Know Nice to Know Don’t Need to Know
A measure of the quality of
the school's learning
environment…
Information on teacher credentials and
qualifications
Disciplinary data…
School Progress – Growth the school has
shown in past 3
yrs.
Comparison of how well students in the state did on the NAEP compared to the national
average
State test scores for all students on the year-end math & ELA tests
The percentage of students enrolled in AP/IB or college credit-earning
The amount of money that is spent per student…
State test scores broken down by
different groups of students…
The attendance rates for the school…
The number of students learning the English
language that no longer need add’l
instruction...
Parents Value Academic & Non-Academic
Information
16

LEARNING ENVIRONMENT - SCHOOL G
(2016)
25%
50%
100%
75%
LEARNING ENVIRONMENT - SCHOOL M
2014 2015 2016
“Given the information
here, it looks like there is a
plan in place for school M…
It tells me there is a plan in
place to have the school
move. School G, I can’t tell.”
“I want to see where [the
school] came from and where
it’s going and how much
better it is going to get in the
future. It has to get better.”
School
District
Average62%
60%
Progress Over Time Gives Parents
Confidence
17

School
growth…
Proficient…
Student
Growth…
Climate &
culture…
…increased budget?
…knowing just
enough to get by?
…different cultures
like Chinese,
African American,
Chicano, etc?
…counting
the students?
18

STEREOTYPING“If you find out that your kid’s
going to high school and 70% of
the population is getting both
breakfast and lunch there, your
children are going to advance to
higher levels than their peers.”
DISCRIMINATION“It talks about homeless
students, and the military
parents, foster care, ethnic
groups,the English language
learners, and those with
disabilities. That’s just
discriminating against people
and that should have no place in
there.”
SHAMING“It kind of makes you feel like if
your child falls into a ‘less group’
maybe they’re not going to get the
education they need.”
CATEGORIZING“I don’t like that they’re
categorizing people because
everybody can succeed. When
my daughter was in school we
were considered low income and
yet she was valedictorian so
everybody has the opportunity
to succeed and they shouldn’t
categorize people.”
Disaggregated Data Is A Minefield:The Unintended Consequences
19

State Communication Materials
• Designed & developed New Mexico Public Education Department’s Parent Portal
• Designed & executed Texas Education Agency’s parent communications campaign around annual state test score reports
• New Mexico & OSSE/DC implementing LH’s research-based ESSA school based report card
20

CONTACT
Bibb [email protected]
Cindi [email protected]
bealearninghero.org
#bealearninghero
@bealearninghero
Learning Heroes


QUESTION & ANSWER


An on-demand archive of this webinar will be available at
www.edweek.org/go/webinarin less than 24 hrs.

ESSA and State Report Cards
Suggested Reading from Education Week:
E-Book
Inside ESSA: The New Federal K-12 LawIn this essential guide to the Every Student Succeeds Act, Education Week explains what the law will mean for: accountability and testing, teacher quality, early-childhood education, special education, academic standards including the common core, English-Language Learners, and teacher evaluation.