d8.1a market assessment and technology monitoring (v1.0)
TRANSCRIPT

This project has received funding from the European Union’s Horizon 2020 research and innovation programme under the Grant Agreement No 856691.
5G-SOLUTIONS for European Citizens
D8.1A Market Assessment and Technology
Monitoring (V1.0)
Document Summary Information
Grant Agreement No 856691 Acronym 5G-SOLUTIONS
Full Title 5G Solutions for European Citizens
Start Date 01/06/2019 Duration 36 months
Project URL https://www.5gsolutionsproject.eu/
Deliverable D8.1A Market Assessment and Technology Monitoring (V1.0)
Work Package WP8
Contractual due date 31/12/2019 Actual submission date 30/12/2019
Nature Report Dissemination Level Public
Lead Beneficiary NURO
Responsible Author Andrew Pomazanksyi, Yash Shekhawat
Contributions from TIM, NOKIA, A2T, CEL, EBOS, ENEL, IBM, ILS, IREN, IRIS, LIVEU, LMI

D8.1A Market Assessment and Technology Monitoring (V1.0)
© 5G-SOLUTIONS, 2019 Page | 2
2
Revision history (including peer reviewing & quality control)
Version Issue Date % Complete1 Changes Contributor(s)
v0.1 02/09/2019 5% Initial Deliverable Structure Yash Shekhawat (NURO)
v0.2 01/10/2019 5% Updated Deliverable Structure Yash Shekhawat (NURO)
v0.2 03/10/2019 5% Quality Check Christos Skoufis (EBOS)
v0.3-0.7 18/11/2019 50% Input from Partners Yash Shekhawat (NURO)
v0.7 19/11/2019 50% Quality Check Christos Skoufis (EBOS)
v0.8 10/12/2019 100% All input consolidated and sent for review
Yash Shekhawat (NURO), Patrick Dunkin (Inlecom), All partners
v0.8 19/12/2019 100% Quality Check and Peer Review Christos Skoufis (EBOS), Martin Tolan, Patrice Boleguin, Tom Walsh (WIT)
v0.9 18/12/2019 99,99% Based on feedback from peer-review it has been added an additional chapter on social acceptance of 5G technology
Luigi Briguglio, Antonio Fiorentino, Emanuela Tangari, Francesca Ventura (CEL)
v1.0 20/12/2019 100% Integration of Internal Reviewers comments
Yash Shekhawat (NURO)
v1.1 30/12/2019 100% Final Version Christos Skoufis (EBOS),
Andrea Di Giglio (TIM)
Disclaimer
The content of the publication herein is the sole responsibility of the publishers and it does not necessarily represent the views expressed by the European Commission or its services. While the information contained in the documents is believed to be accurate, the authors(s) or any other participant in the 5G-SOLUTIONS consortium make no warranty of any kind with regard to this material including, but not limited to the implied warranties of merchantability and fitness for a particular purpose.
1 According to 5G-SOLUTIONS Quality Assurance Process: 1 month after the Task started: Deliverable outline and structure 3 months before Deliverable’s Due Date: 50% should be complete 2 months before Deliverable’s Due Date: 80% should be complete 1 months before Deliverable’s Due Date: close to 100%. At this stage it sent for review by 2 peer reviewers Submission month: All required changes by Peer Reviewers have been applied, and goes for final review by the Quality Manager, before submitted

D8.1A Market Assessment and Technology Monitoring (V1.0)
© 5G-SOLUTIONS, 2019 Page | 3
3
Neither the 5G-SOLUTIONS Consortium nor any of its members, their officers, employees or agents shall be responsible or liable in negligence or otherwise howsoever in respect of any inaccuracy or omission herein. Without derogating from the generality of the foregoing neither the 5G-SOLUTIONS Consortium nor any of its members, their officers, employees or agents shall be liable for any direct or indirect or consequential loss or damage caused by or arising from any information advice or inaccuracy or omission herein.
Copyright message
© 5G-SOLUTIONS Consortium, 2019-2022. This deliverable contains original unpublished work except where clearly indicated otherwise. Acknowledgement of previously published material and of the work of others has been made through appropriate citation, quotation or both. Reproduction is authorised provided the source is acknowledged.
1. Table of Contents
1. Executive summary .............................................................................................................................. 8
2. Introduction .......................................................................................................................................... 9
2.1 Mapping Projects’ Outputs .......................................................................................................... 9
2.2 Deliverable Overview and Report Structure ............................................................................... 9
3. 5G general framework ....................................................................................................................... 11
3.1. 5G features and use cases .......................................................................................................... 11
3.2. Politics behind 5G ....................................................................................................................... 12
4. 5G Business Ecosystem ...................................................................................................................... 14
4.1. Business Ecosystem and stakeholders....................................................................................... 14
4.2. 5G Market Analysis .................................................................................................................... 16
4.3. 5G impact on SMEs and start-ups .............................................................................................. 20
4.3.1 Improvement of internal business communication ........................................................ 21
4.3.2 Speeding-up businesses processes ................................................................................... 21
4.3.3 Expanding capabilities with Internet of Things ............................................................... 21
4.3.4 Driver for innovation in SMEs and start-ups .................................................................... 21
4.3.5 Improvement of recruiting procedure and bridging skill gaps ....................................... 22
4.4. 5G impact on telecommunication service providers ................................................................ 22
5. Social Acceptance of 5G Technologies ............................................................................................... 27
5.1. 5G as main technology for life ................................................................................................... 27
5.2. Impacting the social acceptance ................................................................................................ 28
5.2.1 Socio-political dimension and acceptance ....................................................................... 29
5.2.2 Market acceptance ............................................................................................................ 30

D8.1A Market Assessment and Technology Monitoring (V1.0)
© 5G-SOLUTIONS, 2019 Page | 4
4
5.2.3 Limits of current methodologies ...................................................................................... 31
5.3. The “close-the-loop” model for social acceptance of 5G technology ...................................... 31
5.3.1 Perception .......................................................................................................................... 32
5.3.2 Motivation .......................................................................................................................... 32
5.3.3 Trust .................................................................................................................................... 33
5.3.4 Awareness .......................................................................................................................... 34
5.3.5 Capacity enabling ............................................................................................................... 34
5.3.6 Accountability .................................................................................................................... 34
6. Market Analysis of 5G-Solutions Verticals ........................................................................................ 35
6.1. Factories of the Future ............................................................................................................... 35
6.1.1 General Market Overview ................................................................................................... 35
6.1.2 The Role of 5G ..................................................................................................................... 36
6.1.3 Market drivers and early innovators ................................................................................ 36
6.1.4 An overview of 5G-SOLUTIONS use cases ........................................................................... 37
6.2. Smart Energy .............................................................................................................................. 41
6.2.1 General Market Overview ................................................................................................... 41
6.2.2 Industrial Demand Side Management .............................................................................. 41
6.2.3 Electric Vehicle Smart Charging .......................................................................................... 45
6.2.4 Electricity network frequency stability ............................................................................ 52
6.3. Smart Cities & Ports ................................................................................................................... 55
6.3.1 Intelligent street lighting ................................................................................................... 55
6.3.2 Smart parking ..................................................................................................................... 60
6.3.3 Smart city co-creation ....................................................................................................... 65
6.3.4 Smart campus ..................................................................................................................... 67
6.3.5 Autonomous assets and logistics for smart harbour/port .............................................. 69
6.4. Media & Entertainment ............................................................................................................. 71
6.4.2 Ultra High-Fidelity Media (UHFM) .................................................................................... 73
6.4.3 Multi-CDN Selection .......................................................................................................... 73
6.4.4 On-site Live Event Experience ........................................................................................... 73
6.4.5 User and machine generated content .............................................................................. 73
6.4.6 Immersive and Integrated Media and Games ................................................................. 74
6.4.7 Cooperative Media Production ......................................................................................... 77
7. Technology Monitoring Methodology ............................................................................................... 79

D8.1A Market Assessment and Technology Monitoring (V1.0)
© 5G-SOLUTIONS, 2019 Page | 5
5
8. Conclusions and Next Actions ............................................................................................................ 81
Bibliography................................................................................................................................................ 82
Glossary of terms and abbreviations used
Abbreviation / Term Description
B2B Business-to-Business
B2B2C Business-to-Business-to-Consumer
B2B2X Business-to-Business-to-X
CAGR Compound annual growth rate
CMS Content Management System
DoA Description of Action
DSM Demand Side Management
E2E Exchange-to-Exchange
eMBMB Enhanced mobile broadband
EU European union
FCC Federal Communications Commission
FEV Full Electric Vehicles
GDP Gross Domestic Product
GDPR General Data Protection Regulation
GSMA Global System for Mobile Communications
ICT Information Communication and Technology
IEA International Energy Agency
IoT Internet of Things
ITRI Industrial Technology Research Institute
LTE Long Term Evolution
mMTC Massive machine-type communication
NILM Non-Intrusive Load Monitoring
NSA Non-Stand-Alone
NSP Network Service Providers
OSP Online Service providers
PESTLE Political, Economic, Social, Technical, Legal, Environmental
SCP Smart Charging Points
SWOT Strengths – Weaknesses – Opportunities - Threats
URLLC Ultra-reliable low latency communication
V2X Vehicle-to-Everything
VR/AR Virtual reality/Augmented Reality
IIoT Industrial Internet of Things
DSR Demand Side Response
EV Electric Vehicle
TSO Transmission System Operator

D8.1A Market Assessment and Technology Monitoring (V1.0)
© 5G-SOLUTIONS, 2019 Page | 6
6
V2G Vehicle-to-grid
CAPEX Capital Expenses
OPEX Operating Expenses
QoE Quality of Experience
OTT Over-the-top
MNO Mobile Network Operator
CDN Content Delivery Network
QoS Quality of Service
List of Figures
Figure 1: 5G Ecosystem stakeholders and interactions .............................................................................. 15
Figure 2: Number of Devices connected by Connection Type .................................................................... 16
Figure 3: Chart of the Global Communication Market Size (2014-2019) ................................................... 17
Figure 4: Chart Showing the Forecast Spending on Global Spending on Telecom Services (2018-2023) .. 17
Figure 5: Chart Showing Global Mobile Subscription Forecast (2017-2023) .............................................. 18
Figure 6: Chart Showing the Global Internet Consumer Data Traffic (2016-2022) .................................... 19
Figure 7: 5G-enabled market for service providers .................................................................................... 23
Figure 8: 5G-enabled market for service providers by verticals ................................................................. 23
Figure 9: 5G-enabled market for service providers by region .................................................................... 24
Figure 10: B2C and B2B Connectivity provider business model ................................................................. 25
Figure 11: B2B2X Service enabler business model ..................................................................................... 25
Figure 12: B2B2X Application and service provider business model .......................................................... 26
Figure 13: Service Offerings and pricing ..................................................................................................... 26
Figure 14: Nationwide protest against the 5G technology in front of the Swiss houses of Parliament in
Bern (21 September 2019) .......................................................................................................................... 27
Figure 15: The hexagon of social acceptance – the “close-the-loop” model ............................................. 32
Figure 16: 5G Services Market Size, Factories of the future ....................................................................... 36
Figure 17: Competitive leadership Mapping............................................................................................... 37
Figure 18: Energy Reduction strategies according to Ares2t Charge Advisor strategies ............................ 47
Figure 19: EV charging type summary ........................................................................................................ 49
Figure 20: Benefits of Smart Lighting in Street Lighting ............................................................................. 56
Figure 21: General competior analytis in smart street lighting .................................................................. 58
Figure 22: Smart Port Infrastructure Market overview .............................................................................. 70
Figure 23: Smart Ports Market By Technology Type ................................................................................... 71
Figure 24: 5G Enterprise Market for Media and Entertainment ................................................................ 72
List of Tables Table 1: Adherence to 5G-SOLUTIONS GA Deliverable & Tasks Descriptions .............................................. 9
Table 2 Dimensions of Social Acceptance ................................................................................................... 28
Table 3: SWOT Analysis for DSM ................................................................................................................. 42
Table 4: SWOT Analysis for Electric Vehicle Smart Charging ...................................................................... 46
Table 5 : EU Early adopters in Smart Charging ........................................................................................... 50

D8.1A Market Assessment and Technology Monitoring (V1.0)
© 5G-SOLUTIONS, 2019 Page | 7
7
Table 6: SWOT Analysis for Electricity Network Frequency stability .......................................................... 53
Table 7: Summary of emerging Cloud Gaming companies ......................................................................... 76

D8.1A Market Assessment and Technology Monitoring (V1.0)
© 5G-SOLUTIONS, 2019 Page | 8
8
1. Executive summary The deliverable summarises the following aspects of the project a) a market analysis for all the vertical industries the project aims to target, b) general framework of 5G technology and its features as well as setting up a framework for the technology monitoring. First a general framework is presented about the 5G technology including the features and the use cases that 5G can bring to the market in various verticals as well as the politics behind the 5G technology adoption. In the following sections, we describe the business impact of 5G on various stakeholders such as SMEs, telecommunication companies and other business ecosystems. Furthermore, we analyse the market of telecommunication and the size of the market for 5G in the upcoming years. The main impacts of 5G will be a) Improvement of Internal business communication; b) Speeding up business processes; c) Expanding the capabilities with Internet of Things; d) Being a driver for innovation in SMEs; e) Improvement of recruiting procedure and bridging the gap in skills. As well as, a deep analysis of social acceptance of 5G technology, including a model with main impacting factors is introduced. Next the deliverable concentrates on the markets that each of the living labs and the verticals aim to target and starts by conducting a general market overview. This vertical market assessment will be reviewed and updated during the lifetime of the project (with a final deliverable D8.1B) and will be further informed by an online Knowledgebase (see Section 7 for more details) into which all consortium members will share industry knowledge as the project evolves. This vertical market knowledge will provide an important foundation for any potential future commercial solutions that may emerge after the completion of 5G-SOLUTIONS (to be explored in M33 in D8.2 Business Development Plan). Finally, the deliverable includes a PESTLE and/or SWOT analysis of the markets that the verticals target as well as a trend analysis. The different markets that the living labs plan to work with have various sizes and the pilots will provide a good starting point for the consortium to create an impact in the industries. Lastly, this deliverable also presents the methodology the consortium plans to implement for constant technology monitoring. The plan includes the setup of a knowledge base for the consortium to share information gained with various administrators in each vertical to post the articles regarding their or other relevant industries.

D8.1A Market Assessment and Technology Monitoring (V1.0)
© 5G-SOLUTIONS, 2019 Page | 9
9
2. Introduction This section provides the goal of the deliverable in context with the 5G-SOLUTIONS project as well as the mapping of the deliverable with the task it is documented in. Furthermore, it provides an overview of the document structure.
2.1 Mapping Projects’ Outputs The purpose of this section is to map 5G-SOLUTIONS Grant Agreement commitments, both within the formal Deliverable and Task description, against the project’s respective outputs and work performed.
Table 1: Adherence to 5G-SOLUTIONS GA Deliverable & Tasks Descriptions
5G-SOLUTIONS Task Respective Document Chapter(s)
Justification
Task 8.1 - Market
assessment and
technology monitoring
All involved members will perform a continuous market and research watch in order to identify and verify that the use cases to be trialled are indeed the most relevant having the highest commercialisation interest and potential amongst the targeted vertical industries. This task will undertake a market survey assessment to understand the sectoral needs and opportunities for 5G-SOLUTIONS, with an initial focus on telecoms and SMEs. The market analysis will include a SWOT analysis, trend analysis and, where appropriate, develop tactical and strategic responses, informing its commercialisation plan in task T8.2. It will also seek to understand well how 5G- SOLUTIONS compares and contrasts to other solutions being developed within the market, to define a market position and unique value propositions for the solution.
The entire deliverable deals with the task defined in the DoA. Section 3 and 4 of the deliverable cover the General Market Analysis of 5G as well as its effects on the business ecosystem. Section 5 deals with the market analysis of the verticals. The final Section, deals with the technology monitoring.
The deliverable outlines the current market landscape for both 5G as a whole as well as for each of the verticals. The information gathered provides a good overview of the market trends which will be helpful in the commercialisation of the technologies built in the project. The deliverable also outlines the framework being used for the technology monitoring by setting up a Knowledge Base.
5G-SOLUTIONS Deliverable
D8.1A - Market assessment & technology monitoring Interim (v1.0) report detailing the business opportunities and barriers for 5G vertical applications providing a roadmap for all future 5G applications development.
2.2 Deliverable Overview and Report Structure Section 1 and 2 of the deliverable focuses on introducing the deliverable. Section 1 provides an executive summary of the deliverable while Section 2 is divided into 2 sub-sections, the Mapping of the project outcomes in the deliverable and the structure.

D8.1A Market Assessment and Technology Monitoring (V1.0)
© 5G-SOLUTIONS, 2019 Page | 10
10
Section 3 focuses on the 5G general framework including the Features, use cases and the politics behind the implementation of 5G technologies. Section 4 contains a number of sub-sections: starting with the Business ecosystems and the stakeholders for the use of 5G, followed by sub-sections regarding the general Market Analysis, Impacts on SMEs and Start-ups as well as the impact on telecommunication companies. Section 5 of the deliverable focuses on the Social Acceptance of 5G. It contains three sub-sections, first documents the 5G as a technology for life, the second sub-section documents the socio-political dimension and acceptance, market acceptance and limitations, the final sub-section focuses on the model for social acceptance for 5G. Section 6 of the deliverable provides more focused market analysis of the living labs, the verticals and the industries they plan to target. It contains four sub-sections for each of the vertical i.e. Factories of the Future, Smart Energy, Smart Cities and Ports and Media and Entertainment. For each of the living labs, apart from a general market assessment, there is further division into specific use cases wherever deemed necessary to document the market of a particular use case using SWOT and PESTLE Analysis as well as the role of 5G in development of the use case. Section 6 of the deliverable documents the Technology monitoring methodology that will be setup during the project lifecycle to help partners as well as external stakeholders to have access to a knowledge base where the information collected regarding 5G or the verticals or related news can be published and categorised. The final section provides the conclusions and the next steps the consortium will undertake as a result of the information provided in this deliverable.

D8.1A Market Assessment and Technology Monitoring (V1.0)
© 5G-SOLUTIONS, 2019 Page | 11
11
3. 5G general framework 3.1. 5G features and use cases The two major features that will come along with 5G networks are enhanced mobile broadband (eMBB) with lower latency and the possibility for massive IoT, given that virtually unlimited amounts of devices can connect to the network simultaneously. Enhanced mobile broadband with ultra-low latency will enable consumers to experience a new way of mobile connectivity. While 5G is prospected to be as fast as 1-20 Gbps, Deutsche Telekom tested 5G and had a speed of 3 gigabits per second so far2. Speeds of up to 20 Gbps will make VR/AR on-the-move, video streaming (in 3D, 4K, 8K, 360°) and high-density experiences possible. An increasing demand for data among private consumers can already be observed. While in 2016 a normal consumer used 1,6 Gb per month, this number will increase to 7 GB per month in 20213. Secondly, massive IoT will be enabled through 5G. This means that meters and sensors in smart cities will be connected and industrial robotics or connected cars will be able to communicate quickly and reliably. 5G will also have implications for the health sector and medicine. The low latency and fast connectivity can make remote video diagnosis easier, enable remote-control surgery or enhance the guidance for practitioners. For example, Barcelona launched a pilot project for remote surgery assistance enabled through 5G. 5G also solves the latency problem and offers ultrahigh definition, enabling collaboration from remote places around the world. On February 27th, 2019 Barcelona hosted the first 5G tele-mentored surgery4. In terms of technology, 5G is the successor of 4G and is especially characterized by a higher bandwidth and lower latency than 4G connections. A closer look on technical specifications and characteristics can help to understand the differences compared to 4G:
Enhanced mobile broadband (eMBB) enables high speed connectivity between 1-20 Gbps and at the same time higher network capacity as well as spectral efficiency (i.e. the information rate that can be transmitted over a given bandwidth in a specific communication system).
Ultra-reliable low latency communications (URLLC) lowers the latency to 1-3ms and offers ultra-reliable and secure communication (LTE offers 15-10ms).
Massive machine-type communication (mMTC) allows connectivity of 10.000-1.000.000.000 IoT devices per km2.
Core Network Approach: Implementation occurs in form of Non-Stand-Alone (NSA) deployments followed by Stand-Alone deployments. NSA will initially deliver higher data-bandwidth and reliable connectivity. NSA means that 5G and 4G will operate together. The full power of 5G can, however, only be reached with SA 5G deployment5.
Network Slicing is an aspect of the new 5G architecture which lets operators provide “slices” of the network with different features to different customers. Every customer can receive a tailored and unique set of resources regarding connectivity, speed and capacity. Slicing can only be done in Stand-Alone 5G mode6.
2 https://www.telekom.com/en/company/details/5g-speed-is-data-transmission-in-real-time-544498 3 https://www.cisco.com/c/en/us/solutions/collateral/service-provider/visual-networking-index-vni/white-paper-c11-738429.html 4 http://blog.hospitalclinic.org/en/2019/02/barcelona-hosts-the-first-5g-tele-mentored-surgery/ 5 https://www.ericsson.com/en/blog/2019/7/standalone-and-non-standalone-5g-nr-two-5g-tracks 6 https://www.sdxcentral.com/5g/definitions/5g-network-slicing/

D8.1A Market Assessment and Technology Monitoring (V1.0)
© 5G-SOLUTIONS, 2019 Page | 12
12
3.2. Politics behind 5G While the 5G installation is in its early stages and 5G is not widely available yet, there are already huge discussions and concerns. The EU has entered a Public Private Partnership (joint venture between European Commission and European ICT) to overcome 5G challenges and to develop future networks. Concerns Discussions and concerns slowing down the implementation of 5G are on one hand related to the reservations about health or public safety, as for example 5G networks might make monitoring much more difficult for police forces because of the scattered data across lots of elements of the mobile system7. Many of those concerns were discussed at the Prague 5G Security Conference on the 2nd and 3rd of May 20198. Cyber security from EU, NATO States and others as well as 5G network experts met in Prague to discuss the opportunities for malicious behaviour enabled through 5G. States must ensure a secure cyberspace and deter attempts to take control over or disrupt communication channels and the information transmitted. As a result, at the meeting’s chairman a number of proposals were put forward in four categories: Policy, technology, Economy and Security, Privacy and Resilience. On the other hand, it would seem that currently the main concern is of another nature. Some policymakers in Brussels believe the tech giant Huawei became the world leading mobile network equipment provider through unfair measures such as espionage and price dumping. While initially being dependent on the technological advancements coming from the US, Europe will have to adopt to new technologies emerging from China and Asia in general. While technological dependence on the US is no issue to most consumers and companies in Europe, it is different with dependence on China. Europe is confident with the US legal system and therefore, companies like Cisco can have a global network switch market share of over 50%. Meanwhile, companies like Huawei are not trusted to keep for example sensible customer data from national security and intelligence services9. This is because Chinese firms are obliged to collaborate with Chinese intelligence agencies10. The big problem Huawei faces today, is that the company apparently closed 28 of its 50 5G network deals in European countries. Now the EU has to decide whether these deals can be fulfilled or if they pose a risk to national security11.
Rollout
In the European Union, the member states are responsible for the rollout of 5G. For 2019, auctions are either already finished or will do so in 11 states: Austria, Belgium, Czech Republic, France, Germany, Greece, Hungary, Ireland, Netherlands, Lithuania, and Portugal. Furthermore, in 2020 there are six additional auctions scheduled in Spain, Malta, Lithuania, Slovakia, Poland, and the UK. The ‘5G Action Plan’ sets target dates for commercial roll-out (2020) and comprehensive roll-out in cities and major transportation paths (2025). Europe is a world-leader in doing trials related to 5G verticals through the European Commission’s 5G Public-Private Partnership with a total number of 139 trials. One important issue is cybersecurity (see Huawei above). Thus, on a national level all member states are supposed to
7 https://www.bbc.com/news/technology-49043822 8 https://www.vlada.cz/en/media-centrum/aktualne/prague-5g-security-conference-173333/ 9 https://technode.com/2019/06/25/europes-5g-challenge-and-why-there-is-no-easy-way-out/ 10 https://www.bloomberg.com/news/articles/2019-07-19/eu-assessing-5g-security-risks-that-could-exclude-huawei 11 https://www.scmp.com/tech/big-tech/article/3019248/nearly-60-huaweis-50-5g-contracts-are-europe

D8.1A Market Assessment and Technology Monitoring (V1.0)
© 5G-SOLUTIONS, 2019 Page | 13
13
assess the several risks associated with 5G deployment to mitigate them and create guidelines for suppliers and operators of 5G networks12.
Auctions
The model that Germany chose for the auction of its 5G spectrums led to the winning operators overpaying themselves by 1 billion Euros after over 400 rounds of auctioning. This high price must be assessed in combination with the costly rollout of the technology and the small revenue stream that the operators such as Vodafone or Telekom will receive in the initial years. The auction results were mainly driven by the small amount of spectrum that German authorities put up for sale. 1&1 Drillisch, which did not own any spectrum at all before, made the auctioned amount especially scarce. The problem with paying these high amounts is that it will negatively affect the pace of 5G-rollouts and the ambitions that the German government (or any others for that matter) might have. A great solution would be to simply give away spectrum to operators, as countries such as China already does13.
12 https://europa.eu/rapid/press-release_MEMO-19-1833_en.htm 13 https://www.lightreading.com/mobile/5g/germanys--euro-6b-5g-auction-should-be-a-break-point-for-telecom/d/d-id/751720

D8.1A Market Assessment and Technology Monitoring (V1.0)
© 5G-SOLUTIONS, 2019 Page | 14
14
4. 5G Business Ecosystem
4.1. Business Ecosystem and stakeholders A business ecosystem refers to a system of different actors who together provide a comprehensive solution for customers or end users [1]. The ecosystem players share customer and system focus for the potential technologies. They both collaborate and compete in the development of a new products or services [2] and must find a balance between the fast pace of technological advances and financial returns. The first requires openness while the latter requires protection [3]. Such an ecosystem can often consist of a core actor and several smaller players in the market. The core actor is often called "keystone" or platform leader [4], [5] while the smaller players are called niche or complementary players. These actors integrate the platform into their software, applications, products and services [6], [7]. The platform enables innovation across the ecosystem and the new solutions adapt by diversifying to include new partnerships, in addition to their industries [7], not only within an internal value network for a single industry such as telecommunications, utilities, transportation, etc. [8]. In recent years, the mobile telecommunication sector and 5G community have adopted the term ecosystem to signal the systemic nature of the technologies and markets. The industry uses the term ecosystem in two slightly different ways. Firstly, GSMA [9] and ITU [10] apply the term mobile ecosystem to broaden the market beyond mobile operators, including for instance device manufacturers, equipment vendors, retail operators, software companies, and organizations in adjacent industry sectors. Also, the term 5G ecosystem signals that many types of firms are involved in value creation and capturing [11]. Secondly, the term ecosystem is used for more specific cases where a platform enables surrounding firms to innovate and create value in order to grow the total market; Apple App Store is often used as an example of this concept [12]. Moreover, 5GPPP identify main stakeholder roles (performed by corporations and/or SMEs/start-ups) in the 5G value chain/ecosystem, indicating also how their business relationships could potentially evolve as the 5G ecosystem is being developed, see Figure 1 [12].

D8.1A Market Assessment and Technology Monitoring (V1.0)
© 5G-SOLUTIONS, 2019 Page | 15
15
Figure 1: 5G Ecosystem stakeholders and interactions
The changing 5G ecosystem challenges how Network Service Providers (NSPs) current business models will evolve when offering specialized services with the needed level of service to vertical users/customers. The involvement of stakeholders from vertical industries such as transportation, health, manufacturing etc. in the 5G value chain/ecosystem is a vital change [12]. They can play the role of an Online Service Provider (OSP) providing services directly to end customers on top of connectivity services from NSPs manufacturing companies producing vertical industry specific equipment and play the role of device manufacturer. The broker is also a relevant stakeholder/partner to include in the 5G business model, acting as intermediary between OSPs (including verticals) and NSPs, and between NSPs, offering services to help its customers establishing the most effective solution meeting their needs [12]. Brokers may also act as intermediaries between end-customers and NSPs/OSPs providing services with similar characteristics as for the wholesale market. It is also expected that revenues for Business-to-Consumer mobile data services in combination with revenues from wholesale relationships will increase when the new services and products are deployed across the 5G value chains/eco-systems. The vision of 5G as an ecosystem includes for certain exterior view, referring to platform, open interfaces, interdependency with external partners and customers and consequently increased innovation and growth. Here, the model hides the internal complexity of a platform, and reveal the complexity of interactions with customers and external partners that can belong to other industry domains. In addition, the new 5G architecture requires that we consider how the internal value network of 5G may be affected, e.g. provisioning of 5G services. Thus, these approaches can be seen as complementary and both of them will be important to understand the 5G market.

D8.1A Market Assessment and Technology Monitoring (V1.0)
© 5G-SOLUTIONS, 2019 Page | 16
16
4.2. 5G Market Analysis Although 5G is on the rise, 4G LTE will remain for a few more years. This can be seen when assessing the prognosticated number of 4G and 5G lines in mobile networks. By 2022 the Asia/pacific region will be leading in total numbers with expected 3,850 million 5G and 229 million 4G lines. Meanwhile, Western Europe is expected to have 678 million 5G and 74 million 4G lines, followed by North America with 589 and 102 million 5G and 4G lines respectively by 202214
Figure 2: Number of Devices connected by Connection Type
Regarding the market size of 5G, it is expected to grow at a CAGR of 111% between 2019 and 2025 where it will reach $277 billion according to Business Wire15.
According to Statista the market shares of the largest global telecom mobile infrastructure companies in 2017 were16
o Huawei 28 % o Ericsson 27 % o Nokia 23 %
Meanwhile, telecommunication equipment companies ranked by overall revenue in 2017 (in billion U.S. dollars) are also led by Huawei with 92 Billion U.S. Dollars. Followers are Cisco Systems (48 billion), Fujitsu (38 billion), Nokia (27 billion) and Ericsson (24 billion)17. The total communications equipment market size by product category from 2014 to 2019 (in billion US dollars) is composed as follows:
14https://de.statista.com.login.bibproxy.whu.edu/statistik/daten/studie/442820/umfrage/anzahl-der-4g-anschluesse-im-mobilfunk-weltweit-nach-region/ 15 https://www.businesswire.com/news/home/20190410005651/en/Global-5G-Market-Report-2019-2025---Market 16 https://www.statista.com/statistics/526037/global-telecom-equipment-market-share/ 17 https://www.statista.com/statistics/314657/top-10-telecom-equipment-companies-revenue/

D8.1A Market Assessment and Technology Monitoring (V1.0)
© 5G-SOLUTIONS, 2019 Page | 17
17
Figure 3: Chart of the Global Communication Market Size (2014-2019)
Spending has constantly grown above 2% since 2017 and is forecasted to grow by 3.2% in 201918. Regarding the telecommunication network infrastructure, the global telecom services spending forecast from 2018 to 2023 (in billion U.S. dollars) by Statista estimates the following spending amounts19 :
Figure 4: Chart Showing the Forecast Spending on Global Spending on Telecom Services (2018-2023)
The 5G mobile infrastructure spending is estimated to reach 4.2 billion US Dollars by 2020 according to the Gartner report20.
18 https://www.gartner.com/en/newsroom/press-releases/2018-10-17-gartner-says-global-it-spending-to-grow-3-2-percent-in-2019 19 https://www.statista.com/statistics/322995/worldwide-telecom-services-spending-forecast/ 20 https://www.gartner.com/en/newsroom/press-releases/2019-08-22-gartner-forecasts-worldwide-5g-network-infrastructure

D8.1A Market Assessment and Technology Monitoring (V1.0)
© 5G-SOLUTIONS, 2019 Page | 18
18
With respect to user numbers, one can see a strong increase in active mobile broadband subscriptions worldwide from 2007 to 2018, reaching 5,286 billion in 201821. The composition of these subscriptions can be observed as follows:
Figure 5: Chart Showing Global Mobile Subscription Forecast (2017-2023)
21 https://news.itu.int/itu-statistics-leaving-no-one-offline/

D8.1A Market Assessment and Technology Monitoring (V1.0)
© 5G-SOLUTIONS, 2019 Page | 19
19
Another relevant measure is the data amount that is transferred via telecommunication networks. They are expected to grow dramatically in the future and will be enabled by 5G. While in 2018 the global monthly average smartphone traffic amounted to 25 exabytes/month, this figure is believed to reach 131 exabytes/month in 202422. This comes down to 5.6 GB/month per person in 2018 and nearly 20 GB/month per person in 2024. These large amounts of forecasted consumed data can be further analysed when looking at the devices and applications using the data. Cellular connected PCs, tablets and smartphones are projected to grow linearly and also M2M data amounts will rise in the future. The main applications the data is used for are internet, video streaming, web, online gaming and file sharing, with internet video being the largest data user:
Figure 6: Chart Showing the Global Internet Consumer Data Traffic (2016-2022)
Some research also gives insights into the leading service providers regarding their attitude towards 5G technology showed the following:
1) 60% of the companies claimed that 5G technology will swing their company focus towards
enterprise ecosystems.
2) 77% of companies expect to play a leading role in 5G ecosystem with enterprise services.
3) 90% of companies say they have made progress in identifying vertical market opportunities.
Some of the top factors that have aided in the rapid growth in the 5G technology market are:
Growth in number of Internet of Things devices and adoption of edge computing: Edge
Computing helps in the processing of large volumes of data near the data source. It can facilitate
in real time analysis with a faster response time. Apart from improvements in faster response
time and overall performance, it can also help reduce security and privacy concerns. It is
estimated that the number of IoT devices will reach 50 billion by 2020. This, along with 5G
technology, and its low latency and constant uptime will prove to be a new and high-demand
market contender.
22 https://www.ericsson.com/en/mobility-report/reports/june-2019/mobile-data-traffic-outlook

D8.1A Market Assessment and Technology Monitoring (V1.0)
© 5G-SOLUTIONS, 2019 Page | 20
20
Surge in demand for content streaming services: In recent years, online content streaming has
grown exponentially, with a large variety of streaming services currently available, all fighting for
the larger market share. The demand for high-quality streaming has further increased the
average global consumption of data, and service providers are finding new and innovative ways
to meet this growing demand. 5G aims to provide ultra-highspeed internet with negligible
lag/latency, making it an optimal solution for meeting streaming demands.
Opportunity in autonomous vehicles: The global autonomous vehicle market has been
experiencing rapid growth in recent years and is projected to reach $550 billion by 2026. Major
automotive companies, such as General Motors, Toyota and Ford have invested $1 billion
towards self-driving startups and AI solutions. Self-driving cars generate massive amounts of
data, which force the implementation and research into innovative solutions and technologies
that would be capable of gathering, storing and processing large amounts of data. 5G-
SOLUTIONS and Edge Computing are planned to be used for this, making self-driving vehicles
closer and more actualized than ever before.
5G Technology Key Market Segmentation
By offering
a. Hardware
b. Software
c. Services
By Connectivity
a. Enhanced Mobile Broadband (eMBB)
b. Ultra-Reliable Low Latency Communication (URLLC)
c. Massive Machine Type Communication (mMTC)
By Application
a. Connected Vehicles
b. Monitoring and Tracking
c. Automation
d. Smart Surveillance
e. Virtual Reality and Augmented Reality
f. Enhanced Video Service
g. Others
By End User
a. Manufacturing
b. Automotive
c. Energy and Utilities
d. Transportation and Logistics
e. Health and Entertainment
f. Others
4.3. 5G impact on SMEs and start-ups

D8.1A Market Assessment and Technology Monitoring (V1.0)
© 5G-SOLUTIONS, 2019 Page | 21
21
4.3.1 Improvement of internal business communication
From responding to customer inquiries to communicating with remote employees via remote access software, fast and reliable communication is critical to the productivity, profitability, and success of small businesses. Due to the incredibly fast 5G connection, businesses can stream high-definition video, audio and images with virtually no latency. This will create tremendous opportunities for instant communication between customers and employees. Especially for start-ups, an enhanced internal communication will boost time to market, which is an essential driver for success in the fast-growing start-up environment. All in all, with faster speed and improved coverage of 5G wireless access, SMEs and start-ups can improve communication both internally and externally. Finally, this will lead to higher financial performance.
4.3.2 Speeding-up businesses processes
For businesses, which rely on network-related tasks such as selling online or sharing documents as well as files in the cloud, accessing faster Internet speed leads to an enormous reduction in process durations. Therefore, faster completion of critical business tasks will inevitably have a positive impact on business efficiency. This improved efficiency is expected to lead to higher employee productivity, paving the way for lower overheads and ultimately a higher bottom line. With regards to start-ups and SMEs, gaining a cost-benefit is an enormous advantage due to their restriction in financial resources. This might reduce their dependency from external investors and, thus, ensures control over the company. Moreover, cloud computing has already become an integral part of modern IT infrastructures. With the reduced latency of 5G technology, employees can communicate more effectively and efficiently than ever before. All in all, start-ups and SMEs are able to optimize their cost structure due to the impact of 5G.
4.3.3 Expanding capabilities with Internet of Things
Networked devices are increasingly evolving in the way business is conducted. From remotely managing production to accelerating delivery to customers by linking all relevant processes, leveraging the power of IoT helps small businesses increase efficiency and ultimately profits. Thereby, small businesses are able to reach a higher level of productivity with a lower cost structure. 5G networks are built to meet the increasing connectivity requirements of the Internet of Things (IoT). By enabling device to device communication for up to one million devices per Square Kilometre, 5G will expand the growing opportunities that IoT offers small businesses. In addition, 5G will be more energy efficient than existing network standards due to the technical improvements of the networks, resulting in a longer battery life of the devices, which in turn will contribute to efficiency improvements.
4.3.4 Driver for innovation in SMEs and start-ups
As President and CEO of the Small Business and Entrepreneurship Council, Karen Kerrigan, said in a statement on the vote of the FCC: "The FCC's courageous action will accelerate the availability of 5G technology, which means that our economy and our businesses will become more innovative, resilient and competitive.”23 An example of such business innovation would be companies that develop interactive virtual reality technologies that enable customers to have dynamic video experiences. Through 5G holographic projection, which allows users to view 3D video without 3D glasses, companies
23 https://sbecouncil.org/2018/09/26/sbe-council-applauds-fcc-vote-to-accelerate-5g-deployment/

D8.1A Market Assessment and Technology Monitoring (V1.0)
© 5G-SOLUTIONS, 2019 Page | 22
22
can offer 3D presentations at meetings, conferences, and events. Such technological innovations would help make a company more attractive by helping it become a pioneer in its field and give it an edge over its competitors. Innovative services and products can only be developed when the required data networks are available. Therefore, 5G is an essential part of developing and introducing innovative products and services. Moreover, 5G creates a wide range of new start-ups opportunities for entrepreneurs, especially in the area of interactive technology like VR and AR. One example is the Hyper Immersion Technology Taiwan Co. Ltd., which was founded in 2014 by a group of entrepreneurs with great enthusiasm for stereoscopic 3D imaging and virtual reality images. Formerly known as Industrial Technology Research Institute (ITRI), Electronics and Optoelectronics Research Labs. The team consistently develops 3D-related techniques and aims to make Virtual Reality (VR) and interactive technologies generally available for individual and family use. Without the implementation of 5G, companies like this would be limited in their business processes. All in all, this makes clear that 5G is a crucial driver for innovation. It is the foundation for the underlying network requirements and also creates a high potential for new business opportunities.
4.3.5 Improvement of recruiting procedure and bridging skill gaps
Another way 5G could significantly benefit SMEs and start-ups is by improving recruitment processes that help business owners recruit the right talent to drive their business forward. One reason 5G is likely to help improve recruitment practices and outcomes is the progress in video and remote technology. 5G technology removes recruitment barriers and enables companies to identify, interview, shortlist and hire the best talent from around the world. With the improvements 5G offers in video and teleconferencing technology, companies can not only find and recruit top talent but also take advantage of future-oriented companies to be a networked company with employees working from anywhere in the world. By helping small businesses recruit more effectively, 5G technology will help small businesses close the skills gaps, which have been difficult to close prior to the introduction of 5G.
4.4. 5G impact on telecommunication service providers Telecommunication market revenues have been declining in the recent years and are close to flat. 5G and digitalization can help telecommunication service providers to extend their traditional business beyond connectivity. 5G offers not just higher speed, but, especially in the upcoming releases, it will deliver a number of 5G attributes, such as higher reliability, segmented network performance, and much lower latency. These valuable attributes can enable new service offerings, use cases and business models. Furthermore, 5G will opens the possibilities of cost reduction for supporting the ever-growing data traffic demand. According to an analysis from Ericsson and Arthur D. Little24, the expectations across industries are that the ramp-up of 5G-enabled use cases is likely to happen later than previously anticipated, because industries are taking much longer than expected for a full digital transformation. By 2030, the expected industry digitalization revenues for ICT players worldwide across all industries - manufacturing, energy and utilities, public safety, healthcare, public transport, media and entertainment, automotive, financial services, retail, and agriculture - are expected to amount to around USD 3.8 trillion.
24 5G for business: a 2030 market compass – Setting a direction for 5G-powered B2B opportunities, October 2019

D8.1A Market Assessment and Technology Monitoring (V1.0)
© 5G-SOLUTIONS, 2019 Page | 23
23
The total value of the global addressable 5G-enabled market for service providers across said 10 industries is projected to be USD 700 billion in 2030, beyond mobile broadband.
Figure 7: 5G-enabled market for service providers
Of course, it will be impossible for all service providers to address all the opportunities across the industries: Healthcare (21%), Manufacturing (19%), Energy and utilities (12%) and Automotive (12%) appear to be the industries offering the larger shares of the revenue potential.
Figure 8: 5G-enabled market for service providers by verticals
Considering geographies, most opportunities for service providers over the coming decade will be in North-East Asia, Western Europe and North America.

D8.1A Market Assessment and Technology Monitoring (V1.0)
© 5G-SOLUTIONS, 2019 Page | 24
24
Figure 9: 5G-enabled market for service providers by region
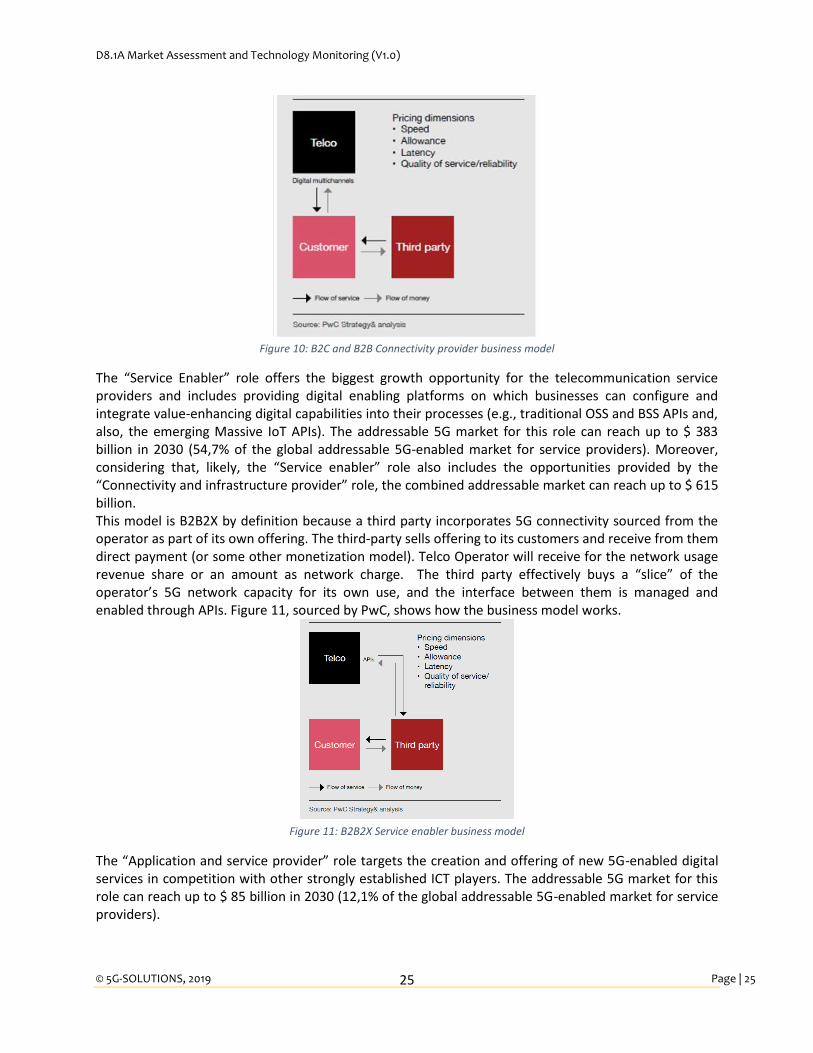
From a theoretical point of view Telecommunication service providers can address the opportunities offered by 5G across industries acting in the 5G value chain the same roles already covered in the 4G domain “Connectivity and infrastructure provider”, “Service enabler” and “Application and service provider”. But 5G offers ways to act these roles in a more enhanced mode and furthermore strengthening business-to-business-to-X (B2B2X) model, where X can be a consumer, a business, or a public agency. In the “Connectivity and infrastructure provider” role, the service provider focuses on implementing and operating network infrastructure and offering a tailored connectivity solution and IT enablers. According to Ericsson and Arthur D. Little, the addressable 5G market for this role can reach up to $ 232 billion in 2030 (33,2% of the global addressable 5G-enabled market for service providers). As far the Connectivity provider role, the model commonly used for 4G services was the “dumb pipe” model, where the operator sells voice and data connectivity directly to end-users, who contract separately with a service provider to buy services that leverage that connection. In this scenario we are in a B2C or B2B business models. In particular, in the B2B case, Operators generate revenues by charging the companies that provide 5G-reliant services to end users, or partner with service providers to bundle their service with connectivity subscriptions. This kind of approach was already present in the 4G era, but 5G gives operators a competitive advantage and make them more attractive. In fact, the improved capabilities provided by the 5G network enable better experience in the service users’ customers that can expect to enjoy more network services bundled with content provider services (e.g., gaming) and
the operator could offer its network service to the customer as part of that bundle. Figure 10, sourced by PwC25, shows how the business model works.
25 Making 5G pay, 2019
D8.1A Market Assessment and Technology Monitoring (V1.0)
© 5G-SOLUTIONS, 2019 Page | 25
25
Figure 10: B2C and B2B Connectivity provider business model
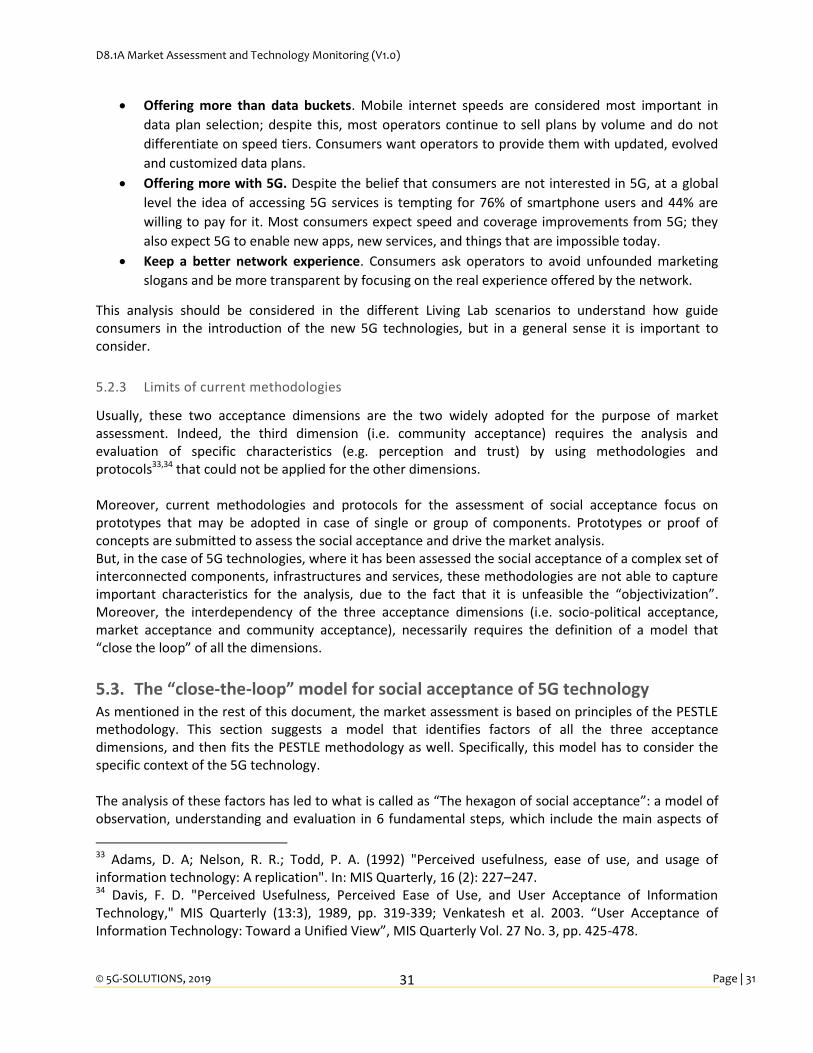
The “Service Enabler” role offers the biggest growth opportunity for the telecommunication service providers and includes providing digital enabling platforms on which businesses can configure and integrate value-enhancing digital capabilities into their processes (e.g., traditional OSS and BSS APIs and, also, the emerging Massive IoT APIs). The addressable 5G market for this role can reach up to $ 383 billion in 2030 (54,7% of the global addressable 5G-enabled market for service providers). Moreover, considering that, likely, the “Service enabler” role also includes the opportunities provided by the “Connectivity and infrastructure provider” role, the combined addressable market can reach up to $ 615 billion. This model is B2B2X by definition because a third party incorporates 5G connectivity sourced from the operator as part of its own offering. The third-party sells offering to its customers and receive from them direct payment (or some other monetization model). Telco Operator will receive for the network usage revenue share or an amount as network charge. The third party effectively buys a “slice” of the operator’s 5G network capacity for its own use, and the interface between them is managed and enabled through APIs. Figure 11, sourced by PwC, shows how the business model works.
Figure 11: B2B2X Service enabler business model
The “Application and service provider” role targets the creation and offering of new 5G-enabled digital services in competition with other strongly established ICT players. The addressable 5G market for this role can reach up to $ 85 billion in 2030 (12,1% of the global addressable 5G-enabled market for service providers).

D8.1A Market Assessment and Technology Monitoring (V1.0)
© 5G-SOLUTIONS, 2019 Page | 26
26
This model, also called solution provider, can be carried out in a traditional B2C mode or in a B2B2C
mode by bundling third-party products and services with its core connectivity and markets and then selling the bundled solution directly to the customers. Some operators are already leveraging this model, such as Vodafone, with a commercial agreement with OTTs to buy their services wholesale and resell them to consumers. Figure 11 by PwC shows how this biz model works.
Figure 12: B2B2X Application and service provider business model
Figure 13: Service Offerings and pricing
As a final consideration, 5G provide Telcos with Telecommunications of a greater flexibility in terms service offerings and pricing, leveraging this variety of business models and playing different roles in the business-to-business ecosystem overcoming the “dumb pipe” seat, and benefit of the market opportunities coming from the digital transformation due to the ever-growing application of IoT, AI, drones, robotics, smart cities, and Industry 4.0.

D8.1A Market Assessment and Technology Monitoring (V1.0)
© 5G-SOLUTIONS, 2019 Page | 27
27
Figure 14: Nationwide protest against the 5G technology in front of the Swiss houses of Parliament in Bern (21 September 2019)
5. Social Acceptance of 5G Technologies The relevance of technological innovation that constitutes 5G is and will be a concrete one that will involve the whole of society and individuals. The first experiments with 5G technology, which will grow exponentially in the near future, yet pose many problems and questions in terms of social acceptance (see Figure 1426) and for this reason this chapter dives the reader into the comprehension of this fundamental aspect for the introduction of innovative technological solutions.
First of all, it should be considered that the 5G-SOLUTIONS strategy is driven by the ambition to continuously improve the technological adoption of project results together with a right assets exploitation and improving/enabling the future user experience/capability. Many of the barriers for achieving successful projects at the implementation level can be considered as a manifestation of lack of social acceptance. However, the introduction of 5G offers many new opportunities providing significant benefits to citizens, businesses and the public sector. To fully realise this socio-economic potential, with a good social acceptance broad collaboration is the key.
5.1. 5G as main technology for life Before explaining these problems, it is essential to clarify a conceptual premise that is also useful in building a methodological and research process. This premise concerns the idea that 5G is a technology directly conceived and aimed at the life of people, at their existence to facilitate several processes, to reduce time and expectations, to make possible operations now more complex, and to bring a direct and concrete advantage in the existence of individuals and in professional, human, social, and cultural relationships. So, it could be said that 5G technology represents a capacity enabler in the life of each individual and of the whole society.
26 (© Keystone / Peter Klaunzer) available at https://www.tvsvizzera.it/tvs/pro-e-contro_la-battaglia-attorno-alla-tecnologia-5g/45433288 (last access December 2019).

D8.1A Market Assessment and Technology Monitoring (V1.0)
© 5G-SOLUTIONS, 2019 Page | 28
28
For this reason, it is of fundamental importance to assess the state of such social relations and possible changes due to the introduction of 5G technology, as well as this allows to better identify the most relevant accepted aspects. Consequently, a wide and proper use of 5G will also bring the advantage of a better, faster and more efficient implementation, corresponding to the needs of users, society, market, and professions. Last but not least, understanding the needs of society has to be considered in terms of “what will be the needs in the next future”. This can be difficult to be imagined, as well as it can be difficult to imagine a how in 2030 more than 60% of world’s population will live in cities, and over a hundred new mega cities will arise. In this perspectives, new capabilities have to be considered to allow sustainability of cities and quality of life in these new scenarios.
5.2. Impacting the social acceptance It is important to analyse how project results and exploitation assets will impact the social acceptance challenges, by considering two main dimensions: socio-political and market acceptance. Factors influencing socio-political and community acceptance are increasingly recognised as being important for understanding the general 5G situation, both at political level, as well as at national community level. The second dimension, market acceptance, has received less attention in the general technology social and ethical ecosystem, but it is fundamental for an industrial project, such as 5G-SOLUTIONS wants to be. In this sense, it could be interesting to take into account the approach used in a renewable energy innovation value chain27. In this case, social acceptance has been described in terms of three dimensions, namely socio-political acceptance, community acceptance and market acceptance. Each interdependent dimension includes specific stakeholders and concepts as shown in Errore. L'origine riferimento non è stata trovata..
Socio-political acceptance Market acceptance Community acceptance
Of technologies and policies Consumers Procedural justice
By the public Investors Distributional justice
By key stakeholders Intra-firm Trust
By policy makers Table 2 Dimensions of Social Acceptance
The Socio-political acceptance is social acceptance at the most general level and concerns the acceptance by key stakeholders and policy actors of effective policies. Those policies require the institutionalisation of frameworks that effectively foster and enhance market and community acceptance, for example establishment of proper policies and guidelines that create a legal framework where citizens can recognise their right and the possibility to be considered as important actors of the scenario. In a complex value chain, including antennas producers, telco, system integrators, device producers, but also final end-users, i.e. consumers, the social acceptance can also be interpreted as market acceptance, or the process of market adoption of an innovation. In this perspective, it could be interesting to
27 “Social acceptance of renewable energy innovation: An introduction to the concept” by Rolf Wustenhagen, Maarten Wolsink, and Mary Jean Burer (2007)

D8.1A Market Assessment and Technology Monitoring (V1.0)
© 5G-SOLUTIONS, 2019 Page | 29
29
consider diffusion of innovation28, which explains the adoption of innovative products by consumers through a communication process between individual adopters and their environment. In addition, the 5G scenarios is complicated by the proliferation of heterogeneous smart devices (e.g. IoV - Internet of Vehicles, IoT - Internet of Things, MMC - Mobile Cloud Computing, SG - Smart Grids, Big Data, and D2D - Device-to-Device communications) in the network and how these are instantiated and interconnected within scenarios and Living Labs. Due to their interdependency, community acceptance plays an important role as well and it can’t be forgot in the analysis. Community acceptance refers to the specific acceptance of siting decisions and project results by local stakeholders, particularly residents and local authorities. Wrong communication approach, missing the engagement of specific groups of communities and lack of information on benefits for the local community may arise barriers to the acceptance of novel technologies, 5G technologies as well, and delay its successful implementation. The reader is accompanied in a short definition of the first two dimensions, while the rest of the chapter aims to identify lack of current state of the art approaches and suggest an enhanced model for the assessment of the social acceptance of 5G technology in 5G-SOLUTIONS project.
5.2.1 Socio-political dimension and acceptance
Already from 2016, the President of the European Commission Jean-Claude Juncker, in his speech on the EU state, had announced a strategy for the development of digital infrastructures. The announced strategy foresees the achievement of three fundamental objectives:
access to ultra-fast connectivity for all socio-economic drivers such as schools, universities,
research centres, public administrations;
connectivity at least 100 Mbps in each home;
urban areas, roads and stations covered by the 5G, for at least one metropolis of each state of
the Union from 2020.
All these objectives should be carefully considered as important dimensions for the 5G-SOLUTIONS project, in order to assess the social-political impact, but also to guide the social acceptance challenge. To implement this strategy, the European Commission has launched a legislative proposal called the European Electronic Communications Code29 . This code provides for the simplification of the rules for private investments related to infrastructures throughout the European Union, in this sense this should be taken into account into social political dimension. The goal is to make the 5G the activator of new applications that will be possible thanks to very high speed and low latency, such as high definition video anywhere and augmented reality in which the digital and physical world will become one. The 5G infrastructure Public Private Partnership (5G PPP), to which the 5G-SOLUTIONS project is directly linked, is a joint initiative between the European Commission and the European ICT industry. It aims to
28 Rogers, E.M., 1995. Diffusion of Innovations, fourth ed. The Free Press, New York. 29 Proposal for a DIRECTIVE OF THE EUROPEAN PARLIAMENT AND OF THE COUNCIL establishing the European Electronic Communications Code, https://eur-lex.europa.eu/legal-content/EN/ALL/?uri=comnat:COM_2016_0590_FIN

D8.1A Market Assessment and Technology Monitoring (V1.0)
© 5G-SOLUTIONS, 2019 Page | 30
30
deliver solutions, standards, architecture and technologies for the ubiquitous next generation communication infrastructures. With WiFI4EU30, the European Commission intends to promote free Wi-Fi connections for citizens and visitors in public spaces such as parks, squares, public buildings, libraries, museums and health centres throughout Europe. In addition, the WiFi4EU initiative, which will have a budget of 120 million euros between 2017 and 2019, will favour the installation of Wi- Fi devices in the centres of community life. The WiFi4EU initiative will be implemented in a geographically balanced manner, so that both residents and visitors to thousands of local communities across the EU can benefit from high-speed connections. Finally, the Connecting Europe Broadband Fund (CEBF)31 aims at to fill the lack of resources on the market by supporting investments in broadband infrastructures through direct funding to the private sector, public enterprises, public-private partnerships (PPPs) and through financial intermediaries. The fund will combine public and private investment, supporting the development of broadband projects across the Union. It will be necessary to create more competition and predictability for investments in the EU: the new rules are aimed at giving certainty on long-term revenues through certain rules that overcome disparities between the different EU countries. All these political initiatives will support the introduction of 5G technologies, in general, but, specifically, also of 5G-SOLUTIONS results and achievements.
5.2.2 Market acceptance
The survey conducted by Ericsson in 201832 to understand the changes in consumer habits and, consequently, the new expectations and needs, has documented some very important points that testify new attitudes and opinions towards the telecommunications stakeholders. The report of this survey describes six calls to action from consumers which operators must act on, to drive consumer satisfaction and monetize mobile broadband for a 5G future. These expectations for a 5G future consumer can be synthesize as follows:
Providing with an effortless buying experience. 57% of smartphone users find complicated to
understand mobile data plans; there is a noticeable misalignment between what users buy and
what they actually use.
Offering a sense of unlimited. Smartphone users are not necessarily looking for limitless data
plans but rather a sense of unlimited. It is a question of mental tranquillity, rather than the
actual use of available traffic, which pushes consumers to purchase unlimited data plans and
operators are invited to explore alternative ways of offering them this sense of freedom.
Treating the gigabyte as currency. Smartphone users with capped data plans are left with 40
percent of their data allowance unused by the end of the month; most users pay for mobile data
they never use. 2 out of 5 consumers would like to be able to monetize this excess traffic and
expect to be able to store, exchange or donate the amount of unused data.
30 WiFi4EU- Free Wi- Fi for Europeans, https://ec.europa.eu/digital-single-market/en/wifi4eu-free-wi-fi-europeans 31 Connecting Europe Broadband Fund (CEBF), https://www.eib.org/en/about/procurement/calls/op-1328.htm 32 “Towards a 5G consumer future”, https://www.ericsson.com/en/reports-and-papers/consumerlab/reports/six-calls-to-action
D8.1A Market Assessment and Technology Monitoring (V1.0)
© 5G-SOLUTIONS, 2019 Page | 31
31
Offering more than data buckets. Mobile internet speeds are considered most important in
data plan selection; despite this, most operators continue to sell plans by volume and do not
differentiate on speed tiers. Consumers want operators to provide them with updated, evolved
and customized data plans.
Offering more with 5G. Despite the belief that consumers are not interested in 5G, at a global
level the idea of accessing 5G services is tempting for 76% of smartphone users and 44% are
willing to pay for it. Most consumers expect speed and coverage improvements from 5G; they
also expect 5G to enable new apps, new services, and things that are impossible today.
Keep a better network experience. Consumers ask operators to avoid unfounded marketing
slogans and be more transparent by focusing on the real experience offered by the network.
This analysis should be considered in the different Living Lab scenarios to understand how guide consumers in the introduction of the new 5G technologies, but in a general sense it is important to consider.
5.2.3 Limits of current methodologies
Usually, these two acceptance dimensions are the two widely adopted for the purpose of market assessment. Indeed, the third dimension (i.e. community acceptance) requires the analysis and evaluation of specific characteristics (e.g. perception and trust) by using methodologies and protocols33,34 that could not be applied for the other dimensions. Moreover, current methodologies and protocols for the assessment of social acceptance focus on prototypes that may be adopted in case of single or group of components. Prototypes or proof of concepts are submitted to assess the social acceptance and drive the market analysis. But, in the case of 5G technologies, where it has been assessed the social acceptance of a complex set of interconnected components, infrastructures and services, these methodologies are not able to capture important characteristics for the analysis, due to the fact that it is unfeasible the “objectivization”. Moreover, the interdependency of the three acceptance dimensions (i.e. socio-political acceptance, market acceptance and community acceptance), necessarily requires the definition of a model that “close the loop” of all the dimensions.
5.3. The “close-the-loop” model for social acceptance of 5G technology As mentioned in the rest of this document, the market assessment is based on principles of the PESTLE methodology. This section suggests a model that identifies factors of all the three acceptance dimensions, and then fits the PESTLE methodology as well. Specifically, this model has to consider the specific context of the 5G technology.
The analysis of these factors has led to what is called as “The hexagon of social acceptance”: a model of observation, understanding and evaluation in 6 fundamental steps, which include the main aspects of
33 Adams, D. A; Nelson, R. R.; Todd, P. A. (1992) "Perceived usefulness, ease of use, and usage of information technology: A replication". In: MIS Quarterly, 16 (2): 227–247. 34 Davis, F. D. "Perceived Usefulness, Perceived Ease of Use, and User Acceptance of Information Technology," MIS Quarterly (13:3), 1989, pp. 319-339; Venkatesh et al. 2003. “User Acceptance of Information Technology: Toward a Unified View”, MIS Quarterly Vol. 27 No. 3, pp. 425-478.

D8.1A Market Assessment and Technology Monitoring (V1.0)
© 5G-SOLUTIONS, 2019 Page | 32
32
Figure 15: The hexagon of social acceptance – the “close-the-loop” model
this technology and its use on a large scale: i.e. Perception, Motivation, Awareness, Trust, Capacity Enabling and Accountability.
A model, such as the one described below, is able to identify the main critical aspects and to track better societal feedback. A greater understanding is reflected in greater confidence, which is reflected in greater willingness to use technologies, in the reduction of barriers of diffidence and fear.
5.3.1 Perception
Technological progress is first and foremost the result of the human tendency to increase knowledge of oneself and of reality. The perception of technology is largely linked to the perception of reality and the reality that this technology can change. In order to evaluate and influence the perception of technological tools, it is appropriate to undertake a process of awareness of reality and personal needs, to which a certain technology can respond. It is also useful to underline that perception often corresponds to the image that a social group has developed of certain elements or tools. The power of technologies to affect perceptions is so strong that an author like Sherry Turkle35 argues about the silencing of human conversations as a damaging consequence of being always close to email or Twitter or Facebook, specifically in the impact ICT has on family life, on education, and on the possibilities of solitude. Improving the positive image of a technology can change between different social groups with different needs, but although it is influenced by subjective norms, it is an important factor for its acceptance.
5.3.2 Motivation
A careful perspective on the introduction of 5G technology into society and the market should start, or certainly consider, the question of the motivation of a particular society. The motivation depends largely on the experiences and history of a certain part of society, linked to the territory and its traditions.
35 Turkle, S. (2015) Reclaiming Conversation: The Power of Talk in the Digital Age, Penguin Press: New York.

D8.1A Market Assessment and Technology Monitoring (V1.0)
© 5G-SOLUTIONS, 2019 Page | 33
33
These distinctions appear important in the evaluation of the social acceptance of a specific technology; the representation of people is influenced by the risks and problems that have characterized and that vary from one population to another. Moreover, due to the fact that motivation may change during the lifespan36 of an individual and a community as well, this factor has to be carefully evaluated considering the potential conflictual positions of the stakeholders. Analyse the possibilities and appropriate strategies to integrate a concept, a tool and an innovation in the light of a recognised interest and social motivation means that the choices for its introduction are more effective in terms of dissemination, information, and even business strategy.
5.3.3 Trust
Trust is a central and decisive aspect in the evaluation of market assessment, since it is both a point of strength and a point of weakness. Society (considered here according to the statistical criterion of a numerical majority of people, and if possible of people with average information on technology) always places a trust in what it uses; this trust can be conscious, the result of a progress, or more often
ingenuous, simply circular factor of a process of habits and traditions. Whatever the individual cases, there is no doubt that trust is the common basis of the users' approach to technology. Forecasting and hypothesizing the impact of 5G technology then means understanding how its infrastructure intercepts the trust of individuals and communities. The growing focus on personal data protection and new legislation are important and necessary conditions for present and future technological development. But history, and in particular the history of technology, shows that public opinion and consensus are often based more on the existence of traditions than on legislation, which can be traditions of facts or thoughts. The perception that some technologies have a central influence on people's existence and relationships is in part the result of the way in which these technologies were designed; on the other hand, however, it is the result of a generalized feeling, not always well-founded. This is why two tools, both technological and with important potential, can generate very different feelings37. Whenever we use a car, we are somehow putting in place an attitude of trust in the carmakers and in every previous step; this is the result of experience. Where that experience is put at risk, or where some event interrupts that trust, we see that the feeling of trust falls apart. An example is the case of Volkswagen in 2015, when it was discovered that the eco-sustainability of diesel engines was, under test conditions, manipulated, in Volkswagen engines, with nitrogen dioxide emissions 40 times higher than the limits allowed by law. As a result of this, the German company's stock collapsed by 22%, with a loss of 12.9 billion euros for members38. Trust, and the proof of truthfulness and correspondence between the prospects announced and reality is of fundamental importance, especially for a technology such as 5G which, for its purposes and its origin, will allow and require the active participation of people and the use of data and personal elements.
36 Nikitin, J., Schoch, S., & Freund, A. M. (2014). The role of age and motivation for the experience of social acceptance and rejection. Developmental Psychology, 50(7), 1943–1950. https://doi.org/10.1037/a0036979 37 Martens, B., Teuteberg, F.: “Decision-making in cloud computing environments: A cost and risk based approach”. Information System Frontiers 14, 871–893 (2012). 38 Data from https://www.wallstreetitalia.com/trend/scandalo-volkswagen/

D8.1A Market Assessment and Technology Monitoring (V1.0)
© 5G-SOLUTIONS, 2019 Page | 34
34
5.3.4 Awareness
In the light of the central issue of trust, it is therefore clear that it is important for end-users to be as distinctly aware as possible. They should be able to understand the nature, purpose, operation and implications of 5G technology, so as to see its enormous possibilities and limitations. A proper awareness is necessary to correctly establish the order of any problems, to avoid the difficulties arising from a lack of information and knowledge; the guided use and conscious judgment on 5G solutions is indispensable for an effective societal impact.
5.3.5 Capacity enabling
As described previously, the effects of 5G are likely to increase the emergence of new realities, new activities and, consequently, new interests and processes on the part of users. It should be noted that addiction is a characteristic and a reality, first of all personal, and therefore social, that is directed towards different objects and instruments, but that always comes from an anthropological dimension, not from an instrumental dimension. However, it is important to note that some tools are designed to be addictive for users (just think of fidget spinners: objects harmless, but addictive)39. A comprehensive assessment of the impacts of introducing a technology to the market must take into account the aspect of dependence and the fear of dependence as a problem, reaffirming the purpose of technological tools and their risks.
5.3.6 Accountability
However, there is a further level of considerations to take into account in order to analyse the benefits of disruptive technologies - such as 5G ones are - in public administrations, public goods, public governance, public engagement, public-private partnerships, as well as public third sector partnerships. This relates to the availability of the institutions to demonstrate their political accountability while adopting disruptive technologies in public services. In fact, 5G technology challenges the political leadership and the ability of institutions to ensure public services that enforce the enjoyment of certain rights: human rights belonging to human beings independently from public interventions, socio-economic and cultural rights - that are a legal status whose activation depends quite completely on the positive actions of the institutions, specifically by providing public services. It is important to remark the primary role of transparency as a tool to enable accountability. If it is not known what an organisation is doing, it cannot be held accountable and cannot be regulated. Transparency may relate to the data, algorithms, goals, outcomes, compliance, influence and/or usage of automated decision-making systems (i.e. algorithmic systems), and will often require different levels of detail for the general public, regulatory staff, third-party forensic analysts and researchers. This lack of transparency risks undermining meaningful scrutiny and accountability, which is a significant concern when these systems are applied as part of decision-making processes that can have a considerable impact on people's human rights (e.g. critical safety decisions in autonomous vehicles; allocation of health and social service resources, etc.)40. Thus, the acceptance of technologies (including the ones coming from 5G-SOLUTIONS) disrupting the existing landscape of public services is fundamental for both public administration and citizens, as it may speed up or slow down consensus and trust in governments and decision makers.
39 Alessandro Baricco, “The Game”, Einaudi, Torino 2018. 40 European Parliamentary Research Service (EPRS) – “A governance framework for algorithmic accountability and transparency”, Brussels © European Union, 2019. doi: 10.2861/59990

D8.1A Market Assessment and Technology Monitoring (V1.0)
© 5G-SOLUTIONS, 2019 Page | 35
35
6. Market Analysis of 5G-Solutions Verticals 5G-SOLUTIONS aims to validate that 5G capabilities will provide prominent industry verticals with ubiquitous access to a wide range of forward-looking services with orders of magnitude of improvement over 4G, thus bringing the 5G vision closer to realisation. This will be achieved through conducting advanced field trials of innovative use cases, directly involving end-users across five significant industry vertical domains:
Factories of the Future
Smart Energy
Smart Cities
Smart Ports
Media & Entertainment This section of the deliverable examines each of the verticals to understand more about the market definition, the role that 5G is expected to play in the market, the current market dynamics and intersects the 5G use cases that the project will undertake. This vertical market assessment will be reviewed and updated during the lifetime of the project (with a final deliverable D8.1B) and will be further informed by an online Knowledgebase (see section 6 for more details) into which all consortium members will share industry knowledge as the project evolves. This vertical market knowledge will provide an important foundation for any potential future commercial solutions that may emerge after the completion of 5G-SOLUTIONS. (to be explored in M33 in D8.2 Business Development Plan).
6.1. Factories of the Future 6.1.1 General Market Overview
The factory-of-the-future is envisaged to be a “smart factory” that encompasses a broad set of technologies, solutions, and products. It connects people, processes, and machines in an industrial environment to enable advanced manufacturing. The smart factory will offer multiple benefits that help users to optimize processes, reduce errors, improve quality, and eliminate waste. The combination of technologies such as Artificial Intelligence (AI), Industrial Internet of Things (IIoT), cloud and edge computing, collaborative robotics, advanced product monitoring systems, process analytic technologies, predictive and assisted maintenance, and process automation techniques are rapidly impacting the way factories carry out their business and forcing a rethink of the entire process from sourcing to logistics. At the core of these technologies there is the mobile connectivity, built on low-latency, high throughput, high reliability, and massive device connectivity. Mobile connectivity is in fact the fundamental starting point to produce value out of the data and mark a shift in the digitalization of the factories and their economy. All industry sectors encompassing manufacturing, food production, pharmaceuticals, automotive, logistics, mining, etc, are opening the door to these disruptions as the potential business returns and the opportunity to gain a competitive edge are enormous. It also provides an excellent opportunity for new and innovative solution providers to emerge in a new ecosystem built around 5G (see Section 4 Section for an overview of the emerging business ecosystem). The overall market for 5G Services in the area of connected/smart factories is projected to reach over $13 billion by 202541 and a general analysis of the key market segments are provided in Figure 16
41 Market and Markets: “5G Services Market, forecast to 2025”

D8.1A Market Assessment and Technology Monitoring (V1.0)
© 5G-SOLUTIONS, 2019 Page | 36
36
Figure 16: 5G Services Market Size, Factories of the future
6.1.2 The Role of 5G
Safer, more flexible and more efficient manufacturing systems will become possible thanks to the ultra-low-latency and reliability of 5G connectivity. Connected sensors deployed throughout the entire production process will enable real time monitoring, data analytics, and coordination of machines thus increasing their automation, flexibility and productivity. Sophisticated data analytics will allow production systems to “self-correct” and make smart data-driven decisions based on data collected in real time. 5G will eliminate lag times between machine communications, and data connections between machines will be 10 to 100 times faster. This will allow machines to catch production glitches in real time, which could lead to big increases in productivity. 5G, as a key enabler for factories-of-the-future, will impact four broad categories of use cases with different requirements:
Process automation: monitoring and diagnostic functions; Production automation: control of manufacturing processes; Logistics: mobile service robots, autonomous transport, product identification, tracking and
localization of people and assets; Company IT: portable monitoring and control devices, augmented reality, integration of
production facilities in company IT infrastructure. Future communication solutions are expected to ensure connectivity between different globally distributed production sites and new actors in the value chain (e.g. suppliers, logistics) seamlessly, in real time and in a secure way.
6.1.3 Market drivers and early innovators
The EU had set a target in 2014 that European manufacturing would contribute 20% to GDP by 202042. However, in contrast with this ambition, global transitions, such as declining energy prices, diminishing
42 White Paper: 5G and the Factories of the Future. Available from: https://5g-ppp.eu/wp-
content/uploads/2014/02/5G-PPP-White-Paper-on-Factories-of-the-Future-Vertical-Sector.pdf

D8.1A Market Assessment and Technology Monitoring (V1.0)
© 5G-SOLUTIONS, 2019 Page | 37
37
resources, new competition from emerging markets and an aging workforce, have diminished its growth and have seen the share of industry in GDP terms decline in recent years43. In response to this decline, rejuvenation of the existing manufacturing sector is a key European agenda for encouraging industrial growth in an effective, efficient, and sustainable manner. The disruptive opportunities in this market that can be driven by 5G technologies will inevitably create many innovators and new types of solutions providers. Currently, the global market is dominated by large companies but during the 5G-SOLUTIONS project, a key focus will be to identify potential niche segments where solutions emerging from the project could be commercialized.
Figure 17: Competitive leadership Mapping
44
6.1.4 An overview of 5G-SOLUTIONS Use Cases
There are five user cases being explored in the context of the Factories-of-the-Future Living Lab as follows:
Use Case 1.1: Time-critical process optimisation inside digital factories
Use Case 1.2: Non-time-critical communication inside factories
Use Case 1.3: Remotely controlling digital factories
Use Case 1.4: Connected goods
Use Case 1.5: Rapid deployment, auto/re-configuration and testing of new robots
43 Future of Manufacturing in Europe. Frost and Sullivan, 2016. 44 Market and Markets, Smart Factory Market, Forecast to 2024
D8.1A Market Assessment and Technology Monitoring (V1.0)
© 5G-SOLUTIONS, 2019 Page | 38
38
6.1.4.1 Time-critical process optimization inside digital factories
This use case will explore the possibility of implementing an in-line product monitoring system and process analytic technologies to replace the current off-line product quality assessment approach. Quality assurance and quality control are two key aspects for the manufacturing industry. Each industry in its own sector wants to produce products that meet the needs and expectation of the customer. This has a direct impact on the industry’s business, increasing the loyalty of the customer, building the brand and maintaining the brand’s reputation, create the perception that the product has a better value for money ratio than competitors, and all these aspects help to make profitable business. The current approach of many manufacturing and consumer goods production facilities ensure quality of their products by adopting a closed control loop mechanism to control process parameters that impact the overall quality of the product. A common example of close feedback control loop is the basic Proportional-Integral-Derivative (PID) Controller. It is mainly used for continuous adaptable process control, measuring and applying corrections to specific process parameters to maintain them in a pre-set range. Such an approach is typically used for off-line quality assessment, where the product inspection happens separately from the production line. Off-line inspection requires a product to be removed from the production line to be inspected and evaluated. A statistically significant number of products to be inspected (samples) allows the Quality Assurance system to gather statistics about the overall production efficiency and the overall product quality, to estimate, out of these numbers, the impact on the business. Despite the low costs of implementing this approach and the possibility of inspecting the product in a comprehensive manner against the specifications, it doesn’t provide any direct feedback on the production process. The inspection provides statistical information about the products to decide if the product is acceptable or if it must be rejected. The product defect can be identified, but the late defect identification does not allow to provide a timely feedback to the process supervision. In case of massive production affected by several defects, the statistically significant number of samples can be high, increasing the scrap quantity. In-line quality assessment mechanisms integrate techniques to inspect each single product at the end or during the different production phases. Because it is in-line and automated, it ensures that every product (and/or every part composing it) is inspected. This requires less time than the off-line inspection methods. Data from the inspection scan be used to feedback the production process in real-time reducing waste and increasing the efficiency. Moreover, given that each single product is inspected, the data analysis to evaluate efficiency and business impact can be done without resorting to statistical methods based on observation of a limited number of samples. The implementation of in-line quality assessment mechanisms is, in general, more complex that the off-line method. Specific technologies are required not only to inspect the product, but also to transfer, validate and analyse the data coming from the inspection, as well as to fully automate the process. For those aspects, there is the necessity of adopting new technologies that are able to cope with the stringent requirements of the in-line quality assessment implementation. The data volume to be offloaded and analysed can easily overcome 10 Gbps, and the latency required in many cases is less than 5 ms. All of this accompanied with requirements for a high level of reliability and security. These requirements could of course be met using ad-hoc cable or optical fibre connections. However, wired connections provide several limitations from an implementation point of view: starting from the cost and the space usage, they are sometimes prohibited for safety reasons or for specific applications such as restricted access areas in the food and pharma industry. In such cases a wireless communication system is preferred. State of the art wireless communication systems often cannot support the high throughput, low latency and extreme reliability required in these applications. 5G will deliver those capabilities and remove a barrier to in-line and real-time monitoring adoption.

D8.1A Market Assessment and Technology Monitoring (V1.0)
© 5G-SOLUTIONS, 2019 Page | 39
39
6.1.4.2 Non-time-critical communication inside factories
This use case focuses on the use of a predictive maintenance in a food production plant. Historically there are 3 main maintenance modalities:
Reactive maintenance: This way of performing maintenance is the most primitive, in fact the
equipment is maintained only when it has already experienced a stoppage (due to a broken
down for instance). It is typically costly and not efficient as other methodologies.
Preventive maintenance: maintenance actions are performed regularly as a means of preventing
equipment failure or stoppages. The main driver of preventive maintenance are statistical
considerations about the forecasted lifetime of the asset, and many efforts are made to find the
minimum amount of services the equipment need to avoid or reduce at the minimum
downtimes.
Predictive maintenance: it is also called Condition-Based Maintenance (CBM) because the
services and interventions are based on the monitoring of the conditions and the performance
of the equipment. The aim is to identify the best time to maintain the equipment before it
experiences a stoppage and keeping the process at the maximum efficiency. The main
difference in regard to the preventive maintenance approach is the actual measurement of key
parameters representing the status of the equipment instead of theoretical and statistical
models on its expected lifetime.
It is evident that predictive maintenance offers significant benefits over the two predecessors, providing the basis for an optimal asset utilization. An optimal production plant efficiency can be reached combining the predictive maintenance method with product quality assessment techniques to produce an automated or assisted maintenance basis for the operator. With the ability of collecting digital data from multiple points about the condition of the asset (temperature, pressure, vibration, acoustic, ultrasonic, viscosity, chemical analysis and thermal imaging, for instance) and combining this data with other datasets such as quality information, resource plans, asset management, etc, analytics can be applied to the data to deliver predictive insights to optimise efficiency and minimise costs. This analysis can be performed faster thanks to the availability of powerful computing resources that can be requested remotely according to the need, avoiding over usage and unnecessary power consumption. In this particular use case, the 5G data collection infrastructure will be integrated with an existing environment producing a data fusion between more than 30,000 sensor data streams. A wired solution is not scalable enough, and there are areas in the production facility that cannot be reached with cables. Wireless sensors are the only way, highlighting once again the importance of disruptive communication systems that are capable of managing large volumes of sensors simultaneously.
6.1.4.3 Remotely controlling digital factories
While in both UC1.1 and UC1.2, local on-site communication is assumed within the plant, in the case of UC1.3, the public wireless access network also plays a role in the E2E communication between remote workers and the factory. The simplest setup of this use case involves remote control applications running on tablets or smart phones for example. However, in view of the trend of new AR devices, it is likely that new remote services may arise to facilitate the creation of virtual back office teams. Such remote teams may use the data coming from smart devices for preventive analytics and easy access to work instructions, whereby, e.g. they would be able to view the camera or iPad/Google Glass of a local worker. Additionally, the application of AR in the plant will facilitate:
D8.1A Market Assessment and Technology Monitoring (V1.0)
© 5G-SOLUTIONS, 2019 Page | 40
40
Augmented-reality support in production and assembly: Precisely positioned picture-in picture fade-ins, showing the operator the next step and helping to avoid misplacement and unnecessary scrap.
Augmented-reality support in maintenance and repair: Repair machines without training due to augmented information and operational guidance.
Cross-functional communication, effective knowledge sharing and collaborative design platforms will be facilitated by solutions for communities of practice. In this use case family, there is a less stringent need for low-latency. Interaction times up to seconds are acceptable for remote servicing machines. However, high availability is key for allowing (emergency) maintenance actions to occur immediately. Bandwidth is important for video-controlled maintenance, with real-time augmented content mixed into the video signal. Moreover, latency is particularly important for real-time, remote motion control of local robots. Edge computing within the network is required for fulfilling the low latency requirements. Security threats are introduced due to the opening up of the machines to allow remote reconfiguration. As such, the cyber-representation of a factory or supply chain needs to be protected, with mission-critical actions being shielded from non-authorised parties.
6.1.4.4 Connected Goods
The consolidation of physical goods will be of strategic importance to the manufacturing industry of the future. Product lifecycle data combined with personalised usage and context; data can be exploited by new business models in the manufacturing industry. Reinforcing this product-service relationship will become increasingly important in the production of connected goods and will see manufacturing plants evolve to a data-driven eco-system. Ultimately this will augment production-related data with usage-related data collected during their lifetime. This use case will assess the potential for 5G to enable full-duplex communication of appliances such as a washing machine in the home of the future. The solution will bill on an open source interoperable IoT building block standard to enable connection from different stakeholders in IoT generated data while developing the necessary security and privacy considerations. This technology will enable consumers to use and leverage IoT solutions in their home to interact with the 6.1.4.5supply of product and services. The vision of P&G is to build a level of interactivity similar to the on-demand solutions in TV content via content providers such as Netflix, but leveraging appliance data. This can cover NILM (non-intrusive load monitoring) or smart meter data from home appliances. It can also cover camera-based information (e.g. fridge, trash can etc.). Based on the broad NILM of other full home data, product supply can be optimized via an external provider. The multi-stakeholder IoT platform will enable smarter and combined delivery of the different product needs in the home. This will collaborate, in the future, with the needs for other uses cases such as car and networked energy. The focus of this specific Use Case is on providing a proof of concept for a washing machine.
6.1.4.6 Rapid Deployment, auto/re-configuration of new robots
UC1.5 focuses on the possibilities of utilising the core functionalities of 5G in order to lower expenses and reduce the time required to commission or reconfigure robots in manufacturing. The goal is to demonstrate how to achieve deployment of new robots into existing plants through automatic on-boarding of industry requirements. This encompasses auto-configuration of (mobile) robots and the corresponding 5G service configuration needed for interconnection / interworking across solutions from different vendors. The possible vendor lock-in caused by incompatibilities, use of different standards and different use of existing standards as well as the complexity resulting in extensive commissioning time and excessive man hours needed for the integration, are often seen as major obstacles for modern automation in various industries.

D8.1A Market Assessment and Technology Monitoring (V1.0)
© 5G-SOLUTIONS, 2019 Page | 41
41
6.2. Smart Energy
6.2.1 General Market Overview
The Smart Energy Living Lab (LL2) will trial a series of use cases that are influenced by current and emerging business requirements for industrial partners IREN (https://www.gruppoiren.it/) and ENEL (www.enelx.com)
UC 2.1: Industrial Demand Side Management
UC 2.2: Electrical Vehicle Smart Charging
UC 2.3: Electricity network frequency stability The following sections provide an economic and market assessment of the key drivers for the use cases that are being undertaken and throughout the project the solutions and findings emerging from the Use cases will be reviewed and aligned to general market developments and trends.
6.2.2 Industrial Demand Side Management
6.2.2.1 Definition of “Industrial Demand Side Management”
Energy demand management, also known as demand-side management (DSM) or demand-side response (DSR) is the modification of consumer demand for energy through various methods such as financial incentives and behavioural change through education. Industrial Demand Side Management is a set of services designed to efficiently manage this process, applying specific optimization actions to energy consumption in industrial sites, with the aim of cutting electrical energy supply costs. These optimization actions have the goal to achieve savings in electricity charges, using smart grid electricity consumption features such as overall consumption, time profile, pricing of power supply and other grid connection parameters. To minimize energy consumption and increase savings generated by DSM integrated with 5G communications infrastructure, the optimization actions must be carried out considering infrastructure constraints, industrial machine capacities and connectivity enablement of the industrial system to perform load control.
STRENGTHS ● Greater green impact ● Lower energy price and operation costs ● Higher grid reliability and energy flexibility ● Lesser backup power
OPPORTUNITIES
● Customer supply involvement ● Consumption control ● Ancillary market opportunities for prosumers ● Energy community participation
WEAKNESSES ● High investments in RES and flexibility assets and possible additional costs
● Frequent load changes

D8.1A Market Assessment and Technology Monitoring (V1.0)
© 5G-SOLUTIONS, 2019 Page | 42
42
● Possible lower quality of production processes
THREATS ● Optimization by energy storage ● Lower willingness of industry players to participate ● Acceptance by staff and community ● High complexity to calculate costs and revenues ● Possible customer privacy ● Resource and technology constraints
Table 3: SWOT Analysis for DSM
Strengths DSM generates green impact since renewable sources (e.g. photovoltaic, Eolic) are used more efficiently as energy sources for the overall market are predicated more efficiently and at the same time the average energy price to the consumer is lower. DSM brings advantages to electricity providers and the energy market (the supply side) with higher grid reliability and reduced operational costs. It reduces the need for expensive backup power. DSM makes the industrial system more flexible, balancing supply and demand during peak periods. Weaknesses DSM often requires rescheduling production bringing high investment and additional costs (e.g. costs for labour, extra start-up and shut-downs, lost equipment lifetime). These costs can reduce the quality of production process in order to maintain the price low. DSM’s frequent load changes is not applicable in specific production conditions, such as constant speed of production, 100% capacity, small buffers, no excess capacity in process sections, too much time required to reach a stable production after a stop, fixed price contracts for electricity. Opportunity Customers could be part of DMS supply chain, allowing the industrial operators to install a remotely controlled device that can switch on or off electrical equipment and allow them to receive economic compensation. Another opportunity is to allow the frequency network to control consumption, customizing energy on the demand shape. Threats Cost of DSM implementation is complex to calculate, because of uncertainty and extensibility of DSM and there are also resource and technological constraints (e.g. storage capacity, ICT systems to dynamically manage energy assets). The relevant gap between accepted and technical DSM potential and the fear to lose process efficiency means there is a low willingness of industry players to share DSM strategies. In addition, DSM is affected by acceptance by industrial operators (for job rescheduling) and the local community for environment impact and privacy, when consumers inform industrial company about their consumption.
6.2.2.2 Emerging applications
Among systems viable for DSM that can store energy, there are two promising technologies in the residential sector:

D8.1A Market Assessment and Technology Monitoring (V1.0)
© 5G-SOLUTIONS, 2019 Page | 43
43
Lithium-ion batteries – the International Renewable Energy Agency predicts costs under
$0.06/kWh/cycle by 2020 and a service life increased from 2000 to 6000 hours45.
Heat storage (also with phase-changing materials)
For larger scale markets, there is a broader range of technologies that becomes viable, including bulk ice storage, hydrogen fuel cells and large-scale lithium-ion batteries. Some examples of future DSM projects are:
energy storage at a large scale
smart inverters
Power 2X technologies
6.2.2.3 The role of 5G
The focus in use case 2.1 is on the optimal scheduling of industrial loads during normal plant operation, the computation and actuation of flexibilities offered on the Dispatching Market and the control actions needed to keep the peak power consumption limited. The first aspect covered by this use case is the planning and aggregation of loads. A distributed monitoring and load shifting control system (based on sensors, meters and in-cloud data analytics and control tools), will be setup to perform a real-time schedule of loads and assess the actual energy behaviour of each activity/production, with the aim of evaluating possible actions of power reduction to be offered on the Dispatching Markets, where the operator of the electricity transmission network buys the balancing power needed to operate the network; this action may be performed by the customer as a single actor of the market, if the power reduction constraints set by the Regulator are met, or in aggregated form with other prosumers (by means of an Aggregator). 5G technology is expected to play an important role, as both data communication from the field to the cloud and communications among the Aggregator and involved customers must be reliable, fast and with minimal delay (latency). The second aspect concerns the peak power consumption, which represents one of the critical parameters for this class of customer segment. The simultaneous use of electrical devices may involve peak loads that can result in the tripping of commercial meters due to overload detection. With the introduction of new tariff schemes accounting for the peak power consumption in addition to the energy component (e.g., maximum demand) and the presence of fluctuating unpredictable Renewable Energy Sources (RES), the problem of keeping the peak power limited is quite important: it appears crucial to rely on a technological solution to promptly switch off the loads responsible for the peak/overload and, therefore, to reschedule the load in a more efficient way. In this sense, 5G technology plays a crucial role: a post-commercial meter could be used to detect the power peak/overload and to generate an alert, which will be transferred to a pre-selected set of control devices that will reduce the power consumption and trigger the computation of a new load schedule as a recovery action. Hence, the objective of this use case is to demonstrate in the field that 5G technology can be effectively used for offering new grid services and drastically reduce the tolerance implemented on the meters before disconnection, without having an impact on the customer perception and quality of service.
45 https://www.forbes.com/sites/dominicdudley/2018/01/13/renewable-energy-cost-effective-fossil-fuels-2020/#e4fded24ff2e

D8.1A Market Assessment and Technology Monitoring (V1.0)
© 5G-SOLUTIONS, 2019 Page | 44
44
6.2.2.4 Trend/market analysis
The growth in DSM market is projected to be driven by global utilities and energy markets efforts in reaching their energy efficiency and it is expected in all regions, with deeper savings in new and mature markets. Driving the increase in industrial DSM markets is the growing energy efficiency measures, the new distributed energy resource technologies and the changing customer expectations. Moreover, national regulatory authorities and regional boards are expected to implement policies which will support the growth of the integrated DSM market. The global energy demand-side management market and new business models will generate up to $1.2 Billion in spending through 202546 and is likely to create many new opportunities for innovative and emerging solutions. During the 5G-SOLUTIONS project, specific attention will focus on the opportunities that could emerge from each Living Lab that would have commercial viability beyond the end of the project.
6.2.2.5 PESTLE Analysis
P Political
E Economical
S Social
T Technological
L Legal
E Environmental
International
Agreements
Geopolitical
issues
World
political
issues
Project
Capital costs
Investor trust
in
Government
Commodity
markets
Behavioural
change
Public perception
Democratization
of the process
Rate of innovation
versus
implementation
Energy Supply
Chain
Pre/post
operational
governance
Cumulative
environmental
factors
Political
International Agreements: International agreements (e.g. EU legislation) influence and shape
the energy system also. Agreements take long periods of time to draft, build consensus and
finally agree upon.
Geopolitical Issues: Geopolitical instability may be a risk to the security of energy supply causing
price volatility (leading to higher generation costs), disruption of supply chains or degradation of
international relationships.
World political issues: Political disagreement (e.g. Brexit) may be a risk for cross-border
projects. Political dispute may also disrupt energy delivery from neighbouring.
Economical
Project capital costs: The infrastructure and project costs are substantial depending on the level
of DSM related infrastructure to be implemented.
Investor trust in Government: The costs and risks of the investment in new energy
infrastructure requires trust between Government and investors to ensure a return on
investment (e.g. revenue guarantees, risk underwriting) and to avoid a shift towards other
favourable markets.
46 Navigant Research: Energy Efficiency and Demand Response Market Analysis and Forecasts: 2019-2028
D8.1A Market Assessment and Technology Monitoring (V1.0)
© 5G-SOLUTIONS, 2019 Page | 45
45
Commodity markets: Volatility in the commodity markets plays a key role in influencing
industrial system development.
Social
Behavioural change: People who use energy will have an impact on the future energy system
and changing people’s behaviour, regarding energy usage, may limit flexibility in addressing
peak energy demand.
Public perception: The public’s perception about different energy options plays an important
role in the development of future energy systems and it may pose considerable barriers to
development, particularly if the issues in question are sensitive.
Democratization of the process: Democratization may delay project completion and increasing
cost, but it may also lead to better planning and/or environmental protection. Transparency of
process is required to increase the potential of stakeholder support for new developments.
Technological
Rate of innovation vs implementation: Innovation of energy generation technology is needed
to achieve improvements in the energy system that will drive down costs, but it takes time and
there are risks.
Energy supply chain: New energy systems require complex and expensive supply chains.
Legal
Pre/post operational governance: The evolution of the energy system may lead to
implementation of new technologies and problems about the governance of development,
operation, decommissioning, liability and asset ownership.
Environmental
Cumulative environmental factors: Some environmental impacts may be serious risk to the
system and moreover it is difficult to understand environmental impacts of new technologies
because of lack of data.
Accidents and climactic events: Accidents and climatic are often characterised by high
consequence events. For future industrial systems the risks cannot be underestimated.
6.2.3 Electric Vehicle Smart Charging
6.2.3.1 Definition of “Electric Vehicle Smart Charging”
Smart charging is a form of EV battery charging based on intelligent control of rate and time of charging (and discharging through V2G/V2H) , that in some cases can use learning algorithms based on big data and artificial intelligence; smart charging is expected to be widely used in future for electric vehicles. It optimizes the electric charging infrastructure by creating and distributing the available power in an efficient, adaptive and flexible way, especially in complex systems like smart grids and dispatching market DR activities, or when the charging cycle can be altered by external events.

D8.1A Market Assessment and Technology Monitoring (V1.0)
© 5G-SOLUTIONS, 2019 Page | 46
46
Smart charging for electric vehicles (EVs) holds the key to unleash synergies between the clean transport sector and low-carbon electricity. It minimizes the load impact from EVs and unlocks the flexibility to use more solar and wind power. In this use case smart charging means adapting the charging cycle of electric vehicles to both the conditions of the power system and the needs of electric vehicle users.
6.2.3.2 SWOT Analysis for EV Smart Charging:
STRENGTHS ● Reduces the impact on the electric infrastructure of electric vehicle diffusion
● Lowers grid infrastructure investments by better use of existing resources
● Potentially more economic recharge ● Minimize peak demand and improve network congestion control ● Better use of smart grid resources
OPPORTUNITIES
● Better customer experience (customer preferences taken into consideration)
● Optimise charging tariffs based on user preferences/behaviour ● Cleaner energy by increased use of low carbon sources and renewable
sources integration ● Off-peak incentives
WEAKNESSES ● Vulnerability to hacking of smart charging points ● Higher infrastructure and maintenance costs
THREATS
● Missing balance between service and retail ● Lack (or absence) of communication broadband availability ● Lack of smart charging points ● Absence of specific regulation, coordination and standardization
Table 4: SWOT Analysis for Electric Vehicle Smart Charging
Strengths Smart Charging avoids unnecessary costs such as grid/market infrastructure overcapacity fees and optimizes how energy is distributed for electric car charging thanks to dynamic load balancing between electric car charging stations and other electrical loads in the network. It ensures a most efficient and effective recharge of electrical vehicle, saving customers from any extraordinary costs (e.g. grid updates). Smart charging can lower the load pressure and consequently enable a more efficient integration of EVs in the power system as well as renewable power, generating higher network congestion control.

D8.1A Market Assessment and Technology Monitoring (V1.0)
© 5G-SOLUTIONS, 2019 Page | 47
47
Figure 18: Energy Reduction strategies according to Ares2t Charge Advisor strategies
Weaknesses Smart charging stations for electric cars are vulnerable to hacking and the costs to extend and maintain infrastructure and to control and manage the overall system remains high although the infrastructure is reduced over time. Opportunity With smart charging consumers are part of a smarter and more flexible system, during off-peak periods when electricity demand is low, consumers can benefit from cheaper electricity and avoid triggering unnecessary network reinforcement. Smart charging can also shift electrical flow to periods where there is plentiful clean, renewable electricity generation. The off-peak incentives, but most importantly the possibility to offer flexibility in the ancillary markets are another opportunity for owners of electric vehicles in terms of balancing the demand and for customers to take advantage of discounts. Threats Smart charging needs a strict coordination between EV users and electricity market in order to provide e-mobility requirements and power system with the necessary flexibility, but competitive wholesale and retail markets are often missing today, even in the emerging e-mobility markets. In countries where wholesale electricity markets exist, competitive balancing / ancillary service markets and retail markets are often missing.
6.2.3.3 Emerging applications
According to International Energy Agency (IEA) analysis (2018), different level of Controlled Charging can be applied:
Level 0 – Grid-compliant charging: EVs are connected to the grid for charging, but smart charging is
not applied.
Level 1 – Controlled charging: charging power and timing of charging can be shifted remotely.
Level 2 – Aggregated controlled charging: the charging profile is negotiated based on various drivers,
and responses are controlled and bundled by aggregators without direct individual user interaction.

D8.1A Market Assessment and Technology Monitoring (V1.0)
© 5G-SOLUTIONS, 2019 Page | 48
48
Level 3 – Bidirectional charging: EVs can also feed electricity back to the grid and home, allowing the
use of EVs as a distributed electricity storage mechanism and enhances the attractiveness for EVs as
a frequency response measure.
Level 4 – Aggregated bidirectional charging: flexibility capacities of EVs are managed by aggregators
to be able to compete in the flexibility market with larger capacities.
As an enabler for new business models the adoption of Smart Charging can be effectively applied in future applications like:
Dynamic pricing to vehicle charging, based on demand – offer negotiation with time – based and
event – based models.
Vehicle-to-grid (also named V2G) to support other DSM services as frequency regulation (see Use
Case 3 - “Electricity network frequency stability”) or power regulation.
6.2.3.4 The role of 5G
Smart charging is a form of DSM where the selection of the charging station used for recharging a PEV and the power absorbed during the recharging process are under the control of a charging point operator, according to a set of grid/energy market boundary conditions and drivers’ charging preferences. Moreover, the driver experience may involve a variety of interactions between the driver and the charging infrastructure through apps and the charging station dashboard, depending on the charging point operational policies and business models. A new paradigm in mobility is also emerging as all smart mobility solutions imply a strong interaction of EVs and electricity systems, posing new challenges and opportunities in the way the next generation networks will be operated. In this regard, the 5G network can be used for allowing a reliable real time scheduling of charging sessions and provide a fast reschedule in case of overload, in case a contractual threshold is overcome due to an excessive number of simultaneous charging sessions, or in case the electric power generated from renewables suddenly falls short of the predictions.
6.2.3.5 Trend/market analysis
Smart Charging is expected to grow very fast in the next 10 years since the need for this kind of DSM service is directly linked to the growth of electric vehicles and Smart Charging Points in major markets. The Electric Mobility market trend is at the edge of a tipping point counting, according to Germany’s Center for Solar Energy a global electric car stock circulating worldwide of 5.6 million vehicles47, at the beginning of 2019, and a 2 million48 growth in 2018 (+40% in stock vs 201749). In the next 10 years electric vehicles growth will be impacted by various factors and the estimate in 203050 ranges between 23-46 million51 increased car sales and circulating stock between 130-250 million vehicles. Growth in EV deployment is expected to reach 1,16 billion in 205052. The above trend will determine a faster deployment of charging infrastructure. In fact, to charge electric vehicles it is estimated that in 2018 5.2 million light-duty vehicle chargers were installed, with an increase of 44% from the year before; 540,000 of these charging points were publicly accessible21 (about
47
Germany’s Centre for Solar Energy and Hydrogen Research (ZSW). 48
Global EV Outlook 2019, International Energy Agency 49
Ares2t estimate based on various internet data 50
This estimate does not include light and extra light vehicles. 51
Based on analysis of GTM Research, IRENA (2019) and Global Electric Outlook 2019. 52
IRENA (2019), Innovation landscape brief: Electric-vehicle smart charging, International Renewable Energy Agency, Abu Dhabi.

D8.1A Market Assessment and Technology Monitoring (V1.0)
© 5G-SOLUTIONS, 2019 Page | 49
49
10%). The deployment of fast chargers25 raised to about 300,000 (6% of total installations). Most of the increase of light charges was in private charging points, accounting for more than 90% of the 1.6 million installations last year53.
Figure 19: EV charging type summary
Global market: The general electric mobility trend with EV penetration and large diffusion of charging points with uncoordinated charging, poses a challenge for electric power systems when demand coincides with peak periods which could translate to the need for additional generation capacity. Clustering effects can also lead to local overloading of distribution networks, resulting in the need to upgrade the distribution network. The market for Smart Charging is strongly linked to Smart Charging Points (SCPs), whose adoption, considering both households charging wall-box (which are the majority) and public and private charging stations, is still very low as of November 2019. On the other hand, all new charging stations already have “Smart” capabilities so a higher availability of smart charging features (e.g. V2G allowing two-way energy flow) on the shared charging infrastructure will be deployed very fast in the next 3-5 years. Slow chargers will account for more than 60% of the total electricity consumed to charge electric vehicles and this scenario is relevant for smart charging since these types of charges are beneficial to the electricity system thanks to the opportunity to provide flexible DSM services including smart charging to optimize electricity demand and electric network usage. We estimate that in 2030 almost all charging points of the 130-240 million54 available will be smart, enabling access to a range of solutions for power systems through the provision of demand-side response (DSR) services like smart charging. In fact, smart charging adoption will enable:
controlling charging behaviours and patterns, minimizing impact on load profile of power
systems
managing precise response to control signals to shift charging demand across time periods
manage complex power systems including renewables and batteries.
European market: Europe is expected to be the second market worldwide with an estimated installed base of smart charging points between 19-30 million and 14% of global market share in 2030.
53
Global EV Outlook 2019, International Energy Agency 54
Estimates based on 0.9 private chargers per EV and 0.1 publicly accessible chargers per EV.

D8.1A Market Assessment and Technology Monitoring (V1.0)
© 5G-SOLUTIONS, 2019 Page | 50
50
Other markets: China remains the world’s leader in electric mobility with an estimated 28% share corresponding to 38-60 million smart chargers installed. US is expected to be the third market worldwide with an estimated installed base of smart charging points between 17-27 million and 12% of global market share in 2030.
6.2.3.6 Manufacturer/competitor analysis
The smart charging technology provider landscape is quite competitive and innovative, even if the players that have reached a good level of service are still few with no clear market leader in providing smart charging services. The competitive landscape is expected to change very rapidly and significantly in the next 3-5 years since the adoption of DSM linked to mobility will be considered more and more strategic. In Europe Enel-X has a market leadership having started to adopt the smart charging paradigm since 2015, also thanks to a partnership with Ares2t, which has been strengthened also by the acquisition of Motorwerks in October 2017. Additionally, Ares2t has been recognised55 among the Italian leaders of charging infrastructure and as the only provider of advanced smart charging services.
Company Country Technology Smart Charging Features
Ares2t Italy Cloud based
Charging speed adapts automatically to grid load constraints, user preferences and cost optimization. The charging platform can maximise the fit between planned and effective distribution at load area. Mobile to charging station smart charging integration is supported.
Green Flux
Netherlands Cloud based
Charging speed adapts itself to the amount of available capacity on the grid to make optimal use of the grid capacity and prevent overload56. Mobile to charging station integration is supported.
Enel XL Italy Cloud based
Enel X’s JuiceNet is a patented communication, control and intelligence platform that dynamically matches drivers’ historical charging patterns, real-time input, and signals from grid operators and energy companies to aggregate and manage charging station demand. Employing open APIs, JuiceNet can control any connected EVSE and coordinates periodic, minor changes in charge rate and timing, which the driver can override at any time. JuiceNet is employed by leading EVSE manufacturers, vehicle OEMs and other partners for the control of shiftable electric loads
Etrel Slovenia Cloud based
Optimizes the cost of charging for “charge at home” charging boxes.
Table 5 : EU Early adopters in Smart Charging
55
Source: “E-MOBILITY STUDY ITALY Opportunities and barriers for Dutch entrepreneurs in the Italian E-Mobility sector” - Rome, 3 June 2019 - Commissioned by the Embassy of the Netherlands in Rome and the Consulate General in Milan, Sustainable Development Foundation. 56
Green Flux website as of Nov 10th
2019 (https://www.greenflux.com/ev-smart-charging/).

D8.1A Market Assessment and Technology Monitoring (V1.0)
© 5G-SOLUTIONS, 2019 Page | 51
51
6.2.3.7 PESTLE Analysis
P Political
E Economical
S Social
T Technological
L Legal
E Environmental
Support
transition to
FEV diffusion
EU/National
Regulations
Reduction of
cost of
charging
Reduction of
capital cost
of EV’s
EV uptake
EV ownership
trends –
sharing v’s
Private
Smart
Charging
Points
IoT and MEC
technologies
Renewable
sources
Big data & AI
Cyber-
security risks
for SCPs
Grid stability
performances
Consumer
Protection
Laws
Improve
efficiency of
usage PHV
Increase
penetration
of renewal
resources
Political
Support transition to FEV diffusion: the transition to FEVs (Full Electric Vehicles) is strongly
supported by the EU with investment programs (Clean Vehicles Directive, Alternative Fuels
Infrastructure Directive- and Energy Performance Building Directive57) incentives to electric
vehicle diffusion and creation of interoperability standards (e.g. OCPP) enabling EV charging
roaming between different CPOs; many countries (i.e. Germany, Netherlands, Denmark, Norway
etc.) already have a large and developed infrastructure in place in many cases roaming ready.
Some governments e.g. UK strongly support the smart charging application, since both the
consumers and the electricity system can benefit from this service.
Economical
Reduction of cost of charging: the cost of charging can be optimized based on user acceptance
to receive a “best effort” service having the scope to optimize energy provisioning to FEVs
according to electricity grid constraints.
Social
Charging process safety: the safety and the protection of consumers is a top priority for all EU
Governments involved in the electromobility transition.
Technological
Smart Charging Points: to enable a full range of benefits, charge points need to be smart in the
sense that they must be able to send and receive information to manage the rate of charging
dynamically ('load control signals'). All new charging points are connected by design and the
charging technology is improving very fast. In 5 years we’ve had a transition from 22 kW
charging points (allowing to charge a city vehicle in 1.0 – 1.5 hours) to Fast Charging Stations of
50 kW58 able to charge a city vehicle in 30-40 minutes. In 2019, field experimentation started of
57
The Energy Performance Buildings Directive sets minimum requirements for charging infrastructure in new and renovated buildings 58
See EVA+ infrastructure of 200 50kW Charging Points distributed between Italy (180) and Austria (20)

D8.1A Market Assessment and Technology Monitoring (V1.0)
© 5G-SOLUTIONS, 2019 Page | 52
52
the Ultrafast infrastructure with Charging Stations between 350-400 kW and the ability to
charge a vehicle in less than 10 minutes.
IoT and MEC technologies: use of sensors inside the station and a highly resilient connection to
MEC capabilities of 5G will enable real-time resource coordination to respond to vehicle
electricity demand.
Renewable sources supported by energy storage: renewable allows a more efficient use of the
energy, supporting electricity production during peaks, especially when the renewable source is
connected to an energy storage system.
Big data & AI: use of Big Data and Artificial Intelligence will allow to better forecast energy
demand by electric vehicles and to more efficiently manage the charging process on specific
vehicle features.
Legal
Cybersecurity: actually, represents a vulnerability since installed charging stations are poorly
protected by hacking attacks; in fact there is a potential risk that the 5G connection could be
used to hack, via the charging station software, the vehicle’s system, or to perpetrate frauds
both on the payment system or the energy consumption.
Grid stability performances: the use of the charging infrastructure by multiple vehicles that
simultaneously start and stop vehicle charging processes can generate spikes and drops of
electricity that can be leveraged by the application of the smart charging.
Environmental
Improve efficiency of usage PHV: smart charging systems allow a better and more efficient use
of renewable energy when the charging station is directly connected to the photovoltaic
generator.
6.2.4 Electricity network frequency stability
6.2.4.1 Definition of “Electricity network frequency stability”
Electricity network frequency stability refers to the capacity of the power supply system to maintain steady state frequency on the overall electricity network, following a severe system malfunction, with a consequent significant imbalance between generation and load. It restores the equilibrium between system generation and load demand with minimum loss of loads, providing the electricity services needed to maintain the electricity network frequency at its rated value (e.g., 50 Hz in Europe). Frequency stability can be considered a “power storage” application of electricity storage.
STRENGTHS
● Higher flexibility and reactivity ● Higher distributed reserve power
OPPORTUNITIES ● Providing ancillary services at best costs ● Source of income for EV users; alleviating battery ownership risk
WEAKNESSES
● Power deficiency ● Battery Degradation ● Relatively larger number of EV’s required to account for reserve

D8.1A Market Assessment and Technology Monitoring (V1.0)
© 5G-SOLUTIONS, 2019 Page | 53
53
power
THREATS ● Poor coordination
Table 6: SWOT Analysis for Electricity Network Frequency stability
Strengths Electricity supply is matched exactly to demand, thanks to flexible generators (e.g. gas-powered turbine) that increase or decrease electricity generation. Reactive power allows to maintain power flows and a stable system, bringing safety and efficiency to electricity grid. The system inertia can be seen as an added value because it is expressed in terms of effective stored energy, taking the form of a reserve power on the whole system to smooth out sudden changes and fill any gaps in system frequency across the network. Weaknesses The electricity network frequency (in)stability may cause an electrical power deficiency if the gaps are overestimated and the frequency flexibility can lead to damaged generators because of frequent switching. Opportunity The frequency stability brings to ancillary services (e.g. scheduling and dispatch, reactive power and voltage control, loss compensation, system protection) at best costs. This has a positive effect on the consumer spending. Threats Poor coordination of operation control, protection devices and weakness of equipment response could be threats of this use case.
6.2.4.2 The role of 5G
This use case deals with the involvement of active demand in the provisioning of the electricity services needed to maintain the electricity network frequency at its rated value (e.g., 50 Hz in Europe). Basically, the network frequency depends on the difference between the demand and supply. It remains constant so long as this difference is zero. Any imbalance between the demand and supply sides results in a deviation from the nominal network frequency, which is typically resolved by the Transmission System Operator (TSO) by asking the generators to provide or release the power needed to clear the imbalance (balancing service). The Dispatching Market, namely the market where the TSO buys this service from legacy generators, has been recently opened to active demand, and Plugin Electric Vehicles (PEVs) aggregates appears the most promising form of active demand to this purpose. Since network frequency instability can occur within seconds or less, a fundamental requirement to enable PEVs smart charging to frequency regulation functions is the availability of highly reliable and low latency communications allowing a fast and coordinated action of distributed PEVs aggregates. Keeping in mind that the current smart meters installed in the charging stations take measurements every minute, and that the measurements do not include network frequency, in the absence of a highly performing communication infrastructure, each charging station should react alone and be equipped with a new, potentially expensive, frequency meter. Hence, the deployment of 5G communications in charging stations could dramatically decrease the number of frequency meters needed to provide the balancing service, and consequently the related total cost of ownership. The smart charging system involved in UC 2.2 can be extended to create the superposition of two control signals working on

D8.1A Market Assessment and Technology Monitoring (V1.0)
© 5G-SOLUTIONS, 2019 Page | 54
54
different time scales: a slow control signal, computed according to the requirements of UC 2.2 under the assumption of nominal network frequency, and a fast control signal, computed by a new controller installed in the charging stations, driven via 5G by the real time measurements of network frequency so as to enable primary frequency regulation.
6.2.4.3 Trend/market analysis
Since Frequency regulation as DSM is highly impacted by the penetration of electric vehicles and a vast deployment of the charging infrastructure in the same way as Smart Charging, the Trend and Market analysis refers to paragraph 6.2.2 “Trend/market analysis”.
6.2.4.4 Early Adopters
In the frequency regulation front, Enel X is currently engaged in several projects, encompassing a range of V2G capabilities: GridMotion59 and Parker60.
6.2.4.5 PESTLE Analysis
P Political
E Economical
S Social
T Technological
L Legal
E Environmental
EU
Regulations
Economic
misalignment
Internal/external
resources
People
involvement
Tailored
Workforce
training
programme
Investment in
research and
development
Improved quality
of life
Incentives
Laws to
reduce
pollution
Support for
renewable energy
Political The European Union Regulations has forced industries to use more pollution control systems and to produce more fuel effective and low emission vehicles. Economical There is a substantial misalignment in economic conditions: in case of favourable conditions and low taxes the sales of electric vehicles are superior. The resource availability is important aspect of economy because it prevents expensive import. Social Nowadays, people are aware of the environment and being eco-friendly. The electricity market influenced social and cultural aspects, in fact there will be a greater people involvement in green value. Technological The most innovative company are dominating the market, so a lot of investments in research and development are expected to improve the quality of life. For example, electric motors are quieter and less polluting than combustion ones, which allows "noiseless" travel. Legal Laws influence the system, limiting pollution rates with restrictive environmental taxes and leading to rigorous emission control tests.
59 https://www.enel.com/media/press/d/2017/05/gridmotion-project-reducing-electric-vehicle-usage-cost-thanks-to-smart-charging-process 60 https://parker-project.com/danish-project-defines-the-electric-vehicle-of-the-future/

D8.1A Market Assessment and Technology Monitoring (V1.0)
© 5G-SOLUTIONS, 2019 Page | 55
55
Environmental Environmental factors significantly affect the system: production of low emission cars, generation of renewable energy, extraction of any resources, its delivery to the power plant, conversion to electricity, and electricity transport has become an economical and efficient process.
6.3. Smart Cities & Ports
Smart Cities are aimed for sustainable economic development and higher quality of life by using ICT in multiple areas such as mobility, healthcare, living, government and economy. Adoption of smart cities solutions, rapid urbanization, and demand for better quality of life are the key factors that drive the growth of the global smart cities market. The main purpose of the smart cities mission is to drive economic growth and to improve the quality of life of individuals by empowering local area development and harnessing technology, particularly the technology which leads to smart outcomes. The market is expected to grow from $308 Billion in 2018 to $717.2 Billion in 202361 and grow at a CAGR of 18.4%.
6.3.1 Intelligent street lighting
Intelligent street lighting has the potential to be the backbone for the development of smart cities in the future. Thus, the market is expected to grow significantly in the next decade. The goal of connecting many kinds of sensors in one area requires a network that can transfer the massive amounts of data that will be created. For this reason, 5G technology is essential for successfully connecting the street lighting of cities in the future and to deliver the maximum benefits both socially and economically.
61 https://www.marketsandmarkets.com/Market-Reports/smart-cities-market-542.html?gclid=Cj0KCQiA_rfvBRCPARIsANlV66P-n_oVJpw29NbK-ugIwgL1lInnjDrTlhUYJuJqj_fIZNKvV3hFo8AaAve-EALw_wcB

D8.1A Market Assessment and Technology Monitoring (V1.0)
© 5G-SOLUTIONS, 2019 Page | 56
56
Figure 20: Benefits of Smart Lighting in Street Lighting
6.3.1.1 SWOT Analysis
Strengths Establishing an intelligent street lighting infrastructure can have various benefits such as reduced energy consumption and maintenance expenses when compared to conventional street lighting solutions. Specifically, maintenance costs will be minimized by real-time notifications that report the cause for the failure of any streetlamp directly to the responsible officials. This will simultaneously improve the safety of road users. Further, employing LED lamps will reduce the carbon footprint due to more energy-efficiency and less heat production. The option to dim lights depending on the sun intensity during the day will additionally improve the energy consumption of the street lighting. Another huge benefit of smart street lighting is that it can be self-powered by renewable energy sources such as power or wind and even send back excess power into the utility to make the grid more resilient. Weaknesses While the smart lighting technology is proven to produce savings over the long-term horizon, these savings are a result of large upfront investments into the necessary infrastructure. Thus, the investment might not make sense from a solely financial viewpoint. Another weakness of the smart street lighting innovation is the lack of universal open standards for aiding communication between all IoT devices. Opportunities Currently, a clear trend towards deploying LED lamps in streetlights can be observed all over the world. The benefits range from lower energy consumption and longer lifetime to improved light quality and recyclability of the lamps. Even though only a few cities have reached the
D8.1A Market Assessment and Technology Monitoring (V1.0)
© 5G-SOLUTIONS, 2019 Page | 57
57
actual implementation stage of their intelligent street lighting projects, many innovative services and features can be anticipated for the future:
Digital signage (parking spots, street signs, public notes, ads) Public/private Wi-Fi hotspots Noise detection (and safety response) Motion detection (data for city planning) Air quality monitoring Audio features (music, announcements)
All these services and features would offer significant benefits to the street lighting operators as well as inhabitants of any area. It is important to note that the smart street lighting infrastructure is believed to act as a central point of technology that will enable all the other IoT solutions in urban areas. Services and features related to public safety, traffic management, smart parking, electric vehicle (EV) charging or environmental monitoring would all require the network of connected infrastructure that the smart lamps would offer with their 5G network. The main reasons for that are their access to the energy grid and their secure and central location in urban areas. Thus, intelligent street lighting projects are viewed as the first step towards building truly smart and connected cities. Threats The main threat to the commercial success of smart lighting technology is the lack of knowledge of responsible officials. They do not realize the strategic importance of such infrastructure investments and thus only make their decision based on the high financial investments. Further, as some of the street lighting infrastructure is owned by private utilities, there might be a risk associated with making the whole IoT infrastructure of cities dependent on these companies.
6.3.1.2 Trend/market analysis
The market for smart street lighting is anticipated to grow significantly over the next years. This development is mainly caused by the city authorities’ and utilities perception that smart street lighting is the first step towards creating smart cities. In the following, the regional differences related to current adoption of the technology will be summarized. Global market: The rapidly growing market for smart street lighting is expected to reach 40 billion US Dollars in size by 2022. Numerous cities are starting to roll out implementation plans, which is mainly driven by the increased awareness of energy efficiency and the resulting government investments. The already discussed trend towards deploying LED lamps and the modernization of city infrastructures overall further supports this growing demand. To illustrate this, by 2027, around 90 percent of the world’s 363 million street lights will be converted into LED. While this process makes the installation of smart lighting technology very convenient, only around 30 percent of these street lights will actually be connected. European market: European cities aim to install 10 million connected street lights by 2025. This would imply a two-fold growth rate over the next years for the region that results in a global market share of over 30 percent in 2024. A main funding instrument for this is the ‘European Innovation
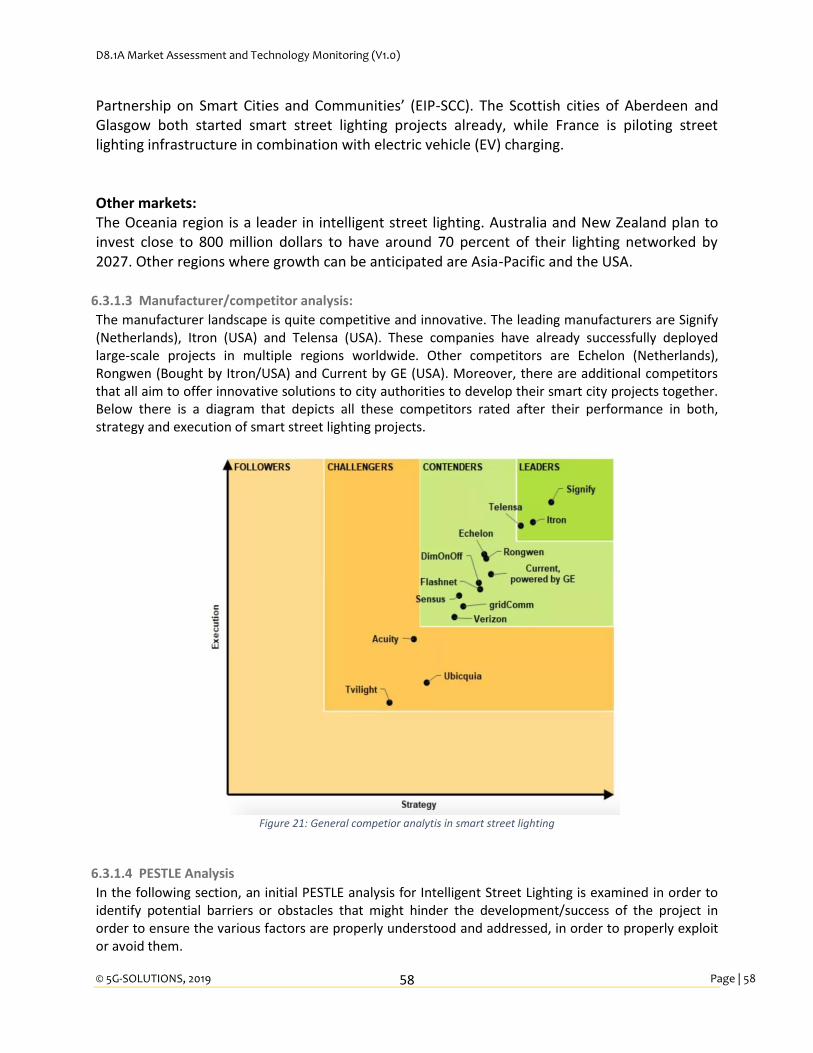
D8.1A Market Assessment and Technology Monitoring (V1.0)
© 5G-SOLUTIONS, 2019 Page | 58
58
Partnership on Smart Cities and Communities’ (EIP-SCC). The Scottish cities of Aberdeen and Glasgow both started smart street lighting projects already, while France is piloting street lighting infrastructure in combination with electric vehicle (EV) charging. Other markets: The Oceania region is a leader in intelligent street lighting. Australia and New Zealand plan to invest close to 800 million dollars to have around 70 percent of their lighting networked by 2027. Other regions where growth can be anticipated are Asia-Pacific and the USA.
6.3.1.3 Manufacturer/competitor analysis:
The manufacturer landscape is quite competitive and innovative. The leading manufacturers are Signify (Netherlands), Itron (USA) and Telensa (USA). These companies have already successfully deployed large-scale projects in multiple regions worldwide. Other competitors are Echelon (Netherlands), Rongwen (Bought by Itron/USA) and Current by GE (USA). Moreover, there are additional competitors that all aim to offer innovative solutions to city authorities to develop their smart city projects together. Below there is a diagram that depicts all these competitors rated after their performance in both, strategy and execution of smart street lighting projects.
Figure 21: General competior analytis in smart street lighting
6.3.1.4 PESTLE Analysis
In the following section, an initial PESTLE analysis for Intelligent Street Lighting is examined in order to identify potential barriers or obstacles that might hinder the development/success of the project in order to ensure the various factors are properly understood and addressed, in order to properly exploit or avoid them.

D8.1A Market Assessment and Technology Monitoring (V1.0)
© 5G-SOLUTIONS, 2019 Page | 59
59
Political When it comes to the political aspects of Smart Street Lights the government is one of the most important stakeholders, since usually the government is responsible for building, maintaining and replacing street lights, either directly or indirectly (they give the contract to a private organization to do the task for them) and would have the final say in the project. It is an important first step to identify the different types of governmental stakeholders there are with respect to the project. The types of political stakeholders include:
Local Government Authorities: These are the local and municipal entities that govern a city,
town, district, etc.
Central Government Authorities: This include all of the federal or central governmental entities,
who are responsible for running the entire nation.
Electricity Providers: These include public entities that are responsible for providing electricity to
a city, town, district, etc.
Unions: These include any unions, including worker unions, trade unions, etc.
The different levels of political stakeholders involved with project means that there is potential for innovation. Economical The economic and logistical factors related to the project are
The type of equipment that needs to be installed including the type of sensors to install. The
major investment is in the initial installation of the street lights. With certain presumptions and
precautions, the return of the investment can be made within 10 years. For example, using more
efficient lights, like LEDs, can help in lowering the cost.
The transportation of said equipment to the location. The other major investment is the logistics
of transportation of the equipment to the location for installation. This cost varies differently for
different cities, countries, etc.
Replacement of old and outdated streetlights with the new street lights.
Maintenance and upgrades of the equipment. This is a long term and continuous investment in
the smart street light. This comes after they have been installed and working.
Social Smart Street Lights ensures equality since it is carried out in public spaces and is equally available to anyone, regardless of age, gender, race, ethnicity, etc. This also ensures an improvement in the quality of life of the people and the community in several ways. With the help of smart streetlights
Traffic Safety can be increased, and accidents can be reduced by better illumination
Citizen safety from theft and attacks can also be improved with better illumination
Reduction in light pollution, leading to better quality sleep and will beneficial for the birds and
animals that inhabit the cities.
Better energy efficiency will ensure that the lights are environmentally friendly.
Technological The technological factors of smart streetlights require the 5G network to be active 24x7 with minimal downtime and little-to-no latency during the services. Currently, some of the most common types of lights used are gaslights, high pressure mercury blubs, arc lamps, etc. which use more energy than LED lights. Furthermore, LED lights are digital whereas the rest are analogue. This implies that the analogue lights can only be programmed externally (turning on/off internally, controlling intensity, etc.). Where LED lights can be programmed to better suit the requirements of the

D8.1A Market Assessment and Technology Monitoring (V1.0)
© 5G-SOLUTIONS, 2019 Page | 60
60
community, therefore being more customizable than analogue lamps. Additionally, the current streetlights have no smart solutions and this project aims to upgrade them. Legal The legal factors regarding the project will vary from place-to-place, since different countries have different laws and regulation regarding streetlights. In the context of the European Union, the Green Public Procurement defines streetlights as a “fixed lighting installation intended to provide good visibility to users of outdoor public traffic areas during the hours of darkness to support traffic safety, traffic flow and public safety”. This is a particularly specific definition and excludes other types of public lights, such as tunnel lights, private car parking lights, stadium lights, etc, which have their own definitions and regulations. Additionally, different types of lights, such as high-pressure sodium lamps and metal halide lamps, both have different requirements based on the wattage of the light being used. Additionally, public safety and compliance with the local level laws are also important factors that should be properly addressed in order to ensure the short- and long-term success of the project. Because streetlights are placed for safety purposes, ensuring the streetlights work efficiently and do not break down, and fulfil the required criteria is top priority Environmental The main environmental concern regarding streetlights is light pollution. Light pollution is defined as the excess of artificial light that brightens the night sky, causing the disruption of the sleep-cycle of people and animals and hinders the observation of the night sky, and is a cause of concern in various big cities, which rely heavily on artificial lights to function properly. A perfect balance between lowering light pollution and efficiency is important to ensure the smart streetlights are environmentally friendly. Another factor related to environmental factor is the energy consumption of the smart streetlights. As previously stated, the energy consumption and efficiency of the new streetlights should be less than the conventional lights currently being used in order to have a positive impact on the environment. The last factor related to the environment is the smart streetlights’ impact on the air quality and greenhouse gas emission. Since smart streetlights use LED lights, which use electronic drivers, rather than electromagnetic drivers which can irritate anyone near the them, also ensuring that the greenhouse gas emission is as low as possible.
6.3.2 Smart parking
Smart parking’s primary objective is to spot the most convenient available parking spaces for drivers and lead the drivers there. Smart parking solutions aim to reduce congestion, emissions and improve traffic safety and simultaneously to allowing higher quality of life for the residents. A smart parking system can benefit not only the drivers and the operators but the city councils as well. Smart parking saves time and costs for the drivers, whereas municipalities are able to provide a more efficient traffic guidance increasing their profits while complying with relevant emissions requirements.
6.3.2.1 SWOT Analysis
Opportunities/strengths:
Smart parking brings many opportunities to different involved parties. While cities will save costs of enforcement-officers checking for wrong parking and boost their productivity, traffic will also be lowered dramatically. Lower traffic means less emissions and this is often a critical issue for cities. The EU-Commission has sued Germany, France, Hungary, Italy, Romania and the UK for not meeting air

D8.1A Market Assessment and Technology Monitoring (V1.0)
© 5G-SOLUTIONS, 2019 Page | 61
61
quality restrictions. This additionally forces the countries and cities even more to implement smart city features as smart parking62. Smart parking cannot only improve productivity but also has a direct effect on health of urban citizens. Another effect that is expected and which would lower emissions, is that drivers would avoid drivinging at peak times. Lower traffic also means drivers would spend less time searching for parking spots, which improves individual lives and productivity. Studies63 revealed that in some cities 30% of the traffic is caused by drivers looking for a place to park their vehicle. Guiding those drivers to free spots efficiently will also lead to more efficient slot usage as well as increased sales for parking providers.
Threats/weaknesses:
The main threats in this market are the high implementation costs paired with configurative and operational complexity. Detecting a free slot, matching it with a searching driver, keeping it available for the driver and then processing payments as well as monitoring the parking duration is a complex task. Furthermore, other barriers can be seen in form of data availability to predict free slots and relationships with governments/utilities providers who own parking spaces. Finally, there are already a few competitors in the smart parking market offering different solutions, as seen in the following competitor analysis.
6.3.2.2 Trend/market analysis
The smart parking market was estimated to amount to 5 $ billion in 2017 and is expected to grow by CAGR 11,2% to 11,5 $ billion by Allied Market Research64. When segmenting the market, it can be helpful do so by different measures.
By technology
o SmartApp o Ultrasonic o In-ground vehicle detection sensor o Others
By parking site
o On-street
o Off-street
By region
o North America
o Europe
o Asia
o ROW
In 2016 the SmartApp segment, which this market assessment will focus on, accounted for 34,14% of the market, resulting in a SmartApp market size of around 1,7 billion $ worldwide65.
62 https://ec.europa.eu/germany/news/20180517-luftverschmutzung-klage_de 63 http://www.parking-net.com/parking-industry-blog/get-my-parking/how-smart-parking-reduces-traffic 64 https://www.alliedmarketresearch.com/smart-parking-market

D8.1A Market Assessment and Technology Monitoring (V1.0)
© 5G-SOLUTIONS, 2019 Page | 62
62
The global demand for cars is constantly increasing and when looking at European countries, Luxembourg which is now the country with the second most passenger cars per capita has 617 vehicles per 1000 inhabitants in 201766. This is an increase of 110 cars since 2008 according to EU statistics and Luxembourg is not the only country with increasing cars per capita. This fact comes along with an increasing demand for smart parking services. In large cities at the forefront of technology like Shanghai, Hong Kong, Singapore and Barcelona 100% of the people surveyed already used smart parking services in their life67. Trends of the global Vehicle-to-Everything (V2X) market size predicts extraordinarily high growth rates. While in 2020 the market is valued at 38.2 $ Billion, it is estimated to reach 110.3 $ Billion in 202668. Finally, urbanization is an important trend to incorporate as especially in Asia most people will be living in urban areas requiring smart parking services to cope with the high number of vehicles on the street69.
6.3.2.3 Competitor Analysis
Payment only
Smartparking.de offers customers the ability to pay for parking tickets anywhere in Germany or
Austria cash less. The app makes it possible to pay in the app itself or via SMS/call. They have a
high coverage in Germany as they include other smart parking service providers on their
platform such as: EasyPark, ParkNow, Park and Joy, Yellowbrick, moBiLET, paybyphone.
EasyPark is a service available in Europe that guides drivers along routes which are likely to have
available parking slots. This is done through their Find & Park software which analyses the
digitized parking ecosystem of a city. EasyPark’s ultimate goal is to help cities reach parking
excellence in form of a macro-overview of the entire parking ecosystem.
Paybyphone enables customers to pay for parking tickets anywhere in Germany through the
app. The app does not guide drivers to available parking locations.
Hardware and Software
Swarco AG has several subsidiary companies all around traffic management and road safety.
Next to parking hardware solutions they also offer software for parking guidance and parking
management solutions.
Skidata AG offers parking management hardware and software for customers that want to
commercialize their parking area or companies that want to manage their parking slots.
65 https://www.globenewswire.com/news-release/2019/05/14/1824025/0/en/Smart-Parking-Market-Forecast-by-Parking-Site-Technology-and-Region-Transforming-Experience-of-Parking-with-Emerging-Smart-Cities-Guided-Technology-to-Evolve-Smart-Parking-Industry.html 66 https://ec.europa.eu/eurostat/statistics-explained/index.php/Passenger_cars_in_the_EU 67 https://de.statista.com/statistik/daten/studie/985757/umfrage/umfrage-zur-nutzung-von-smart-parking-diensten-in-staedten-weltweit/ 68 https://www.globenewswire.com/news-release/2019/04/18/1806686/0/en/Automotive-Vehicle-to-Everything-V2X-Market-To-Reach-USD-110-3-Billion-By-2026-Reports-And-Data.html 69 https://www.statista.com/statistics/672054/change-in-urbanization-worldwide-by-region/

D8.1A Market Assessment and Technology Monitoring (V1.0)
© 5G-SOLUTIONS, 2019 Page | 63
63
Urbiotica creates and develops solutions based on sensors that connect smart cities. The
company offers the installation of parking slot panels and other parking management products
and is located in Barcelona.
Cisco System, Inc. is developing Cisco Kinetic which is an IoT platform that connects devices.
Next to supporting retail, transportation and other industries, Cisco Kinetic also aims to improve
smart cities’ parking services. Cisco launched a proof of concept in Barcelona to show how they
can manage different services using their Kinetic infrastructure.
Nedap N.V. offers a range of products and services such as vehicle and people identification to
provide access to parking facilities, as well as vehicle detection services to localize available
parking bays and vehicle access control services. Simultaneously Nedap offers different sensors
for smart parking solutions such as RFID scanners, number plate recognition devices and other
occupancy detecting sensors.
Parking Service Provider
Parkopedia is a worldwide leader in parking service applications guiding drivers to the nearest
parking facility. Thereby the application checks availability, prices, opening hours, electric
chargers, etc.
Telekom´s Park and Joy is another parking service provider that predicts available parking spots
at customers destinations by analysing parking data collected by sensors. That data is combined
with anonymous network usage data from Telekom, weather and calendar data. The service is
available in many German cities but will soon expand its coverage.
ParkNow is another global parking service provider which part of the NOW family is where BMW
Group and Daimler AG aggregate their mobility services. The service includes parking slot
guidance and payment methods and is available in several countries worldwide.
ParkMe is another application that guides drivers to available parking slots. It shows real time
availability, offers different online payment methods and enables customers to reserve available
slots. The application guides drivers to on and off-street parking slots and is available in Canada,
USA and several European countries. ParkMe is part of INRIX, a worldwide leader in traffic data
insight collected from road sensors, customers and vehicles.
Parkmobile LLC is a parking spot guidance application that operates in most cities in the USA.
Next to parking slot guidance the application offers mobile payment and reservation solutions.
The service includes the availability of parking slot related data such as EV charging, oversize
possibilities, security information and much more.
6.3.2.4 Why is 5G crucial for Smart Parking?
In short: 5G can deliver faster data rates, higher bandwidth and lower latency which will enable fast Vehicle-to-everything (V2X) communication even in smart cities containing millions of connected devices. With 5G, it does not matter how condensed the connected devices are, they will still be able to have a high bandwidth. This implies no lag on cloud collaboration systems (no latency), enabling continuous monitoring and updating of parking spaces.
6.3.2.5 PESTLE Analysis
The PESTLE analysis framework gives us a good idea about the various factors and potential obstacles that need to be overcome in order to ensure success of smart parking and its future growth.

D8.1A Market Assessment and Technology Monitoring (V1.0)
© 5G-SOLUTIONS, 2019 Page | 64
64
Political The political factors in the context of smart parking and its long-term profitability will vary vastly depending upon the country and their laws and policies. Since the political environment varies so differently, they will need to be accounted for when entering any market. Some of the political stakeholders for smart parking are:
1) Central Government: This includes the federal government involved with running the country,
setting and enforcing tax laws, maintaining law and order in the country, etc.
2) Local Government: These generally consist of the second-tier government authorities that
govern a city, district, or state. Local government generally have their own tax laws (depending
upon the political structure).
Economical The economic aspects of the projects mainly are concerned with the logistics of the initial installation and maintenance of the hardware and infrastructure. Smart parking tells drivers the closest and best place to park their cars, so it will be required to be regularly maintained in order to ensure it does not break down or stop working. Some of the economical parameters are:
1) The type of economic system of the nation
2) Labour costs
3) Transportation costs
4) Stability of the economy in that nation
5) Inflation rates
6) Exchange rates
7) Taxes and Customs for the hardware
Social The social aspects of smart parking revolve around the people and communities within a nation or city, along with their willingness to adopt this new technology and educating them about the topics, because the percentage of the population who will use this technology will determine the success and the long-term sustainability and further development of the project. A breakdown of the social parameters includes:
1) The demographics and the skill levels of the population
2) Social structures, hierarchy and class structure within the population
3) Education and literacy levels of the population
4) Attitude and willingness of the population to adopt this new technology
5) Social conventions and traditions
Technological Technology has been developing and progressing at an exponential level in the last decade, so much so that certain demographics and industries have not had time to react and adapt to this rapid change. For instance, traditional taxi industry has found itself competing against services like Uber or Lyft or BlaBlaCar. Additionally, automated driving, pioneered by Google and Tesla, is also in the process of making drivers obsolete in the future. When analysing the technological aspects of the project, it is important to know and adapt to the advancement in technology. 5G, which is the latest generation in cellular network technology, is said to be a revolutionary instalment in cellular technology, with little to no latency, minimal downtime and so

D8.1A Market Assessment and Technology Monitoring (V1.0)
© 5G-SOLUTIONS, 2019 Page | 65
65
on. 5G technology and its features are crucial for smart parking, since the service requires constant uptime and no lag nor dip in connectivity to be effective.
1) The recent and current trends in technological advancements
2) The implications of such technology
3) The type of equipment required for the smart parking
4) Rate of technology diffusion
Legal The legality of smart parking will differ from country to country, since they have their own laws which they create and enforce. Additionally, data protection and data privacy are also crucial for the product to be allowed on the market. General Data Protection Regulation (GDPR) is a new regulation in the EU parliament, enacted on the 28th of May 2018. It is a data protection act which states that companies must fully disclose any data that it will be collected and processed. The user can order a portable copy of the data collected and the companies must comply and provide them with said data. Additionally, the users can opt out of this at any point without any inconvenience. The legal factors that need to be addressed are
1) The legal framework of the country (Tax laws, employment laws, copyright, discrimination laws,
etc)
2) Data protection and data privacy
3) Health and safety laws
Environmental Different countries and organizations have different laws and policies regarding environmental sustainability and pollution laws. Furthermore, the environmental conditions will also vary based on the geographic location of the locations, which are important factors, since environmental factors (heat, rain, climate, etc.) are important factors and the technology might have to be altered based on them. Some of the environmental factors include:
1) Weather and overall climate of the place
2) Environmental pollution laws
3) Recycling laws
4) Proper waste management
5) Carbon footprint laws
6.3.3 Smart city co-creation
Co-creation implies collaboration between several stakeholders and can be supported by the business ecosystem and triple-helix frameworks previously mentioned in chapter 4. Today, approximately 55 per cent of the world’s population lives in cities. This will reach 68 per cent by 2050, according to the United Nations [13]. Beyond higher data rate and lower latency, 5G will allow for massive machine-type communication such as connecting IoT (Internet of Things) devices, ref. chapter 3.1. This will also boost the connectivity of homes, offices, cities and improve areas such as transport and energy savings. Using data from sensors gathering data from roads or pedestrian and vehicle habits, street lamps could be dimmed or even switched off in low-traffic areas, and can be activated as persons are walking nearby. Inside buildings, office blocks and shopping malls can utilize proximity lighting turning off heating or air conditioning when no one is present. Smart City ecosystems start with local governments enabling collaboration with potential industry and academia partners across several sectors [14]. In this context, access and control over open data

D8.1A Market Assessment and Technology Monitoring (V1.0)
© 5G-SOLUTIONS, 2019 Page | 66
66
becomes a strategic asset for the cities. Cities should make the data available across vertical silos experimenting with decentralized data infrastructures proposing new frameworks and business models rewarding openness, transaction and data sharing. This will mitigate the digital ecosystem that is currently highly fragmented with vertical solution and data handling in silos [14]. Furthermore, it is proposed that the value of open data can be exploited in open ecosystems, e.g. public health data (medical, decease control, sanitation), public safety data (law enforcement, emergency services) and public infrastructure data (roads, environment control, public parks. This can enable start-ups, SME’s, NGO’s and local communities to take advantage of this data and build apps and services relevant to the wider community [14]. Cities should also explore sharing of data generated by citizens, IoT sensor networks and on city level data that has broad communal use and are privacy protected. A survey among smart cities and municipalities in Norway shows that the most frequent areas for smart city programs/strategies are: Education, Facilities, Transport, Environment and Health and Care. For these areas sensors (IoT), smart mobile devices and cloud services are most frequently used to communicate with the citizens [15]. This is also supported through an information technology literature review on Smart cities [16]. In the same study, the smart cities and municipalities were asked to rank the most important success factors for smart city program/strategies [15]. Collaboration with local knowledge bodies were viewed at the most important success factor. This refers to University College and research institutes, industry, regional and local public infrastructure actors as well as local start-ups. Some of the smart city projects are also connected to national and international competence bodies. Other success factors were the following: that the municipality has good data systems and data management, collaboration and co-creation with citizens, strategies are anchored on political level, good technology understanding and a unified strategy covering all service areas and collaboration with local industry. Involvement of the citizens is important in order to secure that the projects matches the need of the inhabitants and to anchor the changes implemented through the projects. Examples of involvement of the citizens are idea workshops and other type of meetings discussing and providing suggestions on the development of the city and municipality. A review of UK smart cities indicates similar findings with respect to areas for smart city strategies [15] [17]. The most important barriers for implementing smart city programs mentioned by the smart cities and municipalities were the following: lack of digital standard for sharing of data, e.g. sharing of sensor data between municipalities sectors though a common technological platform. Issues related to internal organization and collaboration within the municipality was second most important barrier together with access to data and competence in the municipality. Funding was also an important barrier together with legal issues. Funding of external collaboration can imply an organizational and managerial principle that is challenging to integrate in smart city organizations and increases the transactional costs [15].
6.3.3.1 SWOT Analysis
A SWOT analysis of Smart Cities is published by Harvard Business Review (HBR) [18], introducing a broad macro environment assessment of Smart Cities. Here we find that robust domestic market and strong relationships with existing customers (suppliers and members of the supply chain) jointly looking for opportunities for growth and innovation are some of the strengths. Among the weaknesses is implementation of technology in processes and that it is challenging to implement business models and IPR (Intellectual Property rights) in the industry that Smart Cities operates in. Opportunities are related to increasing standardization and that Machine learning and Artificial Intelligence technologies can improve the transformation processes. Threats of new entrants because of reduced cost and increased efficiency should be expected and increased costs due to environmental regulations.

D8.1A Market Assessment and Technology Monitoring (V1.0)
© 5G-SOLUTIONS, 2019 Page | 67
67
EURAC (European Academy of Bozen-Bolzano) has developed a free of charge software-based SWOT tool, available online as a self-assessment tool for city administrations to identify opportunities and barriers for the implementation of a Smart City project70.
6.3.4 Smart campus
The main purpose of the Smart Campus Use Case is to enable continuous evolution of the smart buildings and campuses from a set of individual isolated systems to a federated smart IoT environment that provides a safer and more efficiently managed working environment for the buildings and the campuses occupants and visitors. This will in turn yield in considerable savings in operational costs of the campus. The 5G technology is seen as an enabler for such an IoT transformation by providing better, more reliable connectivity to up to a million connected IoT devices in a single cell.
6.3.4.1 SWOT Analysis
Strengths Perhaps the most obvious benefit of a smart campus is the considerable cost savings such a system might yield in the long run. For example, 4k video monitoring and automated detection of suspect behaviour can help improve the physical security of the campus as well as the safety of its occupants. Such systems can help enforce more efficient and effective security policies with a fraction of the cost. Data from potentially thousands of sensors deployed around the campus like temperature, CO2 levels, presence detection and lighting levels can be leveraged in a multitude of ways to enhance the comfort of the campus occupants indoors and outdoors. HVAC (Heating Ventilation and Air Conditioning) systems can be controlled to enhance occupants’ comfort and productivity levels, smart lighting can be used to simulate daylight conditions indoors, while data on the occupancy of different parts of the campus can allow better planning of the use of these spaces in the campus. In emergency situations, presence data can be leveraged to improve rescue operations. Another major benefit of smart campus is predictive maintenance of IoT devices and infrastructure. In fact, real-time monitoring of the system’s components health like the IoT devices can help increase the lifespan of these devices, considerably reduce the disruption of the service due to maintenance, and proactively schedule maintenance operations well in advance by predicting potential flaws in the system. This in turn can yield in considerable cost cutting in terms of the system maintenance and operation. Weaknesses While the benefits of deploying smart campus technology using 5G are numerous, and although the IoT industry have come a long way, the adoption of such a technology remains at an early stage. In fact, smart campuses ought to follow a B2B business model due to the nature and the location of such services. However, until new services and applications will emerge, that can yield in considerable cost savings in the short term, it seems like the argument for a move forward towards a smart campus, which requires a considerable upfront investment, remains a bit uncompelling. Opportunities The advent of the 5G technology is going to transform smart campuses and Industrial IoT in a broader sense. In fact, 5G can be the catalyst for a widespread adoption of such a technology as it will considerably reduce the upfront costs related to the infrastructure deployment for the campuses owners and will transfer this cost to the telecom operators that can withstand such important
70 http://sinfonia.eurac.edu/swot/info/

D8.1A Market Assessment and Technology Monitoring (V1.0)
© 5G-SOLUTIONS, 2019 Page | 68
68
investments. In other words, smart campuses owners and their management companies will only have to pay a monthly or yearly fee to the service provider, which will incentivise a faster and wider adoption of this technology. Due to the novelty of 5G, there is no definite market leader in the space of 5G-based smart campus solutions. This represents a golden opportunity for the different actors who are involved in this space at such an early stage. Also, 5G will pave the way for new innovative and futuristic applications and services for smart campuses, which will only create new opportunities for extension to new markets and market segments. Threats In its early stages, 5G-based smart campus solutions will face fierce competition from other IoT service providers in the ecosystem. In fact, there are a number of service offerings for Industrial IoT and smart campuses in particular from companies that use communications technologies other than 5G. These companies are a step ahead compared to newer 5G adopters in terms of market knowledge with a more comprehensive portfolio and a stronger trust-based relationship with their customers. Another potential threat for such a solution is handling and protection of user related data. GDPR Regulation has set a higher standard to the level of protection required when dealing with private user data. A smart campus solution is not immune from cyber-attacks that can use user or corporate data in a malicious way.
6.3.4.2 Trend/market analysis:
The smart campus market is expected to grow significantly in the next few years. This will be accelerated by the advent of the 5G technology as it will greatly reduce CAPEX. This in turn will lead to an evolution to a smarter campus and will significantly minimize OPEX. A recent report71 suggests the smart building industry will grow from $60 Billion in 2019 to $105 Billion in 2024 at a Compound Annual Growth Rate (CAGR) of 11.7% during the forecast period. When analysing the trend, it is useful to segment the market into the following submarkets: Component-based
Solutions providers
Services providers
Solution type-based
Building infrastructure management
Security and emergency management
Energy management
Network management
Workforce management
Service type-based
Consulting
System integration and deployment
Support and maintenance
Building type-based
Residential
Commercial
Industrial
71
https://www.marketsandmarkets.com/Market-Reports/smart-building-market-1169.html

D8.1A Market Assessment and Technology Monitoring (V1.0)
© 5G-SOLUTIONS, 2019 Page | 69
69
Region-based
North America
Europe
Asia-Pacific
Middle east and Africa
Latin America The North American region is expected to lead the market in the next year according to the same source. When it comes to the market segment, the commercial buildings are expected to lead the market in the next few years.
6.3.4.3 Competitor Analysis
The following is a list of some of the key players in the IoT smart Campus space. European market o Legrand: The French-born electrical component manufacturer, which has been taking a deeper
interest in sustainable business practices across its own operations, launched its IoT initiative
dubbed ELIOT
o Schneider Electric: The energy management specialist, which has been especially vocal in the past
about smart cities projects, overhauled its smart building product line called EcoStruxure
o Siemens: An emerging force in commercial and community microgrids, German conglomerate
Siemens is also shoring up its IoT expertise. Recently, it presented a variety of new cloud offerings
ranging from cloud connectivity solutions to cloud operations.
Global market o Cisco: The networking giant follows an energy efficiency concept it started pushing more
aggressively in early 2016. It also provides solutions for building automation technology, controls
and equipment to integrate HVAC, communications, and security systems at the infrastructure level.
o Hitachi: The Japanese conglomerate began touting its IoT strategy, based on a technology called
Lumada, which is a platform that helps turn data into insight using advanced AI to drive digital
innovation.
o Honeywell: Enterprise Buildings Integrator (EBI) is a comprehensive, network-based solution for
intelligent building automation and enterprise management. Using flexible architecture and open
industry standards, EBI integrates existing building systems to streamline processes and optimize
building performance.
o Panasonic: The Japanese company is already a well-known player in green building technologies
such as energy-efficient lighting, refrigeration, air conditioning, heating and renewable energy.
o Verdigris Technologies: This San Francisco upstart is using artificial intelligence to collect
information from a building’s electrical panels and then analyse these "fingerprints" for opportunity
to optimize settings and to predict possible maintenance issues that could boost power
consumption.
6.3.5 Autonomous assets and logistics for smart harbour/port
6.3.5.1 Market Overview
Ports around the world face common challenges of increasing labour costs, a high degree of labour intensity, harsh working environments, and insufficient personnel. The industry is now united on a path
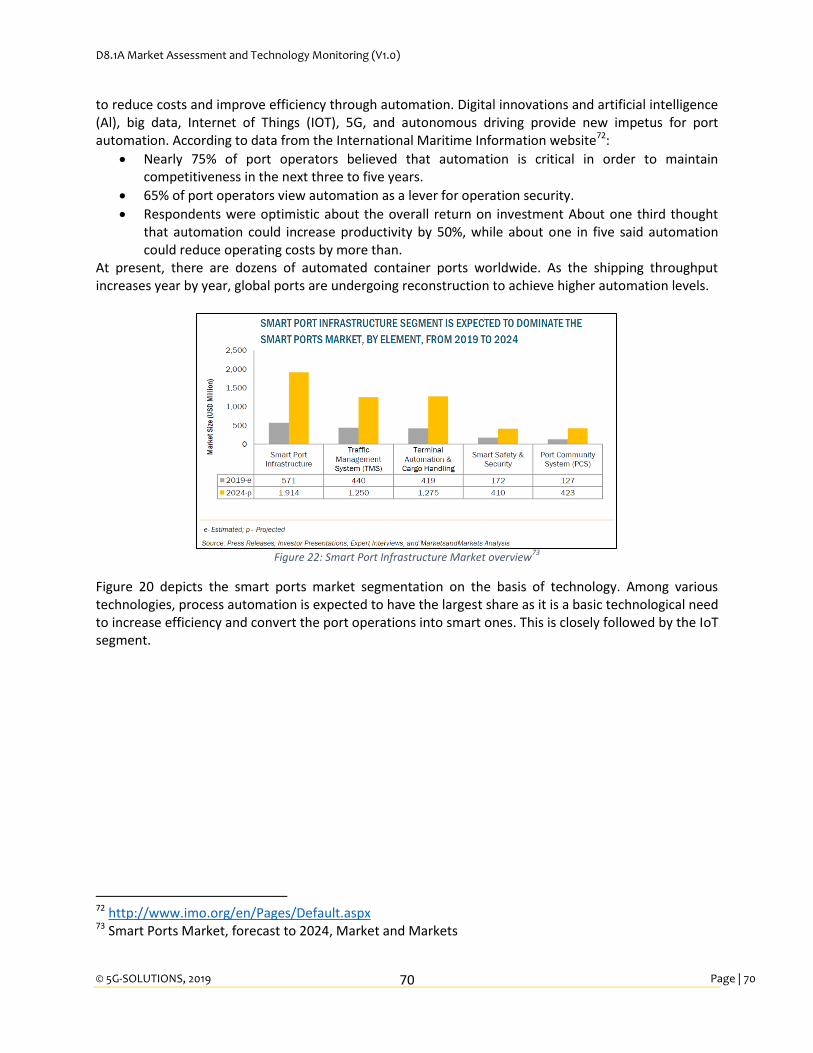
D8.1A Market Assessment and Technology Monitoring (V1.0)
© 5G-SOLUTIONS, 2019 Page | 70
70
to reduce costs and improve efficiency through automation. Digital innovations and artificial intelligence (Al), big data, Internet of Things (IOT), 5G, and autonomous driving provide new impetus for port automation. According to data from the International Maritime Information website72:
Nearly 75% of port operators believed that automation is critical in order to maintain competitiveness in the next three to five years.
65% of port operators view automation as a lever for operation security.
Respondents were optimistic about the overall return on investment About one third thought that automation could increase productivity by 50%, while about one in five said automation could reduce operating costs by more than.
At present, there are dozens of automated container ports worldwide. As the shipping throughput increases year by year, global ports are undergoing reconstruction to achieve higher automation levels.
Figure 22: Smart Port Infrastructure Market overview
73
Figure 20 depicts the smart ports market segmentation on the basis of technology. Among various technologies, process automation is expected to have the largest share as it is a basic technological need to increase efficiency and convert the port operations into smart ones. This is closely followed by the IoT segment.
72 http://www.imo.org/en/Pages/Default.aspx 73 Smart Ports Market, forecast to 2024, Market and Markets
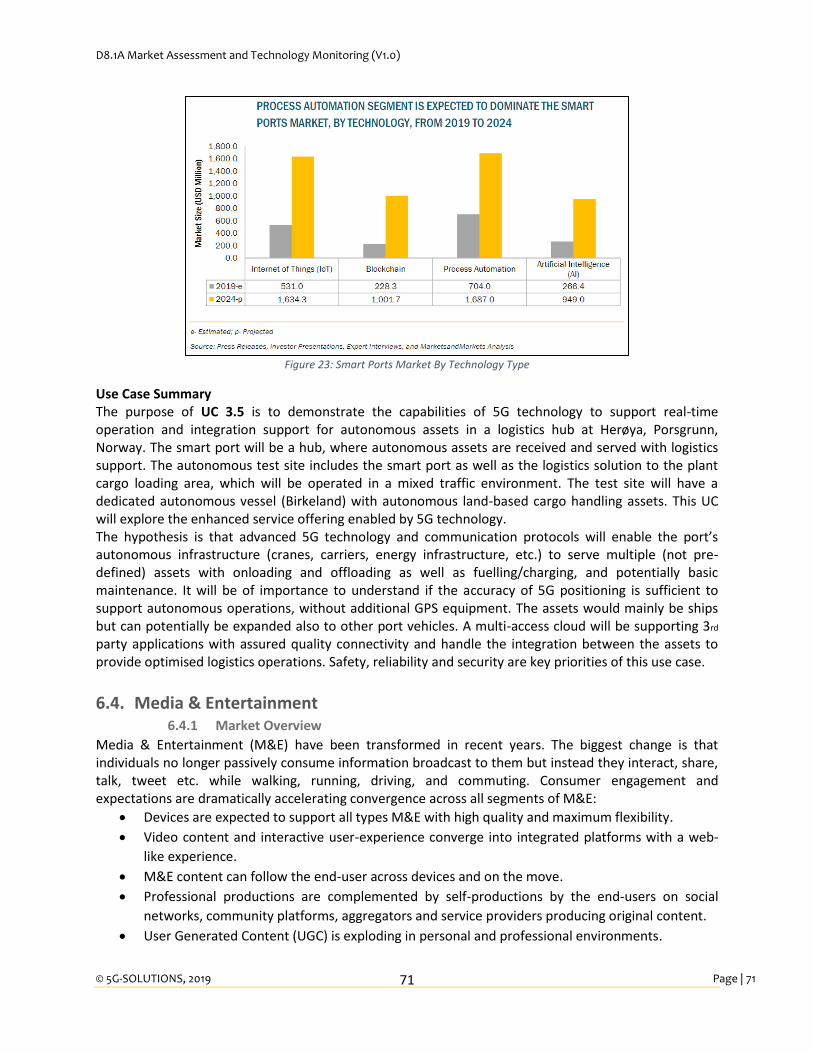
D8.1A Market Assessment and Technology Monitoring (V1.0)
© 5G-SOLUTIONS, 2019 Page | 71
71
Figure 23: Smart Ports Market By Technology Type
Use Case Summary The purpose of UC 3.5 is to demonstrate the capabilities of 5G technology to support real-time operation and integration support for autonomous assets in a logistics hub at Herøya, Porsgrunn, Norway. The smart port will be a hub, where autonomous assets are received and served with logistics support. The autonomous test site includes the smart port as well as the logistics solution to the plant cargo loading area, which will be operated in a mixed traffic environment. The test site will have a dedicated autonomous vessel (Birkeland) with autonomous land-based cargo handling assets. This UC will explore the enhanced service offering enabled by 5G technology. The hypothesis is that advanced 5G technology and communication protocols will enable the port’s autonomous infrastructure (cranes, carriers, energy infrastructure, etc.) to serve multiple (not pre-defined) assets with onloading and offloading as well as fuelling/charging, and potentially basic maintenance. It will be of importance to understand if the accuracy of 5G positioning is sufficient to support autonomous operations, without additional GPS equipment. The assets would mainly be ships but can potentially be expanded also to other port vehicles. A multi-access cloud will be supporting 3rd
party applications with assured quality connectivity and handle the integration between the assets to provide optimised logistics operations. Safety, reliability and security are key priorities of this use case.
6.4. Media & Entertainment 6.4.1 Market Overview
Media & Entertainment (M&E) have been transformed in recent years. The biggest change is that individuals no longer passively consume information broadcast to them but instead they interact, share, talk, tweet etc. while walking, running, driving, and commuting. Consumer engagement and expectations are dramatically accelerating convergence across all segments of M&E:
Devices are expected to support all types M&E with high quality and maximum flexibility.
Video content and interactive user-experience converge into integrated platforms with a web-
like experience.
M&E content can follow the end-user across devices and on the move.
Professional productions are complemented by self-productions by the end-users on social
networks, community platforms, aggregators and service providers producing original content.
User Generated Content (UGC) is exploding in personal and professional environments.
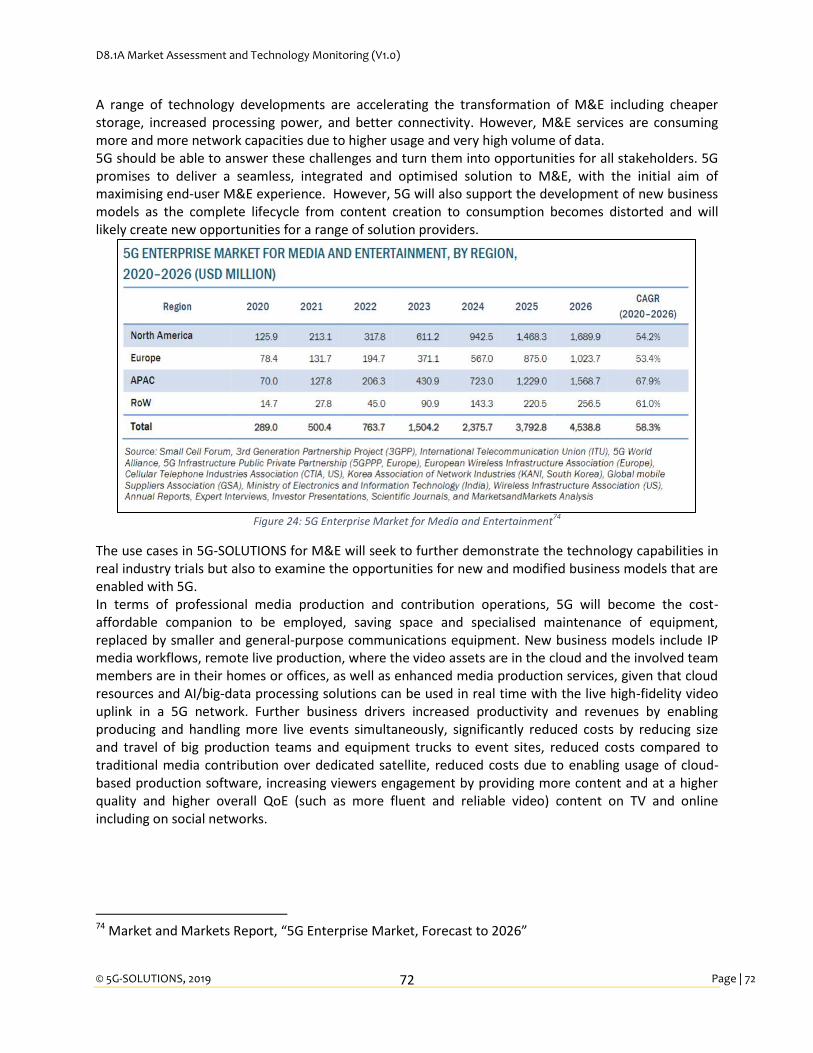
D8.1A Market Assessment and Technology Monitoring (V1.0)
© 5G-SOLUTIONS, 2019 Page | 72
72
A range of technology developments are accelerating the transformation of M&E including cheaper storage, increased processing power, and better connectivity. However, M&E services are consuming more and more network capacities due to higher usage and very high volume of data. 5G should be able to answer these challenges and turn them into opportunities for all stakeholders. 5G promises to deliver a seamless, integrated and optimised solution to M&E, with the initial aim of maximising end-user M&E experience. However, 5G will also support the development of new business models as the complete lifecycle from content creation to consumption becomes distorted and will likely create new opportunities for a range of solution providers.
Figure 24: 5G Enterprise Market for Media and Entertainment
74
The use cases in 5G-SOLUTIONS for M&E will seek to further demonstrate the technology capabilities in real industry trials but also to examine the opportunities for new and modified business models that are enabled with 5G. In terms of professional media production and contribution operations, 5G will become the cost-affordable companion to be employed, saving space and specialised maintenance of equipment, replaced by smaller and general-purpose communications equipment. New business models include IP media workflows, remote live production, where the video assets are in the cloud and the involved team members are in their homes or offices, as well as enhanced media production services, given that cloud resources and AI/big-data processing solutions can be used in real time with the live high-fidelity video uplink in a 5G network. Further business drivers increased productivity and revenues by enabling producing and handling more live events simultaneously, significantly reduced costs by reducing size and travel of big production teams and equipment trucks to event sites, reduced costs compared to traditional media contribution over dedicated satellite, reduced costs due to enabling usage of cloud-based production software, increasing viewers engagement by providing more content and at a higher quality and higher overall QoE (such as more fluent and reliable video) content on TV and online including on social networks.
74 Market and Markets Report, “5G Enterprise Market, Forecast to 2026”
D8.1A Market Assessment and Technology Monitoring (V1.0)
© 5G-SOLUTIONS, 2019 Page | 73
73
6.4.2 Ultra High-Fidelity Media (UHFM)
Rapid progress in display and capture technologies is enabling a new, highly immersive production and viewing experience with ultra-crisp, wide-view pictures with deep contrast and multi-channel sound. In order to guarantee a high quality of experience for UHFM, the 5G network should be able to support efficient network management, fair resource allocation, high speed transport capabilities and strategies, e.g. by means of local and network caching of content. UC 4.1 involves media streaming to devices using a variety of applications supported by the partners under different network configurations. The subscriber needs to have access to the content in good quality and high resolution no matter if he/she is still or moving and be able to have a high QoE using any device. In current 4G networks the service is not guaranteed and when needed, the video quality is lowered by the application server. Mobility also impacts the quality and finally there is a high possibility of problems in high density areas e.g. football stadiums are typically poorly served by current 4G networks.
6.4.3 Multi-CDN Selection
This use case examines a common problem that occurs when large audiences are consuming a Linear broadcast service or when a popular programme is released for on-demand consumption. This is a daily problem occurring when users consume media content via OTT (Over-the-Top) platforms in a Mobile Network Operator (MNO) network. This specific use case will examine users of the media OTT applications of public and commercial broadcasters enjoying linear media or on-demand content distributed via multiple Content Delivery Networks (CDN). Under certain circumstances the origin of content may become unavailable or congested therefore not providing the expected QoS. From the content provider point of view, distribution cost may increase in order to dimension the CDN to provide enough capacity to withstand the peaks. On the other hand, the MNO is in between, and the network congestion may also affect service provision.
6.4.4 On-site Live Event Experience
In highly-populated live events, such as sports venues, music concerts, or carnivals, lots of users will simultaneously try to upload images, live videos and recorded clips as well as watch other participants’ content or background content related to the event. At the same time, special groups of users (e.g. Emergency health response, Police etc.) require continuous Service Level Agreements (SLAs) higher than those of the mass grouping. The challenge for media service providers is to offer a good QoE to their clients in a dense client environment. Currently, the providers sharing the radio access, backhaul and core network try to optimise their quality independently causing a dramatic degradation of the QoE. There are also special users such as emergency services and first responders that require a steady QoS. 5G network must be able to provide extra resources for specific users, groups or services. UC 4.3 involves the generation and simulation of various subscriber profiles in terms of bitrate and quality requirements and the evaluation of the corresponding QoE.
6.4.5 User and machine generated content
This use case is focused on the media-related experience in generating professional and semi-professional content for various purposes including live news coverage, live sports and other entertainment coverage. It also encompasses telemedicine related live transmission such as video from rural medical centers to medical experts or live from moving ambulances, real time security cameras, automotive-generated content such as multiple cameras enabling teleoperation or uploading huge

D8.1A Market Assessment and Technology Monitoring (V1.0)
© 5G-SOLUTIONS, 2019 Page | 74
74
amounts of sensory-generated data. User Generated Content for both professional and non-professional journalism is also included and tested. For the broadcast and news coverage transmissions, this continues the application of replacing the traditional satellite trucks (disruptive) while allowing many more use cases (e.g. news coverage from indoors, from underground, at no-time notice, on the move, from drones, etc.). When either very reliable transmission is needed or high video quality (in the past full HD, nowadays 4K and in the coming years even 8K), and/or during mobility, then multi-link bonding may be used. In this use case the professional or semi-professional content generator minimizes the risk for transmission failure from anywhere and regardless of potential degradations in any single network, aggregates bandwidth from one or more networks. Various bonding combinations that will be tested within this use case. They include bonding multiple 5G connections of the same slice type, of different slice types, of 4G with 5G, of 5G with WiFi, and more.
6.4.6 Immersive and Integrated Media and Games
The immersive technologies of augmented and virtual reality will have a fundamental impact on the way individuals consume content in the future. Nevertheless, there are certain weaknesses about the technology, such as the dependency on 5G networks, which must be considered carefully.
6.4.6.1 SWOT Analysis
Opportunities/strengths: Both AR and VR gaming require extremely low latency, which can best be provided by 5G networks. This will boost the feasibility of mobile gaming in areas where 5G coverage is in place. The Pokemon Go servers, for instance, faced significant issues to connect with users as the game got increasingly popular. 5G technology will solve this problem. Another huge opportunity for the gaming market is the cloud gaming technology that will allow smaller players to enter the mobile gaming market without having to provide hardware such as an xBox or a PlayStation. Threats/weaknesses: The dependency on 5G technology poses a clear threat on this segment of the gaming market. This is due to the fact that it will take multiple years and billions of dollars of investment into the infrastructure to reach a certain level of coverage of 5G.75 Additionally, very few devices are currently able to leverage 5G technology. While smartphone manufacturers will surely be launching lots of new products with 5G add-ons, this limits the market to a very small group of early adopters today.76 Finally, one factor that could limit the growth of immersive gaming technologies is the lack of adequate employees, which will eventually lead to a consolidation of the market. 77
6.4.6.2 Trend/market analysis:
In the gaming market, China, USA and Japan are among the three countries with the highest revenues of 34.4$, 31.54$ and 17.72$ billion respectively. Gaming revenues in general will increase over the next years and especially the VR gaming market will experience substantial growth. The revenue of VR gaming is prospected to rise from 4.7 Billion Dollars in 2018 to 19.5 Billion Dollars in 2025 in the USA
75
https://newsroom.accenture.com/news/new-research-from-accenture-strategy-highlights-economic-and-societal-impact-of-investing-in-5g-infrastructure.htm 76
https://www.zdnet.com/article/top-5g-announcements-from-mwc-2018/ 77
https://www.mckinsey.com/industries/media-and-entertainment/our-insights/augmented-and-virtual-reality-the-promise-and-peril-of-immersive-technologies

D8.1A Market Assessment and Technology Monitoring (V1.0)
© 5G-SOLUTIONS, 2019 Page | 75
75
alone. On a global scale, total market size of VR and AR is predicted to hit 95 Billion Dollars by 2025.78 It becomes clear that especially mobile gaming will increase and the mobile games will come along with certain bandwidth and latency requirements that have to be met for an appropriate gaming experience. The market growth of mobile games can be seen in NEWZOO’s report on the games market. While the worldwide mobile games market size was around 56.4 Billion Dollars in 2018, it is expected to amount to 88.25 Billion Dollars in 2021. This will only be possible with 5G in place to fulfil the necessary conditions.79 Cloud Gaming: A strong trend towards cloud gaming, which requires 5G to enable gaming on PC or mobile phones, can be observed. Therefore, all large players in the gaming industry have adopted this trend developing Google Stadia, Geforce Now or Microsoft xCloud. After Amazon acquired twitch, a game streaming platform, it is expected to see a gaming cloud service emerging from AWS. So far, they cooperate with the cloud gaming service provider Parsec. However, these are not the only players in the market and many are expected to follow. An overview of the most relevant competitors in the cloud gaming market can be seen here:80
78
https://www.mckinsey.com/industries/media-and-entertainment/our-insights/augmented-and-virtual-reality-the-promise-and-peril-of-immersive-technologies 79
https://www.statista.com.login.bibproxy.whu.edu/statistics/308454/gaming-revenue-countries/ 80
https://www.edgegap.com/post/cloud-gaming-comparison-table/
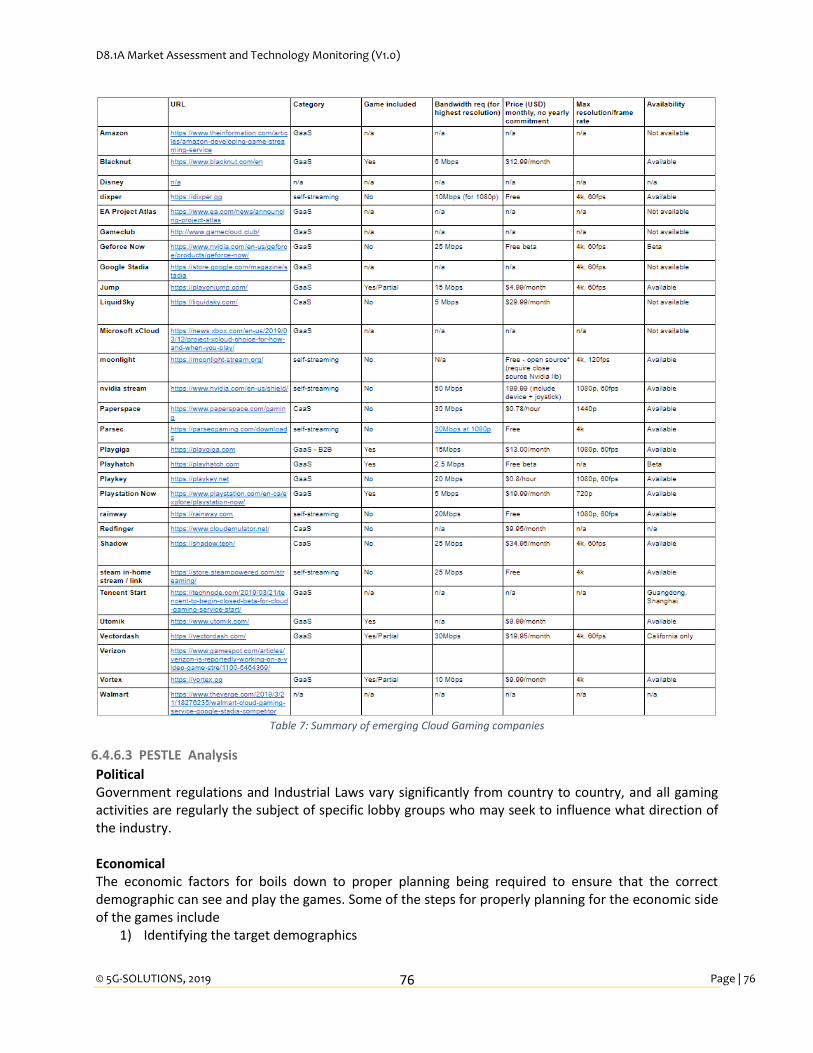
D8.1A Market Assessment and Technology Monitoring (V1.0)
© 5G-SOLUTIONS, 2019 Page | 76
76
Table 7: Summary of emerging Cloud Gaming companies
6.4.6.3 PESTLE Analysis
Political Government regulations and Industrial Laws vary significantly from country to country, and all gaming activities are regularly the subject of specific lobby groups who may seek to influence what direction of the industry. Economical The economic factors for boils down to proper planning being required to ensure that the correct demographic can see and play the games. Some of the steps for properly planning for the economic side of the games include
1) Identifying the target demographics

D8.1A Market Assessment and Technology Monitoring (V1.0)
© 5G-SOLUTIONS, 2019 Page | 77
77
2) Identifying the stakeholders
3) Developing a plan for stakeholder engagement
4) Developing a business plan and monetizing model for the game
5) Exploitation and dissemination plan for the stakeholders
6) Cost of acquiring hardware and software capable of running VR/AR applications
Social The social aspects of AR/VR game development include
1) Technology being accessible to everyone, regardless of age, gender, ethnicity, race, etc
2) Integration and adoption of the new AR/VR technology
3) Attitude of citizens regarding AR/VR
4) Current social trends and social structures, classes and hierarchies
5) Considering the content of the applications developed so as not to offend or disrespect any
culture
Technological The concept of virtual reality is not new, it has been around since the 60s. However, only recently has the technology been able to catch up to the concept. VR technology has developed rapidly and, therefore, also increased interest in the field. Although there is still a lot to be developed, the current state of the technology is sufficient for a variety of applications. The technological aspects of VR include
1) Hardware capable of supporting and running VR applications (Headset, controllers, computer
which is VR compatible, etc.)
2) Software for VR development (Unity, Unreal Engine 4, etc.)
3) Addressing, preventing and educating people regarding some of the health issues related to VR,
such as motion sickness, headaches, dizziness, loss of balance and nausea are induced in certain
people and should be avoided
Augmented reality is the superimposing digital content on-to the real-world using camera and glasses. Augmented reality has also seen a steep increase in development and popularity. Things such as Google Glasses, Hololens, etc. have demonstrated that augmented reality can be used for a plethora of different applications. Some of the technological aspects include the availability of hardware that supports AR. Legal The legal aspects include
1) Data protection of the users
2) Data privacy as per GDPR
3) No usage of copyrighted material unless it is granted by the creator
4) Inappropriate content
Environmental All future development must be cognisant of the need to create energy efficient products and support green and sustainable initiatives.
6.4.7 Cooperative Media Production
Cooperative Media Production, or At-Home Production or Remote Integration (REMI) has become the new standard for production companies, broadcasters and sports organizations of all sizes. Wireless At-Home/Cloud Production solutions allow broadcasters to reduce costs by producing live shows from a

D8.1A Market Assessment and Technology Monitoring (V1.0)
© 5G-SOLUTIONS, 2019 Page | 78
78
centralized studio control room instead of on-site production and satellite trucks. Traditional on-site trucks involve huge costs both in terms of duplicated equipment and personnel, in very low efficiency due to the overhead involved such as travel time of the teams and the equipment, quality variance between events, production faults, lower efficiency in multi-site simultaneous events management etc. At-home production solves all these inefficiencies by requiring that only the camera and audio team needs to be in the field, whereas the production is done either in the professional studio facility or anywhere else as seen fit. Sports and event producers can deliver multi-camera live events while eliminating the need to spend a fortune on production vehicles, satellite uplinks and travel expenses. In this use case several cameras are each connected in the field to cellular-based transmission devices, including bonding devices to provide the utmost reliability and bandwidth. These field devices then transmit the video stream over the cellular and the standard public internet (ISP) to a single receiving/decoder server with several physical SDI outputs. The multiple video streams in the station or production facility are then used for the actual remote production. Video quality is up to 4K from each camera.

D8.1A Market Assessment and Technology Monitoring (V1.0)
© 5G-SOLUTIONS, 2019 Page | 79
79
7. Technology Monitoring Methodology In this section, we discuss the strategy that the consortium has decided upon regarding technology monitoring. We plan utilise an existing web-based Knowledge Base Portal implemented under SELIS81 project and enhanced under CHARIOT82 project (using the EBOS WiseBOS CMS Platform). For this purpose, further adjustments planned to be implemented in order the existing Portal to be able to support 5G-SOLUTIONS project and be able to handle various posts and publications that the partners feel relevant for the consortium to have access to. The Knowledge Base Portal has a web-based frontend where the users can view various articles, related to the project. As mentioned before this Portal is already used for SELIS83 and CHARIOT84 H2020 EU funded projects. The main purpose of having the Knowledge Base Portal is, to provide a centralized location where all articles, publications and relevant documents can be hosted in a structured way and can easily be accessed. This portal will be used as part of the exploitation and dissemination plan of the project, and as a resource to support capacity building, as listed below
1. Exploitation and dissemination
a. Establishment of communications partnerships with appropriate pilot focused
communities, and relevant associations across Europe.
b. Dissemination and development of communities that support the pilots.
2. Capacity Building
a. Maximise the use and impact of the project solutions within the European communities
and consequently leverage the project results.
The Knowledge Base has been developed to support multiple projects, by the use of latest technologies of web development and the GUI will be designed with GUI Design principles in mind such as:
Clarity: The interface is visually, conceptually and linguistically clear.
Comprehensibility: The interface is easily understood and the flow easily followed.
Consistency: The interface looks, acts, and operates the same throughout.
Control: The user controls the interaction. o Actions results from explicit user requests o Actions are performed quickly o Actions are capable of interruption or termination o The user is never interrupted for errors
Efficiency: Minimize user’s eye and hand movements. o Transition between various systems control flows easily and freely. o Navigation paths are as short as possible. Ensure that users never lose their work as a
result of an error on their part
Simplicity: o Provide an interface as simple as possible. o Make common actions simple at the expense of uncommon actions being made harder. o Provide uniformity and consistency.
81 https://cordis.europa.eu/project/rcn/204146/factsheet/en 82 https://cordis.europa.eu/project/rcn/212490/factsheet/en 83 http://www.knowledgeportalcenter.com/selis 84 http://www.knowledgeportalcenter.com/chariot

D8.1A Market Assessment and Technology Monitoring (V1.0)
© 5G-SOLUTIONS, 2019 Page | 80
80
The Knowledge Base will be enhanced to support 5G-SOLUTIONS project and allow the visitor navigating to articles and useful materials (related to the project) assigned to the following categories and sub-categories:
1. Project Results:
a. 5G-Solutions Publications
b. 5G-Solutions Public Deliverables
2. 5G
a. Factories of the Future
b. Smart Energy
c. Smart Cities
d. Smart Ports
e. Media & Entertainment
f. Telecom Providers
g. SME Opportunities
h. Technological Developments
i. Social Impacts
Moreover, additional categories can be added as per project and partners’ needs. Each category will have an owner that will be responsible for posts in the category. The implementation enhancements will be handles by EBOS and the administration part of setting up the categorisations and adding articles will be managed by NURO (as the Task leader) and Inlecom) as the Work Package Leader). More information, access link, portal’s screenshots along with statistics (number of articles, number of visits, other Google Analytics) will be reported on D8.1B.

D8.1A Market Assessment and Technology Monitoring (V1.0)
© 5G-SOLUTIONS, 2019 Page | 81
81
8. Conclusions and Next Actions This deliverable presents the market analysis and technology monitoring of the 5G-SOLUTIONS project and its verticals. The deliverable starts by laying down the features that 5G provides and the use cases that can be implemented over the technology. It further elaborates on the politics behind 5G and how it affects the technology implementation and take-up actions. In addition, the deliverable provides a stakeholder overview of the 5G technology and the various Business Ecosystems. A combination of instrumental, normative and descriptive approaches will be adapted to understand the end-users, third parties and policy makers that can be addressed to achieve best possible results for the use cases. Various stakeholders such as Hardware Manufacturers, Network Infrastructure Manufacturers, Software Network Function providers, Device Manufacturers, IT service providers, Network Service Providers, Communication Service Providers, Online Service Providers, Brokers and end customers are identified with their roles and interactions documented. The deliverable also gives a general market analysis of the 5G technology where a CAGR of 111% is foreseen. The section also provides the impact of 5G on SMEs, Start-ups and Telecommunication companies. For start-ups and SMEs, the technology can be beneficial from the improvement of improving internal business communication all the way to recruiting procedures. For Telecommunication companies, 5G opens up the possibilities of cost reduction for supporting the ever-growing data traffic and increasing their revenues. Furthermore, the present document goes into details regarding each of the living lab and the use cases that the project intends to complete. These include the 4 living labs; a) Factories of the future b) Smart Energy c) Smart Cities & Ports d) Media and Entertainment. For each of the living labs, a general market overview is presented, followed by an overview of the role of 5G for the living labs through PESTLE and SWOT analyses, trend analysis of the use cases is provided wherever necessary to give an in depth overview of the landscape where the use case plans to operate. This will help in the development of a potential commercial solutions from the use case and will also provide a general overview on the commercialisation options available to the consortium partners. Finally, the deliverable covers the technology monitoring methodology that we will adopt to ensure there is a constant update on emerging technologies in relevant sectors and provide all the partners in the project with the knowledge base. In the next steps, we plan to implement and run the knowledge base as well as constantly update it with relevant information and note the results in D8.1B, which is the second version of this deliverable to be submitted at the end of the project.

D8.1A Market Assessment and Technology Monitoring (V1.0)
© 5G-SOLUTIONS, 2019 Page | 82
82
Bibliography
[1] R. Adner, “Match your innovation strategy to your innovation ecosystem,” Harvard Business
Review, vol. 84, pp. 98-107 + 148, 2006.
[2] R. Bouncken and S. Kraus, “Innovation in knowledge-intensive industries: The double-edged sword
of co-opetition,” Journal of Business Research, vol. 66, no. 10, pp. 2060-2070, 2013.
[3] K. Laursen and A. Salter, “The paradox of openness: appropriability, external search and
collaboration,” Research Policy, pp. 867-878, 2014.
[4] M. Iansiti and R. Levien, The keystone advantage. What the new dynamics of business ecosystems
mean for strategy, innovation and sustainability, USA: Harvard Business School press, 2004.
[5] A. Gawer and M. A. Cusumano, “Industry platforms and ecosystem innovation,” Journal of product
innovation management, vol. 31, no. 3, pp. 417-433, 2014.
[6] A. Tiwana, Platform ecosystems. Aligning architecture, governance and strategy, London: Elsevier,
2014.
[7] A. Gawer, "Bridging different perspectives on technological platforms: toward an integrative
framework," Research Policy, vol. 43, no. 7, pp. 1239-1249, 2014.
[8] C. Stabell and Ø. Fjeldstad, “Configuring value shops for competitive advantages:On chains, Shops
and networks,” Strategic Management Journal, vol. 19, no. : Configuring value shops for
competitive advantages: ,, pp. 413-437, 1998.
[9] GSMA, “Embracing payments as a platform for the future of mobile money,” 2019.
[10] ITU, “Setting the scene for 5G: Opportunities and challenges,” 2018.
[11] NGMN Alliance, “NGMN 5G white paper,” 2015.
[12] 5GPPP, “5G Innovations for new business opportunities,” 2017. [Online]. Available: https://5g-
ppp.eu/wp-content/uploads/2017/01/5GPPP-brochure-MWC17.pdf. [Accessed 20 May 2018].
[13] United Nations, “The worlds worlds cities in 2016,” 2017.
[14] E. Almirall, J. Wreham, C. Ratti, P. Conesa, F. Bria, A. Gaviria and A. Edmondson, “Smart Citites at
the Crossroads: New Tensions in City Transformation,” California Management Review, vol. 59, no.
1, 2016.
[15] Agenda Kaupang, “Smart byer og kommuner i Norge - en kartlegging,” Oslo, 2019.
[16] A. Camero and E. Alva, “Smart City and information technology, a review,” Cities, pp. 84-94, 2019.
[17] Navigant Conculting Inc., “UK Smart Cities Index 2017,” Huawei, London, 2017.
[18] E. Almirall, J. Wareham, C. Ratti and P. Conesa, “Smart Cities at the Crossroads: New Tensions in
City Transformation Harvard Business Review Case Study,” HBR Publications, 2018.