d4.1 context awareness system - protective-h2020.eu · mission dependency ... information on...
TRANSCRIPT

The research leading to these results has received funding from the European Union’s Horizon 2020 Research and Innovation Programme, under grant agreement no 700071.
Horizon 2020 Programme Instrument: Innovation Action
Proactive Risk Management through Improved Cyber Situational Awareness
Start Date of Project: 2016-09-01
Duration: 36 months
D4.1 Context Awareness System Deliverable Details
Deliverable Number D4.1
Revision Number F
Author(s) AIT, ITTI
Due Date 0417
Delivered Date 16/06/17
Reviewed by GMV, PSNC, RoEduNet, UOXF
Dissemination Level PU
Contact Person EC Georgios Kaiafas
Contributing Partners
1. AIT, ITTI - Authors
2. GMV, PSNC, RoEduNet, UOXF - reviewers
Project Number: 700071 D4.1 Context Awareness System
PROTECTIVE Revision History 2
Revision History Revision By Date Changes
F AIT 16/6/17 Corrected minor format errors
E AIT 15/05/17 Release to REA
A3 AIT 10/5/17 Feedback from UOXF. Updates to Chapter 1& 2
A2 AIT, ITTI 8/5/17 Incorporating feedback from GMV, PSNC, RoEDUNET, AIT, UOXF. Improving content and readability throughout document.
A1 AIT, ITTI 25/04/17 Ready for Internal Review

Project Number: 700071 D4.1 Context Awareness System
PROTECTIVE Terminology 3
Terminology Organisation Mission A set of activities to achieve purpose or goal
Mission Impact Criteria Organisation drivers that will be used to evaluate the impacts of risk to the organisations mission/ business objectives
Abbreviation’s List
AHP Analytic Hierarchical Process
API Application Programming Interface
ASM Asset State Management
BIA Business Impact Analysis
BPMN Business Process Modelling Notation
CA Context Awareness
CMDB Configuration Management Data Base
CVE Common Vulnerabilities and Exposures
CSIRT Computer Security Incident Response Team
CVSS Common Vulnerability Scoring System
CRR Cyber Resilience Review
ENISA European Network and Information Security Agency
FES Front-end Server
GDP Gross Domestic Product
ICT Information and Communication Technology
IDS Intrusion Detection System
IT Information Technology
MCDA Multiple Criteria Decision Analysis
NVD National Vulnerability Database
MAIR Mission and Asset Information Repository
MDG Mission Dependency Graph
MIM Mission Impact Management
NREN National Research and Education Network
OVDB Ontology Vulnerability Data Base
PII Personally Identifiable Information
SCADA Supervisory Control and Data Acquisition
SME Small Medium Enterprise
SME Subject Matter Expert
WSM Weighted Sum Model

Project Number: 700071 D4.1 Context Awareness System
PROTECTIVE Executive Summary 4
Executive Summary This document describes the PROTECTIVE Context Awareness (CA) system. The CA system provides
the situational knowledge that enables asset criticality to be determined when assessing the priority
of security (meta) alerts. The system provides information about the importance of an asset to the
mission or business of the organisation and the current vulnerability management state of the asset
in response to queries from the PROTECTIVE prioritisation subsystem. It consists of three subsystems
i) the Mission Impact Management (MIM) subsystem, ii) the Asset State Management (ASM)
subsystem and iii) the Mission and Asset Information Repository (MAIR).
Mission impact research originated in the military domain but has recently become more widespread
in the civil cybersecurity domain also as situational awareness research grows in significance therein.
Existing research approaches are summarised in Chapter 2 and a methodology based on the use of
Mission Dependency Graphs (MDG) to conduct mission impact assessment for the PROTECTIVE
community is described. Example worksheets are included in the Annexes.
Asset state research focuses on asset configuration and, vulnerability assessment including patch
levels and vulnerabilities relevant to the asset software and hardware. Chapter 3 describes related
research and overviews the PROTECTIVE approach which is based on the use of semantic web
ontology technology.
The CA system also includes an asset database (MAIR) that consists of information imported from
other, i.e. non-PROTECTIVE, organisation asset repositories. This database is used by both CA
subsystems. Chapter 4 describes the MAIR architecture and the mission impact meta-model which
defines both the PROTECTIVE MDG and the data base model. It also describes the relationship
between asset state ontology and meta-model.
.
Project Number: 700071 D4.1 Context Awareness System
PROTECTIVE Executive Summary 5
REVISION HISTORY ....................................................................................................................... 2
TERMINOLOGY............................................................................................................................. 3
ABBREVIATION’S LIST ................................................................................................................... 3
EXECUTIVE SUMMARY ................................................................................................................. 4
1 INTRODUCTION ...................................................................................................................... 6
2 CA: MISSION IMPACT ASSESSMENT ......................................................................................... 7
2.1 BACKGROUND ......................................................................................................................... 7
2.2 MISSION IMPACT ASSESSMENT GUIDELINES ................................................................................. 14
2.3 IDENTIFY SECURITY OBJECTIVES, SERVICES AND ASSETS .................................................................... 15
2.4 ASSESSING DEPENDENCY PRIORITY ............................................................................................ 21
2.5 USEFUL READING ................................................................................................................... 24
3 CA: ASSET STATE MANAGEMENT .......................................................................................... 25
3.1 METHODS FOR ASSESSMENT OF TECHNICAL VULNERABILITIES AND RELATED CHALLENGES ......................... 25
3.2 RESEARCH LANDSCAPE ............................................................................................................ 27
3.3 CONCLUSIONS AND CONCEPT SUMMARY ...................................................................................... 30
4 CA: MISSION AND ASSET INFORMATION REPOSITORY ........................................................... 34
4.1 MAIR OVERVIEW .................................................................................................................. 34
4.2 MAIR META-MODEL .............................................................................................................. 36
5 CONCLUSION ........................................................................................................................ 39
6 REFERENCES ......................................................................................................................... 40
ANNEX A NREN MISSION IMPACT ASSESSMENT QUESTIONNAIRE ............................................... 43
ANNEX B SERVICE PROFILE CATALOGUE ...................................................................................... 45
ANNEX C ASSET PROFILE CATALOGUE ......................................................................................... 46
ANNEX D PAIRWISE COMPARISON WORKSHEET ......................................................................... 47
ANNEX E DECISION MATRIX WORKSHEET ................................................................................... 48
Project Number: 700071 D4.1 Context Awareness System
PROTECTIVE 6
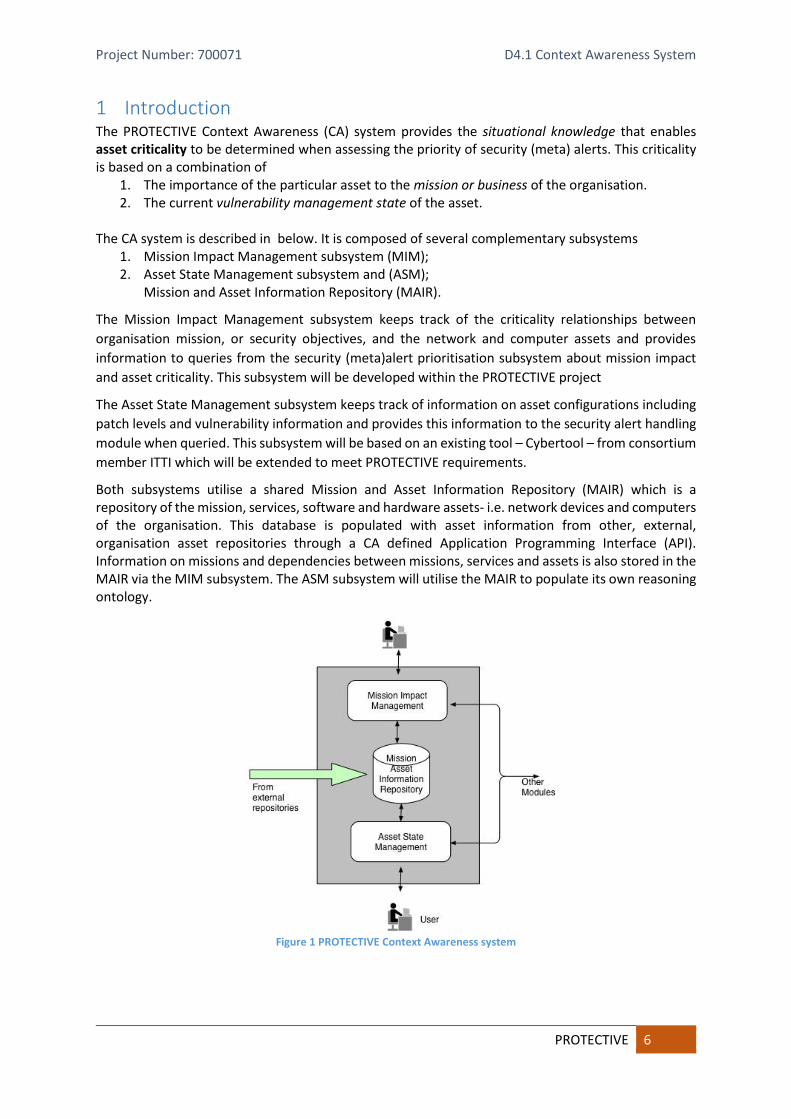
1 Introduction The PROTECTIVE Context Awareness (CA) system provides the situational knowledge that enables asset criticality to be determined when assessing the priority of security (meta) alerts. This criticality is based on a combination of
1. The importance of the particular asset to the mission or business of the organisation. 2. The current vulnerability management state of the asset.
The CA system is described in below. It is composed of several complementary subsystems
1. Mission Impact Management subsystem (MIM); 2. Asset State Management subsystem and (ASM);
Mission and Asset Information Repository (MAIR).
The Mission Impact Management subsystem keeps track of the criticality relationships between
organisation mission, or security objectives, and the network and computer assets and provides
information to queries from the security (meta)alert prioritisation subsystem about mission impact
and asset criticality. This subsystem will be developed within the PROTECTIVE project
The Asset State Management subsystem keeps track of information on asset configurations including
patch levels and vulnerability information and provides this information to the security alert handling
module when queried. This subsystem will be based on an existing tool – Cybertool – from consortium
member ITTI which will be extended to meet PROTECTIVE requirements.
Both subsystems utilise a shared Mission and Asset Information Repository (MAIR) which is a repository of the mission, services, software and hardware assets- i.e. network devices and computers of the organisation. This database is populated with asset information from other, external, organisation asset repositories through a CA defined Application Programming Interface (API). Information on missions and dependencies between missions, services and assets is also stored in the MAIR via the MIM subsystem. The ASM subsystem will utilise the MAIR to populate its own reasoning ontology.
Figure 1 PROTECTIVE Context Awareness system

Project Number: 700071 D4.1 Context Awareness System
PROTECTIVE CA: Mission Impact Assessment 7
The CA subsystems is part of the Enrichment subsystem in the PROTECTVE node structure – see Figure 1Figure 2 below:
VisualisationVisualisation
Enrichment
Database
Ingestion
Meta-AlertPrioritisation
Threat Intelligence
Sharing
User Interface Launchpad
AnalysisModules
Visualisation
Reporter
Enriched/Meta-Alert
Queue
PROTECTIVE Node
External Sources
IDEA alert format
External alert format
Human advisory format
To ProtectiveNodes
To External TI Systems
IDS
Figure 2 PROTECTIVE Node Architecture
The CA subsystem is used to annotate the received alerts to assist the prioritisation of the generated meta-alerts and thus help to increase the Computer Security Incident and Response Team (CSIRT) situational awareness levels. A complete description of the PROTECTIVE node operation is given in D2.1.
The rest of the document gives a comprehensive description of the CA subsystem components. Chapter 2 describes the mission impact background and approach as well as giving guidelines on how to conduct a mission impact assessment. Chapter 3 describes the asset state background and approach and gives an overview of the proposed ASM subsystem design. Chapter describes the MAIR which defines both the assets data base entities and the mission impact dependency schema.
2 CA: Mission Impact Assessment
2.1 Background
Asset criticality is a measure of how important the computer or network node or the information
residing on them, is to the daily operation of the business, or mission, of the organisation i.e. if these
nodes are impacted by a security attack then they have a major impact on the business mission.
Servers that host business critical applications or information must be protected with the highest
priority as must the network connections that enable clients to reach them. Furthermore, in a

Project Number: 700071 D4.1 Context Awareness System
PROTECTIVE CA: Mission Impact Assessment 8
situation where CSIRTs must struggle with large volumes of security alerts it is essential to focus on
the most important assets.
In a large organisation, it can however be difficult to identify these assets since networks are large and
subject to change and different parts of the business organisation may have different points of view
on what is important. It is therefore necessary to establish a means or methodology to derive such
information if asset prioritisation is required by the organisation. In this section, we describe the
principal issues to consider when assessing this mission impact and outline two different approaches
to address this problem. We select one approach for PROTECTIVE and describe a methodology to
enable the CSIRT to conduct a mission impact assessment.
2.1.1 Introduction
According to Amico , (Amico & Goodall, 2009) a mission is “a combination of tasks to achieve a
common goal” while for Jakobson (Jakobson G. , 2014) it is a “goal directed structured order of space
and time bound actions to resolve the operational situation in favour of the agent that is conducting
the mission or the business process.”. The key take-away is that a mission is always a combination of
action/task/process and goal. However, in many parts of the literature, e.g. (NIST, 2012), the goal is
often implicit and the term mission is often a synonym for process or task. For our purposes, an
organisation’s missions define the “set of activities to achieve a particular purpose or goal”. Depending
on the specific context a mission may be short term to achieve a tactical goal or long term to achieve
strategic goals
In commercial organisations, a mission is generally considered as a strategic concept while business
functions/processes are more usually used to describe the operational activities of short term nature,
whereas in military or security related organisations mission refers to both short and longer term
activities. An organisation may have many different, sometimes competing, goals which in turn can be
supported by different missions - a side effect of this is that a mission may contain other missions.
Missions/business functions are in turn supported by Information Technology (IT) infrastructure in
order to achieve their operational goals. Security threats to particular IT assets may therefore impact
upon the missions and business functions that the assets support and this impact may in turn be
propagated to the organisation business goals that the mission supports. Since a number of different
IT assets may be subject to a threat at the same time a knowledge of which asset is most “mission
critical” can help an analyst from the security team analyst to react accordingly to priorities derived
from the inclusion of that information. Consequent ranking of these priorities allows the analyst to
determine which threatened asset to deal with first.
A good description of the risk relationships between an organisation’s objectives, mission and
information technology (IT) is given by NIST (NIST, 2012) – cf. Figure 3. The levels defined there are:
• Organisation – defines the strategic goals and objectives of the organisation and sets the context for all risk management activities carried out by an organization. It defines the organisational strategic risk approach identifies the key mission functions and formulates the operational policy within which to conduct risk management. From a risk assessment viewpoint, the determination of the relative importance of the missions/business functions is a key role of this layer. The greater the criticality of organizational missions and business functions, the greater the necessity for organizations to ensure that risks are adequately managed.

Project Number: 700071 D4.1 Context Awareness System
PROTECTIVE CA: Mission Impact Assessment 9
Figure 3 Multi-tiered Risk Management [after NIST, 2012]
• Mission/Business Process - risk management activities at this layer include: (i) defining the mission/business processes needed to support the missions and business functions of organizations; (ii) prioritizing the mission/business processes with respect to the strategic goals and objectives of organizations; (iii) defining the types of information needed to successfully execute the mission/business processes, the criticality/sensitivity of the information, and the information flows both internal and external to organizations.
• Information System – this layer encompasses the computing, networking and storage assets as well as the associated software applications and middleware that enable process execution (process layer) to realise the business objective of the organisation layer. Risk assessment at this layer is tactical and includes the identification of threats and vulnerabilities that are likely to arise from the nature of the information systems infrastructure technologies and topology.
An important corollary of Figure 3 is that risk is hierarchical and interconnected creating dependencies
between the different levels i.e. the model can be used to identify dependencies and to construct
mission-asset dependency graphs. Thus, mission criteria can be propagated down the risk hierarchy
in order to understand the criticality of information system assets to the organisation missions and
goals. Conversely risks at the information system layer can be propagated/aggregated up the risk
hierarchy in order to assess organisational risk.
Mission impact modelling has its roots in both military and commercial domains, though formal
research has been more active in the former. In the commercial domain, such modelling often takes
the form of Business Impact Analysis (BIA) - which is normally conducted either as part of a risk
assessment or a business continuity assessment (Swanson & al., 2010). Although the use of the term
‘mission’ is not often used in commercial organisations we prefer to retain mission in this document
in preference to business since we feel it gives a more precise meaning to the role of public sector
organisations such as National Research and Education Network (NREN) service providers.
2.1.2 Impact Assessment Approaches
Mission impact assessment is a process of identifying and recording the dependencies between
missions and the IT assets that support them. The outcome of such a process is the mission
dependency graphs (MDG)
Dependency mapping may be carried out to support different types of risk assessment such as
• Threat oriented – this assessment focuses on how an adversary could exploit technical and

Project Number: 700071 D4.1 Context Awareness System
PROTECTIVE CA: Mission Impact Assessment 10
non-technical aspects of a system to produce adverse effects. It starts with identification of threat events and threat sources, (Jakobson G. , 2011), (Holsopple & Yang, 2013).
• Vulnerability oriented – this assessment aims to gauge how risk might arise to the systems from an identified set of vulnerabilities within the system through exploitation by relevant threat events, (Jiang, Ding, Zhai, & Yu, 2015).
• Asset oriented – this focuses on the assets that must be protected from threats i.e. on the identification of system components as well as their interconnections and dependencies. Assets are generally assigned a criticality metric to denote their importance. Such an assessment may arise because of a business or mission impact analysis (Kim, Kang, Luo, & Velazazquez, 2014),
• Mission or objective oriented – In this case the risk assessment focuses on the mission or business objectives that must be achieved despite the presence of threats. This assessment entails defining risk relationships between mission objectives and information system assets, (Watters, Morrissey, & Powers, 2009) (Suh & Han, 2003), (Innerhoffer-Oberperfler & Breu, 2006).
Mission impact assessments are either process-driven or artefact-driven (Schulz, Kotson, & Zipkin,
2015). The process-driven analyses are typically conducted manually by subject matter experts
(SMEs), who identify both the risk measurement criteria and the assets that support the mission. The
main advantage of this approach is that the SME’s have an in-depth understanding of the whole terrain
including mission, processes and supporting assets and the interactions between them. Another
advantage is that since the graph is produced by humans it is considerably easier to understand than
one produced by automated processes. The main drawback is that the process is manual and
therefore time-consuming and expensive. Furthermore, locating suitable experts to provide the
information is not always easy or indeed possible. Another drawback is that the graph produced is
static since it is produced at a particular point in time. Process driven analyses are often a component
part of risk assessments methodologies such as that of (NIST, 2012). Examples of process driven
approaches described in the literature include (Watters, Morrissey, & Powers, 2009), (Suh & Han,
2003), (Innerhoffer-Oberperfler & Breu, 2006).
The artefact-driven approaches use logs and data from hosts and network equipment to draw inferences about the usage of network assets. However, it may be difficult to correctly infer the nature of mission through this approach, as it can be difficult to find data sources that can reveal the missions, processes, and tasks. The two most common strategies are to link assets to missions by pivoting through the workforce, or to infer the missions through the clustering of assets or employees, coupled with semantic analysis of document or network content. The quality of the output is highly dependent on the quality of the available data, as well as the quality of the algorithms used to draw the inferences. Maps created with this bottom-up approach can be hard for humans to interpret because the results can be both noisy and incomplete. The advantage is that with suitable algorithms, generating graphs is much faster and less labour intensive. Data-driven techniques enable discovery of new assets as they join the network. They are also able to identify hidden dependencies that may elude even the most expert SME. Examples in the literature include (Jiang, Ding, Zhai, & Yu, 2015), (Dai, Sun, Liu., & Giacobe, 2012), (Kim, Kang, Luo, & Velazazquez, 2014).
Due to the largely static mission nature of the NREN service provider environment we have opted
for a process-driven assessment approach for PROTECTIVE.
2.1.3 Mission Dependency Graphs
Mission dependency graphs are generated as the output of mission/business impact assessment that
is, in turn, part of a risk assessment process such as that described in (NIST, 2012). The first step in the
Project Number: 700071 D4.1 Context Awareness System
PROTECTIVE CA: Mission Impact Assessment 11
mission assessment process is to identify and rank the critical organisational mission impact criteria1
that can be impacted by attacks on the IT infrastructure. These take the form of key business
objectives or security objectives (e.g. loss of reputation etc.). These objectives form the topmost layer
of the MDG. The ranked objectives define a prioritisation order that is propagated or trickled down
the graph to the lowest asset level to help define the asset criticality and so aid the meta-alert
prioritization process.
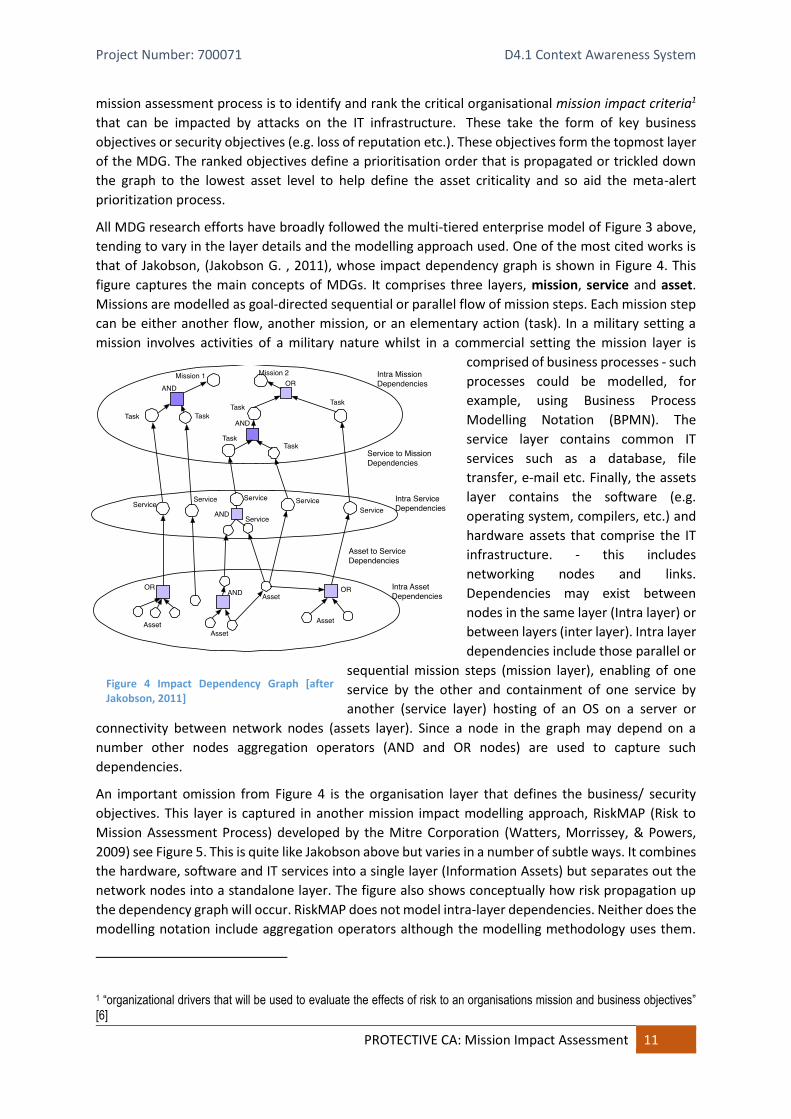
All MDG research efforts have broadly followed the multi-tiered enterprise model of Figure 3 above,
tending to vary in the layer details and the modelling approach used. One of the most cited works is
that of Jakobson, (Jakobson G. , 2011), whose impact dependency graph is shown in Figure 4. This
figure captures the main concepts of MDGs. It comprises three layers, mission, service and asset.
Missions are modelled as goal-directed sequential or parallel flow of mission steps. Each mission step
can be either another flow, another mission, or an elementary action (task). In a military setting a
mission involves activities of a military nature whilst in a commercial setting the mission layer is
comprised of business processes - such
processes could be modelled, for
example, using Business Process
Modelling Notation (BPMN). The
service layer contains common IT
services such as a database, file
transfer, e-mail etc. Finally, the assets
layer contains the software (e.g.
operating system, compilers, etc.) and
hardware assets that comprise the IT
infrastructure. - this includes
networking nodes and links.
Dependencies may exist between
nodes in the same layer (Intra layer) or
between layers (inter layer). Intra layer
dependencies include those parallel or
sequential mission steps (mission layer), enabling of one
service by the other and containment of one service by
another (service layer) hosting of an OS on a server or
connectivity between network nodes (assets layer). Since a node in the graph may depend on a
number other nodes aggregation operators (AND and OR nodes) are used to capture such
dependencies.
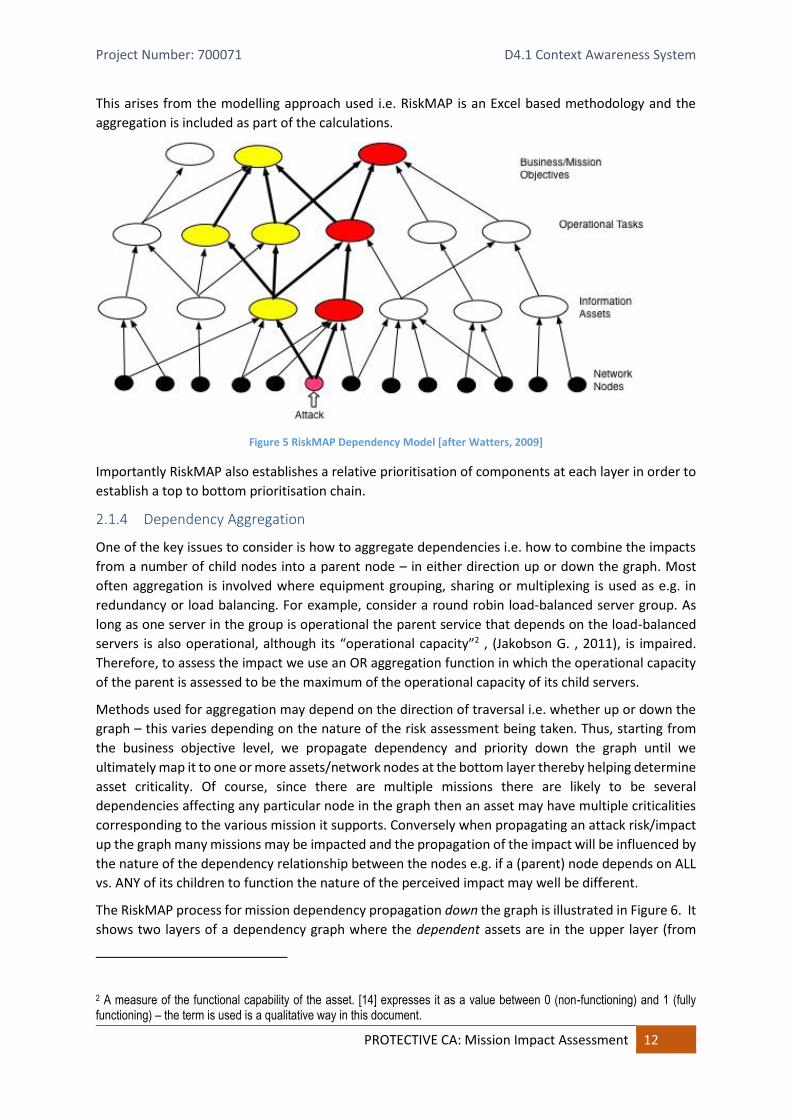
An important omission from Figure 4 is the organisation layer that defines the business/ security
objectives. This layer is captured in another mission impact modelling approach, RiskMAP (Risk to
Mission Assessment Process) developed by the Mitre Corporation (Watters, Morrissey, & Powers,
2009) see Figure 5. This is quite like Jakobson above but varies in a number of subtle ways. It combines
the hardware, software and IT services into a single layer (Information Assets) but separates out the
network nodes into a standalone layer. The figure also shows conceptually how risk propagation up
the dependency graph will occur. RiskMAP does not model intra-layer dependencies. Neither does the
modelling notation include aggregation operators although the modelling methodology uses them.
1 “organizational drivers that will be used to evaluate the effects of risk to an organisations mission and business objectives” [6]
Figure 4 Impact Dependency Graph [after Jakobson, 2011]
Project Number: 700071 D4.1 Context Awareness System
PROTECTIVE CA: Mission Impact Assessment 12
This arises from the modelling approach used i.e. RiskMAP is an Excel based methodology and the
aggregation is included as part of the calculations.
Figure 5 RiskMAP Dependency Model [after Watters, 2009]
Importantly RiskMAP also establishes a relative prioritisation of components at each layer in order to
establish a top to bottom prioritisation chain.
2.1.4 Dependency Aggregation
One of the key issues to consider is how to aggregate dependencies i.e. how to combine the impacts
from a number of child nodes into a parent node – in either direction up or down the graph. Most
often aggregation is involved where equipment grouping, sharing or multiplexing is used as e.g. in
redundancy or load balancing. For example, consider a round robin load-balanced server group. As
long as one server in the group is operational the parent service that depends on the load-balanced
servers is also operational, although its “operational capacity”2 , (Jakobson G. , 2011), is impaired.
Therefore, to assess the impact we use an OR aggregation function in which the operational capacity
of the parent is assessed to be the maximum of the operational capacity of its child servers.
Methods used for aggregation may depend on the direction of traversal i.e. whether up or down the
graph – this varies depending on the nature of the risk assessment being taken. Thus, starting from
the business objective level, we propagate dependency and priority down the graph until we
ultimately map it to one or more assets/network nodes at the bottom layer thereby helping determine
asset criticality. Of course, since there are multiple missions there are likely to be several
dependencies affecting any particular node in the graph then an asset may have multiple criticalities
corresponding to the various mission it supports. Conversely when propagating an attack risk/impact
up the graph many missions may be impacted and the propagation of the impact will be influenced by
the nature of the dependency relationship between the nodes e.g. if a (parent) node depends on ALL
vs. ANY of its children to function the nature of the perceived impact may well be different.
The RiskMAP process for mission dependency propagation down the graph is illustrated in Figure 6. It
shows two layers of a dependency graph where the dependent assets are in the upper layer (from
2 A measure of the functional capability of the asset. [14] expresses it as a value between 0 (non-functioning) and 1 (fully functioning) – the term is used is a qualitative way in this document.

Project Number: 700071 D4.1 Context Awareness System
PROTECTIVE CA: Mission Impact Assessment 13
whence the directed edges emanate) and the depended_on (where the arrows terminate) asset is in
the lower layer. The values of the assets are depicted as vi and the degree of dependency between
nodes i and j is wij, where i, j are arbitrary nodes, 0<= i, j <n, and where n is the total number of nodes
in the tree.
For the figure for the nodes a, b, c, d
vd = f ((a, wad), (b, wbd) (c, wcd))
and the question of propagation then becomes one of determining the function f. For RiskMAP the
typical functions used are
• the “SUM” method which is used if one wishes to show both the degree of dependency (the
number of dependency paths from Business Objective to
Network Node and their criticality) and the priority (based
on Objective relative weight). The Network Node relative
weight can be considered as the sum of all dependency
paths (from each Objective to the Node), each path
multiplied by the relative weight of the Objective that it
supports.
• The “MAX” method is used if one wishes to identify
the cases where a Node is most critical to a Business
Objective, there is another way to calculate and portray Node relative
weight – that being to show only the maximum of the products of
dependency path and Objective relative weight.
We thus have
(a) vd = SUM((va*wad), (vb*wbd), (vc*wad)) OR
(b) vd = MAX((va*wad), (vb*wbd), (vc*wad))
More generally some researchers explicitly include an aggregation operator as a separate node type
in the graph. This approach is exemplified by Jakobson, (Jakobson G. , 2011), (Figure 4 above) and by
Holsopple, (Holsopple & Yang, 2013). The aggregation operator combines the inputs of its children
according to the specified function and propagates the aggregated value to its parent node. A wide
range of aggregation function operators can be used. The most common are:
• AND - this operator combines ALL its child inputs to generate the parent output. The actual combination method can vary between researchers. In the RiskMAP example above the AND is realised by the SUM function. For Jakobson who is concerned with the “operational capacity” of a node, AND is calculated by choosing the minimum value amongst the child nodes on the basis of the rule that “a chain is only as strong as its weakest link”. On the other hand, and for the same reason, for Holspopple, who is concerned with propagating impact, AND is realised by choosing the maximum value amongst the child nodes;
• OR - this operator addresses the situation where the functioning of a node depends on any one of its child nodes. For RiskMAP this is realised by the MAX function while Jakobson uses an averaging function. Holspopple chooses the minimum impact value - again using the “weak link” rule above.
Additionally, Holspopple, (Holsopple & Yang, 2013), proposes a general approach to aggregation based on Yager operators that allows the choice of arbitrary aggregation operators. In addition to the ones listed above he cites as examples
Figure 6 Dependency propagation in RiskMAP
Project Number: 700071 D4.1 Context Awareness System
PROTECTIVE CA: Mission Impact Assessment 14
• Weighted Minimum – a form of OR function. This can be used when the degradation of the functionality of the child will minimally impact the mission;
• Weighted Maximum – a form of AND function. This can be used when it is highly desirable for all children to be fully functional, but the mission isn’t completely non-functional when a child goes down;
• Average - essentially captures a “consensus” between the children; • At least “n” - capture the situation where a minimum number of children are required to
complete a mission.
2.2 Mission Impact Assessment Guidelines
Based on the above analyses we develop a set of guidelines for PROTECTIVE members to conduct
mission impact assessments. The development of these guidelines has been guided by two
overarching goals
1. Ease of use; 2. Reuse of best practice i.e. not reinventing the wheel.
The adoption of the mission impact assessment methodology must represent a trade-off between
richness of the output and the ease of use for personnel in conducting the review. In line with the
approach of other risk assessment methodologies (Caralli, Stevens, Young, & Wilson, 2007), (US-CERT,
2016) (Mitre Corporation, 2017) we have opted for simplicity of use at the expense of sophistication.
As outlined earlier our approach is process-driven rather than artefact-driven i.e. a manual, semi-static
rather than a more dynamic and complex one. The motivation for this includes the fact that, for our
primary NREN audience,
• the provision of services is the primary goal and the nature and deployment of these services is not changing very often.
• offered services are often of a coarse granularity e.g. Video conferencing, and depend on a relatively small number of assets.
• the development of a comprehensive dynamic service dependency map will entail very fine grained asset and service enumeration and likely require the integration of many different inventory systems and the development of bespoke enumeration agents (or alternately the purchase of a commercial Configuration Management Database (CMDB) system). These activities are beyond the resourcing reach of many NREN’s.
We also aim to reflect industry best practises to the greatest extent possible and therefore refer
extensively to related literature from various industry groupings and regulatory agencies – European
and otherwise. This means that where possible we refer to existing procedures that could be applied
to conduct a particular assessment step.
Before conducting the assessment, it is necessary to decide what the structure of the MDG will be i.e.
to identify the layers of the graph. The main elements (goals, mission, service, process, task, asset etc.)
can be seen from Figures 2, 3 and 4. From this we propose the following general layers in a top to
bottom order
1. Business Security Objectives – what are the impact criteria for the organisation (see
discussion in next section).
2. Mission – “business” goals of the organisation e.g.” provide videoconferencing service to
constituents”.
3. Service – functional capability made available to users (which could be to other services as
well as human users).
4. Asset – physical or virtual device that provides the service.
Project Number: 700071 D4.1 Context Awareness System
PROTECTIVE CA: Mission Impact Assessment 15
These are discussed further in Chapter 4 when describing the CA meta-model.
Based on these goals we define an iterative two-step methodology to develop a mission dependency
map:
1. Identify the security objectives, services and assets of the organisation. a. Identify impact criteria b. Identify services and their dependencies c. Identify supporting assets
2. Identify and weight the dependencies between these entities.
2.3 Identify security objectives, services and assets
As pointed out earlier information security risk management is always performed in the context of the
business or mission of the organisation. One of the key security risk management activities is therefore
to identify the principal business security objectives for the organisation (Innerhoffer-Oberperfler &
Breu, 2006). These form an abstract high level definition of the goals of the security management
effort and are expressed in terms of mission impact criteria i.e. “organizational drivers that will be
used to evaluate the effects of a risk to an organization’s mission and business objectives” (Caralli,
Stevens, Young, & Wilson, 2007). Examples can be found in Table 1 and Table 2 below.
These are the areas of greatest risk to the organisation achieving its business goals/fundamental
mission. It goes without saying that the mission and goals of the organisation must be defined and
clear in order to perform an impact assessment. Once mission impact criteria have been defined the
next step in the process is normally to identify the business functions/critical services that, if attacked
or damaged, could impact the mission. This process is applied recursively through the various
supporting IT layers to identify other subsidiary services and assets. This approach is staple to almost
all mission dependency approaches, (Watters, Morrissey, & Powers, 2009), (Jakobson G. , 2011), (ISO,
2011).
However, for service provider organisations the process of mission impact identification and
identification of critical services is not quite so linear. here the provision of services is part of the
organisation mission and hence the identification of impact criteria and critical services are mutually
dependent. Some iterations of both steps may therefore be required to complete the mission
dependency graph. This should be borne in mind when reading the rest of this chapter,
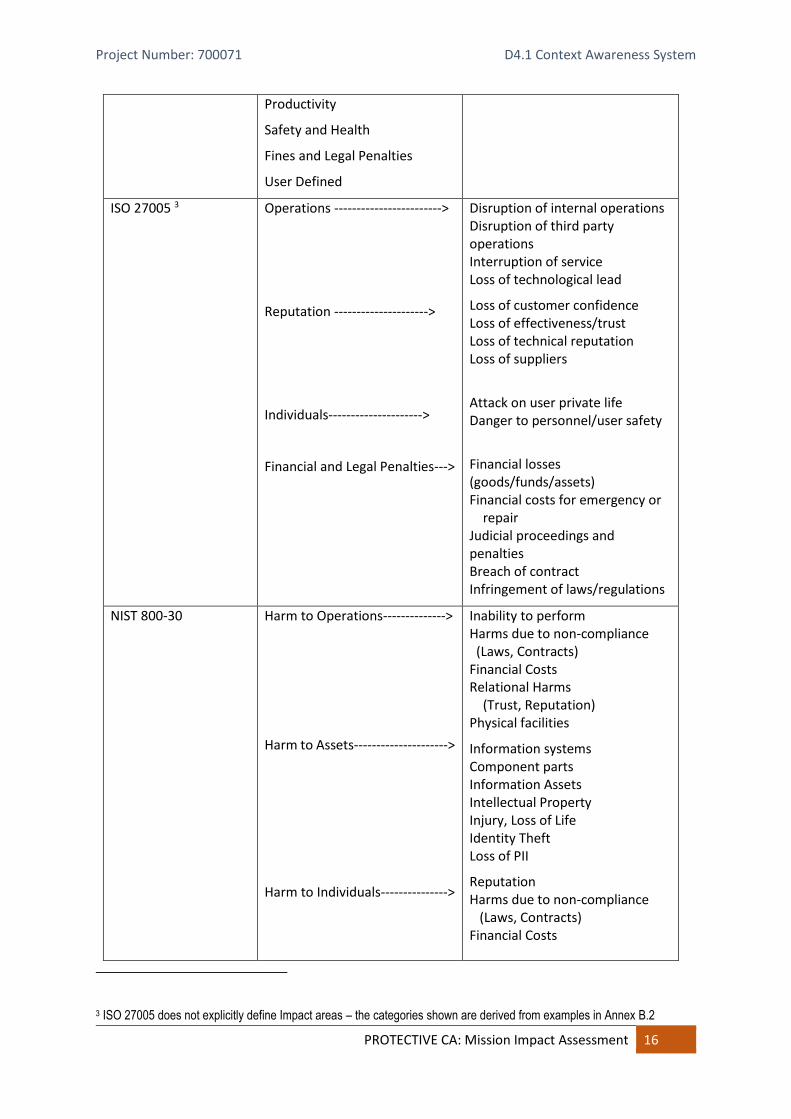
2.3.1 Identify Mission Impact Criteria
Mission impact criteria vary from sector to sector as for example between military, commercial and
infrastructure services provision. Individual risk management methodologies, (NIST, 2012), (Swanson
& al., 2010), (Caralli, Stevens, Young, & Wilson, 2007) tend to have their own approach to the
definition of such criteria – each supplies a predefined set but includes the possibility to define domain
or organisation specific criteria. We reproduce the main impact areas from (NIST, 2012), (Watters,
Morrissey, & Powers, 2009), (US-CERT, 2016), below:
Table 1 Impact Criteria
Risk Assessment Approach
Impact Areas Impact types
OCTAVE Reputation and Customer Confidence
Financial
Project Number: 700071 D4.1 Context Awareness System
PROTECTIVE CA: Mission Impact Assessment 16
Productivity
Safety and Health
Fines and Legal Penalties
User Defined
ISO 27005 3 Operations ------------------------>
Reputation --------------------->
Individuals--------------------->
Financial and Legal Penalties--->
Disruption of internal operations Disruption of third party operations Interruption of service Loss of technological lead
Loss of customer confidence Loss of effectiveness/trust Loss of technical reputation Loss of suppliers
Attack on user private life Danger to personnel/user safety
Financial losses (goods/funds/assets) Financial costs for emergency or repair Judicial proceedings and penalties Breach of contract Infringement of laws/regulations
NIST 800-30 Harm to Operations-------------->
Harm to Assets--------------------->
Harm to Individuals--------------->
Inability to perform Harms due to non-compliance (Laws, Contracts) Financial Costs Relational Harms (Trust, Reputation) Physical facilities
Information systems Component parts Information Assets Intellectual Property Injury, Loss of Life Identity Theft Loss of PII
Reputation Harms due to non-compliance (Laws, Contracts) Financial Costs
3 ISO 27005 does not explicitly define Impact areas – the categories shown are derived from examples in Annex B.2

Project Number: 700071 D4.1 Context Awareness System
PROTECTIVE CA: Mission Impact Assessment 17
Harm to Other Organisations-->
Harm to the Nation--------------->
Relational Harms (Trust, Reputation)
Critical Infrastructure loss Loss of Continuity of Operations Relational Harms Ability to achieve Future Objectives
Private enterprises typically base their impact criteria on measures related to business objectives such
as shareholder value, customer service or operational excellence whilst public sector entities typically
base approaches on measures related to ensuring mission effectiveness or service delivery. Some
private sector focused risk assessment frameworks also include some element of service delivery
while public sector frameworks often include organisational focused criteria.
In general frameworks that have a strong public-sector influence take a more function oriented
approach because of the “sector’s ability to support the economy and national security”, (Homeland
Security, 2016). In other words, the IT sector is part of a highly-interlinked infrastructure chain with
each link in the chain providing and consuming services from each other – services are enabled
through service capabilities or functions at each link or layer. This infrastructure service approach
recognises and puts the focus on the critical role of these infrastructure systems in providing services.
This interlinking/ interdependence between communications infrastructure and other critical service
infrastructure is also explored by the European Network and Information Security Agency (ENISA),
(ENISA, 2014) , (ENISA, 2016).
According to (ENISA, 2014) identifying critical infrastructure mission impact areas can be difficult.
Impact criticality is defined as “the: (I) level of contribution of an infrastructure to society in
maintaining a minimum level of national and international law and order, public safety, economy,
public health and environment”, or (ii) “impact level to citizens or to the government from the loss or
disruption of the infrastructure.” Impact is usually evaluated with respect to three primary
characteristics that can also help guide the selection of suitable mission impact areas
• Scope or spatial distribution – the geographic area that could be affected by the loss or unavailability of a critical infrastructure.
• Severity or intensity or magnitude – the consequences of the disruption or destruction of a critical infrastructure.
• Effects of time or temporal distribution – the point that the loss of an element could have a serious impact (immediate, one to two days, one week).
On this basis (ENISA, 2014) is motivated to suggest the following general impact type examples for
critical infrastructure services.
Table 2 Critical Infrastructure Mission Impact Criteria
Criterion Title Explanation
International Relations The effect that that a service interruption will have on the relationships between the nation and 3rd countries.
Public order The effect that a service interruption may cause to the public order

Project Number: 700071 D4.1 Context Awareness System
PROTECTIVE CA: Mission Impact Assessment 18
Public operations hindered The daily operations of the public, such as going to work via public transportation, are stopped or thwarted
Population affected The percentage of the population of the MS affected from the disruption of the service
Concentration The density of the population on the geographic area affecting the service
Economic Impact The cost of service disruption in terms of GDP percentage.
Public confidence The effect that the proper operation of this service has on the public confidence towards the government
These can be combined with similar factors from (Homeland Security, 2016) and (ITSEAG, 2102) to
form a more focused Infrastructure Services impact table – see Table 3 .
Table 3 Infrastructure Services Mission Impact
Risk Assessment Approach
Impact Areas Impact types
ENISA Critical Infrastructure Assets and Services
Public confidence
International Relations
Public order
Public operations hindered
Other country services are affected
Concentration/density of population
% Population affected
Economic Impact
SCADA (Australia) People----------------------------->
Products ---------------------------->
Processes --------------------------->
Reputation ------------------------->
Users & Operators
Buildings; Networks; SCADA SW; SCADA HW; Field Devices;
Management& Control; Information management
Corporate reputation
IT Sector Specific Plan IT Products and Services
Incident Management Services
DNS Services
Identity Management Services

Project Number: 700071 D4.1 Context Awareness System
PROTECTIVE CA: Mission Impact Assessment 19
Internet Content Services
Internet Connectivity Services
Based on the earlier industry state of the art survey and noting the actual services operated by NRENs
from interviews and observation conducted during visits to NREN premises we propose the following
set of Impact Criteria as a starting point for performing a mission impact assessment for NREN and
similar service providers.
Table 4 Mission Impact Criteria for NREN's
Service Type Impact Area Impact Types
Infrastructure/
Communication Services
(DNS, IP, VOIP, etc.)
Harm to Constituents
Harm to people
Network Support Services
(Fault resolution, Help desk etc.)
Security Support Services
(Incident Management, Threat Intelligence Distribution etc.)
Internal Services/IT Processes
(Infrastructure monitoring, Service provisioning etc.
Harm to Assets
Noting the already identified iterative nature of mission dependency map development for service we
return to the topic of mission impact criteria development after the critical service identification.
2.3.2 Identify Services and their Dependencies
US_CERT defines a service as “a set of activities that the organisation carries out in performance of a
duty or in the production of a product”. Further services can be externally or internally focused.
External services (essentially equivalent to mission) are typically customer (or client) facing e.g.
provision of video-conferencing for an Internet Service Provider (such as an NREN) or Automated
Teller Machine (ATM) cash withdrawal for a bank. Internal services are the organisational activities
required to support the provision of external services.
This step includes the identification of all external facing services and the internal services to support
them as well as the dependencies i) between external services, ii) between external and internal
services and iii) between internal services.
Identifying services might seem straightforward - however establishing a list of critical services is not
always easy, especially for critical infrastructure services, (ENISA, 2014). Hints on how identify of
services (both internal and external) can be obtained from organisational documents, (US-CERT,
2016), (Arthur J. Gallagher & Co., 2014), (Financial Stability Board, 2014) , such as
Project Number: 700071 D4.1 Context Awareness System
PROTECTIVE CA: Mission Impact Assessment 20
• Strategic plans;
• Business plans;
• Contracts;
• Customer requests;
• Standard work processes.
Identified services should be identified and catalogued. This could be e.g. a spread-sheet, a
configuration managed document or a database. An example service catalogue worksheet is provided
in Appendix B.
The precise nature of service dependencies can vary depending on the nature of the service and
whether the service is external or internal. An example of an external service dependency is that given
by (D. & Haiser, 1997) which shows how a Web application service depends on a DNS service as well
as IP connectivity services. An example of dependencies between an external and internal service is
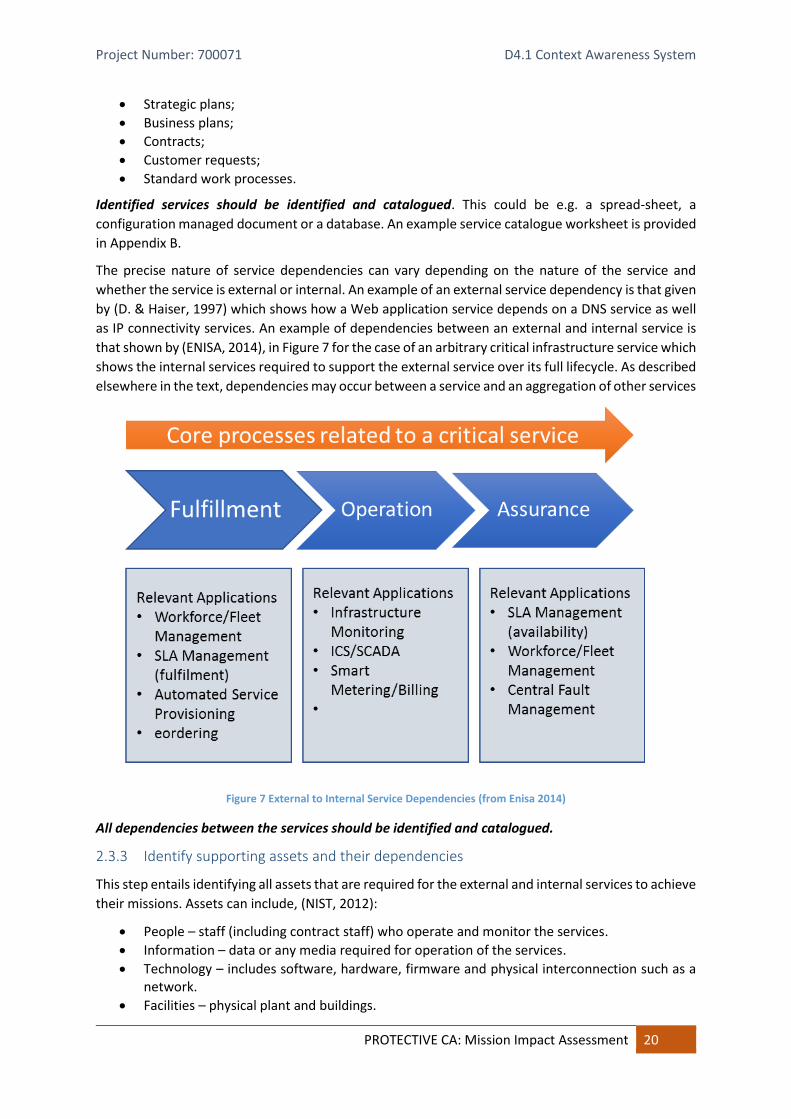
that shown by (ENISA, 2014), in Figure 7 for the case of an arbitrary critical infrastructure service which
shows the internal services required to support the external service over its full lifecycle. As described
elsewhere in the text, dependencies may occur between a service and an aggregation of other services
Figure 7 External to Internal Service Dependencies (from Enisa 2014)
All dependencies between the services should be identified and catalogued.
2.3.3 Identify supporting assets and their dependencies
This step entails identifying all assets that are required for the external and internal services to achieve
their missions. Assets can include, (NIST, 2012):
• People – staff (including contract staff) who operate and monitor the services.
• Information – data or any media required for operation of the services.
• Technology – includes software, hardware, firmware and physical interconnection such as a network.
• Facilities – physical plant and buildings.
Project Number: 700071 D4.1 Context Awareness System
PROTECTIVE CA: Mission Impact Assessment 21
This document objective concerns mostly with information and technology assets. Identified assets
should be documented and catalogued via some tool. An example spread sheet based asset catalogue
is provided in Appendix C.
Dependencies exist between services and assets and between assets and assets.
Examples of such dependencies include, (D. & Haiser, 1997)
• Execution dependency: The performance of an application server process executing on a host machine depends on the status of the host.
• Link dependency: The performance of a service offered over a network link depends on the status of the link.
• Component dependency: An example of this dependency occurs in the case of a web service that is provided collectively by multiple “front-end servers” (FESs). While a single domain name is associated with the web service, round-robin DNS scheduling is used to map subscriber requests to one of the FESs. In this case, the status of the web service depends on the status of the service provided by the individual FESs; i.e., the web service has component dependencies on the service provided by the different FESs.
• Organizational dependency: Services and/or servers may be mapped to different domains of responsibility. A dependency of this type is an organizational dependency.
All dependencies should be carefully identified and catalogued.
2.3.4 Process Output
The output from the above process is conceptually a weighted MDG of the form shown in Figure 3 or
3 as well as service and asset catalogues.
2.4 Assessing Dependency Priority
The above process yields an MDG showing the dependency links between the missions, services and
assets of the organisation. In addition to identifying dependencies most techniques for defining an
MDG also include the notion of weighting the dependency between entities to reflect the degree of
importance or criticality of the dependency. These weightings are normally expressed on a categorical
scale such as “Small, Medium, Large” or an ordinal scale from e.g. 1 to 5. Establishing a prioritised
ranking of top level mission impact criteria and trickling these priorities down through the dependency
graph is the basis of establishing asset criticality and thus a means of identifying the most important
mission critical assets and prioritising the handling of these assets in accordance with their potential to
disrupt operations should they fail (due to cyber-attack or other damage).
Researchers have used a variety of approaches to determine mission impact dependency prioritisation
including various forms of multiple criteria decision analysis, (Watters, Morrissey, & Powers, 2009), (Suh &
Han, 2003), (Kim, Kang, Luo, & Velazazquez, 2014), Bayesian Networking, (Dai, Sun, Liu., & Giacobe, 2012),
Fuzzy Cognitive maps (Szwed & Skrzynski, 2014), and , for dynamic dependency identification, graph
ranking algorithms such as Page Rank (Jiang, Ding, Zhai, & Yu, 2015).
In keeping with the process-driven mission impact assessment we have adopted, the steps to establish the
prioritised dependency mapping are
1. Establish a prioritised ranking of the security objectives.
2. Propagate this prioritisation down through the layers of the MDG.
Some of the previous process-driven research efforts have used the same, (Suh & Han, 2003)for each
step while others have used a different method at each step, (Watters, Morrissey, & Powers, 2009).
In our case, we follow the RiskMap approach i.e. in using a different method for each step.
Project Number: 700071 D4.1 Context Awareness System
PROTECTIVE CA: Mission Impact Assessment 22
2.4.1 Prioritising Security Objectives
This step is essential if prioritised treatment of critical assets is required i.e. if there is no difference of
priority between the security objectives then there are no critical assets, as all assets will have the
same value to the organisation
The most common approach to rank security objectives in process-driven mission assessment is using
some form of Multiple Criteria Decision Analysis (MCDA), (Watters, Morrissey, & Powers, 2009), (Suh
& Han, 2003). MCDA is a family of techniques, (Wikipedia, 2016)], used to evaluate conflicting criteria
when deciding. One of the more widely used such techniques is the Analytic Hierarchy Process (AHP)
(Wikipedia, 2016). AHP structures the decision problem as a hierarchy of sub-problems and then
conducts pairwise comparison of alternatives at each layer to establish a weighting for each
alternative. Weightings at higher layers are reflected down the tree to establish the final prioritisation.
AHP is used as part of the RiskMAP process, (Watters, Morrissey, & Powers, 2009), and also by Suh
and Han, (Suh & Han, 2003), while Kim, (Kim, Kang, Luo, & Velazazquez, 2014) , uses another MCDA
variant called TOPSIS and Cheng, (Cheng, 2014)describes a simplified version called Grid analysis or
Decision Matrix Analysis. In a related area, Nurse (Nurse & Sinclair, 2012) uses the Weighted Sum
Model (WSM) variant to select amongst different security actions to be applied across a number of
Enterprises in collaboration scenarios and also points out some of the complexities of using MCDM
methods in security risk management.
In all of these cases the prioritisation and weighting is determined by a panel of subject matter experts,
(SME). A notable exception to the use of the MCDA process in ranking security objectives is OCTAVE,
(Caralli, Stevens, Young, & Wilson, 2007). Here a simple ordering of priority is made without taking
any weighting into account.
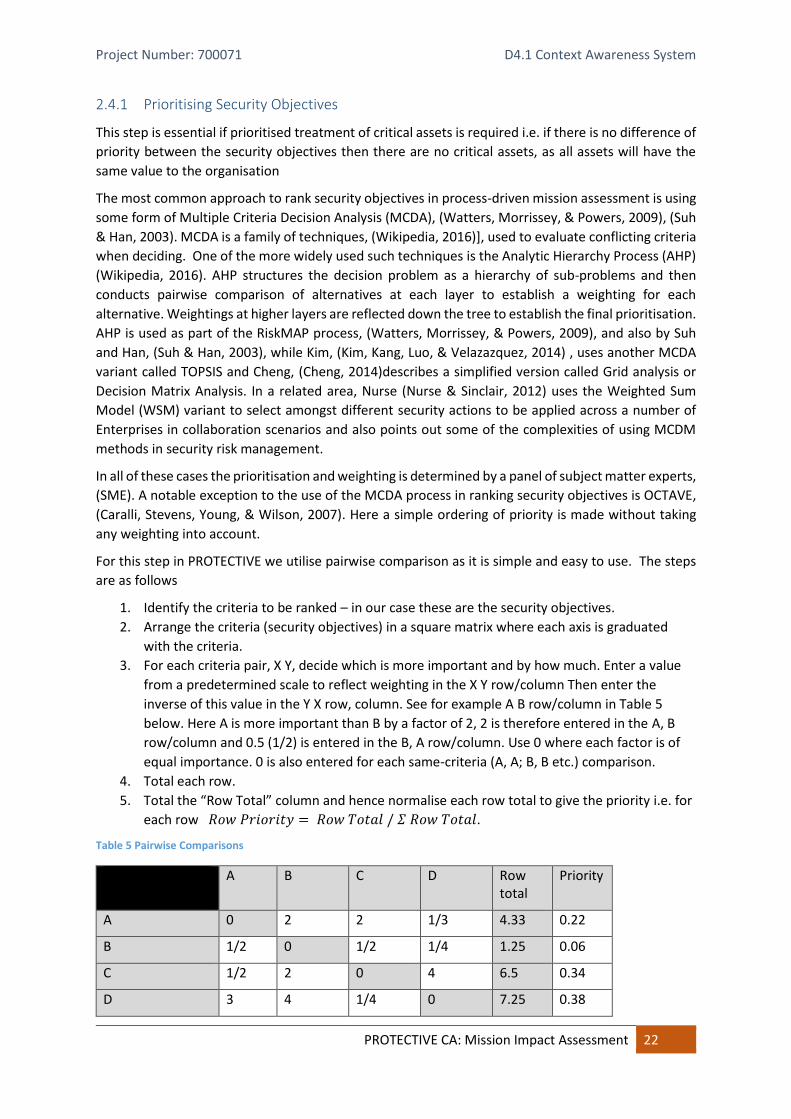
For this step in PROTECTIVE we utilise pairwise comparison as it is simple and easy to use. The steps
are as follows
1. Identify the criteria to be ranked – in our case these are the security objectives.
2. Arrange the criteria (security objectives) in a square matrix where each axis is graduated
with the criteria.
3. For each criteria pair, X Y, decide which is more important and by how much. Enter a value
from a predetermined scale to reflect weighting in the X Y row/column Then enter the
inverse of this value in the Y X row, column. See for example A B row/column in Table 5
below. Here A is more important than B by a factor of 2, 2 is therefore entered in the A, B
row/column and 0.5 (1/2) is entered in the B, A row/column. Use 0 where each factor is of
equal importance. 0 is also entered for each same-criteria (A, A; B, B etc.) comparison.
4. Total each row.
5. Total the “Row Total” column and hence normalise each row total to give the priority i.e. for
each row 𝑅𝑜𝑤 𝑃𝑟𝑖𝑜𝑟𝑖𝑡𝑦 = 𝑅𝑜𝑤 𝑇𝑜𝑡𝑎𝑙 / 𝛴 𝑅𝑜𝑤 𝑇𝑜𝑡𝑎𝑙.
Table 5 Pairwise Comparisons
A B C D Row total
Priority
A 0 2 2 1/3 4.33 0.22
B 1/2 0 1/2 1/4 1.25 0.06
C 1/2 2 0 4 6.5 0.34
D 3 4 1/4 0 7.25 0.38
Project Number: 700071 D4.1 Context Awareness System
PROTECTIVE CA: Mission Impact Assessment 23
Thus, the prioritised order for objectives A, B, C, D in this example is D, C, A, B
A Pairwise Comparison worksheet is provided in Annex D and a corresponding Excel spread-sheet will
be designed.
2.4.2 Dependency Propagation
In this step, the priorities for each entity in a layer are mapped to the dependent entities in the layer
below. This is done by combining the layer n entity priority with the weighting of the dependencies
this entity has towards the layer n-1 entities that it depends on or influences to give in turn priorities
for those layer n-1 entities. Once this has been done the process is repeated for the layer n-1 to layer
n-2 dependencies.
To do this we use a form of MCDA called Decision Matrix Analysis or Grid based Analysis (Cheng, 2014).
The steps are as follows:
1. List all the layer n entities as the row labels on a table, and list the layer n-1 as the column
headings in the table. These are the layer n-1 entities needed to achieve the mission or
security objective.
2. Specify the priority of each layer n entity using the priority calculated in the previous step.
This will be in the range 0-1 for the security objectives but possibly larger for subsequent
layers.
3. For each column, score each layer n entity/layer n-1 entity combination using the Impact
scale indicated below the table. This ranges from 0 (no impact) to 4 (failure) and indicates
the impact based on how well it impacts the parent node. These scores indicate the
criticality of the layer n-1 entities to help the layer n entity achieve its purpose.
4. Then, multiply each score from step 3 by the relative importance derived from step 2. This
will give users weighted scores for each layer n/layer n-1/factor combination.
5. Finally, add up the corresponding weighted scores for each layer n-1 entity. Entities with
higher scores are more important than the entities with lower scores. These scores now
form the basis for repeating the process for layers n-1/n-2 comparison where applicable.
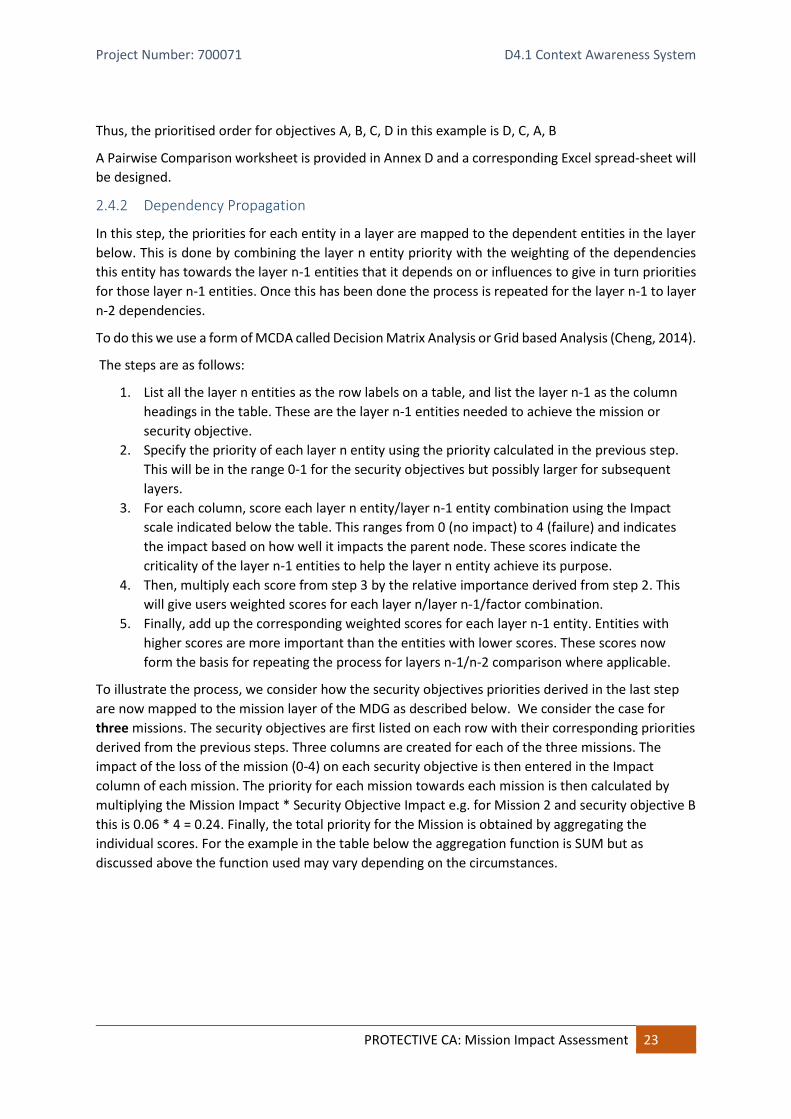
To illustrate the process, we consider how the security objectives priorities derived in the last step
are now mapped to the mission layer of the MDG as described below. We consider the case for
three missions. The security objectives are first listed on each row with their corresponding priorities
derived from the previous steps. Three columns are created for each of the three missions. The
impact of the loss of the mission (0-4) on each security objective is then entered in the Impact
column of each mission. The priority for each mission towards each mission is then calculated by
multiplying the Mission Impact * Security Objective Impact e.g. for Mission 2 and security objective B
this is 0.06 * 4 = 0.24. Finally, the total priority for the Mission is obtained by aggregating the
individual scores. For the example in the table below the aggregation function is SUM but as
discussed above the function used may vary depending on the circumstances.

Project Number: 700071 D4.1 Context Awareness System
PROTECTIVE CA: Mission Impact Assessment 24
Table 6 Decision Matrix Analysis
Asset/Service Mission 1 Mission 2 Mission 3
Security Objectives Priority Impact Priority Impact Priority Impact Priority
A 0.22 0 0 2 .44 4 .88
B 0.06 4 .24 4 .24 0 0
C 0.34 2 .68 5 1.7 0 0
D 0.38 0 0 1 .38 3 1.14
TOTAL 0.92 2.76 2.02
Impact Key 0 - No Impact
1- Minimal Impact
2 – Somewhat Impacted
3 – Substantially Impacted
4 – Failure
The process is now repeated for each layer n/n-1 mapping until the bottom layer I reached and the
final prioritisation is reached. At this stage, the Mission Impact Assessment is complete.
2.5 Useful Reading
There are several documents that may provide further insight or aid to practitioners conducting or
about to conduct a mission impact analysis exercise. These include
US-CERT Cyber Resilience Review (CRR)
The CRR, (US-CERT, 2016) is a “non-technical assessment to evaluate an organization’s operational
resilience and cybersecurity practices. The CRR may be conducted as a self-assessment or as an on-
site assessment facilitated by DHS cybersecurity professionals. The CRR assesses enterprise programs
and practices across a range of ten domains including risk management, incident management, service
continuity, and others” It consists primarily of an extensive questionnaire over the ten domains and is
supported by a number of supplementary resource materials for each of the domains. The Asset
Management supplemental resource is the most relevant for the current context. The CRR contains
an extensive set of useful information and ideas and is and easily understood.
OCTAVE Allegro
Allegro, (Caralli, Stevens, Young, & Wilson, 2007), is the latest offering of the OCTAVE family of risk
management methodologies from the Software Engineering Institute (SEI) in CMU. It is a “pragmatic”
methodology that omits much of the earlier processes and which focuses on identifying risk to
information assets. Its most direct input to the current context is in the definition of impact criteria
but the overall focus on a lightweight and efficient process coupled with extensive template examples
serves as an excellent exemplar on how to conduct risk assessments.
ENISA Documents on Critical Infrastructure
These include “Methodologies for the identification of Critical Information Infrastructure assets and
services”, (ENISA, 2014), and “Communication network dependencies for ICS/SCADA systems”,
(ENISA, 2016). These documents are aimed at identifying issues and methodologies to identify

Project Number: 700071 D4.1 Context Awareness System
PROTECTIVE CA: Asset State Management 25
services, assets and dependencies in the overlap between critical infrastructures and communications
networks. While they are somewhat high level in nature they contain valuable contextual information,
and give useful guidelines for identifying impact criteria, services and dependencies.
NIST 800 SP 34
This document, (Swanson & al., 2010), is the “Contingency Planning Guide for Federal Information
Systems”. While significantly broader in scope than the current context it contains some useful
information on conducting a business impact analysis and a BIA template - in Appendix B – that can
serve as a starting point for a tool to document dependencies.
3 CA: Asset State Management Asset state and vulnerability management is nowadays an essential part of cyberattack prevention
and the securing of IT networks and the assets composing them. Management of vulnerabilities can
also contribute to the post-incident investigation and recovery in case of malicious attack or
network/asset failure. According to MITRE (MITRE, 2016), a vulnerability is a “mistake in software that
can be directly used by a hacker to gain access to a system or network.” According to the ISO/IEC
27000-series standard, vulnerability is considered as “weakness of an asset or control can be exploited
by one or more threats” (ISO, 2016). Based on this standard, vulnerability management is an integral
part of overall IT risk management in organizations and is interrelated to the threat and asset
definition, since the weakness of an asset vulnerability could allow it to be exploited and harmed by
one or more threats.
This section presents the initial approach to vulnerabilities management as employed in PROTECTIVE.
It is important to underline that the terms “vulnerability assessment/management” and “asset state”
will be used interchangeably in this section.
3.1 Methods for assessment of technical vulnerabilities and related challenges
MITRE is the provider and administrator of the CVE (Common Vulnerabilities and Exposures) initiative,
commonly used as a reference database for publicly known cyber-security vulnerabilities. The list of
CVE vulnerabilities feeds also into the NVD (National Vulnerability Database) (NIST, 2016) database.
For CVE purposes, a software flaw can be classified as a vulnerability, if it can be used by an attacker
to violate a reasonable security policy for the given system or asset, allowing attacker to:
• execute commands as another user,
• access data that is contrary to the specified access restrictions for that data,
• pose as another entity,
• conduct a denial of service (MITRE, 2016).
As for qualitative assessment of known vulnerabilities, most approaches rely on the CVSS (Common
Vulnerability Scoring System) (CVSS) framework (FiRST, 2015) to assign scores to each known
vulnerability. CVSS scores (constituting overall score of the vulnerability) are:
• Base metrics - representing the intrinsic and fundamental i.e. not changing over time features
of the given vulnerability. Base metrics are also environment-independent, therefore the
score calculated using base metrics does not vary for e.g. different networks. Base metrics are
further divided into:
o Exploitability metrics - describing the level of exploitability and indicating “difficulty
level” for the attacker exploiting the particular vulnerability,

Project Number: 700071 D4.1 Context Awareness System
PROTECTIVE CA: Asset State Management 26
o Impact metrics – assessing the vulnerability’s impact on an asset’s confidentiality,
integrity and availability.
• Temporal metrics - scores assigned to the particular vulnerability that can change over time,
but (similarly to base metrics) not dependent on the environment. Temporal metrics are
categorized into following groups:
o Exploitability metrics – represents the current state of techniques used to exploit
vulnerability and the availability of code that could be used to exploit given
vulnerability. E.g. publicly available and easy-to-exploit code can result in a higher
number of potential attackers and increase the overall vulnerability score.
o Remediation Level – representing the availability and efficiency of patches and fixes
developed to reduce or eliminate the given vulnerability.
o Report Confidence – assessing the level of confidence and the credibility of the
known technical details describing the given vulnerability (the score is higher when
the vulnerability is known and exists with certainty).
• Environmental metrics - assessing the vulnerability based on placing it in a particular user
environment.
The ISO/IEC 27005 standard (ISO, 2011) indicates automated vulnerability scanning, discovery and
assessment is an integral part of proactive, methodical testing of ICT (Information and
Communications Technology) systems and infrastructure. It’s also defined as crucial in the well-
recognised CSC CIS 204. The automated vulnerability scanning tools can be used to scan a network or
selected network assets to find known vulnerabilities (e.g. system allows anonymous File Transfer
Protocol (FTP)). However, potential vulnerabilities identified in the network may not represent real
vulnerabilities in the wider context of the system (environment, dependencies, business processes,
security requirements). For example, misconfiguration of particular assets may be intentional,
resulting from specific environmental requirements, while many of the vulnerability scanners would
flag them as a known vulnerability. Therefore, ISO/IEC 27005 indicates the first serious challenge in
vulnerability management – different automated solutions tend to interpret various operational
circumstances as false positives.
In (Wang & Guo, OVM: An Ontology for Vulnerability Management, 2009) the authors stated that a
constant, rapid growth of new vulnerabilities was discovered every day, but also general development
of new tools, protocols and devices, impose the problem with updating vulnerability databases. What
is more important, in consequence is, this causes the challenge that vulnerability assessment metrics
do not always represent real threats associated to security flaws. Authors emphasize also the need for
definition of a classification framework able to describe vulnerabilities from various viewpoints.
Also, according to (Chejara, Garg, & Singh, 2013), simple vulnerability discovery and analysis with use
of commonly known frameworks is not enough to properly assess completely the vulnerability of a
network. Methods relying on CVE/CVSS consider vulnerabilities (i.e. find them and prioritize their
criticality) independently, since in real cases, an attacker can use more than one attack paths and
exploit more than one vulnerability subsequently or in parallel, using so-called vulnerability chaining.
Therefore, it emphasizes the need for the management of vulnerabilities considering the context of
4 https://www.cisecurity.org/controls/continuous-vulnerability-assessment-and-remediation/

Project Number: 700071 D4.1 Context Awareness System
PROTECTIVE CA: Asset State Management 27
interrelations between them, attacks profile and possible routes and the context of a given IT
environment, such as business value of the attacked assets.
3.2 Research landscape
Most scientific approaches described in literature employ CVE/CVSS frameworks to provide a view on
the vulnerabilities in a given IT environment. However, in the light of limitations and challenges
described earlier, researchers are focused on combining CVE/CVSS capabilities with other methods,
that can enrich the results of a vulnerability assessment, increase the reliability of vulnerability
scanning and better fit into real IT conditions.
One of the examples of well-known standards enhanced by other techniques is use of the semantic
description/ontology to define relations between vulnerabilities, assets, attacks, countermeasures,
etc., and to facilitate reasoning from identified relations.
In (Wang & Guo, OVM: An Ontology for Vulnerability Management, 2009) and (Wang & Guo, Security
Data Mining in an Ontology for Vulnerability Management, 2009), the authors propose an ontological
approach to describe, and then use, the fundamental concepts in cyber security, considering their
relationships. The major goal is reliable reasoning about vulnerability causes and impact on the
network. Ontology developed for purposes of the research (OVM – ontology for vulnerability
management) has been populated by the vulnerabilities existing in the NVD dataset. Additional
interference rules and knowledge representation have been implemented. Authors adopt also the
CVE (MITRE, 2017) scheme as a taxonomy for the vulnerability concept, and CVSS scores linked to NVD
content. In this research, semantic reasoning eases the automation of vulnerability management and
allows decision-makers to get vulnerability-related information in a more structured manner. Also,
such an approach enables retrieving information about similar vulnerabilities (for example impacting
the same type of assets with similar impact level), about similar assets (vulnerable to the same threats)
or similar attack paths – e.g. including the same nodes in attack graphs but exploiting different
vulnerabilities. For example, definition of similarity rules, allows us to compare a vulnerability genesis,
existence in the same IT asset, kind/route of possible exploitation, type of consequence caused by
successful exploitation, etc. and, as a result, to change the priority of one vulnerability in relation to
other ones. Therefore, the use of common methods (CVE/CVSS) enriched with semantic reasoning can
contribute to the more accurate categorization of vulnerabilities with the ability to retrieve
information about similarities and differences related to the security concepts. Additionally, it can
facilitate high-level decision making by structuring the security-related knowledge.
In (Kamongi, Kotikela, Kavi, Gomathisankaran, & Singhal, 2013) the framework called Vulcan for
vulnerability assessment in a Cloud environment is presented. One of the main components of this
framework is the Ontological Vulnerability Assessment module. This component relies on an Ontology
Vulnerability Database (OVDB) fed by knowledge about currently known vulnerabilities provided by
the NVD database, therefore the first feature of OVDB is access to a structured and conceptualized
set of listed vulnerabilities. The second feature is reasoning capabilities, i.e. automated processes of
discovering, extracting, populating of the OVDB and then mapping OVDB knowledge with external
Metasploit Auxiliary Module and Exploit Database (database of possible exploits for given
vulnerability), enhancing basic vulnerability listing.
The OVDB is populated by extraction of XML data provided by the NVD, tagging the information and
mapping particular tags to different classes and properties in the ontology. The important parts of the
architecture are system classifiers used to group (classify) classes in the ontology, depending on user
preferences, for example according to cloud computing domain, software and hardware vendors or
services. The next module is the indexer, that is software responsible for crawling the ontology
Project Number: 700071 D4.1 Context Awareness System
PROTECTIVE CA: Asset State Management 28
database and creating the knowledge index using classified ontology classes as an input. This way, the
index can include vulnerabilities grouped according to the system classifiers provided by the user. The
created vulnerability class index is the list of all vulnerabilities for the considered system that are
grouped based on vulnerability classes (provided by system classifiers). By using the vulnerability class
index, a user can for example search for vulnerabilities assigned to a specific domain or sub-domain,
e.g. to discover all vulnerabilities within defined set of software vendors, technologies or frameworks.
A disadvantage of that approach is the requirement of updating the system classifiers and re-indexing
of the ontology DB in case of any changes in the database.
Searching and semantic reasoning are enabled for a user by the SNLP (Semantic Natural Language
Processor) module offering capabilities such as pattern matching, searching based on keywords and
reasoning based on ontology class properties and relationships between classes.
The typical VULCAN use case scenario includes:
• Providing user dynamic input (e.g. Android) and a user query expressed by use of natural
language (e.g. assess vulnerabilities related to unauthorized access to my device) that is
further processed by the SNLP.
• Generation of an “Android-related” list of vulnerabilities by the system classifiers, feeding
them to the indexer module and generation of vulnerability indexes to produce vulnerability
classes (groups).
• Indexed data contain classified vulnerabilities related to Android and unauthorized access to
it, listed using CVE format.
It should be noticed that authors use also a third-party solution - Mercury framework (now Drozer
framework) (MWR, 2013) – for Android-based devices security testing to perform a kind of
penetration testing. After mapping discovered vulnerabilities onto possible exploitation routes, the
Mercury framework launches relevant attacks on the considered products (in this specific use case to
gain root access to the device). By combining the VULCAN framework with a third-party solution
capable of testing IT assets, users can be provided with valuable information about real threats,
because listed CVE vulnerabilities are immediately verified. However, the authors use only the
Mercury framework, thus the capabilities of automated penetration testing for VULCAN are limited.
Other challenges and limitations include the lack of cyber security metrics incorporated in the
framework, that could allow comparing different vendors and assets based on present vulnerabilities.
According to the publication ontology relationships among vulnerabilities require future work.
Some other approaches described in the literature use semantic reasoning in cyber security and cyber
defence tasks where vulnerability management is only a part of those approaches. For example, in
(Sadighian, Zargar, M. Fernandez, & Lemay, 2013) the authors propose a context-aware alert fusion
approach based on semantic reasoning. The main idea is to assist user security-related decisions by
providing him synthetized information reasoned by a set of ontologies and with use of a set of IDS
sensors. Information coming from sensors is enriched by the ontology containing information from
CVE and NVD databases (among other ontologies), in which vulnerabilities are grouped into three
classes based on severity - low, medium, high. In (Wu, Gandhi, & Siy, 2013), the author proposed a
semi-automated process for semantically supported annotating of CVE/CVSS information, based on
parsing of natural language vulnerability reports and machine learning techniques.
Another combination of vulnerability definition/assessment frameworks with other cyber security
techniques is using them in conjunction with analysis of cyber-attack graphs. An attack graph is
represented by the number of nodes – attacker’s states (or attack stages) and edges (possible

Project Number: 700071 D4.1 Context Awareness System
PROTECTIVE CA: Asset State Management 29
transitions among attacker states). Therefore, attack graphs allow visualizing paths followed by the
attacker when attempting to gain access to specific resources localized within the network. In the
context of vulnerability management, a combination of vulnerability databases and scoring with
analysis of attack paths can allow consideration of vulnerability chain, “cascading effect” of
vulnerabilities, or estimation on how one vulnerability affects other ones, within the same attack path.
This enables more accurate estimation of a network's severity level by providing a vulnerability score
to an attack path - not single nodes. As a result, prioritization of patching can be considered in the
context of a given attack path, not in the context of independent assets. In vulnerability management,
this allows identification of the easiest ways that can be used to compromise given resources.
(Chejara, Garg, & Singh, 2013) proposes another CVSS-based approach combined with attack graphs
theory enhanced using probabilistic methods. The authors employ conditional probability to calculate
interdependent vulnerability scores. Generic CVSS scores are independent of each other, while when
considering attack chaining, each exploited vulnerability has an impact on exploitation of the next
vulnerability in the attack path. As in previous publications, in this paper the authors focus on the
calculation of the score for the complete attack path. The main pillar of their approach is the
assumption that if two consequent vulnerabilities are exploited (two nodes in an attack graph are
compromised), the probability of a second event can be represented by conditional probability, given
the probability of the first event.
However, the authors indicate some work that needs to be done to optimize this approach, namely
setting reasonable threshold values for attack path scores (e.g. depending on the defence mechanisms
implemented). On the other hand, the challenge related to the identification of a complete set of
attack paths is considered. This can result in difficulties in maintaining accuracy of the attack graph
over time, however it can be less critical in not changing (or slowly evolving) environments comprised
of assets that are well-known - for which vulnerability scores are reliable and well-documented.
Attack graphs in vulnerability management are also the subject of (Ko, Lim, Lee, & Shon, 2014). The
approach described in this paper is focused mainly on smart grid networks, but can be translated into
different domains and network types. In this approach, independent CVSS scores are enriched with
the defined NVS parameter representing context of the network.
Similarly, to the (Wang & Guo, OVM: An Ontology for Vulnerability Management, 2009) research, the
proposed method is two-stage: firstly, the CVSS score is calculated for the nodes within the given
attack route, secondly the network vulnerability total score is calculated based on weighted average
of attack paths scores. In this approach, CVSS scoring is considered with the newly developed NVS
parameter that mainly depends on existing network defence mechanism, such as firewalls
implemented, IDS, protocol types, and communication links. Experimental results show that
depending on the security mechanisms applied, the newly developed metric can correct original CVSS-
based calculation by about 10-15% (increasing or decreasing the score).
In (Keramati, Akbari, & Keramati, 2013) another CVSS-based security metric that can assess the impact
of an attack on the network are presented. The primary focus of the research is put on estimation of
interrelationships between vulnerabilities instead of analysing CVSS scores separately and without a
context. Again, analysis of attack graphs was crucial for evaluation of the complete network security
posture. In their work the authors assess losses that are consequences of exploiting vulnerabilities,
taking into account such network security parameters as confidentiality, availability and integrity. The
main results are:
• development of a security metric enabling comparison of simplicity (or difficulty) of exploiting
various attack paths,
Project Number: 700071 D4.1 Context Awareness System
PROTECTIVE CA: Asset State Management 30
• development of a security metric enabling comparison of security losses after exploiting
different network vulnerabilities.
Another, CVSS metric-based approach is presented in (Tupper & Zincir-Heywood, 2008). The proposed
VEA-bility security metric is defined to assess the security of a network based on multiple factors. The
main three pillars of the assessment include network exploitability dimension, network attackability
dimension and host vulnerability dimension.
The VEA-bility score for the given network is calculated based on the gathered information on CVSS
scores for each network asset, network topology and attack graph analysis and uses the formula: VEA-
bility = 10 –((V+E+A)/3), where:
• V is the network vulnerability function expressed by the exponential average of the host,
vulnerability scores, or a maximum of 10. This means that the vulnerability score of the
network is not lesser than the CVSS score for the most vulnerable host in an analysed
network, with the assumption that additional vulnerable hosts contribute to increase this
value.
• E is the network exploitability function expressed by the sum of all exploitability scores
assigned to network assets using the CVSS framework and evaluating the likelihood of a host
exploitation.
• A is the network attackability function that is a sum of the attackability scores for all network
assets. These scores are derived from the information gathered by the attack graphs
analysis.
It should be noted that information about the network was gathered by using the Nessus scanner and
the Sheyner/Swasey toolkit. Authors indicate that one of the possible directions of development of
VEA-bility metric is incorporation of a greater number of CVSS sub-scores, such as environmental
metrics. (Farnan & Nurse, 2015) also explores controls-based assessment of infrastructure
vulnerability. The idea is that one uses a certain control set and if those controls are not present in the
organisation, then they are assumed to be vulnerable to certain attacks.
3.3 Conclusions and concept summary
According to the reviewed literature, it can be concluded that most researchers use CVE/NVD
databases and the CVSS framework to get initial vulnerability scores of the assets in an analysed
network. The main limitation of CVE/CVSS according to reviewed publications is the fact that a simple
listing of vulnerability scores for assets operating in a network does not provide a comprehensive view
on the real level of network security. Lack of addressing of “collective vulnerabilities”, attack chaining,
network context (such as defensive or remediation mechanisms implemented) can result in
disinformation for decision-makers while they analyse unprocessed CVSS scores. The most common
research approaches to increase reliability of these scores or to support contextual evaluation of
reports generated based on them, are:
• Adjustment of CVSS metrics to be more credible by use of weighted parameters (CVSS sub-
metrics).
• Semantic reasoning and use of cyber security ontologies to recognize patterns and
dependencies between such cyber security concepts such as threats, vulnerabilities,
attackers, etc., to support the intelligent reasoning and searching within vulnerabilities
based on user defined parameters (such as vulnerability severity or group of
technologies/assets that can be affected by exploiting a given vulnerability).
Project Number: 700071 D4.1 Context Awareness System
PROTECTIVE CA: Asset State Management 31
• Analysis of attack graphs enhanced with probabilistic methods to obtain conditional
dependencies between assets, thus between CVSS scores and modification of these scores.
Each of these approaches has advantages and can be valuable in vulnerability management as it is
described in the next sub-sections. All of them are also characterized by limitations and challenges.
For instance, in case of highly evolving and dynamic environments, the effective implementation of
these approaches requires either rebuilding the attack graphs to include new exploits and assets, or
rebuilding and re-indexing the ontology knowledge base.
It is worth mentioning that aspects of data collection, topology discovery, building of attack graphs
and feeding the ontology with knowledge for analysed networks are not the primary subject in
scientific considerations5. Authors do not focus on these processes, however in some cases they stated
that they use third party software to perform these tasks, such as in (Tupper & Zincir-Heywood, 2008),
where the Nessus tool was used to gain information about the analysed IT network. Particularly, the
centre of gravity has shifted towards improving (increasing accuracy, reliability and adjustment to real
scenarios) CVSS scoring methodology.
Although the vulnerability management, enriched with semantic description and/or attack graph
analysis is relatively widely discussed in scientific literature, the real examples of tools employing
those techniques are rare. For example, the NIST Interagency Report (Singhal & Ou, 2011) emphasizes
challenges related to using attack graphs in security analysis in practice. Authors do not dispute the
benefits that may be achieved by combining attack graph generation and analysis with security risk
management and demonstrate the methodology using the MULVAL (Xinming, 2016) tool. However,
presented examples are simple, focused on presenting only proof of the concept and do not reflect
the real complexity of the networks and assets dependencies. In the part devoted to the challenges
of attack graphs generation, the authors stressed their doubts about the scalability of attack graph
creation and stated that the ability to generate graphs based on information gathered in large,
enterprise networks comprised of hundreds of hosts and applications is crucial for further exploitation
of attack graphs in real security applications. Some other challenges discussed in the report are:
• difficulties in gathering detailed information about vulnerabilities and exploits, that may be
overcome with the use of automation.
• proper analysis of cycles in an attack graph in terms of probabilistic methods,
• insufficient granularity of CVSS scores.
• modeling of zero-days vulnerabilities and including it in risk analysis.
Taking the above into consideration Figure 8 presents the initial concept of the asset state /
vulnerability management solution in PROTECTIVE as an evolution of the current operation of the
Cyber Tool prototype in its current stage at TRL4. The knowledge base (security ontology) will have to
be adjusted to accommodate/reflect networks and IT infrastructures models employed in
PROTECTIVE.
5 Or provide assessment for small networks only
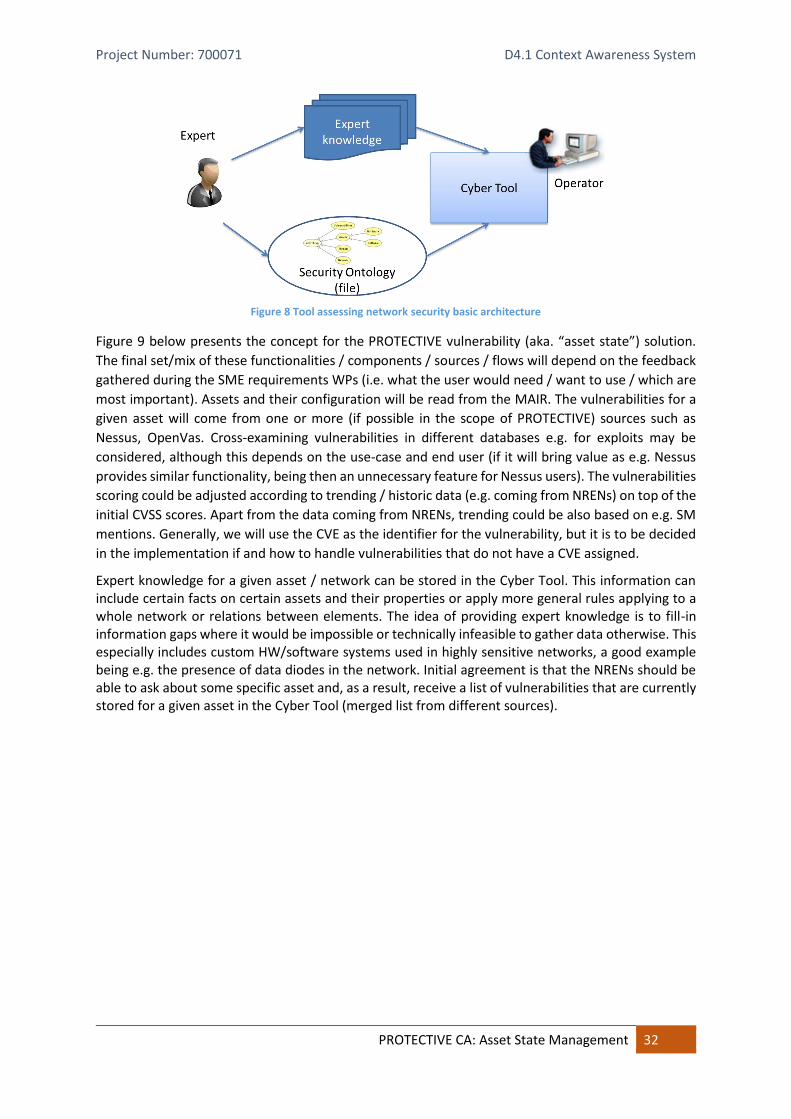
Project Number: 700071 D4.1 Context Awareness System
PROTECTIVE CA: Asset State Management 32
Figure 8 Tool assessing network security basic architecture
Figure 9 below presents the concept for the PROTECTIVE vulnerability (aka. “asset state”) solution.
The final set/mix of these functionalities / components / sources / flows will depend on the feedback
gathered during the SME requirements WPs (i.e. what the user would need / want to use / which are
most important). Assets and their configuration will be read from the MAIR. The vulnerabilities for a
given asset will come from one or more (if possible in the scope of PROTECTIVE) sources such as
Nessus, OpenVas. Cross-examining vulnerabilities in different databases e.g. for exploits may be
considered, although this depends on the use-case and end user (if it will bring value as e.g. Nessus
provides similar functionality, being then an unnecessary feature for Nessus users). The vulnerabilities
scoring could be adjusted according to trending / historic data (e.g. coming from NRENs) on top of the
initial CVSS scores. Apart from the data coming from NRENs, trending could be also based on e.g. SM
mentions. Generally, we will use the CVE as the identifier for the vulnerability, but it is to be decided
in the implementation if and how to handle vulnerabilities that do not have a CVE assigned.
Expert knowledge for a given asset / network can be stored in the Cyber Tool. This information can include certain facts on certain assets and their properties or apply more general rules applying to a whole network or relations between elements. The idea of providing expert knowledge is to fill-in information gaps where it would be impossible or technically infeasible to gather data otherwise. This especially includes custom HW/software systems used in highly sensitive networks, a good example being e.g. the presence of data diodes in the network. Initial agreement is that the NRENs should be able to ask about some specific asset and, as a result, receive a list of vulnerabilities that are currently stored for a given asset in the Cyber Tool (merged list from different sources).
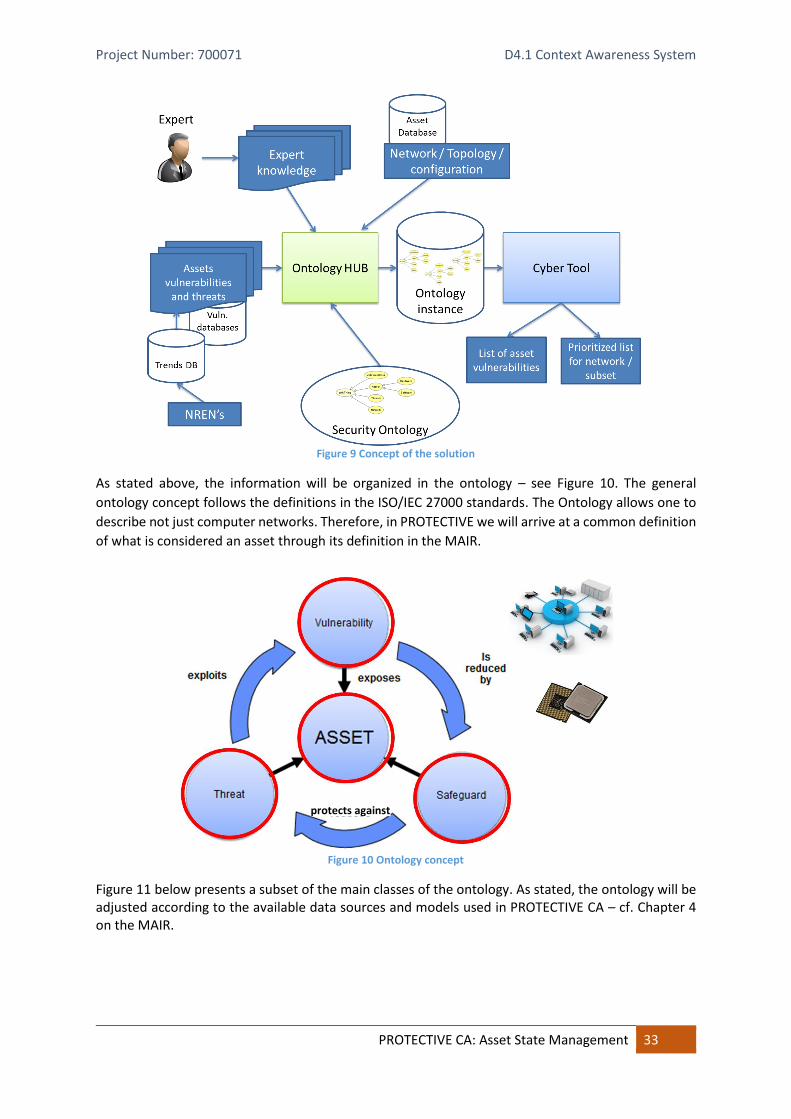
Project Number: 700071 D4.1 Context Awareness System
PROTECTIVE CA: Asset State Management 33
Figure 9 Concept of the solution
As stated above, the information will be organized in the ontology – see Figure 10. The general
ontology concept follows the definitions in the ISO/IEC 27000 standards. The Ontology allows one to
describe not just computer networks. Therefore, in PROTECTIVE we will arrive at a common definition
of what is considered an asset through its definition in the MAIR.
Figure 10 Ontology concept
Figure 11 below presents a subset of the main classes of the ontology. As stated, the ontology will be adjusted according to the available data sources and models used in PROTECTIVE CA – cf. Chapter 4 on the MAIR.
protects against

Project Number: 700071 D4.1 Context Awareness System
PROTECTIVE CA: Mission and Asset Information Repository 34
Figure 11 Main classes
4 CA: Mission and Asset Information Repository
4.1 MAIR Overview
The Mission and Asset Information Repository (MAIR) is a repository that tracks an organisations
mission, IT infrastructure and services and the relationships between them. It gives a logical view of
the infrastructure items and the infrastructure entity information in the data-base is a federation of
data from other information repositories and databases in the organisation i.e. the MAIR is populated
from these sources via a provisioning application programing interface (API).
As such the MAIR can be considered as a much-simplified federated Configuration Management Data
Base (CMDB) (DMTF, 2010). According to (DMTF, 2010) “an ITIL CMDB contains a record of the
expected configuration of the IT environment, as authorized and controlled through the change
management and configuration management processes”. The MAIR however is not concerned at all
with configuration management and therefore has a much-reduced role compared to a “proper”
CMDB. However, the design of the MAIR will use the CMDB architectural pattern and principles as a
starting point for its development.
According to (DMTF, 2010) a federating CMDB provides an aggregate view of an item or relationship,
potentially using data from multiple managed data repositories (MDR). An MDR provides data about
managed resources (for example, computer systems, application software, and buildings), process
artefacts (for example, incident records), and the relationships between them. The whole assemblage
of MDRs and federating CMDB is called a federated CMDB. A federated CMDB client can query the
CMDB for entity or relationship information,
A conceptual view of the federated CMDB is shown in Figure 12 below:
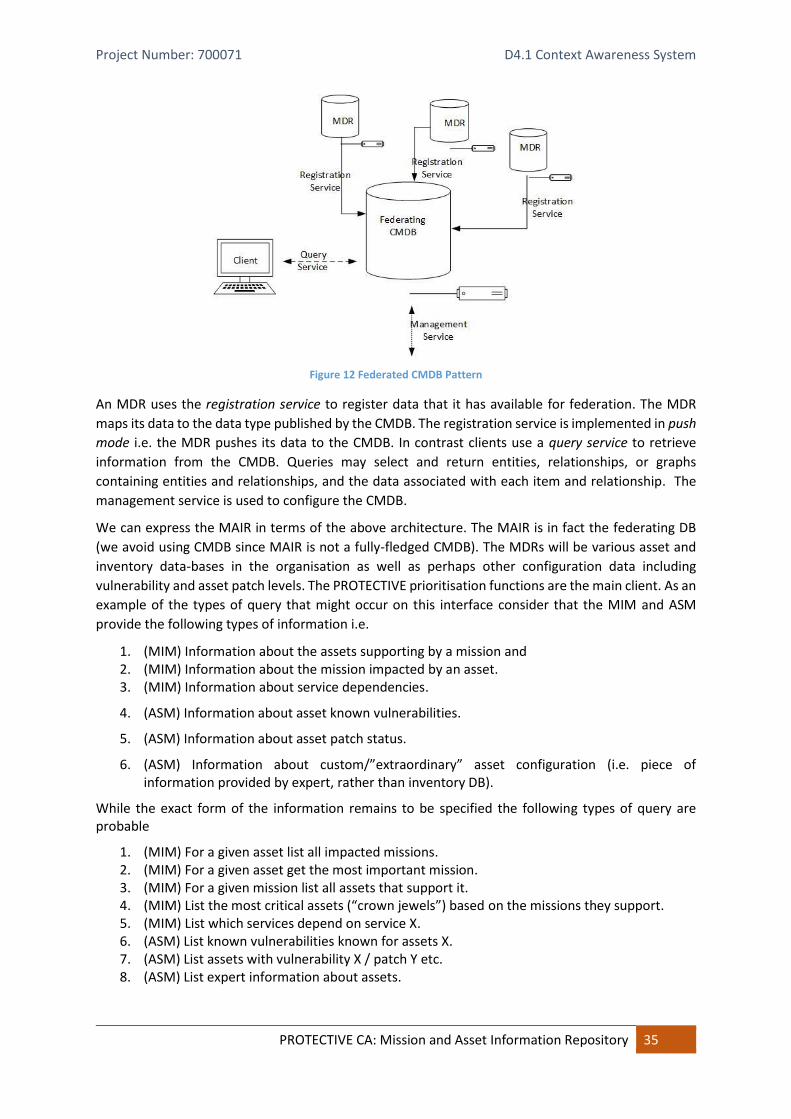
Project Number: 700071 D4.1 Context Awareness System
PROTECTIVE CA: Mission and Asset Information Repository 35
Figure 12 Federated CMDB Pattern
An MDR uses the registration service to register data that it has available for federation. The MDR
maps its data to the data type published by the CMDB. The registration service is implemented in push
mode i.e. the MDR pushes its data to the CMDB. In contrast clients use a query service to retrieve
information from the CMDB. Queries may select and return entities, relationships, or graphs
containing entities and relationships, and the data associated with each item and relationship. The
management service is used to configure the CMDB.
We can express the MAIR in terms of the above architecture. The MAIR is in fact the federating DB
(we avoid using CMDB since MAIR is not a fully-fledged CMDB). The MDRs will be various asset and
inventory data-bases in the organisation as well as perhaps other configuration data including
vulnerability and asset patch levels. The PROTECTIVE prioritisation functions are the main client. As an
example of the types of query that might occur on this interface consider that the MIM and ASM
provide the following types of information i.e.
1. (MIM) Information about the assets supporting by a mission and 2. (MIM) Information about the mission impacted by an asset. 3. (MIM) Information about service dependencies.
4. (ASM) Information about asset known vulnerabilities.
5. (ASM) Information about asset patch status.
6. (ASM) Information about custom/”extraordinary” asset configuration (i.e. piece of information provided by expert, rather than inventory DB).
While the exact form of the information remains to be specified the following types of query are probable
1. (MIM) For a given asset list all impacted missions. 2. (MIM) For a given asset get the most important mission. 3. (MIM) For a given mission list all assets that support it. 4. (MIM) List the most critical assets (“crown jewels”) based on the missions they support. 5. (MIM) List which services depend on service X. 6. (ASM) List known vulnerabilities known for assets X. 7. (ASM) List assets with vulnerability X / patch Y etc. 8. (ASM) List expert information about assets.

Project Number: 700071 D4.1 Context Awareness System
PROTECTIVE CA: Mission and Asset Information Repository 36
The MIM and ASM subsystems will use the management service to configure, manage and query the
MAIR. More work remains to be done to complete the specification of the design and the individual
interfaces. For example, as outlined in the discussion of the ASM in Chapter 3 more detailed
requirement collection needs to be done from an SME perspective to arrive at a detailed description
of the MAIR entities and models.
4.2 MAIR Meta-model
As already mentioned there is a modelling overlap between the ASM and the MIM. The ontology
described in Figure 11 shows some the anticipated entities that are likely to be required for
PROTECTIVE. In a similar manner Figure 13 describes the proposed MIM meta-model. This model
contains two sets of information
1. the core meta-model elements that capture the dependency relationships – these are
indicated in the heavily lined outlines and the dependencies are expressed via the broken
lines.
2. actual assets and services – the leaf nodes of the schema.
This is the first version of the MIM meta-model and it is expected to evolve as more requirements
are collected and the interaction with the ASM and the other parts of the PROTECTVE system
become clearer. The actual assets and services depicted in the model should therefore be
considered as representative rather than complete i.e. not all assets/services and/or relationships
are shown. However, such evolution is expected to be incremental and to involve the addition of new
leaf node types and the completion of the property values of the entity types.
In the model, we can see that the four main elements (Security Objective; Mission; Service; Asset)
that form the dependency chain are those already identified in Section 2.2. Both Service and Asset
can be sub-classed – in fact need to be – to create realistic entity layer schemes to be used by
organisations. The model also includes a Grouping construct that is used to describes various forms
of managing collections of entities. Grouping is a form of aggregation of entities. This is not quite the
same as the aggregation we spoke of in Chapter 2.1.4 which is rather more concerned with
aggregation of dependencies – thus dependency aggregation occurs in all instantiated entities
including Grouping entities. Specific aggregation functions will be applied at each entity node to
capture the combined impact of the dependent entities as outlined in Chapter 2. These are not shown
explicitly in the meta-model. In contrast to the approaches surveyed in the state of the art in section
2.1 where Business Process is the business function modelling entity we adopt the CRR, (US-CERT,
2016), approach of internal and external services and use the modelling entities Mission and Service
to capture the business purposes and functions. Internal services are realised as Business Processes
while client facing activities are presented as Mission. Additionally, the Service entity allows us to
capture more usual consideration of the term as e.g. network connectivity services or TCP/IP
application services such as HTTP. These are captured as Connectivity Service and IT Service, either
or both of which can be evolved further.
In addition to the business aspects the model also attempts to capture the human and organisational
aspects of context by incorporating the Constituency entity and its family of related entities.
The Asset entity is simply a root object for several more specific entity types including Device,
Software and Information that are in turn further refined into more specific entity types. Information
assets include any information that is needed to manage and operate the organisation and such assets
are usually stored in information containers such as databases and file systems. The inclusion of
Vulnerability is intended to illustrate support for the ASM

Project Number: 700071 D4.1 Context Awareness System
PROTECTIVE CA: Mission and Asset Information Repository 37
One type of asset that is perhaps conspicuous by its absence is Virtual Device – the precise needs for
this entity or its subclasses within the scope of PROTECTIVE is yet to be determined.

Project Number: 700071 D4.1 Context Awareness System
PROTECTIVE CA: Mission and Asset Information Repository 38
Figure 13 PROTECTIVE CA Meta-model

Project Number: 700071 D4.1 Context Awareness System
PROTECTIVE | References 39
The MAIR meta-model will be used as the modelling basis to conduct mission impact assessments as
outlined in Chapter 2. The MDG produced from these assessments will be stored in the MAIR and used
to manage queries from clients. Support tools will be developed to help users capture and manage
these relationships and to enter them into the MAIR.
5 Conclusion This document describes the Context Awareness system in PROTECTIVE and specifies the research and
design approaches to be considered in the further development of the model.
It defines the architectural structure of the CA system in terms of its component systems and outlines
their scope and interactions. It describes the main features of each subsystems and the research
approaches underpinning each subsystem. It outlines the interaction of the CA system and its’s
components with the other parts of the PROTECTIVE systems and makes clear the benefits that the
CA provides to the overall PROTECTIVE solution in assisting alert and meta-alert prioritisation.
It also specifies a methodology and tools to conduct mission impact assessment and outlines the
models to be used in the development of the CA systems.
Project Number: 700071 D4.1 Context Awareness System
PROTECTIVE | References 40
6 References Amico, A. D., & Goodall, J. R. (2009). Mission Impact of Cyber Events : Scenarios and Ontology to
Express the Relationships between Cyber Assets , Missions and Users,. Proceedings of the 5th
International Conference on Information Warfare and Security.
Arthur J. Gallagher & Co. (2014, ). Critical Business Function Checklist. Retrieved March 14, 2017, from
Arthur J. Gallagher: https://www.ajg.com/media/1329771/Critical-Business-Functions.pdf
Caralli, R., Stevens, J., Young, L., & Wilson, W. (2007). Introducing OCTAVE Allegro : Improving the
Information Security Risk Assessment Process. Hanscom: Software Engineering Institute .
Chejara, P., Garg, U., & Singh, G. (2013, December). Vulnerability Analysis in Attack Graphs Using
Conditional Probability. International Journal of Soft Computing and Engineering (IJSCE),
Volume-3, Issue-2, pp. 18-21.
Cheng. (2014). Metrics of Security. In A. Kott, C. Wang, & R. Erbacher (Eds.), Cyber Defense and
Situational Awareness (pp. 263-297). Heidelberg: Springer International.
D., R. G., & Haiser, T. (1997). Determining the Availability of Distributed Applications. In Integrated
Network Manageemnt V (pp. 207-218). Dordecht : Springer Science.
Dai, J., Sun, X., Liu., P., & Giacobe, N. (2012). Gaining Big Picture Awareness through an Interconnected
Cross-layer Situation Knowledge Reference Model. IEEE International Conference on Cyber
Security.
DMTF. (2010). Configuration Management Database (CMDB) Federation Specification. DMTF.
ENISA. (2014). Methodologies for the identification of Critical Information Infrastructure assets and
services. ENISA.
ENISA. (2016). Communication network dependencies for ICS/SCADA Systems. ENISA.
Farnan, O. J., & Nurse, J. R. (2015). Exploring a Controls-Based Assessment of Infrastructure
Vulnerability. In C. Lambrinoudakis, & A. Gabillon (Eds.), Risks and Security of Internet and
Systems (pp. 144-159). Mytilene, Greece: Springer.
Financial Stability Board. (2014, July 16). Recovery and Resolution Planning for Systemically Important
Financial Institutions: Guidance on Identification of Critical Functions and Critical Shared
Services. Retrieved March 15, 2017, from http://www.fsb.org/wp-
content/uploads/r_130716a.pdf?page_moved=1
FiRST. (2015). Common Vulnerability Scoring System, V3 Development Update. Retrieved April 24,
2017, from http://www.first.org/cvss/
Holsopple, J., & Yang, S. (2013). Mission Impact Assessment. San Diego: IEEE International Multi-
Disciplinary Conference on Cognitive Methods in Situation Awareness and Decision Support
(CogSIMA).
Homeland Security. (2016). Information Technology Sector-Specific Plan - 2016. Retrieved March 5,
2017, from https://www.dhs.gov/sites/default/files/publications/nipp-ssp-information-
technology-2016-508.pdf
Innerhoffer-Oberperfler, F., & Breu, R. (2006). Using an Enterprise Architecture for IT Risk
Management. Proceeding Information Security South Africa.
ISO. (2011). ISO/IEC 27005, annex D. International Organization for Standardization.
Project Number: 700071 D4.1 Context Awareness System
PROTECTIVE | References 41
ISO. (2016). ISO/IEC 27000-series. International Organization for Standardization.
ITSEAG. (2102). The Generic SCADA Risk Management Framework For Australian Critical
Infrastructure,. Australia: Trusted Information Sharing Network .
Jakobson, G. (2011). Mission Cyber Security Situation Assessment Using Impact Dependency Graphs.
Chicago: 14th International Conference on Information Fusion.
Jakobson, G. (2014). Mission Resilience. In K. A, C. Wang, & R. F. Erbacher (Eds.), Cyber Defense and
Situational Awareness (pp. 297-322). Heidelberg: Springer International Publishing.
Jiang, J., Ding, L., Zhai, E., & Yu, T. (2015). VRank : A Context-Aware Approach to Vulnerability Scoring
and Ranking in SOA VRank : A Context-Aware Approach to Vulnerability Scoring and Ranking
in SOA. Gaithersburg: IEEE International Conference onWeb Services (ICWS) .
Kamongi, P., Kotikela, S., Kavi, K., Gomathisankaran, M., & Singhal, A. (2013). VULCAN: Vulnerability
Assessment Framework for Cloud Computing. In Seventh International Conference on
Software Security and Reliability (pp. 218-226). Gaithersburg, MD, USA: IEEE.
Keramati, M., Akbari, A., & Keramati, M. (2013). CVSS-based Security Metrics for Quantitative Analysis
Of Attack Graphs. In Computer and Knowledge Engineering (ICCKE) (pp. 178-183). Mashhad,
Iran: IEEE.
Kim, A., Kang, M. H., Luo, J. Z., & Velazazquez, A. (2014). A Framework for Event Prioritization in Cyber
Network Defense. Washington: Naval Research Laboratory.
Ko, J., Lim, H., Lee, S., & Shon, T. (2014, July 24). AVQS: Attack Route-Based Vulnerability Quantification
Scheme for Smart Grid. The Scientific World Journal, p. 713012.
Kott, A., Wang, C., & F., E. R. (2014). Cyber Defense and Situational Awareness (AIDS 62 ed.).
Heidelberg: Springer.
MITRE. (2016). Common Vulnerabilities and Exposures. Retrieved April 24, 2017, from
https://cve.mitre.org/about/terminology.html
MITRE. (2017). Common Weakness Enumeration. Retrieved April 24, 2017, from
https://cwe.mitre.org/
Mitre Corporation. (2017). Crown Jewels Assessment. Retrieved March 8, 2017, from
https://www.mitre.org/publications/systems-engineering-guide/enterprise-
engineering/systems-engineering-for-mission-assurance/crown-jewels-analysis
MWR. (2013). drozer - The new Android security testing tool. Retrieved April 24, 2017, from
https://www.mwrinfosecurity.com/news/drozer-the-new-android-security-testing-tool/
NIST. (2012). Guide for Conducting Risk Assessments. Gaithersburg: National Institute for Science and
Technology.
NIST. (2016). National Vulnerability Database. Retrieved April 24, 2017, from https://nvd.nist.gov/
Nurse, J. R., & Sinclair, J. E. (2012). Towards A Model to Support the Reconciliation of Security Actions
across Enterprises. 2012 Workshop on Socio-Technical Aspects in Security and Trust (pp. 11-
19). Cambridge, MA: IEEE Computer Society.
Sadighian, A., Zargar, S. T., M. Fernandez, J., & Lemay, A. (2013). Semantic-based Context-aware Alert
Fusion for Distributed Intrusion Detection Systems. In Risks and Security of Internet and
Systems (CRiSIS) (pp. 1-6). La Rochelle: IEEE.
Project Number: 700071 D4.1 Context Awareness System
PROTECTIVE | References 42
Schulz, A., Kotson, M., & Zipkin, J. (2015). Cyber Network Mission Dependencies. Lexinginton, MA:
Lincoln Laboratory , MIT.
Singhal, A., & Ou, X. (2011). NIST Interagency/Internal Report (NISTIR) - 7788. NIST.
Suh, B., & Han, I. (2003). The IS risk analysis based on a business model. Information and Management,
41, 149-158.
Swanson, M., & al., e. (2010). Contingency Planning Guide for Federal Information Systems Business
Continuity. Gaithersburg: National Institute for Standards and Technology.
Szwed, P., & Skrzynski, P. (2014). A New Lightweight Methid For Security Risk Assessment Based on
Fuzzy Cognitive Maps. Int. J. Appl. Math. Comput. Sci. , 24(1), 213-225.
Tupper, M., & Zincir-Heywood, A. N. (2008). VEA-bility Security Metric: A Network Security Analysis
Tool. In Third International Conference on Availability, Reliability and Security (pp. 950-957).
Barcelona, Spain: IEEE.
US-CERT. (2016). Cyber Resilience Review. Retrieved March 14, 2017, from https://www.us-
cert.gov/ccubedvp/assessments
Wang, J. A., & Guo, M. (2009). OVM: An Ontology for Vulnerability Management. In F. Sheldon, G.
Peterson, A. Krings, R. Abercrombie, & A. Mili (Eds.), CSIIRW '09 Proceedings of the 5th Annual
Workshop on Cyber Security and Information Intelligence Research: Cyber Security and
Information Intelligence Challenges and Strategies (p. 34). New York, NY, USA: ACM.
Wang, J. A., & Guo, M. (2009). Security Data Mining in an Ontology for Vulnerability Management. In
International Joint Conference on Bioinformatics, Systems Biology and Intelligent Computing
(pp. 597-603). Shanghai, China: IEEE.
Watters, J., Morrissey, S., & Powers, S. (2009). The Risk-to-Mission Assessment Process ( RiskMAP ): A
Sensitivity Analysis and an Extension to Treat Confidentiality Issues. Dartmouth : Mitre
Corporation .
Wikipedia. (2016). Multiple Criteria Decision Analysis. Retrieved January 26, 2017, from
https://en.wikipedia.org/wiki/Multiple-criteria_decision_analysis
Wu, Y., Gandhi, R., & Siy, H. (2013, July 1). Semi-Automatic Annotation of Natural Language
Vulnerability Report. International Journal of Secure Software Engineering, pp. 18-41.
Xinming, ". O. (2016). The Argus group. Retrieved April 24, 2017, from
http://www.arguslab.org/mulval.html

Project Number: 700071 D4.1 Context Awareness System
PROTECTIVE | Annex A NREN Mission Impact Assessment Questionnaire 43
Annex A NREN Mission Impact Assessment Questionnaire The intent of these questions is to gather information to prepare a “Business Impact Analysis”
procedure. This procedure will be used later by the NREN organisation to identify and prioritise
services and assets for use within the pilot trials. Questions have both an organisation internal and
external focus
Mission of your organisation
Question Objective: To understand the organisation’s purpose
1. What is the mission of your organization? Please be as specific as possible. 2. Are the mission’s objectives and activities identified and prioritised?
Question Objective: To identify the high-value activities that support the achievement of the organisation mission and objectives
Clients of your organisation
Question Objective: To understand the nature of the NREN constituency.
1. Who are the clients (participants) of your organisation? 2. Please identify different categories of client if such exist? 3. Please indicate if any categories are more important than others?
Impact Areas
Question Intent: To understand which criteria are important to assess the impact of risks.
“Impact Area” is means the categories where realised risk can have a major disruptive consequence.
Examples cloud include “Cost”, “Reputation”, “Compliance with Regulations” or perhaps for NREN
type organisations “Quality of Provided Service” or related Service Level Agreement factors.
1. Does your organisation periodically conduct a Business Impact Analysis as part of Risk Assessment?
2. Have suitable impact areas been defined by your organisation as a base for conducting Business Impact Assessment?
3. Has a clear relationship between these Impact Areas and Mission objectives been defined? 4. Have these impact areas been prioritised to determine their relative importance?
Infrastructure services provided to clients
Question Objective: To understand the types of services provided to clients and to establish their
relative importance.
Here “infrastructure service” means a communication, storage or compute service provided to the
client base e.g. VoIP, IaaS etc.
1. Are the infrastructure services provided to clients clearly identified and catalogued? 2. Have these services been prioritised based on importance to organisation mission goals and
value to client? 3. Have “owners” of these services within the organisation been identified? 4. Can dependencies between these services be clearly identified and does such a “service
dependency map” exist? 5. Are geographical dependencies important to note when assessing impact i.e. if a service in
one area/region is affected could it impact other services in the same region?

Project Number: 700071 D4.1 Context Awareness System
PROTECTIVE | Annex A NREN Mission Impact Assessment Questionnaire 44
Other services critical to the fulfilment of the mission
Question Objective: To understand the internal business processes and services (e.g. provision
services) and external client facing services and processes (e.g. helpdesk) that are required to fulfil
the mission and to establish their importance.
1. Have other services critical to the fulfilment of the mission been identified and catalogued? 2. Have dependencies between these mission objectives and these services/processes been
clearly identified and does a “mission-service dependency map” exist? 3. Have these services/processes been prioritised based on value to mission fulfilment? 4. Have “owners” of these services within the organisation been identified? 5. Can dependencies between these services be clearly identified and does a “service
dependency map” exist?
Infrastructure Assets
Question Objective: To understand the nature of the assets used to provide both client
infrastructural and internal services.
Here “infrastructure asset“ means a communication, storage or compute capability provided to
support either client infrastructure processes or internal services/process. This definition can also
include “information assets” i.e. information or data that is of value to the organization, such as
client records, intellectual property etc. as well as the assets that contain this information e.g.
databases.
1. Does an inventory of infrastructure assets exist? Is asset “aggregation” used in the identification of assets in your organisation? e.g. “Network” is an aggregated asset.
2. If so have all types of aggregated asset been identified? 3. Have the dependencies between assets and client infrastructure services been identified and
does a “service-asset impact dependency map” exist? 4. Have the dependencies between assets and internal services been identified and does a
“service-asset impact dependency map” exist? 5. Have the dependencies between assets been identified and does an “asset-asset impact
dependency map” exist? 6. Have “owners” of these assets within the organisation been identified? 7. Are geographical dependencies important to note when assessing impact i.e. if a service in
one area/region is affected could it impact other services in the same region?

Project Number: 700071 D4.1 Context Awareness System
PROTECTIVE | Annex B Service Profile Catalogue 45
Annex B Service Profile Catalogue Service Id Name Description Services
Supported
(Id’s)
Supporting Networks
Service Type Technical
Owner
Assets
Supported

Project Number: 700071 D4.1 Context Awareness System
PROTECTIVE | Annex C Asset Profile Catalogue 46
Annex C Asset Profile Catalogue Asset Id Name Type Services
Supported Location Business
owner Technical Owner
Assets Supported
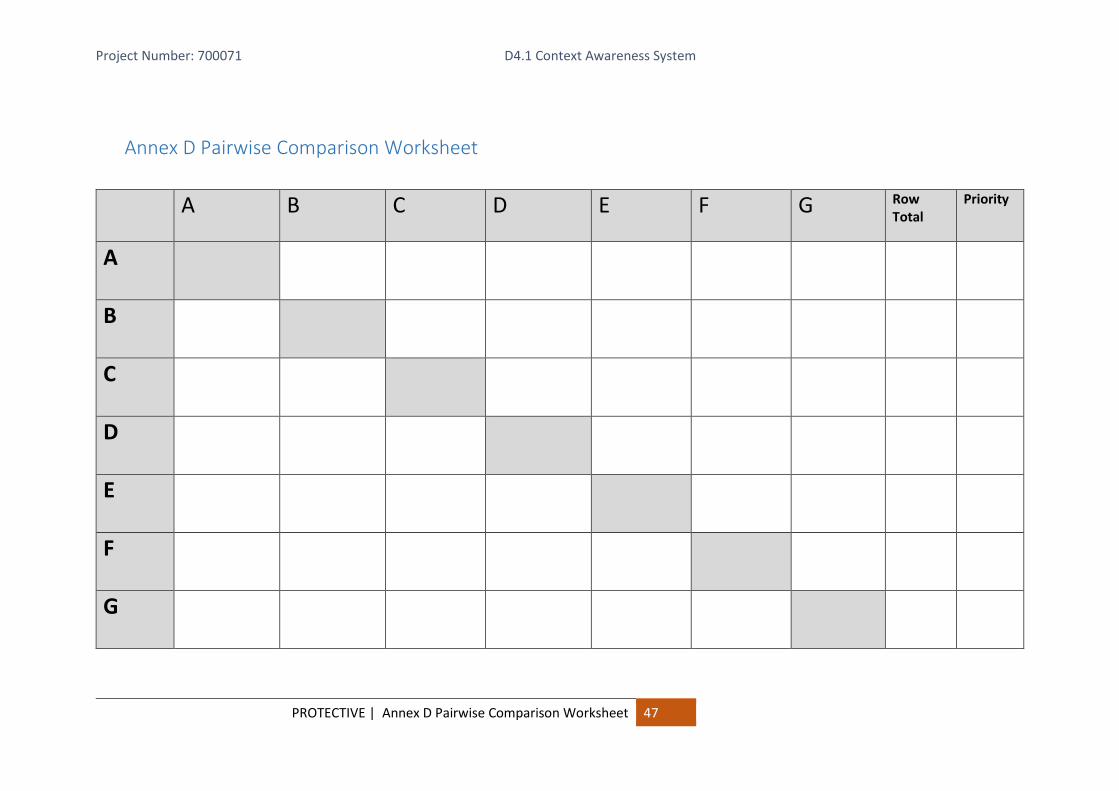
Project Number: 700071 D4.1 Context Awareness System
PROTECTIVE | Annex D Pairwise Comparison Worksheet 47
Annex D Pairwise Comparison Worksheet
A B C D E F G Row
Total Priority
A
B
C
D
E
F
G

Project Number: 700071 D4.1 Context Awareness System
PROTECTIVE | Annex E Decision Matrix Worksheet 48
Annex E Decision Matrix Worksheet Asset/Service Priority
Impact Weight Impact Weight Impact Weight Impact Weight Impact Weight Impact Weight Impact Weight Impact Weight
TOTAL
Impact Key 0 - No Impact
1- Minimal Impact
2 – Somewhat Impacted
3 – Substantially Impacted
4 – Failure