d3.1 state of the art and description of kpis...
TRANSCRIPT
INTERMODELEU
Simulation using Building Information Modelling Methodology of
Multimodal, Multipurpose and Multiproduct Freight Railway Terminal
Infrastructures
Grant agreement: 690658
D3.1 – STUDY OF THE STATE OF THE ART AND DESCRIPTION OF KPI
AND KRI OF TERMINALS, HINTERLAND MOBILITY AND RAIL NETWORK
Authors Enrique Martín (CENIT)
M. Ángel Dombriz (FGC)
Gisela Soley (IDP)
Status Final Deliverable
Dissemination Public
This project has received funding from the European Union’s Horizon 2020
research and innovation programme under grant agreement No. 690658.

D3.1 Study of the state of the art and description of KPI and
KRI of terminals, hinterland mobility and rail network
Revision history:
Revision Date Author Organization Description
0.1 07/11/2016 Enrique Martín CENIT State of the Art
0.2 11/11/2016 Sergi Saurí CENIT State of the Art
0.3 11/11/2016 Pau Morales CENIT State of the Art
0.4 18/11/2016 Enrique Martín
Gisela Soley
CENIT
IDP
KPIs and PIs selection and definition
0.5 21/11/2016 Pau Morales CENIT KPI definition
0.6 23/11/2016 M. Ángel Dombriz
Gisela Soley
FGC
IDP
Introduction and objectives
0.7 25/11/2016 Gisela Soley IDP Methodology
0.8 28/11/2016 Enrique Martín CENIT All document
0.9 28/11/2016 Pau Morales CENIT Methodology
0.10 29/11/2016 Gisela Soley IDP All document
0.11 29/11/2016 Pau Morales CENIT Summary and conclusions
1.0 29/11/2016 Enrique Martín
Gisela Soley
CENIT
IDP
First version
1.1 19/05/2017 Álex Calvo
Gisela Soley
BASF
IDP
LCA indicators
1.2 22/05/2017 Pau Morales CENIT KRIs
2.0 22/05/2017 Gisela Soley IDP Second version

D3.1 Study of the state of the art and description of KPI and
KRI of terminals, hinterland mobility and rail network
Page 3 of 121
Statement of originality:
This deliverable contains original unpublished work except where clearly indicated otherwise. Acknowledgement of previously published material and of the work of others has been made through appropriate citation, quotation or both.
The information set out in this publication are those of the author(s) and do not
necessary reflect the official opinion of neither INEA nor the Commission. Neither INEA
nor the Commission is responsible for the use that may be made of the information
contained therein.

D3.1 Study of the state of the art and description of KPI and
KRI of terminals, hinterland mobility and rail network
Page 4 of 121
ExecutiveSummary
The INTERMODEL project aims at establishing a methodology to design and alternative
appraisal of multimodal freight terminals taking the most of the BIM tool and their
capacity for providing multi‐dimensional models. The dimensional models are to be
combined with different simulations models resulting in an aggregated decision‐making
tool to be used during the project‐planning phase and thorough its life cycle.
In such context, some performance measures and metrics are required, in order to
identify the key factors accountable in the design and location decision process, while
considering the future evolution of the terminals. Thus, the goal of WP3 during the first
three months of the project (M1‐M3) was to establish a set of Key Performance
Indicators (KPIs) for the assessment of intermodal freight terminals through in an ICT
environment. The work done and final findings being provided in this deliverable (D3.1).
The study started with a state of the art review of current performance measures used
in transport, logistics and the supply chain. The findings were completed with a
consultation on the project partners, in which experienced consultants in logistics,
building management and design, railway operators, terminal operators and public
bodies identified additional KPIs according to their particular objectives.
The combined work from the state of the art and the consultation process derived in a
long list of KPIs covering the different assessable aspects from any intermodal freight
terminal. The resulting list was examined during a working meeting held in Melzo and
La Spezia (Italy), and a deeper discussion took place regarding what indicators were the
most relevant to the different stakeholders. As a result, a methodology to identify the
final selection of KPIs to be used was proposed. First, a framework to organize the KPIs
from the expanded list was constructed where the main strategic goals, stakeholders,
performance dimensions and scope to be considered were identified and allowing to
first classify the KPIs according to the framework and afterwards shortlist the most
representative ones, to cover all fields in the classification.
The proposed methodology for selecting feasible performance measures (based on
relevant inputs from the literature review) is briefly introduced as follows:
1. Identification of the strategy and mission of the organization
2. Identification of stakeholders involved
D3.1 Study of the state of the art and description of KPI and
KRI of terminals, hinterland mobility and rail network
Page 5 of 121
3. Identification of the different perspectives that should be considered in the
performance system
4. Identification of particular strategic goals
5. Selection of effectiveness criteria and feasible KPIs and PIs set
6. Scoring process and determination of overall KPI score (aggregation
method)
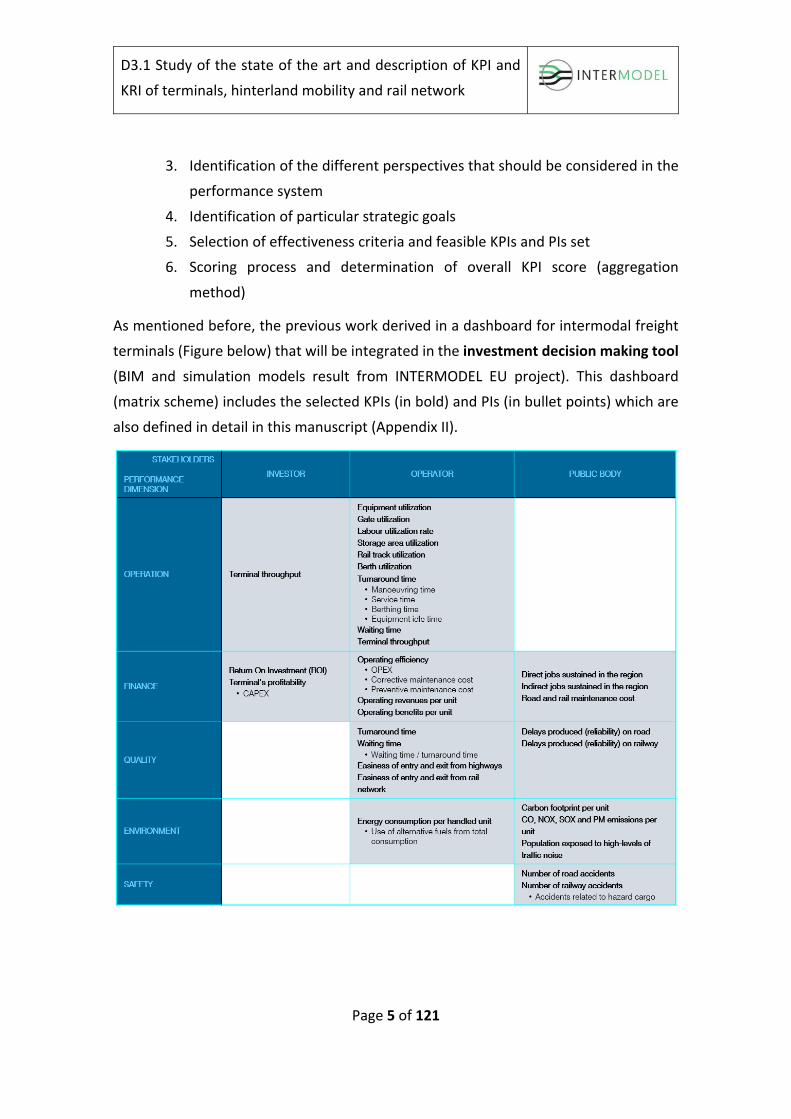
As mentioned before, the previous work derived in a dashboard for intermodal freight
terminals (Figure below) that will be integrated in the investment decision making tool
(BIM and simulation models result from INTERMODEL EU project). This dashboard
(matrix scheme) includes the selected KPIs (in bold) and PIs (in bullet points) which are
also defined in detail in this manuscript (Appendix II).

D3.1 Study of the state of the art and description of KPI and
KRI of terminals, hinterland mobility and rail network
Page 6 of 121
Finally, it should be highlighted that this tool will be really useful for both public
institutions and private companies since it will support decisions as regards to layout
design, building materials choice, operative planning, handling equipment selection and
allocation of intermodal freight terminals, simultaneously in the same framework.

D3.1 Study of the state of the art and description of KPI and
KRI of terminals, hinterland mobility and rail network
Page 7 of 121
Tableofcontents
Executive Summary .......................................................................................................... 4
1. Introduction ............................................................................................................ 10
1.1. Scope ................................................................................................................ 10
1.2. Audience .......................................................................................................... 11
1.3. Definitions / Glossary ....................................................................................... 11
1.4. Abbreviations ................................................................................................... 13
1.5. Structure .......................................................................................................... 14
2. State of the art ........................................................................................................ 15
2.1. Introduction and objectives ............................................................................. 15
2.2. General overview of measuring performance ................................................. 15
2.2.1. Purpose and definition ............................................................................. 15
2.2.2. Classification of indicators ........................................................................ 17
2.2.3. Measuring Risk, KRI feasibility .................................................................. 19
2.3. Measuring the performance of logistics, supply chain management and freight
transport ..................................................................................................................... 20
2.3.1. Logistics and supply chain performance .................................................. 20
2.3.2. Intermodal transport and freight terminals performance ....................... 21
2.4. Adoption of performance indicators to the BIM concept ............................... 31
3. Processes at intermodal terminals ......................................................................... 33
4. Methodology for KPI definition .............................................................................. 35
5. Selection and definition of KPI ............................................................................... 41
5.1. Identification of strategies and goals .............................................................. 41
5.2. Identification of actors involved ...................................................................... 42
5.3. Identification of the different perspectives for performance system ............. 43
D3.1 Study of the state of the art and description of KPI and
KRI of terminals, hinterland mobility and rail network
Page 8 of 121
5.4. Selection of effectiveness criteria and feasible KPIs and PIs set ..................... 45
6. Definition of KPIs and PIs ........................................................................................ 51
7. Conclusions ............................................................................................................. 52
References ...................................................................................................................... 55
Appendix I ....................................................................................................................... 64
Appendix II ...................................................................................................................... 71

D3.1 Study of the state of the art and description of KPI and
KRI of terminals, hinterland mobility and rail network
Page 9 of 121
List of Figures
Figure 1. Integrated transport chain. ............................................................................. 34
Figure 2. KPI & PI list methodology ................................................................................ 37
List of Tables
Table 1. Most common operational and financial indicators found in the literature
review ............................................................................................................................. 25
Table 2. Most common quality service, environmental and economic impact indicators
found in the literature review ........................................................................................ 29
Table 3. Relevant actors and functions in freight terminals .......................................... 42
Table 4. Performance dimensions ‐ Stakeholders matrix .............................................. 45
Table 5. Indicator’s categories proposed for the KPIs and PIs set ................................. 45
Table 6. KPI list for intermodal freight terminals ........................................................... 46
Table 7. Classification of performance indicators (KPIs and PIs) ................................... 49
Table 8. Template for KPI & PI definition ....................................................................... 51

D3.1 Study of the state of the art and description of KPI and
KRI of terminals, hinterland mobility and rail network
Page 10 of 121
1. Introduction
1.1. Scope
The INTERMODEL project aims at establishing a methodology for multimodal freight
terminals which allows taking the most of the BIM tool and its capacity for providing
multi‐dimensional models. These dimensional models are likely to be an input of
different simulations models in order to optimize the decision‐making process during
the project phase, based on financial, economic and environmental impact and
throughout the project life cycle, considering both the investment period and the
operation.
By combining and integrating abovementioned models (BIM and simulation tools) a
decision‐making tool would be developed. The target of this tool is to help decision‐
makers to determine which actions and proposals will contribute to reach a better
terminal performance, through the selection of the best location regarding both
operational and environmental aspects, an improved layout and optimized processes,
among others.
In such context, bearing in mind that this tool will show how future scenarios are
working, some performance measures and metrics are required to focus on key factors
and to make proper decisions. Thus, the aim of this deliverable is to establish a set of
Key Performance Indicators (KPIs) for the assessment of intermodal freight terminals
through an ICT environment. In particular, selected performance measures regarding
financial, operational, security, environmental and quality service issues would be
integrated within the developed BIM framework methodology resulting in a potential
contribution to the research community since no previous works have been found in
that sense.
To sum up, this deliverable will provide a set of KPIs (high‐level indicators) and PIs
(secondary level indicators) that will be included in a scoreboard integrated in the BIM
decision‐making tool. This comparative scoreboard that includes the selected KPIs
related to financial, operational, quality service, sustainable and safety issues and from
three points of view (investor/management, operator and public body) will help to
compare alternatives, assess potential measures and solutions and provide support to
decision‐makers taking into account both project definition and exploitation phases.

D3.1 Study of the state of the art and description of KPI and
KRI of terminals, hinterland mobility and rail network
Page 11 of 121
1.2. Audience
The intended audience of this document is any actor involved in activities related to
intermodal freight terminals, both seaport and inland, such as public administrations,
private terminal operators, logistics companies, shippers and rail operators.
The integrated tool developed within the project will allow a fast way to make decisions
in the planning and operation, taking into account the relevant KPIs defined in this
document.
1.3. Definitions/Glossary
In the current section a short description of main terms used in the manuscript are
described, that is:
BIM ‐ Building Information Model. Shared digital representation of physical and
functional characteristics of any built object, including buildings, bridges and traffic
networks. The acronym is also used to define management and Building Information
Modelling in general, referring to using model‐based applications. (ISO 12911)
BIM 6th dimension ‐ Energy efficiency and environmental impact. BIM is used to model
and evaluate energy efficiency and environmental impact, monitor a
building/infrastructure’s cycle costs and optimise cost efficiency.
BIM 8th dimension ‐ Operational simulation. Simulation of the operational running of
the infrastructure (e.g. the movement of cargo, the design’s adequacy to an efficient
logistics supply chain, detection of bottlenecks). BIM model will result in an integral
control platform.
Cargo ‐ Freight that is loaded into a container or on a trailer.
Dashboard ‐ A set of KPIs joined together in one overview screen. This way the user gets
an overall overview of the performance in one view.
Environment ‐ Surroundings in which an organization operates, including air, water,
land, natural resources, flora, fauna, humans and their interrelations.
Environmental impact ‐ Change to the environment, whether adverse or beneficial,
wholly or partially resulting from environmental aspects.

D3.1 Study of the state of the art and description of KPI and
KRI of terminals, hinterland mobility and rail network
Page 12 of 121
Environmental aspect ‐ Aspect of construction works, part of works, processes or
services related to their life cycle that can cause change to the environment.
Environmental performance ‐ Performance related to environmental impacts and
environmental aspects.
Equipment ‐ Crane, vehicles, reach stacker and others machines used in the terminal.
Functional performance ‐ Performance related to the functionality of the construction
works or an assembled system (part of works), which is required by the client and/or by
users and/or by regulations.
Gate ‐ A point at an intermodal terminal where a clerk checks in and out all containers
and trailer. All reservations and paperwork are checked at the gatehouse.
Greenhouse effect ‐ Environmental issue related to pollution. The greenhouse effect is
defined as the amount of CO2 (in kg) that reinforces the greenhouse effect to the same
degree as the substance emitted. CO2 emissions as a result of fuel combustion and CH4
emissions are mainly responsible for the greenhouse effect.
Idle time – Non‐productive time.
Indicator ‐ Quantifiable value related to performance or environmental
impacts/aspects.
Key Performance Indicator ‐ Indicator that tells you what to do to increase performance
dramatically. They represent a set of measures focusing on those aspects of
organizational performance that are the most critical for the current and future success
of the organization. The KPI will be calculated on the results of the simulation model.
Life Cycle ‐ Consecutive and interlinked stages of a product system, from raw material
acquisition or generation of natural resources to the final disposal.
Maintenance ‐ Combination of all technical and associated administrative actions during
the service life to retain a building or an assembled system (part of works) in a state in
which it can perform its required functions.
Output (operational) ‐ The simulation tool will provide two types of output: animation
and KPI.
D3.1 Study of the state of the art and description of KPI and
KRI of terminals, hinterland mobility and rail network
Page 13 of 121
Performance ‐ Expression relating the magnitude of a particular aspect of the object of
consideration relative to specified requirements, objectives and/or targets.
Social aspects ‐ Aspect of construction works, part of works, processes or services
related to their life cycle that can cause change to society or quality of life.
Social impact ‐ Any change to society or quality of life, whether adverse or beneficial,
wholly or partially resulting from social aspects.
Terminal simulation model ‐ A detailed simulation model of the intermodal operational
terminal processes. The network is either not simulated or at a higher level of
abstraction.
1.4. Abbreviations
The following list contains the most common abbreviations used in this deliverable:
3PL: Third Part Logistics
AI: Aggregated Indicators
ASC: Automated Stacking Cranes
BIM: Building Information Model
CAPEX: Capital Expenditure
DEA: Data Envelopment Analysis
ITU: Intermodal Transport Unit
KPI: Key Performance Indicator
OPEX: Operational Expenditure
PI: Performance Indicator
PMS: Performance Measurement System
ROI: Return On Investment
RMG: Rail‐Mounted Gantry cranes
RTG: Rubber‐Tired Gantry cranes
RoRo: Roll‐on Roll‐off

D3.1 Study of the state of the art and description of KPI and
KRI of terminals, hinterland mobility and rail network
Page 14 of 121
SFA: Stochastic Frontier Analysis
TEU: Twenty Foot Equivalent Unit
UNCTAD: United Nations Conference on Trade and Development
1.5. Structure
The present document is organized as follows:
Introduction: contains an overview of this document, providing its scope,
audience and structure.
State of the art and description of KPI and KRI: literature review carried out for
this research project focuses on potential areas and factors to be used for
defining performance and risk indicators for intermodal freight terminals. In
addition, the main contributions to the research community are described in the
last part of this section. And as a result of the assessment the use of KRIs is
disregarded and integrated within the PI used.
Methodology for KPI definition: contains the methodological approach followed
for the definition of the most appropriate performance indicators.
Definition of KPI and PI: presents and describes the KPIs and PIs developed for
the performance measurement of the intermodal freight terminals through a
new decision making tool.
Evaluation methods: proposes two different existing methods for aggregating a
set of KPIs in a single indicator.
Conclusions: gathers the main study findings and the final KPI and PI list
proposed to be included in the dashboard for the assessment of intermodal
freight terminals through the decision‐making tool, which will show the
supposed upgrade in performance in both design and operation phases.
In addition, Appendix I includes the list of KPI and PI obtained from the partners’
consultation, and in Appendix II, the definitions of the KPI and PI finally proposed are set
out.

D3.1 Study of the state of the art and description of KPI and
KRI of terminals, hinterland mobility and rail network
Page 15 of 121
2. Stateoftheart
2.1. Introductionandobjectives
The literature review carried out for this research project focuses on potential areas and
factors to be used for defining performance indicators for intermodal freight terminals.
Firstly, this section reviews the trends of organizations in regard to performance
measures and includes different definitions and approaches used in the literature.
Secondly, a categorization of the performance indicators in the field of logistics, supply
chain and freight transport from the literature is provided. Finally, examples of
integration of performance measures and indicators within BIM framework
methodologies has also been included in the analysis, but few cases were found ‐and
even not directly related to the scope of this project.
The purpose of this section is being a first step for selecting the relevant KPIs that the
model framework will use to make the right decisions that would contribute to an
improved layout, operational processes and location of intermodal terminals.
2.2. Generaloverviewofmeasuringperformance
2.2.1. Purposeanddefinition
Within the last years, measuring the performance of organizations has become more
significant with the globalization and increasing level of competition. Thus, performance
management systems are being used to ensure that companies and processes are going
in the right direction, achieving targets in terms of organizational goals and objectives
(Ghalayini and Noble, 1997).
Measuring or monitoring performance could be used by several purposes, that is:
Evaluating one or more aspects of the business or part of it and comparing it with
the best in its specific sector (Haponava and Jibouri, 2009);
Revealing the gap between planning and execution, helping companies to
identify potential problems and areas for improvement and making decisions
based on facts and;
Identifying success if improvements planned actually happened, identifying
whether customer needs are met, where problems and bottlenecks exist and
where improvements are required (Parker, 2000; Gunasekaran and Kobu, 2007).

D3.1 Study of the state of the art and description of KPI and
KRI of terminals, hinterland mobility and rail network
Page 16 of 121
According to the above purposes, different definitions of performance can be found in
the literature. For instance, Mentzer and Konrad (1991) defined performance as an
investigation of effectiveness and efficiency in the accomplishment of a given activity
and where the assessment is carried out in relation to how well the objectives have been
met. Neely et al. (1995) also considered that a performance measure is a set of metrics
used to quantify the efficiency and/or effectiveness of an action. In such case, the term
metric refers to the definition of the measure, how it will be calculated, who will be
carrying out the calculation, and from where the data will be obtained.
Gosselin (2005) stated that a performance indicator could be defined as the physical
value used to measure, compare and manage the overall organizational performance.
Similarly, Parmenter (2009) defined it as an indicator used by management to measure,
report, and improve performance. The approach given by Parmenter (2009) was aimed
at providing the missing link between the balanced scorecard work of Kaplan and Norton
(1996) which is a framework for integrating measures derived from the organization’s
strategy in which the drivers, encompassing customers, internal‐business processes and
learning and growth perspectives were derived into tangible objectives and measures.
This approach was extremely useful for a myriad of purposes: to communicate strategy,
to link strategic objectives to long‐term targets, to identify and align strategic initiatives
or even to perform periodic and systematic strategic reviews and obtain feedback to
learn from.
However, it should be mentioned that performance indicators used for measuring,
managing and comparing the performance of organizations, vary depending on the
nature of the organization, its strategy and the industry considered. Thus, different
authors (Leong et al. 1990; Mapes and Szwejckewski, 1997) stated that each
organization has to determine performance indicators and, subsequently, performance
measures and figures that are strategically relevant to its respective situation.
Therefore, we can find several perspectives or typologies of overall business
performance in the literature, but it is largely accepted that KPIs should be specific,
measurable, attainable, realistic and time‐sensitive (Shahnin and Mahbod, 2004). In fact,
they considered their so‐called smart criteria for defining and selecting appropriate
performance indicators and proposed an analytical hierarchy process to prioritize

D3.1 Study of the state of the art and description of KPI and
KRI of terminals, hinterland mobility and rail network
Page 17 of 121
indicators. Thus, the rest of the section will be focused on logistics and transportation
indicators.
Beyond the considerations from Shanin and Mahbod (2004), Castillo and Pitfield (2010)
presented a framework for identifying and selecting a small subset of sustainable
transport indicators and suggested five methodological and analytical attributes that are
desirable for transport indicators, that is: measurability, ease of availability, speed of
availability, interpretability and transport’s impact isolatable. Complementarily to both
previous criteria, the research project COCKPIIT suggested that indicators should have
direct relevance to objectives, an appropriate spatial and temporal scale, high quality
and reliability, clear identification of causal links and their collection should be realistic
and limited.
2.2.2. Classificationofindicators
On the first hand, we could find the classification of indicators according to Parmenter
(2009), that is:
Key result indicators (KRI) informs how something has been done in a
perspective;
Performance indicator (PI) indicate what to do in order to improve the
performance;
Key performance indicator (KPI) indicate what is the best to do to improve the
performance. Usually, these indicators are focused on those most critical for the
current and future success of an organization aspects of organizational
performance.
Secondly, and regarding the performance indicators (both PI and KPI), it was found that
many authors have suggested many categories for different approaches of performance
measurement but there are two main groups that are widely used, that is: financial or
cost based (measuring rate of return on investment, cash flow and profit margins) and
non‐financial or non‐cost based measures of performance (De Toni and Tonchia, 2001;
Bhatti et al., 2014, for instance). However, as stated in Gunasekaran and Kobu (2007)
other authors such as Beamon (1999) considered time, resource utilization, output and
flexibility or (Bagchi, 1996) classified indicators as function‐based and value‐based, like
performance measurements in logistics.
D3.1 Study of the state of the art and description of KPI and
KRI of terminals, hinterland mobility and rail network
Page 18 of 121
White (1996), De Toni and Tonchia (2001), Neely et al. (2005) and Parmenter (2009) also
consider non‐cost measures as quality, time, learning and growth, delivery reliability and
flexibility indicators for measuring the organizational performance. They also concluded
that the four main categories are namely costs, time, flexibility and quality. Out of these,
Sinclair and Zairi (1995) also consider the customer satisfaction, employee factors,
safety and environmental/social performance as the indicators of business performance
used by many organizations.
On the other hand, indicators can be classified according to the process and stage
measured and the scope of their effect (Marsden and Bonsall, 2005). Thus we can
differentiate by input, output, outcome and impact indicators; quantitative and
qualitative indicators, short term, intermediate and long term/final indicators, and
finally, as regards to the relation to decision‐making levels, in strategic, tactical and
operational (Gunasekaran et al., 2001).
Moreover, the classification proposed by De Rus et al. (2003) for transport activities
should be mentioned as well. They proposed two main groups: technical and economic
indicators. And for each group, the indicators were classified according to the
relationship between inputs and outputs. As an example, the productivity is an
output/input indicator, technical efficiency is an input/input indicator and utilization
measures could be output/output indicators. Then, we could have costs and revenues
in relation to input/outputs as the average cost and revenue per ton of cargo.
To sum up, performance measures and metrics could be classified according to the main
following sets:
Financial‐cost based /Non‐financial
Qualitative/Quantitative
Short/Medium/Long term
Strategic/tactical/operational level
Function‐based/Value‐based
Input/output/outcome indicators
Time/Quality/Flexibility/reliability
Safety and security
Environmental and sustainable indicators

D3.1 Study of the state of the art and description of KPI and
KRI of terminals, hinterland mobility and rail network
Page 19 of 121
2.2.3. MeasuringRisk,KRIfeasibility
Regarding the development of Key Risk Indicators (or KRI) (please not mistake with Key
Result Indicators, previously cited), are mainly used to assess the potential effect of
events that could determine a variation on the company (in this case terminal) initial
objectives (COSO, 2004). The potential loss resulting from each event can be quantified
in terms of probability and severity or impact (Sheffi and Rice, 2005; Einarsson and
Rausand, 1998).
Some efforts have been done to integrate both Performance and Risk Indicators in a
common framework, since the former measure performance and the later potential
losses measured in probability and impact. However, giving their different nature, they
are usually assessed separately (Arena and Arnaboldi, 2014).
The most common technique for KRI production is to assess all activities taking place,
identify their exposure to failure (risks), the cause behind such exposure and the
probability of its occurrence and its severity (Scandizzo, 2005).
The literature provides two different approaches to identify the risks a terminal can face:
in‐depth interviews with experts to identify risks and the relationships between causes
and consequences or by means of taxonomies of risks with associated sources and
manifestations (Cagliano et al, 2012). Once this point was reached, however, it would
become extremely difficult to produce meaningful KRIs to assess the vulnerability of the
system (terminal) at a planning stage. In fact, KRIs are dependent on environmental
factors and even operational (managerial) decisions that would provide frequency and
severity of the risks. In fact, KRIs are hard to be produced at a planning stage and virtually
impossible in virtual scenarios with no real placement.
Therefore, and given the previous considerations, it does not seem appropriate to
calculate Risk Indicators at this stage of the research, although initially considered.
The next section focuses on both performance indicators in logistics and supply chain
and in transport and infrastructure. The combination of them shapes a comprehensive
basis for the current research project.

D3.1 Study of the state of the art and description of KPI and
KRI of terminals, hinterland mobility and rail network
Page 20 of 121
2.3. Measuring the performance of logistics, supply chain
managementandfreighttransport
The logistics and transport industry also measures its performance through the use of
indicators and metrics which are essential for effectively managing logistics and
transport operations, particularly in a competitive global economy.
2.3.1. Logisticsandsupplychainperformance
A comprehensive review of recent literature (1995‐2004) regarding performance
measures and metrics in logistics and supply chain management can be found in
Gunasekaran and Kobu (2007) who tried to determine performance of a supply chain
system by using a minimum number of KPIs and providing reasonable accuracy with
minimum cost. The selected literature identified several important performance
indicators in the evaluation of logistics efficiency and effectiveness differentiating those
researchers focused on the field of logistics from those focused on the broader supply
chain, such as Garcia et al. (2012), Schönsleben (2012) and Lohman et al. (2004).
The results of the literature survey indicated that clear and specific objectives and
consistency in measuring are the key factors to success. In parallel, they provided 27
measurements called KPI for supply chain performance. They also stated the most
widely used performance measurement was financial performance, usually related to
strategic level of decisions such as rate of return on investment, sales, profit, etc. The
non‐financial most common measures were labor efficiency, capacity utilization,
forecasting accuracy, cycle times, production flexibility, value added, service variety and
perceived quality.
Following the above approach, Krauth et al. (2005) presented a literature survey on the
concept of performance indicators in logistics and a framework capturing the dynamics
of performance indicators for logistical service providers including an extensive list of
KPIs. In particular, they proposed the following type of indicators: (1) from the
management point of view (effectiveness, efficiency, satisfaction, IT and innovation); (2)
from the employee’s point of view (working conditions, salaries and benefits or km per
trip); (3) customer’s point of view (transportation price, goods safety, response time,
timeliness of goods delivery, etc.) and; (4) from the society’s point of view (level of CO2
emissions, disaster risk, road maintenance costs, number of available work places, use
D3.1 Study of the state of the art and description of KPI and
KRI of terminals, hinterland mobility and rail network
Page 21 of 121
of innovation technologies, etc.). However, their contribution was that they present a
first‐step towards a long term aim to use indicators ex‐ante rather than post‐ante.
Other authors as Rafele (2004), Rushton et al. (2010) and Domingues et al. (2015)
organized the logistics indicators according to three dimensions: activities (transport,
warehousing and customer service), actors (carriers, 3PL and warehouses) and decision
level dimension (operational, tactical and strategic).
Domingues et al. (2015) also proposed a performance measure framework focused on
the transportation activity of a 3PL firm, offering a clear guide to compute and organize
the 27 selected indicators with a user‐friendly interface. They introduced a record sheet
for each KPI where a more detailed description and usage recommendations were
presented, including the formula, frequency of measurement, the drivers involved and
units of measure. Among the selected indicators, it is worthy to highlight the following
indicators: capacity, distance travelled per day, turnover per km, delivery frequency,
profit per delivery, on‐time delivery performance, product changeover time, claims due
to quality fails, order to delivery cycle time, distribution of transportation costs and the
traditional productivity.
Finally, some useful and relevant indicators regarding the performance of maritime
logistics chains can be found through the literature. In such context, Gunasekaran et al.
(2001) suggested the following indicators: lead time, the percentage of goods in transit,
the number of faultless notes invoiced, the flexibility of delivery systems or the total
distribution cost.
Despite the logistics and supply chain approach is not directly related to the scope of
the current project, there are several performance measures that can be adapted for
the performance of intermodal freight terminals. In fact, the approach given by Krauth
et al. (2005) satisfies the overall target of the INTERMODEL EU project and will be taken
into account for the final KPIs definition.
2.3.2. Intermodaltransportandfreightterminalsperformance
According to the major trend found in the literature review, it has been considered
appropriate to analyze indicators in this section distinguishing between operational and
financial performance measures and, on the other hand, indicators related to quality
service, environmental and sustainable measures.

D3.1 Study of the state of the art and description of KPI and
KRI of terminals, hinterland mobility and rail network
Page 22 of 121
Operationalandfinancialperformanceindicators
In the maritime and seaport terminals field, many indicators have been defined to
compare performance. Thomas and Monie (2000) stated the measurement of port or
terminal efficiency is of particular importance because they are vital to the economy of
the region and to the success and welfare of its industries and citizens.
Traditionally such measurements have been focused on cargo‐handling productivity
indicators at berth (UNCTAD, 1976; Bendall and Stent, 1987; Ashar, 1997), by measuring
a single factor productivity (De Monie, 1987) or by comparing actual with optimum
throughput over a specific time period (Talley, 1998).
Since then, the number of port performance studies has increased roughly and can be
organized in three groups according to its approach (González and Trujillo, 2009): (1)
studies that use partial indicators of productivity but do not analyze the joint
contribution of all inputs to production nor give an acceptable treatment to multi‐output
processes; (2) studies that deploy simulation tools and queueing theory to analyze
operations and processes from an engineering view; and (3) a new generation of studies
based on formal efficiency measures stemming from the work developed by Chang
(1978). In this view, two approaches namely Data Envelopment Analysis (DEA) and
Stochastic Frontier Analysis (SFA) have been utilized to analyze port performance in
terms of technical efficiency (González and Trujillo, 2009; Tongzon, 2011; Cullinane et
al., 2005; etc.).
Nevertheless, this kind of approaches falls beyond the scope of this research project,
since the target is developing a decision‐making tool for decision‐makers in intermodal
transport and not to compare intra‐port performance of on‐going intermodal freight
terminals, although some concepts and approaches could be adapted. In addition, these
techniques require large amounts of data and makes their calculation quite difficult and
complex due to its stochastic character.
Regarding the use of performance indicators in ports and container terminals, it should
be firstly mentioned the original performance indicators that were proposed by UNCTAD
(1976) and classified in two groups: financial and operational indicators.
Then, Owino et al. (2006) were able to identify up to 30 different performance indicators
in 18 different papers. As an example, Le‐Griffin and Murphy (2006) proposed various

D3.1 Study of the state of the art and description of KPI and
KRI of terminals, hinterland mobility and rail network
Page 23 of 121
productivity indicators as well as utilization rates at crane, berth, yard, gate, and gang
levels. Due to the vast number of indicators, Trujillo and Nombela (1999) and Bichou
and Gray (2004) stated that all performance indicators can be roughly grouped in three
categories: physical, productivity and economical and financial related; whereas Thomas
and Monie (2000) suggested that measures can be divided into four categories also:
production (throughput measures), productivity, utilization and service measures.
Other researchers such as Chung (1993), Talley (2007), Longo et al. (2013), Ducruet et
al. (2004) and Hakam (2015) consider an additional category of operational performance
measures namely, time‐related indicators. These kind of indicators could largely
illustrate the capability of ports and terminals in terms of operational and service quality
performance showing how efficiently ports serve the customers. The most common
used indicators in that sense are the average turnaround time and the dwell time which
is the number of days a unit of cargo remain at the terminal. In that context, Cariou
(2012) and Suarez‐Aleman et al. (2013) disaggregated turnaround time (port time) in the
combination of several components such as port access, waiting, maneuvering,
berthing, productive (service) and idle time, which can be applied for the main actors of
an intermodal terminal (trucks, trains and vessels). Indeed, the time between ship arrival
and departure, for many years has been described as one of the major indicators
measuring time efficiency of ports, although it is not reported by ports regularly (De
Langen, Nijdam, Horst, 2007). Finally, the time for customs and other administrative
procedures could also be considered.
As regards to financial performance, the port’s performance can be evaluated over time
from a single‐port approach or relative to the performance of other ports (multi‐port
approach) which generally relay upon frontier statistical models (DEA and SFA).
Traditional indicators were firstly introduced by UNCTAD (1976) such as the cargo
handling revenue, contribution per ton or the capital equipment expenditure per ton of
cargo, etc. but usual financial statements (income, profit and loss account, balance
sheet) related to the tonnage of cargo handled at the port/terminal.
However, regarding the objective of the INTERMODEL project and following Talley
(2007), a port/terminal should be evaluated from the standpoint of technical efficiency,
cost efficiency and effectiveness by comparing its actual throughput with its economic
technically efficient optimum throughput, cost efficient optimum throughput and
D3.1 Study of the state of the art and description of KPI and
KRI of terminals, hinterland mobility and rail network
Page 24 of 121
effectiveness optimum through‐put, respectively. In that sense, deriving from a previous
work of Talley (1996), 17 performance indicators with respect to the cost/technical
efficiency and effectiveness were proposed. From this research work, it is worthy to
highlight those indicators that try to perform the maximization of annual throughput
subject to a profit constraint, bearing in mind operating, financing and maintenance
costs.
Marlow and Paixao (2003) also included financial indicators within a basis framework
for measuring the multimodal process effectiveness relative to the objective of
minimizing door‐to‐door cost in order to provide a better customer satisfaction and
improved performance. These indicators were the overall transport cost, ship costs by
unit of cargo carried and port costs by unit of cargo handled. In addition, and beyond
operational port performance measures, Marlow and Paixao (2003) highlighted the
importance of measuring port effectiveness in the context of the need for leanness and
agility in port operations, and suggested a set of new indicators to reflect increased
visibility within the port environment and along the entire logistics transport chain.
Alternatively, to classic financial measures, De Langen et al. (2007) focused on the
regional economic impact of the ports and on the attractiveness of the port as a location
for port‐related industries. Therefore, port‐related employment and value added were
also used as port performance indicators, concept that could be extended to intermodal
freight terminals as well.
Regarding performance measures of intermodal freight terminals, Ferreira and Sigut
(1993) considered that the major determinants on terminal performance were lifting
equipment and labor productivity, pick‐up/delivery cycle times, track and physical
layout, train reliability, management information systems and work practices. According
to them, the most useful performance indicators are related to the lifting equipment
performance (equipment availability, reliability and operational productivity) and the
financial performance distinguishing between the ones used to monitor performance
of the terminal on an ongoing basis, and those which address the long term financial
viability of terminal operations. In particular, the terminal operating cost and the overall
terminal cost (including capital provision) per container handled are the indicators
required to manage a terminal.

D3.1 Study of the state of the art and description of KPI and
KRI of terminals, hinterland mobility and rail network
Page 25 of 121
To sum up, Table 1 shows the most common indicators as regards to operational and
financial performance used for measuring namely port performance, seaport terminals
and intermodal freight terminals.
Table 1. Most common operational and financial indicators found in the literature review
Category of performance indicator
Subcategory of performance indicator
Performance indicator Main sources
Operational Productivity/
utilization
Quay productivity/utilization
Terminal area productivity/utilization
Storage area utilization
Equipment productivity/utilization
Gate utilization
Berth occupancy
Labor productivity/utilization
UNCTAD (1976)
Ferreira and Sigut (1993)
Le‐Griffin and Murphy (2006)
Marlow and Paixao (2003)
Hakam (2015)
Thomas and Monie (2000)
Talley (1996)
Time‐related Turnaround time
Waiting time
Service time
Maneuvering time
Berthing time
Idle time
Cut‐off time
Dwell time
Total time delays
Time for administrative procedures
Le‐Griffin and Murphy (2006)
Cariou (2012)
Chung (1993)
De Langen, Nijdam and Horst (2007)
Ducruet et al. (2004)
Marlow and Paixao (2003)
Nam et al. (2002)
Suarez‐Aleman et al. (2013)
UNCTAD (1976)
Pachakis and Kiremidjian (2004)
Tahar and Hussain (2000)

D3.1 Study of the state of the art and description of KPI and
KRI of terminals, hinterland mobility and rail network
Page 26 of 121
Category of performance indicator
Subcategory of performance indicator
Performance indicator Main sources
Financial Investment and funding
Infrastructure construction
Equipment purchase
Profitability
Turnover
Revenues/Expenditures
Ferreira and Sigut (1993)
UNCTAD (1976)
Chung (1993)
Talley (2007)
Costs and pricing
Labour costs
Equipment costs
Infrastructure costs
Maintenance costs
Ferreira and Sigut (1993)
Marlow and Paixao (2003)
Talley (1996)
UNCTAD (1976)
Qualityserviceandenvironmentalperformanceindicators
Beyond financial and operational performance measurements, the literature review
shows how organizations, ports and terminal operators also focus on indicators related
to product quality, flexibility and reliability, product variety and innovation.
Regarding port terminals and, for extension any kind of freight terminal, quality
indicators are waiting time over service time, berth occupancy rate and total turnaround
time ‐ and its two components, service time and waiting time‐, among others. In all cases
considering both, average values and their probability distribution function (Huynh and
Walton 2005, Dragović et al. 2005 or Henesey et al. 2003). Actually, authors like Ballis
(2004) or Henesey (2006) consider waiting time as one of the most important indicators
when evaluating the quality/performance of a terminal and Notteboom (2006) related
the influence of time factor and delays due to port congestion on liner shipping schedule
reliability.
Waiting time over service time ratio is a performance indicator found in a broad range
of papers, from Bassan (2007) to UNCTAD (2006) or Fourgeaud (2000). It expresses the
idea that ships with less cargo to discharge cannot afford waiting as long as ships which
may have several times more cargo. However, this indicator can be misleading since its
D3.1 Study of the state of the art and description of KPI and
KRI of terminals, hinterland mobility and rail network
Page 27 of 121
value increases as the turnaround time for a ship in port decreases, due to, for instance,
a better performance of the terminal operative.
Berth occupancy rate, in turn, is commonly used as a means to express the degree of
congestion a specific terminal is facing. Usually, a maximum waiting probability is given,
from which the maximum berth occupancy can be obtained by means of either
simulation or simplified queuing problems (see Bassan (2007), for instance). However,
those numbers depend as well on the terminal typology whether bulk, container (the
most studied kind) or RoRo, the arrivals traffic pattern, the number of berthing points
and the service time as well as the maximum waiting time allowed (Agerschou, 2004;
Fourgeaud, 2000) and, therefore, cannot define quality without help of any other
indicators.
Later on, the quality of service issue was also considered a key role in the design and
operation of intermodal freight terminals (Ballis, 2004). This was introduced through the
Level of Service concept that was developed to provide a measure of the comfort and
convenience experienced by system users. In that sense, Ballis (2004), following the
conclusions drawn by the project IQ by the European Commission (Mathonnet, 2000),
proposed quality standards and were quantified through a limited number of indicators
that are classified according to an A‐F scale.
Service (quality) is tightly linked with time measurements to complete the processes
affecting the customer (Morales‐Fusco et al., 2010). In that sense, the indicators that
are directly affecting time‐related performance identified in the literature are: waiting
time of the user in the system, reliability (no delays, no wrong delivery), flexibility (if a
system can easily respond to changes in requirements), qualification (terminal’s
capability), terminal accessibility during the day which can be both identified as the
opening and closing time of the terminal and in regard to physical access. Additionally,
safety and security (% of lost or damaged cargo) should be considered as quality related
indicators.
On the other hand, energy efficiency and emissions have gained importance in recent
years since minimizing the environmental impact of transport has become a cornerstone
of transportation policies at an EU level and in general, while accident‐free transport is
in the interest of all parties involved. For example, the PPRISM project (ESPO, 2010)
developed a port performance dashboard of indicators at European level in which socio‐

D3.1 Study of the state of the art and description of KPI and
KRI of terminals, hinterland mobility and rail network
Page 28 of 121
economic impact and environmental performance indicators were included together
with other kind of categories (market, logistic chain, operational and governance); and
the Delft University developed a model that determines transport cost and emissions
related to intermodal transport chains (Rigo et al., 2007). The environmental indicators
(Litmann, 2007) range from air emissions to noise hindrance, erosion of river banks,
habitat loss and disturbance of animal habitats. The energy consumption and the use of
renewable fuels together with transport accidents were also recommended.
As regards to green performance measurements, environmental impact is considered
besides time, cost, quality, volume, flexibility (Andersen and Fagerhaug, 1999). Air
pollution, energy recovery and recycling were used to measure the environmental
performance in the green supply chain management and performance measurement
system (Hervani, 2005). In Rothenberg (2005), they discuss the performance indicators
used to do environmental benchmarking in the automobile industry. The metrics they
use include regulatory, gross emission efficiency and life cycle.
The Halifax Regional Municipality (GPI, 2008) also intended to provide sustainable
transportation indicators. The energy consumption, greenhouse gas emissions, space
taken by transport facilities, access to public transportation are some examples used to
evaluate transportation system performance in Halifax region.
As regards to the performance assessment for intermodal chains, Rigo et al. (2007)
introduce a sustainable transport performance indicator which is a global score obtained
by analyzing environmental, economic, logistic and safety performance in an integrated
way. In particular, they focused on air emissions (CO2, CO, NOX, SOX and PM) measured
in grams per ton of cargo.
The potential of environmental indicators has been found when analyzing intermodal
transport and the location of dry ports. Many studies (Lv and Li, 2009; Wei et al., 2010;
Hanaoka and Regmi, 2011) consider the environmental protection, the reduction of air
emissions and port congestion or even the promotion of intermodal transport through
the modal shift as potential decision‐indicators.
With regards to the socio‐economic impacts, the PPRISM project distinguished
indicators in two categories: expressed in absolute figures and expressed in relative
terms. In relation to the first category, we could find the gross value added, the

D3.1 Study of the state of the art and description of KPI and
KRI of terminals, hinterland mobility and rail network
Page 29 of 121
employment measured in full‐time equivalent, fiscal revenues which provides an insight
into how port activities contribute to the flow‐back to the treasury of a country/region,
the investment and trade values that provide an insight of the importance of the port
for international trade. Based on the analysis of indicators expressed in absolute terms,
a number of indicators could also be useful for a variety of purposes: value added per
ton, employment per unit of land and/or value added per invested euro by the public
sector.
Similar to previous section,Table 2 resume the most common measures and indicators
regarding quality service, environmental, sustainable and socio‐economic issues.
Table 2. Most common quality service, environmental and economic impact indicators found in the literature
review
Category of performance indicator
Subcategory of performance indicator
Performance indicator Main sources
Quality service
Safety and security Flexibility Reliability and service care Accessibility and connectivity
Time‐related indicators % of lost or damaged cargo No delays, no wrong delivery Employees qualification Incidence of train/vessel delay in departure (%) Schedule reliability
Ballis (2004) Huynh and Awad‐Núñez et al. (2015) Walton (2005) Dragović et al. (2005) Henesey et al. (2003) Notteboom (2006) Marsden et al. (2005) Agerschou (2004) Fourgeaud (2000)
Environmental /sustainable
Accidents Noise Air pollution Climate change Water pollution Habitat loss Hydrologic impacts Energy consumption Sprawl Congestion Resource efficiency
Number of transport accidents, fatalities, injured, polluting accidents, etc. Crash casualties and costs Air pollution emissions Embodied emissions Noise pollution exposure People exposed to traffic noise above 55 LAeq Impervious surface coverage Habitat preservation Community livability ratings Water pollution emissions
Litman (2007) Litman (2016) GPI (2008) Marsden, et al (2005) Hanaoka and Regmi, 2011

D3.1 Study of the state of the art and description of KPI and
KRI of terminals, hinterland mobility and rail network
Page 30 of 121
Category of performance indicator
Subcategory of performance indicator
Performance indicator Main sources
Use of renewal fuelsEnergy efficiency Vibrations Mode split
Socio‐economic impact
Economic impact Return on investment
Value added per tonEmployment per unit of land Value added per invested euro by the public sector Port‐related employment Port value added
ESPO (2010) De Langen et al. (2007)
The use of performance indicators in the port industry has increased in recent years. For
instance, the Port of Rotterdam uses 32 KPIs to grade port operations and assess the
current quality of the services. Similarly, the Port of Hamburg, in the framework of
project StratMoS (Doderer, 2011), developed three sets of indicators ‐depending on the
point of view of the stakeholder being involved‐ to assess port performance,
qualitatively, and depending on the user considered. The system is usually automated
and can be checked dynamically, for instance, the Port of Venice developed the LogIS
system to follow up how several KPIs perform.
Finally, we would like to highlight, the project COCKPIIT (Posset et al., 2010) that
presented and analyzed the different areas of application for intermodal performance
indicators. This concept intended to provide a new approach in the domain of
intermodal performance indicators from a door‐to‐door perspective in which
transshipment nodes (terminals) are part of it. The core element of this innovative
approach was the so‐called transport pyramid that includes all components of
intermodal transport. Actually, they considered three different dimensions:
System dimension: chain, entity, process and resource perspective;
Performance dimension: operational, service quality, financial and
environmental;
Transport mode view: rail, road and inland navigation.
Then, by combining the three different dimensions several indicators were proposed.
For example, under the operational performance we could find the total lead time,
utilization, productivity and throughput. The service quality dimension is related to
D3.1 Study of the state of the art and description of KPI and
KRI of terminals, hinterland mobility and rail network
Page 31 of 121
three main subcategories (flexibility, reliability and service care and safety and security).
The financial performance includes resulting costs for operation, maintenance and final
prices for the customers. Finally, environmental performance was focused on emissions,
noise pollution, energy consumption land take and conservation.
2.4. AdoptionofperformanceindicatorstotheBIMconcept
In such context, the literature regarding the use of performance measures is mainly
focused on the benefits due to the use of BIM methodologies in construction projects
(Fazli et al., 2014; Sarkar et al., 2015; McAuley et al., 2013). In particular, this kind of
indicators try to measure the effectiveness of BIM as a tool in project management. They
measure whether a project is considered successful in relation to budget, project
schedule, satisfaction of the client, or according to technical specifications. That is, they
compare the cost and time reduction or control with traditional Design‐Bid‐Build
approach or even the improvements in communication between main stakeholders
involved.
The only KPI that could be currently integrated in BIM tools might be the cost estimation
at any point in the design phase which can be used as input data to evaluate financial
indicators.
Therefore, the literature showed a need for integrating and developing a tool in BIM in
which performance measures related to the operating phases (post‐building) of
transport infrastructure should be included. This will help decision‐makers to deliver a
project successfully, not only in the coordination, communication and construction
planning but also in financial, operating, environmental, safety and quality terms once
on duty. It should be highlighted that the three last issues are related to the 6th, 7th and
8th BIM dimensions which are currently being developed.
To conclude the literature review, the potential contributions of this research project
as regards to the use of performance measures is threefold:
1. A selected group of performance indicators organized in five categories are
proposed in order to measure and monitor the performance of intermodal
freight terminals (road/rail and road/rail/sea facilities) in a holistic approach.
These indicators will evaluate (1) the performance of terminal operations from
both technical and economical point of view; (2) the external effects as regards
D3.1 Study of the state of the art and description of KPI and
KRI of terminals, hinterland mobility and rail network
Page 32 of 121
to sustainable, safety and environmental terms; and (3) the financial
requirements from the investor/management point of view.
2. The literature review showed that operational and financial performance
indicators are vastly employed for seaport and intermodal terminals but quality
service, sustainable and environmental measures are particularly required for
evaluating freight terminals (transhipment nodes within supply chains) and its
impact on its neighbourhood. Individual contributions were found from a
sustainable and environmental point of view but an integrated approach is
required for intermodal freight terminals.
3. The integration of selected performance indicators in BIM tools for assessing the
performance of intermodal freight terminals in both construction and operating
phases will constitute a great contribute since just construction cost indicators
are currently integrated in BIM.
D3.1 Study of the state of the art and description of KPI and
KRI of terminals, hinterland mobility and rail network
Page 33 of 121
3. Processesatintermodalterminals
In order to evaluate the performance of intermodal freight terminals and its interaction
with the hinterland and railway network as a whole, it is necessary to first understand
the operations and processes of intermodal terminals, how they interact with each other
and how cargo is transhipped between modes of transport.
Intermodal freight terminals are interfaces within intermodal transport chains where
transhipment of loading units between different modes of transport (ship, truck and
train) take place, and they depend widely on the trunk haul operation forms and the
hinterland transport.
Terminal processes can be organized according to the following subsystems:
Delivery and receipt operations: It refers to those terminal operations required
to deliver or receive cargo from a truck or train. This kind of operations includes
gate operations in which trucks and trains are identified and registered at land
gates and then, loading and unloading operations. Depending on the terminal
layout, the container or ITU will be picked‐up or delivered by internal
transportation equipment or by yard cranes in corresponding transfer points.
Storage operations: The storage yard serves as a buffer for loading, unloading
and transhipping cargo. According to the type of cargo, two ways of storing can
be distinguished: storing on chassis or directly with the truck/trailer and, stacking
on the ground in which cargo is piled up. Usually, the container yard is served by
several yard cranes such as rubber‐tired or rail‐mounted gantry cranes
(RTG/RMG), straddle carriers or automated stacking cranes (ASC) in the case of
an automated terminal.
The process of storing (or retrieving) a container or ITU includes the time for
adjusting the RTG, picking up the container or ITU, moving toward the allocation
place and downloading the container or ITU.
Transfer operations: It refers to transport operations within the intermodal
terminal. It includes those moves from the storage yard to the gate, from the
shore to the yard and, when needed, to relocate cargo within the storage area.
This horizontal transportation moves are performed by internal trucks, straddle
carriers or even reach stackers.

D3.1 Study of the state of the art and description of KPI and
KRI of terminals, hinterland mobility and rail network
Page 34 of 121
Ship/Train‐to‐shore operations: It refers to quayside operations at seaport
terminals or rail track operations at intermodal freight terminals in which loading
and unloading of ships and/or trains is carried out by quay cranes and lifting
equipment (gantry cranes), respectively.
The Figure 1 below shows a typical layout of an intermodal freight terminal including
relevant infrastructure and terminal equipment according to the subsystems
abovementioned.
Figure 1. Inland terminal layout
Source: COCKPIIT Final Report (Posset et al., 2000)
Other common logistical functions at intermodal freight terminals are:
packing/groupage, cargo consolidation, warehouse services, trucking service,
maintenance and repair of vehicles/equipment/means of transport, provision of
equipment/TEUs/ITUs, etc.

D3.1 Study of the state of the art and description of KPI and
KRI of terminals, hinterland mobility and rail network
Page 35 of 121
4. MethodologyforKPIdefinition
This section outlines the methodology adopted on this task to establish a suitable short
list of recommended KPIs for adoption in the ‘investment decision making tool’. This
tool will be useful for both public institutions and private organizations and based on
the application of the BIM modelling technology to the logistic processes and the
terminal operations management combined with simulation tool models.
As shown in the literature review (Section 2), deriving KPIs is not a simple accounting
task, as it must include a deep understanding of the business and/or operations to be
successful. As such, different Performance Measurement Systems (PMS) were proposed
to determine and monitor KPIs. The most well‐known approach is the Balance Scorecard
developed by Kaplan and Norton (1996) which links the vision and strategy of an
organization between four perspectives (customer, financial, internal business
processes and learning and growth). Then for each strategic organization’s objective a
performance measure and target values are defined. Later, different measures and
solutions are proposed to achieve it.
Other PMS include the performance measurement matrix implemented by Keegan, Eiler
and Jones (1989) and the Performance Prism (Neely, Adams and Kennerley, 2002) which
was used in the project COCKPIIT (Posset et al., 2010) in order to provide a new approach
in the domain of intermodal performance indicators from a door‐to‐door perspective in
which transshipment nodes (terminals) are part of it.
However, above techniques require the user to consider potentially dozens of
relationships at one time. Thus, there is a demand for simple KPI selection processes
such as the approach suggested by Horst and Weiss (2015) which focuses on
manufacturing processes and excludes much of the complexity found in other PMS.
In such context, taking inputs from the previous approaches, the method of KPI and PI
selection proposed for the INTERMODEL EU project is introduced as follows:

D3.1 Study of the state of the art and description of KPI and
KRI of terminals, hinterland mobility and rail network
Page 36 of 121
1. Identification of the strategy and mission of the organization
The first step for selecting feasible KPIs and PIs is identifying the strategies that an
organization would like to achieve. That is, the selection of those performance
indicators must be aligned with the strategies in order to assess and monitor major
decisions and measures related to each strategy.
2. Identification of stakeholders involved
In order to make appropriate decisions it is really important to identify all those
stakeholders involved and affected by those decisions. Thus, selected performance
measures should take into account the different points of view.
3. Identification of the different perspectives that should be considered in the
performance system
The objective of identifying the different perspectives involved in the performance
system is minimizing information overload by limiting the number of measures
used. Actually, if forces managers and decision‐makers to just focus on handful
measures that are most critical for an organization.
4. Identification of particular strategic goals
The target of this stage is identifying those objectives that an organization’s strategy
is trying to achieve. For instance, under the strategy of increasing the operational
efficiency a strategic goal could be the improvement of equipment productivity.
5. Selection of effectiveness criteria and feasible KPIs and PIs set
The selection of feasible KPIs and PIs will result in a comparative scoreboard which
will be used to assess different terminal layouts, operational processes, allocation,
type of equipment and materials, etc. Due to the importance of this stage, the
authors have followed the sequential phase depicted in Figure 2.

D3.1 Study of the state of the art and description of KPI and
KRI of terminals, hinterland mobility and rail network
Page 37 of 121
Figure 2. KPI & PI list methodology
First of all, a revision of the literature and main research projects regarding the use
of performance measures within supply chain, freight terminals, multimodal
transport and logistics has been undertaken. In parallel, main partners involved in
the industry of intermodal transportation (terminal operators, public administration,
road freight providers, railway operators and experts in transport and logistics) were
consulted in order to provide their inputs and experiences regarding the use of
performance measures in their daily decisions. The KPI list generated by the
partners’ consultation is included in Appendix I of this deliverable.
As a result of this initial phase, a list of KPIs was obtained. Then, these indicators are
assessed qualitatively against the following criteria:
‐ Data access, referring to the easiness in researching the information needed to
calculate the performance indicator;
‐ Effort, in case data has to be collected by the operator, then it is referred to the
amount of effort that it takes;
‐ Clarity, defined as the ability to easily understand the performance indicator;
‐ Measurability, on basis of comparable data;
‐ Transferability, referring to the possibility of using the same data source in
terminals modelled from different regions or Member States.
‐ SMART criteria: It is the acronym standing for Specific, Measurable, Attainable,
Relevant and Time‐bound.

D3.1 Study of the state of the art and description of KPI and
KRI of terminals, hinterland mobility and rail network
Page 38 of 121
6. Scoring process and determination of overall KPI score (aggregation method)
Following the objective of developing a decision‐making tool, it has been considered
the possibility of combining the values of different KPIs in a single and/or reduced
number of values. This section outlines two possible methods to calculate the
aggregated indicator(s). However, the choice of the final methodology should be
done after further analysis is done and some KPI and PI values are obtained to be
used as benchmarking. That is, at completion of WP2, WP4 and WP8.
Ideally, the aggregated indicator(s) (AIs) should cover all stakeholders, performance
dimensions and scopes of INTERMODEL project, either by providing a value for each
field considered or by considering them equitably in its final form.
In any case, the analysis proposed has to be multivariate considering the multiple
sources (KPI and PI values) available to evaluate. Despite the quantity of data
available, the ability to obtain a clear picture of what is going on and make proper
decisions is a challenge.
Possible methodologies for the multivariate analysis:
Total factor productivity (OECD, 2002): Total factor productivity (TFP)
derives directly from differentiating ‘cost/input’ from ‘profit/output’
indicators. That is, assessing, how much it can be achieved (outputs)
considering the investment (inputs) made. The formulation of this AI is rather
simple to obtain since is calculated directly by dividing all outputs
contribution by all inputs.
⁄
With:
, 1
, 1
To construct such AI it will be necessary to first identify which KPIs are
outputs and which are inputs. Some of them will come straightforwardly
(total throughput or Work places would be desirable outputs whereas CAPEX

D3.1 Study of the state of the art and description of KPI and
KRI of terminals, hinterland mobility and rail network
Page 39 of 121
and OPEX would be inputs) but some others might be more difficult to
classify (equipment utilization, to say one).
Another difficulty would be weighting the relative importance of each input
and output on the final score. In that sense, different weighting
methodologies, like the ones defined below, could be applied to each set of
variables.
Delphi method (Loo 2002): The Delphi method is a methodology to weight
variables in a multi‐criteria analysis using the opinions of panels of experts in
a structured manner. The technique is designed as a succession of
communication processes which aims to achieve a convergence of opinion
on specific issue, in this case, the weight assigned to each indicator.
The method needs of a board panel of experts covering all stakeholders
affected by the evaluated alternatives, experts on the topic and policy
makers. The members of the panel will be consulted in multiple (3‐4) rounds
by the coordination of the consultation process. Each time a structured
questionnaire will have to be answered anonymously by all panel members.
The results will be then assessed quantitatively and qualitatively and
redistributed to the panelists together with further and more precise
questionnaires focusing on the areas where consensus has not been found.
The main issues with the Delphy method, besides untying irreconcilable
mixed opinions is the possible lack of representativeness of the panel of
experts. This problematic can be partially addressed triangulating the results
(for instance with independent samples).
ELECTRE methods: ELECTRE (ELimination and Choice Expressing REality)
method is a family of multi‐criteria decision analysis dating back to the mid
1960s and first proposed by Bernard Roy (1968) and updated thorough the
years and applied to multiple fields related where choices or rankings
between multiple alternatives have to be done.
The main idea behind the method is to compare each pair of alternatives
comprehensively (using all KPIs) and assess the outranking relationships
D3.1 Study of the state of the art and description of KPI and
KRI of terminals, hinterland mobility and rail network
Page 40 of 121
between them, allowing to disregard some alternatives and the KPIs that do
not add value in the decision‐making process.
In this case, the application of the method will result in a shortlist of KPIs (and
alternatives). The shortlisted alternatives can then be assessed by any other
method or, using again the ELECTRE approach, successively until the final
weights and winning alternative are obtained. As a result, the final set of KPIs
and their relative importance would vary each time.

D3.1 Study of the state of the art and description of KPI and
KRI of terminals, hinterland mobility and rail network
Page 41 of 121
5. SelectionanddefinitionofKPI
In this section, the methodology previously proposed is applied for the scope of the
INTERMODEL EU project in order to get a selection of KPIs and PIs that will be integrated
in the resulting BIM methodology.
5.1. Identificationofstrategiesandgoals
The first steps before defining the list of KPIs that will drive terminal performance
involve identifying the strategic actions and its goals. For the particular case of
intermodal freight terminals, future and current working intermodal facilities should
focus on:
1. Optimising the economic performance of the terminal, considering both the
investment in construction phase and the reduction of the costs during its
operation (including the cost related to maintenance) and maximising revenues.
Main party involved in this optimization is the investor, who promotes the
terminal.
2. Ensuring the service quality within the terminal: Maximize efficiency and reduce
congestion in the seaport/inland terminal by aligning loading, discharge and gate
operations; Minimize turnaround time of trucks, trains and/or vessels by
ensuring containers are placed strategically for loading, and that there will be
areas available for unloading; Maintain haulier truck service levels so that they
can be served in a timely manner;
3. Minimizing the effects of the hub on the immediate surroundings, identifying
the impact on the access road network and on the railway network. It is
essentially important to identify possible periods of congestion in both networks,
in order to make the most appropriate decisions to avoid these periods during
the project. The key stakeholders are the connection infrastructure operators.
4. Reducing the environmental impact and external costs during construction and
operation phases. In this case, it is especially relevant to reduce greenhouse gas
emissions to the atmosphere in order to minimize the climate change effects. All
the actors involved (public administrations, investors, terminal operators,
railway operators) must be interested in this reduction;
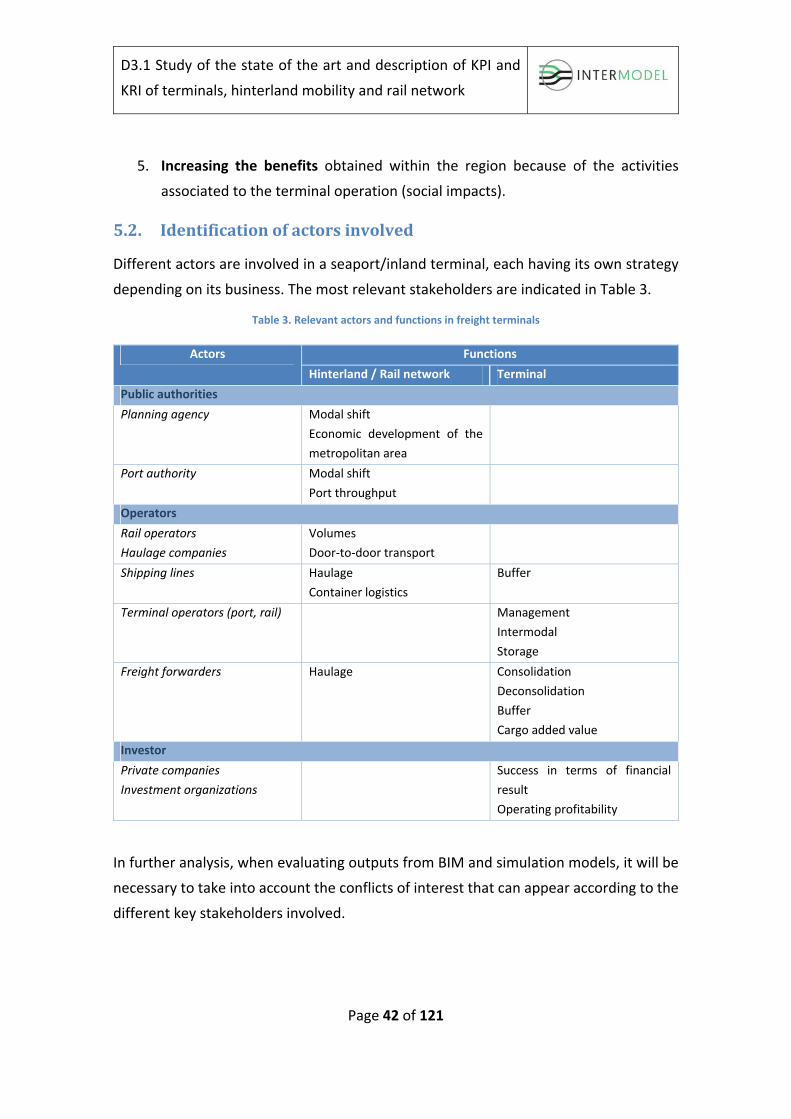
D3.1 Study of the state of the art and description of KPI and
KRI of terminals, hinterland mobility and rail network
Page 42 of 121
5. Increasing the benefits obtained within the region because of the activities
associated to the terminal operation (social impacts).
5.2. Identificationofactorsinvolved
Different actors are involved in a seaport/inland terminal, each having its own strategy
depending on its business. The most relevant stakeholders are indicated in Table 3.
Table 3. Relevant actors and functions in freight terminals
Actors Functions
Hinterland / Rail network Terminal
Public authorities
Planning agency Modal shift
Economic development of the
metropolitan area
Port authority Modal shift
Port throughput
Operators
Rail operators
Haulage companies
Volumes
Door‐to‐door transport
Shipping lines Haulage
Container logistics
Buffer
Terminal operators (port, rail) Management
Intermodal
Storage
Freight forwarders Haulage Consolidation
Deconsolidation
Buffer
Cargo added value
Investor
Private companies
Investment organizations
Success in terms of financial
result
Operating profitability
In further analysis, when evaluating outputs from BIM and simulation models, it will be
necessary to take into account the conflicts of interest that can appear according to the
different key stakeholders involved.
D3.1 Study of the state of the art and description of KPI and
KRI of terminals, hinterland mobility and rail network
Page 43 of 121
5.3. Identification of the different perspectives for performance
system
The perspectives proposed for the performance system have been chosen taking into
account the strategies and stakeholders involved, and on the other hand, according to
data gathered in Section 2.3.2 and after a consultation to main involved partners.
The resulting performance dimensions are as follows:
1. Operational performance
This performance dimension includes indicators that describe effectiveness, as a
measure of the capability of producing and intended result, and efficiency, as a
measure for producing results taking into account used resources.
These indicators are grouped according to the following subcategories:
Productivity and throughput
Efficiency (productivity – utilization)
Efficiency (productivity – time related)
Total traffic
2. Financial performance
The financial performance dimension is focused on evaluating how efficiently
and effectively terminal resources are used to generate services and increase
shareholder value or how investments are traduced into revenues and benefits.
In particular, the following financial factors should be covered:
Financial indicators
Costs
Revenues
Benefits
Employment
Maintenance costs
Investment on modal shift

D3.1 Study of the state of the art and description of KPI and
KRI of terminals, hinterland mobility and rail network
Page 44 of 121
3. Quality performance
The quality performance dimension links the service quality performance with
customer service quality needs. The indicators should cover the following quality
factors:
Service quality (time‐related indicators)
Accessibility
Damages
4. Environmental performance
The environmental performance is focused on the environmental impact of
intermodal freight terminal activities on the surrounding area. In that sense, the
indicators cover the following sustainable/environmental issues:
Energy efficiency
Alternative fuels
Climate change
Road and rail network congestion
Air pollution
Noise pollution
Health
5. Safety performance
The safety performance dimensions that usually is included in the quality service
dimensions is focused on analysing whether safety‐related actions are achieving
the pursued results and whether such actions are leading to less adverse impact
on human health, environment or property from an accident. These indicators
should cover the following dimension:
Accidents/Collisions
It should be mentioned that the environmental and safety performance dimensions are
related to the 6th and 8th dimensions of BIM methodologies. Therefore, it has been
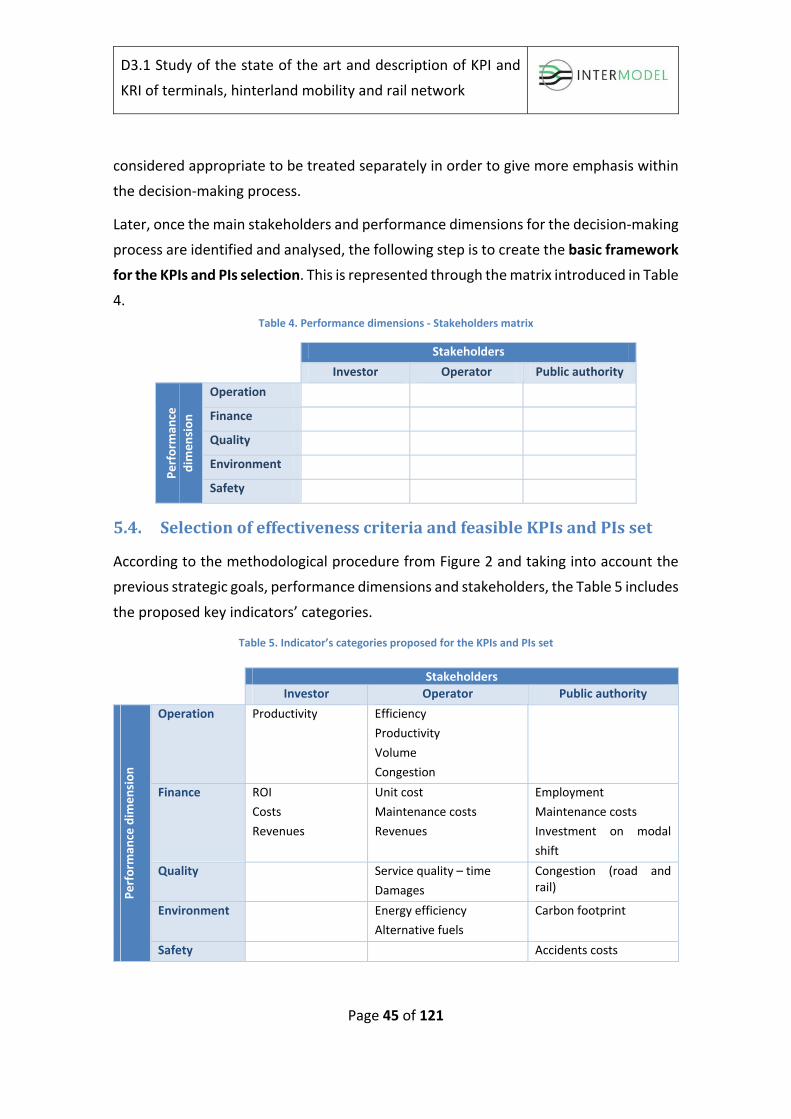
D3.1 Study of the state of the art and description of KPI and
KRI of terminals, hinterland mobility and rail network
Page 45 of 121
considered appropriate to be treated separately in order to give more emphasis within
the decision‐making process.
Later, once the main stakeholders and performance dimensions for the decision‐making
process are identified and analysed, the following step is to create the basic framework
for the KPIs and PIs selection. This is represented through the matrix introduced in Table
4.
Table 4. Performance dimensions ‐ Stakeholders matrix
Stakeholders
Investor Operator Public authority
Perform
ance
dim
ension
Operation
Finance
Quality
Environment
Safety
5.4. SelectionofeffectivenesscriteriaandfeasibleKPIsandPIsset
According to the methodological procedure from Figure 2 and taking into account the
previous strategic goals, performance dimensions and stakeholders, the Table 5 includes
the proposed key indicators’ categories.
Table 5. Indicator’s categories proposed for the KPIs and PIs set
Stakeholders
Investor Operator Public authority
Perform
ance dim
ension
Operation Productivity Efficiency
Productivity
Volume
Congestion
Finance ROI
Costs
Revenues
Unit cost
Maintenance costs
Revenues
Employment
Maintenance costs
Investment on modal
shift
Quality Service quality – time
Damages
Congestion (road and rail)
Environment Energy efficiency
Alternative fuels
Carbon footprint
Safety Accidents costs
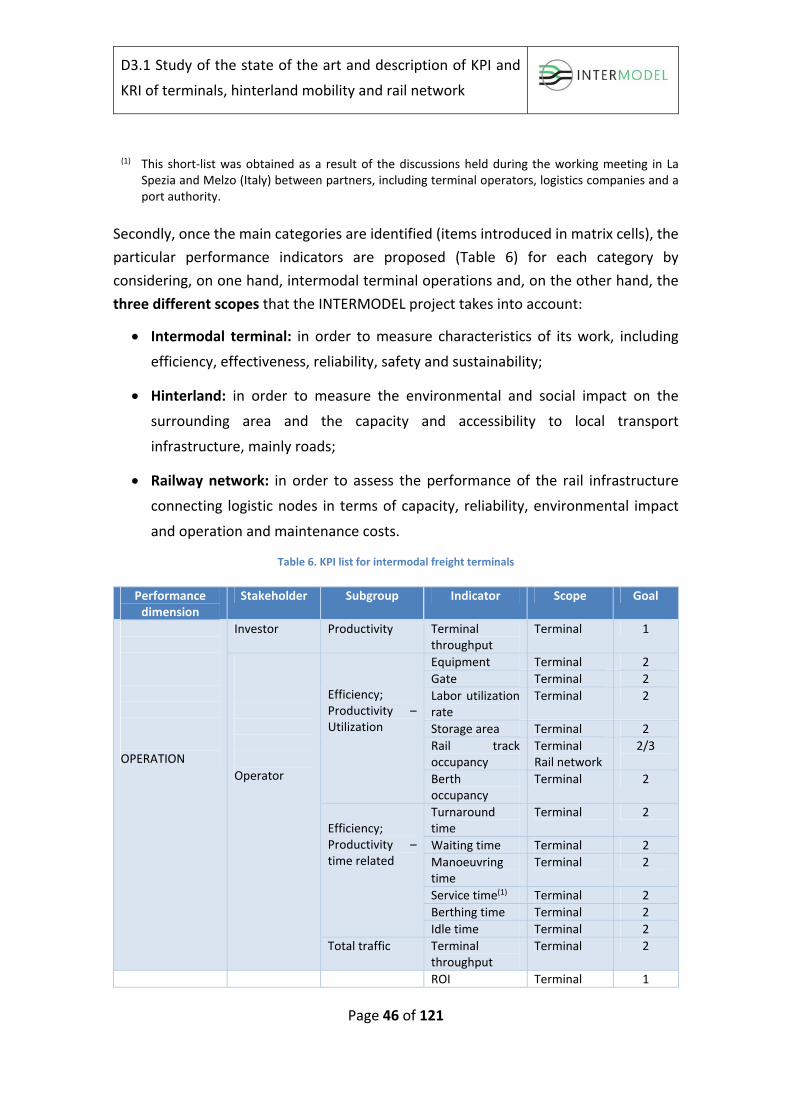
D3.1 Study of the state of the art and description of KPI and
KRI of terminals, hinterland mobility and rail network
Page 46 of 121
(1) This short‐list was obtained as a result of the discussions held during the working meeting in La Spezia and Melzo (Italy) between partners, including terminal operators, logistics companies and a port authority.
Secondly, once the main categories are identified (items introduced in matrix cells), the
particular performance indicators are proposed (Table 6) for each category by
considering, on one hand, intermodal terminal operations and, on the other hand, the
three different scopes that the INTERMODEL project takes into account:
Intermodal terminal: in order to measure characteristics of its work, including
efficiency, effectiveness, reliability, safety and sustainability;
Hinterland: in order to measure the environmental and social impact on the
surrounding area and the capacity and accessibility to local transport
infrastructure, mainly roads;
Railway network: in order to assess the performance of the rail infrastructure
connecting logistic nodes in terms of capacity, reliability, environmental impact
and operation and maintenance costs.
Table 6. KPI list for intermodal freight terminals
Performance dimension
Stakeholder Subgroup Indicator Scope Goal
OPERATION
Investor Productivity Terminal throughput
Terminal 1
Operator
Efficiency; Productivity – Utilization
Equipment Terminal 2
Gate Terminal 2
Labor utilization rate
Terminal 2
Storage area Terminal 2
Rail track occupancy
Terminal Rail network
2/3
Berth occupancy
Terminal 2
Efficiency; Productivity – time related
Turnaroundtime
Terminal 2
Waiting time Terminal 2
Manoeuvringtime
Terminal 2
Service time(1) Terminal 2
Berthing time Terminal 2
Idle time Terminal 2
Total traffic Terminal throughput
Terminal 2
ROI Terminal 1

D3.1 Study of the state of the art and description of KPI and
KRI of terminals, hinterland mobility and rail network
Page 47 of 121
Performance dimension
Stakeholder Subgroup Indicator Scope Goal
FINANCE
Investor Financial indicators
Profitability Terminal 1
Costs CAPEX Terminal 1
Operator
Operating cost Efficiency Terminal 1
OPEX Terminal 1
Maintenance cost ‐ equipment
# hours on corrective maintenance per machine
Terminal 1
# hours on preventive maintenance per machine
Terminal 1
Revenues Revenues per unit
Terminal 1
Benefits Benefits per unit Terminal 1
Maintenance cost ‐ Infrastructure
Corrective concrete structures maintenance cost
Terminal
1
Preventive concrete structures maintenance cost
Terminal
1
Public authority
Employment Direct jobs Terminal 1/5(4)
Jobs sustainedin the region
Terminal 5
Maintenance cost
Road and rail track maintenance
Hinterland Rail network
3
QUALITY
Operator
Service quality ‐time
Turnaround Terminal 2
Waiting time / turnaround
Terminal 2
Accessibility
Easiness of entry and exit from highways
Hinterland 3
Easiness of entry and exit from rail network
Rail network 3
Public authority
Investment on modal shift
Investment in infrastructure improvement(2)
Hinterland Rail network
3/4
Subsidies(2) Hinterland 4
Road congestion
Delays produced(5)
Hinterland 3

D3.1 Study of the state of the art and description of KPI and
KRI of terminals, hinterland mobility and rail network
Page 48 of 121
Performance dimension
Stakeholder Subgroup Indicator Scope Goal
Rail network congestion
Delays produced(5)
Rail network 3
ENVIRONMENT
Operator
Energy efficiency
Total consumption per num. of handled units
Terminal 1/4
Alternative fuels Use of alternative fuels/total consumption
Terminal 1/4
Public authority
Climate change Carbon footprint
Hinterland 4
Air pollution CO, NOX, SOC, PM emissions
Hinterland 4
Noise Population exposed to high levels of traffic noise
Hinterland 4
Health(3) Hinterland 4
SAFETY
Public authority
Accidents
Num. of road accidents
Hinterland 2/4
Num. of railway accidents
Rail connection
2/4
Percentage of accidents related to hazard cargo
Hinterland 2/4
(1) Related to congestion (2) Difficult to obtain (3) Difficult to measure (4) Conflict of interests (5) When it affects both terminal and public road users
In the previous table, it can be observed that each proposed performance indicator is
related to a performance dimension, stakeholder, category, scope and strategic goal
(the number indicated correspond to the index defined in section 5.1).
Finally, since some performance indicators are dependent of others, it has been
considered convenient to classify the proposed indicators in two levels:
1. High‐level performance indicators (KPIs), which are focused on big picture
performance goals;

D3.1 Study of the state of the art and description of KPI and
KRI of terminals, hinterland mobility and rail network
Page 49 of 121
2. Secondary level performance indicators (PIs), focused more on the daily
processes in each area of an organization – in intermodal freight terminals e.g.
different sections: cargo handling, container handling, shunting, shipping, etc.
As an example, the indicator turnaround time provides generic information regarding
the quality of service or the productivity of an intermodal terminal while service time or
berthing time just inform about the efficiency of loading/unloading operations without
taking into account waiting times. Thus, the former indicators are categorized as
performance indicators (secondary level) and the turnaround time as a KPI (high‐level).
According to the above categorization, Table 7 shows the resulting classification.
Table 7. Classification of performance indicators (KPIs and PIs)
Key Performance Indicators (KPIs) Performance Indicators (PIs)
Operational
1‐Intermodal terminal throughput (volume) 28‐Maneuvering time2‐Equipment utilization 29‐Service time3‐Gate utilization 30‐Berthing time4‐Labour utilization rate 31‐Idle time (equipment)5‐Storage area utilization 6‐Rail track utilization7‐Berth utilization 8‐Turnaround time 9‐Waiting time
Financial
10‐Return On Investment (ROI) 32‐Capital Expenditure (CAPEX) 11‐Terminal’s profitability 33‐Operational Expenditure (OPEX) 12‐Operating efficiency (operating margin) 34‐Corrective maintenance cost ‐ equipment 13‐Operating revenues per unit 35‐Preventive maintenance cost ‐ equipment
36‐Corrective concrete structures maintenance cost 37‐Preventive concrete structures maintenance cost
14‐Operating benefits per unit 15‐Direct jobs sustained by terminal activities16‐Indirect jobs sustained by terminal activities17‐Road and rail track maintenance cost
Quality, environmental and safety
18‐Easiness of entry and exit from highways 38‐Waiting time / turnaround time 19‐Easiness of entry and exit from rail network20‐Energy consumption per handled unit
39‐Use of alternative fuels from total consumption
21‐Carbon footprint per unit 40‐Accidents related to hazard cargo 22‐Delays produced (reliability) – road23‐Delays produced (reliability) – railway24‐CO, NOX, SOC, PM emissions 25‐Population exposed to high levels of traffic noise

D3.1 Study of the state of the art and description of KPI and
KRI of terminals, hinterland mobility and rail network
Page 50 of 121
Key Performance Indicators (KPIs) Performance Indicators (PIs) 26‐Number of road accidents 27‐Number of railway accidents

D3.1 Study of the state of the art and description of KPI and
KRI of terminals, hinterland mobility and rail network
Page 51 of 121
6. DefinitionofKPIsandPIs
This section outlines the proposed list of KPIs and PIs which have emerged from the
previous analysis. For each indicator a record sheet has been developed whose template
is introduced in Table 8. In addition, the range of answers and information is included in
the corresponding cells.
Table 8. Template for KPI & PI definition
KPIname
Performance
dimension:
Stakeholder
involved:
Scope: Subgroup:
[Operational, Financial,
Quality, Environment,
Safety]
[Investor, Terminal
operator, public body]
[Terminal, Rail
Network, Hinterland]
[Name]
Descriptionandobjective: Formula: Unit:
[Describe the KPI and its objective]
Inputdataanddatasource: Frequency of
measurement:
Calculationmethod:
[Describe which data is required and the exact
location of the necessary raw data/raw
information to calculate the metric of the KPI]
[Daily, monthly,
annually, etc.]
[BIM, simulation tool,
analytical]
Presentation of
results
Evolution of the
indicator:
Decisionlevel: Relationship with
otherindicators:
[Number or graphical] [Panel; Historical data] [Operational, Tactical
and strategic]
Notesandcomments:
Particular issues related to the KPIs that should be taken into account
Finally, each of the proposed and selected KPIs and PIs indicated in Table 7 are described
in Appendix II.

D3.1 Study of the state of the art and description of KPI and
KRI of terminals, hinterland mobility and rail network
Page 52 of 121
7. Conclusions
The objective of this deliverable was to establish a set of Key Performance Indicators
(KPIs) and Performance indicators (PIs) for the assessment of the layout design, building
materials choice, operative planning, handling equipment selection and allocation of
intermodal freight terminals through an ICT environment. In particular, a selection of
feasible performance measures integrated in a dashboard would be integrated within
the developed BIM framework methodology (BIM and simulation tools) resulting in a
potential investment decision making tool that will be useful for both public institutions
and private organizations and an important contribution to the research community
since no previous works have been found in that sense.
In order to achieve the objective, a method composed by sequential stages was
proposed to select feasible KPIs and PIs. The work was preceded with an extended
literature review aimed at identifying the key performance indicators used by
researchers and terminal managers and the most common KPI selection methodologies
used to evaluate organizational performances.
The resulting proposed methodology focuses on handling and transport processes and
excludes much of the complexity found in other PMS. At a glance, it involves the
following steps:
1. Identification of the strategy and mission of the organization
2. Identification of stakeholders involved
3. Identification of the different perspectives that should be considered in the
performance system
4. Identification of particular strategic goals
5. Selection of effectiveness criteria and feasible KPIs and PIs set
6. Scoring process and determination of overall KPI score (aggregation
method)
As a result of its application to our study case (intermodal freight terminals), the
dashboard for Intermodal Freight Terminals depicted in Figure 3 has been defined and
proposed.
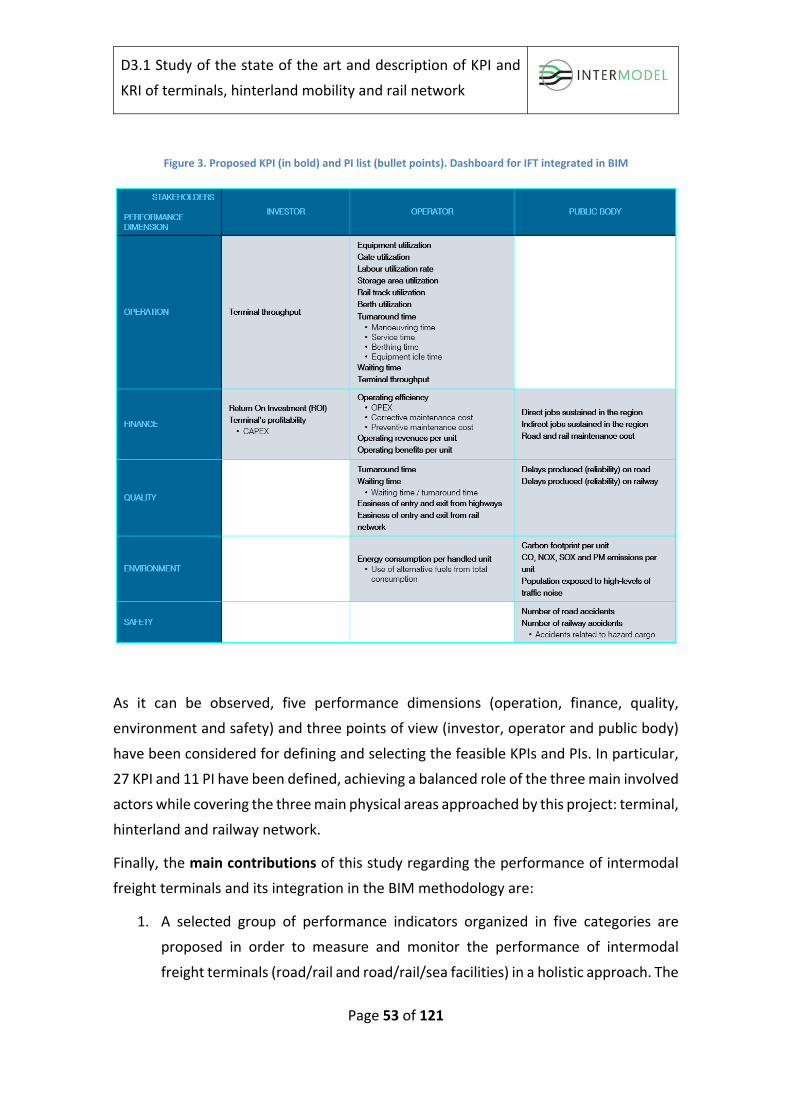
D3.1 Study of the state of the art and description of KPI and
KRI of terminals, hinterland mobility and rail network
Page 53 of 121
Figure 3. Proposed KPI (in bold) and PI list (bullet points). Dashboard for IFT integrated in BIM
As it can be observed, five performance dimensions (operation, finance, quality,
environment and safety) and three points of view (investor, operator and public body)
have been considered for defining and selecting the feasible KPIs and PIs. In particular,
27 KPI and 11 PI have been defined, achieving a balanced role of the three main involved
actors while covering the three main physical areas approached by this project: terminal,
hinterland and railway network.
Finally, the main contributions of this study regarding the performance of intermodal
freight terminals and its integration in the BIM methodology are:
1. A selected group of performance indicators organized in five categories are
proposed in order to measure and monitor the performance of intermodal
freight terminals (road/rail and road/rail/sea facilities) in a holistic approach. The

D3.1 Study of the state of the art and description of KPI and
KRI of terminals, hinterland mobility and rail network
Page 54 of 121
selected indicators evaluate (1) the performance of terminal operations from
both a technical and economical point of view; (2) the external effects in terms
of sustainability, safety and environment; and (3) the financial requirements to
the investor/management.
2. The literature review showed that operational and financial performance
indicators are vastly employed for seaport and intermodal terminals. In turn,
quality service, sustainability and environmental measurements are particularly
required for evaluating freight terminals (transhipment nodes within supply
chains) and their impact on their neighbourhood. Finally, individual contributions
were found assessing specific aspects on sustainability and environmental
impact but an integrated approach is required for intermodal freight terminals.
3. The integration of the selected performance indicators to the BIM tools in both,
construction and operating phases, of intermodal freight terminals will
constitute a great contribution of this project. Currently, only construction cost
indicators are included in BIM.

D3.1 Study of the state of the art and description of KPI and
KRI of terminals, hinterland mobility and rail network
Page 55 of 121
References
Agerschou, H. (2004). Facilities requirements. In: Planning and design of ports and
marine terminals. London: Thomas Telford Limited, 5–20.
Andersen, B., Fagerhaug, T. (1999). "Green" performance measurement. International
Journal of Business Performance Management, 1(2), 171‐185.
Ashar, A. (1997). Counting the Moves. Port Development International, 13, 25‐29.
Awad‐Nuñez, S., Gónzalez‐Cancelas, N., Soler‐Flores, F., Camarero‐Orive, A. (2015). How
should the sustainability of the location of dry ports be measured? A proposed
methodology using Bayesian networks and multi‐criteria decision analysis. Transport, 30
(3), 312‐319.
Bagchi, P.K. (1996). Role of benchmarking as a competitive strategy: the logistics
experience. International Journal of Physical Distribution and Materials Management,
26 (2), 4‐22.
Ballis, A. (2004). Introducing Level‐of‐service Standards for Intermodal Freight
Terminals. Transportation Research Record, 1873, 79–88.
Bassan, S. (2007). Evaluating seaport operation and capacity Analysis—Preliminary
methodology. Maritime Policy and Management, 34 (1), 3–19.
Beamon, B.M. (1999). Measuring supply chain performance. International Journal of
Operations and Production Management, 19 (3), 275 – 292.
Bendall, H., Stent, A. (1987). On measuring cargo handling productivity. Maritime policy
and management, 14(4), 337‐343.
Bhatti, M.I., Awan, H.M., Razaq, Z. (2014). The key performance indicators (KPIs) and
their impact on overall organizational performance. Quality and Quantity 48, 3127‐
3143.
Bichou, K., Gray, R. (2004). A Logistics and Supply Chain Management Approach to Port
Performance Measurement. Maritime Policy and Management, 31 (1), 47–67.
Bowersox, D.J., Closs, D.J. (1996). Logistical Management. The integrated supply chain
process. McGraw‐Hill, New York, US.

D3.1 Study of the state of the art and description of KPI and
KRI of terminals, hinterland mobility and rail network
Page 56 of 121
Castillo, H., Pitfield, D.E. (2010). ELASTIC – A methodological framework for identifying
and selecting sustainable transport indicators. Transportation Research Part D, 15 (4),
179‐188.
Carriou. (2011). Port performance measurement in practice. PortEconomics.
www.porteconomics.eu.
Chang, S. (1978). Production function and capacity utilization of the port of mobile.
Maritime policy and management, 5, 297‐305.
Chung, K.C. (1993). Port Performance Indicators. The World Bank, Transport, PS‐6.
Cullinane, K., Song, D.W., Wang, T.F. (2005). The Application of Mathematical
Programming Approaches to Estimating Container Port Production Efficiency. Journal of
Productivity Analysis, 24, 73‐92.
De Langen, P., Nijdam, M., Horst, M.v.D. (2007). New indicators to measure port
performance. Journal of Maritime Research, 4(1), 23‐36.
De Monie, G. (1987). Measuring and Evaluating Port Performance and Productivity.
Unctad Monographs On Port Management, 6, Geneva, UNCTAD.
De Rus G., Campos J., Nombela G. (2003). Economía del Transporte. Ed. Antoni Bosch.
De Toni, A., Tonchia, S. (2001). Performance measurement systems‐models,
characteristics and measures. International journal of operations and production
management, 21(1/2), 46‐71.
Domingues, M.L., Reis, V., Macário, R. (2015). A comprehensive framework for
measuring performance in a Third‐Party Logistics Provider. Proceedings of 18th Euro
working group on transportation, EWGT 2015, 14‐16 July 2015, Delft, The Netherlands.
Dragović, B., Park, N.K., Radmilović, Z., Maraš, V. (2005). Simulation modelling of ship‐
berth link with priority service. Maritime Economics and Logistics, 7 (4), 316‐335.
Ducruet, C., Itoh, H., Merk, O. (2014). Time efficiency at world container ports.
Discussion paper No. 2014‐08, International Transport Forum, OECD.
ESPO (2010). Port performance indicators selection and measurement. WP1: Pre‐
selection of an initial set of indicators. Grant Agreement No
TREN/09/SUB/G2/170.2009/S12.552637. Final report.
D3.1 Study of the state of the art and description of KPI and
KRI of terminals, hinterland mobility and rail network
Page 57 of 121
European Commission (2000): IMPULSE. Final report. 29.2.2000
Fazli, A., Fathi, S., Enferadi, M.H., Fazli, M., Fathi, B. (2014). Appraising effectiveness of
Building Information Management (BIM) in Project management. Procedia Technology
16, 1116‐1125.
Ferreira, L., Sigut, J. (1993). Measuring the performance of intermodal freight terminals.
Transportation Planning and Technology, 17 (3), pp. 269‐280.
Fourgeaud, P. (2000). Measuring port performance. The World Bank. Available from:
http://siteresources.worldbank.org/INTPRAL/Resources/338897‐
1117630103824/fourgeau.pdf.
Garcia, F., Marchetta, M. G., Camargo, M., Morel, L., Forradellas, R. Q. (2012). A
framework for measuring logistics performance in the wine industry. International
Journal of Production Economics, 135(1), 284–298.
Ghalayini, A.M., Noble, J.S. (1997). An integrated dynamic performance measurement
system for improving manufacturing competitiveness. International Journal of
Production Economics, 48(3), 207‐225.
González M.M., Trujillo, L. (2009). Efficiency measurement in the port industry: A survey
of the empirical evidence. Journal of Transport Economics and Policy, 43 (2), 157‐191.
Gosselin, M. (2005). An empirical study of performance measurement in manufacturing
organizations. International journal of operations and production management, 54
(5/6), 419‐437.
GPI (2008). GPI Transportation Accounts: Sustainable Transportation in Halifax Regional
Municipality, GPI Atlantic (www.gpiatlantic.org).
Gunasekeran, A., Patel, C., Tirtiroglu, E. (2001). Performance measurement and metrics
in a supply chain environment. International Journal of Operations and Production
Management, 21(1/2),71‐87.
Gunasekeran, A., Kobu, B. (2007). Performance measures and metrics in logistics and
supply chain management: a review of recent literature (1995‐2004) for research and
applications. International Journal of Production Research, 45(12), 2819‐2840.
D3.1 Study of the state of the art and description of KPI and
KRI of terminals, hinterland mobility and rail network
Page 58 of 121
Hakam, M.H. (2015). Nordic Container Port Sustainability Performance – A conceptual
intelligent framework. Journal of Service Science and Management, 8, 14‐23.
Hanaoka, S., Regmi, M. (2011). Promoting intermodal freight transport through the
development of dry ports in Asia: an environmental perspective. IATSS Research, 35(1),
16‐23.
Haponava T., Jibouri S A. (2009). Identifying key performance indicators for use in
control of pre‐project stage process in construction. International Journal of Productivity
and Performance Management, 58 (2), 160‐173.
Henesey, L., Wernstedt, F. and Davidsson, P. (2003). Market‐driven control in container
terminal management. In: 2nd International Conference on Computer Applications and
Information Technology in the Maritime Industries 2003.
Henesey, L. (2006). Multi agent systems for container terminal management. Thesis
(PhD). Blekinge Institute of Technology, Karlshamn, Sweden.
Hervani, A. A. (2005). Performance measurement for green supply chain management.
Benchmarking: An International Journal, 12(4), 330.
Huynh, N. N. and Walton, C. M. (2005). Methodologies for reducing truck turn time at
marine container terminals. Austin, Texas, USA: Southwest Region University
Transportation Center. Research Report SWUTC/05/167830‐1.
Kaplan, R. S., David P. Norton. (1996). The Balanced Scorecard: Translating Strategy into
Action. Boston: Harvard Business School Press.
Keegan, R.S., Eiler, R.G., Jones, C.R. (1989). Are your performance measures obsolete?.
Management accounting, 70(12), 45‐50.
Kozan, E. and Preston, P. (2006). Mathematical modelling of container transfers and
storage locations at seaport terminals. OR spectrum, 28, 519–537.
Krauth, E., Moonen, H., Popova, V., Schut, M. (2005). Performance measurement and
control in logistics service providing. ICEIS 2005 – Artificial Intelligence and decision
support systems.
D3.1 Study of the state of the art and description of KPI and
KRI of terminals, hinterland mobility and rail network
Page 59 of 121
Le‐Griffin, H.D., Murphy, M. (2006). Container terminal productivity: experiences at the
ports of Los Angeles and Long Beach. Technical report, Department of Civil Engineering,
University of Southern California.
Leong, G.K., Snyder, D.L., Ward, P.T. (1990). Research in the process and content of
manufacturing strategy. Omega 18(2), 109‐122.
Litman, T. (2007). Developing indicators for comprehensive and sustainable transport
planning. Transportation Research Record, 2017, 10‐15.
Litman, T. (2016). Well Measured: Developing indicators for sustainable and livable
transport planning. Victoria Transport Policy Institute.
Lohman, C., Fortuin, L., & Wouters, M. (2004). Designing a performance measurement
system: A case study. European Journal of Operational Research, 156, 267–286.
Longo, F., Huerta, A., Nicoletti, L. (2013) Performance Analysis of a Southern
Mediterranean Seaport via Discrete‐Event Simulation. Strojniški vestnik ‐ Journal of
Mechanical Engineering, Vol. 59 (9), 517‐525.
Loo, R. (2002). The Delphi method: a powerful tool for strategic management. Journal
of Police Strategies & Management, 25(4), 762–769.
Lv, R., Li, C. (2009). Analysis on location selection of dry ports based on ANP. 16th
International Conference on Industrial Engineering and Engineering Management, IEEE.
Mapes, J.N., New, C., Swejczewski, M. (1997). Performance trade‐offs in manufacturing
plants. International journal of operations and production management, 17 (10), 1020‐
1033.
Marsden, G., Kelly, C., Nellthorp, J., Lucas, K., Brookes, M. (2005). A framework for the
appraisal of sustainability in transport. Institute for Transport Studies (ITS), Leeds, UK.
Marlow, P., Paixao, A.C. (2003a). Measuring lean ports performance. International
Journal of Transport Management, 1, 189–202.
Mathonnet, C. (2000). Le project IQ intermodal quality une nouvelle approche de la
qualité pour les terminaux intermodaux. Transports, 400, 108–116.
McAuley, B., Hore, A.V., West, R. (2013). Establishing Key Performance Indicators to
Measure the Benefit of Introducing the Facilities Manager at an early Stage in the
D3.1 Study of the state of the art and description of KPI and
KRI of terminals, hinterland mobility and rail network
Page 60 of 121
Building Information Modelling Process. Proceedings of the CITA BIM Gathering, Dublin,
Ireland, 14th – 15th November, 61‐69.
Mentzer, J.T., Konrad, B.P. (1991). An efficiency/effectiveness approach to logistics
performance analysis. Journal of Business Logistics 12(1), 33‐62.
Morales‐Fusco, P., Saurí, S., Spuch, B. (2010). Quality indicators and capacity calculation
for RoRo terminals. Transportation Planning and Technology, 33(8), 695–717.
Nam, K.‐C., Kwak, K.‐S., Yu, M.‐S. (2002). Simulation Study of Container Terminal
Performance. Journal of Waterway, Port, Coastal, and Ocean Engineering, 128(3), 126‐
132.
Neely, A., Gregory, M. Platts, K. (1995). Performance measurement system design.
International journal of operations and production Management, 15 (4), 80 – 116.
Neely, A., Adams, C., Kennerley, M. (2002). The performance prism: The scorecard for
measuring and managing business success. Prentice Hall Financial Times London.
Neely, A., Gregory, M. Platts, K. (2005). Performance measurement system design: a
literature review and research agenda. International journal of operations and
production Management, 25 (12), 1228 – 1263.
Notteboom, T. E. (2006). The time factor in liner shipping services. Maritime Economics
and Logistics, 8, 19–39.
OECD (2002). Benchmarking Intermodal Freight Transport, OECD Publications, Paris,
France.
Owino, E.L., Wang, T‐F. and Pasukeviciute, I. (2006). Performance measurement in
european container terminal industry: An empirical investigation. In: IAME 2006
Conference. 12–14 July 2006 Melbourne, Australia.
Pachakis, D. and Kiremidjian, A.S. (2003). Ship traffic modeling methodology for ports,
Journal of Waterway, Port, Coastal, and Ocean Engineering, 129 (5), 193‐202.
Parker, C. (2000). Performance measurement. Work Study, 49, 63‐66.
Parmenter, D. (2009). Key Performance Indicators. Developing, implementing, and using
winning KPIs. John Wiley and Sons, Inc, USA.
D3.1 Study of the state of the art and description of KPI and
KRI of terminals, hinterland mobility and rail network
Page 61 of 121
PORTOPIA (2015). WP7: Inland Ports Performance Indicators. D7.1: KPIs for inland ports
(Pre‐selection). Grant Agreement No. 605176.
Posset, M., Gronalt, M., Häuslmayer, H. (2010). COCKPIIT – Clear Operable and
Comparable Key Performance Indicators for Intermodal Transportation. Intermodalität
und Interoperabilität von Verkehrssystemen. Studie als Anhang zum Endbericht, Juni
2010.
Rafele, C. (2004). Logistic service measurement: a reference framework. Journal of
Manufacturing Technology Management, 15(3), 280‐290.
Rigo, N., Hekkenberg, R., Ballé Ndiaye, A., Hadhazi, D., Simongati, G., Hargitai, C. (2007).
Performance assessment for intermodal chains. European journal of transport and
infrastructure research EJTIR, 7 (4), 283‐300.
Rothenberg, S. (2005). Lessons from benchmarking environmental performance at
automobile assembly plants. Benchmarking 12 (1), 5.
Roy, Bernard (1968). Classement et choix en présence de points de vue multiples (la
méthode ELECTRE).La Revue d'Informatique et de Recherche Opérationelle (8): 57–75
Rushton, A., Croucher, P., & Baker, P. (2010). The Handbook of Logistics & Distribution
Management (4th ed.). Kogan Page Limited/ The Chartered Institute of Logistics and
Transport (UK)
Sarkar, D., Raghavendra, H.B., Ruparelia, M. (2015). Role of Key Performance Indicators
for evaluating the usage of BIM as tool for Facility Management of Construction Projects.
International Journal of Civil and Structural Engineering, 5 (4), 370‐378.
Schönsleben, P. (2012). Integral Logistics Management: Operations and Supply Chain
Management Within and Across Companies (4th ed.). US: CRC Press.
Shahin, A., Ali Mahbod, M. (2004). Priorization of key performance indicators: An
integration of analytical hierarchy process and goal setting. International Journal of
Productivity and Performance Management, Vol. 56 (3), 226 – 240.
Sinclair, D., Zairi, M. (1995). Effective process management through performance
measurement: part II‐benchmarking total quality‐based performance measurement for
best practice. Bus. Process Management Journal, 1(2), 58‐72.

D3.1 Study of the state of the art and description of KPI and
KRI of terminals, hinterland mobility and rail network
Page 62 of 121
Doderer, S. (2011). StratMoS: Smooth Operations – Optimising feeder and shortsea
operations in ports. Port of Hamburg, Hamburg.
Suarez‐Aleman, A., Trujillo, L., & Cullinane, K. P. B. (2013). Estimating port efficiency
through an alternative methodology: Time as an output of port efficiency. Paper
presented at the International Conference of the International Association of Maritime
Economists (IAME), Marseilles, France.
Tahar, R.M., Hussain, K. (2000). Simulation and analysis for the Kelang container
terminal operations. Logistic information management, 13 (1), 14‐20.
Talley, W. K. (1996). Performance evaluation of mixed‐cargo ports. Alexandria, VA:
Water Resources Support Center, Army Corps of Engineers, Unpublished report.
Talley, W.K. (1998). Optimum throughput and performance evaluation of marine
terminals. Maritime policy and management, 15(4), 327‐331.
Talley, W. K. (2007). Port performance: an economic perspective. In: Devolution, Port
Governance and Port Performance Research. Transportation Economics, 17, 499–516.
Thomas, B.J., Monie, G. (2000). The measurement of port performance: with particular
reference 10 container terminal operations. International Labour Organization
Porth’orker Development Programme. Cardiff/Antwerp, January 2000.
Tongzon, J.L. (2001). Efficiency Measurement of Selected Australian and Other
International Ports Using Data Envelopment Analysis. Transportation Research Part A,
35, 113‐128.
Trujillo, L., Nombela, G. (1999). Privatization and regulation of the seaport industry.
Policy Research Working Paper 2181. The World Bank, Washington DC.
UNCTAD (1976). Port Performance Indicators. New York, U.S.: United Nations
Conference on Trade and Development.
UNCTAD (2006). Review of maritime transport, 2006. Geneva, Switzerland: United
Nations Publications. (COMPIT'2006). 8–10 May 2003 Oegsteest, The Netherlands.
Wei, J., Sun, A., Zhuang, J. (2010) The selection of dry port location with the method of
Fuzzy‐ANP. Lecture Notes in Electrical Engineering, 72, 265‐273.

D3.1 Study of the state of the art and description of KPI and
KRI of terminals, hinterland mobility and rail network
Page 63 of 121
White, G.P. (1996). A survey and taxonomy of strategy‐related performance measures
for manufacturing. International Journal of Operations and Production Management
16(3), 42‐61.
ISO 12911 (2012): Framework for building information modelling (BIM) guidance.

D3.1 Study of the state of the art and description of KPI and
KRI of terminals, hinterland mobility and rail network
Page 64 of 121
AppendixI
This appendix includes the KPI and PI list proposed by the partners during the
consultation carried out during the development of Task 2.1.
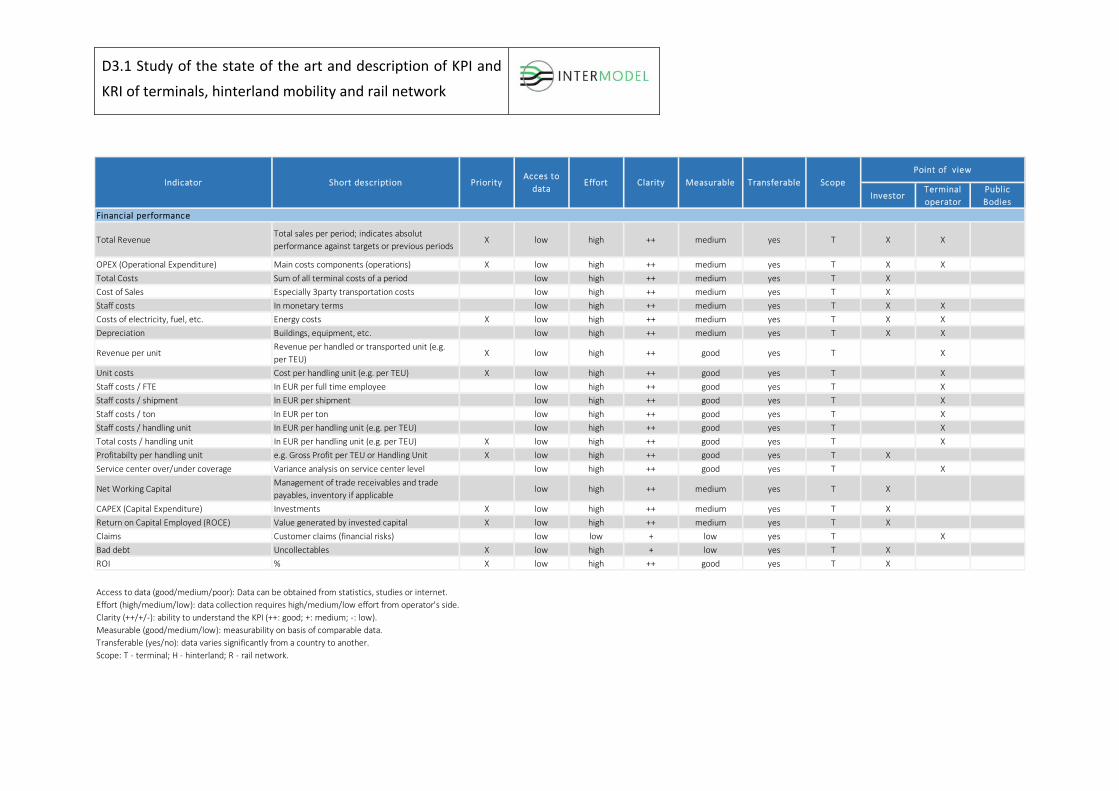
D3.1 Study of the state of the art and description of KPI and
KRI of terminals, hinterland mobility and rail network
InvestorTerminal operator
Public Bodies
Financial performance
Total RevenueTotal sales per period; indicates absolut performance against targets or previous periods
X low high ++ medium yes T X X
OPEX (Operational Expenditure) Main costs components (operations) X low high ++ medium yes T X XTotal Costs Sum of all terminal costs of a period low high ++ medium yes T XCost of Sales Especially 3party transportation costs low high ++ medium yes T XStaff costs In monetary terms low high ++ medium yes T X XCosts of electricity, fuel, etc. Energy costs X low high ++ medium yes T X XDepreciation Buildings, equipment, etc. low high ++ medium yes T X X
Revenue per unitRevenue per handled or transported unit (e.g. per TEU)
X low high ++ good yes T X
Unit costs Cost per handling unit (e.g. per TEU) X low high ++ good yes T XStaff costs / FTE In EUR per full time employee low high ++ good yes T XStaff costs / shipment In EUR per shipment low high ++ good yes T XStaff costs / ton In EUR per ton low high ++ good yes T XStaff costs / handling unit In EUR per handling unit (e.g. per TEU) low high ++ good yes T XTotal costs / handling unit In EUR per handling unit (e.g. per TEU) X low high ++ good yes T XProfitabilty per handling unit e.g. Gross Profit per TEU or Handling Unit X low high ++ good yes T XService center over/under coverage Variance analysis on service center level low high ++ good yes T X
Net Working CapitalManagement of trade receivables and trade payables, inventory if applicable
low high ++ medium yes T X
CAPEX (Capital Expenditure) Investments X low high ++ medium yes T XReturn on Capital Employed (ROCE) Value generated by invested capital X low high ++ medium yes T XClaims Customer claims (financial risks) low low + low yes T XBad debt Uncollectables X low high + low yes T XROI % X low high ++ good yes T X
ClarityPoint of view
Indicator Short description PriorityAcces to data
Effort Measurable Transferable Scope
Transferable (yes/no): data varies significantly from a country to another.Measurable (good/medium/low): measurability on basis of comparable data.Clarity (++/+/‐): ability to understand the KPI (++: good; +: medium; ‐: low).
Scope: T ‐ terminal; H ‐ hinterland; R ‐ rail network.
Effort (high/medium/low): data collection requires high/medium/low effort from operator's side.Access to data (good/medium/poor): Data can be obtained from statistics, studies or internet.

D3.1 Study of the state of the art and description of KPI and
KRI of terminals, hinterland mobility and rail network
Page 66 of 121
InvestorTerminal operator
Public Bodies
Operational performanceVolumes (e.g. # of TEUs, tons of bulk good, etc.)
Sum of handled or transported units (further splits by product or type of goods possible)
X low low ++ medium yes T X X
Weight in terminal (in tons)Weight of handled goods (further splits by products or type of goods possible)
low low ++ medium yes T X
# of trucks Total number of trucks low low ++ medium yes T X# of trains Total number of trains low low ++ medium yes T X
# of shipments Number of shipments handled by the terminal X low low ++ medium yes T X
# of standard containers (e.g. TEUs)Number of standard containers handled by the terminal
X low low ++ medium yes T X
# of handling units (e.g. TEUs)Number of handling units e.g. containers handled by the terminal
X low low ++ medium yes T X
# of FTEs at month endWorkforce in terms of number of Full Time Employees at month end
low low ++ medium yes T X X
# of FTEs on averageWorkforce in terms of number of Full Time Employees (monthly average)
X low low ++ medium yes T X X
HeadcountWorkforce in terms of number of people employed
X low low ++ medium yes T X X
Overtime FTEs on monthly average Average extra hours per month low medium ‐ medium yes T XUnpaid overtime FTEs on monthly average Unpaid extra hours per month low medium ‐ medium yes T XFTE Arrival Gateway Number of employees at arrival gateway good low ++ medium yes T XFTE Departure Gateway Number of employees at departure gateway good low ++ medium yes T X
# of not own FTE (white collar) Number of subcontracted white collar workers good low + medium yes T X
ClarityPoint of view
Indicator Short description PriorityAcces to data
Effort Measurable Transferable Scope
Transferable (yes/no): data varies significantly from a country to another.Measurable (good/medium/low): measurability on basis of comparable data.Clarity (++/+/‐): ability to understand the KPI (++: good; +: medium; ‐: low).
Scope: T ‐ terminal; H ‐ hinterland; R ‐ rail network.
Effort (high/medium/low): data collection requires high/medium/low effort from operator's side.Access to data (good/medium/poor): Data can be obtained from statistics, studies or internet.

D3.1 Study of the state of the art and description of KPI and
KRI of terminals, hinterland mobility and rail network
Page 67 of 121
InvestorTerminal operator
Public Bodies
Operational performance# of not own FTE (blue collar) Number of subcontracted blue collar workers good low + medium yes T XTotal FTE capacity terminal Total employees X good low ++ medium yes T X
Productivity (machinery and blue collar)Handled units (e.g. TEUs) per hour, per day, per FTE, per…
good high ++ good yes T X
Productivity (white collar) Shipments per FTE (white collar) good high ++ good yes T XXProductivity (blue collar) Handling units per FTE X good high ++ good yes T X
Shipments / FTE in Terminal Number of shipments per Full Time Employees good high + good yes T X
Tonnage / FTE Total tons per Full Time Employees good high + good yes T X
Handling units / FTENumber of handling units per Full Time Employees
good high + good yes T X
Productivity per machine related to the effective working hours
Number of handled units per machine considering only effective working hours
X low high ++ good yes T X
Hours of machinery working per year Working hours per year X low high ++ good yes T XHours of machinery inactive per year Inactive hours per year X low high ++ good yes T XAvailability of machinery % RMG, % RTG, % RS, % trucks… low high + medium yes T X
Volume related to space (storage productivity)
TEUs per square meter, tons per square meter… X good low ++ good yes T X
% use of terminal warehouse space % X low low ++ good yes T XGate utilization % X good low ++ good yes T XBerth utilization % X good low ++ good yes T XRail utilization Train per year per rail good low ++ good yes T XLand utilization TEUs per year per gross square meter X low low + good yes T X
ClarityPoint of view
Indicator Short description PriorityAcces to data
Effort Measurable Transferable Scope
Transferable (yes/no): data varies significantly from a country to another.Measurable (good/medium/low): measurability on basis of comparable data.Clarity (++/+/‐): ability to understand the KPI (++: good; +: medium; ‐: low).
Scope: T ‐ terminal; H ‐ hinterland; R ‐ rail network.
Effort (high/medium/low): data collection requires high/medium/low effort from operator's side.Access to data (good/medium/poor): Data can be obtained from statistics, studies or internet.

D3.1 Study of the state of the art and description of KPI and
KRI of terminals, hinterland mobility and rail network
Page 68 of 121
InvestorTerminal operator
Public Bodies
Operational performanceEquipment utilization TEUs per year per crane/RS… low low ++ good yes T XEquipment productivity Moves per crane/RS per hour X low low ++ good yes T XDistance traveled by terminal tractors b/w train and designated terminal positions of unloaded containers
In meters, kilometers low low ++ good yes T X
Distance traveled by terminal tractors b/w terminal locations of the containers to be loaded and trains
In meters, kilometers low low ++ good yes T X
Service quality# damages Quality KPIs X low high ++ low no T/H X# accidents Quality KPIs X low low ++ low no T/H X X# departures in time Quality KPIs low low ++ good yes T XAverage round trip In minutes, hours X medium high ++ good yes H X
Average time spent in terminal per container In minutes, hours X medium high ++ good yes T X
Waiting hours of trucks at terminal door In minutes, hours X medium high ++ medium yes T XAverage time spent by train at terminal In minutes, hours X medium high ++ good yes T XAverage time spent by truck at terminal In minutes, hours X medium high ++ good yes T X# trains spending over 50% more than the av. time for trains
Related to waiting time/delays low high + good yes T X
# trucks spending over 50% more than the av. time for trucks
Related to waiting time/delays low high + good yes T X
Turnaround time of trains In minutes, hours X medium high ++ good yes R X
ClarityPoint of view
Indicator Short description PriorityAcces to data
Effort Measurable Transferable Scope
Transferable (yes/no): data varies significantly from a country to another.Measurable (good/medium/low): measurability on basis of comparable data.Clarity (++/+/‐): ability to understand the KPI (++: good; +: medium; ‐: low).
Scope: T ‐ terminal; H ‐ hinterland; R ‐ rail network.
Effort (high/medium/low): data collection requires high/medium/low effort from operator's side.Access to data (good/medium/poor): Data can be obtained from statistics, studies or internet.

D3.1 Study of the state of the art and description of KPI and
KRI of terminals, hinterland mobility and rail network
Page 69 of 121
InvestorTerminal operator
Public Bodies
Environmental performance
Total carbon emissionsTotal carbon emitted through energy consumption of terminal
X low high ++ medium yes H X
Carbon footprint per handling unit (e.g. container or ton)
Carbon footprint of a handled standard container (e.g. TEU)
X low high ++ good yes T X
Dangerous goods KPIsSpecific KPIs in case of dangerous goods (depending on local regulations)
X low high + good yes T X
"# of trucks in rush hour"; "number of containers handled in peak season"
Directly related with emissions low high ++ low yes H/R X
Socio‐economic# of jobs @terminal Role as employer X low high + good no T XTaxes Contribution to area in terms of taxes low high ‐ low no H X
TrafficEffects on local traffic, key routes due add. trucks, trains
X low medium + low no H/R X
MarketTrading balance Trading balance of country, region low high ++ low no H X
Trade flowsVolumes of goods shipped from and to the region of the terminal
low high ++ low no H X
Transport modes / logistics grid Share of road, rail, air, ocean, … transportation X good low ++ good no H/R X
Development of transportation modesDeveloment rail volume, road volume, etc. (absolute and in %)
X low low ++ low no H/R X
Competitor volumes Volume handled by main competitors low low ++ low no H X
Competitor revenueRevenue and Revenue devlopment of main compeitiors
low low ++ low no H X
Competitor profitabilityProfitability and development of main competitors
low low ++ low no H X
ClarityPoint of view
Indicator Short description PriorityAcces to data
Effort Measurable Transferable Scope
Transferable (yes/no): data varies significantly from a country to another.Measurable (good/medium/low): measurability on basis of comparable data.Clarity (++/+/‐): ability to understand the KPI (++: good; +: medium; ‐: low).
Scope: T ‐ terminal; H ‐ hinterland; R ‐ rail network.
Effort (high/medium/low): data collection requires high/medium/low effort from operator's side.Access to data (good/medium/poor): Data can be obtained from statistics, studies or internet.

D3.1 Study of the state of the art and description of KPI and
KRI of terminals, hinterland mobility and rail network
Page 70 of 121
InvestorTerminal operator
Public Bodies
Maintenance (railway tracks)Failures in total Number of failures low ++ low yes T/H X
Faults in infrastructure with unknown cause Unknown cause failures low low ++ low yes H X
Faults in infrastructure with known cause Known cause failures low low ++ low yes H XFaults interfering with traffic Faults affecting operation medium low ++ low yes H/R X XMeantime between failures and repair (MTBF and MTTR)
Average time between failures and mean time to repair
medium low ++ good yes H/R X X
Overall equipment effectiveness (OEE) (Availability) ∙ (Performance) ∙ (Quality) low high ++ good yes H/R XCapacity utilization % X medium high ++ good yes T/R XHours of freight train delays due to infrastructure
In minutes, hours X medium high ++ low yes T/R X
Maintenance cost per track‐kilometer Monetary cost per track kilometer X medium high ++ good no R X XMaintenance (equipment)# hours on corrective maintenance per machine
Hours per year per each equipment item X medium high ++ good yes T/R X X
# hours on preventive maintenance per machine
Hours per year per each equipment item X medium high ++ good yes T/R X X
Maintenance (infrastructure)Crack opening For concrete elements low high + good yes T X XChloride content For concrete elements low high + good yes T X XCarbonation For concrete elements low high + good yes T X XSteel corrosion rate For steel elements low high + good yes T X XExposure class Related with concrete and steel good high + low yes T X X
ClarityPoint of view
Indicator Short description PriorityAcces to data
Effort Measurable Transferable Scope
Transferable (yes/no): data varies significantly from a country to another.Measurable (good/medium/low): measurability on basis of comparable data.Clarity (++/+/‐): ability to understand the KPI (++: good; +: medium; ‐: low).
Scope: T ‐ terminal; H ‐ hinterland; R ‐ rail network.
Effort (high/medium/low): data collection requires high/medium/low effort from operator's side.Access to data (good/medium/poor): Data can be obtained from statistics, studies or internet.

D3.1 Study of the state of the art and description of KPI and
KRI of terminals, hinterland mobility and rail network
AppendixII
This appendix includes the definition of each KPI and PI included in the proposed final
list.

D3.1 Study of the state of the art and description of KPI and
KRI of terminals, hinterland mobility and rail network
Page 72 of 121
1. Intermodalterminalthroughput(volume)
Performance
dimension:
Stakeholder
involved:
Scope: Subgroup:
Operational
Investor
Operator
Terminal Productivity
Total traffic
Descriptionandobjective: Formula: Unit:
The terminal throughput is a measure of the
activity related to the delivery of outbound cargo,
reception of inbound cargo and
loading/unloading transhipment cargo.
The goal of new intermodal terminals should be
to maximize equipment and labor productivity
while achieving as much throughput as possible.
Summation of TEU, ITU
or tons of cargo handled
by the terminal, either
as imports, exports or
transhipment
TEUs
ITUs
Tonnes
Differentiating total,
imports, exports and
transhipment
Inputdataanddatasource: Frequency of
measurement:
Calculationmethod:
Number of handled containers / ITUs / tonnes of
cargo per quay crane / rail lifting piece of
equipment.
Number of trucks and trains arriving / leaving the
terminal and their average cargo (TEU / ITU /
tonnes).
Daily/monthly/annually Terminal simulation
model
Presentation of
results
Evolution of the
indicator:
Decisionlevel: Relationship with
otherindicators:
Number and
graphically
Throughput evolution
per year
Strategic
Tactical
Efficiency
Financial indicators
(unitary revenues,
benefits and costs)
Notesandcomments:
Imports and exports are treated separately from transhipment to avoid double counting.

D3.1 Study of the state of the art and description of KPI and
KRI of terminals, hinterland mobility and rail network
Page 73 of 121
2. Equipmentutilization
Performance
dimension:
Stakeholder
involved:
Scope: Subgroup:
Operational Operator Terminal Efficiency; Productivity‐
utilization
Descriptionandobjective: Formula: Unit:
The utilization of any item or type of equipment
is defined as the proportion of time that it was
effectively deployed over a specified period.
The goal is to measure the equipment
performance (availability, reliability and
operational productivity) in order to estimate
the terminal’s investment in cargo‐handling.
This is calculated per type of equipment and
individually for each working unit.
Eq‐U (%)=TA/(TR‐TD)
TA: Total equipment active time over a time period
TR: Total rostered time for a piece of equipment over a time period
TD: Total downtime in a period of time (scheduled maintenance and breakdown repairs)
Percentage (%)
Inputdataanddatasource: Frequency of
measurement:
Calculationmethod:
Time related data from the terminal simulation
model.
Annually Terminal simulation
model
Presentation of
results
Evolution of the
indicator:
Decisionlevel: Relationship with
otherindicators:
Average results and
for each equipment
item
Utilization’s evolution
per year
Strategic
Tactical
Productivity
Waiting time
Preventive/Corrective
maintenance time
Notesandcomments:
The time for maintenance and breakdown repairs depends on type of equipment and hypothesis on
their calculation (regarding working time / total time or units processed).
As many KPIs values as types of terminal equipment.

D3.1 Study of the state of the art and description of KPI and
KRI of terminals, hinterland mobility and rail network
Page 74 of 121
3. Gateutilization
Performance
dimension:
Stakeholder
involved:
Scope: Subgroup:
Operational Operator Terminal Efficiency; Productivity‐
utilization
Descriptionandobjective: Formula: Unit:
The utilization of terminal gates is defined as the
proportion of time that they were effectively
deployed over a specified period.
Gate utilization is a valuable measure for terminal
operators related to the gate efficiency.
Gate‐U (%)=TA/TR
TA: Total gate active time in a period of time
TR: Total rostered time for a gate in a period of time
Percentage (%)
Inputdataanddatasource: Frequency of
measurement:
Calculationmethod:
Time related data from the terminal simulation
model.
Annually Terminal simulation
model
Presentation of
results
Evolution of the
indicator:
Decisionlevel: Relationship with
otherindicators:
Average results and for
each gate
Utilization’s evolution
per year
Tactical
Operational
Productivity
Waiting time
Notesandcomments:
Gate utilization should be considered separately for entering/departing trucks.

D3.1 Study of the state of the art and description of KPI and
KRI of terminals, hinterland mobility and rail network
Page 75 of 121
4. Labourutilizationrate
Performance
dimension:
Stakeholder
involved:
Scope: Subgroup:
Operational Operator Terminal Efficiency; Productivity‐
utilization
Descriptionandobjective: Formula: Unit:
The utilization of labour is defined as the
proportion of time that it was effectively deployed
over a specified period.
It is important to monitor labour well and know
what the productivity per man‐hour is over a
measured period
Labour‐U (%)=TA/TR
TA: Total man active time in a period of time
TR: Total rostered time for a man in a period of time
Percentage (%)
Inputdataanddatasource: Frequency of
measurement:
Calculationmethod:
Time related data from the terminal simulation
model.
Annually Terminal simulation
model
Presentation of
results
Evolution of the
indicator:
Decisionlevel: Relationship with
otherindicators:
Results per employee
type and graphically
Utilization’s evolution
per year
Operational Productivity
Notesandcomments:
It considers blue collar employees working at gates, storage yard, berth, railway yard, etc.
Assumed productivity per employee can vary.
Utilization of labour is difficult to measure.
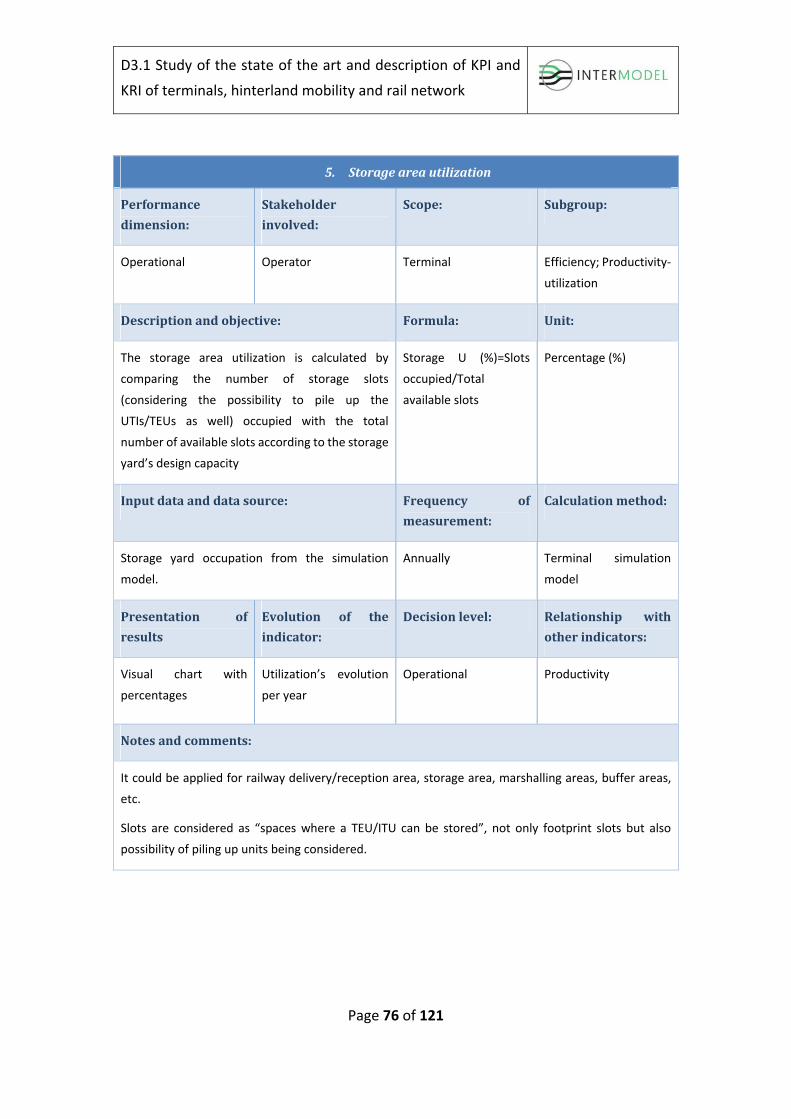
D3.1 Study of the state of the art and description of KPI and
KRI of terminals, hinterland mobility and rail network
Page 76 of 121
5. Storageareautilization
Performance
dimension:
Stakeholder
involved:
Scope: Subgroup:
Operational Operator Terminal Efficiency; Productivity‐
utilization
Descriptionandobjective: Formula: Unit:
The storage area utilization is calculated by
comparing the number of storage slots
(considering the possibility to pile up the
UTIs/TEUs as well) occupied with the total
number of available slots according to the storage
yard’s design capacity
Storage U (%)=Slots
occupied/Total
available slots
Percentage (%)
Inputdataanddatasource: Frequency of
measurement:
Calculationmethod:
Storage yard occupation from the simulation
model.
Annually Terminal simulation
model
Presentation of
results
Evolution of the
indicator:
Decisionlevel: Relationship with
otherindicators:
Visual chart with
percentages
Utilization’s evolution
per year
Operational Productivity
Notesandcomments:
It could be applied for railway delivery/reception area, storage area, marshalling areas, buffer areas,
etc.
Slots are considered as “spaces where a TEU/ITU can be stored”, not only footprint slots but also
possibility of piling up units being considered.

D3.1 Study of the state of the art and description of KPI and
KRI of terminals, hinterland mobility and rail network
Page 77 of 121
6. Railtrackutilization
Performance
dimension:
Stakeholder
involved:
Scope: Subgroup:
Operational Operator Terminal
Rail network
Efficiency; Productivity‐
utilization
Descriptionandobjective: Formula: Unit:
This measure reflects the amount of time that the
rail track was occupied out of the total time
available.
Rail track‐U (%)=Rail
track time
occupied/Total
available time
Percentage (%)
Inputdataanddatasource: Frequency of
measurement:
Calculationmethod:
Time related data from the terminal simulation
model.
Annually Terminal simulation
model
Presentation of
results
Evolution of the
indicator:
Decisionlevel: Relationship with
otherindicators:
Chart Utilization’s evolution
per year
Operational Productivity
Notesandcomments:

D3.1 Study of the state of the art and description of KPI and
KRI of terminals, hinterland mobility and rail network
Page 78 of 121
7. Berthutilization
Performance
dimension:
Stakeholder
involved:
Scope: Subgroup:
Operational Operator Terminal Efficiency; Productivity‐
utilization
Descriptionandobjective: Formula: Unit:
This measure reflects the amount of time that the
berth was occupied out of the total time available.
Berth‐U (%)=Berth time
occupied/Total
available time
Percentage (%)
Inputdataanddatasource: Frequency of
measurement:
Calculationmethod:
Time related data from the terminal simulation
model.
Annually Terminal simulation
model
Presentation of
results
Evolution of the
indicator:
Decisionlevel: Relationship with
otherindicators:
Visual chart with
percentages
Utilization’s evolution
per year
Operational Productivity
Notesandcomments:
It can be related to the berth length or to the number of berthing points.

D3.1 Study of the state of the art and description of KPI and
KRI of terminals, hinterland mobility and rail network
Page 79 of 121
8. Turnaroundtime
Performance
dimension:
Stakeholder
involved:
Scope: Subgroup:
Operational
Quality
Operator Terminal Efficiency;
Productivity‐time
related
Service quality ‐ time
Descriptionandobjective: Formula: Unit:
The elapsed time between a
truck/train/vessel’s arrival at a terminal and
its departure.
It is frequently used as a measure of terminal
efficiency.
Terminal
TT=TArr+Tunload+Tload+Tdep
Trains:
TArr: Train shunting time + Train entrance control time + Train waiting time before unloading
Tunload: Sum of unloading times from train to storage
Tload: Sum of loading times from storage to train
Tdep: Train waiting time for departure processing + train operations monitoring time + train safety inspection time + train shunting time + train waiting time from shunting to departure
Trucks:
TArr: Truck waiting / queueing time at‐gates + Truck time for‐gate processing + In‐gate checking time + Truck waiting time at buffer area + Truck driving time from waiting area to loading position
Time (minutes, hours)

D3.1 Study of the state of the art and description of KPI and
KRI of terminals, hinterland mobility and rail network
Page 80 of 121
8. Turnaroundtime
Tunload: Sum of unloading times from truck to storage
Tload: Sum of loading times from storage to truck
Tdep: Truck driving time from loading position to out‐gate + Truck time for out‐gate processing
Ships:
TArr: Ship port services time + Ship waiting time before unloading
Tunload: Sum of unloading times from ship to storage
Tload: Sum of loading times from storage to ship
Tdep: Ship waiting time for departure processing + ship port services time
Inputdataanddatasource: Frequency of
measurement:
Calculation
method:
Time related data from the terminal
simulation model.
For each vessel/truck/train
arrival
Terminal simulation
model
Presentation of
results
Evolution of the
indicator:
Decisionlevel: Relationship with
otherindicators:
Total and individual
results represented
in numbers and
graphically
Average values per
year and per type of
customer (ship,
truck, train)
Operational Waiting time
Service time
Maneuvering time
Berthing time
Notesandcomments:
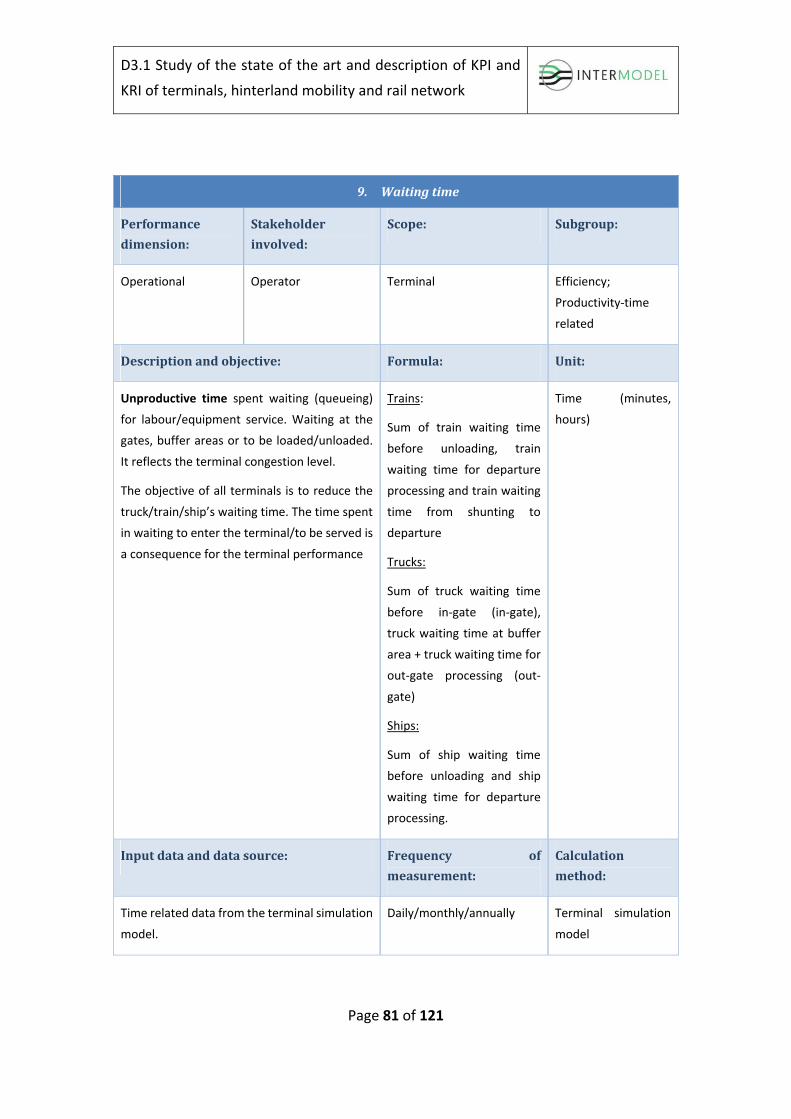
D3.1 Study of the state of the art and description of KPI and
KRI of terminals, hinterland mobility and rail network
Page 81 of 121
9. Waitingtime
Performance
dimension:
Stakeholder
involved:
Scope: Subgroup:
Operational Operator Terminal Efficiency;
Productivity‐time
related
Descriptionandobjective: Formula: Unit:
Unproductive time spent waiting (queueing)
for labour/equipment service. Waiting at the
gates, buffer areas or to be loaded/unloaded.
It reflects the terminal congestion level.
The objective of all terminals is to reduce the
truck/train/ship’s waiting time. The time spent
in waiting to enter the terminal/to be served is
a consequence for the terminal performance
Trains:
Sum of train waiting time
before unloading, train
waiting time for departure
processing and train waiting
time from shunting to
departure
Trucks:
Sum of truck waiting time
before in‐gate (in‐gate),
truck waiting time at buffer
area + truck waiting time for
out‐gate processing (out‐
gate)
Ships:
Sum of ship waiting time
before unloading and ship
waiting time for departure
processing.
Time (minutes,
hours)
Inputdataanddatasource: Frequency of
measurement:
Calculation
method:
Time related data from the terminal simulation
model.
Daily/monthly/annually Terminal simulation
model
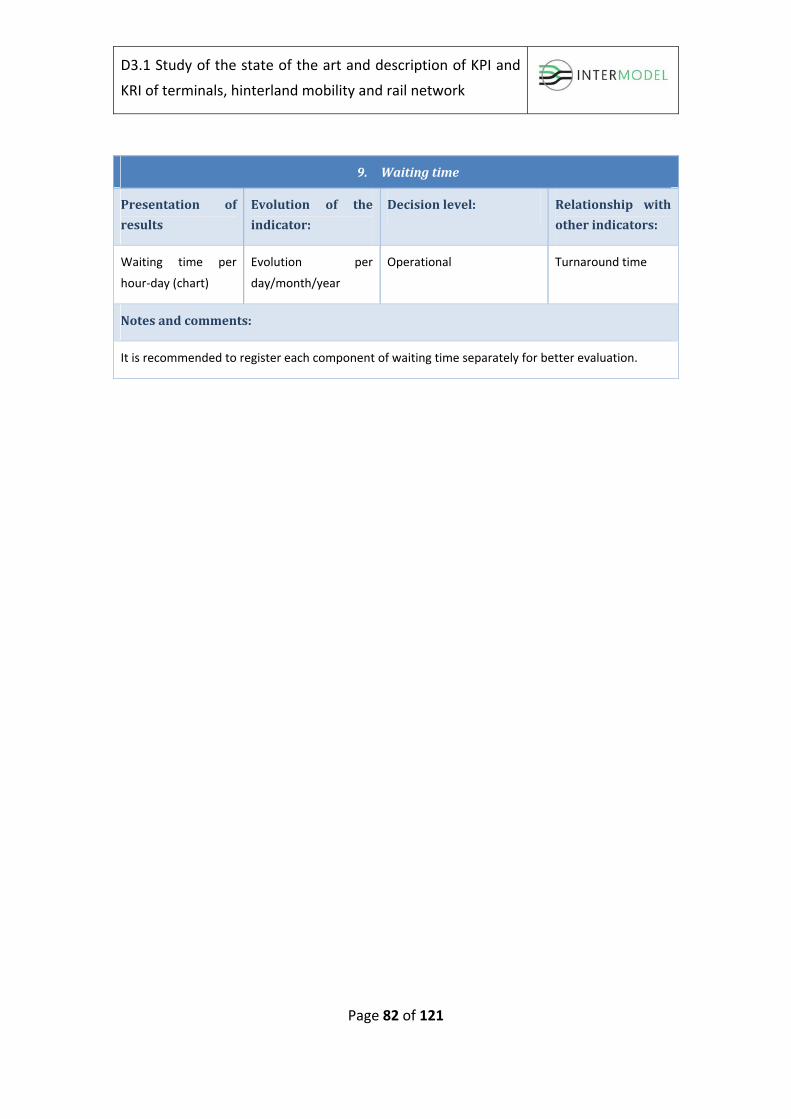
D3.1 Study of the state of the art and description of KPI and
KRI of terminals, hinterland mobility and rail network
Page 82 of 121
9. Waitingtime
Presentation of
results
Evolution of the
indicator:
Decisionlevel: Relationship with
otherindicators:
Waiting time per
hour‐day (chart)
Evolution per
day/month/year
Operational Turnaround time
Notesandcomments:
It is recommended to register each component of waiting time separately for better evaluation.

D3.1 Study of the state of the art and description of KPI and
KRI of terminals, hinterland mobility and rail network
Page 83 of 121
10. ReturnOnInvestment(ROI)
Performance
dimension:
Stakeholder
involved:
Scope: Subgroup:
Financial Investor Terminal Financial indicators
Descriptionandobjective: Formula: Unit:
This performance indicator measures the
amount of return on an investment relative to
the investment’s cost.
ROI= (Gain from
Investment ‐ Cost of
Investment)/Cost of
Investment =
Benefits/Investment
cost
Percentage (%)
Inputdataanddatasource: Frequency of
measurement:
Calculationmethod:
Capital expenses (CAPEX)
Benefits from terminal’s operation
Monthly/annually BIM
Presentation of
results
Evolution of the
indicator:
Decisionlevel: Relationship with
otherindicators:
Graphically and
percentage
Against previous year
during concession
period
Strategic CAPEX
Profitability
Notesandcomments:
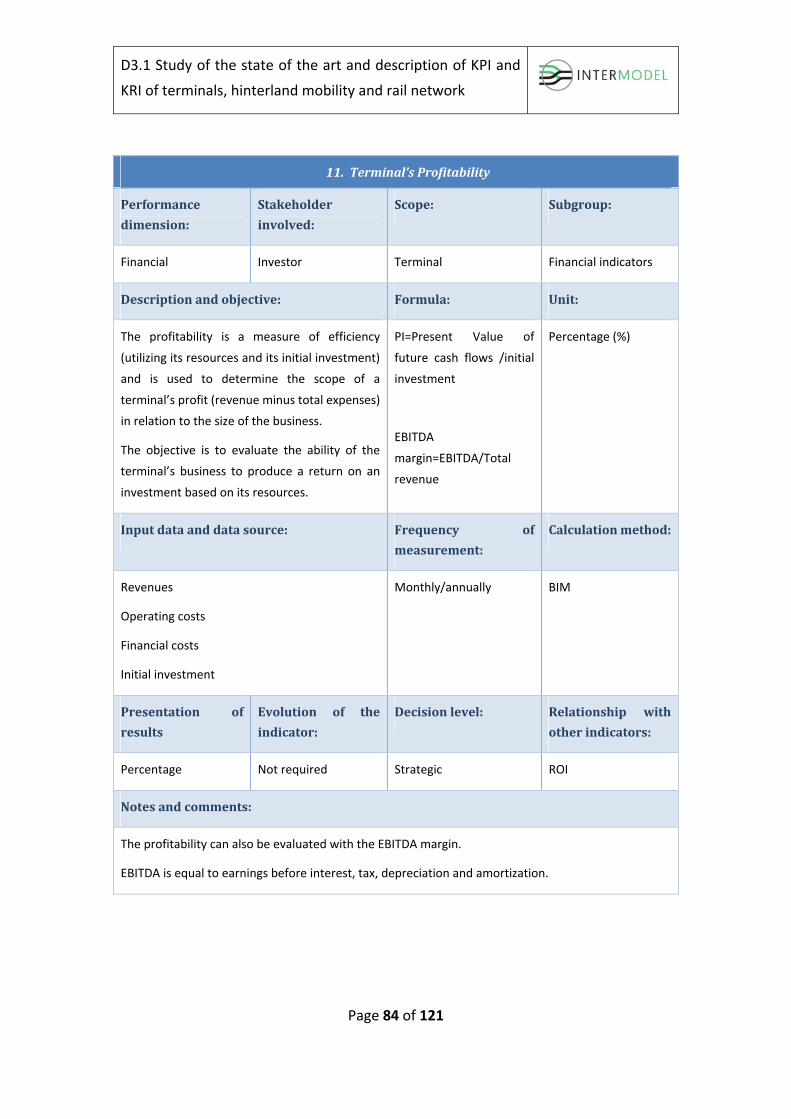
D3.1 Study of the state of the art and description of KPI and
KRI of terminals, hinterland mobility and rail network
Page 84 of 121
11. Terminal’sProfitability
Performance
dimension:
Stakeholder
involved:
Scope: Subgroup:
Financial Investor Terminal Financial indicators
Descriptionandobjective: Formula: Unit:
The profitability is a measure of efficiency
(utilizing its resources and its initial investment)
and is used to determine the scope of a
terminal’s profit (revenue minus total expenses)
in relation to the size of the business.
The objective is to evaluate the ability of the
terminal’s business to produce a return on an
investment based on its resources.
PI=Present Value of
future cash flows /initial
investment
EBITDA
margin=EBITDA/Total
revenue
Percentage (%)
Inputdataanddatasource: Frequency of
measurement:
Calculationmethod:
Revenues
Operating costs
Financial costs
Initial investment
Monthly/annually BIM
Presentation of
results
Evolution of the
indicator:
Decisionlevel: Relationship with
otherindicators:
Percentage Not required Strategic ROI
Notesandcomments:
The profitability can also be evaluated with the EBITDA margin.
EBITDA is equal to earnings before interest, tax, depreciation and amortization.
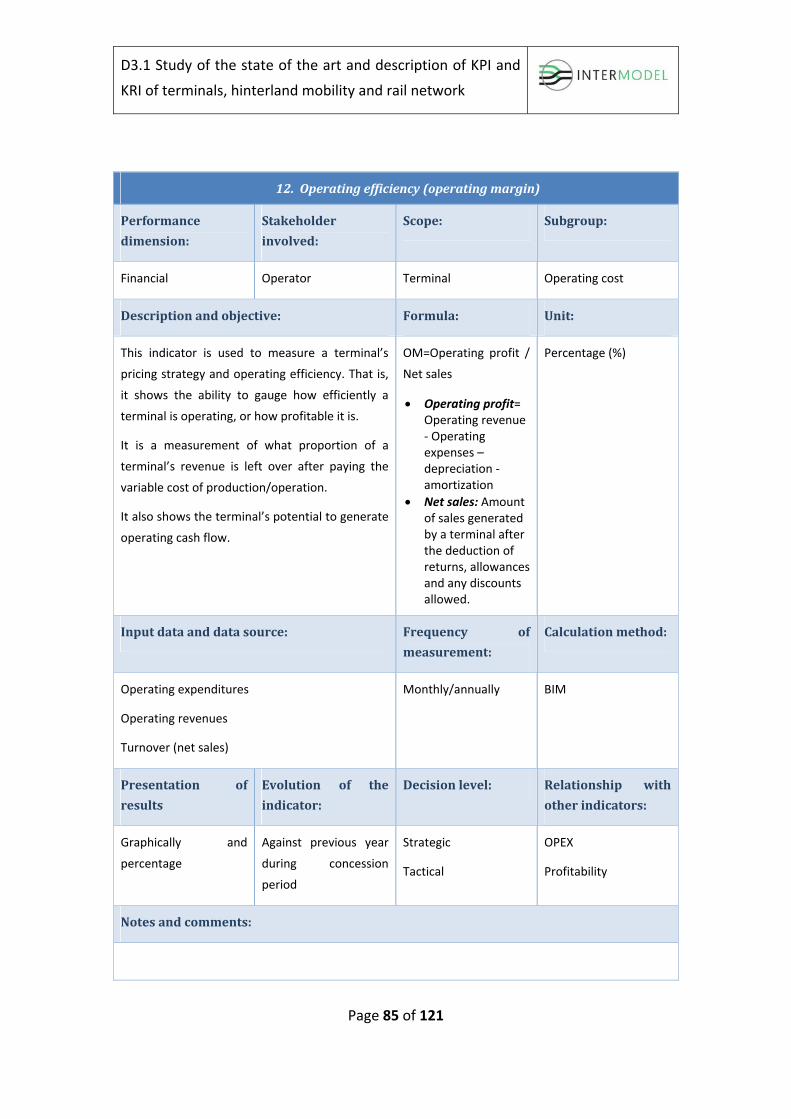
D3.1 Study of the state of the art and description of KPI and
KRI of terminals, hinterland mobility and rail network
Page 85 of 121
12. Operatingefficiency(operatingmargin)
Performance
dimension:
Stakeholder
involved:
Scope: Subgroup:
Financial Operator Terminal Operating cost
Descriptionandobjective: Formula: Unit:
This indicator is used to measure a terminal’s
pricing strategy and operating efficiency. That is,
it shows the ability to gauge how efficiently a
terminal is operating, or how profitable it is.
It is a measurement of what proportion of a
terminal’s revenue is left over after paying the
variable cost of production/operation.
It also shows the terminal’s potential to generate
operating cash flow.
OM=Operating profit /
Net sales
Operating profit= Operating revenue ‐ Operating expenses – depreciation ‐ amortization
Net sales: Amount of sales generated by a terminal after the deduction of returns, allowances and any discounts allowed.
Percentage (%)
Inputdataanddatasource: Frequency of
measurement:
Calculationmethod:
Operating expenditures
Operating revenues
Turnover (net sales)
Monthly/annually BIM
Presentation of
results
Evolution of the
indicator:
Decisionlevel: Relationship with
otherindicators:
Graphically and
percentage
Against previous year
during concession
period
Strategic
Tactical
OPEX
Profitability
Notesandcomments:
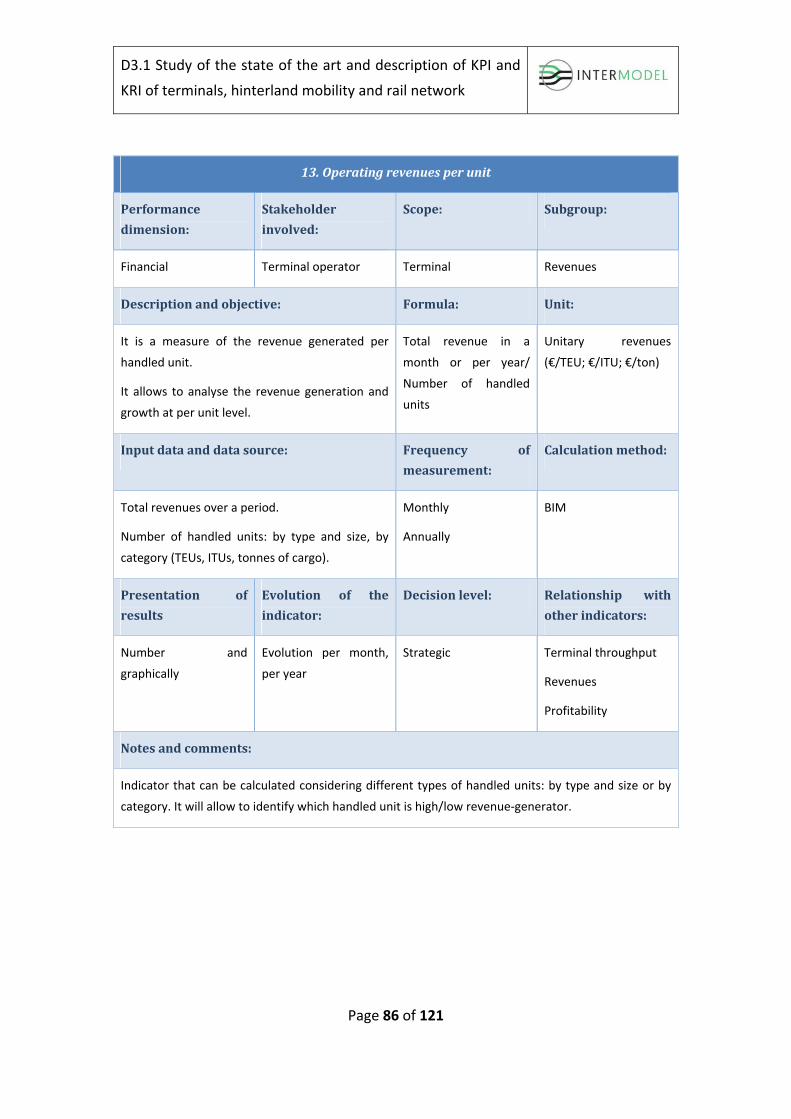
D3.1 Study of the state of the art and description of KPI and
KRI of terminals, hinterland mobility and rail network
Page 86 of 121
13.Operatingrevenuesperunit
Performance
dimension:
Stakeholder
involved:
Scope: Subgroup:
Financial Terminal operator Terminal Revenues
Descriptionandobjective: Formula: Unit:
It is a measure of the revenue generated per
handled unit.
It allows to analyse the revenue generation and
growth at per unit level.
Total revenue in a
month or per year/
Number of handled
units
Unitary revenues
(€/TEU; €/ITU; €/ton)
Inputdataanddatasource: Frequency of
measurement:
Calculationmethod:
Total revenues over a period.
Number of handled units: by type and size, by
category (TEUs, ITUs, tonnes of cargo).
Monthly
Annually
BIM
Presentation of
results
Evolution of the
indicator:
Decisionlevel: Relationship with
otherindicators:
Number and
graphically
Evolution per month,
per year
Strategic Terminal throughput
Revenues
Profitability
Notesandcomments:
Indicator that can be calculated considering different types of handled units: by type and size or by
category. It will allow to identify which handled unit is high/low revenue‐generator.
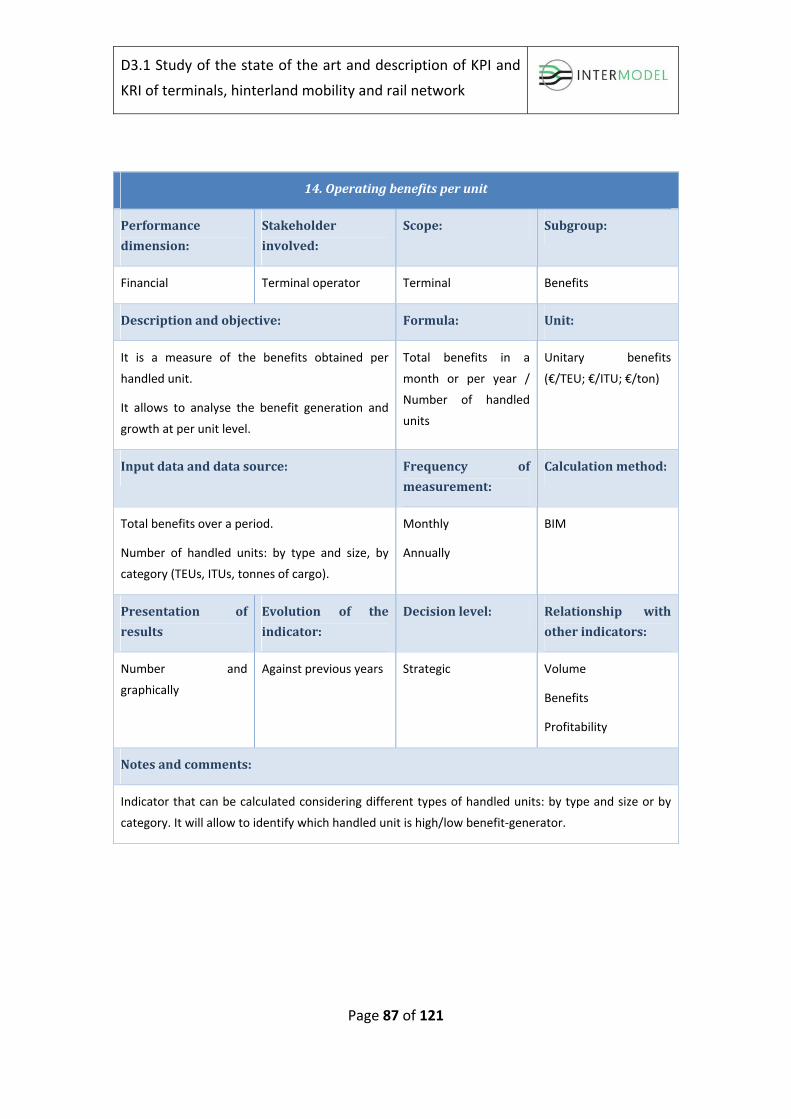
D3.1 Study of the state of the art and description of KPI and
KRI of terminals, hinterland mobility and rail network
Page 87 of 121
14.Operatingbenefitsperunit
Performance
dimension:
Stakeholder
involved:
Scope: Subgroup:
Financial Terminal operator Terminal Benefits
Descriptionandobjective: Formula: Unit:
It is a measure of the benefits obtained per
handled unit.
It allows to analyse the benefit generation and
growth at per unit level.
Total benefits in a
month or per year /
Number of handled
units
Unitary benefits
(€/TEU; €/ITU; €/ton)
Inputdataanddatasource: Frequency of
measurement:
Calculationmethod:
Total benefits over a period.
Number of handled units: by type and size, by
category (TEUs, ITUs, tonnes of cargo).
Monthly
Annually
BIM
Presentation of
results
Evolution of the
indicator:
Decisionlevel: Relationship with
otherindicators:
Number and
graphically
Against previous years Strategic Volume
Benefits
Profitability
Notesandcomments:
Indicator that can be calculated considering different types of handled units: by type and size or by
category. It will allow to identify which handled unit is high/low benefit‐generator.

D3.1 Study of the state of the art and description of KPI and
KRI of terminals, hinterland mobility and rail network
Page 88 of 121
15.Directjobssustainedbyterminalactivities
Performance
dimension:
Stakeholder
involved:
Scope: Subgroup:
Financial Public body Terminal Employment
Descriptionandobjective: Formula: Unit:
Amount of employment directly sustained and/or
created by terminal activities at a given moment
or over a given period. Jobs is a measure of the
number of jobs required to produce a given
volume of production.
Describes the direct contribution of terminal
activities to the creation of employment.
Sum of the
employment generated
in each company
working in the terminal
Calculated based on
different areas
assigned in the
terminal and the ratio
of workers per area
unit, and according to
number of equipments,
gates, etc.
Number of employees
hired (full time
employee‐FTE)
Inputdataanddatasource: Frequency of
measurement:
Calculationmethod:
Number of workers necessary for each type of
area in the terminal for its proper operation and
statistical ratios.
Annually
Ad‐hoc (e.g. in function
of specific projects)
BIM
Presentation of
results
Evolution of the
indicator:
Decisionlevel: Relationship with
otherindicators:
Number Against previous years Operational
Strategic
Notesandcomments:
Can be unbundled on a sector level (cargo handling, logistics, shipping, etc.)

D3.1 Study of the state of the art and description of KPI and
KRI of terminals, hinterland mobility and rail network
Page 89 of 121
16.Indirectjobssustainedbyterminalactivities
Performance
dimension:
Stakeholder
involved:
Scope: Subgroup:
Financial Public body Hinterland Employment
Descriptionandobjective: Formula: Unit:
Amount of employment indirectly sustained
and/or created by terminal activities at a given
period, within a given geographical area.
Describes the indirect contribution of terminal
activities to the creation of employment within a
certain region.
Several applications exist:
‐ Upstream economic activities (sectors supplying terminal activities);
‐ Downstream economic activities, mostly referred to as induced employment;
‐ Strategic or catalytic effects: linked to the attraction of specific activities due to the presence of the terminal.
Work places is a measure of the number of jobs
required to produce a given volume of
production.
For indirect impacts: A multiplier is defined which quantifies the relationship between direct and indirect employment.
For induced impacts: In most cases a multiplier is defined which quantifies the relationship between direct and induced employment.
For strategic and catalytic impacts, a multiplier is defined which quantifies the relationship between direct and strategic/catalytic employment.
Number of employees
hired (full time
employee‐FTE)
Inputdataanddatasource: Frequency of
measurement:
Calculationmethod:
Multipliers obtained from surveys or studies
(Economic Effect Analyses).
Annually
Ad‐hoc (e.g. in function
of specific projects)
BIM
Presentation of
results
Evolution of the
indicator:
Decisionlevel: Relationship with
otherindicators:
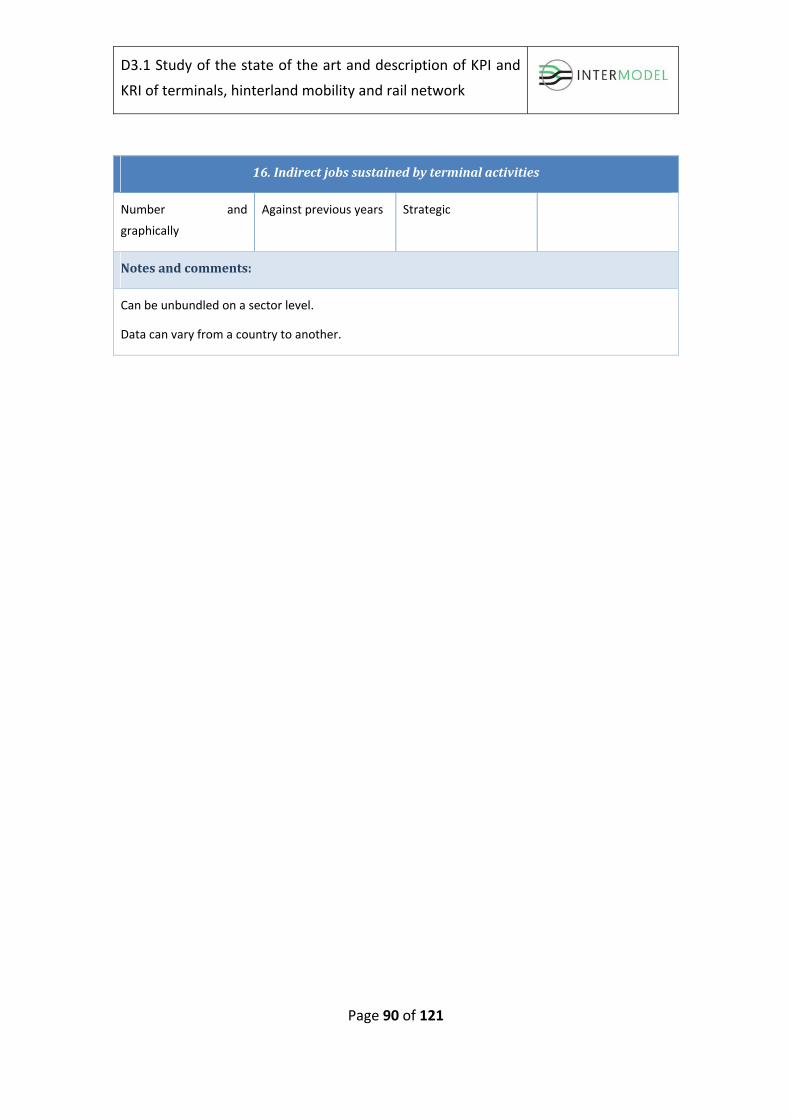
D3.1 Study of the state of the art and description of KPI and
KRI of terminals, hinterland mobility and rail network
Page 90 of 121
16.Indirectjobssustainedbyterminalactivities
Number and
graphically
Against previous years Strategic
Notesandcomments:
Can be unbundled on a sector level.
Data can vary from a country to another.

D3.1 Study of the state of the art and description of KPI and
KRI of terminals, hinterland mobility and rail network
Page 91 of 121
17.Roadandrailtrackmaintenancecost
Performance
dimension:
Stakeholder
involved:
Scope: Subgroup:
Financial Public body Rail Network
Hinterland
Maintenance cost
Descriptionandobjective: Formula: Unit:
Maintenance expenditure on road/truck
infrastructure is the expenditure for keeping
infrastructure in working order.
It refers to public spending and do not include
expenditure financed by the private sector.
Expresses the Public body interest in increasing
safety and improving mobility, and in reducing the
environmental impact of road transport,
congestion and CO2 emissions.
Road:
Total road
maintenance cost in a
year / road traffic flow
in the hinterland
Rail track:
Total rail track
maintenance cost in a
year / track kilometer
in the rail network
Monetary cost per road
kilometer (€/veh‐km)
Monetary cost per
track kilometer (€/km)
Inputdataanddatasource: Frequency of
measurement:
Calculationmethod:
Total road/rail maintenance cost: Publications,
annual accounts, statistics.
Kilometers within the hinterland.
Annually
Ad‐hoc (e.g. in function
of specific projects)
Terminal simulation
model
Presentation of
results
Evolution of the
indicator:
Decisionlevel: Relationship with
otherindicators:
Number and
graphically
Against previous years Strategic Public investment
Reliability
Notesandcomments:
Indicator that can be calculated considering road and truck separately.
It is a variable cost.

D3.1 Study of the state of the art and description of KPI and
KRI of terminals, hinterland mobility and rail network
Page 92 of 121
17.Roadandrailtrackmaintenancecost
Data coverage varies significantly from a country to another, mainly due to the lack of more detailed
common definitions and the difficulty for countries to change their data collection system.

D3.1 Study of the state of the art and description of KPI and
KRI of terminals, hinterland mobility and rail network
Page 93 of 121
18.Easinessofentryandexitfromhighways
Performance
dimension:
Stakeholder
involved:
Scope: Subgroup:
Quality Terminal operator Hinterland Accessibility
Descriptionandobjective: Formula: Unit:
The easiness of entry and exit from highways is
defined as the accessibility or connection to main
roads.
Average driving time
from terminal to main
road network
connections
Time (minutes)
Inputdataanddatasource: Frequency of
measurement:
Calculationmethod:
Time related data from the simulation model.
Number of network connections.
Annually
Traffic simulation tool
Presentation of
results
Evolution of the
indicator:
Decisionlevel: Relationship with
otherindicators:
Number and
graphically
Against previous years Strategic Hinterland connection
Notesandcomments:
Data needed is easy to research and the effort for collection is low.

D3.1 Study of the state of the art and description of KPI and
KRI of terminals, hinterland mobility and rail network
Page 94 of 121
19.Easinessofentryandexitfromrailnetwork
Performance
dimension:
Stakeholder
involved:
Scope: Subgroup:
Quality Terminal operator Rail network Accessibility
Descriptionandobjective: Formula: Unit:
The easiness of entry and exit from railway
network is defined as the accessibility or
connection to main rail track.
Average travel time
between the terminal
and the main railway
connections
Time (minutes)
Inputdataanddatasource: Frequency of
measurement:
Calculationmethod:
Distance between the terminal and the main rail
track.
Layout
Previously to the
construction of the
terminal
Ad‐hoc (e.g. in function
of specific projects)
Traffic simulation tool
Presentation of
results
Evolution of the
indicator:
Decisionlevel: Relationship with
otherindicators:
Number and
graphically.
Against previous years Strategic Hinterland connection
Notesandcomments:
Data needed is easy to research and the effort for collection is low.

D3.1 Study of the state of the art and description of KPI and
KRI of terminals, hinterland mobility and rail network
Page 95 of 121
20.Energyconsumptionperhandledunit
Performance
dimension:
Stakeholder
involved:
Scope: Subgroup:
Environment Terminal operator Terminal Energy efficiency
Descriptionandobjective: Formula: Unit:
Measures the energy consumed by handled unit.
The aim is to measure the environmental
improvement according to changes in modal split,
use of efficient vehicles or alternative fuels, and a
better management.
Total energy consumed
/ Number of handled
units
kJ/kW per load unit
Volume of fuel per
handled unit
Inputdataanddatasource: Frequency of
measurement:
Calculationmethod:
Total energy consumption in the terminal
estimated with the traffic simulation tool.
Total number of handled units.
Monthly
Annually
Traffic simulation tool
Presentation of
results
Evolution of the
indicator:
Decisionlevel: Relationship with
otherindicators:
Number and
graphically
Against previous year Strategic Energy consumption
Terminal throughput
Notesandcomments:
Indicator that can be calculated considering different types of handled units: by type and size or by
category (TEUs, ITUs, tons)
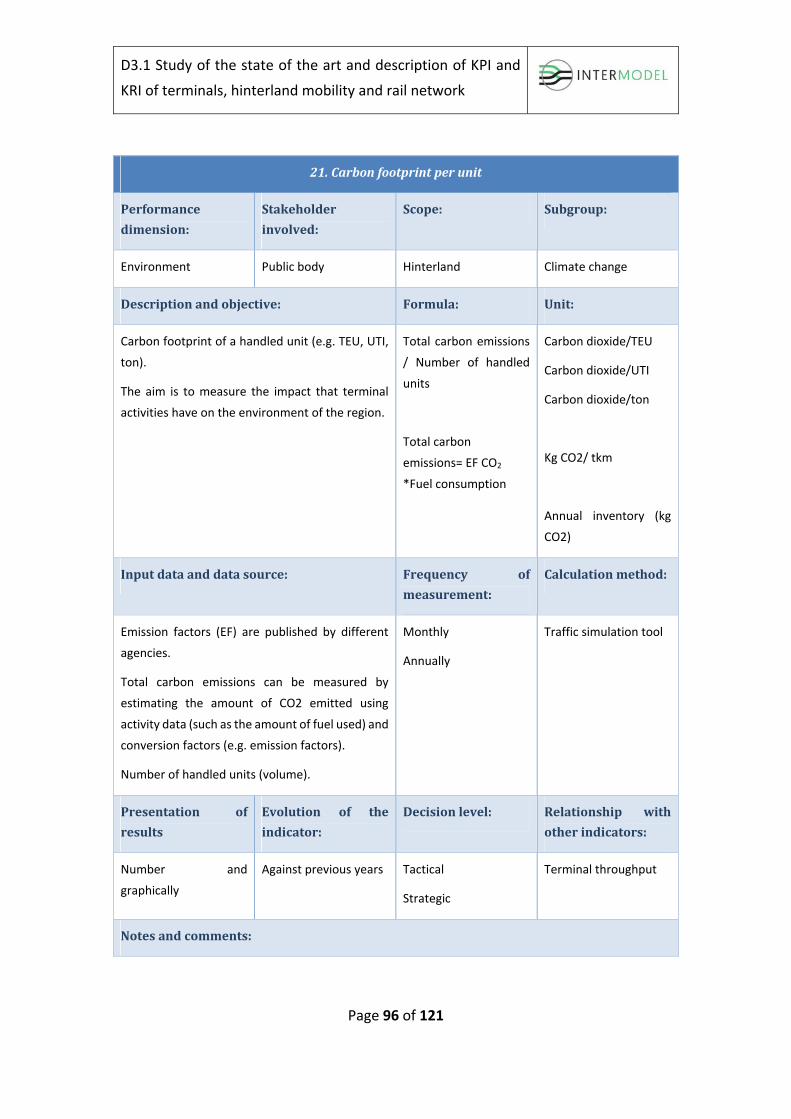
D3.1 Study of the state of the art and description of KPI and
KRI of terminals, hinterland mobility and rail network
Page 96 of 121
21.Carbonfootprintperunit
Performance
dimension:
Stakeholder
involved:
Scope: Subgroup:
Environment Public body Hinterland Climate change
Descriptionandobjective: Formula: Unit:
Carbon footprint of a handled unit (e.g. TEU, UTI,
ton).
The aim is to measure the impact that terminal
activities have on the environment of the region.
Total carbon emissions
/ Number of handled
units
Total carbon
emissions= EF CO2
*Fuel consumption
Carbon dioxide/TEU
Carbon dioxide/UTI
Carbon dioxide/ton
Kg CO2/ tkm
Annual inventory (kg
CO2)
Inputdataanddatasource: Frequency of
measurement:
Calculationmethod:
Emission factors (EF) are published by different
agencies.
Total carbon emissions can be measured by
estimating the amount of CO2 emitted using
activity data (such as the amount of fuel used) and
conversion factors (e.g. emission factors).
Number of handled units (volume).
Monthly
Annually
Traffic simulation tool
Presentation of
results
Evolution of the
indicator:
Decisionlevel: Relationship with
otherindicators:
Number and
graphically
Against previous years Tactical
Strategic
Terminal throughput
Notesandcomments:

D3.1 Study of the state of the art and description of KPI and
KRI of terminals, hinterland mobility and rail network
Page 97 of 121
21.Carbonfootprintperunit
Indicator that can be calculated considering different types of handled units: by type and size or by
category (TEUs, ITUs, tons).

D3.1 Study of the state of the art and description of KPI and
KRI of terminals, hinterland mobility and rail network
Page 98 of 121
22.Delaysproduced(reliability)‐Road
Performance
dimension:
Stakeholder
involved:
Scope: Subgroup:
Quality Public body Hinterland Road congestion
Descriptionandobjective: Formula: Unit:
Expresses arrival and departures delays.
It is an external factor (e.g. delays of trucks due to
congestion lead to longer waiting times in the
terminal).
Average delays (extent)
Time (minutes, hours)
Inputdataanddatasource: Frequency of
measurement:
Calculationmethod:
Time related data from the terminal simulation
model.
Traffic flows from traffic simulation.
Monthly
Annually
Terminal simulation
model
Presentation of
results
Evolution of the
indicator:
Decisionlevel: Relationship with
otherindicators:
Number and
graphically
Against previous year Operational Waiting time
Turnaround time
Reliability
Notesandcomments:

D3.1 Study of the state of the art and description of KPI and
KRI of terminals, hinterland mobility and rail network
Page 99 of 121
23.Delaysproduced(reliability)‐Railway
Performance
dimension:
Stakeholder
involved:
Scope: Subgroup:
Quality Public body Rail Network Rail network
congestion
Descriptionandobjective: Formula: Unit:
Expresses arrival and departures delays.
It is an external factor (e.g. delays of freight trains
lead to longer waiting times in the terminal).
Average delays (extent)
Time (minutes, hours)
Inputdataanddatasource: Frequency of
measurement:
Calculationmethod:
Time related data from the terminal simulation
model.
Annually Terminal simulation
model
Presentation of
results
Evolution of the
indicator:
Decisionlevel: Relationship with
otherindicators:
Number and
graphically
Against previous years Operational
Notesandcomments:

D3.1 Study of the state of the art and description of KPI and
KRI of terminals, hinterland mobility and rail network
Page 100 of 121
24.CO,NOX,SOC,PMemissions
Performance
dimension:
Stakeholder
involved:
Scope: Subgroup:
Environment Public body Hinterland Air pollution
Descriptionandobjective: Formula: Unit:
The aim is to analyse quantify the adverse effects
that acid rain and smog precursors can have on
biodiversity.
Acid rain and smog precursors (CO, NOX and SOC)
are emissions to air which, with dispersion, can be
transported in the atmosphere over distances of
hundreds to thousands of miles, and eventually
deposited through precipitation or by direct ‘dry’
processes.
Total emissions /
Number of handled
units
Total CO emissions= EF
CO *Fuel consumption
Total NOx emissions=
EF NOx *Fuel
consumption
Total SOC emissions=
EF SOC *Fuel
consumption
Total PM emissions= EF
PM *Fuel consumption
Kg CO, NOX, SOC and
PM per handled unit
Kg CO, NOX, SOC and
PM / tkm
Annual inventory of
CO, NOX, SOC and PM
(kg; tons)
Inputdataanddatasource: Frequency of
measurement:
Calculationmethod:
Emissions factors per type of equipment and/or
activity obtained from statistical data.
Annually Traffic simulation tool
Presentation of
results
Evolution of the
indicator:
Decisionlevel: Relationship with
otherindicators:
Number and
graphically
Against previous years Strategic
Notesandcomments:

D3.1 Study of the state of the art and description of KPI and
KRI of terminals, hinterland mobility and rail network
Page 101 of 121
24.CO,NOX,SOC,PMemissions
Indicator that can be calculated considering different types of handled units: by type and size or by
category (TEUs, ITUs, tons).

D3.1 Study of the state of the art and description of KPI and
KRI of terminals, hinterland mobility and rail network
Page 102 of 121
25.Populationexposedtohighlevelsoftrafficnoise
Performance
dimension:
Stakeholder
involved:
Scope: Subgroup:
Environment Public body Hinterland Noise
Descriptionandobjective: Formula: Unit:
Expresses the amount of people exposed to
levels of traffic noise above the maximum
outdoors noise level permitted.
Shows the awareness for environmental
concerns as measures for a better protection of
the environment.
It is calculated according to the sound power
level from the traffic flow (vehicles‐km) by
using simulation model for propagation
distance (Örgen and Barregard, 2016)1
M (Leq‐
55dB)=∑ ∬
∙
n represents a squared area within the hinterland region
d(n) is the population density at square n
: Step function for noise level
Number of persons
exposed to a noise
level over 55 dB
Inputdataanddatasource: Frequency of
measurement:
Calculation
method:
Maximum outdoors noise level (dBA).
Road traffic noise prediction.
Annually Traffic simulation tool
Presentation of
results
Evolution of the
indicator:
Decisionlevel: Relationship with
otherindicators:
Number and
graphically
Against previous
years
Strategic
Notesandcomments:
Often connected with additional costs.
1 https://www.ncbi.nlm.nih.gov/pmc/articles/PMC4865157/#pone.0155328.ref008

D3.1 Study of the state of the art and description of KPI and
KRI of terminals, hinterland mobility and rail network
Page 103 of 121
25.Populationexposedtohighlevelsoftrafficnoise
Noise emission models are not native implemented within the traffic simulation tool. Thus, it should
be developed ad‐hoc.
Poor data access.
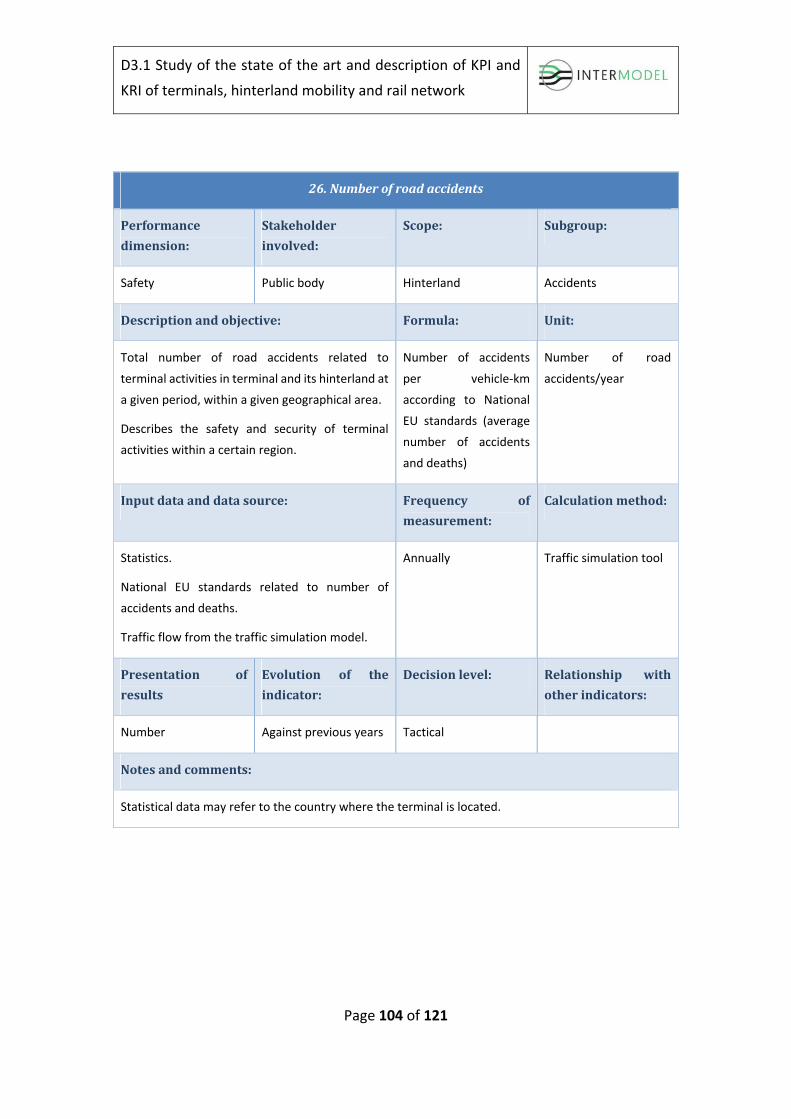
D3.1 Study of the state of the art and description of KPI and
KRI of terminals, hinterland mobility and rail network
Page 104 of 121
26.Numberofroadaccidents
Performance
dimension:
Stakeholder
involved:
Scope: Subgroup:
Safety Public body Hinterland Accidents
Descriptionandobjective: Formula: Unit:
Total number of road accidents related to
terminal activities in terminal and its hinterland at
a given period, within a given geographical area.
Describes the safety and security of terminal
activities within a certain region.
Number of accidents
per vehicle‐km
according to National
EU standards (average
number of accidents
and deaths)
Number of road
accidents/year
Inputdataanddatasource: Frequency of
measurement:
Calculationmethod:
Statistics.
National EU standards related to number of
accidents and deaths.
Traffic flow from the traffic simulation model.
Annually Traffic simulation tool
Presentation of
results
Evolution of the
indicator:
Decisionlevel: Relationship with
otherindicators:
Number Against previous years Tactical
Notesandcomments:
Statistical data may refer to the country where the terminal is located.

D3.1 Study of the state of the art and description of KPI and
KRI of terminals, hinterland mobility and rail network
Page 105 of 121
27.Numberofrailwayaccidents
Performance
dimension:
Stakeholder
involved:
Scope: Subgroup:
Safety Public body Hinterland Accidents
Descriptionandobjective: Formula: Unit:
Total number of railway accidents related to
terminal activities in terminal and its hinterland at
a given period, within a given geographical area.
Describes the safety and security of terminal
activities within a certain region.
Number of accidents
per train‐km according
to National EU
standards (average
number of accidents
and deaths)
Number of railway
accidents/year
Inputdataanddatasource: Frequency of
measurement:
Calculationmethod:
Statistics.
National EU standards related to number of
accidents and deaths.
Traffic flow from the traffic simulation model.
Annually Traffic simulation tool
Presentation of
results
Evolution of the
indicator:
Decisionlevel: Relationship with
otherindicators:
Number Against previous year Operational
Notesandcomments:
Statistical data may refer to the country where the terminal is located.

D3.1 Study of the state of the art and description of KPI and
KRI of terminals, hinterland mobility and rail network
Page 106 of 121
28.Manoeuvringtime
Performance
dimension:
Stakeholder
involved:
Scope: Subgroup:
Operational Operator Terminal Efficiency;
Productivity‐time
related
Descriptionandobjective: Formula: Unit:
It is the time required for port
services/shunting operations/driving
operations to arrive/depart to/from the
terminal.
It reflects layout effectiveness and the effects
of internal congestion on circulation.
Trains:
Sum of train shunting time
for entrance and departure
Trucks:
Truck driving time from
waiting area to loading
position and reverse
processes
Ships:
Sum of ship port services
time for entrance + ship port
services time for departure
Time (minutes,
hours)
Inputdataanddatasource: Frequency of
measurement:
Calculation
method:
Time related data from the terminal simulation
model
Daily/monthly/annually Terminal simulation
model
Presentation of
results
Evolution of the
indicator:
Decisionlevel: Relationship with
otherindicators:
Waiting time per
hour‐day (chart)
Evolution per
day/month/year
Operational Turnaround time
Notesandcomments:
This partial time is included in arrival and departure time in Turnaround Time indicator.

D3.1 Study of the state of the art and description of KPI and
KRI of terminals, hinterland mobility and rail network
Page 107 of 121
29.Servicetime
Performance
dimension:
Stakeholder
involved:
Scope: Subgroup:
Operational Operator Terminal Efficiency;
Productivity‐time
related
Descriptionandobjective: Formula: Unit:
It is the time elapsed from the commence of
cargo operations to their completion.
Trains:
Sum of train loading and/or
unloading time
Trucks:
Sum of truck loading and/or
unloading time
Ships:
Sum of net berthing time
(loading and/or unloading
time)
Time (minutes,
hours)
Inputdataanddatasource: Frequency of
measurement:
Calculation
method:
Time related data from the terminal simulation
model.
Daily/monthly/annually Terminal simulation
model
Presentation of
results
Evolution of the
indicator:
Decisionlevel: Relationshipwith
otherindicators:
Service time per
truck/train/vessel
Evolution per
day/month/year
Operational Turnaround time
Berthing time
Notesandcomments:
This time is included in loading/unloading time within turnaround time indicator.
In case of simultaneous loading/unloading processes, we should consider total operational time and
not the sum of both components.

D3.1 Study of the state of the art and description of KPI and
KRI of terminals, hinterland mobility and rail network
Page 108 of 121
30.Berthingtime
Performance
dimension:
Stakeholder
involved:
Scope: Subgroup:
Operational Operator Terminal Efficiency;
Productivity‐time
related
Descriptionandobjective: Formula: Unit:
It is the gross time elapsed from the arrival of
vessels to the terminal to its departure.
Sum of gross berthing time:
loading and/or unloading
time and waiting time to be
served
Time (minutes,
hours)
Inputdataanddatasource: Frequency of
measurement:
Calculation
method:
Time related data from the terminal simulation
model.
Daily/monthly/annually Terminal simulation
model
Presentation of
results
Evolution of the
indicator:
Decisionlevel: Relationshipwith
otherindicators:
Service time per
truck/train/vessel
Evolution per
day/month/year
Operational Turnaround time
Service time
Notesandcomments:

D3.1 Study of the state of the art and description of KPI and
KRI of terminals, hinterland mobility and rail network
Page 109 of 121
31. Idletime(equipment)
Performance
dimension:
Stakeholder
involved:
Scope: Subgroup:
Operational Operator Terminal Efficiency;
Productivity‐time
related
Descriptionandobjective: Formula: Unit:
It is the non‐productive time in which an
employee or equipment item remain on site
ready for use but is placed in a standby basis.
Sum of non‐productive time
per equipment and
employee
Time (minutes,
hours)
Inputdataanddatasource: Frequency of
measurement:
Calculation
method:
Time related data from the terminal simulation
model
Daily/monthly/annually Terminal simulation
model
Presentation of
results
Evolution of the
indicator:
Decisionlevel: Relationship with
otherindicators:
Idle time per
equipment item and
employee
Evolution per
day/month/year
Operational Equipment utilization
Notesandcomments:

D3.1 Study of the state of the art and description of KPI and
KRI of terminals, hinterland mobility and rail network
Page 110 of 121
32. CapitalExpenditures(CAPEX)
Performance
dimension:
Stakeholder
involved:
Scope: Subgroup:
Financial Investor Terminal Costs
Descriptionandobjective: Formula: Unit:
The capital expense are funds used by a
company/terminal operator to acquire or upgrade
physical assets such as property, buildings or
equipment.
These costs are spread over the useful life of the
asset and need to be capitalized.
CAPEX is the sum of all
expenses (money
spent) on buildings,
equipment and
infrastructure items by
the terminal operator
Monetary units (€)
Unitary costs (€/ton;
€/TEU; €/UTI)
Inputdataanddatasource: Frequency of
measurement:
Calculationmethod:
Expenditures associated to buildings, equipment
and infrastructure items
Monthly/annually BIM
Presentation of
results
Evolution of the
indicator:
Decisionlevel: Relationship with
otherindicators:
Graphically and
amount of money
Yes (annually) Strategic
Operational
Profitability
Notesandcomments:

D3.1 Study of the state of the art and description of KPI and
KRI of terminals, hinterland mobility and rail network
Page 111 of 121
33. OperationalExpenditures(OPEX)
Performance
dimension:
Stakeholder
involved:
Scope: Subgroup:
Financial Operator Terminal Operating cost
Descriptionandobjective: Formula: Unit:
An operating expense is an ongoing cost a
business/terminal operator incurs through its
normal business operations.
Those include accounting expenses, license fees,
maintenance and repairs, office expenses,
supplies, utilities, insurance, property
management, taxes, labour, energy, etc.
OPEX is the sum of all
expenses (money
spent) on accounting
expenses, concession
fees, maintenance and
repairs, equipment
operating costs, office
expenses, supplies,
utilities, insurance,
taxes, labour, energy,
etc.
Monetary units (€)
Unitary costs (€/ton;
€/TEU; €/UTI)
Inputdataanddatasource: Frequency of
measurement:
Calculationmethod:
Cost modelling from Terminal simulation model or
BIM cost module
Monthly/annually BIM/Terminal
simulation model
Presentation of
results
Evolution of the
indicator:
Decisionlevel: Relationship with
otherindicators:
Graphically and
percentage
Yes, monthly/annually Tactical
Operational
Operating efficiency
Notesandcomments:
Operating expenses are often considered to be either fixed or variable.
It may be quite difficult to calculate OPEX in detail. Therefore, it is suggested to estimate them as flat
rates per item/unit.

D3.1 Study of the state of the art and description of KPI and
KRI of terminals, hinterland mobility and rail network
Page 112 of 121
34. Correctivemaintenancecost(equipment)
Performance
dimension:
Stakeholder
involved:
Scope: Subgroup:
Financial Operator Terminal Maintenance cost ‐
equipment
Descriptionandobjective: Formula: Unit:
This indicator is related to the total downtime in a
period scheduled for corrective maintenance and
breakdown repairs.
Hours per year for each
equipment item
Inputdataanddatasource: Frequency of
measurement:
Calculationmethod:
Annually BIM
Presentation of
results
Evolution of the
indicator:
Decisionlevel: Relationship with
otherindicators:
Graphically and
percentage
Yes, annually Strategic
Operational
Operating efficiency
Profitability
Notesandcomments:

D3.1 Study of the state of the art and description of KPI and
KRI of terminals, hinterland mobility and rail network
Page 113 of 121
35. Preventivemaintenancecost(equipment)
Performance
dimension:
Stakeholder
involved:
Scope: Subgroup:
Financial Operator Terminal Maintenance cost ‐
equipment
Descriptionandobjective: Formula: Unit:
This indicator is related to the total downtime in a
period scheduled for preventive maintenance and
breakdown repairs.
Hours per year for each
equipment item
Inputdataanddatasource: Frequency of
measurement:
Calculationmethod:
Annually BIM
Presentation of
results
Evolution of the
indicator:
Decisionlevel: Relationship with
otherindicators:
Graphically and
percentage
Yes, annually Strategic
Operational
Operating efficiency
Profitability
Notesandcomments:

D3.1 Study of the state of the art and description of KPI and
KRI of terminals, hinterland mobility and rail network
Page 114 of 121
36. Correctiveconcretestructuresmaintenancecost
Performance
dimension:
Stakeholder
involved:
Scope: Subgroup:
Financial Investor
Terminal operator
Public body
Terminal Infrastructure
maintenance cost
Descriptionandobjective: Formula: Unit:
A concrete structure shall retain the required
levels of its performance for the intended service
life with adequate reliability by providing
necessary maintenance activities. For
accomplishing it, an adequate maintenance plan,
in which the performance of the concrete
structure shall be clearly specified on the basis of
a service life scenario incorporating maintenance
strategy, should be preliminarily made.
The appropriate maintenance plan for existing
structures should be formulated under the basis
of appropriated indicators (see input data).
Maintenance index
Inputdataanddatasource: Frequency of
measurement:
Calculationmethod:
Crack opening
Chloride content
Carbonation
Steel corrosion rate
Exposure class
Lifespan
3 years BIM
Presentation of
results
Evolution of the
indicator:
Decisionlevel: Relationship with
otherindicators:
Graphically Every 5 years Strategic Operating efficiency
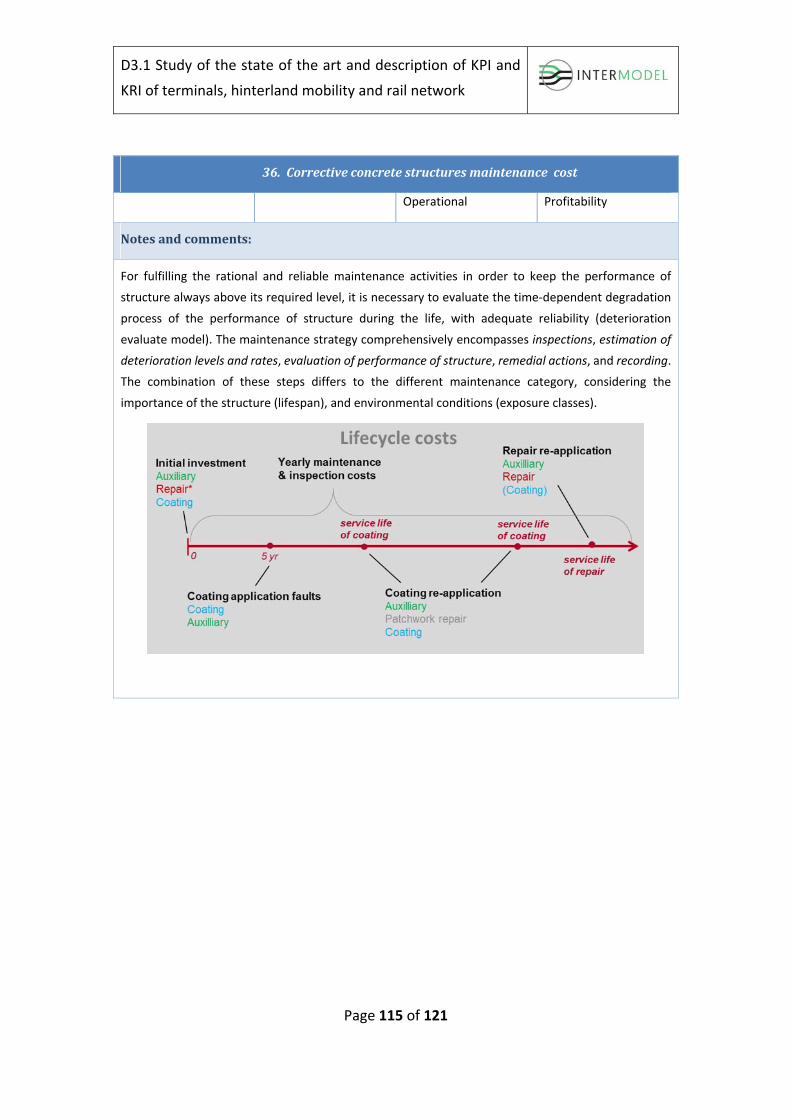
D3.1 Study of the state of the art and description of KPI and
KRI of terminals, hinterland mobility and rail network
Page 115 of 121
36. Correctiveconcretestructuresmaintenancecost
Operational Profitability
Notesandcomments:
For fulfilling the rational and reliable maintenance activities in order to keep the performance of
structure always above its required level, it is necessary to evaluate the time‐dependent degradation
process of the performance of structure during the life, with adequate reliability (deterioration
evaluate model). The maintenance strategy comprehensively encompasses inspections, estimation of
deterioration levels and rates, evaluation of performance of structure, remedial actions, and recording.
The combination of these steps differs to the different maintenance category, considering the
importance of the structure (lifespan), and environmental conditions (exposure classes).

D3.1 Study of the state of the art and description of KPI and
KRI of terminals, hinterland mobility and rail network
Page 116 of 121
37. Preventiveconcretestructuresmaintenancecost
Performance
dimension:
Stakeholder
involved:
Scope: Subgroup:
Financial Investor
Terminal operator
Public body
Terminal Infrastructure
maintenance cost
Descriptionandobjective: Formula: Unit:
For achieving proper maintenance of newly
constructed structures, the maintenance plan
should be formulated at the design stage, with the
proper selection of the materials to be used in the
construction, which assure easy and less
maintenance tasks during the structure design
service life.
Maintenance index
Inputdataanddatasource: Frequency of
measurement:
Calculationmethod:
Exposure class
Lifespan
Frost attack
Chemical attack
‐ BIM
Presentation of
results
Evolution of the
indicator:
Decisionlevel: Relationship with
otherindicators:
Graphically ‐ Strategic
Operational
Operating efficiency
Profitability
Notesandcomments:
For fulfilling the rational and reliable maintenance activities in order to keep the performance of
structure always above its required level, it is necessary to evaluate the time‐dependent degradation
process of the performance of structure during the life, with adequate reliability (deterioration
evaluate model). The maintenance strategy comprehensively encompasses inspections, estimation of

D3.1 Study of the state of the art and description of KPI and
KRI of terminals, hinterland mobility and rail network
Page 117 of 121
37. Preventiveconcretestructuresmaintenancecost
deterioration levels and rates, evaluation of performance of structure, remedial actions, and recording.
The combination of these steps differs to the different maintenance category, considering the
importance of the structure (lifespan), and environmental conditions (exposure classes).

D3.1 Study of the state of the art and description of KPI and
KRI of terminals, hinterland mobility and rail network
Page 118 of 121
38. Waitingtime/Turnaroundtime
Performance
dimension:
Stakeholder
involved:
Scope: Subgroup:
Quality Terminal operator Terminal Service quality ‐ time
Descriptionandobjective: Formula: Unit:
It is the unproductive time spent waiting
(queueing) for labour/equipment service, waiting
at the gates, buffer areas or to be
loaded/unloaded over the total time
(turnaround).
Expresses the terminal operator’s ability to run
reliable and punctual operations.
Train waiting time /
Train turnaround time
Truck waiting time /
Truck turnaround time
Ship waiting time / Ship
turnaround time
Percentage (%)
Inputdataanddatasource: Frequency of
measurement:
Calculationmethod:
Time related data from the terminal simulation
model.
For each
vessel/truck/train
arrival
Terminal simulation
model
Presentation of
results
Evolution of the
indicator:
Decisionlevel: Relationship with
otherindicators:
Graphically and
percentage
Average values per
year and per type of
customer (ship, truck,
train)
Operational
Strategic
Waiting time
Turnaround time
Notesandcomments:
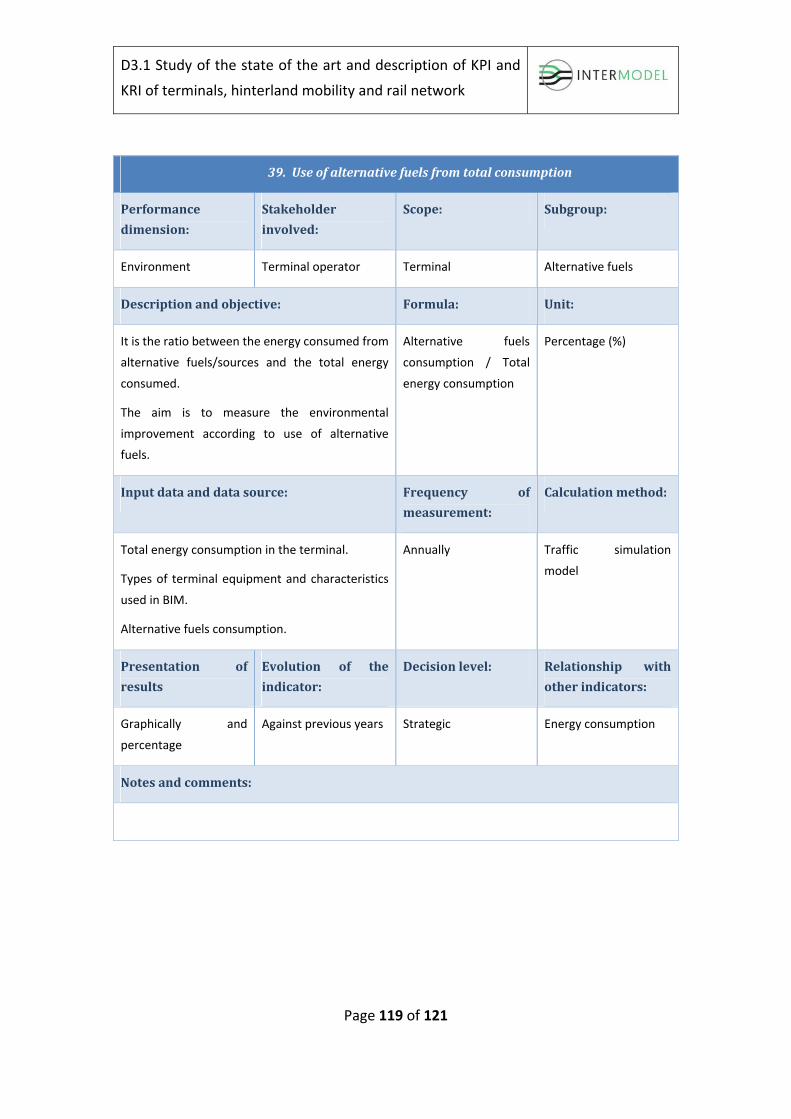
D3.1 Study of the state of the art and description of KPI and
KRI of terminals, hinterland mobility and rail network
Page 119 of 121
39. Useofalternativefuelsfromtotalconsumption
Performance
dimension:
Stakeholder
involved:
Scope: Subgroup:
Environment Terminal operator Terminal Alternative fuels
Descriptionandobjective: Formula: Unit:
It is the ratio between the energy consumed from
alternative fuels/sources and the total energy
consumed.
The aim is to measure the environmental
improvement according to use of alternative
fuels.
Alternative fuels
consumption / Total
energy consumption
Percentage (%)
Inputdataanddatasource: Frequency of
measurement:
Calculationmethod:
Total energy consumption in the terminal.
Types of terminal equipment and characteristics
used in BIM.
Alternative fuels consumption.
Annually Traffic simulation
model
Presentation of
results
Evolution of the
indicator:
Decisionlevel: Relationship with
otherindicators:
Graphically and
percentage
Against previous years Strategic Energy consumption
Notesandcomments:
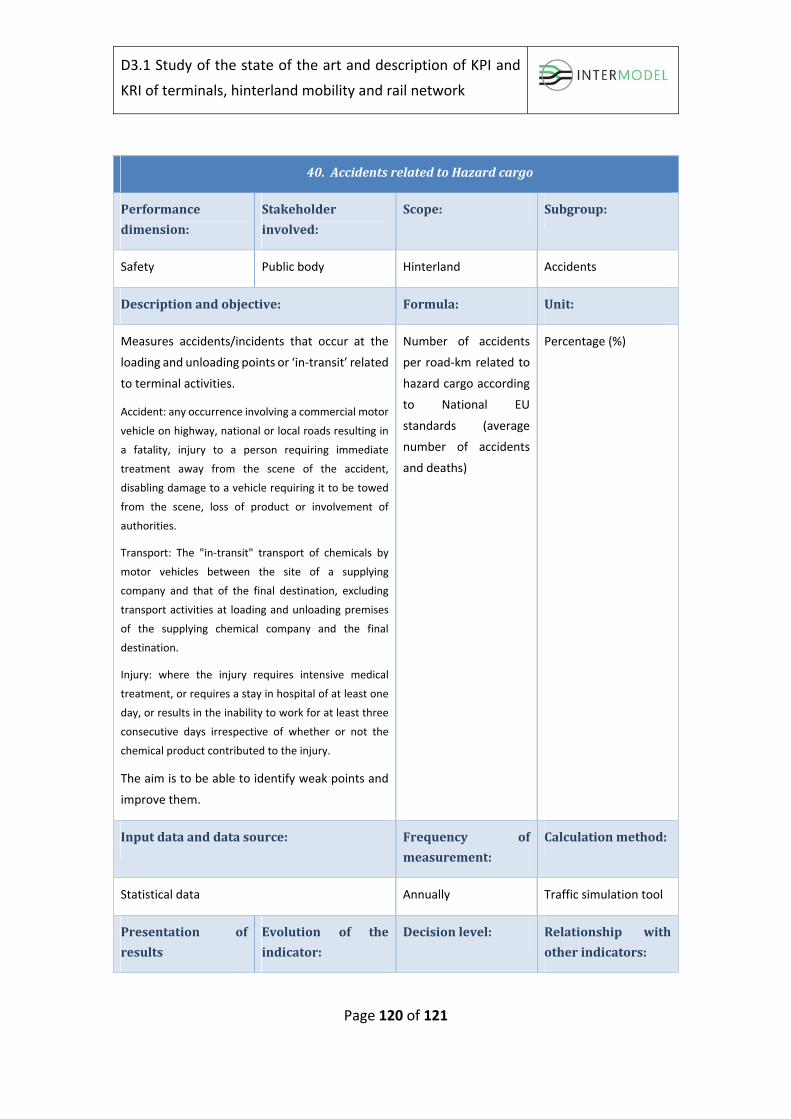
D3.1 Study of the state of the art and description of KPI and
KRI of terminals, hinterland mobility and rail network
Page 120 of 121
40. AccidentsrelatedtoHazardcargo
Performance
dimension:
Stakeholder
involved:
Scope: Subgroup:
Safety Public body Hinterland Accidents
Descriptionandobjective: Formula: Unit:
Measures accidents/incidents that occur at the
loading and unloading points or ‘in‐transit’ related
to terminal activities.
Accident: any occurrence involving a commercial motor
vehicle on highway, national or local roads resulting in
a fatality, injury to a person requiring immediate
treatment away from the scene of the accident,
disabling damage to a vehicle requiring it to be towed
from the scene, loss of product or involvement of
authorities.
Transport: The "in‐transit" transport of chemicals by
motor vehicles between the site of a supplying
company and that of the final destination, excluding
transport activities at loading and unloading premises
of the supplying chemical company and the final
destination.
Injury: where the injury requires intensive medical
treatment, or requires a stay in hospital of at least one
day, or results in the inability to work for at least three
consecutive days irrespective of whether or not the
chemical product contributed to the injury.
The aim is to be able to identify weak points and
improve them.
Number of accidents
per road‐km related to
hazard cargo according
to National EU
standards (average
number of accidents
and deaths)
Percentage (%)
Inputdataanddatasource: Frequency of
measurement:
Calculationmethod:
Statistical data Annually Traffic simulation tool
Presentation of
results
Evolution of the
indicator:
Decisionlevel: Relationship with
otherindicators:

D3.1 Study of the state of the art and description of KPI and
KRI of terminals, hinterland mobility and rail network
Page 121 of 121
40. AccidentsrelatedtoHazardcargo
Number Against previous year Operational Total number of
accidents
Notesandcomments:
Statistical data may refer to the country where the terminal is located.
Consider in case the terminal handles hazard cargo.