d 1.1.1.e guidelines for risk assessment to geological and ...drm.cenn.org/pdf/guidelines for risk...
TRANSCRIPT

Guidelines for landslide susceptibility, hazard and risk zoning
1
Deliverable 1.1.1
Guidelines for Risk Assessment to Geological and Hydro-meteorological Hazards
Institutional building for natural disaster risk reduction (DRR) in Georgia
a MATRA project implemented by
Faculty of Geo-information Science and Earth Observation, University of Twente (ITC, lead), The Netherlands
& Caucasus Environmental NGO Network (CENN), Georgia

Guidelines for landslide susceptibility, hazard and risk zoning
2
Contents
1. Disaster Risk Management Framework ....................................... 4
2. DRR related existing and future plans of national, regional and municipal authorities ...................................................................... 9
2.1 National level ........................................................................................... 9 2.1.1 The Ministries ............................................................................ 10
2.2 Regional, municipal level ...................................................................... 11 2.3 Structures and persons with responsibilities in DRR ............................. 12
2.3.1 The Ministry of Environment Protection and Natural Resources12 2.3.2 The Emergency Situation Management Department of the Ministry of
Internal Affairs of Georgia ........................................................ 13 2.4 Suggested Management of Natural Disasters under the Conditions of the
Existing Legislation ............................................................................ 13
3. Flood Hazard assessment ............................................................. 15 3.1.1 Main types and causes ............................................................... 15 3.1.2 Data requirements related to different scales and approaches ... 16 3.1.3 History and frequency of historical events ................................ 16 3.1.4 Hazard assessment at a National/Regional scale: ...................... 17 3.1.5 Hazard assessment at District/Municipal scale. ........................ 17 3.1.6 Selection of optimal approaches in Georgian context. .............. 18
4. Landslide hazard assessment ....................................................... 19 4.1 Introduction ............................................................................................ 19 4.2 QRA framework ..................................................................................... 21 4.3 Landslide zoning at different scales ....................................................... 24
4.3.1 Purpose of landslide zoning maps ............................................ 24 4.3.2 Landslide zoning levels ............................................................. 25 4.3.3 Landslide zoning map scales .................................................... 26 4.3.4 References ................................................................................. 28
4.4 Input data for landslide risk assessment ................................................. 31 4.4.1 Landslide inventory mapping .................................................... 32 4.4.2 Environmental factors................................................................ 36 4.4.3 Triggering factors ...................................................................... 39 4.4.4 Elements at risk data .................................................................. 39 4.4.5 Quality of the input data ............................................................ 40 4.4.6 References ................................................................................. 42
4.5 SUGGESTED METHODS FOR LANDSLIDE SUSCEPTIBILITY ASSESSMENT ................................................................................... 44 4.5.1 Methods for susceptibility assessment related to landslide initiation
................................................................................................... 46 4.5.2 Landslide inventory analysis ..................................................... 47 4.5.3 Knowledge driven methods ....................................................... 48 4.5.4 Data-driven landslide susceptibility assessment methods ......... 49 4.5.5 Physically-based landslide susceptibility assessment methods . 50 4.5.6 Selecting the best method of analysis ........................................ 52
4.6 FROM SUSCEPTIBILITY TO HAZARD ............................................ 54 4.6.1 References ................................................................................. 55

Guidelines for landslide susceptibility, hazard and risk zoning
3
5. Annex 1: Glossary of terms .......................................................... 59

Guidelines for landslide susceptibility, hazard and risk zoning
4
International Decade for Natural Disaster Reduction: 1990 - 1999:
On 11 December 1987 at its 42nd session, the General Assembly of the United Nations designated the 1990's as the International Decade for Natural Disaster Reduction (IDNDR). The basic idea behind this proclamation of the Decade was and still remains to be the unacceptable and rising levels of losses which disasters continue to incur on the one hand, and the existence, on the other hand, of a wealth of scientific and engineering know-how which could be effectively used to reduce losses resulting from disasters. The main objective was to minimize loss of life and property, economic and social disruption caused by the occurrence of natural disasters.
1. Disaster Risk Management Framework
The general framework of this guideline is based on the Disaster Risk Management (DRM) approach promoted by the United Nations through the International Strategy for Disaster Reduction – ISDR. One of the key premises in this approach is that disasters are not seen as events of nature by itself but the product of intricate relationships linking the natural and organizational structure of a society (UN-ISDR, 2005). Given the strength of the physical forces involved and the human socioeconomic interdependence on climate and the environment, it is unlikely that adverse impacts from climate events will ever be totally eliminated. Still, efforts to understand and dig in the root causes of disasters clearly indicate that there is considerable scope, both at a macro and household level, to handle the extent and nature of disaster occurrence. Disasters could, in fact, be reduced, if not prevented, their impact on peoples and
communities’ mitigated, and human action or inaction to high risk and vulnerability to natural hazards could spell the difference (Birkmann, 2006). Human societies have, therefore, the responsibility to identify the risks and factors leading to disasters and decide on the appropriate interventions to control or manage them. Risk assessment is then a central stage that, more than a purely scientific enterprise should be seen as a collaborative activity that brings together professionals, authorized disaster managers, local authorities and the people living in the exposed areas.
The past decades have witnessed a shift in focus from ‘disaster recovery and response’ to ‘risk management and mitigation’. The change was also from an approach that was focused primarily on the hazard as the main causal factor for risk, and the reduction of the risk by physical protection measures to a focus on vulnerability of communities and ways to reduce those through preparedness and early warning. Later also the capacities of local
Disaster Risk Reduction (DRR) refers to the conceptual framework of elements considered with the possibilities to minimize vulnerabilities and disaster risks throughout a society, to avoid (prevention) or to limit (mitigation and preparedness) the adverse impacts of hazards, within the broad context of sustainable development Disaster Risk Management (DRM) can be described as an array of measures involving public administration, decentralization, organizational and institutional development (or strengthening), community-based strategies, engineering, settlement development and land use planning. It also takes into consideration environmental issues as part of the risk mitigation and reduction strategies

Guidelines for landslide susceptibility, hazard and risk zoning
5
Hyogo framework for action 2005-2015.
Priorities for action: 1. Ensure that disaster risk reduction is a national and a local priority with a strong
institutional basis for implementation; 2. Identify, assess and monitor disaster risks and enhance early warning; 3. Use knowledge, innovation and education to build a culture of safety and resilience
at all levels; 4. Reduce the underlying risk factors; 5. Strengthen disaster preparedness for effective response at all levels.
communities and the local coping strategies were given more attention. The Yokohama conference in 1994 put socio-economic aspects as component of effective disaster prevention into perspective. It was recognized that social factors, such as cultural tradition, religious values, economic standing, and trust in political accountability are essential in the determination of societal vulnerability. In order to reduce societal vulnerability, and therewith decrease the consequences of natural disasters, these factors need to be addressed. The ability to address socio-economic factors requires knowledge and understanding of local conditions, which can – in most cases - only be provided by local actors. From 1990-2000 the International Decade for Natural Disaster Reduction (IDNDR) and now its successor the International Strategy for Disaster Reduction (ISDR) stress the need to move from top-down management of disaster and a cycle that stresses rehabilitation and preparedness, towards a more comprehensive approach that tries to avoid or mitigate the risk before disasters occur and at the same time fosters more awareness, more public commitment, more knowledge sharing and partnerships to implement various risk reduction strategies at all levels (UN-ISDR, 2005). This more positive concept has been referred to as ‘risk management cycle’, or ‘spiral’, in which learning from a disaster can stimulate adaptation and modification in development planning rather than a simple reconstruction of pre-existing social and physical conditions. The ISDR aims at building disaster resilient communities by promoting increased awareness of the importance of disaster reduction as an integral component of sustainable development, with the goal of reducing human, social, economic and environmental losses due to natural hazards and related technological and environmental disasters. The World Conference on Disaster Reduction was held in 2005 in Kobe, Hyogo, Japan, and adopted the present Framework for Action 2005-2015: Building the Resilience of Nations and Communities to Disasters. The main priorities for action are indicated below.

Guidelines for landslide susceptibility, hazard and risk zoning
6
A general strategy for disaster risk reduction must firstly establish the risk management context and criteria, and characterize the potential threats to a community and its environment (hazard); secondly it should analyse the social and physical vulnerability and determine the potential risks from several hazardous scenarios in order to, finally, implement measures to reduce them (see Figure 1.11). The final goal, reduction of disaster risk in the present and control of future disaster risk, should be achieved by combining structural and non-structural measures that foster risk management as an integrating concept and practice which are relevant and implemented during all stages of a community’s development process and not just as a post-disaster response. Disaster risk management requires deep understanding of the root causes and underlying factors that lead to disasters in order to arrive at solutions that are practical, appropriate and sustainable for the community at risk (UN-ISDR, 2005). Evidently, managing risk in this manner requires a consensual and collaborative approach. The UN-ISDR has widely advocated for new ways in which authorities, communities, experts and other stakeholders jointly diagnose problems, decide on plans of action and
Figure 1.1: The “traditional” disaster cycle and the role of risk assessment.

Guidelines for landslide susceptibility, hazard and risk zoning
7
Figure 1.3: Framework on Risk Management, with indication of the various
Term Definition Risk analysis the use of available information to estimate
the risk to individuals or populations, property, or the environment, from hazards. Risk analysis generally contains the following steps: hazard identification, hazard assessment, elements at risk/exposure analysis, vulnerability assessment and risk estimation.
Risk evaluation the stage at which values and judgements enter the decision process, explicitly or implicitly, by including consideration of the importance of the estimated risks and the associated social, environmental, and economic consequences, in order to identify a range of alternatives for managing the risks.
Risk assessment
the process of risk analysis and risks evaluation
Risk control or risk treatment
the process of decision making for managing risks, and the implementation, or enforcement of risk mitigation measures and the re-evaluation of its effectiveness from time to time, using the results of risk assessment as one input.
Risk management
the complete process of risk assessment and risk control (or risk treatment).
Table 11 Definitions for risk management (IUGS, 1997).
implement them. In other words, a new ethic of disaster risk management is emerging, based on ‘informed consent’ as opposed to paternalism. Risk assessment as the starting point for further risk management processes should in turn be a multifaceted activity aimed at integrating the likelihood and potential consequences of an event with subjective interpretations (perceptions) of interacting, heterogeneous actors. Figure 1.23 shows the structure that will be followed in this chapter, and which focuses more on the use of (spatial) risk information, which is also the focus of these guidelines.
Traditionally the process of Disaster Risk Management was presented as a cycle, in which the various phases would follow each other until the next disaster event would happen. It involves several phases: Prevention, Preparedness, Relief /
Response, Recovery and Reconstruction. This cyclic way of presenting Disaster Risk Management has been debated. Others mentioned that all phases receive more or less attention depending on the situation. In a disaster event obviously relief and response would get more attention, and later on prevention would become more dominant (Expand-Contract Model). The various phases are Disaster prevention, preparedness, relief/response, recovery/rehabilitation. Disaster prevention includes: Risk analysis, risk evaluation and effective risk reduction. The formulation and implementation of long-range policies and programmes to
prevent or eliminate the occurrence of disasters or more frequently, to reduce the severe effects of disasters (mitigation strategies);
Establishment of legislation and regulatory measures, principally in the field of physical and urban planning, public works and building e.g. rules on land use planning, rules on building codes, building of special constructions, etc.

Guidelines for landslide susceptibility, hazard and risk zoning
8
Prevention: Activities to provide outright avoidance of the adverse impact of hazards and means to minimize related environmental, technological and biological disasters. Depending on social and technical feasibility and cost/benefit considerations, investing in preventive measures is justified in areas frequently affected by disasters. In the context of public awareness and education, related to disaster risk reduction changing attitudes and behavior contribute to promoting a "culture of prevention". Preparedness: Activities and measures taken in advance to ensure effective response to the impact of hazards, including the issuance of timely and effective early warnings and the temporary evacuation of people and property from threatened locations (UN-ISDR, 2004). Relief /Response: The provision of assistance or intervention during or immediately after a disaster to meet the life preservation and basic subsistence needs of those people affected. It can be of an immediate, short term, or protracted duration. Recovery / Reconstruction: Decisions and actions taken after a disaster with a view to restoring or improving the pre-disaster living conditions of the stricken community, while encouraging and facilitating necessary adjustments to reduce disaster risk.
In essence, disaster prevention consists of the acquisition of basic geographically-registered information on hazards, the vulnerability of the elements at risk and consequent risks analysis and, on the basis of that information, the planning of human activities such as land-use, construction and public/engineering works so as to reduce or eliminate the possibility of damage and destruction.
Disaster preparedness is supported by the necessary legislation and means a readiness to cope with disasters or similar emergencies which cannot be avoided. It includes: forecasting and warning / monitoring, education and training of the population, organization for and management of disasters situations, preparation of operational plans, training of relief groups, stock piling of supplies, earmarking of necessary funds, organization, planning of emergency operations, and communications. The concept of "mitigation" spans the broad spectrum of disaster prevention and preparedness activities. Mitigation is a management strategy that balances current actions and expenditures with potential losses from future hazard occurrences. It means reducing the actual or probable effects of an extreme hazard on man and his environment. Disaster response. The effective delivery of relief from the community level upwards, depends strongly on the adequacy of public awareness and disaster preparedness plans and the effectiveness with which they are carried out. Major components of disaster relief are: assessment of the situation (both the assessment of the extent of the damage as well as that of relief requirements), rescue operation, relief supplies and handling of strategic problems. After the relief phase recovery activities start until all systems return to acceptable, normal or better levels.
Short term recovery activities return vital life-support systems to minimize operation standards;
Long term recovery activities may continue for years until acceptable performance levels are achieved.
Recovery (rehabilitation and reconstruction) affords an opportunity to develop and apply disaster risk reduction measures (UN-ISDR, 2004).

Guidelines for landslide susceptibility, hazard and risk zoning
9
2. DRR related existing and future plans of national, regional and municipal authorities
2.1 National level Medium-Term Strategy of the Government of Georgia (Basic Data and Directions - BDD)
Medium-Term Strategy of the Government of Georgia is one of the most important documents at the national level describing the strategic goals and the vision of the executive power of Georgia. This strategy lists the priorities of the Georgian Government. The Government of Georgia updates its medium-term plan every year on the basis of the strategies and priority directions of the Government of Georgia for the given moment. To achieve the set objectives the executive power determines its priorities and medium-term action plans which are later to be reflected in the State budget. The following priorities in the field of environmental protection have been identified in BDD 2009-2012 1:
Provision of efficient use of resources, which implies: – Continuation of reforms in the forestry sector; – Transition to water resource basin management.
Development of the system of environment protection, which implies: – Reform of waste management system; – Introduction of the clean development mechanism, which implies:
Improvement of environmental monitoring and forecast: – Prevention of hazardous natural processes; – Development of monitoring system with regards to atmospheric pollution.
It is interesting what is meant under prevention of hazardous natural processes. The same document says:
Prevention of hazardous natural processes Justification of the priority:
Poor idea about current natural processes taking place; Insufficient data and information on the condition of environment
regarding hazardous natural dangerous processes; Absence of national plan of preventive measures regarding natural
disasters; Human losses and material damages; Existence of eco-migrants.
The anticipated results are described as follows: Reduction of the scale of natural disasters, meaning:
Reduction of the number of human and material losses; Reduction of the number of eco-migrants; Protected landscapes and ecosystems.
1 BDD of the Government of Georgia for 2009-2012

Guidelines for landslide susceptibility, hazard and risk zoning
10
Assessment criteria: Reduced scales of damages caused by natural disasters, meaning:
Reduced number of human and material losses; Reduced number of eco-migrants.
Anticipated barriers: Lack of distribution of competencies at the interagency level and weak coordination, meaning:
Insufficient knowledge of modern approaches: Low level of public awareness.
It shall be noted that Georgia has not joined the Hyogo Framework for Action, HFA, which has the following priorities:
2.1.1 The Ministries The Ministry of Environment Protection and Natural Resources of Georgia First of all the National Environmental Action Plan (NEAP) which should reflect the priorities of the Ministry for 5 years shall be mentioned. The first such plan was developed in 2000. In this document natural disasters have not been identified as a priority direction. The development of the second document was completed in 2007; however it has not been adopted yet due to unknown reasons. Together with other priorities natural disasters, as a strategic direction was included in the working version of this document. Development of a national plan of natural disaster preventive measures (included in the priorities of the Ministry of Environment Protection and Natural Resources of Georgia for 2009-2012) is important. Several attempts have been made to develop this kind of plan; however it does not exist yet. Among the structures subordinated to the Ministry of Environment Protection and Natural Resources of Georgia the National Environmental Agency is a key body having direct responsibilities in natural disaster management. Every year the National Environmental Agency prepares the report on consequences of geological and natural processes and the prognosis of their development in the coming year for each region. The last report providing description of the disasters occurred in 2009 and the prognosis for 2010 will be published in the end of January. The Ministry of Internal Affairs of Georgia The Emergency Situation Management Department is a structural subsection of the Ministry of Internal Affairs of Georgia. As indicated in the letter of the Ministry of Internal Affairs of Georgia to CENN, the Emergency Situation Management Department within its competence coordinates prevention of emergency situations throughout the country, takes measures for mitigations and eliminating their results, also, the Department provides with implementation of civil defence tasks during martial law. As regards to emergency situations, the Emergency Situation Management Department of the Ministry of Internal Affairs of Georgia acts within its competence and in accordance with its budget. Environmental monitoring and improvement of the forecast system, in particular, creation of a complete picture of hazardous natural processes occurring in the environment and development of a national plan of natural disaster preventive measures is a priority of the Ministry of Environment Protection and Natural Resources of Georgia in 2009-20122.
2 The letter of the Ministry of Internal Affairs of Georgia to CENN.

Guidelines for landslide susceptibility, hazard and risk zoning
11
Thus, the whole process of natural disaster management described in the DRM concept is split among the various agencies of the executive power, which in conditions of weak coordination complicates the process of development of uniform approaches in natural disaster management. The legal aspects of the mentioned issue shall be further studied. The Ministry of Refugees and Settlement of Georgia The above Ministry is responsible for settlement of involuntarily displaced persons, including those displaced as a result of natural disasters). The plans of the Ministry concerning this matter are specified in the letter of Ministry to CENN:
This year purchasing of residential houses for the people affected by natural disasters is planned within the allocated budget3.
However, from the same letter it is evident that the funds allocated from the State budget are not sufficient to fully compensate all needs of the affected people. On the basis of the resolution of the President of Georgia the new ministry of regional development and Infrastructure has been established, the competences, duties and responsibilities of which are still not clear yet. The role to be played by thus ministry in natural disaster management is not clear too.
2.2 Regional, municipal level Regional and municipal authorities consider measures to control hazardous natural processes in their annual plans of activities. Planning of these measures is based mainly on information obtained from the bodies of local self-governance. Due to limited resources only small part of the measures from the list submitted by the bodies of the local self-governance are planned. Usually priority is given to the processes which already are at the culmination stage of their development and may lead to the disaster. Preventive measures are planned rarely. Unfortunately, there is almost no communication with other governmental bodies having responsibilities in management of hazardous natural processes which would allow for planning of a uniform approach to the issue. The Georgian legislation on local self-governance as well as the Georgian environmental legislation entitles the bodies of local self-governance to develop local environmental action programmes, however none of the territorial-administrative units (municipalities) and none of the bodies of local self-government have developed such programme so far
3 The letter of the Ministry of Refugees and Settlement of Georgia to CENN.

Guidelines for landslide susceptibility, hazard and risk zoning
12
2.3 Structures and persons with responsibilities in DRR
2.3.1 The Ministry of Environment Protection and Natural Resources The Ministry is responsible for the state of the environment in the country, as well as for the issues related to management of natural disasters. There are six territorial bodies under the Ministry of Environment Protection and Natural Resources of Georgia. They represent the Ministry Environment Protection and Natural Resources in respective administrative units. The Ministry has the regional department represented by territorial bodies. The regional departments of the Ministry of Environment Protection and Natural Resources of Georgia are entitled to:
prevent emergency ecological situations and develop measures for elimination of negative consequences;
state control on primary registration of water resources and their use; participate in the process of allocation and management of land, changing their
status and changing forest categories; organize public environmental education; maintain relations with environmental organizations and the whole environmental
community; coordinate and participate in activities directed to repopulation of endemic, rare
and endangered species of Georgian flora and fauna; participate in development of proposals on creation of protected areas and
hunting farms. Legal person of the public law: National Environmental Agency – subordinated body to the Ministry of Environment and Natural resources The following structures are under the National Environmental Agency:
Department of Hydrometeorology Department of Environmental Pollution Monitoring Department of Geological Hazards and Geological Environment Management Department of Coast Protection Department of Spatial Information
The Special Geologic Service of Georgia (at present a structural unit of the National Environmental Agency) has been studying the patterns of development of hazardous geological processes on the whole territory of the country, mapping their spatial distribution, developing the lists of the threats posed to settlements, agricultural lands and engineering structures, preparing special geodynamic baseline maps and the maps of the anthropogenic change of the geological environment of various contents and scales and planning short and long-term management measures during decades. In particular, the main results of undertaken works include:
The map of the engineering-geological state of the development of hazardous geological processes on the territory of Georgia, 1:200000 (published);
Mapping of the level of damage from landslides and mudflows and zoning of the risks of their development on the territory of Georgia , 1:500000 (published);
Special engineering-geological survey and mapping of the whole territory of Georgia at 1:50000 and 1:25000;
Special engineering-geological survey of the Black Sea coastal regions of Georgia at 1:50000 and 1:25000 on the basis of which the regional scheme of integrated management of the coastal zone and coastal protection have been developed;
Development of the large-scale (1:10000) special engineering-melioration maps of protection of agricultural maps as a basis for zoning the threats posed to lands

Guidelines for landslide susceptibility, hazard and risk zoning
13
from natural processes and implementation of measures for their protection-rehabilitation and land use planning. The surveys have been carried out for 23 administrative districts covering 800 thousand ha. The materials have been transferred to the Ministry of Agriculture;
Special surveys have been carried out in the settlements and strategic engineering facilities located within the high landslide and mudflow risk zone and relevant recommendations have been developed. Protective and preventive measures have been implemented at more than 200 locations;
A monographic study – Erosion control general scheme of the territory of Georgia for 1981-2000 has been developed and published. The paper describes all types of geological processes occurring in Georgia, main factors of their development, risk zoning of the territory, measures to be undertaken and their costs;
Long-term prognosis of landslides, mudflows and coast washing in Georgia for 1981-20004.
(The majority of all these activities have been implemented during the Soviet period, therefore almost all data provided in relevant documents is outdated. However it does not mean that they are useless, since any kind of survey implies study of the processes in the historical perspective. Therefore, when such basis is available, recommencement of this type of activities becomes easier. In this regard, the results of the abovementioned activities are a unique resource which will be extremely helpful if used adequately). On the basis of the analysis of the existing information and its generalization “The Erosion Control General Scheme of the Territory of Georgia” developed for 1981 shall be worked up and the basic long-term prognosis of the trends of development of hazardous geological processes and anthropogenic change of the geologic environment for 25-30 year period with relevant special forecasting maps. Non-existence of such basic forecasting maps complicated the process of timely identification of the time and place of reactivation of geological processes and adjustment of a short-term forecast. This has been proved during the analysis the picture of development of the extreme processes in 2003-2005.
2.3.2 The Emergency Situation Management Department of the Ministry of Internal Affairs of Georgia With regard to management of hazardous natural processes the functions of the Emergency Situation Management Department is as follows: coordination of prevention of emergency situations throughout the country, taking measures for mitigations and eliminating their results and implementation of fire safety measures. The functions of the Emergency Situation Management Department in natural disaster management are specified in the Law of Georgia on Protection of Population and Territories from Natural and Technogenic Disasters.
2.4 Suggested Management of Natural Disasters under the Conditions of the Existing Legislation In this section the best option of management of natural disasters in conditions of the existing situation and competences will be discussed. Only specific aspects of natural disaster prevention and elimination of their negative consequences will be reviewed. 4 The report of the Head of the Department of Geological Hazards and Geological Environment Management – Hazardous natural processes in Georgia and the problems of their management 2007-08.

Guidelines for landslide susceptibility, hazard and risk zoning
14
Since emergency response is within the competence primarily of the Ministry of Internal Affairs this issue will not be discussed at this stage. Below are given some cases which often serve as a basis for development of a problem of hazardous natural processes for the bodies of local self-governance. Issuance of licenses on use of natural resources In this regards the situation is as follows: a person interested in obtaining the license submits the application on his/wish on use of a specific object to the Ministry of Economic Development and pays duties5. The Ministry of Economic Development sends relevant information to the National Environmental Agency. The National Environmental Agency shall make a relevant conclusion on possibility of using this specific object without causing damage to the environment. In case of a positive conclusion the Ministry of Economic Development announces an auction and sells the license on use of this specific object. When making conclusions the National Environmental Agency relies on its own resources. The Agency implements field studies or uses already existing information. At this stage there is no communication between the Agency and local authorities. Therefore, in a number of cases the issuance of a license leads to development of negative natural processes. The planning process of natural disaster prevention/mitigation or elimination of consequences At best the bodies of local self-governance inform the National Environmental Agency on the existing situation in case of development of a hazardous natural process or the risk of a disaster. The National Environmental Agency visits the indicated territory and assesses the situation. On the basis of the conclusion the Agency develops relevant recommendations and the list of required actions the implementation of which is a prerogative of the bodies of local self-governance. Baseline studies The problem of nonexistence of baseline studies is worth mentioning. Due to limited funding the National Environmental Agency carries out irregular geomonitoring surveys only in the especially hazardous and ecologically stressed urban areas. The high mountainous regions where catastrophic landslides, mudflows, avalanches affecting the settlements often occur are not under observation. It is obvious that in such conditions one of the most important components of natural disaster management - pre-disaster management, implying observation on the development of a process, risk assessment, prevention, mitigation and preparedness is almost excluded.
5 The legal aspects of payment of duties is regulated by the Law of Georgia on Duties on Natural Resource Use
Guidelines for landslide susceptibility, hazard and risk zoning
15
3. Flood Hazard assessment Introduction A hazard is defined as a “potentially damaging physical event, phenomenon or human activity that may cause the loss of life, or injury, property damage, social and economic disruption, or environmental degradation” (UN-ISDR, 2010). In these guidelines, we deal with two types of natural hazards, floods and landslides. Both qualify as physical events, but they may be triggered by human activity, or other phenomena. Hazard assessment implies the determination of the magnitude and frequency of the hazards, and includes its spatial delineation. Hazards are described by six characteristics: Triggering factors; athmospheric factors that cause the hazard. Spatial occurrence; the location and dimension of the affected area. Duration of the event; time span between the start and end of the event. Time of onset; time span between the first precursor of the event and the peak
intensity. Frequency; repetition rate, which equals one over the temporal probability of the
event in a given period of time. Magnitude; refers to the size of the hazard (discharge of the river, surface area
affected by the landslide) The primary hazard may lead to secondary events that subsequently lead to more casualties and damage. Examples incluse landslides that block a river leading to flooding, or a prolonged flood that leads to lack of drinking water and subsequent illnesses. These secondary effects will not be dealt with in these guidelines. Since November 2007 the European flood directive (EU, 2007) has been adopted by the European Union, which requires the following:
1. preliminary flood risk assessment 2. flood hazard maps and flood risk maps 3. flood risk management plans
These guidelines comply with the flood directive, but are not limited to flood risk only and pay more attention to spatial planning. The preliminary flood risk assessment and the flood hazard maps are dealt with in section 3.2, flood risk maps in chapter 4, and management plans in chapter 5. The main task during the flood hazard assessment comprises the determination of the area that is inundated during flood events with different return periods. Flood hazard is determined by the flood extent and depth, flow velocity and the duration of the flood. In areas with low data availability, flood inundation models are the main tool to determine the flood prone area. The FLOODsite project of the EU has carried out detailed studies into many aspects of the flood hazard assessment and flood risk management e.g. (Asselman et al., 2009; Borga, 2009; Klijn et al., 2009). All reports are available online at www.floodsite.net/html/publications.asp.
3.1.1 Main types and causes Four main types of flooding are distinguished: flash floods, alluvial floods, coastal floods, and pluvial floods. Coastal flooding, due to high water levels at sea and pluvial flood, due to high intensity rainfall that exceeds the capacity of the sewer system are not discussed here. Flash floods and alluvial floods are both triggered by heavy, or prolonged rainfall.
Flash floods result from a rapid hydrological response with a time of onset varying between one hour to a few hours. The size of the catchment is typically a few hundred square kilometers. The speed of the response results from overland

Guidelines for landslide susceptibility, hazard and risk zoning
16
flow due to steep slopes and low infiltration capacity, or saturation of the soils. Infiltration capacity may be altered by human activities such as deforestation, ploughing, or forest fires. Flash floods occur on the narrow valley floors of mountainous areas. The main problem with flash floods is the prediction of the event. Due to the local scale of the event and the spatial variability of the rainfall, prediction of flash flooding is still limited. Most effort are focussed on the accurate prediction of rainfall with either a dense network of rain gauges, or by using rain radar (Borga 2009). The aim is to lengthen the time of onset to the time it takes for the population to take action, the social response time.
Alluvial floods occur on lowland rivers and in deltaic regions. Triggered by
prolonged and extensive rainfall, rivers overtop their natural or man made levees and inundate the floodplains. These lowland floodplains are often the preferred building location and much economic value has amassed here. The time of onset is more than a day, and the prediction of water levels can be fairly accurate using a series of gauging stations. An alluvial flood may last for a week, but inundated areas may drain very slowly extending the duration of the flood to weeks. The magnitude-frequency relationship has to be established for each river basin separately.
Coastal floods
Dam break floods and sudden inundation of floodplains due to the failure of
embankments are devastating events that are very difficult to predict, have short times of onset, and a lot of energy. For dam break floods little, or no calibration data will be available to model these events, and the outcome of the models should be seen as scenario studies. Floods due to failing embankments have happened many times in the past and generally 2D flood models are used to model these events.
3.1.2 Data requirements related to different scales and approaches Flood hazard assessment should be carried out at different scales. At the national-regional scale, a preliminary flood hazard assessment should be carried out. At this scale hazard maps give an overview of the flood prone areas and provide information for the allocation of resources. Using a medium scale Digital Elevation Model (DEM), and a morphometric interpretation of the area, or a simple rainfall runoff model should be carried out to determine the flood hazard. At the district, or municipal scale a flood inundation model should be applied. Such a model is more data demanding, but will return the flood hazard in a quantitative way.
3.1.3 History and frequency of historical events One of the most important indicators for future floods are the recorded historic floods. Following the EU flood directive the historic overview should include:
a description of the significant floods which have occurred in the past, where significant adverse consequences of similar future events might be envisaged;
a description of the floods which have occurred in the past and which had significant adverse impacts on human health, the environment, cultural heritage and economic activity and for which the likelihood of similar future events is still relevant, including their flood extent and conveyance routes and an assessment of the adverse impacts they have entailed;
These events should be stored in a database. Records in this database serve both the hazard assessment at the national and regional scale to determine the frequency of flooding, as well as on the district level for flash floods. Recorded flash floods should be related to recorded rain measurements to determine the rainfall thresholds.

Guidelines for landslide susceptibility, hazard and risk zoning
17
3.1.4 Hazard assessment at a National/Regional scale: To get an overview of the flood hazard at the national scale, several steps need to be taken: Firstly, digital maps should be developed at a scale of 1:500 000: 1. Base data to familiarize with the area, containing:
river basins, including subbasins river channels topography land use major dams river gauging stations hydrometeorological stations
2. Rain data: Yearly average rain data Rainfall variability
3. Overview of major historic flood events, linked to section 3.2.3 Flash floods, ranked by severity in terms of damage, or casualties Alluvial floods, ranked by severity in terms of damage, or casualties
Secondly, a semi-quantitative analysis should be carried out. No off the shelve tools are available to be implemented however. Different options can be tested, the final option can be explained in more detail in the final guidelines and applied to the whole country. Option 1: GIS analysis of areas with a high risk of flooding, based on catchment shape, proximity to the river, valley shape Option 2: Estimation of rainfall thresholds (Carpenter et al., 1999) per catchment, determining the rainfall that will create a flash flood for that catchment. To be validated with historic events, and or rating curves Option 3: Setting up a simplified rainfall runoff model using the kinematic wave approximation of the flood wave (De Roo et al., 1996; De Roo and Jetten, 1999). Different rain fall patterns could be tested for the effect of the hydrograph. Option 4: Using the time series of the Delft-FEWS system, currently installed at NEA to link that discharge prediction to known flash floods. Options 2 till 4 will give a prediction of the hazardous discharge. The discharge, combined with a morphometric characterisation of the channel could be used to qualitatively assess the severity of the area for flash floods. Alluvial floods may be determined by the overall geomorphology of the area (lowland rivers, floodplains and deltas)
3.1.5 Hazard assessment at District/Municipal scale. Hazard assessment based on flood modeling leading to a probabilistic hazard for specific areas at municipal scale. The modelling should be carried out using a 1D, or 2D hydrodynamic model. Asselman et al. (2009) give background information on the appropriate application of hydrodynamic models. The advantage of these models is the ability to predict water depth, flow velocity, flood extent over the whole area under study. These are the prerequisites for a quantitave risk assessment. However, this approach requires detailed and accurate digital data. The spatial data should be made available in a GIS format. Inundation models need to be parameterized properly, calibrated, and validated, and no one of a kind guideline should be given on which model to apply and how to parameterise it. For alluvial floods the following data are required: Geographical data:

Guidelines for landslide susceptibility, hazard and risk zoning
18
Accurate digital terrain model, especially for lowland rivers, small ridges can make a big difference in terms of speed of inundation and flood extent. Preferably based on airborne laser scanning, or photogrammetry.
Bathymetry of the main channel and embanked floodplains of the river as cross sections.
Location of linear elements, such as embankments, raised roads, or railroads that block the flow of water.
Landcover and vegetation characteristics for the parameterization of hydrodynamic roughness.
Outline of river basins and subbasins. Hydrometeorological data
Locations of meteorological stations, including a list of parameters that are measured.
Locations of water gauging stations, including a parameter list. Stage-discharge relationships for each gauging station, including the cross section
between the top of the embankments. Magnitude-frequency relationship for gauging stations based on all available
discharge data. Parameters of hydraulic structures, such as weirs, bridges, culverts, or reservoirs. Grain size distribution or textural class of the main channel per river reach. For calibration of the model on historic floods: flood extent and flood depth.
Historic data Time series of water levels and discharge for all gauging stations. Precipitation data List of historic floods per river basin that had a significant adverse impact on
human health, the environment, cultural heritage, or economic activity. These events should still be relevant in the current situation.
Using the available discharge data, the magnitude-frequency relationship should be established. For floods with increasing return periods the inundation model will give the inundation extent, flood depth and flow velocity that is required in the risk assessmentt. For flash floods, the main operational concern is to provide enough warning time to enable a successful social response. Setting up an inundation model is generally not carried out due to the high costs involved for modelling, the large river bed level changes, and the small spatial extent of the flash flood as it is bounded by the valley walls. To determine the return period of the flooding event, the return period of the rainstorm that caused the flash flood is usually computed based on measured rainfall. These relations are often weak due to the high spatial variation of rainfall in mountainous areas. The flood extent should be carefully mapped in the field after a flash flood. People often vividly remember the extent of the flood and of recent floods recordings might be available to map the flood extent after the event. High water marks can also be mapped using a low cost GPS.
3.1.6 Selection of optimal approaches in Georgian context. This section needs to be filled in after evaluation of the case studies that we are currently carrying out. Options include:
1D2D flood modeling using Sobek Flood extent mapping using the ‘flood mapping utility’ in Delft FEWS. Measured
cross sections are required to convert discharge to flood extent Field survey of flood extents mountainous areas Database of flood events per river basin/river reach.

Guidelines for landslide susceptibility, hazard and risk zoning
19
Estimation of rainfall thresholds
4. Landslide hazard assessment
4.1 Introduction The goal of this document is to recommend methodologies for the quantitative assessment and zoning of landslide susceptibility, hazard and risk at different scales (site specific, local, regional and national). Quantitative Risks Assessment (QRA) provides a rational basis to conceptualize landslide risk, to develop risk acceptability criteria, to perform cost-benefit analyses, and to evaluate different landslide risk management and mitigation alternatives in order to reduce existing risk to acceptable levels (Fell et al. 2008). Quantitative Risk Assessment (QRA) of landslides is important for the stakeholders involved for different reasons: To scientists and engineers because risk is quantified in an objective and reproducible way and the results can be compared from one region to other. Furthermore it helps to the identification of the challenges in the required input data and the weaknesses of the analyses used. To the landslide risk managers because it allows the performance of a cost-benefit analysis, it provides the basis for prioritizing mitigation actions and the allocation of resources. To the citizens in general because QRA is a tool that helps for increasing the awararenes on the existing risk levels and for evaluating the efficiency of the actions undertaken, For QRA, a higher degree of geological and geomechanical input data and high DEM quality are usually necessary to evaluate a range of possible scenarios, design events and return periods. As stated by Lee and Jones (2004), the probability of landsliding and the value of adverse consequences are only estimates. Due to the limitation of available information, the use of numbers may conceal that the potential for error is great. In that respect, QRA is not necessarily more “precise” than the alternative (Hungr et al. 2008). It facilitates however, clear and unambiguous communication of judgement between geoscience professionals and land owners and decision makers. The classical expression for calculating landslide risk (R) is that proposed by Varnes (1984):
R= Hx(ExV) Where: H is Landslide Hazard, E the Exposed elements, and V their Vulnerability In reality, the components of Risk such as H and E have to be disaggregated and each considered separately, which is the reason why risk assessment is so complex. Generally, for large areas where the quality and quantity of available data are too scarce for quantitative analysis, a qualitative risk assessment may be more applicable; while for site-specific slopes that are amenable to conventional limit equilibrium analysis, a detailed quantitative risk assessment should be carried out (Dai et al. 2002). As illustrated in there are three important components in risk analysis: hazards, vulnerability and elements-at-risk (Van Westen et al., 2008). They are characterized by both spatial and non-spatial attributes. Hazards are characterized by their temporal probability and intensity derived from frequency magnitude analysis. Intensity expresses the severity of the hazard. The hazard component in the equation actually refers to the probability of occurrence of a hazardous phenomenon with a given intensity within a specified period of time (e.g. annual

Guidelines for landslide susceptibility, hazard and risk zoning
20
probability). Hazards also have an important spatial component, both related to the initiation of the hazard and the spreading of the hazardous phenomena (e.g. the areas affected by volcanic products such as lava flows) (Van Westen, 2009).
Figure 3.1 Components of the risk analysis Elements-at-risk are the population, properties, economic activities, including public services, or any other defined values exposed to hazards in a given area (UN-ISDR, 2004). They are also referred to as “assets”. Elements-at-risk also have spatial and non-spatial characteristics. There are many different types of elements-at-risk and they can be classified in various ways. The way in which the amunt of elements-at-risk is characterized (e.g. as number of buildings, number of people, economic value or the area of qualitative classes of importance) also defines the way in which the risk is presented. The interaction of elements-at-risk and hazard defines the exposure and the vulnerability of the elements-at-risk. Exposure indicates the degree to which the elements-at-risk are actually located in the path of a particular hazardous event. The spatial interaction between the elements-at-risk and the hazard footprints are depicted in a GIS by map overlaying of the hazard map with the elements-at-risk map (Van Westen, 2009). Vulnerability refers to the conditions determined by physical, social, economic and environmental factors or processes, which increase the susceptibility of a community to the impact of hazards (UN-ISDR, 2004). The vulnerability of communities and households can be based on a number of criteria, such as age, gender, source of income etc. which are analyzed using a more qualitative approach involving the use of indicators rather than following the equation as indicated in Figure 1.1. Physical vulnerability is evaluated as the interaction between the intensity of the hazard and the type of element-at-risk, making use of so-called vulnerability curves (See chapter 8.1). For further explanations on hazard and risk assessment the reader is referred to textbooks such as Alexander (1993), Okuyama and Chang (2004), Glade, Anderson, and Crozier (2005), Smith and Petley (2008) and Alcantara-Ayala and Goudie (2010).

Guidelines for landslide susceptibility, hazard and risk zoning
21
4.2 QRA framework The general framework of this deliverable is based on the Guidelines for Landslide Susceptibility, Hazard and Risk Zoning prepared by the JTC-1 on Landslides and Engineered Slopes (Fell et al. 2008) and on the Disaster Risk Management (DRM) approach promoted by the United Nations through the International Strategy for Disaster Reduction – ISDR (Figure 3.2) . The overall framework of risk management involves the complete process of risk assessment and risk control (or risk treatment). Risk assessment includes the process of risk analysis and risk evaluation. Risk analysis uses available information to estimate the risk to individuals, population, property, or the environment, from hazards. Risk analyses generally contain the following steps: hazard identification, hazard assessment, inventory of elements at risk and exposure, vulnerability assessment and risk estimation. Since all these steps have an important spatial component, risk assessment often requires the management of a set of spatial data, and the use of Geographic Information Systems. Risk evaluation is the stage at which values and judgements enter the decision process, explicitly or implicitly, by including consideration of the importance of the estimated risks and the associated social, environmental, and economic consequences, in order to identify a range of alternatives for managing the risks
Figure 3.2 Landslide hazard and risk assessment and management framework
Landslide hazard assessment requires a multi-hazard approach as different types of landslides may occur, each with different characteristics and causal factors, and with different spatial, temporal and size probabilities. Also landslides hazards often occur in conjunction with other

Guidelines for landslide susceptibility, hazard and risk zoning
22
types of hazards (e.g. flooding, or earthquakes). Figure 3.2 based on Van Westen et al (2005) gives the framework of multi-hazard landslide risk assessment with an indication of the various components (A to H). The first component (A) deals with the input data required for a multi-hazard risk assessment, focusing on the data needed to generate susceptibility maps for initiation and runout, triggering factors, multi-temporal inventories and elements at risk. The input maps will be discussed in the next section. The second session (B) focuses on susceptibility assessment, and is divided into two components. The first susceptibility component is the most frequently used, and deals with the modelling of potential initiation areas (initiation susceptibility), which can make use of a variety of different methods (inventory based, heuristic, statistical, deterministic), which will be discussed later in this document. The resulting maps will then form the input as source areas in the modelling of potential run-out areas (runout susceptibility). The third section (C) deals with landslide hazard assessment, which heavily depends on the availability of so called event-based landslide inventories, which are inventories of landslides caused by the same triggering event. Only by linking landslide distributions to the temporal probability of the triggering event, it is possible to carry out a magnitude frequency analysis. Event-based landslide inventories in adition to other factors are also used to determine the spatial probability of landslide initiation and runout, and to determine the size probability of potential landslides for a given return period. The fourth section (D) focuses on vulnerability assessment and indicates the various types of vulnerability and approaches that can be used. The focus is on the use of expert opinion in defining vulnerability classes, and the application of available vulnerability curves or vulnerability matrices. Most of the focus is on determining physical vulnerability of elements at risk. Other types of vulnerability (e.g. social, environmental, and economic) are mostly analyzed using a Spatial Multi-Criteria Evaluation, as part of a qualitative risk assessment (G). Section E gives the concept of risk assessment which integrates the hazard, vulnerability and both nature and amount of elements at risk (either as the number of people, number of buildings, or economic value). The specific risk is calculated for many different situations, related to landslide type, volume, return period of the triggering event, and type of element at risk. The integration of Section F present the quantitative risk approach in which the results are shown in risk curves plotting the expected losses against the probability of occurrence for each landslide type individually, and expressing also the uncertainty based on the uncertainties of the input components in the risk analysis. This could be done by generating two loss curves expressing the minimum and maximum losses for each return period of triggering events, or associated annual probability. The individual risks curves can be integrated into total risk curves for a particular area and the population loss can be expressed as F-N curves. The risk curves can be made for different basic units, e.g. administrative units such as individual slopes, road sections, census tracts, settlements, municipalities, regions or provinces. Section G deals with methods for qualitative risk assessment, which are mostly based on integrating a hazard index, and a vulnerability index, using Spatial Multi Criteria Evaluation. The last session (H) deals with the use of risk information in various stages of Disaster Risk Management.

Guidelines for landslide susceptibility, hazard and risk zoning
23
Figure 3.3 Framework of multi-hazard landslide risk assessment (based on Van Westen et al. 2005)
Landslide are caused by a range of causal and triggering factors (e.g. volcanic eruptions, earthquakes, meteorological extremes, and anthropogenic activites) and are also causing secondary hazards (e.g. tsunamis, seizes or dam break floods). This is illustrated in Figure .

Guidelines for landslide susceptibility, hazard and risk zoning
24
Therefore landslide risk assessment should take into account the different landslide types, their interrelations, and the secondary hazards caused by them.
Figure 3.4 Causal factors, interrelationships and secondary hazards related to
landslides
4.3 Landslide zoning at different scales Landslide zoning is the division of land into homogeneous areas or domains and their ranking according to degrees of actual or potential landslide susceptibility, hazard or risk. The first formal applications of landslide zoning, based on qualitative approaches, date back to the 1970’s (e.g. Brabb et al., 1972; Humbert, 1972; Humbert, 1977; Antoine, 1978; Kienholz, 1978; Nilsen et al.,1979) while quantitative methods have been developed in the 1980’s (Brand, 1988) and particularly in the 1990’s for the risk management of an individual slope (Wong et al., 1997; Hardingham et al., 1998) or a large number of slopes (Wong and Ho, 1998). These developments are well described by Ho et al. (2000) and Wong (2005). Further significant developments of landslide zoning has been recorded during the last decade, as it is highlighted by the Guidelines developed by the Australian Geomechanics Society (AGS, 2000; AGS, 2007), the analysis of questions related to the scales of work (Cascini et al., 2005), the approaches adopted and the development trends in risk assessment practice from site-specific (Wong, 2005) to global (Nadim et al. 2006, 2009; Hong et al. 2007) scale, and the “Guidelines for landslide susceptibility, hazard and risk zoning for land use planning” (Fell et al., 2008a).
4.3.1 Purpose of landslide zoning maps Landslide zoning may be developed by preparing different maps that, according to the type of zoning, can be distinguished among
Landslide inventory map may be used for susceptibility zoning and/or as information for policy makers and the general public;

Guidelines for landslide susceptibility, hazard and risk zoning
25
Landslide susceptibility zoning map may be used to prepare the hazard map and/or, in combination with elements at landslide risk within the susceptible area, as information for policy makers and the general public. It may be also used as advisory where the available records of incident data allows the assessment of the societal risk (e.g., in terms of F-N curves) within the susceptible areas threatened by rapid to extremely rapid landslides (Cruden and Varnes, 1996);
Landslide hazard zoning map can be used as information, advisory or statutory to control the development of threatened areas, representing the most efficient and economic way to reduce future damage and loss of life. Such maps also provide the appropriate element of decision for considering the feasibility of the development with or without any stabilisation or protective countermeasures (Cascini et al., 2005);
Elements at risk map is used to prepare the consequence scenarios map and, in combination with the landslide susceptibility zoning map, may be used as information and advisory for policy makers and general public;
Consequence scenario map may be used as information and advisory showing the areas that require QRA. Using quantitative procedures, this map provides for each element the consequence scenario related to its vulnerability and a given landslide hazard; in such a case, it may be used as information, advisory and statutory.
Landslide risk zoning map may be used as statutory and allow the implementation of alert system aimed at protecting the human life. In addition, QRA provides a global view of the expected annual damage for the elements at risk due to the landslide hazard. It can be used as statutory and design and, on the basis of cost-benefit analysis, either control or stabilization works can be identified and designed for landslide risk mitigation.
Considering that the purpose of zoning may be pursued at different levels and scales, using different input data and procedures, suggestions and recommendations are necessary in order to make useful landslide zoning maps that must be prepared at an appropriate scale to get the information needed at that scale.
4.3.2 Landslide zoning levels The scientific literature suggests a large number of methods for landslide inventory, susceptibility and hazard zoning (Atkinson and Massari, 1998; Evans and King, 1998; Baeza and Corominas 2001; Dai and Lee, 2002; Donati and Turrini 2002; Cascini et al., 2005; Cascini, 2008), while only few approaches are devoted to elements at landslide risk and landslide consequence scenario zoning (van Westen, 2004; van Westen et al., 2008; Bonnard et al., 2004; Remondo et al. 2005, Kaynia et al., 2008). Referring to the landslide analysis, all the available methods can be essentially placed in well defined categories that perform qualitative or quantitative landslide modelling and can be defined as knowledge-driven/heuristic, data-driven/statistical or deterministic/probabilistic (Soeters and van Westen, 1996 and Fell et al., 2008b). Considering the quality of the input data and the complexity of the analyses performed as well as the mapping resolution, landslide zoning can be performed at a given level (preliminary, intermediate, advanced).

Guidelines for landslide susceptibility, hazard and risk zoning
26
The preliminary level of zoning is associated to methods for which susceptibility, hazard and risk are assessed based on heuristic procedures (or expert judgement). Mapping of the landslides and their geomorphologic setting are the main input data. The intermediate level of zoning is usually based on the results of data treatment techniques and empirical relations which outputs are confronted to the occurrence of landslide events. Usually, the laws governing the instability phenomenon are not directly considered. It requires significant amount of input data, most of them collected from images and DEM. The advanced level of zoning is usually carried out with the help of physically based models to calculate quantitatively parameters such as probability of failure, run-out distance or landslide velocity and allow the analysis of risk scenarios. It requires high quality input data and the results can be presented in large scale maps.
4.3.3 Landslide zoning map scales The current practice in Europe (Corominas and Mavrouli, 2010) shows that the scale of the landslide zoning maps – required by State or local Authorities – varies significantly from Country to Country depending on the coverage, the information provided, and the methodology that is used. In general, some common input data are used for all cases, i.e. geologic, geomorphologic and soil cover maps. The techniques to obtain input data for the landslide inventory and susceptibility maps vary in a wide range, resulting in various levels of quality and quantity of data. On the other hand, hazard and risk assessment is quantitative or qualitative, according to the use of: i) analytical procedures supported by computer simulation; ii) weighted indicators, expert judgment and field survey; iii) combination of the above two procedures. On the basis of the current practice and considering that landslide zoning may be also requested by land developers or those developing major infrastructures (such as highways and railways), Table 3.1 summarizes the most common mapping scales and types of landslide zoning that can be developed at different levels based on their application. In particular, at national zoning scale (< 1:100,000) knowledge-driven/heuristic methods are suggested for a preliminary level landslide and susceptibility zoning even though risk zoning is also feasible at this scale (Castellanos et al. 2007; Malet et al. 2009). At regional zoning scale (1:100,000 to 1:25,000) more advanced zoning level may be pursued; statistical analysis are recommended only when an appropriate dataset is available (Fell et al., 2008b). If pursued a qualitative risk assessment is recommended. At local zoning map scale (1:25,000 to 1:5,000) all the zoning levels may be developed for qualitative/quantitative risk assessment. Particularly, the use of statistical analysis and deterministic approaches is encouraged for quantitative risk assessment once a high quality of all the necessary input data is guaranteed. At site-specific zoning map scale (> 1:5,000), only an advanced zoning level for QRA is suggested. This needs the most complete dataset in order to properly enhance the worthiness of the deterministic approaches. Independently from the selected approach and the level of zoning, the landslide inventory and the elements at risk are the basis for all the mapping, and it is important that these activities be done thoroughly. With this aim, the landslide inventory and the elements at risk should be mapped at a larger scale than the other zoning maps. It is worth noting that, as it concerns land use planning and development (i.e., statutory purposes), the hazard and risk maps, need the appropriate level of zoning; otherwise, delivering building permits, expropriation and compensating measures may be affected by

Guidelines for landslide susceptibility, hazard and risk zoning
27
errors and an eventual controversy cannot be adequately supported. This can be avoided accurately defining the zoning boundaries at local and site-specific zoning scale. Similar details are necessary to design the risk mitigation measures; particularly warning systems and urban emergency planes need to be defined at local scale, while the site-specific scale is the only one for the design of control and stabilization works. At national and regional scales less detailed zoning maps are necessary for information and advisory purposes as well as for mapping the area that need a more advanced zoning level. These scales may be also profitable used to individuate and plan warning systems in charge of central Authorities.
Table 3.1 Landslide mapping scales, types of landslide zoning and examples of zoning application
Scale description
Indicative range of scale
Typical area of zoning
Types of landslide zoning
Examples of zoning application
National < 1:100,000 > 10,000 km2 Inventory mapping, susceptibility zoning of geological contexts
Landslide inventory and susceptibility to inform policy makers and the general public.
Regional 1:100,000 to 1:25,000
1000 ÷ 10,000 km2
Inventory mapping, susceptibility and hazard zoning referring to local areas
Landslide inventory and susceptibility zoning for regional development; or very large scale engineering projects. Preliminary level hazard mapping for local areas
Local 1:25,000 to 1:5,000
10 ÷ 1000 km2
Hazard and risk zoning referring to single landslides (from qualitative to quantitative)
Landslide inventory, susceptibility and hazard zoning for local areas. Intermediate to advanced level hazard zoning for regional development. Preliminary to advanced level risk zoning for local areas and the advanced stages of planning for large engineering structures, roads and railways.
Site-specific > 1:5,000
Several hectares to tens of square kilometres
QRA for individual slopes or singular locations
Intermediate and advanced level hazard and risk zoning for local and site specific areas and for the design phase of large engineering structures, roads and railways

Guidelines for landslide susceptibility, hazard and risk zoning
28
Table 3.2 Recommended types of zoning and zoning map scales related to landslide zoning purpose (modified/adapted from Fell et al., 2008a)
Purpose Type of zoning Zoning level
Applicable zoning map scale
Inventory
Susceptibility
Hazard Elements at risk
Consequences
Risk
Preliminary
Intermediate
Advanced
National and Regional zoning
Information X X X X
1:250,000 to 1:25,000
Advisory X X (X) (X) (X) (X) X (X)
Statutory
Not recommended
Local zoning
Information X X X X (X) (X) X (X) 1:25,000 to 1:5,000
Advisory (X) X X X X X X X X
Statutory (X) X (X) (X) (X) X X
Site-specific zoning
Information
Not recommended
1:5,000 to 1:1,000 Advisory
Not commonly used
Statutory (X) X X X X X X Design (X) (X) X X X (X) X Notes: X= applicable; (X) = may be applicable.
4.3.4 References Alcantara-Ayala, I., Goudie, A.S. (2010) Geomorphological Hazards and Disaster Prevention. Cambridge
University Press. Cambridge. 291 pp Alexander, D. (1993). Natural disasters. UCL Press Ltd., University College, London. Dai, F.C., Lee, C.F., Ngai, Y.Y., 2002. Landslide risk assessment and management: an overview. Engineering
Geology, 64: 65-87

Guidelines for landslide susceptibility, hazard and risk zoning
29
Fell, R., Corominas, J., Bonnard, C., Cascini, L., Leroi, E., Savage, W.Z., (2008). Guidelines for landslide susceptibility, hazard and risk zoning for land use planning. Engineering Geology, 102, 85-98
Glade, T., Anderson, M., Crozier, M.J., (2005). Landslide Hazard and Risk. John Wiley & Sons, Ltd., Chichester, England, 802 pp
Hungr, O., McDougall S., Wise M., Cullen, M. 2008. Magnitude–frequency relationships of debris flows and debris avalanches in relation to slope relief. Geomorphology 96: 355–365
IUGS Working Group on Landslides, Committee on Risk Assessment, 1997. Quantitative risk assessment for slopes and landslides – the state of the art. In D. Cruden & R. Fell (editors). Landslide risk assessment. A.A. Balkema, Rotterdam. pp. 3-12
Lee, E.M., Jones, K.C. 2004. Landslide Risk Assessment. London:Thomas Telford Books Okuyama, Y., Chang, S.E. (eds) (2004). Modeling spatial and economic impacts of disasters. Springer,
Advances in spatial science. 329 pp Smith, K., Petley, D.N. (2008). Environmental hazards. Assessing risk and reducing disaster. Taylor & Francis,
London. UN-ISDR, 2004. Terminology of disaster risk reduction. United Nationas, International Strategy for Disaster
Reduction, Geneva, Switzerland http://www.unisdr.org/eng/library/lib-terminology-eng%20home.htm Van Westen, C.J., Castellanos Abella, E.A., Sekhar, L.K. (2008) Spatial data for landslide susceptibility,
hazards and vulnerability assessment : an overview. In: Engineering geology, 102 (3-4), 112-131 Van Westen, C.J., Van Asch, T.W.J., Soeters, R., 2005. Landslide hazard and risk zonation; why is it still so
difficult? Bulletin of Engineering geology and the Environment 65 (2), 167-184 Van Westen, C.J. (ed) (2009). Distance Education course on the use of spatial information in Multi-hazard risk
assessment. http://www.itc.nl/Pub/study/Courses/C11-AES-DE-01 Varnes, D.J. 1984. Landslide hazard zonation: a review of principles and practice. Natural Hazard Series. Vol.
3. UNESCO, Paris AGS, 2000. Landslide risk management concepts and guidelines. Australian Geomechanics Society. Australian
Geomechanics 35(1): 49-92. AGS, 2007. Guideline for landslide susceptibility, hazard and risk zoning for land use management. Australian
geomechanics society landslide taskforce landslide zoning working group. Australian Geomechanics 42(1): 13-36.
Amatruda G., Bonnard, Ch., Castelli M., Forlati, F., Giacomelli L., Morelli M., Paro L., Piana F., Pirulli M., Polino R., Prat P., Ramasco M., Scavia C., Bellardone G.,Campus S., Durville J.-L., Poisel R., Preh H., Roth W., Tentschert E.H., 2004. A key approach: the IMIRILAND project method. In: Identification and mitigation of large landslides risks in Europe. IMIRILAND PROJECT – European Commission – Fifth Framework Program. Ch. Bonnard, F. Forlati, C. Scavia (Eds.), A.A. Balkema Publishers, pp. 13-43.
Atkinson, P.M., Massari, R., 1998. Generalised linear modelling of susceptibility to landsliding in Central Apennines, Italy. Computers and Geosciences 24, 373-385.
Baeza, C., Corominas, J., 2001. Assessment of shallow landslide susceptibility by means of multivariate statistical techniques. Earth Surface Processes and Landforms 26, 1251– 1263.
Bonnard et al., 2004 In: Identification and mitigation of large landslides risks in Europe. IMIRILAND PROJECT – European Commission – Fifth Framework Program. Ch. Bonnard, F. Forlati, C. Scavia (Eds.), A.A. Balkema Publishers, pp. 13-43.
Brabb, E.E., Pampeyan, E.H., Bonilla, M.G., 1972. Landslide susceptibility in San Mateo County, California. U.S. Geol. Surv., Misc. Field Studies, Map MF-360. Scale 1:62,500.
Brand, E.W. 1988. Special Lecture: Landslide risk assessment in Honk Kong. Proceeding of the V International Symposium on Landslides, Lausanne, Vol. 2, pp. 1059-1074.
Cascini, L. 2008. Applicability of landslide susceptibility and hazard zoning at different scales. Engineering Geology, 102, pp. 164-177.
Cascini, L., Bonnard, Ch., Corominas, J., Jibson, R., Montero-Olarte, J. 2005. Landslide hazard and risk zoning for urban planning and development. – State of the Art report. Proceeding of the International Conference on Landslide Risk Management. Hungr, Fell, Couture & Eberhardt (Eds.), A.A. Balkema Publishers, pp. 199-235.
Castellanos Abella, E.A., van Westen, C.J. 2007. Generation of a landslide risk index map for Cuba using spatial multi-criteria evaluation. In: Landslides : journal of the International Consortium on Landslides, 4 (2007)4, pp. 311-325.
Corominas, J., Mavrouli, O. (coordinators) 2010. Overview of landslide hazard and risk assessment practices. Deliverable 2.1 of the Work Package 2.1 - Harmonization and development of procedures for quantifying landslide hazard. SafeLand Project - 7th Framework Programme Cooperation Theme 6 Environment (including climate change) Sub-Activity 6.1.3 Natural Hazards.

Guidelines for landslide susceptibility, hazard and risk zoning
30
Cruden, D.M., Varnes, D.J.,1996. Landslide types and processes. In: Turner, A.T., Schuster, R.L. (Eds.), “Landslides — Investigation and Mitigation”, Transportation Research Board Special Report No. 247. National Academy Press, Washington DC, pp. 36–75.
Dai, C.F., Lee, C.F., 2002. Terrain based mapping of landslide susceptibility using a geographic information system: a case study. Canadian Geotechnical Journal 38: 911-923.
Donati, L., Turrini, M.C. 2002. An objective method to rank the importance of the factors predisposing landslides with the GIS methodology — application to an area of the Apennines (Valneria; Perugia, Italy), Engineering Geology 63: 277–290.
Evans, N.C., King, J.P., 1998. The natural terrain landslide study. Debris avalanche susceptibility. Technical Note TN 1/98, Geotechnical Engineering Office, Hong Kong.
Fell, R., Corominas, J., Bonnard, Ch., Cascini, L., Leroi, E., Savage, W.Z. on behalf of the JTC-1 Joint Technical Committee on Landslides and Engineered Slopes. 2008a. Guidelines for landslide susceptibility, hazard and risk zoning for land use planning. Engineering Geology, 102: 85-98.
Fell, R., Ho, K.K.S., Lacasse, S., Leroi, E. 2005. A framework for landslide risk assessment and management. In Landslide Risk Management, Editors O Hungr, R Fell, R Couture and E Eberhardt, Taylor and Francis, London,3-26
Hardingham, A.D., Ho, K.K.S., Smallwood, A.R.H., Ditchfield, C.S. 1998. Quantitative risk assessment of landslides – a case history from Hong Kong. Proceedings of the Seminar on Geotechnical Risk Management, Geotechnical Division, Hong Kong Institution of Engineers, pp. 145-152.
Ho, K.K.S., Leroi, E., Roberds, B. 2000. Quantitative risk assessment - application, myths and future direction. Proceedings of the International Conference on Geotechnical and Geological Engineering GeoEng2000, Melbourne, Vol. 1, pp. 269-312.
Hong, Y., Adler, R., Huffman, G. 2007. Use of satellite remote sensing data in the mapping of global landslide susceptibility. Natural Hazards, 43, 245-256
Humbert, M. 1972. Les Mouvements de terrains. Principes de réalisation d’une carte prévisionnelle dans les Alpes. Bulletin du BRGM. Section III, n°1 : 13-28.
Humbert, M. 1977. La Cartographie ZERMOS. Modalités d’établissement des Cartes des zones exposées à des risques liés aux mouvements du sol et du sous-sol. Bulletin du BRGM, Section III, n. 1/2: 5-8.
Kaynia, A.M., Papathoma-Köhle, M., Neuhäuser, B., Ratzinger, K., Wenzel, H., Medina-Cetina, Z. 2008. Probabilistic assessment of vulnerability to landslide: Application to the village of Lichtenstein, Baden-Württemberg, Germany. Engineering Geology 101: 33–48.
Kienholz, H., 1978. Map of geomorphology and natural hazards of Grindelwald, Switzerland, scale 1:10,000. Artic and Alpine Research 10, 169–184.
Leroi E., Bonnard Ch., Fell R., McInnes R., 2005. Risk assessment and management – State of the Art report. Proceeding of the International Conference on Landslide Risk Management. Hungr, Fell, Couture & Eberhardt (Eds.), A.A. Balkema Publishers, pp. 159-198
Malet, J.-P., Thiery, Y., Puissant, A., Hervás, J., Günther, A., Grandjean, G., 2009. Landslide susceptibility mapping at 1:1M scale over France: exploratory results with a heuristic model. In: Malet, J.-P., Remaître, A., Boogard, T. (Eds), Proc. International Conference on Landslide Processes: from Geomorphologic Mapping to Dynamic Modelling, 6 -7 February 2009, Strasbourg, France. CERG Editions, Strasbourg, pp. 315-320.
Nadim, F., Kjekstad, O., Peduzzi, P., Herold, C. and Jaedicke, C. 2006. Global landslide and avalanche hotspots. Landslides, Vol. 3, No. 2, 159-174.
Nadim, F., Kjekstad, O., 2009. Assessment of Global High-Risk Landslide Disaster Hotspots. In: Sassa, K., Canuti, P. (Eds.), Landslides - Diaster Risk Reduction. Springer, 213-221
Nilsen, T.H., Wright, R.H., Vlasic, T.C., Spangle, W.E., 1979. Relative slope stability and land-use planning in the San Francisco Bay region, California. U.S. Geological Survey Professional Paper 944: 96.
Remondo, J., Bonachea, J., Cendrero, A., 2005. A statistical approach to landslide risk modelling at basin scale: from landslide susceptibility to quantitative risk assessment. Landslides 2: 321-328.
Schwab, J.C., Gori, P.L., Sanjay, J. 2005. Landslide Hazard and Planning. Planning Advisory Service Report number 533/534. American Planning Association, Washington DC (USA).
Soeters, R., van Westen, C.J., 1996. Slope instability recognition, analysis and zonation. In: Turner, A.K., Schuster, R.L. (Eds.), Landslides Investigation and Mitigation. TRB Special Report 247. National Academy Press, Washington D.C., pp. 129–177.
van Westen, C.J., 2004. Geo-information tools for landslide risk assessment: an overview of recent developments. In: Lacerda, W.A., Ehrlich, M., Fontoura, S.A.B., Sayão, A.S.F. (Eds.), Proceedings 9th International Symposium on Landslides, Rio de Janeiro, Brasil, Vol. 1. Balkema, pp. 39–56.
van Westen, C.J., Castellanos, E., Kuriakose, S.L. 2008. Spatial data for landslide susceptibility, hazard, and vulnerability assessment: An overview. Engineering Geology, 102, pp. 112-131.

Guidelines for landslide susceptibility, hazard and risk zoning
31
Wong, H.N. 2005. Landslide risk assessment for individual facilities– State of the Art report. Proceeding of the International Conference on Landslide Risk Management. Hungr, Fell, Couture & Eberhardt (Eds.), pp. 237-296, A.A. Balkema Publishers.
Wong, H.N., Ho, K.K.S. 1998. Overview of risk of old man-made slopes and retaining walls in Hong Kong. Proceedings of the Seminar on Slope Engineering in Hong Kong, Hong Kong, A.A. Balkema Publisher, pp. 193-200.
Wong, H.N., Ho, K.K.S., Chan, Y.C. 1997. Assessment of consequence of landslides. Proceedings of the International Workshop on Landslide Risk Assessment, Honolulu, Hawaii, USA, pp. 111-149.
4.4 Input data for landslide risk assessment 4.4.1 Landslide inventory mapping In order to make a reliable map that predicts the landslide hazard and risk in a certain area, it is crucial to have insight in the spatial and temporal frequency of landslides, and therefore each landslide hazard or risk study should start by making a landslide inventory that is as complete as possible in both space and time. Attempts have been made to standardize classification in nomenclature, activity, causes, rates of movement and remedial measures for landslides by the IAEG Commission on Landslides, UNESCO-WP/WLI, and the IUGS-Working group on Landslides (IAEG, 1990; IUGS, 1995, 2001; UNESCO, 1993a, 1993b. 1994) Landslide inventories can be carried out using a variety of techniques, which are summarized in Table 5.2. For visual interpretation of landslides, stereoscopic imagery with a high to very high resolution is required (SafeLand, 2010). Optical images with resolutions larger than 3 meters (e.g. SPOT, LANDSAT, ASTER, IRS-1D), as well as SAR images (RADARSAT, ERS, JERS, ENVISAT) have proven to be useful for visual interpretation of large landslides in individual cases (Singhroy, 2005), but not for landslide mapping on the basis of landform analysis over large areas (Soeters and Van Westen, 1996; Metternicht et al., 2005; SafeLand, 2010). Traditionally, aerial photo interpretation has been the most used technique for landslide mapping (Cardinali et al. 2002). However, with the rapid development of new technologies this is starting to change. Very high resolution imagery (QuickBird, IKONOS, CARTOSAT-1, CARTOSAT-2, ALOS-PRISM, GEOYE) has become the best option now for landslide mapping from satellite images, and the number of operational sensors with similar characteristics is growing year by year, as more countries are launching earth observation satellites with stereo capabilities and resolution of 3 meters or better. The high costs may still be a limitation for obtaining these very high resolution images for particular study areas, especially for multiple dates after the occurrence of main triggering events such as tropical storms or cyclones. Nowadays for many areas the use of Google Earth data is a good alternative and many parts of the world are covered by high resolution imagery which can be downloaded, and combined in GIS with a Digital Elevation Model to generate stereoscopic images, that are essential in landslide interpretation. Another interesting development is the visual interpretation of landslide phenomena from shaded relief images produced from LiDAR DEMs, from which the objects on the earth surface have been removed; so called bare earth DEMs (Haugerud et al., 2003; Schulz, 2004). Also the combination of an Airborne Laser Scanner (ALS) and Terrestrial Laser Scanner (TLS) for the quantification of landslide volumes has been proven successfully. Terrestrial LiDAR measurements have also been successfully applied for the monitoring of individual landslides (Rosser et al., 2005). The use of shaded relief images of LiDAR DEMs also allows a much more detailed interpretation of the landslide mechanism as the deformation features within the large landslide are visible, and landslide can be mapped in heavily forested areas (Ardizzone et al., 2007; Van den Eeckhaut, 2007).

Guidelines for landslide susceptibility, hazard and risk zoning
32

Guidelines for landslide susceptibility, hazard and risk zoning
33
Table 3.3 gives a schematic overview of the main data layers required for landslide susceptibility, hazard and risk assessment (indicated in the upper row of 4.4.1 Landslide inventory mapping In order to make a reliable map that predicts the landslide hazard and risk in a certain area, it is crucial to have insight in the spatial and temporal frequency of landslides, and therefore each landslide hazard or risk study should start by making a landslide inventory that is as complete as possible in both space and time. Attempts have been made to standardize classification in nomenclature, activity, causes, rates of movement and remedial measures for landslides by the IAEG Commission on Landslides, UNESCO-WP/WLI, and the IUGS-Working group on Landslides (IAEG, 1990; IUGS, 1995, 2001; UNESCO, 1993a, 1993b. 1994) Landslide inventories can be carried out using a variety of techniques, which are summarized in Table 5.2. For visual interpretation of landslides, stereoscopic imagery with a high to very high resolution is required (SafeLand, 2010). Optical images with resolutions larger than 3 meters (e.g. SPOT, LANDSAT, ASTER, IRS-1D), as well as SAR images (RADARSAT, ERS, JERS, ENVISAT) have proven to be useful for visual interpretation of large landslides in individual cases (Singhroy, 2005), but not for landslide mapping on the basis of landform analysis over large areas (Soeters and Van Westen, 1996; Metternicht et al., 2005; SafeLand, 2010). Traditionally, aerial photo interpretation has been the most used technique for landslide mapping (Cardinali et al. 2002). However, with the rapid development of new technologies this is starting to change. Very high resolution imagery (QuickBird, IKONOS, CARTOSAT-1, CARTOSAT-2, ALOS-PRISM, GEOYE) has become the best option now for landslide mapping from satellite images, and the number of operational sensors with similar characteristics is growing year by year, as more countries are launching earth observation satellites with stereo capabilities and resolution of 3 meters or better. The high costs may still be a limitation for obtaining these very high resolution images for particular study areas, especially for multiple dates after the occurrence of main triggering events such as tropical storms or cyclones. Nowadays for many areas the use of Google Earth data is a good alternative and many parts of the world are covered by high resolution imagery which can be downloaded, and combined in GIS with a Digital Elevation Model to generate stereoscopic images, that are essential in landslide interpretation. Another interesting development is the visual interpretation of landslide phenomena from shaded relief images produced from LiDAR DEMs, from which the objects on the earth surface have been removed; so called bare earth DEMs (Haugerud et al., 2003; Schulz, 2004). Also the combination of an Airborne Laser Scanner (ALS) and Terrestrial Laser Scanner (TLS) for the quantification of landslide volumes has been proven successfully. Terrestrial LiDAR measurements have also been successfully applied for the monitoring of individual landslides (Rosser et al., 2005). The use of shaded relief images of LiDAR DEMs also allows a much more detailed interpretation of the landslide mechanism as the deformation features within the large landslide are visible, and landslide can be mapped in heavily forested areas (Ardizzone et al., 2007; Van den Eeckhaut, 2007).

Guidelines for landslide susceptibility, hazard and risk zoning
34
Table 3.3, Van Westen el al. 2008). These can be subdivided into four groups: landslide inventory data, environmental factors, triggering factors, and elements at risk. Of these, the landslide inventory is by far the most important, as it should give insight into the location of landslide phenomena, failure mechanisms, causal factors, frequency of occurrence, volumes and the damage that has been caused. Landslide inventory databases should display information on landslide activity, and therefore require multi-temporal landslide information over larger regions. For detailed mapping scales, activity analysis is often restricted to a single landslide and becomes more landslide monitoring. The environmental factors are a collection of data layers that are expected to have an effect on the occurrence of landslides, and can be utilized as causal factors in the prediction of future landslides. The list of environmental factors indicated in 4.4.1 Landslide inventory mapping In order to make a reliable map that predicts the landslide hazard and risk in a certain area, it is crucial to have insight in the spatial and temporal frequency of landslides, and therefore each landslide hazard or risk study should start by making a landslide inventory that is as complete as possible in both space and time. Attempts have been made to standardize classification in nomenclature, activity, causes, rates of movement and remedial measures for landslides by the IAEG Commission on Landslides, UNESCO-WP/WLI, and the IUGS-Working group on Landslides (IAEG, 1990; IUGS, 1995, 2001; UNESCO, 1993a, 1993b. 1994) Landslide inventories can be carried out using a variety of techniques, which are summarized in Table 5.2. For visual interpretation of landslides, stereoscopic imagery with a high to very high resolution is required (SafeLand, 2010). Optical images with resolutions larger than 3 meters (e.g. SPOT, LANDSAT, ASTER, IRS-1D), as well as SAR images (RADARSAT, ERS, JERS, ENVISAT) have proven to be useful for visual interpretation of large landslides in individual cases (Singhroy, 2005), but not for landslide mapping on the basis of landform analysis over large areas (Soeters and Van Westen, 1996; Metternicht et al., 2005; SafeLand, 2010). Traditionally, aerial photo interpretation has been the most used technique for landslide mapping (Cardinali et al. 2002). However, with the rapid development of new technologies this is starting to change. Very high resolution imagery (QuickBird, IKONOS, CARTOSAT-1, CARTOSAT-2, ALOS-PRISM, GEOYE) has become the best option now for landslide mapping from satellite images, and the number of operational sensors with similar characteristics is growing year by year, as more countries are launching earth observation satellites with stereo capabilities and resolution of 3 meters or better. The high costs may still be a limitation for obtaining these very high resolution images for particular study areas, especially for multiple dates after the occurrence of main triggering events such as tropical storms or cyclones. Nowadays for many areas the use of Google Earth data is a good alternative and many parts of the world are covered by high resolution imagery which can be downloaded, and combined in GIS with a Digital Elevation Model to generate stereoscopic images, that are essential in landslide interpretation. Another interesting development is the visual interpretation of landslide phenomena from shaded relief images produced from LiDAR DEMs, from which the objects on the earth surface have been removed; so called bare earth DEMs (Haugerud et al., 2003; Schulz, 2004). Also the combination of an Airborne Laser Scanner (ALS) and Terrestrial Laser Scanner (TLS) for the quantification of landslide volumes has been proven successfully. Terrestrial LiDAR measurements have also been successfully applied for the monitoring of individual landslides (Rosser et al., 2005). The use of shaded relief images of LiDAR DEMs also allows a much more detailed interpretation of the landslide mechanism as the deformation features within the large landslide are visible, and landslide can be mapped in heavily forested areas (Ardizzone et al., 2007; Van den Eeckhaut, 2007).

Guidelines for landslide susceptibility, hazard and risk zoning
35

Guidelines for landslide susceptibility, hazard and risk zoning
36
Table 3.3 is not exhaustive, and it is important to make a selection of the specific factors that are related to the landslide types and failure mechanisms in each particular environment. However, they do give an idea of the types of data included, related to morphometry, geology, soil types, hydrology, geomorphology and land use. It is not possible to give a prescribed uniform list of causal factors. The selection of causal factors differs, depending on the scale of analysis, the characteristics of the study area, the landslide type, and the failure mechanisms. 4.4.1 Landslide inventory mapping In order to make a reliable map that predicts the landslide hazard and risk in a certain area, it is crucial to have insight in the spatial and temporal frequency of landslides, and therefore each landslide hazard or risk study should start by making a landslide inventory that is as complete as possible in both space and time. Attempts have been made to standardize classification in nomenclature, activity, causes, rates of movement and remedial measures for landslides by the IAEG Commission on Landslides, UNESCO-WP/WLI, and the IUGS-Working group on Landslides (IAEG, 1990; IUGS, 1995, 2001; UNESCO, 1993a, 1993b. 1994) Landslide inventories can be carried out using a variety of techniques, which are summarized in Table 5.2. For visual interpretation of landslides, stereoscopic imagery with a high to very high resolution is required (SafeLand, 2010). Optical images with resolutions larger than 3 meters (e.g. SPOT, LANDSAT, ASTER, IRS-1D), as well as SAR images (RADARSAT, ERS, JERS, ENVISAT) have proven to be useful for visual interpretation of large landslides in individual cases (Singhroy, 2005), but not for landslide mapping on the basis of landform analysis over large areas (Soeters and Van Westen, 1996; Metternicht et al., 2005; SafeLand, 2010). Traditionally, aerial photo interpretation has been the most used technique for landslide mapping (Cardinali et al. 2002). However, with the rapid development of new technologies this is starting to change. Very high resolution imagery (QuickBird, IKONOS, CARTOSAT-1, CARTOSAT-2, ALOS-PRISM, GEOYE) has become the best option now for landslide mapping from satellite images, and the number of operational sensors with similar characteristics is growing year by year, as more countries are launching earth observation satellites with stereo capabilities and resolution of 3 meters or better. The high costs may still be a limitation for obtaining these very high resolution images for particular study areas, especially for multiple dates after the occurrence of main triggering events such as tropical storms or cyclones. Nowadays for many areas the use of Google Earth data is a good alternative and many parts of the world are covered by high resolution imagery which can be downloaded, and combined in GIS with a Digital Elevation Model to generate stereoscopic images, that are essential in landslide interpretation. Another interesting development is the visual interpretation of landslide phenomena from shaded relief images produced from LiDAR DEMs, from which the objects on the earth surface have been removed; so called bare earth DEMs (Haugerud et al., 2003; Schulz, 2004). Also the combination of an Airborne Laser Scanner (ALS) and Terrestrial Laser Scanner (TLS) for the quantification of landslide volumes has been proven successfully. Terrestrial LiDAR measurements have also been successfully applied for the monitoring of individual landslides (Rosser et al., 2005). The use of shaded relief images of LiDAR DEMs also allows a much more detailed interpretation of the landslide mechanism as the deformation features within the large landslide are visible, and landslide can be mapped in heavily forested areas (Ardizzone et al., 2007; Van den Eeckhaut, 2007).

Guidelines for landslide susceptibility, hazard and risk zoning
37
Table 3.3 intends to provide a summary of this discussion. The basic data can be subdivided into those that are more or less static, and those that are dynamic and need to be updated regularly. Examples of static data sets are related to geology, soil types, geomorphology and morphography. The time frame for the updating of dynamic data may range from hours to days, for example for meteorological data and its effect on slope hydrology, to months and years (see
4.4.1 Landslide inventory mapping In order to make a reliable map that predicts the landslide hazard and risk in a certain area, it is crucial to have insight in the spatial and temporal frequency of landslides, and therefore each landslide hazard or risk study should start by making a landslide inventory that is as complete as possible in both space and time. Attempts have been made to standardize classification in nomenclature, activity, causes, rates of movement and remedial measures for landslides by the IAEG Commission on Landslides, UNESCO-WP/WLI, and the IUGS-Working group on Landslides (IAEG, 1990; IUGS, 1995, 2001; UNESCO, 1993a, 1993b. 1994) Landslide inventories can be carried out using a variety of techniques, which are summarized in Table 5.2. For visual interpretation of landslides, stereoscopic imagery with a high to very high resolution is required (SafeLand, 2010). Optical images with resolutions larger than 3 meters (e.g. SPOT, LANDSAT, ASTER, IRS-1D), as well as SAR images (RADARSAT, ERS, JERS, ENVISAT) have proven to be useful for visual interpretation of large landslides in individual cases (Singhroy, 2005), but not for landslide mapping on the basis of landform analysis over large areas (Soeters and Van Westen, 1996; Metternicht et al., 2005; SafeLand, 2010). Traditionally, aerial photo interpretation has been the most used technique for landslide mapping (Cardinali et al. 2002). However, with the rapid development of new technologies this is starting to change. Very high resolution imagery (QuickBird, IKONOS, CARTOSAT-1, CARTOSAT-2, ALOS-PRISM, GEOYE) has become the best option now for landslide mapping from satellite images, and the number of operational sensors with similar characteristics is growing year by year, as more countries are launching earth observation satellites with stereo capabilities and resolution of 3 meters or better. The high costs may still be a limitation for obtaining these very high resolution images for particular study areas, especially for multiple dates after the occurrence of main triggering events such as tropical storms or cyclones. Nowadays for many areas the use of Google Earth data is a good alternative and many parts of the world are covered by high resolution imagery which can be downloaded, and combined in GIS with a Digital Elevation Model to generate stereoscopic images, that are essential in landslide interpretation. Another interesting development is the visual interpretation of landslide phenomena from shaded relief images produced from LiDAR DEMs, from which the objects on the earth surface have been removed; so called bare earth DEMs (Haugerud et al., 2003; Schulz, 2004). Also the combination of an Airborne Laser Scanner (ALS) and Terrestrial Laser Scanner (TLS) for the quantification of landslide volumes has been proven successfully. Terrestrial LiDAR measurements have also been successfully applied for the monitoring of individual landslides (Rosser et al., 2005). The use of shaded relief images of LiDAR DEMs also allows a much more detailed interpretation of the landslide mechanism as the deformation features within the large landslide are visible, and landslide can be mapped in heavily forested areas (Ardizzone et al., 2007; Van den Eeckhaut, 2007).

Guidelines for landslide susceptibility, hazard and risk zoning
38
Table 3.3). Landslide information needs to be updated continuously, and land use and elements at risk data need to have an update frequency which may range from 1 to 10 years, depending on the dynamics of land use change in an area. Especially the land use information should be evaluated with care, as this is both an environmental factor, which determines the occurrence of new landslides, as well as an element at risk, which may be affected by landslides. 4.4.1 Landslide inventory mapping In order to make a reliable map that predicts the landslide hazard and risk in a certain area, it is crucial to have insight in the spatial and temporal frequency of landslides, and therefore each landslide hazard or risk study should start by making a landslide inventory that is as complete as possible in both space and time. Attempts have been made to standardize classification in nomenclature, activity, causes, rates of movement and remedial measures for landslides by the IAEG Commission on Landslides, UNESCO-WP/WLI, and the IUGS-Working group on Landslides (IAEG, 1990; IUGS, 1995, 2001; UNESCO, 1993a, 1993b. 1994) Landslide inventories can be carried out using a variety of techniques, which are summarized in Table 5.2. For visual interpretation of landslides, stereoscopic imagery with a high to very high resolution is required (SafeLand, 2010). Optical images with resolutions larger than 3 meters (e.g. SPOT, LANDSAT, ASTER, IRS-1D), as well as SAR images (RADARSAT, ERS, JERS, ENVISAT) have proven to be useful for visual interpretation of large landslides in individual cases (Singhroy, 2005), but not for landslide mapping on the basis of landform analysis over large areas (Soeters and Van Westen, 1996; Metternicht et al., 2005; SafeLand, 2010). Traditionally, aerial photo interpretation has been the most used technique for landslide mapping (Cardinali et al. 2002). However, with the rapid development of new technologies this is starting to change. Very high resolution imagery (QuickBird, IKONOS, CARTOSAT-1, CARTOSAT-2, ALOS-PRISM, GEOYE) has become the best option now for landslide mapping from satellite images, and the number of operational sensors with similar characteristics is growing year by year, as more countries are launching earth observation satellites with stereo capabilities and resolution of 3 meters or better. The high costs may still be a limitation for obtaining these very high resolution images for particular study areas, especially for multiple dates after the occurrence of main triggering events such as tropical storms or cyclones. Nowadays for many areas the use of Google Earth data is a good alternative and many parts of the world are covered by high resolution imagery which can be downloaded, and combined in GIS with a Digital Elevation Model to generate stereoscopic images, that are essential in landslide interpretation. Another interesting development is the visual interpretation of landslide phenomena from shaded relief images produced from LiDAR DEMs, from which the objects on the earth surface have been removed; so called bare earth DEMs (Haugerud et al., 2003; Schulz, 2004). Also the combination of an Airborne Laser Scanner (ALS) and Terrestrial Laser Scanner (TLS) for the quantification of landslide volumes has been proven successfully. Terrestrial LiDAR measurements have also been successfully applied for the monitoring of individual landslides (Rosser et al., 2005). The use of shaded relief images of LiDAR DEMs also allows a much more detailed interpretation of the landslide mechanism as the deformation features within the large landslide are visible, and landslide can be mapped in heavily forested areas (Ardizzone et al., 2007; Van den Eeckhaut, 2007).

Guidelines for landslide susceptibility, hazard and risk zoning
39
Table 3.3 also gives an indication of the extent to which remote sensing data can be utilized to generate the various data layers (based on Soeters and Van Westen, 1996, Metternicht et al., 2005, and SafeLand, 2010). For a number of data layers the main emphasis in data acquisition is on field mapping, field measurements or laboratory analysis, and remote sensing imagery is only of secondary importance. This is particularly the case for the geological, geomorphological, and soil data layers. The soil depth and slope hydrology information, which are very important in physical modeling of slope stability are also the most difficult to obtain, and remote sensing has not proven to be a very important tool for these. On the other hand, however, there are also data layers for which remote sensing data can be the main source of information. This is particularly so for landslide inventories, digital elevation models, and land use maps. In the following sections an overview is given of the methods for spatial data collection. Most emphasis is given to landslide inventories, given their high importance, but also a number of aspects dealing with environmental factors, triggering factors and elements at risk will be discussed and illustrated
4.4.1 Landslide inventory mapping In order to make a reliable map that predicts the landslide hazard and risk in a certain area, it is crucial to have insight in the spatial and temporal frequency of landslides, and therefore each landslide hazard or risk study should start by making a landslide inventory that is as complete as possible in both space and time. Attempts have been made to standardize classification in nomenclature, activity, causes, rates of movement and remedial measures for landslides by the IAEG Commission on Landslides, UNESCO-WP/WLI, and the IUGS-Working group on Landslides (IAEG, 1990; IUGS, 1995, 2001; UNESCO, 1993a, 1993b. 1994) Landslide inventories can be carried out using a variety of techniques, which are summarized in Table 5.2. For visual interpretation of landslides, stereoscopic imagery with a high to very high resolution is required (SafeLand, 2010). Optical images with resolutions larger than 3 meters (e.g. SPOT, LANDSAT, ASTER, IRS-1D), as well as SAR images (RADARSAT, ERS, JERS, ENVISAT) have proven to be useful for visual interpretation of large landslides in individual cases (Singhroy, 2005), but not for landslide mapping on the basis of landform analysis over large areas (Soeters and Van Westen, 1996; Metternicht et al., 2005; SafeLand, 2010). Traditionally, aerial photo interpretation has been the most used technique for landslide mapping (Cardinali et al. 2002). However, with the rapid development of new technologies this is starting to change. Very high resolution imagery (QuickBird, IKONOS, CARTOSAT-1, CARTOSAT-2, ALOS-PRISM, GEOYE) has become the best option now for landslide mapping from satellite images, and the number of operational sensors with similar characteristics is growing year by year, as more countries are launching earth observation satellites with stereo capabilities and resolution of 3 meters or better. The high costs may still be a limitation for obtaining these very high resolution images for particular study areas, especially for multiple dates after the occurrence of main triggering events such as tropical storms or cyclones. Nowadays for many areas the use of Google Earth data is a good alternative and many parts of the world are covered by high resolution imagery which can be downloaded, and combined in GIS with a Digital Elevation Model to generate stereoscopic images, that are essential in landslide interpretation. Another interesting development is the visual interpretation of landslide phenomena from shaded relief images produced from LiDAR DEMs, from which the objects on the earth surface have been removed; so called bare earth DEMs (Haugerud et al., 2003; Schulz, 2004). Also the combination of an Airborne Laser Scanner (ALS) and Terrestrial Laser Scanner

Guidelines for landslide susceptibility, hazard and risk zoning
40
(TLS) for the quantification of landslide volumes has been proven successfully. Terrestrial LiDAR measurements have also been successfully applied for the monitoring of individual landslides (Rosser et al., 2005). The use of shaded relief images of LiDAR DEMs also allows a much more detailed interpretation of the landslide mechanism as the deformation features within the large landslide are visible, and landslide can be mapped in heavily forested areas (Ardizzone et al., 2007; Van den Eeckhaut, 2007).

Guidelines for landslide susceptibility, hazard and risk zoning
41
Table 3.3 Schematic representation of basic data sets for landslide susceptibility, hazard and risk assessment. Left: indication of the main types of data, Middle: indication of the ideal update frequency, RS: column indicating the usefulness of Remote Sensing for the acquisition of the data, Scale: indication of the importance of the data layer at national, regional, local and site investigation scales, related with the feasibility of obtaining the data at that particular scale, Hazard models: indication of the importance of the data set for heuristic models, statistical models, physically-based models, and probabilistic models, Risk models: indication of the importance of the data layer for qualitative and quantitative risk analysis. (C= Critical, H= highly important, M= moderately important, and L= Less important, - = Not relevant)
Data Update
frequency (years)
10..... 1. … 0.002
(day)
RS Scale Hazard models
Risk method
s Main Type
Data layer
Rem
ote
Sen
-sin
g
use
ful?
N
atio
nal
Reg
ion
al
Loca
l
Sit
e S
pec
ific
Heu
rist
ic
Sta
tist
ical
P
hys
ical
ly
bas
ed
mo
del
s P
rob
abili
stic
(Sem
i)
Qu
anti
tati
ve
Qu
alit
ativ
e
Landslide
Inventory
Landslide Inventory
H C H H H C H H H
Req
uir
es r
esu
lts
of p
rob
abili
stic
haz
ard
an
alys
is
Req
uir
es r
esu
lts
of h
euri
stic
, st
atis
tica
l or
det
erm
inis
tic
haz
ard
an
alys
is
Landslide Activity H M C C C H C C C Landslide
Monitoring M M M M C - - H H
Environ-
mental
factors
DEM H H C C C H C C C Slope
angle/aspects etc H L H H H H H H H
Internal relief H H M L L H L - - Flow
accumulation H L M H H L M H H
Lithology M H H H H H H H H Structure M H H H H H H H H
Faults M H H H H H H - - Soil types M M H C C H H C H Soil depth - - L C C - - C H
Slope hydrology - - - C C - - C H Main
geomorphology units
H C H M L C M L L
Detailed geomorph. units H H H H L H H M L
Land use types H H H H H H H H H Land use changes H M H H C H H H C
Triggering factor
s
Rainfall L M M C C H H C C Temp /
Evapotranspiration
M - - M H - - H L
Earthquake catalogs - M M H C - - - C
Ground acceleration L L M H H H H H L
Elements at risk
Buildings H L M C C - - - - C C Transportation
networks H M M M H M M M M H H
Lifelines - - L L M - - - - L L Essential facilities L L M H H - - - - H H Population data L H H C C - - - - C C Agriculture data H L M H M - - - - L M Economic data - L M H H - - - - L M Ecological data H L L L L - - - - L M

Guidelines for landslide susceptibility, hazard and risk zoning
42
Many developments have taken place in the last decade related to methods for the automatic detection of landslides based on their spectral or altitude characteristics. Multi-spectral images such as SPOT, LANDSAT, ASTER and IRS-1D LISS3 have proven to be more applicable for landslide mapping based on image classification in conditions where landslides are fresh and unvegetated (Cheng, 2004, Nichol and Wong 2005). Image classification of multi-spectral images for landslide studies can be successful for identifying a large number of unvegetated scarps that have been produced during a single triggering event. However, practice has shown that the use of optical satellite imagery for multi-temporal landslide detection after major triggering events, especially in tropical areas, is often hampered by the persistent cloud cover in the affected area, which makes it difficult to obtain cloud-free images for a long period of time. Image classification methods used for landslide mapping can be differentiated in pixel based and non-pixel based ones. Recent advances in computer vision and machine intelligence have led to the development of new techniques, such as object-oriented analysis (OOA) for automatic content extraction of both man-made and natural geospatial objects from remote sensing images (Akcay and Aksoy, 2008). OOA has the potential to accurately and meaningfully detect landslides by integrating the contextual information to image analysis, and thereby, reducing the time required for creation of landslide inventory for large areas (Martha et al., 2010). Also automatic detection of landslides using LiDAR derived DEMs have shown to be successful (Booth et al., 2009). Many methods for landslide mapping make use of digital elevation models of the same area from two different periods. The subtraction of the DEMs allows visualizing where displacement due to landslides has taken place, and the quantification of displacement volumes. DEMs derived from spaceborne missions such as SRTM, ASTER and SPOT do not provide sufficient accuracy to differentiate actual landslide movement from noise, when overlaying two DEMs from different dates. High resolution data from Quickbird, IKONOS, PRISM (ALOS) and CARTOSAT-1 are able to produce highly accurate digital elevation models that might be useful in automatic detection of large and moderately large landslides. Interferometric Synthetic Aperture Radar (InSAR) has been used extensively for measuring surface displacements. Multi-temporal InSAR analyses using techniques such as the Permanent Scatterers (PSInSAR; Ferretti et al. 2001), PSP (Persistent Scatterers Pairs) and SBAS (Small Base-line Subset) can be used to measure displacement of permanent scatterers such as buildings with millimetre accuracy, and allow the reconstruction of the deformation history (Farina et al. 2008). It is very important to obtain imagery as soon as possible after the occurrence of a major triggering event, so that accurate event-based landslide maps can be made, which in turn will make it possible to derive landslide hazard maps, that relate the frequency of a triggering event to the landslide density caused by the event. Such event-based landslide inventory maps should be stored in a landslide database implemented in GIS. Much progress has been made in the development of landslide databases at regional or national level. One of the first comprehensive projects for landslide and flood inventory mapping has been the AVI project in Italy (Guzzetti et al., 1994). There are good examples in the literature of the use of landslide inventories for hazard assessment (Guzzetti, 2000; Chau et al., 2004 ). However, the existing landslide databases often present several drawbacks (Ardizzone et al., 2002) related to the completeness in space and even more so in time, and the fact that they are biased to landslides that have affected infrastructures such as roads.

Guidelines for landslide susceptibility, hazard and risk zoning
43
Table 3.4 Overview of techniques for the collection of landslide information. Indicated is the applicability of each technique for different mapping scales (N=National, R=Regional, L=Local and S=Site specific. (H= highly applicable, M= moderately applicable, and L= Less applicable).
Group Technique Description Scale
N R L S
Image interpretation
Stereo aerial photographs
Analog format or digital image interpretation with
single or multi-temporal data set
M H H H
High Resolution satellite images
With monoscopic or stereoscopic images, and single or multi-temporal data set
M H H H
LiDAR shaded relief maps
Single or multi-temporal data set from bare earth model.
L M H H
Radar images Single data set L M M M (Semi) automated
classification based on spectral
characteristics
Aerial photographs Image ratioing, thresholding M H H H Medium resolution
multi spectral images
Single data images, with pixel based image classification or image segmentation
H H H M
Multiple date images, with pixel based image classification or image segmentation
H H H M
Using combinations of optical and radar
data
Either use image fusion techniques or mult-sensor image classification, either pixel based
or object based
M M M M
(Semi) automated classification based
on altitude characteristics
InSAR Radar Interferometry for information over larger areas
M M M M
Permanent scatterers for pointwise displacement data
H H H H
LiDAR Overlaying of LiDAR DEMs from different periods
L L M H
Photogrammetry Overlaying of DEMs from airphotos or high resolution satellite images for different periods
L M H H
Field investigation methods
Field mapping Conventional method
M H H H
Using Mobile GIS and GPS for attribute data collection
L H H H
Interviews Using questionnaires, workshops etc.
L M H H
Archive studies Newspaper archives Historic study of newspaper, books and other archives
H H H H
Road maintenance organizations
Relate maintenance information along linear features with possible cause by landslides
L M H H
Fire brigade/police Extracting landslide occurrence from logbooks on accidents
L M H H
Dating methods for landslides
Direct dating method
Dendrochronology, radiocarbon dating etc.
L L L M
Indirect dating methods
Pollen analysis, lichenometry and other indirect methods,
L L L L
Monitoring networks
Extensometer etc. Continuous information on movement velocity using extensometers, surface tiltmeters,
inclinometers, piezometers
- - L H
EDM Network of Electronic Distance Measurements, repeated regularly
- - L H
GPS Network of Differential GPS measurements, repeated regularly
- - L H
Total stations Network of Theodolite measurements, repeated regularly
- - L H
Ground-based InSAR
Using ground-based radar with slide rail, repeated regularly
- - L H
Terrestrial LiDAR Using terrestrial laser scanning, repeated regularly
- - L H
4.4.2 Environmental factors

Guidelines for landslide susceptibility, hazard and risk zoning
44
Table 3.5 provides more details on the relevance of the most important environmental factors for landslide susceptibility assessment. The selection of the environmental factors that are used in the susceptibility assessment is depending on the type of landslide, the failure mechanism, the type of terrain and the availability of existing data and resources. Often different combinations of environmental factors should be used, resulting in separate landslide susceptibility maps for each failure mechanism, and landslide type. As topography is one of the major factors in landslide hazard analysis, the generation of a Digital Elevation Model (DEM), plays a major role. Digital Elevation Models (DEMs) can be derived through a large variety of techniques, such as digitizing contours from existing topographic maps, topographic leveling, EDM (Electronic Distance Measurement), differential GPS measurements, (digital) photogrammetry, InSAR, and LiDAR. Many derivate maps can be produced from DEMs using fairly simple GIS operations. Derivatives from DEMs can be used in heuristic analysis at small scales (hillshading images for display as backdrop image, physiographic classification, internal relief, drainage density), in statistical analysis at regional scales (e.g. altitude zones, slope gradient, slope direction, contributing area, plan curvature, profile curvature, slope length), in physically-based modeling at local scales (local drain direction, flow path, slope gradient) and in landslide run out modeling (detailed slope morphology, flow path, rock fall movement). The use of slope gradient maps in landslide hazard assessment is greatly affected by the resolution of the DEM. As a general rule of thumb the use of slope gradient maps is not advisable for small scale studies, whereas in regional scale studies slope maps, and other DEM derivatives such as aspect, slope length, slope shape etc. can be used as input factors for heuristic or statistical analysis. In local and site investigation scale hazard assessment, DEMs are used in slope hydrology modeling and slope maps are used for physically-based stability modeling. Traditionally, geological maps form a standard component in heuristic and statistical landslide hazard assessment methods. Mostly the stratigraphical legends of existing geological maps are converted into an engineering geological classification, which gives more information on the rock composition and rock mass strength. In medium and small scale analysis the subdivision of geological formations into meaningful mapping units of individual rock types often poses a problem, as the intercalations of these units cannot be properly mapped at these scales. In detailed hazard studies specific engineering geological maps are collected and rock types are characterized using field tests and laboratory measurements. Digital geological maps of chronostratigraphy, lithostratigraphy, faults, tectonic lineaments, tectonic units and other themes are available on-line with scales ranging from 1:250.000 (for certain countries) to 1:50 million. For individual countries geological information is often digitally available at much larger scales. In detailed hazard studies specific engineering geological maps are collected and rock types are characterized using field tests and laboratory measurements. For detailed analysis also 3-D geological maps have been used, although the amount of outcrop and borehole information collected will make it difficult to use this method on a scale smaller than 1:5000, and its use is restricted mostly to a site investigation level (e.g. Xie et al., 2003). Apart from lithological information structural information is very important for hazard assessment (e.g. for earthquakes, landslides, volcanic eruptions).

Guidelines for landslide susceptibility, hazard and risk zoning
45
Table 3.5 Overview of environmental factors, and their relevance for landslide susceptibility and hazard assessment. Scale of analysis: N=National, M=Regional, L=Local and S=Site Specific. (H= highly applicable, M= moderately applicable, and L= Less applicable)
Group Data layer and types
Relevance for landslide susceptibility and hazard assessment
Scales of analysis
N R L S
Digital Elevation Models
Slope gradient Most important factor in gravitational movements L H H H
Slope direction Might reflect differences in soil moisture and vegetation H H H H
Slope length, shape, curvature
Indicator for slope hydrology M H H H
Flow direction Used in slope hydrological modeling L M H H
Flow accumulation Used in slope hydrological modeling L M H H
Internal relief In small scale assessment as indicator for type of terrain. H M L L
Drainage density In small scale assessment as indicator for type of terrain. H M L L
Geology Rock types Based on engineering properties of rock types H H H H
Weathering Depth of profile is an important factor L M H H
Discontinuities Discontinuity sets and characteristics L M H H
Structural aspects Geological structure in relation with slope angle/direction H H H H
Faults Distance from active faults or width of fault zones H H H H
Soils Soil types Engineering soils with genetic or geotechnical properties M H H H
Soil depth Soil depth based on boreholes, geophysics and outcrops L M H H
Geotechnical prop. Grain size, cohesion, friction angle, bulk density L M H H
Hydrological prop. Pore volume, saturated conductivity, PF curve L M H H
Hydrology Water table Spatially and temporal depth to ground water table L L M H
Soil moisture Spatially and temporal soil moisture content L L M H
Hydrologic components Interception, evapotranspiration, throughfall, overland flow, infiltration, percolation etc.
M H H H
Stream network Buffer zones around streams H H H L
Geomorpho-logy
Physiographic units First subdivision of the terrain in zones related to overall physiographic setting
H M L L
Terrain Mapping Units Homogeneous units of lithology, morphography and processes
H M L L
Geomorphology Genetic classification of main landform building processes H H M L
Slope facets Geomorphological subdivision of terrain in slope facets H H H L
Landuse Land use map Type of land use/ land cover H H H H
Land use changes Temporal varying land use/ land cover M H H H
Vegetation Type, canopy cover, rooting depth, root cohesion, weight L M H H
Roads Buffers around roads in sloping areas with road cuts M H H H
Buildings Slope cuts made for building construction M H H H
At medium and large scale attempts have been made to generate maps indicating dip direction and dip angle, based on field measurements, but the success of this depends very strongly on the amount of measurements and the complexity of the geological structure (Günther, 2003). Another option is to map the relation between slope gradient/slope direction and bedding dip/dip direction for individual slope facets. Fault information is also used

Guidelines for landslide susceptibility, hazard and risk zoning
46
frequently as one of the environmental factors in a statistical landslide hazard assessment. The use of wide buffer zones around faults, which is now the standard practice should be treated with caution, as this might be only true for active faults. In other cases a very narrow buffer zone should be taken, which is related to the zone where rocks are fractured. In terms of soil information required for landslide hazard assessment, there are basically two different thematic data layers needed: soil types, with associated geotechnical and hydrological properties, and soil sequences, with depth information. Table 3.6 gives an overview of the most important geotechnical, hydrological and vegetation characteristics required for modelling slope stability for soilslides, rock slides and reactivated landslides. Pedologic soil maps, normally only classify the soils based on the upper soil horizons, with rather complicated legends and are therefore less relevant in case of landslide deeper than 1-2 meters. Engineering soil maps describe all loose materials on top of the bedrock, and classify them according to the geotechnical characteristics. They are based on outcrops, borehole information and geophysical studies. Especially the soil depth is very difficult to map over large areas, as it may vary locally quite significantly. Soil thickness can be modeled using a correlation with topographic factors such as slope, or predicted from a process based model (Kuriakose et al., 2009). Given the fact that soil thickness is one of the most crucial factors in deterministic slope stability modeling, it is surprising that very limited work has been done on the modeling of soil thicknesses over larger areas. Table 3.6 Overview of geotechnical and hydrological paramters required for deterministic slope stability assessment
Soil slope stability: new failures
Existing landslides Rock slope stability
Geo
tech
nica
l cha
ract
eris
tics
Soil types Material types Rock types Thickness and layering, depth to bedrock, paleotopography
Thickness of shear surface, interndiate shear surfaces
Weathering profile
Particle size distribution, Plasticity (Atterberg limits)
Movement history, displacement
rock structure including orientation, occurrence and spacing of bedding, joints, faults and other discontinuities
Soil density Density of landslide materials
Rock density
Shear strength (total and effective angle of internal friction and cohesion)
Residual shear strength Uniaxial compressive Strength, shear strength along discontinuities
Hyd
rolo
gica
l ch
arac
teri
stic
s
Ground water level fluctuations
Ground water level fluctuations
Ground water level fluctuations
Saturated conductivity, initial moisture content, infiltration capacity, soil retention curves
Saturated conductivity, initial moisture content, infiltration capcity, soil retention curves
Permeabilities
Veg
etat
ion
Cha
ract
eris
tics
Vegetation type, surcharge
Vegetation type, surcharge
Rooting depth, rooting density, root cohesion
Rooting depth, rooting density, root cohesion
Canopy storage, throughfall ratio, evapotranspiration
Canopy storage, throughfall ratio, evapotranspiration
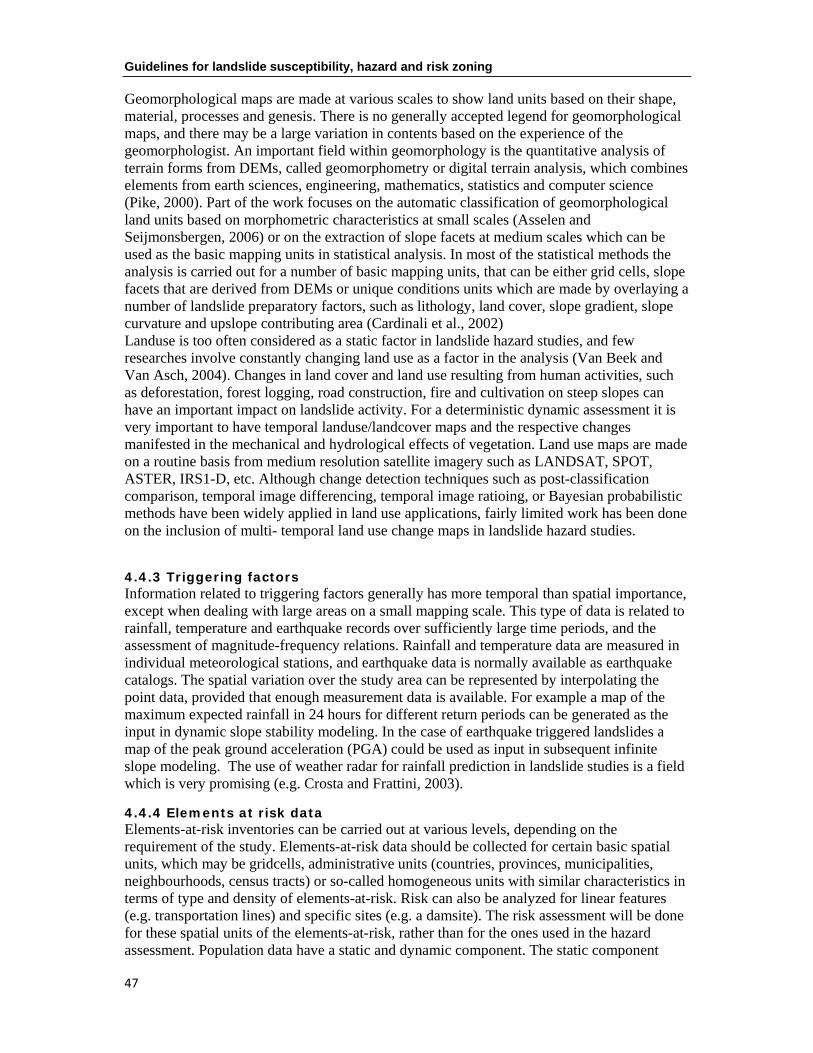
Guidelines for landslide susceptibility, hazard and risk zoning
47
Geomorphological maps are made at various scales to show land units based on their shape, material, processes and genesis. There is no generally accepted legend for geomorphological maps, and there may be a large variation in contents based on the experience of the geomorphologist. An important field within geomorphology is the quantitative analysis of terrain forms from DEMs, called geomorphometry or digital terrain analysis, which combines elements from earth sciences, engineering, mathematics, statistics and computer science (Pike, 2000). Part of the work focuses on the automatic classification of geomorphological land units based on morphometric characteristics at small scales (Asselen and Seijmonsbergen, 2006) or on the extraction of slope facets at medium scales which can be used as the basic mapping units in statistical analysis. In most of the statistical methods the analysis is carried out for a number of basic mapping units, that can be either grid cells, slope facets that are derived from DEMs or unique conditions units which are made by overlaying a number of landslide preparatory factors, such as lithology, land cover, slope gradient, slope curvature and upslope contributing area (Cardinali et al., 2002) Landuse is too often considered as a static factor in landslide hazard studies, and few researches involve constantly changing land use as a factor in the analysis (Van Beek and Van Asch, 2004). Changes in land cover and land use resulting from human activities, such as deforestation, forest logging, road construction, fire and cultivation on steep slopes can have an important impact on landslide activity. For a deterministic dynamic assessment it is very important to have temporal landuse/landcover maps and the respective changes manifested in the mechanical and hydrological effects of vegetation. Land use maps are made on a routine basis from medium resolution satellite imagery such as LANDSAT, SPOT, ASTER, IRS1-D, etc. Although change detection techniques such as post-classification comparison, temporal image differencing, temporal image ratioing, or Bayesian probabilistic methods have been widely applied in land use applications, fairly limited work has been done on the inclusion of multi- temporal land use change maps in landslide hazard studies.
4.4.3 Triggering factors Information related to triggering factors generally has more temporal than spatial importance, except when dealing with large areas on a small mapping scale. This type of data is related to rainfall, temperature and earthquake records over sufficiently large time periods, and the assessment of magnitude-frequency relations. Rainfall and temperature data are measured in individual meteorological stations, and earthquake data is normally available as earthquake catalogs. The spatial variation over the study area can be represented by interpolating the point data, provided that enough measurement data is available. For example a map of the maximum expected rainfall in 24 hours for different return periods can be generated as the input in dynamic slope stability modeling. In the case of earthquake triggered landslides a map of the peak ground acceleration (PGA) could be used as input in subsequent infinite slope modeling. The use of weather radar for rainfall prediction in landslide studies is a field which is very promising (e.g. Crosta and Frattini, 2003).
4.4.4 Elements at risk data Elements-at-risk inventories can be carried out at various levels, depending on the requirement of the study. Elements-at-risk data should be collected for certain basic spatial units, which may be gridcells, administrative units (countries, provinces, municipalities, neighbourhoods, census tracts) or so-called homogeneous units with similar characteristics in terms of type and density of elements-at-risk. Risk can also be analyzed for linear features (e.g. transportation lines) and specific sites (e.g. a damsite). The risk assessment will be done for these spatial units of the elements-at-risk, rather than for the ones used in the hazard assessment. Population data have a static and dynamic component. The static component

Guidelines for landslide susceptibility, hazard and risk zoning
48
relates to the number of inhabitants per mapping unit, and their characteristics, whereas the dynamic component refers to their activity patterns, and their distribution in space and time. Population distribution can be expressed as either the absolute number of people per mapping unit, or as population density. Census data are the obvious source for demographic data. However, for many areas census data is not available, outdated, or unreliable. Therefore also other approaches have been used to model population distribution with remote sensing and GIS, to refine the spatial resolution of population data from available population information (so-called dasymetric mapping). Building information can be obtained in several ways. Ideally data is available on the number and types of buildings per mapping unit, or even in the form of building footprint maps. If such data is not available, building footprints maps can be generated using screen digitizing from high resolution images. Automated building mapping has also been carried out using high resolution satellite images, InSAR, and specifically using LiDAR.
4.4.5 Quality of the input data The occurrence of landslides is governed by complex interrelationships between factors, some of which cannot be determined in detail and others only with a large degree of uncertainty. Some important aspects in this respect are: the error, accuracy, uncertainty and precision of the input data and the objectivity and reproducibility of the input maps. The accuracy of input data refers to the degree of closeness of the measured or mapped values or classes of a map to its actual (true) value or class in the field. An error is defined as the difference between the mapped values or classes and the true ones. The precision of a measurement is the degree to which repeated measurements under unchanged conditions show the same results. Uncertainty refers to the degree with which the actual characteristics of the terrain can be represented spatially in a map. The sources of errors, which may occur in the generaton of input data for landslide hazard and risk analysis, are schematically represented in Error! Reference source not found.. The error in a map can be assessed only if another map, or field information is available which is error-free, and with which it can be verified. Slope angles, for example, can be measured at several points in the terrain, and these point values can be compared with a slope map dervied from a DEM to assess the degree of error. This evaluation is different for maps which are not based on factual, measured data, but on interpretation, such as the genetic elements of a geomorphological map. Such a map can also be checked in the field, but it is still possible that different geomorphologists will not agree on the specific origin of a certain landform. For maps based on interpretation, only the uncertainty of the map can be assessed, by comparison of different maps by different observers. This method will only render reliable results if the field experience of the observers and the mapping method are identical. Therefore, the actual uncertainty of such maps is difficult to determine in an absolute manner. A better way is to express directly the uncertainty of the features that are mapped. This can be done for example for landslides, by including a parameter in the description of the landslide referring to the certainty of the landslide features. Spatial uncertainty can also be expressed by not drawing straight boundary lines, e.g. between two lithological units, but by drawing an “uncertainty buffer”. It is possible to include these “fuzzy” boundaries in the map, and assigning fuzzy values between 0 and 1. The amount of uncertainty is strongly related to the degree of subjectivity of a map. The terms objective and subjective are used to indicate whether the various steps taken in the determination of the degree of hazard are verifiable and reproducible by other researchers, or whether they depend upon the personal judgment of the researcher. Many of the input maps

Guidelines for landslide susceptibility, hazard and risk zoning
49
used in landslide hazard analysis are based on aerial photo-interpretation and will therefore contain a large degree of uncertainty. Table 3.8 lists the factors that are considered to be important in controlling slope instability and a qualitative description of the degree of uncertainty (partly after Carrara et al., 1992). The degree of uncertainty is related to many factors, such as the scale of the analysis, the time and money allocated for data collection, the size of the study area, the experience of the researchers, and the availability and reliability of existing maps. From this list it can be seen that many factors contain an inter-mediate or high degree of uncertainty, either because they are based on a limited amount of factual data (such as soil characteristics) or they are made by subjective interpretation. Table 3.7 Main sources of uncertainty of input data for landsluide hazard and risk assessment Group Type Example
Sou
rce
data
Use of data from different sources that have not been checked in the field
Use of fault and lineament maps derived from different organisations
Use of input data with different map scales Combination of 1:100.000 lithological map with a 1:10.000 topomap
Inappropriate scale of the source data DEMs with high resolution derived from topographic maps with 50 m contour interval
Geometric (positional) errors in the source data
Use of data with inaccurate coordinate systems
Semantic errors in the compilation of maps Use of wrongly classified landslide inventory maps Temporal errors in the compilation of maps Use of outdated landuse maps Availability of incomplete data sets Use of incomplete historical landslide inventories, or
rainfall records
Imag
e an
alys
is
Non availability of imagery from right period
Images from suitable period after the occurrence of a major triggering event
Non availability of imagery of the right type
Cloud cover in optical imagery that prevents mapping of phenomena
Inexperience of image interpretor Not enough experience to map landslides, or other thematic information
Too limited time for image interpretation Thestudy area os too large, and time for interpretation limited
Inaccuracies due to the vague ("fuzzy") character of natural boundaries.
Changes between landuse types that have a gradual change
Too much dependency on automated techniques
Generalization of rule sets used in image classification
Fie
ld d
ata
coll
ecti
on
and
map
gen
erat
ion
Too limited time for field checking Not enough fieldwork for landslide mapping and characterisation
Spatial variation of data which cannot be represented
Lithological differences relevant to landslide occurrence that cannot be mapped at scale
Uncertainty on subsurface conditions Soil depth variations over larger areas are very difficult to model
Lack of sufficient samples to represent spatial characteristics
Characterization of spatial variation of geotechnical characteristics
Lack of sufficiently long period of measurement
Groundwater fluctuations in relation to major events ar onot recorded in project period.
Lack of spatial units to link samples to Characterization of elements at risk data to homogeneous units
GIS
Pro
cess
ing Errors in data entry Digitizing errors, or errors in matching sptail and
attribute dataErrors in data storage Errors due to the limited precision
Errors in data analysis and manipulation Errors in the conversion of data, errors in generating derivative maps.

Guidelines for landslide susceptibility, hazard and risk zoning
50
Errors in data output and application Wrong legends, colour usage, combination with topographic data
Some of the factors with the highest degree of uncertainty are: Detailed geotechnical information, as well as information on soil thickness,
groundwater, rock structure and seismic acceleration can only be obtained for relative small areas, and at large scale. This is because a large amount of data points are required in order to be able to model the spatial variation of these phenomena.
Those maps in which image interpretation plays an important role, and in which the quality of the product depends largely on the experience of the interpreter, will produce the greatest inconsistencies. These maps will be quite erroneous if not based on thorough field checks (Fookes et al., 1991).
The landslide inventory map is the most important data layer, since this contains information on the locations where landslides have actually taken place. For each landslide information should be stored related to the type of landslide, the state of activity, and (if possible) the date of occurrence and damage caused.
Table 3.8 Relative uncertainties for several factors determining landslide hazard
Factor Uncertainty
Slope angle Slope direction Slope convexity General lithological zonation Detailed lithological composition General tectonic framework Detailed rock structure Earthquake acceleration Rainfall distribution Geomorphologic setting Detailed geomorphologic situation Present mass movement distribution Present mass movement typology Present mass movement activity Past mass movement distribution Soil type distribution Soil characteristics Soil thickness Groundwater conditions Land use Past climatologic conditions
Low Low Low Low High Low High High Intermediate Low Intermediate Intermediate Intermediate Intermediate/high High Low/intermediate Intermediate/high High High Low High
4.4.6 References Akcay, H.G., Aksoy, S. (2008). Automatic detection of geospatial objects using multiple hierarchical
segmentations. IEEE Transactions on Geoscience and Remote Sensing 46, 2097-2111. Ardizzone, F., Cardinali, M., Carrara, A., Guzzetti, F., Reichenbach, P. (2002). Impact of mapping errors on the
reliability of landslide hazard maps. Natural Hazards and Earth System Sciences 2, 3-14. Ardizzone, F. Cardinali, M., Galli, M., Guzzetti, F., and P. Reichenbach (2007). Identification and mapping of
recent rainfall-induced landslides using elevation data collected by airborne Lidar. Nat. Hazards Earth Syst. Sci., 7, pp. 637-650.

Guidelines for landslide susceptibility, hazard and risk zoning
51
Asselen, S.V., Seijmonsbergen, A.C. (2006). Expert-driven semi-automated geomorphological mapping for a mountainous area using a laser DTM. Geomorphology 78 (3-4), 309-320.
Booth, A.M., Roering, J. and Perron, J.T. (2009). Automated landslide mapping using spectral analysis and high-resolution topographic data: Puget Sound lowlands, Washington, and Portland Hills, Oregon. Geomorphology 100, 132-147.
Cardinali, M., Reichenbach, P. Guzzetti, F., Ardizzone, F., Antonini, G., Galli., Cacciano, M., Castellani, M., Salvati, P. ( 2002). A geomorphological approach to the estimation of landslide hazards and risks in Umbria, Central Italy. Natural Hazards and Earth System Sciences 2, 57-72.
Carrara, A., Cardinali, M. and Guzetti, F. (1992). Uncertainty in assessing landslide hazard and risk. ITC-Journal 1992-2: 172-183.
Chau, K.T., Sze, Y.L., Fung, M.K., Wong, W.Y., Fong, E.L., Chan, L.C.P., (2004). Landslide hazard analysis for Hong Kong using landslide inventory and GIS. Computers & Geosciences 30 (4), 429-443.
Cheng, K.S., Wei, C., Chang, S.C. (2004). Locating landslides using multi-temporal satellite images. Advances in Space Research 33 (3), 296-301.
Crosta G.B., Frattini P. (2003) Distributed modelling of shallow landslides triggered by intense rainfall. Natural Hazards And Earth System Sciences NHESS, European Geophysical Society, vol. 3, 1-2, pp. 81-93 ISSN 1561-8633.
Farina, P., Casagli, N., & Ferretti, A. (2008). Radar-interpretation of InSAR measurements for landslide investigations in civil protection practices. Proc. 1st North American Landslide Conference, Vail, Colorado. 272-283
Ferretti, A., Prati, C., Rocca, F. (2001). Permanent scatterers in SAR interferometry. IEEE Transactions on Geoscience and Remote Sensing 39 (1), 8-20.
Fookes, P. G., Dale, S. G., and Land, J. M. (1991). Some observations on a comparitive aerial photography interpretation of a landslipped area, Quarterly Journal of Engineering Geology 24, 249–265
Günther, A., (2003). SLOPEMAP: programs for automated mapping of geometrical and kinematical properties of hard rock hill slopes. Computers and Geoscience 865-875
Guzzetti, F., Cardinali, M., Reichenbach, P. (1994). The AVI project: a bibliographical and archive inventory of landslides and floods in Italy. Environmental Management 18 (4), 623-633.
Guzzetti, F. (2000). Landslide fatalities and the evaluation of landslide risk in Italy. Engineering Geology 58 (2), 89-107.
Haugerud, R.A., Harding, D.J., Johnson, S.Y., Harless, J.L., Weaver, C.S., Sherrod, B.L. (2003). High-resolution LiDAR topography of the Puget Lowland, Washington - A bonanza for earth science. GSA Today 13, 4-10.
IAEG-Commission on Landslides (1990). Suggested nomenclature for landslides. Bulletin of the International Association of Engineering Geology 41, 13-16..
IUGS-Working group on landslide (1995). A suggested method for describing the rate of movement of a landslide. Bulletin of the International Association of Engineering Geology 52, 75-78.
IUGS-Working group on landslide (2001). A suggested method for reporting landslide remedial measures. Bulletin of Engineering Geology and Environment 60, 69-74.
Kuriakose, S.L., Devkota, S., Rossiter,D.G. and Jetten, V.J. (2009). Prediction of soil depth using environmental variables in an anthropogenic landscape, a case study in the Western Ghats of Kerala, India. Catena, 79(1), 27-38.
Martha, T.R., Kerle, N., Jetten, V., van Westen, C.J. and Kumar, K.V. (2010) Characterising spectral, spatial and morphometric properties of landslides for semi - automatic detection using object - oriented methods. Geomorphology, 116 (1-2), 24-36
Metternicht, G., Hurni, L., Gogu, R. (2005). Remote sensing of landslides: An analysis of the potential contribution to geo-spatial systems for hazard assessment in mountainous environments. Remote Sensing of Environment 98 (2¬3), 284-303.
Nichol, J., Wong, M.S., 2005. Satellite remote sensing for detailed landslide inventories using change detection and image fusion. International Journal of Remote Sensing 26 (9), 1913-1926.
Pike, R.J., 2000. Geomorphometry - diversity in quantitative surface analysis. Progress in Physical Geography 24 (1), 1-20
Rosser, N.J., Petley, D.N., Lim, M., Dunning, S. A., Allison, R.J., (2005). Terrestrial laser scanning for monitoring the process of hard rock coastal cliff erosion. Quarterly Journal of Engineering Geology and Hydrogeology, 38(4), 363-375.
SafeLand deliverable 4.1, (2010). Review of Techniques for Landslide Detection, Fast Characterization, Rapid Mapping and Long-Term Monitoring. Edited for the SafeLand European project by Michoud C., Abellán A., Derron M.-H. and Jaboyedoff M. Available at http://www.safeland-fp7.eu
Schulz, W.H. (2004). Landslides mapped using LiDAR imagery, Seattle, Washington. U.S. Geological Survey Open-File Report 2004-1396.

Guidelines for landslide susceptibility, hazard and risk zoning
52
Singhroy, V., 2005. Remote sensing of landslides. In: Glade, T., Anderson, M., and Crozier, M.J., (Eds.), Landslide Hazard and Risk. John Wiley and Sons Ltd., West Sussex, England, pp. 469-492.
Soeters, R., Van Westen, C.J. (1996). Slope instability recognition, analysis and zonation. In: Turner, A.K., Schuster, R.L., (Eds.), Landslides, Investigation and Mitigation. Transportation Research Board, National Research Council, Special Report 247, National Academy Press, Washington D.C., U.S.A., pp. 129-177.
UNESCO-WP/WLI, (1993a). Multilingual Landslide Glossary. Bitech Publishers Ltd., Richmond, Canada, 34 pp.
UNESCO-WP/WLI, (1993b). A suggested method for describing the activity of a landslide. Bulletin of the International Association of Engineering Geology 47, 53-57.
UNESCO-WP/WLI, (1994). A suggested method for reporting landslide causes. Bulletin of the International Association of Engineering Geology 50, 71-74.
Van Beek, L.P.H., Van Asch, T.W.J. (2004). Regional assessment of the effects of land-use change and landslide hazard by means of physically based modeling. Natural Hazards 30 (3), 289-304
Van Den Eeckhaut, M., Poesen, J., Verstraeten, G., Vanacker, V., Nyssen, J., Moeyersons, J., Van Beek, L.P.H., Vandekerckhove, L., (2007). The use of LIDAR-derived images for mapping old landslides under forest. Earth surface processes and landforms 32, 754-769.
Xie, M., Tetsuro, E., Zhou, G., Mitani, Y., (2003). Geographic Information Systems based three-dimensional critical slope stability analysis and landslide hazard assessment. Journal of Geotechnical and Geoenvironmental Engineering 129 (12), 1109-1118
4.5 SUGGESTED METHODS FOR LANDSLIDE SUSCEPTIBILITY ASSESSMENT Landslide susceptibility assessment aims at subdividing the terrain in zones that have a different likelihood that landslides of a particular type may occur in future. Landslide susceptibility zoning involves the classification, area or volume (magnitude) and spatial distribution of existing and potential landslides in the study area. It may also include a description of the travel distance, velocity and intensity of the existing or potential landsliding. Landslide susceptibility zoning usually involves developing an inventory of landslides which have occurred in the past together with an assessment of the area with a potential to experience landsliding in the future, but with no assessment of the frequency (annual probability) of the occurrence of landslides. In some situations susceptibility zoning will need to be extended outside the study area to be zoned for hazard and risk to cover areas from which landslides may travel on to or regress into the area being zoned. It will generally be necessary to assess independently the propensity of the slopes to fail and areas onto which landslides from the source landslides may travel (Fell et al., 2008). Therefore this chapter is divided into two components. The first susceptibility component is the most frequently used, and deals with the modelling of potential initiation areas (initiation susceptibility), which can make use of a variety of different methods (inventory based, heuristic, statistical, deterministic). The resulting maps will then form the input as source areas in the modelling of potential run-out areas (runout susceptibility A landslide susceptibility map contains a subdivision of the terrain in zones (which may be individual pixels in a GIS-derived map, slope facets, homogeneous units, or administrative units) that have a different likelihood landslides of a particular type may occur. The likelihood may be indicated either qualitatively (as high, moderate low, and not susceptible) or quantitatively (e.g. as the density in number per square kilometres, area affected per square kilometre, Safety Factor or Probability of Failure). Landslide susceptibility assessment can be considered as the initial step towards a landslide hazard and risk assessment. But it can also be an end product by itself, which can be used in land use zoning, and environmental impact assessment. This is especially the case in small scale analysis or in situations where there is

Guidelines for landslide susceptibility, hazard and risk zoning
53
not sufficient information available on past landslide occurrences in order to assess the spatial, temporal and size probability of landslides. Landslide susceptibility maps should contain information on the type of landslides that might occur, on the expected sizes/volumes and on their spatial frequency. A landslide initiation susceptibility assessment may involve the following factors:
The location of past landslide events with a classification of their type and activity.
Whether the geological, topographical, geotechnical and climatic conditions are judged to be contributing to the possible occurrence of landslides.
The proportion of the area which may be affected by the landslides (for small scale landslides) or the number of landslides per square km in the inventory of historic landsliding (for rock falls and small landslides)
Landslide initiation susceptibility maps should include:
A topographic basis, with contourlines or hillshading as backdrop and with drainage network, roads, settlements etc.
Zones with different classes of susceptibility to landslide initiation for particular landslide types, indicated by different colours (e.g. using the traffic light colour scheme, ranging from green indicating very low susceptibility to red with very high susceptibility). If the susceptibility map is used as the basis for landuse planning, then the number of classes should be limited (e.g. to less than 5), otherwise the map becomes very difficult to interpret, and use. If the susceptibility map is to be used as the basis for runout susceptibility and for hazard and risk assessment, no direct classification is needed, and the original values can best be used.
A legend with explanation of the susceptibility classes, either qualitatively or including information on expected landslide densities. A separate description on the validation of susceptibility maps is essential.
Superimposed on the susceptibility map should be an inventory of historic landslides, which allows the user to compare the susceptibility classes with the actual historic landslides. There is a major difference in approaches for landslide susceptibility assessment depending on a number of aspects that are also interrelated: The objectives of the study. These could range from a prioritization of landslide
susceptibility areas over large territories, land use planning, restrictive zoning, design of risk reduction measures, Environmental Impact Assessment, Preparedness planning etc.
The scale of the study area (national, regional, local and site investigation). The scale of susceptibility assessment is closely related to the objective of the study.
The available data. This refers to the various types of input data indicated in the previous chapter. The most important limiting factor is the availability of landslide inventory maps, with associated information on time of occurrence, type, size, volume and activity.
The resources for data collection and time of study. This is closely related to the objective of the study, the scale of analysis and the available data. If given the objective of the study detailed analysis should be carried out and available data is limited, large investments for data collection are required.
The type of landslides and failure mechanisms. In general separate landslide susceptibility maps should be made for different landslide types, as the input into

Guidelines for landslide susceptibility, hazard and risk zoning
54
subsequent hazard and risk assessment. Even if the same type of landslides is caused by different failure mechanisms, these should be identified and analysed separately.
The homogeneity of the study area. For instance if geological or soil types are homogeneous over larger areas, it is possible to use even simple physically-based models over large areas.
Whether the aim is to predict reactivation of existing landslides or to predict areas with first time failures. The assessment of the susceptibility for reactivation of existing landslides has a much lower uncertainty as the location of the event is known, and the methods focus on the evaluation of the conditions under which given landslides could be reactivated. Most of the methods used for reactivation analysis are based on detailed landslide inventories and analysis of historical activity supported by physically-based models, and are applied at local or site investigation scales. The analysis of landslide susceptibility for new failures is prone to much higher uncertainty, and a wider variety of methods is normally applied.
The methods for landslide susceptibility assessment are usually based on two assumptions: That the past is a guide to the future, so that areas which have experienced landslides in
the past are likely to experience landslides in the future. Therefore the collection of detailed landslide inventories is of prime importance in any landslide susceptibility assessment.
Areas with similar environmental settings (as characterized by topography, geology, soil, geomorphology and landuse) as the areas which have experienced landslides in the past are also likely to experience landslides in the future.
4.5.1 Methods for susceptibility assessment related to landslide initiation Overviews and classification of methods for landslide initiation susceptibility assessment can be found in Soeters and Van Westen (1996), Carrara et al. (1999), Guzzetti et al. (1999), Aleotti and Chowdury (1999), Dai et al. (2002), Cascini et al. (2005), Chacon et al. (2006), Fell et al. (2008), Cascini (2008) and Dai et al (2008). The methods for landslide initiation susceptibility assessment are shown in Figure 3.. They are subdivided in qualitative ones (landslide inventory analysis, and knowledge driven methods) and quantitative ones (data driven and physically-based models). The inventory-based methods are also required as a first step for all other methods, as they form the most important input and are used for validating the resulting maps.

Guidelines for landslide susceptibility, hazard and risk zoning
55
Figure 3.3 Methods for landslide initiation susceptibility assessment.
There is a difference between susceptibility methods for areas focusing on landslide reactivation and areas where landslides might occur in locations where there have been no landslides before.
4.5.2 Landslide inventory analysis The most straightforward approach to landslide susceptibility assessment is a landslide inventory, giving the spatial distribution of landslides, represented either as points (on small scales) or as polygons (on large scales, with a legend explaining the type and activity. In areas that are characterized mainly by reactivated landslides this might be sufficient as a first level of information. Landslide inventory maps are the basis for most of the other landslide susceptibility assessment methods. They can, however, also be used as an elementary form of susceptibility map, because they display where in an area a particular type of slope movement has occurred. At national and regional scales the density of landslides (of different types) per administrative unit can be considered as an appropriate susceptibility map. Also density contour maps (isopleths maps) at such small scales can be a good solution. Temporal information should play an important role in landslide inventory maps. They should contain information on landslide occurrences over a longer period of time (e.g. over decades), and in case of slow moving or intermittent landslides, also on the landslide activity. Landslide activity should not be confused with the age of landslide occurrence. Landslide inventories are either continuous in time, or provide so-called event-based landslide inventories, which are inventories of landslides that happened as a result of a particular triggering event (rainfall event, earthquake). These are also referred to as multiple occurrences of landslide events (MORLE) by Crozier (2005). By correlating the density of landslides with the frequency of the trigger, it is possible to make a magnitude-frequency relation, required for hazard assessment. The landslide distribution can also be shown in the form of a density map within administrative units or to use counting circles for generating landslide density contours. This is applied only in national and regional scales. An overview of the methods and examples of references is given in Table 3..

Guidelines for landslide susceptibility, hazard and risk zoning
56
Table 3.7 Recommended methods for landslide inventory analysis
Approach References Landslide distribution maps based on image interpretation. Generation of event-based inventories or MORLE.
Wieczorek, 1984; Crozier, M.J. 2005
Landslide activity maps based on multi-temporal image interpretation
Keefer, 2002; Reid and Page, 2003
Generating inventories based on historical records
Guzzetti et al.,2000; Jaiswal and van Westen 2009
Landslide inventory based on radar interferometry
Squarzoni et al., 2003; Colesanti and Wasowski, 2006.
Representation of landslide inventory as density information, landslide isopleth maps
Coe et al., 2000; Bulut et al, 2000; Valadao et al., 2002
4.5.3 Knowledge driven methods In knowledge driven or heuristic methods expert opinion plays a decisive role. A landslide susceptibility map can be directly mapped in the field by expert geomorphologists, or made in the office as a derivative map of a geomorphological map. This method is used extensively as the basis for local susceptibility mapping for landuse zoning in many countries. The method is direct, as the expert interprets the susceptibility of the terrain directly in the field, based on the observed phenomena, and the geomorphological / geological setting. This method is subjective and depends largely on the experience and time involvement of the expert. However, when carried out by expert geomorphologists, such susceptibility maps may provide highly accurate results, as the susceptibility can be assessed for every locality separately without the need to incorporate a certain degree of simplification of causal relationships which is required for most of the other methods. In the direct method GIS is used basically only as a tool for entering the final map, without extensive modeling. Direct mapping can also be supported with other methods (e.g. inventory, statistical or physically-based modelling). Knowledge-driven methods can also be applied indirectly using a GIS, by combining a number of factor maps that are considered to be important for landslide occurrence. On the basis of his/her expert knowledge related to past landslide occurrences and their causal factors within a given area, an expert assigns a particular weight to certain combinations of factors. This can also be done by combining all relevant factors using a GIS and assigning the susceptibility class to each individual combination. Or it can be done by giving weights to the classes of the individual factor maps and weights to the maps themselves. The terrain conditions are summated according to these weights, leading to susceptibility values, which can be grouped into hazard classes. This method of qualitative map combination has become widely used in slope instability zonation. Several techniques can be used such as Boolean overlay, Fuzzy logic, multi-class overlay and Spatial Multi-Criteria Evaluation. The drawback of this approach is that the exact weighting of the various parameter maps is difficult. These factors might be very site specific and cannot be simply used in other areas. They should be based on extensive field knowledge and be assigned by real experts with sufficient field knowledge of the important factors. The methods are subjective, but the weights assigned to the factors are transparent and can be discussed among experts, and defended against end users/decision makers. The resulting classes of the susceptibility map (high, moderate, low and not susceptible) can be characterized by the landslide density within

Guidelines for landslide susceptibility, hazard and risk zoning
57
these classes, obtained by overlaying the susceptibility map with the landslide inventory. This should be an iterative procedure, in which the experts adjust the weights until the susceptibility map gives a satisfactory classification of the landslides, in which the majority of landslides should occur in the high susceptible zones. The heuristic methods are also applicable when no landslide inventories are available, although then the susceptibility classification cannot be verified and the resulting susceptibility classes cannot be characterized by a landslide density. These methods can be applied at all scales of analysis. It is the recommended method for a national scale. However, in regional and local scales they can also be applied and can be supported by other methods (e.g. statistical or physically-based modeling). Table 3. gives examples of the various knowledge driven methods. Table 3.8 Recommended methods for knowledge driven landslide susceptibility assessement Approach References Geomorphological mapping Kienholz, 1978; Rupke et al., 1988; Seijmonsbergen, 1992; Cardinali
et al, 2002 Direct mapping method Barredo et al., 2000; van Westen et al., 2000 Multi-class weighting method Malet et al., 2009; Mora and Vahrson, 1994 Spatial multi-criteria analysis Ayalew et al., 2005; Castellanos and Van Westen, 2007; Analytical hierarchy process (AHP) Yoshimatsu and Abe, 2005; Yalcin, 2008; Fuzzy logic approach Ercanoglu and Gokceoglu, 2001; Chung and Fabbri, 2001
4.5.4 Data-driven landslide susceptibility assessment methods In data-driven landslide susceptibility analysis, the combinations of factors that have led to landslides in the past are evaluated statistically and quantitative predictions are made for current landslide free areas with similar conditions. The methods assume that similar conditions that have lead to landslides in the past will do so in future. Susceptibility maps are mostly made for the present situation of the environmental factors, e.g. for the present state of landuse. If these aspects change, e.g. due to a land use change or construction of infrastructure, also the landslide susceptibility might change. The methods are called data-driven as the data of the past occurrences of landslides is used to obtain information on the relative importance of each of the factor maps and classes. Three main data-driven approaches are used: bivariate statistical analysis, multi-variate methods, and Artificial Neural Network analysis. In a bivariate statistical analysis, each factor map (slope, geology, land use etc.) is combined with the landslide distribution map, and weight values, based on landslide densities, are calculated for each parameter class (slope class, lithological unit, land use type, etc). Several statistical methods can be applied to calculate weight values, such as the information value method, weights of evidence modeling, Bayesian combination rules, certainty factors, the Dempster-Shafer method and fuzzy logic. Bivariate statistical methods are a good learning tool for the analyst to find out which factors or combination of factors plays a role in the initiation of landslides. It can be combined with heuristic methods and can also serve as the first step before multivariate statistical analysis is carried out. The method is mostly done on a grid level. Multivariate statistical models evaluate the combined relationship between a dependent variable (landslide occurrence) and a series of independent variables (landslide controlling factors). In this type of analysis all relevant factors are sampled either on a grid basis, or in (morphometric) units. For each of the sampling units also the presence or absence of landslides is determined. The resulting matrix is then analyzed using multiple regression, logistic regression or discriminant analysis. With these techniques, good results can be
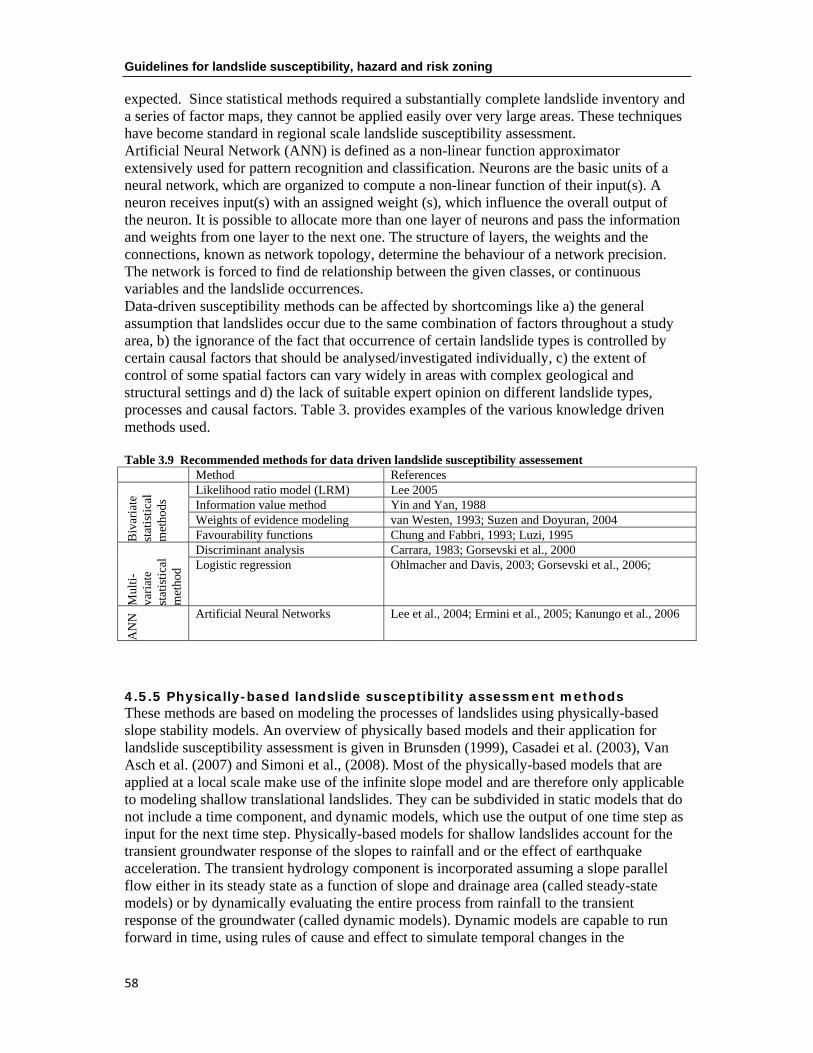
Guidelines for landslide susceptibility, hazard and risk zoning
58
expected. Since statistical methods required a substantially complete landslide inventory and a series of factor maps, they cannot be applied easily over very large areas. These techniques have become standard in regional scale landslide susceptibility assessment. Artificial Neural Network (ANN) is defined as a non-linear function approximator extensively used for pattern recognition and classification. Neurons are the basic units of a neural network, which are organized to compute a non-linear function of their input(s). A neuron receives input(s) with an assigned weight (s), which influence the overall output of the neuron. It is possible to allocate more than one layer of neurons and pass the information and weights from one layer to the next one. The structure of layers, the weights and the connections, known as network topology, determine the behaviour of a network precision. The network is forced to find de relationship between the given classes, or continuous variables and the landslide occurrences. Data-driven susceptibility methods can be affected by shortcomings like a) the general assumption that landslides occur due to the same combination of factors throughout a study area, b) the ignorance of the fact that occurrence of certain landslide types is controlled by certain causal factors that should be analysed/investigated individually, c) the extent of control of some spatial factors can vary widely in areas with complex geological and structural settings and d) the lack of suitable expert opinion on different landslide types, processes and causal factors. Table 3. provides examples of the various knowledge driven methods used. Table 3.9 Recommended methods for data driven landslide susceptibility assessement Method References
Biv
aria
te
stat
isti
cal
met
hods
Likelihood ratio model (LRM) Lee 2005 Information value method Yin and Yan, 1988Weights of evidence modeling van Westen, 1993; Suzen and Doyuran, 2004 Favourability functions Chung and Fabbri, 1993; Luzi, 1995
Mul
ti-
vari
ate
stat
isti
cal
met
hod
Discriminant analysis Carrara, 1983; Gorsevski et al., 2000 Logistic regression Ohlmacher and Davis, 2003; Gorsevski et al., 2006;
AN
N Artificial Neural Networks Lee et al., 2004; Ermini et al., 2005; Kanungo et al., 2006
4.5.5 Physically-based landslide susceptibility assessment methods These methods are based on modeling the processes of landslides using physically-based slope stability models. An overview of physically based models and their application for landslide susceptibility assessment is given in Brunsden (1999), Casadei et al. (2003), Van Asch et al. (2007) and Simoni et al., (2008). Most of the physically-based models that are applied at a local scale make use of the infinite slope model and are therefore only applicable to modeling shallow translational landslides. They can be subdivided in static models that do not include a time component, and dynamic models, which use the output of one time step as input for the next time step. Physically-based models for shallow landslides account for the transient groundwater response of the slopes to rainfall and or the effect of earthquake acceleration. The transient hydrology component is incorporated assuming a slope parallel flow either in its steady state as a function of slope and drainage area (called steady-state models) or by dynamically evaluating the entire process from rainfall to the transient response of the groundwater (called dynamic models). Dynamic models are capable to run forward in time, using rules of cause and effect to simulate temporal changes in the
Guidelines for landslide susceptibility, hazard and risk zoning
59
landscape. A dynamic landslide susceptibility model addresses the spatial and temporal variation of landslide initiation. They are therefore also applicable in the landslide hazard assessment (See next chapter). However, the resulting maps show the Safety Factor for each pixel for a given scenario. It is still complicated to determine the possible landlide size, although this is done by grouping pixels with the same low Safety Factos into potential landslide polygons. Physically-based models are also applicable to areas with incomplete landslide inventories. The parameters used in such models are most often measurable and are considered as state variables having a unique value for a given moment in time and space. Most physically-based models are dynamic in nature, implying that they run forward (or backward) in time constantly calculating the values of the state variables based on the equations incorporated. If implemented in a spatial frame work (a GIS model) such models are also able to calculate the changes in the values with time for every unit of analysis (pixel). The results of such models are more concrete and consistent than the heuristic and statistical models, given the white box approach of describing the underlying physical processes leading to the phenomena being modelled. They have a higher predictive capability and are the most suitable for quantitatively assessing the influence of individual parameters contributing to shallow landslide initiation. However, it is often more time consuming and resource intensive to derive the necessary data required for physically-based models. The parameterization of these models can be complicated, in particular the spatial distribution of soil depth, which plays a decisive role. The advantage of these models is that they are based on slope stability models, allowing the calculation of quantitative values of stability (safety factors). The main drawbacks of this method are the high degree of oversimplification and the need for large amounts of reliable input data. The methods are applicable only over larger areas only when the geomorphological and geological conditions are fairly homogeneous and the landslide types are simple. The methods generally require the use of groundwater simulation models. Stochastic methods are sometimes used for selection of input parameters. GIS-based analysis of earthquake induced landslide susceptibility includes three components which are commonly used together: pseudo-static slope stability analysis, models for the attenuation of ground shaking, and (adapted versions of the) Newmark's displacement method (e.g. Jibson et al. 1998). Apart from GIS-based models for slope stability assessment, there is also a range of detailed 2-D and 3-D models that normally are applied on cross sections or on single slopes (e.g. Slope/W, SLIDE, CLARA etc.). These require detailed information on geotechnical parameters, soil/rock layers, failure mechanisms, hydrological situation and seismic acceleration. Numerical modelling applications can be subdivided in continuum modeling methods (e.g. finite element, finite difference, with software such as FLAC3D, VISAGE) and discontinuum modeling (e.g. distinct element, discrete element, with software such as UDEC). Limit Equilibrium Methods do not allow the evaluation of stress and strain conditions in the slope and are incapable to reproduce the crucial role played by deformability in slope movements (Bromhead, 1996; Van Asch et al., 2007). Finite Elements Methods and Finite Difference Methods are able to handle material heterogeneity, non-linearity and boundary conditions, but due to their internal discretization they cannot simulate infinitely large domains and the computation time can be problematic. Boundary Element Methods require discretization at the boundaries of the solution domains only, which simplifies the input requirements, but they are impractical when more than one material must be taken into account. It is the most efficient technique for fracture propagation analysis. Distinct Element Methods represent a discontinuous medium as assemblages of blocks formed by connected fractures in the problem domain, and solve the equations of motion of these blocks through continuous detection and treatment of contacts between the blocks. Handling large displacements

Guidelines for landslide susceptibility, hazard and risk zoning
60
including fracture opening and complete detachments is therefore straightforward in these methods although they are less suitable to model plastic deformation. Hence, any numerical simulation will contain subjective judgements and be a compromise between conflicting detail of process descriptions and practical consideration. It is essential to define guidelines for the development of physically-based models that perform satisfactorily for a given problem (Van Asch et al., 2007).
Table 3.10 Recommended methods for physically-based landslide susceptibility assessment (location of the slope failure)
Type Method References
GIS-based limit equilbrium methods
Static infinite slope modeling (e.g. SINMAP, SHALSTAB)
Pack el al. 1998; Dietrich et al., 1995
Dynamic infinite slope modeling with rainfall trigger (e.g. TRIGRS, STARWARS +PROBSTAB
Baum et al, 2002; Van Beek, 2002; Casadei et al. 2003; Simonie t al., 2008
Earthquake induced infinite slope modeling (e.g. Newmark)
Jibson et al., 1998
Kinematic analysis for rockslopes
Stereonet plots, GIS based analysis of discontinuities (e.g. SLOPEMAP, DIPS )
Gunter, 2002;
2-D Limit equilibrium methods
2-D LEM with groundwater flow and stress analysis. E.g., SLOPE/W, SLIDE, GALENA, GSLOPE
GEO-Slope, 2011;
3-D Limit equilibrium methods
3-D slope stability analysis, e.g. CLARA-W, TSLOPE3, SVSLOPE
Hungr, 1992; Gilson et al, 2008
Numerical Modeling
Continuum modeling (e.g. finite element, finite difference) , FLAC3D, VISAGE
Hoek et al, 1993; Stead et al, 2001
Discontinuum modeling (e.g. distinct element, discrete element), e.g. UDEC
Hart, 1993; Stead et al., 2001
4.5.6 Selecting the best method of analysis Not all methods for landslide hazard zonation are equally applicable at each scale of analysis. Some require very detailed input data, which can only be collected for small areas at the expense of a lot of efforts and costs. Aspects that are relevant for the selection of the method of analysis are presented in

Guidelines for landslide susceptibility, hazard and risk zoning
61
Table 3..

Guidelines for landslide susceptibility, hazard and risk zoning
62
Table 3.11 Important aspects in the use of the main methods for landslide initiation susceptibility assessment. Important aspects Scales of analysis
National Regional Local Site
Inve
ntor
y m
etho
ds
Limited to knowing the spatial and temporal distribution. Can be carried out at all scales of analysis. Difficult to apply at small scales (it is quite time consuming to map landslide distribution over large areas, using image interpretation). Used in combination with a heuristic or statistical method at larger scales.
Yes, but difficult to obtain inventory for entire country
Yes, multi-temporal data should be obtained for a period as long as possible
No, but important data for validation of models
No, but important data for validation of models
Heu
rist
ic m
etho
ds
A dominant role for the expert opinion of the analyst. Can be used at all scales of analysis. Increasing detail of the input data, going from small to large scales. Highly subjective, depending on the skill and experience of the analyst, but may result in the best output results, since they do not lead to generalization.
Best method at this scale. Causal factors and triggering factors can be weighted
Best method at this scale. Separate maps are made for different types
Yes, but in combination with other methods
Yes, but in combination with other methods
Stat
isti
cal m
etho
ds
The relative importance of the causal factors for landslides is analyzed using bivariate or multivariate statistics. These methods are objective, since the weights for the different factor maps contributing to slope instability are determined using a fixed method. They may lead to generalizations in those cases where the interplay of causal factors is very complex
No, because it is mostly not possible to get a good landslide inventory
Yes, if sufficient data on landslide locations and causal factors can be obtained
Best method for this scale. Correlating past landslides with combination of factors
No, not enough spatial variability of input factors.
Phys
ical
ly-b
ased
mod
ellin
g
The hazard is determined using slope stability models, resulting in the calculation of factors of safety and failure probabilities. Provides the best quantitative information on landslide hazard. Can be used directly in the design of engineering works, or the quantification of risk. Requires a large amount of detailed input data, derived from laboratory tests and field measurements. Suitable only over small areas at large scales.
No, too difficult to parameterize the models
No, too difficult to parameterize the models, unless the area is very homogeneous.
Yes, but only if the area if fairly homogeneous
Best method for this scale. Different approaches can be selected. See table 6-4
Therefore a selection has to be made of the most useful types of analysis for each of the mapping scales, maintaining an adequate cost / benefit ratio. Table 4-5 gives an overview of the methods for landslide hazard analysis and recommendations for their use at the four scales.

Guidelines for landslide susceptibility, hazard and risk zoning
63
4.6 FROM SUSCEPTIBILITY TO HAZARD Conversion of landslide susceptibility maps into landslide hazard maps requires estimates of spatial, temporal and magnitude probabilities of landslides (Guzzetti et al., 1999; Glade et al., 2005; Fell et al., 2008; Van Asch et al., 2007; Corominas and Moya, 2008; van Westen et al., 2008). The difference between susceptibility and hazard is the inclusion of probability (temporal, spatial and size probability). Figure 3. gives a schematic representation of how these 3 probabilities are derived and combined in a hazard assessment (Jaiswal et al., 2011). The spatial probability required for hazard assessment is not the same as the landslide susceptibility. Although some methods (e.g. multivariate statistical methods) give the output in terms of probability, this is not the same as the spatial probability of occurrence of landslides given a certain triggering event. In most of the methods that convert susceptibility to hazards, triggering events and the landslide pattern caused, play a major role. Hence the importance of obtaining event-based landslide inventories or MORLES, for which one can determine the temporal probability of the trigger, the spatial probability of landslide occurring within the various susceptibility classes, and the size probability. In this approach, which is mostly carried out at regional and local scales, the susceptibility map is basically only used to subdivide the terrain in zones with equal level of susceptibility.
Figure 3.4 Parameters and process adopted for the quantitative assessment of landslide
hazard (Jaiswal et al., 2011)

Guidelines for landslide susceptibility, hazard and risk zoning
64
Size probability is the probability that the landslide will be of a particular minimum size. The quantitative estimation of the probability of occurrence of landslides of a given size is a key issue for any landslide hazard analysis (Malamud et al., 2004; Fell et al., 2008). Whereas the landslide susceptibility maps indicate classes with different levels of susceptibility to landslide occurrence, the translation in the expected number/area of landslides for given return periods, is what makes these useful for subsequent hazard and risk assessment. Magnitude probabilities of landslides can be estimated after performing the magnitude-frequency analysis of landslide inventory data. For estimating landslide magnitudes, the area of landslide (m2) can be considered as a proxy (Guzzetti et al., 2005). The frequency-size analysis of landslide area can be carried out by calculating the probability density function of landslide area using the maximum likelihood estimation method assuming two standard distribution functions: (i) the Inverse-Gamma distribution function (Malamud et al., 2004), and (ii) the Double-Pareto distribution function (Stark and Hovius, 2001). See also chapter 7 for more information on this topic. Temporal probability can be established using different methods. A relation between triggering events (rainfall or earthquakes) and landslide occurrences is needed in order to be able to assess the temporal probability. Temporal probability assessment of landslides is either done using rainfall threshold estimation, through the use of multi-temporal data sets in statistical modeling, or through dynamic modeling. Rainfall threshold estimation is mostly done using antecedent rainfall analysis, for which the availability of a sufficient number of landslide occurrence dates is essential. If distribution maps are available of landslides that have been generated during the same triggering event, a useful approach is to derive susceptibility maps using statistical or heuristic methods, and link the resulting classes to the temporal probability of the triggering events. The most optimal method for estimating both temporal and spatial probability is dynamic modeling, where changes in hydrological conditions are modeled using daily (or larger) time steps based on rainfall data. However, more emphasis should be given to the collection of reliable input maps, focusing on soil types and soil thickness. The methods for hazard analysis should be carried out for different landslide types and volumes, as these are required for the estimated damage potential. Landslide hazard is both related to landslide initiation, as well as to landslide deposition, and therefore also landslide run-out analysis should be included on a routine basis.
4.6.1 References Aleotti, P. and Chowdury, R. 1999. Landslide hazard assessment: summary review and new perspectives. Bull.
Eng. Geol. Env. (1999): 21-44, pp 21- 44 Ayalew L, Yamagishi H, Marui H, Kanno T (2005) Landslide in Sado Island of Japan: Part II. GIS-based
susceptibility mapping with comparision of results from two methods and verifications. Eng Geol 81:432–445.
Baum, R.L., Savage, W.Z., and Godt, J.W. (2002). TRIGRS - A Fortran program for transient rainfall infiltration and grid based regional slope stability analysis, Open file report 02-424: Colorado, USA, U.S. Department of the Interior and U.S. Geological Survey
Bromhead, E.N. (1996). Slope stability modeling : an overview. In : Landslide recognition. Wiley & Sons, Chichester, 231-235.
Brunsden, D. (1999). Some geomorphological considerations for the future development of landslide models: Geomorphology. 30(1-2), p. 13-24.
Bulut F, Boynukalin S, Tarhan F, Ataoglu E (2000) Reliability of isopleth maps. Bull Eng Geol Environ 58:95–98
Carrara, A. (1983) Multivariate models for landslide hazard evaluation. Mathematical Geology, 15 (3):403- 426 Carrara A.; Guzzetti F.; Cardinali M.; Reichenbach P. (1999). Use of GIS technology in the prediction and
monitoring of landslide hazard, Natural Hazards, Volume 20, Issue 2-3, 1999, Pages 117-135

Guidelines for landslide susceptibility, hazard and risk zoning
65
Cardinali M, Reichenbach P, Guzzetti F, Ardizzone F, Antonini G, Galli M, Cacciano M, Castellani M, Salvati P (2002) A geomorphological approach to the estimation of landslide hazards and risks in Umbria, Central Italy. Nat Hazards Earth Syst Sci 2:57–72
Casadei, M., Dietrich, W.E., and Miller, N.L. ( 2003). Testing a model for predicting the timing and location of shallow landslide initiation on soil mantled landscapes: Earth Surface Processes and Landforms. 28(9), p. 925-950.
Cascini, L., Bonnard, Ch., Corominas, J., Jibson, R., Montero-Olarte, J., 2005. Landslide hazard and risk zoning for urban planning and development. In: Hungr, O., Fell, R., Couture, R., Eberthardt, E. (Eds.), Landslide Risk Management. Taylor and Francis, London, pp. 199–235.
Cascini, L (2008) Applicability of landslide susceptibility and hazard zoning at different scales. Engineering Geology, Volume 102, Issue 3-4, Pages 164-177
Castellanos, EA, Van Westen CJ (2007) Qualitative landslide susceptibility assessment by multicriteria analysis: a case study from San Antonio del Sur, Guantanamo, Cuba. Geomorphology 94(3–4):453–466.
Chacon J, Irigaray C, Fernandez T, El Hamdouni R (2006) Engineering geology maps: landslides and geographical information systems. Bull Eng Geol Environ 65:341–411.
Chung CF, Fabbri AG (1993) Representation of geoscience data for information integration. J Non-Renewable Resour 2(2):122–139
Chung CF, Fabbri AG (2001) Prediction models for landslide hazard using fuzzi set approach. In: Marchetti M, Rivas V (eds) Geomorphology and environmental impact assessment. A.A. Balkema, Rotterdam, pp 31–47
Coe, J.A., Michael J.A., Crovelli, R.A., Savage, W.A. (2000) Preliminary map showing landslides densities, mean recurrence intervals, and exceedance probabilities as determined from historic records, Seattle, Washington. USGS Open-File report 00-303
Colesanti, C., Wasowski, J. (2006). Investigating landslides with space-borne Synthetic Aperture Radar (SAR) interferometry. Engineering Geology 88 (3-4), 173-199.
Corominas, J. and Moya, 2008. A review of assessing landslide frequency for hazard zoning purposes. Engineering geology 102, 193-213
Crozier, M.J. (2005). Multiple occurrence regional landslide events in New Zealand: hazard management issues. Landslides,2: 247-256
Dai, F.C., Lee, C.F. and Ngai, Y.Y. (2008). Landslide risk assessment and management: an overview . Engineering Geology, 64 (1), 65-87
Dietrich, W.E., Reiss, R., Hsu, M.-L., and Montgomery, D.R., (1995). A process-based model for colluvial soil depth and shallow landsliding using digital elevation data: Hydrological Processes. 9, p. 383-400
Dixon, N., and Brook, E. (2007). Impact of predicted climate change on landslide reactivation: case study of Mam Tor, UK. Landslides, 4, 137-147
Ercanoglu, M. and Gokceolglu, C. (2001). Assessment of landslide susceptibility for a landslide-prone area (north of Yenice, NW Turkey) by fuzzy approach. Environmental Geology 41 :720-730.
Ermini L, Catani F, Casagli N (2005) Artificial neural networks applied to landslide susceptibility assessment. Geomorphology 66:327–343
Fell, R., Corominas, J., Bonnard, C., Cascini, L., Leroi, E., Savage, W.Z., (2008). Guidelines for landslide susceptibility, hazard and risk zoning for land use planning. Engineering Geology 102, 85-98.
Geo-slope (2011). Slope/W.. Geo-Slope International ltd. Gagary, Canada. www.geo-slope.com Gilson Gitirana Jr., Marcos A. Santos, Murray Fredlund, (2008). Three-Dimensional Analysis of the Lodalen
Landslide, GeoCongress 2008, March 9 - 12, 2008, New Orleans, LA, USA Glade T., Anderson M. & Crozier M.J. (Eds) (2005): Landslide hazard and risk.- Wiley. 803 p Gorsevski, P.V., Gessler, P., and Foltz, R.B. (2000). Spatial prediction of landslide hazard using discriminant
analysis and GIS. GIS in the Rockies 2000 Conference and Workshop: applications for the 21st Century, Denver, Colorado, September 25 - 27, 2000
Günther, A., (2003). SLOPEMAP: programs for automated mapping of geometrical and kinematical properties of hard rock hill slopes. Computers and Geoscience 865-875
Guzzetti, F., Carrara, A., Cardinali, M. and Reichenbach, P., (1999). Landslide hazard evaluation: a review of current techniques and their application in a multi-scale study, Central Italy. Geomorphology, 31(1-4): 181-216.
Guzzetti F., Cardinali M., Reichenbach P. and Carrara A., (2000). Comparing landslide maps: A case study in the upper Tiber River Basin, central Italy. Environmental Management, 25:3, 2000, 247-363.
Hart, R.D (1993). An introduction to distic element modeling for rock engineering. In: Hudson (ed.) comprehensive Rock engineering
Hoek, E., Grabinsky, M.W., and Diederichs (1993). Numerical modeling for underground excavations. Transactions of the Institution of Mining and Metallurgy – Section A 100: A22-A30.

Guidelines for landslide susceptibility, hazard and risk zoning
66
Jaiswal P., van Westen C.J. (2009). Estimating temporal probability for landslide initiation along transportation routes based on rainfall thresholds. Geomorphology 112, 96-105.
Jaiswal P., van Westen, C.J. and Jetten, V. (2011). Quantitative assessment of landslide hazard along transportation lines using historical records. Landslides (in press).
Jibson, R.W., Harp, E. L. and Michael, J.A..(1998). A Method for Producing Digital Probabilistic Seismic Landslide Hazard Maps: An Example from the Los Angeles, California, Area. US Geological Survey Open File Report 98-113
Kanungo, D.P., Arora, M.K., Sarkar, S. and Gupta, R.P., (2006). A comparative study of conventional, ANN black box, fuzzy and combined neural and fuzzy weighting procedures for landslide susceptibility zonation in Darjeeling Himalayas. Engineering Geology, 85(3-4): 347-366.
Keefer, D.K. (2002). Investigating landslides caused by earthquakes – a historical review. Surveys in Geophysics 23: 473–510
Kienholz H (1978) Maps of geomorphology and natural hazard of Grindewald, Switzerland, scale 1:10,000. Arctic Alpine Res 10(2):169–184
Lee, S., Ryu, J.-H., Won, J.-S. and Park, H.-J., (2004). Determination and application of the weights for landslide susceptibility mapping using an artificial neural network. Engineering Geology, 71(3-4): 289-302.
Lee S (2005) Application of logistic regression model and its validation for landslide susceptibility mapping using GIS and remote sensing data. Int J Remote Sens 26:1477–1491.
Luzi L (1995) Application of favourability modelling to zoning of landslide hazard in the Fabriano Area, Central Italy. In: Proceedings of the first joint European conference and exhibition on geographical information, The Hague, Netherlands, pp 398–402
Malamud, B.D., Turcotte, D.L., Guzzetti, F., Reichenbach, P., 2004. Landslide inventories and their statistical properties. Earth Surface Processes and Landforms 29, 687-711.
Malet, J.P., Thiery, Y, Hervás, J., Günther, A., Puissant, A, Grandjean, G. (2009). Landslide susceptibility mapping at 1:1M scale over France: exploratory results with a heuristic model. Proc. Int. Conference on Landslide Processes: from Geomorphologic Mapping to Dynamic Modelling. A tribute to Prof. Dr. Theo van Asch, 6 -7 February 2009. Strasbourg, France.
Mora S, Vahrson G (1994) Macrozonation methodology for landslide hazard determination. Bull Assoc Eng Geol XXXI(1):49–58
Ohlmacher CG, Davis CJ (2003) Using multiple logistic regression and GIS technology to predict landslide hazard in northeast Kansas, USA. Eng Geol 69 (3-4): 331–343
Pack, R.T., Tarboton, D.G., and Goodwin, C.N., (1998). The SINMAP Approach to Terrain Stability Mapping, 8th Congress of the International Association of Engineering Geology: Vancouver, British Columbia, Canada, International Association of Engineering.
Reid, L.M. & Page, M.J. (2003). Magnitude and frequency of landsliding in a large New Zealand catchment. Geomorphology, 49: 71-88
Rupke, J., Cammeraat, E., Seijmonsbergen, A.C. and van Westen, C.J. (1988) Engineering geomorphology of the Widentobel catchment, Appenzell and Sankt Gallen, Switzerland : a geomorphological inventory system applied to geotechnical appraisal of slope stability. In: Engineering geology, 26 (1988)1, pp. 33-68.
Seijmonsbergen , A.C. , 1992. Geomorphological evolution of an alpine area and its application to geotechnical and natural hazard appraisal in the NW. Rätikon Mountains and S. Walgau (Vorarlberg, Austria), including map series at 1:10,000 scale. PhD-thesis, Faculty of Environmental Sciences, Department of Physical Geography, University of Amsterdam. 109 pp. ISBN: 90-6787-021-8.
Simoni, S., Zanotti, F., Bertoldi, G., and Rigon, R., (2008). Modelling the probability of occurrence of shallow landslides and channelized debris flows using GEOtop-FS: Hydrological Processes. 22(4), p. 532-545.
Soeters, R., Van Westen, C.J., 1996. Slope instability recognition, analysis and zonation. In: Turner, A.K., Schuster, R.L., (Eds.), Landslides, Investigation and Mitigation.
Suzen ML, Doyuran V (2004) Data driven bivariate landslide susceptibility assessment using geographical information systems: a method and application to Asarsuyu catchment, Turkey. Eng Geol 71:303–321.
Squarzoni, C., Delacourt, C., Allemand, P., 2003. Nine years of spatial and temporal evolution of the La Vallette landslide observed by SAR interferometry.. Engineering Geology 68 (1_2), 53_66.
Stark, C., P., Hovius, N., 2001. The characterisation of landslide size distributions. Geophysical Research Letters 28, 1091-1094.
Stead, D., Eberhardt, E., Coggan, J., and Benko, B. (2001). Advanced Numerical Techniques In Rock Slope Stability Analysis – Applications And Limitations. LANDSLIDES – Causes, Impacts and Countermeasures, 17-21 June 2001, Davos, Switzerland, 615-624
Valadao P, Gaspar JL, Queiroz G, Ferreira T (2002) Landslides density map of S. Miguel Island, Azores archipelago. Nat Hazard Earth Syst Sci 2:51–56

Guidelines for landslide susceptibility, hazard and risk zoning
67
Van Asch, T.W.J., Malet, J.P., Van Beek, L.P.H. and Amitrato, D. (2007) Techniques, issues and advances in numerical modelling of landslide hazard. Bull. Soc. géol. Fr., 2007, 178 (2), 65-88
van Beek, L.P.H. (2002). Assessment of the influence of changes in Landuse and Climate on Landslide Activity in a Mediterranean Environment [PhD thesis]: Utrecht, The Netherlands, University of Utrecht.
Van Westen, C. J.: 1993, Application of Geographic Information Systems to Landslide Hazard Zonation, Ph-D Dissertation Technical University Delft. ITC-Publication Number 15, ITC, Enschede, The Netherlands, 245 pp.
Van Westen, C.J., Soeters, R. and Sijmons, K. (2000) Digital geomorphological landslide hazard mapping of the Alpago area, Italy. In: International journal of applied earth observation and geoinformation : JAG, 2 (2000)1, pp. 51-60.
Van Westen, C.J., Castellanos Abella, E.A. and Sekhar, L.K. (2008) Spatial data for landslide susceptibility, hazards and vulnerability assessment : an overview. In: Engineering geology, 102 (2008)3-4, pp. 112-131
Wieczorek, G.F. ( 1984). Preparing a detailed landslide-inventory map for hazard evaluation and reduction. Bulletin of the Association of Engineering Geologists 21 (3), 337– 342
Yalcın A (2008) GIS-based landslide susceptibility mapping using analytical hierarchy process and bivariate statistics in Ardesen (Turkey): comparisons of results and confirmations. Catena 1:1–12.
Yin, K. J. and Yan, T. Z.: 1988, Statistical prediction model for slope instability of metamorphosed rocks, Proceedings 5th International Symposium on Landslides, Lausanne, Switserland, Vol. 2, 1269-1272.
Yoshimatsu, H. and Abe, S. (2005). A review of landslide hazards in Japan and ssessment of their susceptibility using an analytical hierarchic process (AHP) method. Landslides DOI: 10.1007/s10346-005-0031-y

Guidelines for landslide susceptibility, hazard and risk zoning
68
5. Annex 1: Glossary of terms The terminology used in this deliverable follows that proposed by D.8.1 with three additions (exposure, magnitude and residual risk), based on the following references:
Fell,R., Corominas, J., Bonnard, C., Cascini, L., Leroi, E., Savage, W.Z., and on behalf of the JTC-1 Joint Technical Committee on Landslides and Engineered Slopes (2008): Guidelines for landslide susceptibility, hazard and risk zoning for land use planning. Engineering Geology, Vol. 102, Issues 3-4, 1 Dec., pp 85-98. DOI:10.1016/j.enggeo.2008.03.022
Technical Committee 32 (Engineering Practice of Risk Assessment and Management) of the International Society of Soil Mechanics and Geotechnical Engineering (ISSMGE): Risk assessment – Glossary of terms. http://www.engmath.dal.ca/tc32/2004Glossary_Draft1.pdf
UN-ISDR, 2004. Terminology of disaster risk reduction. United Nationas, International Strategy for Disaster Reduction, Geneva, Switzerland http://www.unisdr.org/eng/library/lib-terminology-eng%20home.htm
Definitions of the main terms are: Annual Exceedance Probability (AEP) – The estimated probability that an event of specified magnitude will be exceeded in any year. Consequence – The outcomes or potential outcomes arising from the occurrence of a landslide expressed qualitatively or quantitatively, in terms of loss, disadvantage or gain, damage, injury or loss of life. Danger – The natural phenomenon that could lead to damage, described in terms of its geometry, mechanical and other characteristics. The danger can be an existing one (such as a creeping slope) or a potential one (such as a rock fall). The characterisation of a danger does not include any forecasting. Elements at risk – The population, buildings and engineering works, economic activities, public services utilities, infrastructure and environmental features in the area potentially affected by landslides. Environmental risk – (a) The potential for an adverse effect on the natural system (environment). (b) the probability of suffering damage because of exposure to some environmental circumstance. The latter acception will not be used in this document. Exposure – Exposure is the spatial overlay of a hazard footprint and (set of) elements at risk.People, property, systems, or other elements present in hazard zones that are thereby subject to potential losses(UNISDR,2009). Frequency – A measure of likelihood expressed as the number of occurrences of an event in a given time. See also Likelihood and Probability. Hazard – A condition with the potential for causing an undesirable consequence. The description of landslide hazard should include the location, volume (or area), classification and velocity of the

Guidelines for landslide susceptibility, hazard and risk zoning
69
potential landslides and any resultant detached material, and the probability of their occurrence within a given period of time.
Hazard zoning – The subdivision of the terrain in zones that are characterized by the temporal probability of occurrence of landslides of a particular size and volume, within a given period of time. Landslide hazard maps should indicate both the zones where landslides may occur as well as the runout zones. A complete quantitative landslide hazard assessment includes:
spatial probability: the probability that a given area is hit by a landslide temporal probability: the probability that a given triggering event will cause
landslides size/volume probability: probability that the slide has a given size/volume runout probability: probability that the slide will reach a certain distance downslope
Individual risk to life – The risk of fatality or injury to any identifiable (named) individual who lives within the zone impacted by the landslide; or who follows a particular pattern of life that might subject him or her to the consequences of the landslide. Landslide inventory – The collection of landslide features in a certain area for a certain period, preferably in digital form with spatial information related to the location (as points or polygons) combined with attribute information. These attributes should ideally contain information on the type of landslide, date of occurrence or relative age, size and/or volume, current activity, and causes. Landslide inventories are either continuous in time, or provide so-called event-based landslide inventories, which are inventories of landslides that happened as a result of a particular triggering event (rainfall, earthquake). Landslide activity – The stage of development of a landslide; pre-failure when the slope is strained throughout but is essentially intact; failure characterized by the formation of a continuous surface of rupture; post-failure which includes movement from just after failure to when it essentially stops; and reactivation when the slope slides along one or several pre-existing surfaces of rupture. Reactivation may be occasional (e.g. seasonal) or continuous (in which case the slide is “active”).
Landslide hazard map - The subdivision of the terrain in zones that are characterized by the temporal probability of occurrence of landslides of a particular size and volume, within a given period of time. Landslide hazard maps should indicate both the zones where landslides may occur as well as the runout zones. A complete quantitative landslide hazard assessment includes:
Spatial probability: the probability that a given area is hit by a landslide. Temporal probability: the probability that a given triggering event will cause
landslides Volume/intensity probability: probability that the slide has a given volume/intensity Runout probability: probability that the slide will reach a certain distance downslope
Landslide intensity – A set of spatially distributed parameters related to the destructive power of a landslide. The parameters may be described quantitatively or qualitatively and may include maximum movement velocity, total displacement, differential displacement, depth of the moving mass, peak discharge per unit width, kinetic energy per unit area. Landslide magnitude – The measure of the landslide size. It may be quantitatively described by its volume or, indirectly by its area. The latter descriptors may refer to the landslide scar, the landslide deposit or both
Guidelines for landslide susceptibility, hazard and risk zoning
70
Landslide probablity – In the framework of landslide hazard the following types of probability are of importance:
spatial probability: the probability that a given area is hit by a landslide temporal probability: the probability that a given triggering event will cause
landslides size/volume probability: probability that the slide has a given size/volume runout probability: probability that the slide will reach a certain distance downslope
Landslide risk map - The subdivision of the terrain in zones that are characterized by different probabilities of losses (physical, human, economic, environmental) that might occur due to landslides of a given type within a given period of time. The risk may be indicated either qualitatively (as high, moderate, low and no risk) or quantitatively (in numbers or economic values). Risk is quantitatively estimated by the product of probability x consequences. It is usually calculated as:
On annual basis: i.e. the expected losses in a particular area being struck by a landslide of a given magnitude (intensity) in a given year.
As a recurrence interval, i.e. the expected losses in a particular area being struck by the 100-year landslide event or
the cumulative losses during a given time interval due to landslides with different return periods
Landslide susceptibility – A quantitative or qualitative assessment of the classification, volume (or area) and spatial distribution of landslides which exist or potentially may occur in an area. Susceptibility may also include a description of the velocity and intensity of the existing or potential landsliding.
Landslide susceptibility map – A map showing the subdivision of the terrain in zones that have a different likelihood that landslides of a type may occur. The likelihood may be indicated either qualitatively (as high, moderate low, and not susceptible) or quantitatively (e.g. as the density in number per square kilometres, or area affected per square kilometre). Landslide susceptibility maps should indicate both the zones where landslides may occur as well as the runout zones. Likelihood – Used as a qualitative description of probability or frequency. Probability – A measure of the degree of certainty. This measure has a value between zero (impossibility) and 1.0 (certainty). It is an estimate of the likelihood of the magnitude of the uncertain quantity, or the likelihood of the occurrence of the uncertain future event. There are two main interpretations:
Statistical-frequency or fraction – The outcome of a repetitive experiment of some kind like flipping coins. It includes also the idea of population variability. Such a number is called an “objective” or relative frequentist probability because it exists in the real world and is in principle measurable by doing the experiment.
Subjective probability (degree of belief) – Quantified measure of belief, judgement, or confidence in the likelihood of a outcome, obtained by considering all available information honestly, fairly, and with a minimum of bias. Subjective probability is affected by the state of understanding of a process, judgement regarding an evaluation, or the quality and quantity of information. It may change over time as the state of knowledge changes.
Guidelines for landslide susceptibility, hazard and risk zoning
71
Qualitative risk analysis – An analysis which uses word form, descriptive or numeric rating scales to describe the magnitude of potential consequences and the likelihood that those consequences will occur. Quantitative risk analysis – An analysis based on numerical values of the probability, vulnerability and consequences, and resulting in a numerical value of the risk. Residual risk – the degree of existing risk given the presence of both stabilization and protection measures. Risk – A measure of the probability and severity of an adverse effect to health, property or the environment. Risk is often estimated by the product of probability × consequences. However, a more general interpretation of risk involves a comparison of the probability and consequences in a non-product form. Risk analysis – The use of available information to estimate the risk to individuals, population, property, or the environment, from hazards. Risk analyses generally contain the following steps: Scope definition, hazard identification, vulnerability evaluation and risk estimation. Risk assessment – The process of risk analysis and risk evaluation. In some communities (for instance those dealing with flood) risk assessment differs from risk evaluation by the fact that it includes subjective aspects such as risk perception. Risk control or risk treatment – The process of decision making for managing risk, and the implementation or enforcement of risk mitigation measures and the reevaluation of its effectiveness from time to time, using the results of risk assessment as one input. Risk estimation – The process used to produce a measure of the level of health, property, or environmental risks being analysed. Risk estimation contains the following steps: frequency analysis, consequence analysis, and their integration. Risk evaluation – The stage at which values and judgements enter the decision process, explicitly or implicitly, by including consideration of the importance of the estimated risks and the associated social, environmental, and economic consequences, in order to identify a range of alternatives for managing the risks. Risk management – The complete process of risk assessment and risk control (or risk treatment).
Risk perception – The way how people/communities/authorities judge the severity of the risk, based on their personal situation, social, political, cultural and religious background, economic level, their level of awareness, the information they have received regarding the risk, and the way they rate the risk in relation with other problems. Societal risk – The risk of multiple fatalities or injuries in society as a whole: one where society would have to carry the burden of a landslide causing a number of deaths, injuries, financial, environmental, and other losses. Susceptibility – see Landslide susceptibility. Temporal–spatial probability of the element at risk – The probability that the element at risk is in the area affected by the landsliding, at the time of the landslide. It is the quantitative expression of the exposure.

Guidelines for landslide susceptibility, hazard and risk zoning
72
Tolerable risk – A risk within a range that society can live with so as to secure certain net benefits. It is a range of risk regarded as non-negligible and needing to be kept under review and reduced further if possible. Vulnerability – The degree of loss to a given element or set of elements exposed to the occurrence of a landslide of a given magnitude/intensity. It is expressed on a scale of 0 (no loss) to 1 (total loss). For property, the loss will be the value of the damage relative to the value of the property; for persons, it will be the probability that a particular life (the element at risk) will be lost, given the person(s) is affected by the landslide. Vulnerability could also refer to the propensity to loss (or the probability of loss), and not the degree of loss. Zoning – The division of land into homogeneous areas or domains and their ranking according to degrees of actual or potential landslide susceptibility, hazard or risk. References Cruden, D.M., Varnes, D.J. 1996. Landslide Types and Processes, in Landslides. Investigation and Mitigation,
Editors AK Turner. and RL Schuster. Special Report 247, Transport Research Board, National Research Council, Washington D.C.
Dikau, R, Brunsden, D, Schrott, L., Ibsen, M.L. 1996. Landslide Recognition. Wiley,Chichester. Hutchinson, J.N. 1988. Morphological and geotechnical parameters of landslides in relation to geology and
hydrogeology. In Ch. Bonnard (Ed.): Landslides. Proceedings 5th International Conference on Landslides. Lausanne. Vol. 1: 3-35
IAEG 1990. Suggested nomenclature for landslides. International Association of Engineering Geology Commission on Landslides,, Bulletin IAEG, No. 41,.13-16.
ISDR 2009. Terminology on Disaster Risk Reduction. http://www.unisdr.org/eng/library/lib-terminology-eng.htm
Varnes, D.J. 1978. Slope Movement Types and Processes. In Special Report 176: Landslides: Analysis and Control , editors R.L. Schuster and R.J. Krizek, TRB, National Research Council, Washington, D.C.,.11-33.