cywr evaluation report v1.2 - department of social ... · presented in this document is provided...
TRANSCRIPT

Cape York Welfare Reform Evaluation
2012

With the exception of the Commonwealth Coat of Arms and where otherwise noted all material presented in this document is provided under a Creative Commons Attribution 3.0 Australia (http://creativecommons.org/licenses/by/3.0/au/) licence.
The details of the relevant licence conditions are available on the Creative Commons website (accessible using the links provided) as is the full legal code for the CC BY 3.0 AU licence (http://creativecommons.org/licenses/by/3.0/au/legalcode).
The document must be attributed as Cape York Welfare Reform Evaluation.
ISBN PDF 978-1-921975-81-3 Doc 978-1-921975-98-1 Print 978-1-921975-80-6

Foreword
iii
Foreword Cape York Welfare Reform (CYWR) is a package of policy reform designed to address the deterioration of social and economic conditions in Cape York Indigenous communities that has occurred over recent years. The CYWR is being trialled in the four Cape York communities of Aurukun, Coen, Hope Vale and Mossman Gorge. While implementation began in 2008, the development of CYWR began some years before. The policy design ideas were set out in Cape York Institute’s 2007 report From hand out to hand up. The evaluation of the CYWR trial was identified as an essential part of the design. The CYWR combines initiatives under the four streams of Social Responsibility, Education, Economic Opportunity and Housing, based in part on theories of change emerging from social psychology, which set out to produce change in social norms and behaviour.
This report represents the final evaluation of CYWR. The framework for the evaluation was developed in 2008 by consultants Courage Partners in conjunction with the partners to the reforms: the Australian and Queensland governments and the Cape York Institute. The central questions identified in the evaluation framework are whether the trial has been implemented as agreed, whether social norms and behaviours are changing as intended, and whether governance and service delivery have supported the intended change.
The initial stage of the evaluation was an implementation review of a key part of the reforms, the Family Responsibilities Commission (FRC), conducted in 2009 and released in 2010. Planning for the final evaluation covering progress and outcomes analysis occurred in 2010 and early 2011. This was led by FaHCSIA on behalf of the CYWR partners and included the partners in all decisions. Fieldwork, extensive data collation and data analysis for the final evaluation was developed and conducted during 2011 and 2012. This evaluation report was finalised in 2012.
The diverse nature of over 15 projects, which make up the reform package, together with the challenges of measuring social change, meant that a broad range of research methods was required. This includes surveys with community members and service providers, stakeholder interviews and consultations, qualitative case studies and extensive quantitative data analysis of both published and unpublished data.
Hearing the voice of the people living in the four welfare reform communities is necessary for both ethical and technical reasons if we are to measure changes in social norms and behaviour. This was gathered through an extensive survey of social change conducted in each of the four communities using local researchers. This survey examined the social norms and attitudes of community members around the areas of social obligations agreed by the communities which underpin the goals of the trial. Reports on their own community’s survey results were provided back to each community.
Measuring the impact of initiatives is challenging for simple program design but the CYWR package is more challenging as it involves interconnected causal relationships. Even so accurate impact measurement involves the same principles used in evaluating the impact of single program interventions—examining the link between implementation and immediate outputs and subsequent outcomes. It was possible in this evaluation to assess the impact of FRC conferencing on subsequent school attendance by matching attendance data for individual students with FRC data. Findings were tested for statistical significance and information was cross-validated using data from a range of sources, including the ABS, field surveys and a wide range of government and operational service data covering education, crime and safety, child projection, housing and employment. Trends in outcomes were compared with outcomes in other Indigenous communities in Queensland to assess whether changes are unique to the CYWR communities or whether they are part of a broader trend.

Cape York Welfare Reform—Evaluation
iv
This evaluation looks at the trial as a whole—it does not evaluate each program separately. The package of projects was intended to operate together and to reinforce the key driver of social change, the FRC, in its efforts to reinforce agreed social obligations around the care of children and personal responsibility for safety and wellbeing, through the restoration of Indigenous authority. It was also expected that projects addressing money management, parenting support and wellbeing would help people build the capacity needed if people are to take more responsibility. The overall aim of CYWR is to rebuild social norms, re-establish Indigenous authority, increase engagement in the real economy, and move individuals and families from welfare housing to home ownership in the four participating communities.
This evaluation describes how the reforms were implemented, the implementation timelines and what has not been implemented, and assesses the impact of the CYWR on the four communities. The time frame in which change of this type might be expected is unclear but the program logic laid out a set of stages which people might progress through. The scope of this evaluation includes the four-year period of implementation and modifications to projects between January 2008 and December 2011. Where it is readily available, data for the first half of 2012 has also been included. Given the timeframe, the evaluation focuses on the short-term and, where applicable, medium-term outcomes, and notes that it is too early for longer term outcomes to have emerged.
This independent evaluation of the CYWR trial has been conducted by a number of independent authors, each focusing on one or more of the four key evaluation questions.
The overview, including an executive summary, was prepared by Dr Michael Limerick, an independent consultant specialising in Indigenous policy, governance, and service delivery. The overview chapter brings together the evidence from the range of evaluation activities and it also seeks to answer the key evaluation questions about changes to social norms or behaviours, changes in service provision and the contribution of governance arrangements. The chapter provides a comprehensive synthesis of the implementation story and looks at whether social norms and behaviours are changing by assessing the evidence against the program logic and theory of change underpinning the trial. The overview concludes by examining the overall theory of change outlined in the original evaluation framework and includes some observations about the big picture.
The chapters which make up the body of the report were also prepared by independent consultants or contractors, with the exception of the Introduction (Chapter 2), which was prepared by FaHCSIA on behalf of the partners. It outlines the history and components of the trial. The remaining chapters are:
Implementation—Chapter 3, prepared by the Social Policy Research Centre (SPRC) at the University of New South Wales
Social change survey—Chapter 4, prepared by Colmar Brunton Social Research
Authority, leadership, and social norms—Chapter 5, prepared by Professor Kate Reynolds et al, social psychologists from the Australian National University
Service delivery—Chapter 6, prepared by Dr Judy Putt, a researcher and criminologist contracted to FaHCSIA
Family Responsibilities Commission—Chapter 7, prepared by SPRC based on data extracted from the FRC operational database
Outcomes—Chapter 8, also prepared by SPRC with assistance from FaHCSIA, using data provided by Australian and Queensland government departments, covering education, crime and safety, child protection, housing and other areas of social responsibility.
Several research reports were also commissioned and provide input to the evaluation:
social change survey aggregate report, by Colmar Brunton Social Research

Foreword
v
service delivery—results from a service provider survey, by Dr Judy Putt, FaHCSIA
consultation paper regarding desktop research and qualitative analysis of service delivery trends apparent from the CYWR initiatives: focus area Aurukun, by a Cairns based consultant Migration Plus
summary of case studies of individual and family experience of change, by anthropologist Dr John von Sturmer who has many years of experience with communities in Cape York.
High-level oversight of the evaluation was provided by the CYWR Project Board. An evaluation steering committee, composed of representatives from each of the three trial partners, was established to oversee the quality and accuracy of the evaluation.
To provide quality assurance of the evaluation, two external evaluation advisers, Professor Deborah Cobb-Clark and Dr Annie Holden, provided advice and feedback on the overall evaluation strategy and the methodology and approach to impact analysis, as well as guidance to the steering committee. They also advised on draft reports and oversaw the quality of evidence used in the final report. In addition to the two evaluation advisers, Professor Kate Reynolds, a social psychologist from ANU, also contributed specialist advice and analysis regarding social norms theory and prepared a chapter on authority, leadership, and social norms.
The Australian Government would like to thank the partners, the Queensland Government and Cape York Institute for their advice and support throughout the evaluation process, and for providing feedback on the draft report. The large amount of administrative data that was used in this evaluation was provided by various departments within the Australian and Queensland Governments, the FRC, CYI and Cape York Regional Organisations. The Australian Government would also like to thank the numerous people who provided full and frank accounts of their experience living and/or working with CYWR, including community leaders, service providers, Australian, Queensland and local government staff, FRC officers, FRC commissioners and, in particular, the community members of the four CYWR communities.
Performance and Evaluation Branch FaHCSIA


Contents
vii
Contents
Foreword ............................................................................................................................................... iii
Glossary ................................................................................................................................................. x
1 Evaluation overview ................................................................................................................. 1 Dr Michael Limerick
1.1 Executive summary ....................................................................................................... 1
1.2 Introduction ................................................................................................................... 7
1.3 The core elements of the trial ....................................................................................... 7
1.4 An overview of the evaluation process ......................................................................... 8
1.5 Evaluation challenges, strengths and limitations .......................................................... 9
1.6 What has been delivered under the trial ..................................................................... 13
1.7 The key strategic evaluation questions ....................................................................... 22
1.8 Conclusions ................................................................................................................. 60
2 Introduction ............................................................................................................................ 65 FaHCSIA
2.1 Chapter structure ........................................................................................................ 65
2.2 Development of welfare reform policy ......................................................................... 66
2.3 Demography of CYWR trial communities ................................................................... 66
2.4 History of the Cape York Welfare Reform trial ............................................................ 67
2.5 CYWR trial governance .............................................................................................. 68
2.6 The objectives, streams and projects of the CYWR trial ............................................ 69
2.7 Funding commitments by the Australian and Queensland governments ................... 82
2.8 Program theory and evaluation framework ................................................................. 84
2.9 Evaluation governance ............................................................................................... 89
2.10 Focus of the evaluation ............................................................................................... 89
2.11 Approach to the evaluation ......................................................................................... 90
3 Implementation ....................................................................................................................... 93 The Social Policy Research Centre
3.1 Introduction ................................................................................................................. 93
3.2 Key findings ................................................................................................................. 93
3.3 Methodology used by SPRC ....................................................................................... 95
3.4 Progress to date ........................................................................................................ 100
3.5 Factors affecting variation in implementation ........................................................... 110
3.6 Barriers and facilitating factors associated with implementation .............................. 111
3.7 Governance arrangements ....................................................................................... 114

Cape York Welfare Reform—Evaluation
viii
3.8 Conclusion ................................................................................................................ 118
4 Social change survey .......................................................................................................... 121 Colmar Brunton Social Research
4.1 Introduction ............................................................................................................... 121
4.2 Key findings ............................................................................................................... 122
4.3 Research objectives .................................................................................................. 123
4.4 Methodology .............................................................................................................. 124
4.5 Research findings ..................................................................................................... 128
4.6 Conclusions ............................................................................................................... 142
5 Authority, leadership and social norms ............................................................................ 145 Katherine J Reynolds, Emina Subasic and Benjamin Jones, Research School of Psychology, The Australian National University, Canberra
5.1 Introduction ............................................................................................................... 145
5.2 Key overall findings ................................................................................................... 147
5.3 Theory and process of change ................................................................................. 149
5.4 Design and limitations of this analysis ...................................................................... 153
5.5 Analysis of social change survey data, with a focus on the FRC, leadership and responsibility ...................................................................................................... 155
5.6 Step 1: Scale formation and descriptive statistics .................................................... 156
5.7 Step 2: Relationships between key variables ........................................................... 158
5.8 Summary of findings and policy implications ............................................................ 163
6 Service delivery .................................................................................................................... 165 Dr Judy Putt
6.1 Key findings ............................................................................................................... 165
6.2 Context ...................................................................................................................... 166
6.3 Methodology of the survey and consultations ........................................................... 170
6.4 Perceptions of the trial .............................................................................................. 171
6.5 Perceptions of changes in the past three years ........................................................ 174
6.6 Perceptions of current service delivery and practice ................................................ 176
6.7 Improving service delivery and supporting future reforms ........................................ 179
6.8 Conclusion ................................................................................................................ 180
7 Family Responsibilities Commission ................................................................................ 183 The Social Policy Research Centre
7.1 Introduction ............................................................................................................... 183
7.2 Key findings ............................................................................................................... 185
7.3 Role and implementation .......................................................................................... 188
7.4 Data analysis approach ............................................................................................ 189
7.5 Effectiveness of the FRC .......................................................................................... 190
7.6 Community and stakeholder views about the FRC ................................................... 209

Contents
ix
7.7 Challenges in using the FRC data for evaluation ..................................................... 214
8 Outcomes .............................................................................................................................. 219 The Social Policy Research Centre, with assistance from FaHCSIA
8.1 Introduction ............................................................................................................... 219
8.2 Methodology .............................................................................................................. 219
8.3 Overall key findings ................................................................................................... 221
8.4 School attendance outcomes .................................................................................... 223
8.5 Educational outcomes ............................................................................................... 245
8.6 Child safety outcomes ............................................................................................... 251
8.7 Crime outcomes ........................................................................................................ 252
8.8 Employment outcomes ............................................................................................. 270
8.9 Housing ..................................................................................................................... 280
8.10 Other outcomes ......................................................................................................... 286
Appendixes
A Summary of findings from the KPMG Implementation Review of the Family Responsibilities Commission ................................................................................................. A.1
B Project performance summary—July 2008 to December 2011 ............................................. B.1
C Funding commitments by the Australian and Queensland governments .............................. C.1
D Evaluation methods used by SPRC ....................................................................................... D.1

Cape York Welfare Reform—Evaluation
x
Glossary 2008 Project Board Agreement
Cape York Welfare Reform Project Board Agreement, 21 July 2008
This document sets out how the Australian Government, Queensland Government and the Cape York Institute for Leadership and Policy will work together, and with other key stakeholders, to deliver the Cape York Welfare Reform.
ABSTUDY ABSTUDY provides help with costs for Aboriginal and Torres Strait Islander Australians who are studying or are undertaking an Australian apprenticeship.
ACMF Attendance Case Management Framework
ACMF is now referred to as Student Case Management (SCM). See SCM below.
AFP Active Family Pathways
Active Family Pathways is a multiagency team approach to coordinating services for clients with complex and longer term needs through a cohesive case coordination framework. AFP places the client at the centre of the case coordination and delivery process and delivers a framework for creating holistic, respectful, responsible, and trusting relationships amongst all parties.
ALA Aboriginal Land Act 1991 (Qld)
AMP Alcohol Management Plan
Since 1 January 2003, alcohol management plans have established legalised restrictions to the type and quantity of alcohol that may be brought into a number of Indigenous communities. These restrictions vary from community to community and change over time through negotiations with individual communities. The law applies to all residents and visitors to the community.
Balkanu Balkanu Cape York Development Corporation
Balkanu is a not-for-profit organisation, established in 1996, and owned by the Cape York Aboriginal Charitable Trust, on behalf of the Aboriginal people of Cape York. It is committed to supporting the Aboriginal people of Cape York and to improve the region's economic and social structures, at the same time as preserving their heritage and culture.
CAF Community Action Fund
The Community Action Fund provides independent financial support to individuals and groups in the four CYWR communities for activities that promote volunteerism and build positive social norms.
Case plan The purpose of a case plan is to provide a framework or tool to encourage and/or direct FRC clients to engage with a community service provider in order to address personal circumstances affecting the client’s ability to display and maintain socially responsible standards of behaviour.

Glossary
xi
Case management
Clients who enter into an agreement, or who are ordered to attend community support services, are case managed by the FRC. Service providers are required to submit a monthly progress report advising if the client has attended and engaged with the provider and the progress they are making towards achieving their goals.
CDEP Community Development Employment Projects Program
An Australian Government funded initiative for Indigenous job seekers, that provides community-managed activities to develop participants’ skills and employability in order to assist their move into employment outside CDEP.
CIM Conditional Income Management
Conditional Income Management involves the FRC sending a notice to the Centrelink Secretary to recommend removing a person’s individual discretion over the spending of a portion of their welfare payments (or direct some of it to a responsible adult in the case of family payments), so that the essential needs of children and families are met. CIM is also referred to as Income Management. See Income Management below.
COAG Council of Australian Governments
The peak intergovernmental forum in Australia comprising the Prime Minister, state premiers, territory chief ministers and the President of the Australian Local Government Association.
Commissioner See FRC Commissioner and Local Commissioners
Conference A conference is held between the FRC Commissioners and the person issued with the notice to attend the conference for breaching a social obligation.
CYAAA Cape York Aboriginal Australian Academy
CYAAA is a not-for-profit organisation which delivers a ‘best of both worlds’ education to Indigenous students. It aims to close the academic achievement gap between Indigenous and mainstream students and to support Cape York children’s bicultural identity.
CYI Cape York Institute for Policy and Leadership
CYI was established in July 2004 in partnership with the people of Cape York, Griffith University and the Australian and Queensland governments to champion reform in Indigenous economic and social policy and to support the development of current and future Cape York leaders. On 16 December 2011, CYI became an independent wholly owned subsidiary of Cape York Corporation Limited.
CYP Cape York Partnerships
Cape York Partnerships is an organisation that formed in 1999 through an agreement between the Australian and Queensland governments and regional Indigenous organisations in Cape York Peninsula. CYP facilitates reform by building innovative partnerships between Indigenous individuals and families, government and the philanthropic and corporate sectors. The organisation operates in a range of projects in the welfare reform communities of Aurukun, Coen, Hope Vale and Mossman Gorge.

Cape York Welfare Reform—Evaluation
xii
CYWR Cape York Welfare Reform
The Cape York Welfare Reform is being trialled in four Cape York Communities—Aurukun, Coen, Hope Vale, and Mossman Gorge. CYWR had the explicit task of reforming destructive social and economic conditions linked to passive welfare dependence and alcohol abuse across Cape York Indigenous communities.
DATSIMA Department of Aboriginal and Torres Strait Islander and Multicultural Affairs
The Queensland Government department responsible for the Aboriginal and Torres Strait Islander Affairs portfolio. The department works with all levels of government and the community to close the gap in advantage and disadvantage between Aboriginal and Torres Strait Islander peoples and non-Indigenous Queenslanders.
Design Reports From Hand Out to Hand Up Volume 1 and Volume 2
The proposals for Cape York Welfare Reform were developed by the Cape York Institute for Policy and Leadership and Cape York Partnerships through the preparation of the design reports From hand out to hand up Volume 1 and Volume 2.
DETE Department of Education, Training and Employment (Queensland Government)
Direct Instruction
Direct Instruction (DI) is an explicit teaching method that uses a mixed methodology of teaching such as lectures and practical demonstrations. DI used in the CYAAA program includes three learning programs: Class, Club and Culture.
DOGIT Deed of Grant in Trust
DoHA Department of Health and Ageing
The federal department responsible for the health and ageing portfolio, focusing on strengthening evidence-based policy advising, improving program management, research, regulation and partnerships with other government agencies, consumers and stakeholders.
FaHCSIA Department of Families, Housing, Community Services and Indigenous Affairs
The federal department responsible for the families, housing, community services and Indigenous affairs portfolio. The department aims to improve the lives of Australians by creating opportunities for economic and social participation by individuals, families and communities.
FIFO Fly-in fly-out
This can also refer to drive-in drive-out services
FIM Family Income Management
FIM is now referred to as MPower (see MPower below)
FRC Family Responsibilities Commission
The statutory body established as a key plank of the Cape York Welfare Reform to restore local Indigenous authority and socially responsible standards of behaviour in Aurukun, Coen, Hope Vale and Mossman Gorge.
Glossary
xiii
FRC Act Family Responsibilities Commission Act 2008 (Qld)
Legislation establishing and empowering the FRC.
FRC Commissioner
The FRC is headed by a legally qualified Commissioner and is assisted by a panel of Local Commissioners in all communities (see also Local Commissioners).
IEP Indigenous Employment Program
The Indigenous Employment Program (IEP) is funded by the Australian Government Department of Education, Employment and Workplace Relations and aims to increase opportunities for Aboriginal and Torres Strait Islander people, their communities and employers through employment, business support and economic development activities.
IM Income management
FRC has the power to place a client on Conditional Income Management. Individuals also have the choice to go onto income management voluntarily. See also Conditional Income Management.
In jurisdiction Within FRC jurisdiction
Section 7 of the FRC Act defines ‘in FRC jurisdiction’ as a community member who is a welfare recipient and who also lives in one of the four CYWR communities or has lived there for a period of three months since the start of the trial. Section 8 of the FRC Act defines a welfare recipient as a person, or partner of that person, who is in receipt of welfare payments. In addition, CDEP participants receiving CDEP wages are considered welfare recipients. They also come under the jurisdiction of the FRC; however, they cannot be income managed.
JSA Job Services Australia
Job Services Australia is the Australian Government employment services system that supports job seekers and employers.
Local Commissioners
Local Commissioners are statutory appointments. Local Commissioners are elders or respected community members who encourage individuals appearing before the FRC to take the steps needed to make lasting changes that will benefit their health, wellbeing and home and community life.
MPower MPower evolved from Cape York Partnerships original money management program, Family Income Management (FIM). MPower is designed to support individuals and families to manage money for basic material needs; build capabilities through financial literacy and behaviour change; and build assets through saving and disciplined money management.
MULTILIT Making Up for Lost Time in Literacy
MULTILIT was developed by the Macquarie University Special Education Centre. It is an evidence-based approach to teaching low-progress students who are experiencing difficulties in learning literacy skills.

Cape York Welfare Reform—Evaluation
xiv
NAPLAN National Assessment Program—Literacy and Numeracy
In 2008, the National Assessment Program—Literacy and Numeracy (NAPLAN) commenced in Australian schools. Every year, all students in years 3, 5, 7 and 9 are assessed on the same days using national tests in reading, writing, language conventions (spelling, grammar and punctuation) and numeracy.
Notice Information about a trigger event identified under the FRC Act such as date, event type and person to be held accountable.
Notice to Attend
A formal notice issued by the FRC to call individuals to conference. The local coordinator currently hand delivers the Notice to Attend Conference to community members.
PoP Pride of Place
Pride of Place is a Cape York Partnerships backyard renovation project that focuses on supporting families to carry out small-scale outdoor improvements to their homes and backyard. Participants receive a financial subsidy towards the improvement, and also make their own financial and Sweat Equity contribution. Pride of Place encourages families to take pride in, and responsibility for, the conditions of their homes.
Project Board Cape York Welfare Reform Project Board
The Project Board originally comprised the Secretary of FaHCSIA for the Australian Government; the Director-General of the Queensland Department of the Premier and Cabinet (DPC) for the Queensland Government (as chair), and the Director of CYI. From 1 October 2012, the Director-General of the Queensland Department of Aboriginal and Torres Strait Islander and Multicultural Affairs replaced the Director General of DPC as the representative for the Queensland Government, and chair. The Project Board is responsible for the whole of project oversight.
RSD Remote service delivery
The National Partnership Agreement on Remote Service Delivery commenced in January 2009 and is a five year agreement between the Australian Government and the state and territory governments that puts into place a new approach for delivering services to Indigenous Australians living in remote Australia. There are 29 RSD communities throughout Australia and six in Queensland. The four CYWR communities are also RSD communities.
SCM Student Case Management
Student Case Management was formally known as Attendance Case Management Framework in the Design Reports.
SCMs Student case managers
Student case managers work to improve the school attendance rate in communities by liaising with parents, students, schools and the broader community to encourage school readiness and attendance.

Glossary
xv
SETs Student Education Trusts
Student Education Trusts is a Cape York Partnerships Opportunity Product designed to support parents to meet their child’s education and development needs from birth to graduation. Student Education Trusts supports parents and families to regularly contribute to an education trust for their child so they have the money to meet education expenses when needed.
SPRC Social Policy Research Centre, University of New South Wales
Streams There are four broad and overlapping streams under the CYWR: Social Responsibility, Economic Opportunity, Education and Housing
Trigger event A ‘trigger event’ or ‘trigger’ is any event described under the FRC Act that gives rise to a notice and represents a breach of a social obligation.
Tripartite Partners
Australian and Queensland governments and the Cape York Institute for Policy and Leadership
The partners responsible for overseeing and implementing the Cape York Welfare Reform.
TSS Transition Support Service
Transition Support Service is an initiative funded by the Queensland Department of Education, Training and Employment to support students from remote communities during their transition to high school.
WRAP Welfare Reform Action Program Plan


Evaluation overview
1
1 Evaluation overview Dr Michael Limerick
1.1 Executive summary The Cape York Welfare Reform (CYWR) aims to reverse the deterioration of social and economic conditions in Cape York Indigenous communities over recent decades. It is founded on the premise that this deterioration has been brought about by passive welfare dependence and the erosion of individual responsibility as the unintended effects of well-meaning but misguided government welfare policies and service delivery.
The overall goal of the trial is to rebuild social norms, restore Indigenous authority and increase engagement in the ‘real economy’ in the Cape York communities of Aurukun, Coen, Hope Vale and Mossman Gorge. The trial is a joint initiative between the Australian and Queensland governments, Cape York regional organisations and the four participating communities. The origins and history of the trial and its associated welfare reform philosophy are described in Chapter 2. This chapter provides an overview of the evaluation, which was an integral part of the trial’s design from the outset. It synthesises key themes and evidence from the multiple evaluation activities, and seeks to answer the key strategic evaluation questions for the trial.
The CYWR trial seeks to fundamentally change and rebuild social norms and behaviours through wide-ranging activities that simultaneously tackle social responsibility, education, economic development and housing. The centrepiece in the trial’s agenda to rebuild social norms is the Family Responsibilities Commission (FRC), an independent statutory authority comprising a Commissioner and local Indigenous Commissioners from each of the reform communities. Under social responsibility are expanded money management services, programs for parenting skills and family violence prevention, social capital building programs, and Wellbeing Centres offering counselling for drug, alcohol and emotional issues. Education initiatives include case managers to improve school attendance, measures to encourage boarding school take-up, educational savings trusts for parents, and the trial was also the catalyst for a new model of schooling. Economic opportunity projects included business development, reforms to the Community Development Employment Projects (CDEP) Program and improved employment services. The housing stream has focused on removing barriers to private home ownership, normalisation of tenancy and programs to encourage home pride.
1.1.1 Implementation of the trial
The trial has been implemented largely as agreed by the three partners in the original 2008 Project Board Agreement or in subsequent negotiated modifications. All planned elements are either fully implemented or at least partially implemented to date, although there have been delays and challenges for some of the reforms, particularly in relation to housing and economic development and more generally, transforming the philosophy underpinning service provision. The usual challenges in the delivery of projects in remote Indigenous communities have been encountered, but the partners have managed to sustain focus and effort and address implementation barriers over the course of the trial.
Qualitative feedback and survey data suggest that the level of community engagement in the development and implementation of the trial has been mostly successful in generating understanding and acceptance of the reforms and a reasonable degree of participation. Despite the far-reaching impact of the reforms and a view by many residents that the trial was not adequately ‘sold’ during its implementation, community support for the trial has grown over time. The main exception has been the vocal opposition to the trial by a portion of the Hope Vale

Cape York Welfare Reform—Evaluation
2
community, led by the Hope Vale Aboriginal Shire Council. The inability to sustain a partnership with Hope Vale Council has been a significant challenge in the trial’s implementation.
The most progress in implementation has been made in relation to the Social Responsibility and Education streams. The successful establishment and operation of the FRC has been a significant achievement of the trial. In the first three and a half years of the trial, about half of the adult population in the four trial communities had direct contact with the FRC for breaching at least one of the behavioural obligations that act as triggers for referral to the FRC. The processes for FRC-mandated income management have been effectively implemented. The planned suite of supporting services (such as Wellbeing Centres, student case managers and family violence programs) and opportunities (such as the MPower financial management planning program and parenting programs) have also been successfully established to provide referral options for the FRC in its conferencing with clients.
The key reform in the Education sphere during the period of the trial has been the establishment of the Cape York Aboriginal Australian Academy (CYAAA) in Aurukun and Coen in 2010, and in Hope Vale in 2011.1 While the CYAAA was not part of the original agreement for the trial, this school reform complements key programs funded under the Education stream of the trial, such as case management of school attendance, encouragement for parents to set up trusts for their children’s education and a drive to transition more children to secondary boarding schools.
The slowest progress in the implementation of the trial has been in relation to implementing projects under the Housing and Economic Opportunity streams. While plans to normalise tenancy arrangements in the trial communities have largely been implemented, it has taken considerable time to address the barriers to home ownership, leaving this agenda only partially implemented. It has taken until the end of the trial period to open the planned business precincts in Hope Vale and Aurukun, and efforts to support the establishment of businesses are progressing slowly. The conversion of CDEP positions into ‘real jobs’ and the reforms to the CDEP scheme have been implemented as planned. However, although some jobs have been created through ‘lighthouse projects’ in the communities, it remains an ongoing challenge to generate significant numbers of new employment opportunities for residents, either within the community or through mobility to other locations.
1.1.2 Outcomes in changing social norms and behaviours
Measuring the trial’s intended outcomes—changed social norms and behaviours—is inherently difficult, but a range of evidence has been collected in the evaluation, including statistics, survey data and qualitative feedback.
Progress in social change
The evaluation framework for the trial conceptualised a theory of change comprising a continuum from putting in place foundations and enablers, bringing about short- to medium-term behaviour change, and finally achieving sustainable improvements in the communities in the longer term.
Signs of progress along this continuum suggest that individuals and families are beginning to gain respite from daily living problems and people feel that life is ‘on the way up’. Progress around the fundamental behavioural changes sought from the trial has been at the foundational level in terms of stabilising social circumstances and creating the conditions for further behavioural change. There are signs that people are taking on greater personal responsibility and raising expectations, particularly in areas such as sending kids to school, caring for children and families and their needs, and accessing supported self-help measures to deal with problems. The trial’s theory of change posits these changes as the enablers for strengthening the capability of individuals to
1 CYAAA was established by the Queensland Government and Cape York Partnerships. CYAAA also operates a tutoring centre from Mossman Gorge, which started operating in 2012. This is not a campus operated in partnership with the Queensland Department of Education, Training and Employment. The centre offers tutoring in literacy and numeracy and instruction in culture for children of Mossman Gorge.

Evaluation overview
3
move off income management and reduce reliance on support services in the longer term. In turn, increased individual capability is expected to lead to behaviour changes that are not yet evident at this stage of the trial, such as significantly increased participation in later years of education or in training and employment, increased caring for the community environment, and taking up private home ownership opportunities.
It is arguable that this extent of progress along a continuum of long-term social norm change is as much as could be expected in a three- to four-year timeframe. This is consistent with the evaluation framework’s suggestion that the period of the trial would only be sufficient to ‘set the foundations and make progress towards’ changing social norms and rebuilding the communities.
That more progress has been made in changing behaviours around education and social responsibility than around housing and economic opportunity reflects that implementation of the trial’s activities has progressed further in the former spheres than in the latter. It might also be argued that there is a natural sequence in which stabilising the social environment and improving educational attainment creates the preconditions for greater employment and business enterprise and transition to private home ownership. However, this raises the risk that progress to date will not be consolidated if job, business and home ownership opportunities are not readily available at the time that people become motivated to change.
There has been a differential level of ‘buy-in’ and commitment across the four communities, with the strongest response evident in Aurukun and the lowest support for the trial in Hope Vale. However, support and commitment for the trial among individuals seems to be correlated with the level of contact with the trial activities, and Hope Vale has the highest proportion of people who are effectively ‘spectators’ rather than participants in the trial.2
The trial has had different impacts on the various population segments within each community. The greatest impact has been on individuals who have been before the FRC and have accessed support services. The residents exhibiting the least improvement are in a ‘harder to reach’ category of individuals who are being repeatedly called before the FRC but are not accessing any of the support services or opportunities that might improve their lives. Although some of the strongest observable impacts of the trial have been in Aurukun, it is estimated from the social change survey data that the section of the population in this ‘harder to reach’ group is 25 per cent of Aurukun’s population, while in the other communities the estimates ranged from 8–15 per cent.3
A current gap in the trial’s reach relates to young people of high school age who have exited boarding school. The trial has few support services or opportunities to cater to their needs. The FRC has never received a formal notice to inform it about children who are not enrolled in school, in any of the four welfare reform communities. The FRC can act only if it is formally notified. The Queensland Department of Education, Training and Employment (DETE) believes that there are about 42 students of compulsory high school age in this category in Aurukun. Since August 2012 these students have been case managed by the Aurukun Multi-Agency Case Management Team. Identified youth have been supported to gain entry to boarding schools outside the community for 2013 or, if not successful, students have been referred to the local secondary program to be run by Western Cape College. The FRC has been involved in this process.
Education
In Aurukun and Mossman Gorge, there were statistically significant improvements in school attendance, reflected in falls in students’ unexplained absences from school during the trial. Coen
2 The social change survey defines the segment of ‘spectators’ as those who have not used any of the services or programs under the trial, are unlikely to have been requested to appear before the FRC, and are likely to have reported no change in their quality of life (Colmar Brunton, Social change research study: aggregate report, report prepared for FaHCSIA, Canberra, 2012, p. 69). In Hope Vale, these comprise 56% of the community, compared to 37%–38% in the other communities. 3 Colmar Brunton, ‘Social change research study: Hope Vale community report’, unpublished report prepared for FaHCSIA, Canberra, 2012, p. 71.

Cape York Welfare Reform—Evaluation
4
and Hope Vale have historically had higher rates of school attendance. This did not change during the trial at Coen, while Hope Vale recorded a very small increase in unexplained absences in 2011. Although statistical improvements are not evident in these two communities, there is a perception by community members that school attendance has improved and children are healthier and happier.
The greatest improvement in school attendance occurred in Aurukun, where attendance rates had been lowest before the trial. The published school attendance rate at Aurukun increased from 46.1 per cent in the first term of 2008 to 70.9 per cent in 2012. Data analysis has linked this improvement to the FRC. Analysis of records for individual students in Aurukun has shown a statistically significant reduction in unexplained absences from school following an FRC conference with the student’s parents or caregivers in 2009 and 2010. The improvement was greatest in 2009 and was generally sustained during the subsequent years of the trial. Qualitative data highlight the positive impact of FRC conferences in encouraging parents to send their children to school. The statistical analysis suggests, however, that after successfully changing the behaviour of a significant number of families in 2009 in Aurukun, the FRC Commissioners have had a progressively more difficult task in subsequent years in affecting the behaviour of individuals who are less amenable to change.
Improvements in school attendance in the trial communities are not part of a broader trend in Indigenous communities. The trial communities’ attendance rate was 4 percentage points lower than the attendance rate in comparable Indigenous communities in 2008, but by 2011 it was 6 percentage points higher than in the other Indigenous communities. By tracking individual students’ attendance across years, analysis reveals that Year 2 students in the trial communities went from 3 percentage points lower attendance than their peers in comparable Indigenous communities in 2008 to 9 percentage points higher than their peers in the other communities in 2011.
More high-school-aged children from Aurukun are attending boarding school than before the trial. While this is consistent with the trial’s philosophy and objectives, it is not clear whether the trial’s activities are contributing to this outcome. The retention of students at high school remains a significant challenge, as between a quarter and a half of students return to their home communities within six months of starting boarding school.
There are some positive early signs about improvement in educational attainment by students in the communities where the CYAAA has been implemented, but it is too early for a definitive finding and an independent evaluation of the CYAAA will be completed in 2013. Overall, the trial’s activities appear to be laying foundations for further and sustained progress in educational outcomes, in the form of increased school attendance, substantial community support for the new CYAAA schools, the promising signs about the success of the Direct Instruction teaching methods, increased parental savings for educational purposes through Student Education Trusts (SETs), and increasing numbers of students transitioning to secondary boarding schools.
Social responsibility
The trial has had an impact in encouraging and assisting community members to better meet the needs of their children and families. The FRC has had an impact in this regard, not only through the effective use of Conditional Income Management, but also through the support and guidance provided by the Commissioners in FRC conferences. Community members perceive that people are generally taking more responsibility for their families and children and trying to be better parents.
In survey responses and qualitative feedback, improved money management is seen as an important outcome of the trial, with community members reporting a greater capacity to meet the needs of their families and children through the BasicsCard (issued under Conditional Income Management), the MPower financial management assistance service and SETs.

Evaluation overview
5
Residents of the communities report that, compared to three years ago, children are happier, more active and eating healthier food, and life is on the way up generally.
The FRC, operating in conjunction with a suite of support services (such as the Wellbeing Centre or parenting and family violence courses) and opportunities (such as MPower, SETs and Pride of Place), is encouraging and enabling many individuals and families to identify and start to address problems that affect their lives. The evaluation has found evidence of greater self-awareness about problems affecting individuals and families, and a greater preparedness to seek opportunities for supported self-help.
Evidence of increased volunteering at Aurukun and Coen is consistent with the behavioural norm that the trial is seeking to rebuild, but it is not possible to directly attribute this change to projects under the trial.
It is not possible to attribute any uniform trends in levels of crime and alcohol abuse in the trial communities to the implementation of welfare reform. Drawing conclusions from official crime data is always problematic in small Indigenous communities and factors such as changes in alcohol supply and numbers of police may have a considerable impact. There have been improvements in several indicators of crime and offending in the trial communities, particularly in Aurukun. Attributing this improvement directly to projects delivered under the trial is difficult. Data analysis shows that the rate of assaults causing bodily injury fell dramatically (by more than half) in 2008–09 in Aurukun and that this is highly likely to be related to the reduction in trading and subsequent closure of the Aurukun tavern from March 2008. Reducing alcohol supply is consistent with the welfare reform philosophy but is not an explicit part of the trial. The data analysis also shows that the reduced crime indicators in the CYWR communities during the trial are largely similar to improvements in other comparison Indigenous communities. However, the improvements across the trial communities did reverse a trend of rising offence rates prior to the trial, which was not the case in comparison communities. Another positive indicator is that the hospitalisation rate for assault has been lower in the trial period in the CYWR communities than it was before the trial—it is not possible to definitively link this to the trial as a similar trend is evident in other Indigenous communities in Queensland.
Housing
Some progress has been made in engendering positive norms around individuals and families taking responsibility and pride in their housing. Many residents are contributing more to their homes by paying normal public housing rent. Some residents are taking advantage of an opportunity to improve their homes through the Pride of Place program, which provides funding for home improvements conditional on the householder demonstrating commitment and responsibility by contributing their own time and money.
Significant progress has been made under the trial in addressing the legislative, financial and tenure-related barriers to private home ownership in Indigenous communities. Many residents of the trial communities have expressed an aspiration to privately own their home and expressed an interest in loans for this purpose. However, no residents have yet made the transition from public housing to home ownership. Further work is needed to build individual capabilities and to ensure that an appropriate home ownership model and incentives are in place.
Economic opportunity
Census data indicate an increase in the employment rate in all of the trial communities between 2006 and 2011. The trial has contributed to this outcome through the conversion of CDEP positions into 103 jobs and the creation of 118 new service delivery jobs. However, the trial has had a limited impact on the number of residents dependent on welfare—apart from the CDEP conversions, many residents who are no longer on CDEP have transitioned to other welfare

Cape York Welfare Reform—Evaluation
6
payments such as Newstart.4 Substantial new employment opportunities will be required either within the communities or through mobility outside the communities before working can become the norm for residents.
The trial has not succeeded to date in generating significant business development in the four communities. Slow progress may be a reflection of the challenges in the economic environment in remote communities but may also be impacted by delays in the implementation of the trial’s activities in this area, such as the new business precincts.
Restoring Indigenous authority
A successful feature of the trial has been the rebuilding of Indigenous authority to tackle antisocial behaviour through the local FRC Commissioners. Most community members and other stakeholders believe that the FRC has strengthened leadership, particularly through the Local Commissioners’ listening, guiding and supporting role. The FRC conferencing process resonates with traditional Aboriginal dispute resolution practices and is consistent with restorative justice principles. An analysis of the social change survey data by social psychologists indicates that residents believe in the underlying logic of the trial—that the FRC can strengthen leadership and encourage people to take responsibility for their behaviour.
1.1.3 Changes in service provision to support the trial objectives
The trial has introduced a raft of new services and opportunities that are specifically designed around the principles of individual, family and community responsibility.
Most service providers perceive that service delivery has changed as a result of the trial in ways that support the welfare reform philosophy. However, there has been inadequate attention to identifying how the welfare reform principles should translate into changed practices at the operational level, and there continues to be a lack of consensus in this regard.
While the usual challenges persist, service providers perceive that coordination and collaboration have improved as a result of the trial, although a better model for coordination of case management is considered necessary to address the complex and inter-related needs of community members.
The level of engagement of services with community members has improved during the trial, with greater opportunities for communities to influence and participate in service provision. Training Indigenous people to fill service positions remains an ongoing need, however.
1.1.4 The contribution of the governance arrangements under the trial The trial is underpinned by unique governance arrangements involving a tripartite partnership
between the Queensland and Australian governments and the Cape York Institute (CYI).5 The governance arrangements embody the welfare reform philosophy of moving beyond passive, government-defined service delivery and instead empowering Indigenous involvement in leadership of policy and program design and delivery.
During the current evaluation, there has not been a comprehensive review of the contribution of the governance arrangements to the outcomes of the trial. This would be worth exploring in order to inform future reform initiatives.
Governance issues for further exploration include: the efficacy of the intergovernmental coordination under the trial; the implications of the tripartite partnership model for conventional government decision-making and funding processes; and the adequacy of the involvement of existing Indigenous community governance structures.
4 Chapter 8, Section 8.8.5. 5 CYI’s responsibilities as trial partner include oversight and coordination of the work of the Cape York regional organisations charged with delivering trial elements (2008 Project Board Agreement, pp. 10–11).

Evaluation overview
7
1.1.5 Conclusion It is important to evaluate welfare reform in the context of the limited progress from past efforts to
improve the life circumstances of residents of remote Indigenous communities. There can be no quick fix to rectify challenges that have been decades in the making. However, the evaluation after only three years of the trial of welfare reform points to a level of progress that has rarely been evident in previous reform programs in Queensland’s remote Indigenous communities.
What is most promising is that some of the progress relates to subtle but fundamental shifts in behaviour that, if sustained and built upon, can be expected to yield significant longer term results. For example, improvements in school attendance and educational attainment will have life-changing implications for a new generation of children, while improved money management and a greater willingness to proactively take responsibility for addressing life challenges offers immediate hope for incremental improvements to adults’ quality of life.
The challenge will be to consolidate the gains to date by providing genuine economic opportunities for individuals and families to continue the journey from welfare dependence to prosperous and fulfilling lifestyles.
1.2 Introduction This chapter provides an overview of the evaluation of the CYWR trial. It synthesises the key themes and evidence from the multiple evaluation activities conducted under the evaluation framework, and seeks to answer the key strategic evaluation questions for the trial. In short, it seeks to make sense of the available evidence and draw some conclusions about whether the trial has worked, or is beginning to work.
An evaluation of the innovative reforms being trialled in Cape York communities was an integral part of the trial’s design from the outset. The central questions for the evaluation are whether the trial has been implemented as agreed and whether social norms and behaviours are changing as intended. A broad range of research methods were used, including surveys, stakeholder interviews, case studies and quantitative analysis. Significant effort was made to measure impact through using unit record data and matching outcomes data for CYWR and comparison communities where possible. Most significantly, the voice of the people living in the four welfare reform communities can be heard through extensive surveys of social change. This evaluation looks at the trial as a whole; it does not examine each project or program. The scope of the data used in the evaluation is generally from July 2008 to December 2011, but more recent information from 2012 is included where available.
The trial represents an ambitious agenda to fundamentally change and rebuild social norms and behaviours through a broad program of activities that simultaneously tackle the domains of social responsibility, education, economic development and housing. These activities aim to:
fundamentally reform the way regional organisations and all levels of government operate in remote communities
deliver services in an integrated way that removes disincentives which cause dependency cycles
increase individual responsibility and active participation within the community
provide a holistic approach to community services and development.6
1.3 The core elements of the trial A more detailed summary of the various activities delivered under the trial since its commencement in 2008 is contained in Chapter 2 (Section 2.6). For the purposes of this overview chapter, it is necessary to outline the core elements of the trial design.
6 Project Board Agreement, 2008, p. 5.

Cape York Welfare Reform—Evaluation
8
The centrepiece in the trial’s agenda to rebuild social norms in the four trial communities is the FRC. The FRC was established by the Family Responsibilities Commission Act 2008 (Qld), and is an independent Queensland Government statutory authority, comprising a former magistrate in the role of Commissioner and local Indigenous Commissioners from each of the reform communities. The FRC holds regular conferences in each community on a regular circuit and is constituted by Commissioner Glasgow and two Local Commissioners, or by three Local Commissioners in some circumstances. The FRC is supported by registry staff based in Cairns and the communities.7
The FRC is intended to restore Indigenous authority and bring about behavioural change through a combination of regulation, conferencing, referral and case monitoring. Local Commissioners are elders or respected community members who request individuals appearing before the Commission to make the changes necessary to take responsibility for their own lives and wellbeing. The FRC refers individuals to relevant support services in their community, which might include case managers to drive change in helping children attend school, money management advisers, parenting programs, and counsellors for drug and alcohol addiction, family violence and mental health issues. While the FRC provides assistance and support through conferencing, it also has the authority to recommend that Centrelink manage either 60 per cent or 75 per cent of an individual’s welfare payments (Conditional Income Management, or CIM). Income management acts both as a means to ensure financial stability for families and as an incentive for the individual to engage with support services and observe behavioural obligations. The FRC has jurisdiction only over individuals who receive welfare payments or CDEP payments and reside in one of the four communities. Individuals are referred to the FRC in the following circumstances:
a child in the individual’s care has three absences in a school term without reasonable excuse or is not enrolled in school without a lawful excuse
the person is the subject of a child safety concern or notification report
a magistrates court convicts the person of an offence, or
the person breaches a public housing tenancy agreement.
The other elements of the trial are summarised in Table 1.1 and comprise a range of support services, opportunities and reformed incentives (such as changes to CDEP and ABSTUDY eligibility) that seek to encourage desired behaviour across four streams: Social Responsibility, Education, Economic Opportunity and Housing. In the area of social responsibility, the trial has expanded money management services, programs for parenting skills and family violence prevention, social capital building programs, and Wellbeing Centres offering counselling for drug, alcohol and emotional issues. In the area of education, the trial has instituted case managers to improve school attendance, measures to encourage boarding school take-up, and educational savings trusts for parents. The trial was also the catalyst for a new model of schooling based on the four Cs: class (which incorporates the Direct Instruction method), club, culture and community. Projects to enhance economic opportunity have included business development, reforms to the CDEP Program and improved employment services. The housing stream has focused on removing the barriers to private home ownership, normalisation of tenancy and programs to encourage home pride.
1.4 An overview of the evaluation process The purpose of a trial is to test whether new ideas and their practical expression in programs and activities can bring about desired changes. Evaluation is therefore a central element of any trial. With this in mind, in 2008 the partners commissioned an evaluation framework and program theory to guide the evaluation of the trial. The evaluation framework posed four key strategic evaluation questions:
7 FRC annual report 2010–11, p. 7.

Evaluation overview
9
1. Was the CYWR implemented as agreed by the three parties?
2. Are social norms and behaviours changing?
3. Has service provision changed in a way that supports the change of social norms and behaviours?
4. Have governance arrangements supported changes in service provision and social norms and behaviours?
The evaluation framework recommended that a broad suite of evaluation activities be undertaken in order to answer these questions. These ranged from implementation reviews, surveys, case studies and qualitative studies to evaluations focusing on particular issues, such as service delivery. The majority of these evaluation activities have been undertaken and form the basis of the chapters and appendices in this report.
This overview chapter seeks to synthesise and organise the findings from the various evaluation activities in order to answer, to the extent possible, the four key strategic evaluation questions above. Section 1.7 discusses each of the questions in turn.
This chapter relies entirely on the evidence collected and the conclusions drawn from the evaluation activities undertaken by other researchers and organisations, as presented in the rest of this report. The author was not requested to collect any additional data. However, the writing of the overview provided an opportunity to consider where the evaluation evidence corroborates or is contradictory, and there was an opportunity to seek clarification from the various evaluators to seek explanations for this. Moreover, the general conclusions in this chapter were subjected to a deliberative process whereby key stakeholders were able to comment on draft conclusions and participate in a workshop discussion. It should be emphasised, however, that there was not necessarily consensus around all aspects of the trial evaluation. This chapter ultimately reflects the author’s own independent opinions and conclusions drawn from the available evidence. It should also be emphasised that, in some areas, there was insufficient evidence to draw conclusions about the impact of the trial. These areas have been highlighted in this chapter.
1.5 Evaluation challenges, strengths and limitations Evaluation of social programs is an imperfect science. It is important to be cognisant of the strengths and inherent limitations of any evaluation process in order to provide context for any conclusions that are drawn.
1.5.1 Strengths of the evaluation
A key strength of the evaluation of the trial derives from the fact that there was attention given to the topic of evaluation at the time the partners agreed to the trial in 2008. The 2008 Project Board Agreement committed the parties to developing an evaluation framework, which was subsequently finalised in March 2009. Flowing from this, an evaluation steering committee, comprising representatives from government partners and the CYI, was established to guide the process (see Section 2.9). This forum has ensured that a diversity of perspectives is involved in the evaluation governance. Early agreement between the government and non-government partners about the scope and terms of the evaluation created a firm foundation for the future evaluation activities.
A positive feature of the evaluation design has been the multitude of methods and sources of information utilised. As recommended by the evaluation framework, the evaluation draws on evidence such as community survey data, qualitative studies, government administrative data, FRC data, project performance information, census statistics and academic commentary. The mixed methods and diverse information sources enable the triangulation of evidence, which gives greater confidence in the robustness of evaluation findings.

Cape York Welfare Reform—Evaluation
10
Where feasible, the evaluation has also accessed unit record data for individuals in order to undertake data matching to track the impact of initiatives on specific individuals. For example, school attendance data for specific children have been compared with the parents’ appearances at FRC conferences to gauge the impact of conferences on school attendance. Another example is that notification rates against individuals for breaches of welfare obligations were compared for periods before and after the individuals were placed on Conditional Income Management. These types of analysis, while costly and time consuming, provide an excellent basis for evaluating the efficacy of specific measures such as the FRC conferences and income management.
The evaluation activities have also canvassed a broad range of perspectives and types of expertise. Contributions to this report have been made by university researchers, an anthropologist, a market research company that specialises in social surveys, evaluation consultants, program managers, policy analysts, government statisticians, non-government organisations and community-level researchers.
Most significantly, a voice has been given to the participants in welfare reform through the extensive social change surveys conducted in all four Cape York communities, and through qualitative interviews with a range of community leaders and residents. The social change surveys deserve particular mention as they were able to canvass the opinions of 35 per cent of the adult population of the four Indigenous communities through the quantitative survey (582 participants), as well as undertake qualitative research through interviews and participatory methods to identify the most significant changes and challenges. The high response rate and the broad representativeness of the sample were achieved through the use of 34 local community members trained to administer the surveys.
1.5.2 Limitations in the scope of the evaluation The scope of an evaluation is determined by a range of factors, including cost, timeframes, data availability and the feasibility of particular evaluation techniques. It also reflects a focus on the issues that are of most importance and interest in the policymaking and program development process. Limitations in the scope of the current evaluation framework relate to three areas, described in turn below.
Economic evaluation
This report does not include an economic evaluation. The welfare reform program design report by the CYI recommended that ‘an economic evaluation should assess the cost effectiveness of the interventions’.8 The evaluation framework report also indicated that an economic evaluation would be useful to guide government policy and investment decisions in the future, although it noted the complexity in undertaking such an analysis.9 A consideration for government in further implementing welfare reform in the future is the cost involved in achieving the outcomes that have been achieved under the trial. The evaluation has documented the level of expenditure on the trial, noting that some of the expenditure is new funding, some is simply a continuation of existing funding and some is a reorientation of existing funding. However, the evaluation has generally not attempted to link outcomes to investments in any specific way in order to determine the cost involved in achieving particular outcomes.
The theory of welfare reform would suggest that successful implementation of the program should result in net cost savings to government over the long term in comparison with the status quo. Success in transitioning individuals from welfare to employment and privately owned housing would reduce the burden on government welfare and public housing. Any employment and business growth in previously welfare-dependent Indigenous communities will generate government revenue.
8 CYI, From hand out to hand up, p. 127. 9 Courage Partners, Evaluation framework and program theory for the Cape York Welfare Reform trial, report for FaHCSIA, 2009, p. 31.

Evaluation overview
11
Reductions in dysfunctional behaviour as a result of transitioning off welfare-dependent lifestyles and rebuilding positive norms would reduce the need for social and health services and, significantly, the high costs of the justice and correctional systems in remote communities. Individuals and families taking more responsibility for their own wellbeing (such as saving for children’s school education) would reduce the obligation on government to meet such needs. The ultimate goal of welfare reform is a retreat of government services from current ‘overservicing’ to ‘normalised’ levels of services seen in mainstream communities.
To the extent that there is evidence of the trial achieving its intended outcomes, it would be a significant benefit to the policy process if the economic value of these outcomes was able to be quantified as a further step following this evaluation. The appropriate timing of such an exercise requires further consideration. Many of the downstream benefits of trial outcomes, such as higher school attendance or increased ‘self-help’ behaviours, will not be evident for a number of years, so a cost–benefit analysis at the present time would need to rely on assumptions about likely gains. Rather than a comprehensive economic evaluation of the whole trial, the most that might be possible in the short term is to analyse a handful of the most evident outcomes to date and quantify the downstream savings to government and the community in comparison to the direct costs of achieving the outcome. Any net savings that are identified by such an analysis will be valuable in informing future policy deliberations about welfare reform.
Governance evaluation
The evaluation framework report highlighted that the trial’s governance arrangements are innovative in the inclusion of not only two levels of government, but also the CYI, an organisation independent of government. The report suggested that a specific review of the governance arrangements could be undertaken to determine their impact on the success of the trial. As discussed below, a comprehensive review of the strategic and operational governance arrangements for the trial has not yet been undertaken.10 This would be useful to enable policymakers to draw lessons from the trial about how to design the governance of future reform programs. The discussion in Section 1.7.4 of this chapter seeks to draw some broad conclusions about governance from the available evidence.
Project-level evaluations
The evaluation activities in this report have sought to assess the extent to which the entire package of reforms in the trial have acted together to achieve the desired outcomes. The primary focus has been on measuring the overall impact of the trial. For the most part, there have not been separate independent evaluations of each project or program under the trial. The main exception to this is that the FRC was subjected to an implementation review in 2010, and a specific evaluation of the FRC’s impact was a key focus of the broader outcomes evaluation by the Social Policy Research Centre (SPRC), as contained in Chapter 7 of this report. There are also separate program-level evaluations currently underway for the CYAAA and the Wellbeing Centres initiative11, but the findings of these were not available for this report.
For the remaining programs and services initiated under the trial, there have not been specific evaluations undertaken for this report. The only information available about their effectiveness is the project performance information collated in Appendix B, plus some evidence about their usage levels and impact that was collected incidentally through the service provider survey (Chapter 6), the social change surveys (Chapter 4) and the other qualitative studies. Some of the programs may have been subject to internal reviews or evaluations—for example, by delivery organisations such as Cape York Partnerships. Such information was not available for this report, however. Given the novel nature of some of the projects delivered under the trial, there remains a need for the responsible funding and delivery agencies to undertake project-level evaluations to determine whether projects have been
10 Issues around the governance of service delivery were considered in some of the evaluation activities, but not the strategic and operational governance of the trial itself. 11 CYP has also undertaken reviews of MPower and the parenting program, known as ‘It Takes a Village to Raise a Child’.

Cape York Welfare Reform—Evaluation
12
implemented successfully and what outcomes have been achieved. The draft program logic developed for all the components of the trial in early 2012 provides a sound starting point for these evaluations.12
1.5.3 Challenges An evaluation of a reform program of the scale and complexity of the CYWR faces a number of challenges. The most significant challenge, attributing outcomes to causes, is common to all evaluations, but is compounded in the case of a set of interconnected reforms that are intended to act together to bring about social change. The evaluation framework argued that ‘causal attribution of the Trial outcomes will be difficult, if not impossible, to determine’.13 For an observable outcome, it is unlikely to be clear which, if any, of several concurrent welfare reform activities has caused the outcome. Even if it is concluded that the welfare reform trial is likely to have contributed, it will still not be clear whether the outcome could have been achieved by one of the initiatives on its own, or only by the multiple initiatives acting in concert.
The problem of causal attribution is made more difficult by the occurrence of other reforms during the trial period, such as changes to programs such as CDEP, the Remote Service Delivery National Partnership Agreement, substantial housing construction investment and the introduction of new alcohol restrictions. Section 3.3.4 discusses a number of other policy changes and reforms impacting the four communities during the trial, all of which need to be considered in evaluating the trial’s impacts. It should be noted that many of the other reforms such as CDEP reforms and alcohol restrictions, while not directly part of the suite of trial activities, are nevertheless consistent with welfare reform principles and might therefore be considered part of the overall continuum of welfare reform implementation.
Despite these difficulties, the evaluation has elicited some evidence that links particular outcomes to particular initiatives (discussed further in Section 1.7). Such evidence is particularly important in being able to draw tentative conclusions about the impact of the trial as a whole on observable social changes. While it might not be possible to disentangle the proportional effects of particular initiatives, when the specific evidence about the success of some initiatives is considered together with a broader pattern of change that is discernible following the commencement of the trial, it gives greater confidence to speculate about the trial’s overall impacts.
Aside from the central difficulty of determining cause and effect, a range of other practical challenges for the evaluation are discussed further in Section 3.3.2 and Appendix D. Key challenges include:
limitations of administrative datasets, such as the difficulty of identifying trends from the low numbers in small communities, limits to reporting small numbers due to privacy, and the impact of local personnel on data collection practices and service levels
the need to take account of the significant differences between the four communities, which can affect their receptiveness to the initiatives under the trial (e.g. their relative strengths and weaknesses, their level of capacity and readiness, the different scope and scale of the problems to be addressed, and their varying cultural composition)
the fact that programs and services under the trial were implemented at different rates and in different ways in each of the four communities
the difficulty of benchmarking against comparator Indigenous communities elsewhere in Queensland, due to the differences in communities and the small numbers involved
the uniqueness of many of the trial initiatives, which precludes comparison with any preceding initiatives
12 Cape York Institute, Draft program logic, 2012. 13 Courage Partners 2009, p. 14.

Evaluation overview
13
the absence of baseline data for key indicators for the trial, such as measures regarding social norms and behaviours that were prevalent at the commencement of the trial
the inability to identify time-series trends in data over the relatively short three-year timeframe for the trial.
There are two more fundamental difficulties that are specific to this evaluation. First, there is the difficulty of reliably measuring the outcomes that are being sought from the trial, which are changes in social norms. For many norms, there are simply no externally valid measures of the outcome. For example, reduction in child neglect has no valid measure—data such as child protection notifications are affected by factors such as the propensity to report and levels of child protection staffing and activity. One of the few intended outcomes that is reliably measurable is school attendance, which the evaluation has been able to analyse in depth.
A second fundamental question is whether the timeframe for the trial is long enough to be able to affect the sort of normative and behavioural change that is desired from welfare reforms. The evaluation framework proposed a more limited goal for the outcomes evaluation of assessing ‘whether the trial has set the foundations for and made progress towards changing social norms and rebuilding the four participating communities’ (emphasis added).14 The report postulates a program theory containing nine sequential outcomes culminating in ‘rebuilt social norms leading to strong responsible communities’. It was noted, however, that this final outcome was unlikely to occur within the trial period and there may not even be evidence of some of the penultimate social change outcomes set out in the program theory. Hence, the conclusions in this chapter about the outcomes of the trial are tempered by the need to be realistic about the extent of change to underlying social norms and behaviours that can be expected within a three- to four-year timeframe.
1.6 What has been delivered under the trial In order to assess the outcomes of the trial it is important to understand whether the program outputs that were considered necessary to achieve those outcomes have indeed been delivered. The trial deliverables are discussed in more detail in other parts of this report, such as Chapter 2 (Introduction), Chapter 3 (Implementation) and Appendix B (Project performance summary). However, Table 1.1 seeks to provide a snapshot of the activities that were planned under the four streams of the trial, the extent to which they were implemented as agreed, and the available evidence from the evaluation activities about the outputs delivered under each activity.
A few qualifications should be heeded in interpreting Table 1.1. First, whether a project has been implemented ‘as agreed’ relates to the original tripartite agreement about the trial in the Project Board Agreement signed in July 2008, plus any addition or modification to the elements of the trial subsequently agreed by the trial partners through the Project Board. As explained in Section 1.7.1, the 2008 Project Board Agreement underpinning the trial did not include every aspect of the original CYI design report for welfare reform.
Second, as further explained in Chapter 2, it should be understood that the scope of the evaluation is generally the period from January 2008 to December 2011. However, some more recent information from 2012 has been included in relation to some of the activities, where this was available.
Third, one risk in simplifying a complex story of implementation and project delivery into a short table is that it obscures the nuances of the journey of various initiatives and may paint a misleading picture. Where the table indicates that a project was ‘implemented as agreed’, this does not imply that the project was delivered precisely to the planned timeframe or that the quality of implementation was as intended. It simply indicates that the project has been implemented largely in the form and to the timeframes agreed in the original 2008 Project Board Agreement, or as modified by the parties
14 Courage Partners 2009, p. 27.

Cape York Welfare Reform—Evaluation
14
through a later decision of the Board. The assessment ‘partially implemented’ indicates that some progress has been made in implementing the project agreed by the partners, but that there have either been significant delays or significant elements of the project have not been implemented as intended (and the parties have not agreed that they should not be implemented). The more detailed information about project implementation and outcomes in other parts of this report should be considered before judging the success or otherwise of particular projects. To provide further context about the timeframes for implementation, Figure 1.1 sets out the timelines for commencement of various trial projects across the four communities over the period of the trial.
Fourth, the final column of Table 1.1 seeks to capture information only about the extent of the specific outputs delivered under each project, and not about the outcomes that flowed from those outputs. The purpose of the table is primarily to set the scene for the following discussion about the trial’s outcomes.

15
Evaluation overview
Table 1.1 Summary of implementation status and significant outputs for CYWR projects
Project Description Implementation status Evidence of significant outputs to date
SOCIAL RESPONSIBILITY STREAM—Welfare reform objectives are to rebuild social norms and restore Indigenous authority; build social capital; rebuild voluntary sector
Family Responsibilities Commission (FRC)
Statutory authority empowered to deal with breaches by welfare recipients of behavioural obligations regarding sending children to school, child safety, criminal offences and tenancy breaches
Implemented as agreed FRC established, 19 Local Commissioners appointed and conferences held in all four communities in August 2008. By December 2011, the FRC had: received a total of 9,170 notices involving 1,257 residents of the
communities (78% of the population potentially within the FRC’s jurisdiction (i.e. on income support or CDEP) were clients of the FRC in 2011)
made 5,034 appointments for conferences with 1,062 individuals, with 66% attendance
held 3,818 conferences for 1,002 individuals (60% of the population aged 17 and over)
placed 663 people on a case plan (53% of clients) placed 424 individuals on income management (25% of the population
aged 17 and over) made 1,383 referrals to service providers, at a rate of 2.4 referrals per
case managed client. Conditional Income Management
Compulsory quarantining of a portion of a person’s welfare payments for use on essentials like food, clothing, rent, electricity and child-rearing expenses
Implemented as agreed By December 2011, 424 people (25% of the population aged 17 and over) had been placed on income management in the four communities at some point in the preceding 3½ years, for an average duration of 16.8 months. 93% were compulsory and 7% were voluntary orders. In Hope Vale, Coen and Mossman Gorge, breaches of behavioural obligations fell by about 10 percentage points in the quarter following being placed on income management.
MPower (previously Family Income Management)
Program to train and assist community members in financial management
Implemented as agreed The FIM program reached 1,035 active participants across the four communities by the end of 2010, and by June 2012, the new MPower program had 1,023 members. This represented 63% of the potential membership in Aurukun, 53% in Coen, 33% in Hope Vale and 68% in Mossman Gorge.15
Wellbeing Centres Community-based centres to provide mental health, alcohol and drug services through a holistic care model
Implemented as agreed, although there have been some delays and service delivery difficulties
Centres established in all four communities during late 2008 / early 2009. By December 2011, the centres had an active client caseload of 441 across the four communities, with 21% referred by the FRC. Wellbeing Centres recorded 9,218 service contacts from 2008–09 to 2011–12, rising from 451 in 2008–09 to 3,793 in 2011–12.
15 Cape York Partnerships (CYP), Family empowerment 4th quarter report, April–June 2012.

16
Cape Y
ork Welfa
re Refo
rm—
Evaluation
Project Description Implementation status Evidence of significant outputs to date
Parenting Programs Three-part parenting program (Baby College, Positive Kids, and Strong Families) delivered by CYP
Partially implemented, following delays and service delivery difficulties
By the end of 2011, there were 108 active case/support plans for clients of the parenting programs across the four communities. By June 2012, CYP reported 32 clients of Baby College, 10 clients of Positive Kids and 103 clients of Strong Families.16
Ending Family Violence Program
Expanded availability of three-day cognitive behavioural intervention program developed by Queensland Corrective Services
Partially implemented. Availability of places on the program has not been to the extent intended under the agreement
From July 2010 to December 2011, 154 people were referred to the program by the FRC, with 29 programs delivered and completion by at least 87 people.17
Community Action Fund and People Action Network
Funding support to individuals and groups for activities that promote volunteerism and build positive social norms
Partially implemented. CAF program was underspent and subsequently redesigned in 2011 as People Action Network, but has not been launched due to lack of sufficient funding to roll out as designed
$49,823 was expended from 2008 to the end of 2011 on 24 initiatives (4 in Aurukun, 1 in Coen, 3 in Mossman Gorge and 16 in Hope Vale).
16 ibid. 17 Data about completions are unavailable for one quarter during this period.

17
Evaluation overview
Project Description Implementation status Evidence of significant outputs to date
EDUCATION STREAM—Welfare reform objective is to enable children to achieve their full potential, talent and creativity and enjoy the best of both worlds
Cape York Aboriginal Australian Academy (CYAAA)
A not-for-profit organisation delivering a ‘best of both worlds’ education to Indigenous students. Aims to close the academic achievement gap between Indigenous and mainstream students and to support Cape York children’s bicultural identity. CYAAA curriculum comprises Class (incorporating the Direct Instruction method), Club (enriching extracurricular programs) and Culture (Indigenous culture and language)
Implemented as agreed The CYAAA commenced in Aurukun and Coen in January 2010 and in Hope Vale in January 2011. The school has instituted regular testing of all students. The CYAAA is in the top 100 public schools in Queensland for the 2011 Teaching and Learning Audit by the Department of Education, Training and Employment, achieving a rating of ‘Outstanding’ in 2 of 8 categories. A CYAAA tutorial centre commenced in Mossman Gorge in Term 3 of 2012.
MULTILIT (Making up Lost Time in Literacy)
Establishment of tutorial centres and training for teachers in a catch-up literacy program developed by Macquarie University
Implemented as agreed in Coen, Hope Vale and Mossman Gorge during 2008. MULTILIT commenced in Aurukun in 2009. During 2009–10, a proportion of the funding for MULTILIT was transferred to implement the CYAAA. MULTILIT was transitioned to the CYAAA in Aurukun and Coen in January 2010 and in Hope Vale in January 2011. MULTILIT also ceased in Mossman Gorge in January 2011, and was replaced by the CYAAA tutorial centre in mid-January 2012
Enrolments in the tutorial centres by Semester 2, 2009 reached 81 across the four communities.
Student Case Management (previously Attendance Case Management Framework)
Employment of student case managers (SCMs) to work with parents, students, schools and the broader community to tackle school attendance issues
Implemented as agreed, although there have been service delivery challenges
SCMs were in place at the beginning of 2008 and between 1 and 3 staff have been employed in the communities during the trial (except Coen, which has been served by a floating SCM since 2011). Data about SCM activity are variable due to changes in staffing and in data collection practices, but generally indicate sustained activity throughout the trial.
Student Education Trusts (SETs)
Voluntary money management service to help parents to plan, budget and save to meet their child’s education needs
Implemented as agreed 668 SET accounts were established in the four communities by the end of 2011, comprising a large proportion of parents/carers (e.g. 87% of Aurukun target group, 60% at Hope Vale, 71% at Mossman Gorge and 119% at Coen).18 Across the CYWR communities, about $756,000 was held in SET accounts at the end of 2011.
ABSTUDY mobility provisions
Legislative change to enable secondary students to receive ABSTUDY allowances for attending schools outside their community by bypassing a locally available school (i.e. local high schools available to Mossman Gorge and Hope Vale students)
Implemented as agreed The number of people receiving ABSTUDY allowances increased between 2008 and 2011 at Mossman Gorge, but stayed at similar levels in Hope Vale.
18 Target data are based on DETE Corporate Data Warehouse February 2008 Census information. As new children are born or move into and out of a community, the accuracy of the targets is affected. Targets have not been updated, resulting in small communities, such as Coen, having more children signed up to SETs than are accounted for in Census and target data.

18
Cape Y
ork Welfa
re Refo
rm—
Evaluation
Project Description Implementation status Evidence of significant outputs to date
ECONOMIC OPPORTUNITY STREAM—Welfare reform objective is to support engagement in the real economy through providing jobs and training Business support Provision of mentoring, skills development,
business loans and other support for business development
Partially implemented, with limited take-up of Indigenous Business Australia (IBA) opportunities to date and early progress on identified business development projects in CYWR communities
IBA has provided some business loans and business support in Hope Vale and Mossman Gorge. Queensland Government has funded a range of business development initiatives through Balkanu Cape York Development Corporation and Aurukun Shire Council, leading to some progress on projects such as the Aurukun Sewing Centre.
Opportunity Hubs One-stop shops to access opportunities under the trial such as money management, employment, education trusts, parenting programs, Pride of Place or home ownership
Implemented in Aurukun, Hope Vale and Mossman Gorge, but not in Coen
The new Hope Vale Opportunity Hub (forming part of the business precinct) opened in late August 2012. The Aurukun Opportunity Hub was operational in 2011. The Mossman Gorge Opportunity Hub was operational in March 2012. Development of the Coen Opportunity Hub is still subject to funding negotiations.
Business precincts Funding for construction of business precincts in Aurukun and Hope Vale
Implemented in Hope Vale, but not in Aurukun as originally intended
Hope Vale Business Precinct opened on 29 June 2012. Aurukun Business Precinct is expected to open in February 2013.
Lighthouse projects Support for special economic development projects in each CYWR community
Partially implemented. Hope Vale Business Precinct and Mossman Gorge Gateway Tourism Centre opened and Coen ranger activity and Hope Vale horticulture project underway, but other projects incomplete
Mossman Gorge Gateway Tourism Centre was opened on 7 August 2012, leading to a number of jobs for Indigenous people during the construction and operations. 20 Indigenous rangers employed at Coen.
Mobility assistance Mobility assistance, pre- and post-placement support, training and mentoring for community members to be placed with employers in Victoria
Implemented as agreed, until end of 2009 when funding completed
50 participants undertook pre-employment training and 33 commenced employment outside of Cape York.
CDEP Reform Conversion of CDEP positions into full-time salaried jobs, change of conditions for CDEP participants to support welfare reform and closure of CDEP to new entrants
Implemented as agreed 103 paid jobs were created in 2008–09. The FRC followed up on 51 CDEP participants who were non-compliant with FRC from 2008 to 2011.
Improved employment services
Improved access to employment services in the CYWR communities from 2008, including additional case management assistance to CDEP and more work readiness training
Implemented as agreed Between the second half of 2009 and the second half of 2011, the number of job placement outcomes by Job Services Australia providers in the four CYWR communities increased from under 130 to nearly 200.
HOUSING STREAM—Welfare reform objectives are to move individuals and families from welfare housing to home ownership and to normalise tenancy arrangements Home ownership Remove barriers to home ownership and assist
individuals and families to purchase their own home
Measures to address legislative and tenure barriers have been implemented as agreed, although it has taken considerable time. However, residents have not yet been assisted to purchase their own homes
State legislation amended to enable private residential leases up to 99 years on Aboriginal communities. Agreement to change valuation methodology from market-based to cost-based. By September 2012, 52 expressions of interest assessed for home ownership in Coen and Hope Vale.

19
Evaluation overview
Project Description Implementation status Evidence of significant outputs to date
Normalisation of Tenancy Arrangements
Normalising tenancy arrangements for public housing (normalised rents, clear rights and responsibilities for tenants and consistent enforcement of tenancy agreements)
Implemented as agreed The Queensland Department of Housing and Public Works now manages tenancy arrangements under the mainstream social housing process for all properties except Mossman Gorge. 442 tenancy agreements have been signed in the four communities.
Pride of Place Program to provide funding of up to $15,000 to undertake home improvements for residents who agree to co-contribute funds and provide ‘sweat equity’ in the work
Following underspends early in the program, program was redesigned and has had greater take-up since 2011
Between October 2010 and December 2011, 102 families were actively participating and 42 households completed projects. By June 2012, CYP reported that 9% of Aurukun households had completed projects, with 13% in Coen, 16% in Hope Vale and 43% in Mossman Gorge.

20
Cape Y
ork Welfa
re Refo
rm—
Evaluation
Figure 1.1 Implementation timeline for trial projects
Prior to trial
Jan–Mar 2008
Apr–Jun 2008
Jul–Sep 2008
Oct–Dec 2008
Jan–Mar 2009
Apr–Jun 2009
Jul–Sep 2009
Oct–Dec 2009
Jan–Mar 2010
Apr–Jun 2010
Jul–Sep 2010
Oct–Dec 2010
Jan–Mar 2011
Apr–June 2011
Jul–Sep 2011
Oct–Dec 2011 2012
FRC
Aurukun 13-Mar-08 Cairns Conferencing
Coen FRC Act passed Office Started
Hope Vale open 12-Aug-08
Mossman Gorge 1-Jul-08
Conditional Income Management
Aurukun 1-Jul-08
Coen 1-Jul-08
Hope Vale 1-Jul-08
Mossman Gorge 1-Jul-08
FIM/MPower
Aurukun FIM MPower - trial 3 May 2011, fully operational July 2011
Coen FIM MPower - trial 6 June 2011, fully operational July 2011
Hope Vale FIM MPower - trial 6 June 2011, fully operational July 2011
Mossman Gorge FIM MPower - trial 6 June 2011, fully operational July 2011
Parenting Program (including It takes a Village to Raise a Child)
Aurukun Run by Aurukun Shire Council 1 July - transition to CYP
Coen Funding approved 29 May 2009 Sep-10
Hope Vale Sep-10
Mossman Gorge Sep-10
Ending Family Violence Program
Aurukun Project May-10 QCS QCS/RFDS QCS until
Coen approved May-10 end 2012
Hope Vale March May-10
Mossman Gorge May-10
Wellbeing Centres
Aurukun RFDS Early April 2009 full implementation
Coen contracted implementation Early 2009 full implementation
Hope Vale Jun-08 46 FRC May 2009 full implementation
Mossman Gorge referrals March 2009 full implementation
Community Action Fund
Aurukun Project Board Rollout program No activity
Coen Approval 22-Jan-09
Hope Vale 27-Oct-08
Mossman Gorge

21
Evaluation overview
Prior to trial
Jan–Mar 2008
Apr–Jun 2008
Jul–Sep 2008
Oct–Dec 2008
Jan–Mar 2009
Apr–Jun 2009
Jul–Sep 2009
Oct–Dec 2009
Jan–Mar 2010
Apr–Jun 2010
Jul–Sep 2010
Oct–Dec 2010
Jan–Mar 2011
Apr–June 2011
Jul–Sep 2011
Oct–Dec 2011 2012
Student Case Management
Aurukun Positions filled Jan-09
Coen Positions filled Jul-08
Hope Vale Communities Jul-08
Mossman Gorge consulted Jul-08
MULTILIT/ Cape York Aboriginal Australian Academy
Aurukun Jan-09 CYAAA
Coen Feb-08 CYAAA
Hope Vale Mar-08 CYAAA
Mossman Gorge Mar-08 No activity CYAAA
Student Education Trusts (SET)
Aurukun Aug-08
Coen Mar-06
Hope Vale Jan-08
Mossman Gorge Since 07
ABSTUDY
Aurukun
Coen
Hope Vale
Mossman Gorge
Pride of Place
Aurukun Board Funding Funding Jan-10 Model Implementation
Coen approval resolved varied Last quarter 09 revised of
Hope Vale Dec-08 Mar-09 late June 09 Last quarter 09 revised
Mossman Gorge May-10 model
Improved employment services
Aurukun IEP JSA
Coen delivered
Hope Vale intensive case management
Mossman Gorge
KEY Start of trial Aurukun Start of FRC Coen Pre-clients Hope Vale Mossman Gorge

Cape York Welfare Reform—Evaluation
22
1.7 The key strategic evaluation questions
1.7.1 Was the reform implemented as agreed by the three partners?
Context
The framework for the implementation of the trial is contained in the Project Board Agreement signed by the three partners on 21 July 2008. While the agreement listed 15 core projects under the four welfare reform streams, it is important to note that the overall mix of program elements and many of the individual projects have evolved considerably during the implementation of the trial. This is appropriate, given the innovative nature of the trial and the fact that many of the projects were effectively untried concepts with no existing design templates. As envisaged in the 2008 Project Board Agreement, the tripartite Project Board has been responsible for managing this evolving process of implementation and agreeing to key changes in the trial framework from time to time. Some of these changes were the result of the rapidly shifting policy environment (such as reforms to CDEP) and some arose from an identified need to recalibrate certain programs to improve delivery.
It should be noted that the 2008 Project Board Agreement did not incorporate every element of the welfare reform design recommendations contained in CYI’s 2007 report, From hand out to hand up. Rather, the agreement was devised by the three parties to trial some, but not all, of the ideas from the report. For example, elements of the CYWR design recommendations that were not part of the negotiated agreement include some of the proposed reforms to CDEP, new measures to support mobility for employment or education, and the power for the FRC to place 100 per cent of a person’s welfare payments under Conditional Income Management (rather than just 60% or 75%). The question for this evaluation is whether welfare reform has been implemented as agreed by the three partners in the 2008 Project Board Agreement (and subsequent changes agreed by the parties), not whether the original welfare reform design recommendations have been implemented.
Implementation of the key elements of the trial
The evaluation has concluded that the CYWR has been implemented largely as agreed by the three partners. A detailed discussion of implementation of the trial is contained in Chapter 3, written by SPRC. In addition, in 2010, KPMG conducted a review specifically on the implementation of the FRC. Table 1.1 provides a snapshot of the status of implementation of the various components of the trial, and illustrates that most elements have been implemented fully and that at least some progress has been made in relation to all projects under the trial.
An aspect of the trial’s implementation that is worth highlighting is the Family Responsibilities Commission (FRC). As the pivotal new institution in the welfare reform framework, the FRC’s effective implementation was crucial to the trial’s overall success. Yet the challenges in establishing this body were substantial. Apart from the usual difficulties in implementing any new initiative in remote Indigenous communities (discussed above), the FRC was a new statutory body with no antecedents required to establish a complex administrative process that integrated with multiple state and Commonwealth statutory frameworks (Centrelink, magistrates courts, child protection, Education Queensland and public housing). Moreover, it was required to become operational with a relatively small complement of staff in a short period of time and begin servicing large numbers of clients across four quite different communities, while building a referral and monitoring system incorporating a range of support services. In addition, performance of the FRC’s functions was contingent on a pool of part-time Local Commissioners with varying levels of experience and training. Due to interest in the initiative, the FRC has also been subject to a heavy statutory reporting burden, with the legislation requiring quarterly reports setting out detailed performance data.
In these circumstances, the successful implementation of the FRC has been a significant achievement. The KPMG review of implementation of the FRC in 2010 concluded that, after 18 months of operation, the FRC had been successfully implemented as intended in all four

Evaluation overview
23
communities.19,20 Noting the challenges and complexity involved in establishing the FRC, the review found that the Commission’s ‘structures and processes conform to good practice principles’ and that it had put in place the ‘foundations and enablers’ to effect behavioural change in the communities. Two years on from this mid-term implementation review, the more recent evaluation activities have confirmed that the FRC continues to function effectively and is a successful element of the trial, particularly in relation to the conferencing undertaken by Local Commissioners (see Section 3.2, key finding 7).
Other key projects that support the FRC’s role under the trial’s Social Responsibility stream, such as Conditional Income Management, MPower and the Wellbeing Centres, have also been implemented as agreed. As Table 1.1 illustrates, the Parenting Program and the Community Action Fund have been the projects in the Social Responsibility stream that encountered the most challenges and delays in implementation.
In the Education stream, all the projects were implemented as originally agreed. However, the MULTILIT program was superseded by the establishment of the CYAAA in Aurukun and Coen in 2010 and Hope Vale in 2011, and by the establishment of a CYAAA tutoring centre in Mossman Gorge in mid-2012.
The least successful implementation of the projects under the trial has been under the Economic Opportunity and Housing streams. In relation to economic opportunity, the agreed CDEP reforms and enhanced employment services were implemented, but the employment mobility assistance activity was not continued beyond 2009 and progress on the establishment of business precincts and ‘lighthouse’ projects and the delivery of business support initiatives has been slow and uneven. After four years, the Hope Vale Business Precinct has only just opened, and the planned Aurukun Business Precinct is not expected to open until later in 2013. There is little evidence of successful establishment of sustainable businesses in the communities, although foundation work has been underway for some projects. Economic development is undoubtedly one of the most difficult areas in which to make headway in remote Indigenous communities characterised by low levels of business skills and experience, historical and structural barriers to economic participation, and limited regional economic opportunities. It also appears that the Cape York regional organisations and local councils tasked with implementing some of the economic development initiatives are still building their capacity to deliver these projects.21
In the Housing stream, the planned normalisation of tenancy arrangements has largely occurred following the Queensland Government’s assumption of tenancy management functions in the communities. The Pride of Place program took time to be established, but appears to be gathering momentum in the last 18 months. However, progress implementing one of the key elements of the welfare reform agenda, private home ownership, has been slow.22 Significant work has been done to address the legislative, tenure and policy barriers to private home ownership on communal land, but to date no residents of the four communities have purchased homes as envisaged.
19 KPMG 2010, p. 8. 20 KPMG noted that the only elements of the FRC model that had not been implemented as planned were the employment of local FRC case managers and the fact that the Commission had commenced operations prior to the establishment of key support services for referral of clients. The case management issue is discussed later in this chapter in relation to service delivery. Two years on, the range of planned support services to which the FRC can refer clients is now largely in place, although there have been delays and inadequate availability of some services, such as parenting programs and Ending Family Violence programs. 21 The service delivery study notes that ‘Cape York regional Indigenous organisations, namely CYP, Cape York Institute and Balkanu, were required to be established, expanded or strengthened to provide leadership and deliver components of the CYWR without initially having the infrastructure or skill pool required’ (Migration Plus, Consultation paper regarding desk top research and qualitative analysis of service delivery trends apparent from the CYWR initiatives: Focus area Aurukun, FaHCSIA, 2012, p. 29). 22 See Chapter 3, section 3.4.4, for more details. Respondents in the qualitative interviews of service providers for the service delivery study indicated that the housing aspect of welfare reform had largely not been addressed to date (Migration Plus 2012, p. 12).

Cape York Welfare Reform—Evaluation
24
Although the overall implementation of the trial appears to have occurred largely as planned, feedback by stakeholders in the evaluation activities highlighted that there needed to be more regular project-level implementation reviews.23,24 Given the fact that many of the trial’s projects are novel and untested, implementation reviews will be critical to refining or recalibrating the delivery of programs to ensure they meet their objectives.
Implementation challenges
SPRC’s overall review of the trial implementation concluded that ‘despite all of the challenges of implementing such a complex and novel set of reforms, the trial has been implemented successfully’.25 This is not to say that the implementation process has been smooth and linear. There have been significant variations in the mode and timetable for implementation of some of the projects across the four communities, as indicated in Chapter 3. SPRC identifies five factors that impacted on implementation:
strategic issues—for example, the policy and legislative barriers to home ownership in Indigenous communities
funding arrangements, which took time to resolve between the Queensland Government, the Australian Government and Cape York service delivery organisations in relation to some programs
whether projects were existing programs that could be readily rolled out, or new projects requiring lengthier start-up times to put funding and operational requirements in place
differences between the communities, such as varying levels of local infrastructure and capacity and a different current mix of programs and services for new initiatives to align with
the practicalities of delivering programs in remote communities, especially workforce and accommodation challenges.
These are, of course, challenges that confront agencies seeking to deliver programs in any remote Indigenous community in Australia. In the case of the CYWR, they have led to delays with some initiatives, as indicated in Table 1.1, but there has nevertheless been at least some progress in the implementation of all elements of the original package of reforms. The ability to ‘cut through’ some of the typical implementation barriers listed above may be attributable in part to the high level of commitment to the trial embodied in the governance arrangements. For example, the seniority of the government members of the Project Board is sometimes useful in addressing lack of cooperation by local offices of state or Commonwealth agencies. The efficacy of the governance arrangements is discussed below. The significant resourcing available to implement the projects may also account for the relatively successful rate of implementation. Another factor may be that the tripartite partnership arrangement creates a culture and a mechanism by which each party is kept accountable for delivering on their obligations by the other parties.
Community engagement
One of the most significant risks to the successful implementation of new programs delivered in remote Indigenous communities is the failure to establish robust foundations through early and ongoing engagement with the affected community. For example, the evaluation of the Northern Territory Emergency Response (NTER) found that, while the rapid delivery of much-needed services was generally welcomed by Indigenous communities, inadequate community engagement had a detrimental impact on implementation of the measures, and caused some community resentment
23 Migration Plus 2012, section 9.7. 24 J Putt, Service delivery, results from the survey of service providers, report for the evaluation of the Cape York Welfare Reform trial, FaHCSIA, 2012, p.12. 25 Chapter 3, Section 3.1.

Evaluation overview
25
towards the reforms.26 In the implementation of the CYWR, 18 months of consultation and community engagement was undertaken prior to the trial commencing and agreement was obtained from representative bodies in the four communities regarding each community’s participation. In the current evaluation, there was, however, a common view expressed by community stakeholders that they felt they had not been adequately consulted or informed during the implementation phase once the trial commenced.27 This view was expressed by those who supported as well as those who opposed the trial.
The question of consultation during implementation of the trial highlights the difficult balance between trying to implement a carefully designed integrated package of reforms while ensuring consultation and adaptation regarding the elements of the reforms to address differences in each community.28 The proponents of the reforms would emphasise the extensive community consultation that informed the design of the reform package, leading to agreement by community leaders to implement the trial. This might be considered to provide a mandate to implement the trial as a package without extensive further consultation. In addition, a level of disgruntlement is perhaps inevitable for a radical change process that impacts on many residents’ daily lives. The trial’s philosophy regarding encouraging or even mandating individual responsibility and targeting dysfunctional behaviours is no doubt challenging and confronting for many. Ultimately, this issue does not seem to have resulted in a significant groundswell of ongoing community opposition to the reforms—in fact, support for the trial appears to have grown over time.29
In Hope Vale, however, the social change survey revealed a higher level of dissatisfaction with welfare reform than in the other three communities.30 This is likely linked to the vocal opposition of the Hope Vale Aboriginal Shire Council to the trial in recent years, although it is unclear whether the council is simply reflecting the views of a portion of its constituency31 or whether its own actions have actively generated community opposition. It is notable that a higher proportion of Hope Vale residents are effectively ‘spectators’ to the trial, in that they have had no contact with the FRC or the support services.32 The social change survey shows that members of this segment are more likely to be male, young, without children and to work for council. They are least likely to support the FRC, while residents who have been before the FRC are most likely to support it.33
Hope Vale Council initially signed up to the trial, but has since become a vocal opponent. The failure to sustain a partnership with the Hope Vale Council has been a significant shortcoming in the trial’s implementation. The ongoing support of local community leadership is a critical prerequisite for a program designed to lead behavioural change at the community level. Many of the council’s expressed concerns reveal a perception that it is inadequately involved in the planning or delivery of projects under the trial.34 Queensland Government consultations in 2012 confirmed that the Hope Vale Council was supportive of many of the new support services and opportunities delivered under
26 FaHCSIA, Northern Territory Emergency Response: evaluation report 2011, pp. 11–14. For another example, see M Limerick, Review of the Palm Island Community Company—Report of Phase 1: Implementation, June 2010. 27 See Chapter 3, Section 3.7.9; Colmar Brunton, Social change research study: aggregate report, pp. 39–40; J von Sturmer and S le Marseny, Living under the Family Responsibilities Commission: experience and testimony ‘Speaking straight, speaking from the heart’, report to FaHCSIA, 2012. This was also noted in the consultation report for the extension of the trial in 2011 (Cape York Welfare Reform Trial Extension consultation report, 2011, p. 8). 28 Chapter 3, Section 3.7.9. 29 See, for example, Chapter 6, Section 6.4.2: ‘The scepticism and resistance to the FRC found in earlier reviews seems to have dissipated: both local residents and service providers are now mostly positive about its role and efficacy’. 30 Colmar Brunton, ‘Social change research study: Hope Vale community report’, unpublished report prepared for FaHCSIA, Canberra, 2012, pp.102, 105. 31 The size of the opposition to the trial as a whole is difficult to gauge, but 34% of Hope Vale respondents to the social change survey indicated strong disagreement with the statement ‘I want the FRC to keep helping people’. 32 Colmar Brunton, Social change research study: aggregate report, 2012, p. 71. 33 ibid., p. 149. 34 SPRC observed that ‘many of the tensions around welfare reform appear to arise from questions or ownership of the programs and services (and funding) rather than about the basic nature of the CYWR trial itself, although there was also some disagreement about the underpinning philosophy of the CYWR trial’ (Chapter 3, Section 3.7.7). The competition over funding and programs as an explanation for Hope Vale Council’s opposition also came through strongly in one of the qualitative interviews with community members (von Sturmer et al. 2012).

Cape York Welfare Reform—Evaluation
26
the trial, but believed that the council should be funded for these programs.35 This suggests that the council is not opposed to the welfare reform philosophy and might have been prepared to support the reforms if a cooperative relationship had been nurtured.36 The question of the appropriate role of a local government in programs about welfare reform is relevant here. It might be argued that councils do not have a legitimate role in social, welfare and educational services as they are not core local government issues. On the other hand, aspects of welfare reform where local governments might have a legitimate interest include housing and economic development. Consistent with this, Hope Vale Council was funded for infrastructure, Pride of Place and business development projects during the trial.
Sustaining the partnership with the Hope Vale Council is one area where the Project Board does not seem to have succeeded in its role of resolving issues to ensure the effective implementation of the trial.37 Part of the problem might have been that some of the proposed governance arrangements were not implemented as planned, affecting opportunities for the regular and ongoing participation of local leaders. This is discussed further in Section 1.7.4.
1.7.2 Are social norms and behaviours changing?
Introduction
The CYI defines social norms as ‘a coincidence between socially accepted values and social behaviour’.38 The thinking that underpins the design of the trial is an assumption that the values held by Cape York Indigenous community members are largely positive values that emphasise things like care for children, the importance of education and work, pride in the community and respect for elders. However, behaviour no longer aligns with these values because of passivity, perverse incentives and erosion of capabilities brought about by the welfare system and a breakdown (or disempowerment) of Indigenous authority’s capacity to uphold positive values by enforcing behavioural standards. The trial aims to simultaneously attack these issues of passivity, disincentives, lack of capabilities and erosion of Indigenous authority in order to rebuild positive social norms. This theory of social change is set out in the program theory for the trial shown in the evaluation framework (see Figure 1.2). The ultimate indicator of the trial’s success will be evidence that this process of rebuilding social norms is occurring, even if only in its early stages.
For the evaluation, Reynolds, Subasic and Jones, researchers at the Australian National University, were asked to investigate how the social survey results can be explained from a social psychology perspective (see Chapter 5). They argue that the ‘theory of social norm and behaviour change that underpins the CYWR trial is well grounded in social psychology theory and research’.39 Social norms are defined in social psychology as ‘accepted or implied rules of how group members should or do behave’ and can be either ‘descriptive norms’ describing current standards of behaviour or ‘aspirational norms’ stipulating desired standards of behaviour.40 The trial therefore seeks to move behaviour in the communities into line with the aspirational norms that align with the positive values held by community members around issues such as education, work and care for families and children.
35 Explanatory Notes, Family Responsibilities Commission Amendment Bill 2012, p. 8. 36 The service delivery study suggested that consideration could be given to contracting more of the service delivery under welfare reform to local councils (Migration Plus 2012, p. 54). 37 In the Project Board Agreement, one of the listed responsibilities of Project Board members is ‘Ensuring effective engagement with the four councils involved in the trial’ (p. 11). 38 CYI, From hand out to hand up, p. 41; see also Pearson, 2006 Arthur Mills Oration, delivered to the Royal College of Physicians, 2006. 39 Chapter 5, Section 5.3.1. 40 Chapter 5, Section 5.1.

Evaluation overview
27
How to measure whether social norms are being rebuilt
Evaluating whether the trial is rebuilding positive social norms requires the following steps:
1. identifying the specific desired behaviours that the trial seeks to encourage in order to align with the positive values held by community members around issues such as education, work and care for families and children
2. measuring whether the desired behaviour is, in fact, occurring (or at least whether community members are changing their attitudes and striving towards the desired behaviour)
3. seeking evidence as to whether it is the activities under the trial that are causing the changes in behaviour, rather than other factors.
In relation to the first step, draft program logics covering all of the trial components have been formulated by the CYI to further particularise the specific behavioural change outcomes that the various trial activities are designed to bring about in the short-, medium- and long-terms. These desired behaviour changes relate to the four streams of social responsibility, education, housing and economic opportunity. For the purposes of this chapter’s analysis of the trial’s progress in rebuilding norms, Table 1.2 presents a simplified summary of the key behaviour changes sought from the trial.
Table 1.2 Key desired behaviour changes and trial components intended to achieve them
Stream Key desired behaviour changes Main drivers/incentives/catalysts for change Social Responsibility
Parents send children to school consistently People care for children and families and ensure
their needs are met Individuals take responsibility for addressing
problems and improving their lives through self-help
Community members show increased volunteerism People commit fewer offences Fewer people abuse alcohol
FRC and Income Management Student case managers Student Education Trusts MPower financial management Wellbeing Centres Parenting Programs Community Action Fund Ending Family Violence program
Education Children attend school more regularly Children are sent to boarding schools outside
communitya Students improve educational achievement
FRC and Income Management Student case managers Cape York Aboriginal Australian Academy and
MULTILIT ABSTUDY mobility provisions Student Education Trusts
Housing Tenants are responsible (pay rent, maintain house, avoid nuisance to neighbours etc.)
People take pride in their homes Individuals and families move to private home
ownership
FRC and Income Management Pride of Place Normalisation of tenancy arrangements Home ownership support MPower financial management
Economic Opportunity
People move from welfare to employment People increasingly ‘orbit’ from the community for
work Residents establish more local businesses
CDEP reform Improved employment services Business support Mobility assistance Business precincts Lighthouse projects
a An initiative to encourage greater take-up of boarding school was already in place before the CYWR. Source: Adapted from Cape York Institute draft program logic.
The second step in the analysis seeks to measure whether the desired behaviour change is occurring, or at least whether people are striving towards the desired behaviour. Depending on the behaviour being measured, a range of data might be relied upon, such as administrative data (e.g. school attendance records or program output data), statistics (e.g. census or crime data) or qualitative observation and feedback. The evaluation has also included a social change survey of community

Cape York Welfare Reform—Evaluation
28
members that contains information about self-reported behaviour as well as perceptions of behaviour change in the past three years. In addition, a survey of service providers included questions about their perceptions of behaviour change in the trial communities. Although measurement of some behaviours is particularly difficult, by using the multiple sources of data available from the evaluation it is usually possible to draw some conclusions about whether behaviour has changed or is changing. In some cases, it is only possible to determine whether attitudes are changing, as there may be unresolved barriers to the desired behaviour. For example, there might be an increased willingness to take up private home ownership, indicating that a norm is being built around this option, but barriers may still be preventing people from taking up the option.
Where positive behavioural change is evident, the third step in this analysis is to identify the extent to which the projects and activities under the trial contributed to the change, rather than other factors. The draft program logics spell out the sort of behaviour change that each project under the trial is intended to bring about. The projects which relate to the desired behaviour changes can be seen in Table 1.2. This illustrates that for some behaviour changes there are several activities that are intended to work together to bring about the desired behaviour change. All of the trial activities are intended to act as drivers, incentives and catalysts for behaviour change. To judge the success of the trial, it is critical to find evidence of direct links between the project and the behaviour change, although this evidence may not always be available from the data.
If it is concluded that the trial activities are causing behaviour change, a further step is to consider how sustainable this change is. The design report draws on social psychologist Herbert Kelman’s work on attitude formation to suggest that norms can be built through three processes: compliance, identification or internalisation.41 The trial design envisages that measures to encourage people to change their behaviours as a result of compliance (e.g. the FRC’s legislative sanction of income management or the prospect of being shamed at an FRC conference) will operate together with incentives to shift enough people to adopt the desired behaviour so that other individuals will also seek to adopt the behaviour in order to identify with the group. Further, the more that people comply with the behaviour, and identify with the group that is behaving positively, the more internalised the values and behaviour will become, to the point where they are automatic. Under this theory, a key question to ask about any desired behaviour change that is apparent is whether people are merely complying due to the sanction, or whether they have changed because they have started to identify with the group or even started to internalise the behaviour. The theoretical framework considers compliance and identification as steps on the way to norm change, while internalisation will indicate that the positive norm has coalesced to the point where it is sustainable.
Are behaviours changing?
In line with the evaluation process described above, in this section each of the desired behaviour changes mentioned in Table 1.2 is considered in turn to determine:
whether there is evidence that the desired behaviour is occurring (or at least attitudes are changing in favour of the desired behaviour)
if so, whether there is evidence that the change has been caused or at least contributed to by the trial
whether the behaviour change indicates mere compliance or a more sustainable process of norm formation.
41 CYI, From hand out to hand up, pp. 40–41. In fact, the Cape York Institute’s theoretical work seeks to take Kelman’s theory further by suggesting that there can be a continuum of change, starting with compliance, moving to identification and then finally to internalisation. In his 1958 paper on attitude change, Kelman proposed compliance, identification and internalisation as three different processes of influence on behaviour, not three sequential steps.

Evaluation overview
29
School attendance
The evaluation has found that the most significant behaviour change during the period of the trial has been a substantial increase in school attendance in Aurukun. School attendance rates started from a low base in Aurukun and have shown significant variation from term to term, but there has been a significant upward trend since the trial commenced. For example, the published school attendance rate for Aurukun increased from 46.1 per cent in the first term of 2008 to 70.9 per cent in the first term of 2012, an increase of 24.8 percentage points (see Figure 8.1). There are limitations in identifying statistically significant changes in published school attendance rates, so the evaluation analysed unit record data for individual students relating to unexplained absences from school.42 Unexplained absences fell significantly in Aurukun between 2008 and 2009.43 The analysis of unexplained absence rates reveals that in 2008, only one-third of enrolled students in Aurukun were in school on any given day. By 2011, this had roughly doubled to two-thirds of students attending school on any given day.44 Not surprisingly, in the social change survey the residents of Aurukun nominated ‘More kids going to school’ as the most significant change in the last three years.45
The unexplained absence rates also show a small but statistically significant increase in school attendance at Mossman Gorge between 2008 through to 2011.46 Coen and Hope Vale have historically had comparatively high rates of school attendance prior to the trial. The unexplained absence rate revealed no change in Coen school attendance during the trial, while Hope Vale exhibited a very small decline in attendance, which occurred in 2011.
Although a statistically significant improvement in school attendance was not evident in Hope Vale or Coen during the trial period, there is a perception by residents that attendance has improved in their communities. Residents of Coen and Hope Vale put forward ‘More kids going to school’ as the most significant change in the last three years, while residents of Mossman Gorge thought it was the third most significant change. There are several explanations for this apparent incongruence between community perception of improved school attendance and the statistical measures. The practice of counting attendance has been much more rigorous under the trial, so the statistics from before the trial may be overestimates. Also, community perceptions might relate to qualitative issues such as parental attitudes towards sending children to school, the level of readiness and enthusiasm of children for school and their willingness to stay for a full school day.47 The daily CYAAA program in three of the communities runs for longer hours than regular schools, so the participation of students in this longer school day might also explain perceptions that there is higher school attendance. Parents’ perceptions about the importance of sending their children to school may also have been affected by the regular visits by student case managers following up on children who have not attended school.
The rapid improvement in school attendance in Aurukun is not part of a broader upward trend in school attendance in Queensland Indigenous communities. The evaluation found compelling evidence that it has been a direct outcome of the trial, and especially the work of the FRC. Increased school attendance was one of the main objectives of the FRC, complemented by support for families through the Attendance Case Management framework. The FRC is able to counsel parents about the importance of school attendance and refer them to appropriate support services to deal with issues that may be affecting school attendance. Where parents continually breach their obligation to send their children to school, the FRC can impose Conditional Income Management. Conferences with parents about non-attendance of children at school have constituted a large part of the FRC’s
42 It should be noted that the analysis considered whether improved school attendance could be a result of a greater proportion of absences being ‘explained absences’ (i.e. where parents provide reasons), but this was not found to explain changes in attendance rates (see Figure 8.7). Rather, changes in attendance rates are linked to numbers of unexplained absences. 43 Chapter 8, Figure 8.5. 44 Chapter 8, Figure 8.5. 45 Colmar Brunton, Social change research study: aggregate report, 2012, p. 53. 46 Chapter 8, Section 8.4.3. 47 For example, von Sturmer reported the views of one of his informants as follows: ‘There has been a very significant shift in the attitude of community members towards sending their children to school. Whilst he said he had never seen any figures on whether school attendance had increased, he feels “the general attitude of community members towards school being a priority has increased”’, von Sturmer et al. 2012, Chapter 4.

Cape York Welfare Reform—Evaluation
30
workload.48 The largest increase in Aurukun school attendance occurred in 2009, the year following the establishment of the FRC, and those levels were sustained or increased for the rest of the trial period. The rise in attendance was considerably larger for those students whose parents were under the jurisdiction of the FRC than for those whose parents were not.49
The evaluation analysed the FRC administrative data and school attendance records to explore the link between the FRC’s work and increased school attendance in Aurukun.50 The FRC had 12 conference sitting weeks in Aurukun across the 2009 school year. The data analysis revealed that in the month following these conferences, unexplained absences for students who were the subject of conferences were on average 25 per cent lower than in the month prior to the conferences. The analysis of individual unit data for Aurukun students showed that the improvement in a student’s attendance was not just short term, but sustained over time. Individual students who were the subject of an FRC conference in 2009 had a 16 per cent lower unexplained absence rate one year after the conference.
Since the initial significant increase in school attendance in Aurukun following the introduction of the trial, further improvements have been more difficult to achieve.51 The FRC has continued to hold regular conferences, but has reported that it is increasingly dealing with a smaller number of families whose behaviour is more difficult to change.52
An apparent anomaly is that the number of conferences held in Aurukun in relation to school attendance has actually increased during the CYWR, despite the improvement in attendance rates. However, this is largely explained by the fact that these conferences now relate to a smaller number of unexplained absences. In 2009, each conference with an individual about school attendance was related to on average 30.3 unexplained absences by a student; while in 2011, the conferences related to only 11.8 unexplained absences.53
The question arises as to what extent initiatives or contextual factors other than the FRC might have contributed to the improved school attendance in Aurukun from 2009. Although student case managers were in place in 2009, the service was encountering significant establishment difficulties and is unlikely to have had a significant impact at that time. This service has complemented the FRC’s efforts over the course of the trial, however. It is possible that the reduction in trading and subsequent closure of the Aurukun tavern from March 2008 may have improved the conditions for school attendance, although the actual improvement in attendance rates did not occur until 2009. Another reform that occurred during the period of the trial, the establishment of the CYAAA in Aurukun in 2010, may have been a factor in sustaining the improvements in school attendance. With the FRC as a ‘push’ factor, a positive school environment is also necessary as a ‘pull’ factor to encourage children to attend school. In the Aurukun social change survey, residents were overwhelmingly very positive about the improvements in the school since the CYAAA took over.54
The evidence in the administrative data about the FRC’s impact on school attendance is confirmed by the community’s feedback in the social change survey. Respondents confirmed that the FRC had encouraged them to make better choices, and improving their children’s school attendance was a common response.55 Comments in the survey included: ‘Gave me a kick in the bum, made me think about what was good for my son’; ‘Help[ed] me with school attendance, helping parents with problem solving’; ‘They helped me get my grandchildren to school’.56 In anthropologist John von Sturmer’s 48 Chapter 7, Section 7.5.3. 49 Chapter 8, Section 8.4.3. 50 ibid. 51 See Chapter 8, Figure 8.10. 52 This observation is reinforced by the evaluation’s analysis of the differential impact of the trial on segments of the population, discussed in Section 1.8.2. 53 Chapter 7,Section 7.7.1. 54 Colmar Brunton, ‘Social change research study: Aurukun community report’, unpublished report prepared for FaHCSIA, Canberra, 2012, p. 28, Table 7. 55 ibid., p. 43. 56 ibid.

Evaluation overview
31
interviews with Aurukun residents, he noted that ‘all agree that the operation of the FRC has been decisive in encouraging parents and grandparents to get their children or grandchildren to school’.57 One of the interviews provides an insight into the role that the FRC plays in shifting mindsets and making parents accountable:
The community understands FRC in a way; the community needs to listen to them … I ask myself why my grandson has not gone to school. This is what the FRC challenges me with. I can’t keep on coming up with excuses. This puts me in an awkward position. We need to clean up first issues first.58
It is clear that in a community with very low attendance rates such as Aurukun, the trial has had a demonstrable impact on changing people’s attitudes and, more importantly, behaviour around sending children to school.59 The FRC has proven a successful intervention to challenge aberrant behaviour and rebuild the social norm around school attendance. In this important respect, the trial is succeeding in its aim to rebuild social norms.
Sending children to boarding school
The trial also aimed to inculcate the practice of sending children away from the community to secondary boarding schools. This is based on the philosophy that attendance at boarding school will provide a better education than attendance at local schools and, more importantly, will better equip students to ‘live in two worlds’. Boarding school is expected to enable children to be ‘bi-cultural’, so they are competent not only within their own community but also in the mainstream world beyond. This is seen as is an important prerequisite to being able to engage in the wider economy.
Students from Coen, Mossman Gorge and Hope Vale already travel outside their communities for high school as the local schools have not offered secondary year levels, but Aurukun students have had the option of completing high school in Aurukun. The number of students from Aurukun who have transitioned to a high school outside the community has doubled during the term of the trial, from 39 in 2008 to 78 in 2011.60 The high schools attended are across the state, including in Cairns, Townsville and south-east Queensland.
It is difficult to ascertain what impact the projects under the trial have had in increasing the number of students at Aurukun attending high school outside the community. During conferencing with parents, the FRC Local Commissioners encourage parents to send their children to boarding school. The trial also intended to provide further support in this area by encouraging parents to establish SETs that can provide for boarding school fees. The positive take-up of the SET scheme provides a solid foundation in the long term for growth in the number of students accessing boarding school. Another driver during the trial for greater boarding school take-up has been the policy of the CYAAA to transition all students to boarding schools where possible.
Other factors have contributed to the increase in the number of Aurukun children attending boarding school in recent years. DETE’s Transition Support Service (TSS)61 provides support to students from across Cape York making the transition to boarding schools.62 The CYI has also supported an
57 An example of an individual who reported the success of an FRC intervention is the following: 'After being placed on the BasicsCard she was motivated to reduce the absenteeism of her daughter and through a range of reward strategies that were negotiated between parent and child and with the assistance of the school attendance officers and the FRC Commissioners, the absenteeism was reduced to an acceptable level within six months and then over the following six month period brought within Education Queensland guidelines', von Sturmer et al., 2012, Chapter 4. 58 von Sturmer et al., 2012, Chapter 4. 59 Respondents to the service provider survey also commented on this. For example, one respondent said: ‘FRC has made a significant impact in creating a social norm regarding school attendance and local leaders and community members valuing education’ (J Putt 2012, p. 37). 60 Chapter 8, Table 8.2. 61 The TSS unit started working during 2005 in Aurukun, Coen and Hope Vale. Then from January 2007 TSS, in its current iteration, has been officially funded by the government. 62 DETE reports that the TSS implemented a focused strategy to increase the total number of students transitioning to the secondary phase of schooling and that ‘these actions resulted in an increase in total numbers supported by TSS in Aurukun’ and an increase in the numbers attending boarding school from Cape York and Torres Strait from 328 in 2008 to 599 in 2011.

Cape York Welfare Reform—Evaluation
32
increasing number of students in recent years to take up scholarships at boarding schools under its Cape York Leaders Program.
Under the trial’s design, one of the intended drivers for increased boarding school take-up was the ABSTUDY mobility provision, which enables students to obtain ABSTUDY support for bypassing a locally available high school opportunity (such as the Cooktown High School accessible to Hope Vale students and the Mossman High School available to Mossman Gorge students) in order to attend a boarding school elsewhere. However, the available data do not indicate any upward trend in the numbers of Mossman Gorge and Hope Vale students accessing boarding school as a result of this change.63
While the evidence shows increased numbers of Aurukun students have transitioned to boarding school outside of Aurukun, improving the retention of students at boarding school is an ongoing challenge—the Queensland Government reports that in 2011, 22 per cent of students supported by TSS at boarding schools were not retained in their school of enrolment and returned to their home communities. This rate has been up to 50 per cent in Aurukun. About 42 students of compulsory high school age in Aurukun who are not enrolled are being case managed by the Aurukun Multi-Agency Case Management Team.
Is the trial succeeding in building a norm around the importance of sending children to boarding school? The social change surveys indicate 86 per cent support among parents for sending children outside the community to boarding school. As the surveys are a snapshot of opinion, it is not clear whether this support has increased during the trial. It is not possible to measure the extent to which the incentives for the greater take-up of this option and the encouragement provided by the FRC and support services have encouraged more parents to send their children to boarding school. It seems likely, however, that the consistent messaging around this during the trial is reinforcing a social norm or expectation that children should attend boarding school.
Improved educational achievement
The trial aims to reinforce the social norm that children are encouraged to do well at school and that communities place a high value on educational attainment. Initially, the main driver was intended to be the MULTILIT accelerated learning program, which provided remedial support to students. This program was superseded in three of the communities by the CYAAA, with its full immersion of students under the Direct Instruction method.
Census data reveal an increase in the proportion of residents of the trial communities who have completed Year 12, and a reduction in the proportion that have left school before Year 10.64 This improvement is not unique to the trial communities, however, as a similar trend is evident in Indigenous communities across Queensland.
The CYAAA is subject to a separate independent evaluation, to be finalised in 2013. It has only been in operation since 2010 in Aurukun and Coen and since 2011 in Hope Vale. The CYAAA has reported that its internal testing shows early indications of improved educational outcomes for students. Given the historical gap in educational outcomes for Indigenous communities, the ability to close the gap is greatest for those students in the earlier years. CYAAA’s testing indicates that an increasing number of students in the early years of schooling, who have had the benefit of Direct Instruction since earlier in their education, are achieving grade level in reading and maths.65 For students in later years, the best measure of progress is whether they are closing the gap with mainstream outcomes at an
63 The number of Hope Vale students assisted by TSS to attend boarding school has not increased since 2008, and the number of students receiving ABSTUDY away from home benefits has not increased. Data are not available for Mossman Gorge because numbers less than 20 are not reportable due to privacy limitations on social security data. 64 Chapter 8, Table 8.6. 65 CYAAA summary progress report, September 2012. Also, see Appendix B, Section B.2.2.

Evaluation overview
33
accelerated rate. The CYAAA’s testing using DIBELS66 measures reports that the gains made by 80 per cent of students between 2010 and 2011 met or exceeded the expected growth benchmarks of the average classroom.67 The upcoming CYAAA evaluation will further assess these apparent improvements in learning outcomes.
National Assessment Program—Literacy and Numeracy (NAPLAN) testing results are highly variable in communities with small class sizes and do not easily measure whether the gap in learning outcomes is being closed. It has not been possible to discern a consistent trend in NAPLAN results for the trial communities from the available data.68 The NAPLAN testing of Year 3s in 2013 will provide an indication of whether the reported success of students who have undertaken Direct Instruction since commencing school translates into meeting national benchmarks. The proportion of students who actually participate in NAPLAN testing could also be a measure of success.
Aside from the data on educational attainment, the evaluation revealed some additional information on the CYAAA. The social change survey data show very strong community satisfaction with the CYAAA in Aurukun and Coen—90 per cent of Aurukun respondents felt the school was better since the CYAAA took over, while 82 per cent of Coen respondents believed this was the case.69 In Hope Vale, there are much more divergent views on the academy, but positive views outweigh the negative.70 These community perceptions were also apparent in some of the qualitative data collected for the evaluation activities. For example, the case studies conducted by von Sturmer found that people felt better reading and writing skills will support children to complete the mainstream curriculum.71 However assessment of the success of the CYAAA is not within the scope of this evaluation.
Overall, there are some positive early signs about improvement in educational achievement by students in communities under the trial. The trial’s activities appear to be laying foundations for further and sustained progress in educational outcomes in the form of increased school attendance, community support for the new CYAAA, the apparent success of the Direct Instruction teaching methods, increased parental savings for educational purposes through SETs, and increasing numbers of students transitioning to secondary boarding schools. The high level of community ‘buy-in’ to these educational initiatives provides a positive indicator that a recognition of the value of education is being increasingly reinforced by supporting behaviours, which suggests that a positive social norm is being built.
Caring for children and families
The trial aims to reinforce positive social behaviours in relation to the care of children and families. Underpinning this goal is the notion that individuals need to take increased responsibility for meeting the needs of their children and families, rather than relying on welfare services and the government. The FRC provides firm guidance to individuals about their responsibilities and is able to order Conditional Income Management for a period to ensure that families’ essential needs are met from welfare payments. Programs such as MPower, SETs, the Wellbeing Centre and the parenting programs recognise that individuals need assistance to build the capabilities to meet their obligations.
66 DIBELS = Dynamic Indicators of Basic Early Literacy Skills, a standardised way to assess students’ progress towards becoming proficient readers. 67 CYAAA summary progress report, p. 6. It should be noted that this does not reflect all students, as this comparison can only be made for those who were tested both in late 2010 and in early 2011. 68 Chapter 8, Section 8.5.4. 69 Colmar Brunton, ‘Social change research study: Aurukun community report’, unpublished report prepared for FaHCSIA, Canberra, 2012, p. 28, Table 7; Colmar Brunton, ‘Social change research study: Coen community report’, unpublished report prepared for FaHCSIA, Canberra, 2012, p. 27, Table 7. 70 41% agreed that the school had improved under CYAAA, while 29% disagreed, with the rest answering neither one way nor the other (Colmar Brunton, ‘Social change research study: Hope Vale community report’, unpublished report prepared for FaHCSIA, Canberra, 2012, p. 29, Table 7). 71 von Sturmer et al., 2012, Chapter 4. The extra staff and the quality of the staff at CYAAA at Aurukun was also commented on by some respondents to the service provider survey (J Putt 2012, p. 41).

Cape York Welfare Reform—Evaluation
34
Feedback to the evaluation has indicated that the FRC Commissioners have provided valuable support and guidance to individuals in relation to care of children. For example, a resident described how the FRC had assisted her in dealing with child protection authorities to ensure she did not lose custody of her children.72 The key role of the local FRC Commissioners is discussed further below in relation to restoring Indigenous authority.
The evaluation has found that income management imposed by the FRC has been a successful intervention in ensuring that the needs of families and children are met. The FRC has had substantial contact with community members. A total of 1,257 residents have been the subject of a notice for breach of one of the behavioural obligations at some point during the trial. In 2011, most people within jurisdiction (74 per cent of 1,057 people on income support or CDEP payments73) in the four communities were the subject of a notice. About 60 per cent of people aged 17 and over (1,002 individuals) have attended an FRC conference at some point, and 25 per cent (424 individuals) have been placed on income management.74 The Cape York model of income management is far more targeted than the original NTER model. The FRC seeks initially to counsel clients about their behaviour and refer them to support services, while income management is used as a means to reform behaviour if these initiatives do not work. Clients on income management are case managed and the FRC monitors their progress and can adjust or revoke income management orders as necessary. There is some evidence that income management assists in reducing subsequent breaches of the behavioural obligations that lead to FRC notices. In Hope Vale, Coen and Mossman Gorge, the average number of notices per quarter for an individual fell by about 10 percentage points after the individual was placed on income management.75 This effect was not evident in Aurukun, however. The reduction in breaches may not be a function of income management alone, as it is possible that the fact of being repeatedly brought before the FRC conferences encourages individuals to comply.
Aside from reducing subsequent breaches of the behavioural obligations attached to welfare, income management has had broader positive effects on individuals and families. Individuals on income management are issued a BasicsCard in respect of 60 per cent or 75 per cent of their welfare payments, which can only be used for essential life expenses such as food and rent. In the social change surveys, 78 per cent of respondents in the four communities reported that the BasicsCard made their life better, while 12 per cent thought that it made their life worse.76 Furthermore, across the four communities, 69 per cent agreed that if people cannot pay for rent and food because they spend their money on other things, then they should be put on the BasicsCard.77 There is some dissent about the BasicsCard, with common complaints being the inability to use it in some stores78 and the paternalistic nature of the intervention.79 Generally, however, the qualitative feedback in the social change surveys was very positive about the impact of the BasicsCard in assisting people to manage their money to meet their families’ needs, as well as reducing the money spent on alcohol and drugs.80
72 von Sturmer: ‘I was desperate to avoid losing my children, I went and saw them every day at the safe house at 9:00 am and worked really hard. The FRC helped prevent the children being taken from me, by helping me to know what to do. I had to fly down to Cairns and go to the court, and I had only 28 days to tell the magistrate that I was a good parent’. 73 Chapter 7, Section 7.5.2. 74 Chapter 7, Table 7.1. 75 Chapter 7, Section 7.5.7. 76 In Aurukun, for example, 8 out of 10 people (81%) felt it had made their lives a lot better (58%) or a little better (23%) (Colmar Brunton, Social change research study: aggregate report, 2012, p. 112). Only 7% felt it had in fact made their life worse (Colmar Brunton, 2012, ‘Social change research study: Aurukun community report’, unpublished report prepared for FaHCSIA, Canberra, 2012, p. 10). 77 Chapter 4, Section 4.5.9. This proportion is as high as 85 per cent in communities such as Aurukun, with only 8 per cent disagreeing. There is less support in Hope Vale, where 50 per cent agreed and 32 per cent disagreed. 78 See, for example, von Sturmer et al. 2012. 79 von Sturmer et al., 2012, Chapter 3. 80 Comments included the following: ‘Lot of houses have food in their house now. Kids getting healthier due to more food and parents can only spend their money on food, i.e. BasicsCard’. ‘There is less alcohol and drugs.’ ‘You can only spend BasicsCard money on food, not grog and gunja.’ (Colmar Brunton, Social change research study: aggregate report, 2012, p. 62). ‘Ever since they brought in welfare reform it has helped parents send their kids to school and with BasicsCard has stopped

Evaluation overview
35
The in-depth qualitative interviews with local FRC Commissioners and other residents confirmed that the improved quality of life brought about by income management was one of the most significant benefits from the trial.81 A local FRC Commissioner explained that ‘The biggest change … has been that people can now have the things they want, things such as white goods in the home and food for their family and children in the fridge and cupboard’.82 As a result, the Commissioner indicated that some women were requesting income management.
The trial’s positive signs of progress regarding improved money management are achieved not only through Conditional Income Management, but also through MPower. MPower is a Cape York Partnerships Opportunity Product designed to: support individuals and families to manage money for basic material needs; build capabilities through financial literacy and behaviour change; and build assets through saving and disciplined money management. MPower is the most commonly used support service introduced by the trial83, with the usage rate ranging from one-third of Hope Vale residents to about two-thirds of Aurukun and Mossman Gorge residents.84 MPower has assisted residents with household budgeting, saving for large expenses and accessing internet banking. Most clients are self-referred, rather than referred by the FRC, and MPower staff report that clients’ financial management capabilities, such as their ability to independently use internet banking facilities and purchase goods online, are increasing.85 The analysis of the social change survey showed that where an individual or their family had used MPower they were 1.40 times more likely to state that their life is on the way up.86 Service providers responding to the service provider survey also most frequently cited MPower as the service that had made the greatest impact.87 Further, in a question about broad outcomes of the trial, a common response from service providers was that more families were managing their money well.88 The authors of the social change survey report concluded that ‘BasicsCard and MPower seem to be some of most effective interventions in improving people’s lives. The BasicsCard is helping, especially women and children—there is more spending on essentials like food and clothing, less humbugging and some people have managed to save more money for boats, cars and white goods’.89
The strong community take-up of the SET scheme is a further indication of residents’ increasing willingness to take responsibility to provide for the needs of their children and increase their readiness for school. A substantial majority of parents and caregivers in the communities have established SET accounts for children90 and there was a total of $756,000 held in 668 SET accounts by the end of 2011. The amount of money contributed by residents over the years of the trial is substantially greater than this, as funds are continually being allocated to meet school needs.
There is less evidence that the parenting programs funded under the trial have had a strong impact in the communities to date. As noted above, there have been administrative challenges (such as funding and staffing issues, including a change of provider mid-trial in Aurukun) and subsequent delays in implementing the program. In the social change survey, only 15 per cent of people said they had been involved in parenting programs91, and in the service provider survey this program was most often
people drinking all their money away. Less drinking has resulted in less domestic violence’ (Colmar Brunton, ‘Social change research study: Mossman Gorge community report’, unpublished report prepared for FaHCSIA, Canberra, 2012, p. 22). ‘BasicsCard helps my mum stay off the grog’ (Colmar Brunton, Social change research study: aggregate report, 2012, p. 80). 81 von Sturmer et al., Chapter 3. 82 von Sturmer et al., Chapter 4. 83 Colmar Brunton, Social change survey aggregate report, 2012, p. 38. 84 CYP, Family empowerment 4th quarter report, April–June 2012. 85 ibid. 86 Colmar Brunton, Social change survey aggregate report, 2012, p. 32. 87 J Putt 2012, p. 41. 88 ibid., p. 46. 89 Colmar Brunton, Social change survey aggregate report, p. 152. 90 87% of Aurukun target group, 60% at Hope Vale, 71% at Mossman Gorge and 119% at Coen (WRAP SETs Quarterly Progress Reports). 91 Colmar Brunton, Social change survey aggregate report, 2012, p. 102.

Cape York Welfare Reform—Evaluation
36
listed as having made the least difference to date.92 However, recent reporting by CYP indicates that by June 2012, the programs had built their client base to 145 clients.93
The overall perception in the social change survey is that residents of the communities were taking more responsibility for their families and children and trying to be better parents. Individuals responded strongly in the affirmative to the statement ‘I want to work hard to make things better for myself and my family’.94 As there is no baseline for the response to this question before the trial, it is not possible to say whether this sentiment has changed as a result of the trial, although the response can be contrasted with the extensive feedback to the pre-trial consultations revealing high levels of concern in the communities about poor attitudes to parenting and care for children and families.95 In response to the question about whether people are trying to be better parents compared with three years ago, 52 per cent said yes, 8 per cent said no, while 33 per cent thought it had stayed the same.96 When individuals were asked for reasons why their life was on the way up, the second most common answer was in the category ‘attitude changed / positive goals / clear direction / happy / making better choices’.97 To the extent that there had been positive changes in attitudes towards the care of children, the authors of the social change survey report detected a feeling in the communities that the welfare reform activities had contributed to the change: ‘The qualitative research suggested that most people felt that more jobs in combination with changes like the FRC, Student Case Management, parenting courses and the BasicsCard were encouraging more people to try to be better parents’.98
These results raise the question whether the positive response to the welfare reform support services and the self-reported perception that people are taking better care of their children and families have translated into measurable improvements in child and family wellbeing. An analysis of data for substantiated child abuse or neglect revealed no clear trend in the welfare reform communities.99 Child safety statistics tend to be a poor indicator of the underlying incidence of issues. The social change surveys included some questions intended to measure perceived child and individual wellbeing. A series of questions about changes in children in the past three years indicated that:
54 per cent thought that children were happier, 37 per cent thought they were about the same and 8 per cent thought they were less happy
50 per cent thought that children were eating healthier food, 39 per cent thought they were eating the same type of food and 11 per cent thought they were eating less healthy food
63 per cent thought that children were more active (playing sport, watching less TV), 27 per cent thought they were about the same and 10 per cent thought they were less active.100
These results are averages across the four communities. It is worth noting that the results in Aurukun were much stronger, with 77 per cent saying children were happier, 69 per cent saying that they were eating healthier food and 69 per cent saying that they were more active.101 In qualitative responses, the respondents linked these outcomes to a range of reasons, many of which were related to initiatives under the trial (e.g. the FRC, increased school attendance, income management), but some of which were not (e.g. healthier food at the store, Police-Citizens Youth Club programs).102
92 J Putt 2012, p. 41. 93 CYP, Family empowerment 4th quarter report, April–June 2012. 94 Colmar Brunton, Social change research study: aggregate report, 2012, p. 89. 95 CYI, From hand out to hand up, vol. 2, 2007, section 2.3. 96 Colmar Brunton, Social change research study: aggregate report, 2012, p. 59. 97 ibid., p. 64. The most common answer was ‘Have a new job / working harder / job diversity.’ 98 ibid., pp. 61–63. 99 Chapter 8, Section 8.6. 100 Colmar Brunton, Social change research study: aggregate report, 2012, p. 55. 101 Colmar Brunton, ‘Social change research study: Aurukun community report’, unpublished report prepared for FaHCSIA, Canberra, 2012, p. 25. 102 Colmar Brunton, Social change research study: aggregate report, 2012, p. 56.

Evaluation overview
37
On the broader question of individual wellbeing, 54 per cent of respondents to the social change surveys across all the communities thought that their life was on the way up, 44 per cent thought it was much the same and 2 per cent thought it was on the way down. Similarly, people responded that either ‘all of the time’ or ‘most of the time’ they felt happy (82%), full of life (77%) and energetic (76%). They also usually felt calm and peaceful (71%).103 These results varied by community, with much more positive results in Aurukun, while results in Hope Vale were not as strongly positive.104
Overall, the evidence summarised here shows that members of the four communities perceive that the activities under the trial—particularly the FRC conferences, income management and MPower—have had an impact in encouraging and assisting people to better meet the needs of their children and families. This change is consistent with the trial’s theory of norm change, because it is occurring partly as a result of compliance (e.g. with the FRC’s conferencing and income management orders), but people are also voluntarily improving their money management and care for families through opportunities such as MPower. This suggests that people may be internalising this norm by seeing the inherent virtues in this behaviour, or at least identifying with it through following the guidance by the FRC and the example of others in the community. The analysis of the social change survey in Chapter 4 lends support to the contention that many in the trial communities see a link between the FRC’s leadership and positive changes in behaviour in the community.105
Taking responsibility to address problems and improve life through supported self-help
A central goal of the trial is to encourage individuals to take responsibility for addressing problems affecting their lives by actively accessing support services and contributing to solutions. In this regard, the trial sets the ambitious agenda of fundamentally altering people’s mindset through challenging attitudes framed by dependency and passivity and creating incentives and opportunities to mobilise people to improve their life circumstances.
The FRC is intended as a critical driver of this attitudinal change through the Commissioners convening conferences with individuals in order to identify and tackle the problems leading to their non-compliant behaviour. Through referrals to support services and other opportunities, the process hopes to spur people along the road to facing up to their problems and actively participating in the solutions on offer. To evaluate the efficacy of this intervention, it is necessary to first consider the impact of the FRC conference process itself before separately considering the impact of the services.
The Family Responsibilities Commission
The evaluation has found strong anecdotal evidence that the FRC conference process is an effective mechanism to prompt individuals to reflect on, and start addressing, their problems. A recurring theme in the feedback to the social change survey was that individuals who had been before the FRC considered that the process had helped them:
Around 40 per cent of survey respondents had been asked to go to an FRC Conference. Of those 236 people, 88 per cent said they attended a conference. Among those 206 that attended, nearly all (90%) said that they followed up and did what they talked about with the FRC. Of those 194 that followed up, 66 per cent said that it made things better for them.106
The 66 per cent who said the FRC had helped comprised 34 per cent who said the FRC had made their lives ‘a lot better’ and 32 per cent who said the FRC had made their life ‘a little better’. About 22 per cent said the FRC had made ‘no difference’, while only 2 per cent said it had made their lives ‘a bit worse’ and 4 per cent said ‘a lot worse’. When asked why the FRC had made a positive difference, the most common response was that it supported and encouraged individuals to make better choices
103 ibid., p. 79. 104 For example, in Aurukun, 62% of respondents said they felt happy all of the time and 56% said they felt calm and peaceful all of the time, while for Hope Vale these figures were 34% and 22%, respectively. 105 This is discussed further later in this chapter in relation to restoring Indigenous authority. 106 Colmar Brunton, Social change research study: aggregate report, 2012, p. 106.

Cape York Welfare Reform—Evaluation
38
and provided direction in terms of who to talk with and where to go for advice.107 Many individuals indicated that they were initially fearful or resistant when they were called before the FRC, but had changed their opinion when they understood that the FRC was prepared to listen and to help. Analysis of the social change survey results revealed that individuals who said they had followed up and done what they had talked about with the FRC were 1.71 times more likely to state that their life is on the way up.108
The positive impact of the FRC conferencing process seems to hinge on the supportive role adopted by the Commissioners. Following his in-depth qualitative interviews in the four communities, von Sturmer reflected that the virtue of the FRC process is in ‘shifting from accusation to true recognition of the problem’ and, importantly, ‘not just a recognition of the problem but taking immediate steps to remedy the situation—with back-up and long-term support’.109 He further noted that ‘the Commissioners tend to pride themselves on their capacity to listen and to attend to the real nature of problems; this view that they have of themselves is more or less endorsed by feedback we have received from each of the WR communities’. In Aurukun, von Sturmer emphasised the importance of the conferences being conducted principally in the Wik-Mungkan language, which is particularly important because people are more confident and forthcoming in their own language and symbolically important because ‘Wik is the language of equality’ while ‘English is the language of hierarchies and externally-derived statuses’. A local Commissioner reflected on the change in their role during the trial:
There was initially a great deal of animosity towards us as commissioners and members of the FRC within the community. There was a lot of abuse. When we started we were sounding boards for the clients, both for their aggression towards the commission, which they did not understand, and in regard to the frustration they had with their problems and their circumstances. People came to the FRC angry—annoyed at being summoned and to a degree because they were being made accountable. Later this would change—just as the FRC itself changed, developing more of a counselling function. People were annoyed at their predicament, not at us. It was their predicament that made them angry.
Now there is almost no aggression towards the FRC, as you can see from the clients that are here today, they are quite happy to be here, they are dealing with their problems in a positive way and they can see that there are solutions to their problems. That is the really big change in the last four years.
Thus, quite apart from the referral to support services or invoking of income management, the feedback shows that the FRC conference process itself is inherently valuable in helping individuals to confront their problems.
Referral or voluntary self-referral to support services and opportunities
The purpose of the referral process is to reinforce a course of action agreed to in the FRC conference. FRC data showed that people attend 41 per cent of the service referrals made as a result of their conferences with the FRC.110 The proportion who attended at least one of their service referrals during their service referral period was 92 per cent. Of respondents to the social change survey who attended a conference, 90 per cent said they followed up and did what they talked about with the FRC.111 In order of frequency, the referrals were to the Wellbeing Centre, MPower, Probation and Parole Service (which runs Ending Family Violence and other programs), student case managers, parenting programs, and other programs.112
107 ibid., p. 107. 108 ibid., p. 32. 109 von Sturmer et al. 2012, Chapter 3. 110 Chapter 7, Section 7.2. 111 Colmar Brunton, Social change research study: aggregate report, 2012, p. 38. 112 Chapter 7, Table 7.15.

Evaluation overview
39
An apparent tension within the trial framework is that individuals referred to services are to some extent compelled to attend under the threat of Conditional Income Management, yet the trial philosophy is that individuals need to exercise self-help in taking responsibility for tackling their problems. This tension is reconciled within the trial’s design by the fact that the FRC as a mechanism is intended to drive behaviour change through a combination of enforcing compliance at the same time as providing a forum for respected community members (the Local Commissioners) to model and encourage behaviour change. In the theory of norm change underpinning the trial, this latter role seeks to bring about behaviour change through tapping into the client’s desire to voluntarily comply in order to identify with the dominant group. Ultimately, it is intended that this will lead to individuals internalising the positive behaviours, creating a new norm. Thus, it is expected that different responses might be expected to emerge from individuals who come before FRC conferences. In practice, it seems that some FRC clients simply ignore the referral (10 per cent of clients do not attend any of their referrals), some grudgingly attend for the sake of compliance, while some willingly attend as they have been genuinely motivated to do so by the FRC conference. The fact that many people report that the FRC has helped them ‘a lot’ seems to indicate that a significant number of people are in this last category, or are in the second category but end up benefiting from the referral despite their initial reticence. This is a significant outcome for the trial and the FRC in its objective of catalysing behaviour and norm change.
Analysis of the social change survey results revealed that the people who had been exposed to the FRC were more likely to be positive about the FRC than people who had not had contact with the FRC.113 Overall, as Table 1.3 shows, support for the continuing role of the FRC was overwhelming in Aurukun and Mossman Gorge, strong in Coen, and polarised in Hope Vale.114
Table 1.3 Attitudes towards the FRC
Statement: ‘I want the FRC to keep helping people’
This sounds exactly like
me (9–10) (7–8) (5–6) (3–4)
This sounds nothing like
me (1–2) Don’t know
Refused to answer
Aurukun 66% 13% 10% 5% 6% 1% 0% Mossman 66% 22% 4% 2% 2% 4% 0% Coen 47% 17% 20% 6% 9% 1% 0% Hope Vale 18% 10% 23% 6% 34% 9% 0%
Together with the FRC, the suite of supporting services under the trial seem to have been well received by residents of the four communities—69 per cent reported that they or a member of their family had used a service provided by the trial and 66 per cent said the services used were useful (while only 18 per cent said they were not).115 As indicated above, the MPower and SETs programs have been well utilised.116 Other support services such as the Wellbeing Centres have been extensively accessed by the community, with 882 individual clients using the service over the four years from 2008–09 to 2011–12. Wellbeing Centre service contacts rose from 451 in 2008–09 to 3,793 in 2011–12.117 Many contacts with the new support services and opportunities provided under the trial are voluntary self-referrals, rather than mandated by the FRC. For example, 56 per cent of the clients of the Stronger Families parenting program at Hope Vale self-referred and 39 per cent of these
113 Colmar Brunton, Social change research study: aggregate report, 2012, p. 108. 114 The Hope Vale Council’s vocal opposition to the FRC and the trial in general is a likely contributor to the fact that one-third of Hope Vale respondents are strongly opposed to the FRC. 115 Colmar Brunton, Social change research study: aggregate report, 2012, p. 103. 116 ibid., p. 102. 117 Royal Flying Doctor Service data, 2008–09 to 2011–12. Note that clients can have multiple service contacts.

Cape York Welfare Reform—Evaluation
40
participants at Coen self-referred,118 while 13 per cent of total referrals to the Wellbeing Centres during the trial have been self-referrals.119
The social change survey verifies the perceived positive impact of such services. The second most common reason (after new housing) reported by residents in an open-ended question for why things are on the way up is that there are more services/support (examples offered by residents were MPower, Wellbeing Centre, Pride of Place, SETs).120 Further, there was strong agreement (67%) with the statement that ‘Things are getting better because there are better services and support to help people’.121 If a participant stated that they or their family had used the Wellbeing Centre, they were 1.49 times more likely to state that their life is on the way up.122 Administrative data from the Wellbeing Centres indicate that the main reasons for presentations at the centres were addictions (alcohol/drugs/gambling) (25%), violence (13%), relationships (9%), stress (9%) and legal issues (9%).123 Many residents have taken advantage of other self-help measures, such as applying to declare their home as a Dry Home and accessing the Pride of Place program. There were many comments by participants in the social change survey about the way in which various support services assisted residents to actively address difficulties they were facing:
Wellbeing Centre helped with my social and emotional wellbeing. My family come to me for help and I share my skills and advice and give them referrals to Wellbeing Centre.
Wellbeing Centre helped me feel happier and do better things than drinking or smoking.
SETs help me to save for my son’s education, Wellbeing helps me emotionally, mentally and physically. MPower helps with Centrelink and Internet banking.
Wellbeing Centre helped me address my anxiety issues.
They helped me sort my problems out, I was on grog and drugs, affect my job and family.
Made me understand more about budget but also save what you want and need.
MPower help budget my payments to save for my family goals.124
Those who felt that the services had not helped tended to raise issues such as the punitive nature of income management or what they felt were unfair reasons for being called before the FRC.
In summary, there is a general perception in the communities that conferencing with FRC Local Commissioners, in conjunction with a suite of support services (such as the Wellbeing Centre, Student Case Management and parenting and family violence courses) and opportunities (such as MPower, SETs and Pride of Place), has encouraged and enabled individuals and families to identify and start to address problems that are affecting their lives. The social change survey sought to directly measure people’s attitudes to seeking help, including self-help and help for family members:
75 per cent felt they would be willing to ask for help with their problems if they needed it
75 per cent said they would volunteer to help others
82 per cent said they would encourage their family to seek help if they had problems.125
As there are no baseline data for this question from the start of the trial, it is not possible to say whether residents are more likely to seek help now than they were four years ago, but their
118 CYP, Family empowerment 4th quarter report, April–June 2012. 119 Royal Flying Doctor Service data, 2008–09 to 2011–12. 120 Colmar Brunton, Social change research study: aggregate report, 2012, p. 43. 121 ibid., p. 51. 122 ibid., p. 66. 123 Royal Flying Doctor Service data, 2008–09 to 2011–12. 124 Colmar Brunton, Social change research study: aggregate report, 2012, p. 104. 125 ibid., p. 81.

Evaluation overview
41
willingness to access support and opportunities is evident by the strong level of take-up of the trial’s services. To this extent, the trial appears to be succeeding in reinforcing behaviours that reflect individual responsibility for improving one’s life, in contrast to passivity and dependence. The fact that many people are accessing support services not under compulsion by the FRC, but of their own volition, is significant as an indication that individuals see inherent benefit in these opportunities for self-help.126 In the trial’s theoretical framework, it suggests that they are beginning to internalise the norm of taking responsibility for their life challenges and engaging in self-help behaviour. This finding is reinforced by the observation of anthropologist John von Sturmer following his interviews at Aurukun:
In the case of Aurukun what was conspicuous were two things: (1) not just an active maintenance of tradition but even a strengthening in some cases; and (2) the development of what might be called a ‘psychologised ego’ or self. As to the second this is clearly a function of various models based on psychological models (anger management, etc.) and counselling in general. We now see the emergence of a narrative ‘I’ which did not exist in the past. We find people being able to articulate their own feelings and fears where once they were inclined to enactment. People report modifications in their own behaviour or attitudes.
This observation clearly illustrates the impacts on attitudes and behaviours that are resulting from the trial’s initiatives (notably the FRC conferencing and the associated counselling and support services) encouraging individuals to recognise and take responsibility for addressing the issues affecting their lives. Although this is a promising finding for the trial, it should be noted that the impact is not uniform—as one service provider observed:
As with all interventions, welfare reform has been helpful with some individuals and families embracing an opportunity to change and tackle personal and community issues. Some people have even elected to have their welfare payments managed without FRC involvement as a way to help themselves. However some other people who do not identify their FRC referral reason as an issue choose not to change and it is difficult for any service or person to convince them otherwise.127
In addition, the long-term success of the trial’s agenda to encourage people to take responsibility will only be clear once there is substantial evidence that the self-help behaviour has resulted in sustainable improvements for a large proportion of residents of the four communities. Short-term gains, such as improving money management, better meeting children’s needs for education and healthy food, and getting help for issues such as family violence and substance abuse, will take some years to become evident in official statistics and other measures of wellbeing. Furthermore, although these improvements set the foundation for greater engagement in the ‘real economy’, the continuing lack of opportunities for employment and business development will make it difficult to achieve significant long-term improvements in living circumstances.
Volunteerism
One of the norms that the trial seeks to rebuild is the spirit of volunteerism in Indigenous communities. Volunteerism and civic participation are increasingly recognised as a key measure of social capital within any society, underpinning its vibrancy and wellbeing.128
There are several sources of evidence about whether residents of the trial communities are engaging more in volunteering and civic activities. Census data show an increase between 2006 and 2011 in the proportion of people aged 15 and above who engaged in voluntary work in the previous 12 months at Aurukun and Coen. For Aurukun, the increase was from 2.9 per cent in 2006 to 12.1 per cent in 2011 and in Coen from 3.8 per cent to 9.0 per cent.129 On the other hand, the Census shows
126 For example, CYI reports that under the parenting programs, as at September 2012, 71 per cent of Baby College participants attend voluntarily while 35 per cent of participants attend Strong Families voluntarily. 127 J Putt 2012, p. 58. 128 R Putnam, Bowling alone: the collapse and revival of American community, Simon & Schuster, 2001. 129 Chapter 8, Table 8.31.

Cape York Welfare Reform—Evaluation
42
that the proportion of people volunteering in Hope Vale declined from 18.5 per cent to 6.8 per cent from 2006 to 2011. The higher level of volunteering in Aurukun is corroborated by self-reported behaviour in the social change survey. For example, Aurukun parents were much more likely to report that they would volunteer at the school—54 per cent compared to 42 per cent at Coen, 35 per cent at Mossman Gorge and 34 per cent at Hope Vale. Aurukun residents were also much more likely to say that ‘I am willing to do volunteer work to help others’, with 90 per cent agreeing, compared to 73 per cent at Coen, 67 per cent at Hope Vale and 64 per cent at Mossman Gorge.130
There is no clear evidence that it is the specific activities in the trial that have encouraged the increase in volunteering in places like Aurukun and Coen. The trial activity that was intended to encourage volunteering was the Community Action Fund. Grants under the program at Aurukun were for only limited activities at the Childhood Centre and Family Support Hub. Most of the program expenditure between 2008 and 2011 was at Hope Vale, which recorded a decline in reported volunteering levels in the Census. Other activities under the trial may have contributed to the outcome, however. The establishment of the CYAAA at Aurukun and Coen in 2010 might have contributed to the greater level of volunteering at those schools than in the other communities, although the CYAAA was also established at Hope Vale from 2011. It might also be speculated that the reportedly improved social conditions at Aurukun as a result of the combined effects of the closure of the tavern and the impact of the trial might have created an environment more conducive to volunteering in that community than was the case in the years prior to the trial.
In summary, the evidence of increased volunteering at Aurukun and Coen is consistent with the behavioural norm that the trial is seeking to rebuild. However, it is not possible to directly attribute this behaviour change to the trial at this point in time, and the statistical decline in reported voluntary work at Hope Vale runs counter to any suggestion that the trial is having a uniform effect in encouraging volunteerism.
Reduced offending and alcohol abuse
A broader goal of the trial in rebuilding positive social norms is to reduce the level of alcohol abuse and offending behaviour in the communities. Being convicted of an offence in the Magistrates Court is one of the triggers for being called to an FRC conference. The FRC seeks to address offending behaviour by counselling clients about their behaviour, referring them to relevant support services and enforcing the sanction of income management where necessary.
It is typically difficult to ascertain trends from official crime statistics, as they are affected by a range of factors, such as changes in policing levels and methods, and significant variability over time resulting from the small numbers of residents in remote Indigenous communities. The evaluation has analysed a range of crime statistics in Chapter 8 in an effort to identify any trends in the trial communities, particularly as compared with other remote Indigenous communities.
The analysis of crime statistics in Chapter 8 revealed a statistically significant decline in the overall offence rate (rate of offences per 1,000 population) in the CYWR communities during the period of the trial.131 This decline also occurred in comparable Indigenous communities, but the overall trend in the trial communities differs in that the decline in offences during the trial reversed a statistically significant upward trend in offences in the four years prior to the trial. The improvement in the comparison Indigenous communities in the trial period did not reverse an upward trend in the previous years. The analysis of the offence data controlled for changes in the number of police in the trial communities, but this was not found to alter the overall conclusions.132
130 Colmar Brunton, Social change research study: aggregate report, 2012, p. 81. It is interesting to note that this ranking of willingness to volunteer in the four communities is mostly similar to the ranking in the ABS Census data. 131 Chapter 8, Section 8.7.3. 132 Chapter 8, Table 8.13.

Evaluation overview
43
While the reversal of the rising crime rate during the trial is a positive trend, attributing this outcome to the trial is difficult. There is significant variability and no consistent pattern of improvement across the four trial communities. The significant fall in offence rates across trial communities is the result of significant improvements in Aurukun that are not evident in the crime data for the other three communities.133 There is also variability across the different categories of offences. There was no statistically significant decline in public order offences, assaults or offences against the person during the trial, in either the trial communities or comparison Indigenous communities.134 Similarly, there were no statistically significant trends in serious assaults or serious assaults causing injury across the four trial communities taken as a whole.
On the other hand, there was a significant decline in the rate of assaults causing serious injury in Aurukun, from an average annual rate of 61.5 per 1,000 persons in the four years prior to the trial, to an annual average of 33.5 per 1,000 persons during the trial. Although there was a significant negative trend in this assault rate even in the pre-trial period between 2004–05 and 2007–08, there was an additional sharp fall in this rate in the first year of the trial period of 2008–09. The rate of serious assault causing bodily injury is reduced by more than half, falling from 56 per 1,000 in 2007–08 to 26 per 1,000 in 2008–09. This dramatic decrease is more or less maintained in the subsequent years. Data analysis shows that this improvement is very likely to be linked to the reduction in trading and subsequent closure of the Aurukun tavern from March 2008.135 Qualitative feedback seems to confirm the significant impact of the closure of the tavern. For example, von Sturmer observed, ‘It is important to note that the restriction on alcohol has had an enormous “calming” effect. It makes life more liveable. Anybody who has lived within these situations during the heavy boozing days knows how destructive and intolerable the situation was then’.136
The data on hospitalisation for assault do indicate a statistically significant decline in the trial communities during the period of the trial.137 The hospitalisation rate for assault fell by about 25 per cent during the trial years, from 32.3 per 1,000 to 24.7 per 1,000.138 As in the case of the overall offence rate, it is not possible to attribute this improvement directly to the trial as the hospitalisation rate for assault also fell by about 20 per cent in other comparison Indigenous communities.
In relation to alcohol abuse, there are no precise measures for gauging change. However, the proportion of offences that involve alcohol may be a useful indicator. Changes to police recording of offences mean that it is only possible to compare the rates of offences relating to alcohol and other substances rather than offences relating to alcohol alone. Similar to the overall pattern of offences, analysis of this data shows that there has been a statistically significant decline in the proportion of offences involving alcohol and other substances in the trial communities. While this mirrors the decline in other Indigenous communities, it reversed an upward trend in the trial communities that was not occurring elsewhere.139 As noted above, it is also very likely that the reduction in trading and subsequent closure of the Aurukun tavern from March 2008 contributed to the improvement, particularly in the rate of assaults causing bodily injury that involved alcohol or other substances.
Responses to the social change surveys are a source of evidence about residents’ perceptions of levels of disharmony in the community. In the surveys, more people thought that there was less fighting within families in the past three years, but there was no strong view that there had been any change in fighting between families.140 Views about vandalism and damage to property differed for the
133 Chapter 8, Section 8.7.6. 134 Chapter 8, Table 8.12. 135 Chapter 8, Section 8.7.6. 136 von Sturmer et al. 2012, Chapter 3. 137 Chapter 8, Section 8.7.5. 138 Chapter 8, Section 8.7.5. 139 Chapter 8, Section 8.7.4. 140 Colmar Brunton, Social change research study: aggregate report, 2012, p. 59.

Cape York Welfare Reform—Evaluation
44
communities—Aurukun residents generally thought there was more, Coen people thought there was a lot less, while there was no strong consensus either way in Hope Vale and Mossman Gorge.141
The surveys also revealed that there was no clear view about whether more or fewer people were trying to give up grog, smoking or gambling.142 Although most people in the communities thought that things were on the way up, less drinking or less fighting and domestic violence were not common reasons given for why people held this view.143 It is interesting to note, however, that anthropologist von Sturmer has detected a shift in attitudes towards alcohol in the communities in recent years. Where previously people saw drinking as ‘the very sign of personal liberty’, he now notes that ‘at no time in our interviews did anyone say curtailment of drinking was a bad thing’.144 It seems that there has been a positive shift in community norms regarding less tolerance towards alcohol abuse. Data from the Wellbeing Centres indicate that the two most common reasons for presentations relate to addictions to alcohol, drugs or gambling (25%), or violence (13%).145
Service providers were also asked for their perceptions about conditions in the trial communities. The survey reported that ‘The most common response to a list of social problems was to say they were about the same, with the proportion ranging from 35 per cent to 45 per cent. However, a higher proportion of participants said there was less drinking alcohol (26%), fighting in or between families (24%) and vandalism (29%) than the proportion that said there was more.’146
One area where the trial’s activities might be expected to directly impact on offending rates is in relation to school-age children, who are attending primary school in greater numbers and increasingly being sent away to boarding school. Qualitative interviews about the school at Aurukun indicated that the rise in school attendance was reducing the opportunity for children to commit offences.147 Youth crime figures were not available for the evaluation, but it is notable that the largest fall in the proportion of victims at Aurukun was in relation to individuals under the age of 20. The proportion of female victims aged 0–19 fell from 20.4 per cent in the four pre-trial years to 12.7 per cent during the trial years, while there was also a small decline in the proportion of male victims aged 0–19.148
In summary, there are some positive signs that offending behaviour and offences involving alcohol and other substances have declined for the trial communities in recent years, particularly at Aurukun. However, the variability in crime data across the four communities and the similar patterns found in comparable Indigenous communities make it difficult to ascertain the extent to which the trial may be contributing to these outcomes by reforming offending behaviour and discouraging alcohol abuse.149
Responsibility and pride in housing
One of the norms that the trial hopes to rebuild in Indigenous communities is for families to take pride in the maintenance and appearance of their homes. The trial seeks to achieve this behaviour and norm change through a series of incentives, drivers and sanctions, such as:
‘normalising’ tenancy arrangements, whereby tenants must enter enforceable tenancy agreements to pay market rent and comply with other tenancy obligations expected for mainstream public housing, while tenancy management is carried out consistently and professionally
141 ibid. 142 ibid. 143 ibid., p. 27. 144 von Sturmer et al. 2012, Chapter 3. 145 Royal Flying Doctor Service data, 2008–09 to 2011–12. 146 J Putt 2012, p. 11. 147 A Holden, Visual Participatory Evaluation Panel findings report, CYAAA, 9 October 2012. 148 Unpublished police data. The actual number of female victims aged 0–19 fell from 129 in the four pre-trial years to 50 in the four trial years, while the number of male victims aged 1–19 fell from 49 to 20. 149 For example, social change survey feedback included: ‘Aurukun had a violence problem. That stopped because of Local Commissioners [the FRC]. Now with kids going to school it’s much better’ (Colmar Brunton, Social change research study: aggregate report, 2012, p. 61).

Evaluation overview
45
referral to the FRC where a tenant breaches their tenancy agreement
a Pride of Place co-contribution program that provides financial incentives (up to $15,000) for families to undertake home improvements (such as pergolas and landscaping) provided they contribute $1,000 to purchase a maintenance kit (e.g. lawnmower) and contribute some of the labour for the improvements (known as ‘sweat equity’).
An assessment about how successfully tenancy arrangements have been normalised in the trial communities has been hampered by the unavailability of key data to measure progress in this area. The objective of normalising the management of tenancy appears to have been achieved as a result of the transfer of management of almost all of the public housing in the trial communities to the Department of Housing and Public Works. The transition to mainstream tenancy agreements has been underway since the beginning of the trial, and 442 tenancy agreements were in place across the four communities by December 2011. However, information was not available to the evaluation to determine how many properties remain under non-standard tenancy agreements or are without a tenancy agreement.
Under the new agreements, rents have increased from an average collection rate of $40–$60 per week to $108–$114 per week.150 Unfortunately, data have not been available to the evaluation to determine what proportion of households are subject to the higher rent amounts, what proportion are meeting their rent obligations and how much the total amount of rent paid has increased in the trial communities since before the trial. It is assumed that the reported increase in the ‘collection rate’ indicates that more rent is now being paid by residents in the trial communities. Although specific evidence is not available, measures that are part of the trial should be contributing to rental payment. Income management enables people to make automatic payments for their rent and MPower assists people to budget for this regular expense. Furthermore, the threat of referral to the FRC for non-payment of rent is intended to drive compliance in this regard. On the other hand, the data show that a large number of households remain more than four weeks in rental arrears in Hope Vale and Aurukun.151
Although the available information is insufficient to determine the extent of the improvement in rental payment, the apparent higher amount of rent being paid by some residents is a positive change consistent with the trial’s objectives, as it increases the ‘stake’ of residents in the public housing they are occupying. Although it is a legal requirement, it may lead to greater feelings of responsibility for the home.
The Pride of Place program provides an opportunity for residents to build capabilities and personal responsibility around care of their home and surrounds, as a first step on the journey to home ownership. Pride of Place experienced some initial delays and underspends and was revised in late 2010.152 The program seems to have taken time to develop momentum but the number of projects completed has grown since the beginning of 2011. By June 2012, there were completed projects for 9 per cent of Aurukun households, 13 per cent of Coen households, 16 per cent of Hope Vale households and 43 per cent of Mossman Gorge households. The delivery organisation, CYP, reports that most households in the program have met or exceeded their savings target ($1,000) to purchase their maintenance kit.153 Success rates in meeting the required ‘sweat equity’ have not been quite as
150 Chapter 8, Section 8.9.1. 151 Chapter 8, Table 8.28. Data to December 2011. It is possible that some of these people are beyond the jurisdiction of the FRC because they are in paid work rather than on income support. 152 Following a re-design of the program in July 2012, Pride of Place additionally now supports families to improve their backyards and grow a vibrant network of local garden enthusiasts through a range of activities through membership in PoP. Members join the Village Garden Club, which meets regularly in members’ gardens, receive home visits by a PoP Enabler, free plant and planting advice each quarter, general gardening and yard improvement advice and the opportunity to participate in maintenance and DIY demonstration sessions. Additionally, all members are now able to have a free garden design completed with the assistance of the projects garden designer and are also eligible for the annual Best Garden in the Village. Members are also eligible to complete the Household Project (backyard improvement). 153 CYP, Family empowerment 4th quarter report, April–June 2012.

Cape York Welfare Reform—Evaluation
46
high.154 The reasonable level of participation in this opportunity does, however, indicate willingness on the part of many households to improve their homes and to contribute to the process through savings and personal effort. The program has not been evaluated, but anecdotal feedback is that it is improving the visual amenity of the community and that residents appreciate the lifestyle benefits from the improvements to their homes and gardens.155
In summary, the trial has led to people contributing more to their public housing through higher rent but there has been insufficient data available to the evaluation to determine whether it is addressing the longstanding issue of some households not meeting their rent obligations. The Pride of Place program shows potential to rebuild the norm of taking responsibility for the care and improvement of homes, but it will take time to create broader momentum for these activities across the community. These are small but practical steps towards a long-term process of engendering positive norms around housing.
Transition to private home ownership
Under the welfare reform philosophy, transitioning from public housing to private home ownership is seen as part of the journey from passive dependence on government provision of life’s necessities to taking responsibility for one’s own accommodation needs and investing in an asset that will have value in the wider economy. The main priorities under the trial have been to first remove legislative, land tenure and practical barriers to home ownership and second to encourage and assist people to take up this opportunity.
The existing longstanding barriers to home ownership in Indigenous communities have thwarted progress towards this objective in Queensland for two decades. The trial appears to have succeeded in driving this agenda forward where past government policy processes have failed. Progress has been made in amending legislation to enable appropriate leasing arrangements on Aboriginal land, and a new methodology for the valuation of social housing will make sales of this housing to individuals more achievable. The progress in addressing the barriers and the availability of loan funding from Indigenous Business Australia (IBA) have not yet translated into private home purchases in the trial communities. However, 52 expressions of interest for home ownership have been received in Coen and Hope Vale, and the Queensland Government and IBA expect to achieve home ownership outcomes in the first half of 2013.156
In the social change survey, 58 per cent of people said they would use a home ownership scheme if it were available to purchase their home, while 26 per cent said they would not and 16 per cent did not know. Similarly, 55 per cent said they would be happy to pay more money than they do now and do maintenance if it meant they would own their house (29 per cent said no and 16 per cent did not know). Without a baseline measurement from before the trial, it is not possible to say whether the trial has changed people’s willingness to consider private home ownership.
There are continuing disincentives for residents of the trial communities to take up the opportunity for private home ownership. There is still doubt about capital growth and secondary markets for a privately owned home in an Indigenous community. Also, many residents have or will soon receive new or upgraded social housing, whereas only older houses are likely to be affordable for purchase. In this respect, the Australian Government’s substantial investment in new public housing under the National Partnership Agreement on Remote Indigenous Housing may have the unintended consequence of diminishing the incentive for residents to pursue the private home ownership opportunity.
154 ibid. 155 See case studies in CYP, Family empowerment 4th quarter report, April–June 2012 and Nicholas Rothwell, ‘Desire to end welfare drip feed takes pride of place’, The Australian, 25 August 2012. 156 Chapter 3, Section 3.4.4.

Evaluation overview
47
In summary, while there has been progress in making private home ownership possible and there is interest among many residents, until significant numbers make the transition from public housing it will not be possible to say that a norm is developing around the expectation that individuals can and should own their own homes in Indigenous communities. This is a long-term enterprise that will require a significant change in mindset for community members. How to create adequate incentives for this transition remains an ongoing challenge.
Transition from welfare to employment, including outside the community
A central objective of welfare reform is to shift residents of Indigenous communities from dependence on government welfare towards engagement in the economy through jobs either within or outside the community. The trial recognises that the local economy and employment opportunities are limited in Indigenous communities, so residents may need to consider moving away for work through a process known as ‘orbiting’ in and out of the community. To achieve this, projects under the trial included reform of CDEP, improved employment services, programs to assist mobility to take up work, and ‘lighthouse’ projects in each community to generate local employment.
The main evidence for whether this desired behaviour change is occurring is through welfare data and employment statistics. The trial design argued that CDEP, despite its goal of preparing people for employment through work on community projects, was actually a disincentive for employment. The trial initiated reforms to CDEP in an attempt to address these disincentives, although the changes did not adopt all of CYI’s original design recommendations. The measures have succeeded in reducing the numbers of people on CDEP (from 635 at the start of the trial to 92 in June 2011 and less than 20 by June 2012), but some of this is cancelled out by a rise in the number of people on other forms of welfare payments (income support) from 614 to 965 between the start of the trial and June 2011. This suggests there has been a flow of many former CDEP recipients onto income support.157
The slight reduction of 240 people across the trial communities on either CDEP or income support is a positive sign for the trial’s agenda to reduce welfare dependence. However, it is not clear whether this simply reflects the movement of population or whether these individuals actually transitioned into employment. One project under the trial was to convert 103 CDEP positions into full-time jobs, so this may account for some of the people no longer on CDEP or income support.158 The trial itself has also created 118 new service delivery jobs across the trial communities, but it is not known how many of these have been filled by residents previously on CDEP or welfare.159 Census data show that Indigenous people make up 74 per cent of non-CDEP employment, and this proportion was 88 per cent in Hope Vale, 61 per cent in Aurukun, 62 per cent in Coen and 100 per cent in Mossman George.160 In Mossman Gorge, the lighthouse project, the new Gateway Tourism Centre, has created jobs for 16 local Indigenous residents.
If CDEP jobs are excluded, Census data show an increase in the employment rate161 in each of the four communities between 2006 and 2011:
Aurukun: 8 per cent in 2006 to 16.1 per cent in 2011
Coen: 22 per cent in 2006 to 45.4 per cent in 2011
Hope Vale: 15 per cent in 2006 to 35.8 per cent in 2011
Mossman Gorge: 3 per cent in 2006 to 14.9 per cent in 2011.
This improvement is likely to be due to the conversion of CDEP positions into jobs and the additional service jobs created since the trial commenced. The improvement has also occurred in other remote 157 Chapter 8, Section 8.8.5; Chapter 7, Table 7.2. 158 Chapter 8, Section 8.8.3. 159 Chapter 8, Section 8.8.3. 160 Unpublished Census data for 2011. 161 Employment rate = employed/all persons aged 15–64 (excluding ‘not stated’). This figure does not count CDEP positions as ‘employed’.

Cape York Welfare Reform—Evaluation
48
Indigenous communities in Queensland, but the Coen and Hope Vale improvements are amongst the highest for any of these communities. Despite the improvement, these statistics illustrate that a significant proportion of residents in the trial communities are not employed.
A positive indicator for the trial’s objectives is that the Job Services Australia providers in the four communities have had a significant increase in the number of job placements, from under 130 in the second half of 2009 to nearly 200 in the second half of 2011. This may include some of the CDEP positions converted to jobs.
Attitudes among community members towards gaining employment are positive. The social change survey reported the following:
Of the 291 people who were not working, 73 per cent felt they would be willing to take a good job in the community and 56 per cent felt they would be willing to leave the community if they were offered a good job.
Of the 295 people who had worked in the past week, 71 per cent felt they would be willing to leave the community if they were offered a good or better job.
When asked about perceptions of ‘others’’ attitudes towards working in the community, 62 per cent agreed that ‘Most people if offered a good job in this community would take it’, while 48 per cent also felt that ‘Most people if offered a job outside of the community would take it’.162
Of the 54 per cent of people who said that their life was on the way up, ‘having a new job / working harder / job diversity’ was the most commonly mentioned reason, at 18 per cent.163
The welfare and employment data cited above reveal some small signs of progress in the transition from welfare to employment, and the surveys indicate positive attitudes towards work, but it is clear that there has not yet been a significant boost in employment levels across the communities. There are obviously significant barriers to increasing employment within Indigenous communities, including the limited local availability of jobs and the lack of skills and experience for those jobs that are available.164 There is no evidence to indicate that more residents are taking up the opportunity to leave or ‘orbit’ from the community to take up a job, although the trial has provided only limited opportunities in this regard.
Elements of the trial that are improving educational outcomes, management of money and self-help behaviours may be laying a solid foundation for more individuals to take up job opportunities in the future. However, it is clear that more work needs to be done to create training and employment pathways for individuals to gain the skills and confidence to take up job opportunities that exist within the communities as well as jobs available through ‘orbiting’ outside the communities. Only with greater opportunities will it be possible for working to become the norm in the communities.
Establishment of local businesses
Under the Economic Opportunity stream, the trial seeks to encourage not only a shift to employment, but also an increased willingness by residents to establish and run their own businesses. Information about business development is available from the Census and from anecdotal information about new businesses established in the four communities. Anecdotal evidence about new businesses recently established in the trial communities includes a car hire business in Hope Vale, and a hostel at Coen. The evidence does not indicate a substantial boost to business creation during the trial, however.
Specific activities under the trial designed to encourage business development include enhanced business support services, the establishment of business precincts in Hope Vale and Aurukun and the
162 Colmar Brunton, Social change research study: aggregate report, 2012, pp. 93–96. 163 ibid., p. 31. 164 For example, 37% of participants in the social change survey agreed that ‘I feel like I don’t have enough skills and confidence to look for a job’ (Colmar Brunton, Social change research study: aggregate report, 2012, p. 93).
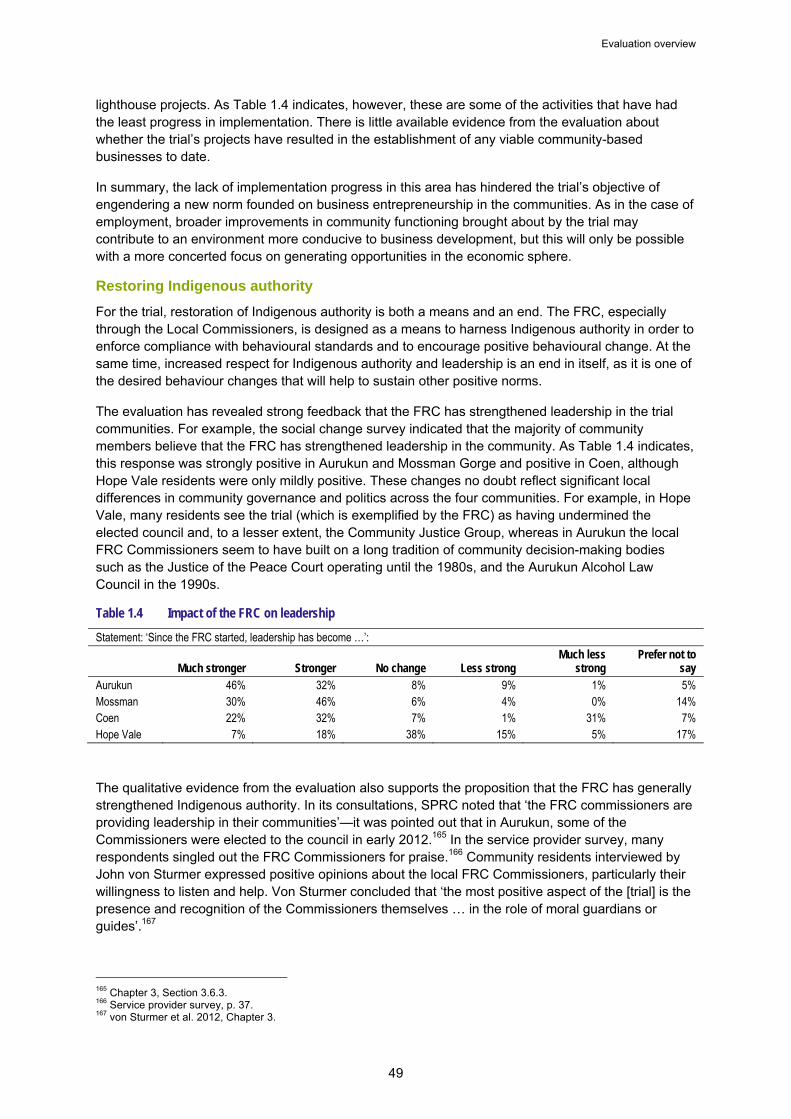
Evaluation overview
49
lighthouse projects. As Table 1.4 indicates, however, these are some of the activities that have had the least progress in implementation. There is little available evidence from the evaluation about whether the trial’s projects have resulted in the establishment of any viable community-based businesses to date.
In summary, the lack of implementation progress in this area has hindered the trial’s objective of engendering a new norm founded on business entrepreneurship in the communities. As in the case of employment, broader improvements in community functioning brought about by the trial may contribute to an environment more conducive to business development, but this will only be possible with a more concerted focus on generating opportunities in the economic sphere.
Restoring Indigenous authority
For the trial, restoration of Indigenous authority is both a means and an end. The FRC, especially through the Local Commissioners, is designed as a means to harness Indigenous authority in order to enforce compliance with behavioural standards and to encourage positive behavioural change. At the same time, increased respect for Indigenous authority and leadership is an end in itself, as it is one of the desired behaviour changes that will help to sustain other positive norms.
The evaluation has revealed strong feedback that the FRC has strengthened leadership in the trial communities. For example, the social change survey indicated that the majority of community members believe that the FRC has strengthened leadership in the community. As Table 1.4 indicates, this response was strongly positive in Aurukun and Mossman Gorge and positive in Coen, although Hope Vale residents were only mildly positive. These changes no doubt reflect significant local differences in community governance and politics across the four communities. For example, in Hope Vale, many residents see the trial (which is exemplified by the FRC) as having undermined the elected council and, to a lesser extent, the Community Justice Group, whereas in Aurukun the local FRC Commissioners seem to have built on a long tradition of community decision-making bodies such as the Justice of the Peace Court operating until the 1980s, and the Aurukun Alcohol Law Council in the 1990s.
Table 1.4 Impact of the FRC on leadership
Statement: ‘Since the FRC started, leadership has become …’:
Much stronger Stronger No change Less strong Much less
strong Prefer not to
say Aurukun 46% 32% 8% 9% 1% 5% Mossman 30% 46% 6% 4% 0% 14% Coen 22% 32% 7% 1% 31% 7% Hope Vale 7% 18% 38% 15% 5% 17%
The qualitative evidence from the evaluation also supports the proposition that the FRC has generally strengthened Indigenous authority. In its consultations, SPRC noted that ‘the FRC commissioners are providing leadership in their communities’—it was pointed out that in Aurukun, some of the Commissioners were elected to the council in early 2012.165 In the service provider survey, many respondents singled out the FRC Commissioners for praise.166 Community residents interviewed by John von Sturmer expressed positive opinions about the local FRC Commissioners, particularly their willingness to listen and help. Von Sturmer concluded that ‘the most positive aspect of the [trial] is the presence and recognition of the Commissioners themselves … in the role of moral guardians or guides’.167
165 Chapter 3, Section 3.6.3. 166 Service provider survey, p. 37. 167 von Sturmer et al. 2012, Chapter 3.

Cape York Welfare Reform—Evaluation
50
As this comment indicates, the evidence suggests that the impact of the local FRC Commissioners is in their listening, guiding and supporting role, rather than in the exercising of their punitive powers to order income management.168 In this way, the FRC model is built on the tradition of restorative justice and conferencing models, which have been widely adopted in the criminal justice system to improve outcomes for Indigenous populations in Canada, New Zealand and Australia in the past two decades.169 Approaches that involve Indigenous persons of respect and authority are considered more effective in dealing with aberrant behaviour than traditional justice system models, such as the courts and correctional systems. A local FRC Commissioner explained how this applies in the case of the FRC:
They realise that we are an alternative to the courts that can only punish them; we can help them to resolve their problems and to find solutions for the situations they have. Community members realise that we can get very close to people in the conference, we can get close because we know the people we are seeing. We see them every day in the community, at the shops and in the street, we also know their parents, their children, so there is no point in trying to tell us things that are not true. Because of this and because they know that we will never discuss what happens in the conference, they open up to us very quickly. It is something that works.170
From an anthropologist’s perspective, von Sturmer points out the ways in which the FRC conference process resonates with traditional Aboriginal dispute resolution practices. He notes that in Aboriginal society, ‘direct confrontation is best—so that the ethos of the FRC conference is not necessarily as threatening as it might be to people from other cultural backgrounds’.171 Von Sturmer explains that the FRC can serve as not only a ‘sounding board’ for airing grievances, but also ‘a strange and unaccustomed answering voice, one that announces the “complaints” and concerns of “the community”: what is acceptable behaviour, what is unacceptable, what are the responsibilities that are to be met by someone who wishes to maintain membership of that community?’
It appears that this process strengthens leadership not only through the Local Commissioners themselves, but also by a flow-on effect for leadership in the wider community. A local Commissioner recounted how very few people ‘were confident enough to speak up’ before the FRC and that this was apparent when the FRC conferences started. Over time, however, people started to ‘speak up a lot more and tell us their story, what is going on in their lives, why things are happening’, which has ‘transferred now to people speaking out more in public as well’.172
The logic of the trial is that an institution that empowers Indigenous elders and leaders will be best placed to lead behavioural change that will improve community and personal wellbeing. Chapter 5 sets out an analysis of the social change survey results by social psychologists from the Australian National University, which sought to investigate the theory of change underpinning the trial. The analysis considered the impact of three possible explanatory variables—endorsement of the FRC, perceptions of strong leadership and levels of responsibility—on perceived changes or self-reported behaviours in the community such as child wellbeing, community improvement, personal improvement, community engagement, leadership change, home living, and health support-seeking.
The analysis revealed that those community members who endorsed the FRC were more likely to report positive changes in leadership, civic participation and people working together to fix problems. This supports the trial’s logic, in that it shows that people perceive the FRC as a vehicle that is bringing about positive behavioural change. In addition, the analysis showed that part of the FRC’s impact on these outcomes is achieved through strengthening leadership and encouraging personal responsibility. The authors concluded that the social change survey findings support the trial logic 168 ibid., Chapter 4. 169 For a description of some of these measures, see K Daly, ‘Racializing restorative justice: lessons from Indigenous justice practices’, paper delivered to Second Restorative Justice Conference, San Antonio, Texas, 13–15 May 2009. 170 von Sturmer et al. 2012, Chapter 4. 171 ibid. 172 ibid., p. 40.

Evaluation overview
51
insofar as endorsement of the FRC was positively related to perceptions of stronger leadership, greater levels of individual responsibility and positive outcomes around behaviour change.173
The social change survey cannot definitively answer the question of whether social norms have changed, because it captures only perceptions of change and self-reported behaviours. However, the analysis of the survey by the ANU researchers suggests that many members of the trial communities believe in the trial’s logic of using the FRC to strengthen leadership and encourage people to take responsibility as a way of catalysing behaviour change. Moreover, they believe that this is working.
While the FRC is widely seen to have generally strengthened Indigenous authority, the evaluation did reveal concerns on the part of some people that it has undermined the authority of the Community Justice Groups (CJGs).174 These groups were originally established as a means to empower elders and respected persons to address crime and associated behavioural issues in Indigenous communities. Unlike the local FRC Commissioners, they operate on a voluntary basis. Under the FRC legislation, the CJGs have a role in nominating the Local Commissioners, many of whom tend to also be CJG members. However, the CJGs and the FRC have not been integrated in the way that the original design report envisaged.175 In reality, the FRC has effectively supplanted many of the functions formerly performed by the CJGs in dealing with non-compliant members of the community through a conferencing style process. This has caused some people to see the FRC as undermining the traditional authority embodied in the CJGs.176 On the other hand, a local FRC Commissioner expressed the view that ‘the FRC has strengthened the justice groups, due to there now being a larger group of people who have the confidence to express their views than there used to be’.177 In considering the future of the FRC, the potential role of the CJGs should be considered.178 A logical option would be to better integrate the FRC functions with the CJG, but due to their variable levels of functionality and capacity, CJGs would need significant support and capacity building, and potentially strengthened powers, to play a more central role in welfare reform in the future.
A further qualification to the finding that the FRC has strengthened Indigenous authority is the need to recognise the impact of the process on the local FRC Commissioners themselves. Von Sturmer notes that many of them were already leaders in their communities and have now gained increased power and prestige, which poses the risk of entrenching a form of elitism.179 In addition, the significant stresses on these individuals may manifest in burnout if they are not appropriately supported.
Although an important finding of the evaluation is that the FRC has strengthened and restored Indigenous authority, a question remains, as to what extent the rest of the elements of the trial package have done so. SPRC points out that, apart from the Local Commissioners’ role in the FRC, local Indigenous communities do not have much authority and control over the initiatives under the trial.180 The Wellbeing Centres have local advisory committees to enable community input into governance, but many of the support services and programs under the trial are managed by non-Indigenous outsiders. There is little evidence about the extent of training provided to local community members to fill key roles. Processes for transitioning services to community control are not explicit in the trial. Some of the frustrations conveyed to von Sturmer in his interviews with community members prompted him to muse, ‘How are community members to participate in the programme other than as those administering it and as those administered by it? How is one to achieve greater local participation? How is the community to “own” the process?’181
173 Chapter 5, Section 5.8. 174 Chapter 3, Section 3.6.3; Colmar Brunton, Social Change research study: aggregate report, 2012, p. 87; von Sturmer et al. 2012. 175 CYI, From hand out to hand up, vol. 2, pp. 52–53. 176 Chapter 3, Section 3.6.3; Colmar Brunton, Social change research study: aggregate report, p. 87; von Sturmer et al. 2012. 177 von Sturmer et al. 2012, Chapter 4. 178 Colmar Brunton, Social change research study: aggregate report, 2012, p.41. 179 von Sturmer et al. 2012, Chapter 3. 180 Chapter 3, Section 3.7.6. 181 von Sturmer et al. 2012, Chapter 4.

Cape York Welfare Reform—Evaluation
52
Conclusion
The preceding analysis shows that the trial has contributed to several of the behaviour changes that are considered necessary for Indigenous communities to become more functional and socially and economically viable places to live. The greatest progress has been in the area of education, notably in improving school attendance, and in building social responsibility in caring for children and families and encouraging people to take responsibility for improving their lives. The least progress has been made in relation to the housing and economic opportunity spheres of the trial’s agenda. The trial has succeeded in strengthening Indigenous authority through the FRC, which has itself been a key factor in bringing about positive behavioural change.
Norm change is a long-term process. The trial design hypothesises that changes in behaviour that are compelled by sanctions and encouraged by incentives and drivers will take time to become internalised. The positive behaviour changes achieved to date raise the prospect that the process of rebuilding norms is underway in the trial communities. Further comment on the dimensions and limitations of this progress is contained in Section 1.8.
1.7.3 Has service provision changed in a way that supports norm and behaviour change?
According to the theory of welfare reform espoused in From hand out to hand up, a paradox of Indigenous policy in recent decades is that the very services intended to address Indigenous disadvantage have actually deepened the problems in Indigenous communities by creating a dependency on ‘passive welfare’ that erodes self-reliance and individual responsibility.182 Hence, a central tenet of the welfare reform proposals is to reorient service provision in a way that reduces dependency and passivity and encourages individuals to take responsibility for addressing their problems and using services in a more proactive way. This shift requires both service providers and Indigenous community members to change their mindset about the role of services in order to see them as supporting and enabling individual initiative rather than as providing solutions to the problems of service recipients. Welfare reform’s ultimate goal is that even many of the enabling and supporting services provided by government will not be needed in the longer term as individuals, families and communities, and the voluntary sector, take increasing responsibility for addressing issues concerning people’s private lives. In this way, government will retreat to the ‘normalised’ service levels seen in mainstream communities.
The third focal question for the evaluation therefore seeks to assess whether service provision has changed in a way that supports norms and behaviour change. There are three dimensions to this question:
1. whether services have changed to operate in a way that encourages the development of norms and behaviours founded on greater individual, family and community responsibility
2. whether services are working in a coordinated way to support the trial’s objectives of providing a holistic, multi-pronged approach to a complex and interrelated set of social challenges183
3. whether services have become more responsive to, and engaged with, the communities that they serve.
To evaluate service delivery reform under the trial, FaHCSIA undertook a survey of service providers in the four welfare reform communities and commissioned a qualitative study of service provision incorporating a case study of Aurukun. The review of implementation of the trial by SPRC contained in Chapter 3 also comments on service provision issues. The social change surveys provide some 182 CYI, From hand out to hand up, pp. 43–44. 183 The evaluation framework notes that this element of service provision was not specifically highlighted in From hand out to hand up, but is an important element of success of the trial (Courage Partners, p. 36).

Evaluation overview
53
additional evidence in relation to accessing of services and community views about the usefulness of service provision.
Have services supported the trial philosophy?
Many of the new services and programs delivered under the trial were specifically designed in order to support the welfare reform philosophy of encouraging personal responsibility and reducing dependency. Programs such as Pride of Place, SETs and MPower184 have built-in requirements for service users (who are often called ‘partners’ or ‘members’ rather than ‘clients’) to be actively involved in and contributing to the outcome. For example, MPower and SETs involve users making regular financial contributions towards their goals. Pride of Place goes further in requiring participants to participate in designing the project and contributing ‘sweat equity’ in the form of assisting with the manual labour involved in installing the home improvements provided under the program.185 CYP’s integration of the ‘strategic conversation’ into each of its projects also requires participants to identify a personal goal for the future, commit to that goal and establish an action plan to achieve that goal, placing personal responsibility at the centre of its operations. Insofar as the FRC is a service, it also clearly seeks to encourage individual and family responsibility: first, by enforcing behavioural obligations; and second, by convening a conference in which the client is an active participant and is encouraged to take responsibility for actions such as attending referrals to services or implementing a family responsibilities agreement. Thus, the innovative new institutions, programs and services introduced under welfare reform clearly operate in a way that encourages personal responsibility, as this is built into their underlying design, guidelines and operations.
More significant is whether the suite of existing services, and any new services and programs that are not necessarily part of the welfare reform agenda, are repositioned in a way that supports the welfare reform philosophy. Such services include schools, public housing, employment services, child protection, family support, health, local government and policing. For these services, it is more difficult to ascertain whether they have changed in a way that supports the trial philosophy. Both the survey and qualitative study of service providers indicated that there was a high level of awareness and understanding about the philosophy of welfare reform. Furthermore, 49.6 per cent of respondents to the survey said that the way services encourage individual and family responsibility had changed in the past three years, while only 10.6 per cent said that it had not (the other 39.8 per cent had not been servicing the community long enough to be able to answer).186 Therefore, there is a strong perception among service providers that services are now encouraging responsibility to a greater extent than previously.
However, only 39.6 per cent of respondents indicated that their own service’s way of operating had changed in order to support the trial, while 22.5 per cent indicated that it had not changed to support the trial. This suggests that, although many services have repositioned to support the trial, a sizeable minority have not changed the way they operate at all since the trial was introduced. This is confirmed by the finding in the qualitative study that some service providers in Aurukun did not understand the expectation that they should align their service delivery arrangements to better support the trial.187 The study also found that most service providers, apart from those delivering the specific welfare reform programs, had not modified their formal policies and procedures to align with welfare reform principles.188 The study suggested that part of this reluctance is due to service providers’ awareness that the trial is time limited, a fact that reduces the incentive to make more substantial changes to programs to align with welfare reform goals.189
184 CYP tends to refer to its programs as ‘Opportunity Products’. 185 Chapter 2, Section 2.6.3. 186 J Putt 2012, p. 44. 187 Migration Plus 2012, Section 9.2. 188 ibid., Section 9.4. 189 ibid.

Cape York Welfare Reform—Evaluation
54
A more significant difficulty for service providers is that it is not necessarily clear how the welfare reform philosophy should in practice translate into changes in the delivery of a particular service. Research into service delivery models commissioned by FaHCSIA for the trial observed that there is no accepted understanding of what ‘active service delivery’ means, other than being the opposite of ‘passive service delivery’.190 SPRC points out that ‘there is no road map or identified process for facilitating the operationalisation of personal responsibility for different service providers, and thus services are essentially left to interpret this philosophy as they see fit’.191 Both the service provider survey and the qualitative study revealed strong differences of opinion about what the welfare reform principles mean in practice. For example, some interpret a self-help and personal responsibility model as one in which the onus is on clients to enter their service’s premises and ask for assistance, rather than on the service provider to proactively undertake outreach into the community.192 Another example is whether sending a bus around the community to pick up participants for a program is consistent with the principle of personal responsibility.193
How welfare reform principles translate practically at the service delivery level is an issue that will require further exploration by policymakers and service providers if the welfare reform agenda is to be expanded. The evaluation framework indicated that signs of the trial’s success in repositioning government services would include:
guidelines for repositioning government services are clearly articulated and communicated to service providers and the community
training workshops on welfare reform principles and implications of program design and delivery.194
It is not clear that there has been sufficient attention to these types of activities during the implementation of the trial. An explicit process of independently reviewing each service’s delivery model and agreeing on measures that will encourage self-reliance and responsibility would contribute to better operationalising welfare reform principles. Greater clarity in expectations of how service delivery should change in practice would enable specific requirements to be included in government tendering processes and service agreements, which would flow through to services’ policies and procedures, as well as their reporting back to funding bodies.195 The 2008 Project Board Agreement stated no more than that service providers are responsible for ‘reconsidering service delivery to ensure it is consistent with welfare reform principles and enables supported self-help and individual choice’.196 Future agreements to implement welfare reform may need to lock in more specific processes to ensure that this happens and that there is accountability on the part of service providers for these outcomes.
Coordination of service delivery
The survey and the qualitative study both found that service providers believe that there have been significant improvements in service coordination and collaboration compared with before the trial.197 The survey revealed that 43.8 per cent of service providers believe that their service is working with other service providers differently from three years ago, with only 19.7 per cent reporting no change (while the other 36.6 per cent were unable to comment on this, probably because they had been working in the community less than three years).198 Service providers indicated a number of areas where their collaboration with other services had improved, such as communication, engagement and
190 O'BrienRich Research Group, ‘Desk-top research into active service delivery and related philosophies of service delivery’, unpublished report prepared for FaHCSIA, 2010. 191 Chapter 3, Section 3.6.2; see also Chapter 7, Section 7.5.6. 192 See J Putt 2012, p. 66. 193 Migration Plus 2012, Section 9.4 194 Courage Partners 2010, pp. 70, 72. 195 See Migration Plus 2012, Section 9.4; J Putt 2012, p. 61. 196 2008 Project Board Agreement, p. 11. 197 See Migration Plus 2012, Section 9.3; J Putt 2012, p. 60. 198 J Putt 2012, p. 44.

Evaluation overview
55
relationships. It seems that the FRC has played a role in this improvement of service provider coordination through ‘acting as a broker and supervisor of cases’.199
However, while service providers reported improvement in coordination, there remained significant challenges in this regard. FRC coordination with referral agencies is an ongoing challenge in some locations and with some services.200 Relationships between service providers are variable and do not necessarily cross over between service sectors and between residential service staff and ‘fly-in fly-out’ staff.201 The service provider survey detected barriers between some of the specific welfare reform services and other services.202 Community interagency meetings are not necessarily effective in improving coordination and information sharing, while there are no interagency meetings in Cairns, leading to some agencies continuing to operate in ‘silos’.203 A concerning result from the survey and service delivery study is the lack of awareness of many service providers about other services operating in the communities they serve.204
One of the objectives of the welfare reform proposals was for the needs of individuals and families to be better case managed through responsive services and the FRC referral process. The From hand out to hand up report emphasised that case management will be a critical tool to support people to address dysfunctional behaviour, noting that the international experience shows that welfare payment obligations are more likely to succeed if case management programs and support services accompany them.205 The original FRC proposals included case managers being engaged in each community to coordinate responses to each FRC client’s needs, but the KPMG review of implementation of the FRC in 2010 noted that this aspect of the model had not been implemented.206 It was instead expected that the new Wellbeing Centres would provide case management of individuals, but KPMG found that this was not meeting the need. The recent evaluation activities confirm that coordination of case management is an ongoing gap in the service delivery framework under the trial.207 Confidentiality of client information is a barrier to agencies working together to coordinate case management. However, the result is that individuals are subjected to multiple intake interviews at different services and are the subject of several separate case plans at each service. Furthermore, where problems that are being addressed are at the family level, different services may be working with different members of the same family (e.g. different services working with men, with women and with children) under different case plans, when one coordinated case plan for the family might be more appropriate.
This is a challenge across the social service sector, but in small discrete Indigenous communities it might be possible to design and implement a more coordinated case management model. Some respondents to the service provider survey suggested a central point of liaison or coordination for case management that would ensure a multiagency approach in which services do not overlap or work in isolation.208
Responsiveness and level of community engagement
Part of the repositioning of service provision envisaged by the trial is a reorientation of services to be more responsive to the needs and aspirations of Indigenous communities, and more engaged with the community in an empowering manner. This flows from the view that services have been too much driven by government agencies’ agendas in a way that disempowers community members and entrenches dependency and passivity. The service provider survey indicated that a majority of service
199 ibid., p. 64. 200 Migration Plus 2012, Section 9.3. 201 ibid. 202 J Putt 2012, pp. 57–58. 203 Migration Plus 2012, Section 9.3. 204 J Putt 2012, p.65; Migration Plus 2012, Section 9.3. 205 CYI, From hand out to hand up, p. 66. 206 KPMG, p. 22. 207 Chapter 7, Section 7.5.6; Migration Plus, Section 9.3. 208 J Putt 2012, p. 58.

Cape York Welfare Reform—Evaluation
56
providers perceive an improvement in their service’s engagement with the local community over the past three years.209
Respondents’ perceptions of how collaboratively other service providers worked with the local community were not quite as positive, although they were more positive than their perceptions about how well other service providers shared information or communicated with other service providers.210 Service providers indicated that their own service frequently consulted with local community members or local leaders. Interestingly, 53.6 per cent of service providers reported that they often consult with FRC Commissioners, while 19.6 per cent reported that they occasionally do so. This suggests that the local FRC Commissioners have provided an important new avenue for service providers to engage with the community. In both the survey and the qualitative study, many service providers commented positively on the local FRC Commissioners personally and in terms of their role in the community.
The local FRC Commissioners have the opportunity to not only provide advice to external service providers, but also, through their conferencing and decision-making, to directly influence the way services are accessed and delivered. John von Sturmer has suggested that in engaging local people of significance and knowledge, the FRC can enable local ‘case-based experience and understandings’ of what the problems are and what strategies might work to address them.211 Unlike previous initiatives, the FRC model puts local community members at the forefront of efforts to identify both the problems and the solutions. This element of the trial is having an important impact in reorienting service provision in a way that empowers the community to tackle norm and behaviour change.
The welfare reform proposals anticipated that further empowerment of the Indigenous community in service delivery would occur through increased levels of Indigenous employment in service jobs. The service provider survey noted that 27 per cent of respondents were of Aboriginal and Torres Strait Islander background, which is much higher than the 10 per cent figure from a similar survey conducted in the Northern Territory.212 A survey of 48 public, private and non-government employers in the trial communities found that 66 per cent of the total jobs (720) were filled by Indigenous people (see Chapter 8). However, a frequent criticism expressed by community members participating in the social change surveys was that too many of the welfare reform jobs were filled by outsiders.213 Von Sturmer notes that where local residents are employed in other services they usually occupy only an ‘adjunct role’ servicing the professional staff.214 These observations suggest the need for greater effort in training and capacity building to equip Indigenous community members to play a more central role in the delivery of services under welfare reform.215
Conclusions about service delivery
The trial has seen the introduction of a raft of new services and opportunities that are specifically designed around the principles of individual, family and community responsibility. Most service providers perceive that service delivery has changed as a result of the trial in ways that support the welfare reform philosophy. However, there has been inadequate attention to identifying how the welfare reform principles should translate into changed practices at the operational level, and there continues to be a lack of consensus in this regard. While the usual challenges persist, there is a perception that coordination and collaboration between service providers have improved as a result of the trial, although a better model for coordination of case management is considered necessary to optimise outcomes for community members. The level of engagement of services with community 209 ibid., p. 53. 52.2% felt there had been a change in their service’s engagement with the local community (almost all positive), 20.4% thought there had been no change, while 27.4% could not comment. 210 ibid., Figure 9, p. 53. 211 von Sturmer et al. 2012, Chapter 3. 212 J Putt 2012, p. 63. 213 Colmar Brunton, ‘Social change research study: Hope Vale community report’, unpublished report prepared for FaHCSIA, Canberra, 2012, p. 104. 214 One key exception is the employment of indigenous leaders in the Cape York Partnerships’ Opportunity Hubs. 215 Models such as the Palm Island Community Company might be considered as a means for government and the community to partner to build local community capacity for the delivery of professional social services.

Evaluation overview
57
members has also improved during the trial, with greater opportunities for communities to influence and participate in service provision. Training Indigenous people to fill service positions remains an ongoing need, however.
The FRC has been a significant contributor to these improvements around reorienting service provision. The FRC is itself a service that gives effect to the welfare reform principles of personal responsibility, while it also acts as fulcrum for encouraging better coordination between services. Importantly, the FRC model empowers respected and knowledgeable local community members to provide input about service delivery and to lead the process of identifying the problems and driving solutions in collaboration with service providers.
1.7.4 Have governance arrangements supported changes in service provision and social norms and behaviours?
The proposed governance arrangements for the trial were originally stipulated in the Project Board Agreement signed by the three partners in July 2008. A diagrammatic representation is contained in figure 3.2 in Chapter 3 of this report. The pivotal governance structure is the Project Board, which is constituted by the Director General of the Queensland Department of the Premier and Cabinet, the Secretary of the Department of Families, Housing, Community Services and Indigenous Affairs, and the Director of the CYI. As the evaluation framework report highlighted in 2009, the trial’s governance arrangements are innovative in the inclusion of not only two levels of government, but also the CYI, an agency independent of government.216 The report noted that a key evaluation question is how these unique governance arrangements have contributed to successful outcomes, and it recommended that a special review of the governance arrangements should form part of the evaluation to consider this issue. A comprehensive review of the governance arrangements has not been undertaken as part of the current evaluation. This is a gap for which a response ought to be considered, because a review of governance will have important lessons for the design of future reform programs of a similar nature to the trial.
In the absence of a detailed evaluation of this issue, it is not possible to make more than general comments in relation to the impact of the governance arrangements on achieving the trial’s objectives. The only available evidence is contained in SPRC’s review of implementation in Chapter 3, a short description of the governance arrangements in Chapter 2 (Section 2.5), and examples throughout the evaluation activities that illustrate how the governance arrangements have facilitated or inhibited various aspects of the trial.
An initial observation by SPRC is that the governance arrangements have not been implemented as originally planned.217 For example, the intended Welfare Reform Action Plan was not used to guide implementation of the trial and local implementation committees were not established in all the CYWR communities as originally designed. Local implementation committees only operated for a short time in two of the communities but were abandoned and existing committee arrangements were used instead. Some structures, such as the Executive Management Team and the local program offices, were central to implementation early in the trial but were discontinued or evolved into other arrangements in later years. SPRC’s assessment is that this may have been necessary where the structures were cumbersome and bureaucratic, but that it may also have led to a loss of coordination and coherence in some respects.
The Project Board has continued to be the pivotal governance structure in the trial. To some extent, the Project Board’s active ongoing role in monitoring the trial was ‘locked in’ by the Family Responsibilities Commission Act 2008, which established the Family Responsibilities Board with the same membership as the Project Board and required quarterly meetings which all members must attend. The level of seniority of the Project Board appears to have been an important factor in
216 Courage Partners 2010, p. 33. 217 Chapter 3, Section 3.7.1.

Cape York Welfare Reform—Evaluation
58
maintaining the necessary drive and commitment of the partners to the trial. The government board members also had sufficient authority to be able to resolve bureaucratic impasses or other implementation barriers. The governance model was adapted to focus effort on removing impediments using a 60-day agenda supported by an operational group known as the Pentagon. On the other hand, Chapter 3 notes that the tripartite partnership approach embodied in the Project Board carries the risk of progress being hampered by disagreements and lengthier approval processes.218
An issue for further exploration in a governance review would be the efficacy of the intergovernmental arrangements for the trial. Previous reforms such as the COAG trials have highlighted the challenges for effective government coordination in Indigenous service delivery.219 The CYWR included some innovative governance structures that have sought to address these challenges.
A review might also consider the relative merits of the Queensland and Australian government representation on the Project Board. At the state level, representation was by the Director General of the Department of the Premier and Cabinet rather than the Indigenous affairs agency, while at the Australian Government level, representation was by the secretary of the agency responsible for Indigenous affairs. The intent of having the Premier’s department head leading the process at the state level was to ensure a high degree of authority and whole-of-government coordination for the Board’s agenda.
A related question is how effective the government parties have been in leading the desired change in service delivery across the full range of agencies involved in the trial communities. For example, it would be illuminating to explore the reasons why insufficient attention has been paid to encouraging government services to change their service delivery practices in line with the welfare reform philosophy (discussed in Section 1.7.3).
The unique and most innovative aspect of the trial’s governance arrangement is the high-level partnership with an independent, non-government agency in the form of the CYI. This arrangement arose from the fact that the trial emerged from the advocacy work of the CYI, encapsulated in the From hand out to hand up report.220 The tripartite partnership arrangement is also reflected in the operational arrangements, under which Cape York regional organisations that are partners of the CYI (notably Cape York Partnerships and Balkanu Cape York Development Corporation) are responsible for the delivery of several of the program elements under the trial. The rationale for the primacy of Cape York regional organisations in the delivery of many of the trial’s programs is that these organisations had been developing the models for ‘enabling’ programs that underpinned welfare reform for several years prior to the trial. For example, Family Income Management, the Work Placement Scheme, MULTILIT and SETs were programs developed by Cape York Partnerships prior to the trial.
The significance of the CYI’s involvement in the governance of the trial through the Project Board is that it facilitates high-level input into policy and program development for an Indigenous-led organisation that has spent considerable time undertaking research, policy development and program design in the area of welfare reform.221 The trial is an example of a policy and program reform agenda that has been shaped largely by an independent think tank, rather than government policymakers. Importantly, the CYI brings a Cape York Indigenous perspective to a forum that is making decisions with significant impacts for Cape York Indigenous people. In this way, the Project Board governance arrangement embodies a partnership approach between government and Indigenous leadership that is consistent with the welfare reform philosophy of ending passive, government-defined service 218 Chapter, 3. Section 3.8. 219 J Hunt, ‘Between a rock and a hard place: self-determination, mainstreaming and Indigenous community governance’, in J Hunt, D Smith, S Garling and W Sanders (eds), Contested government: culture, power and institutions in Indigenous Australia, CAEPR Research Monograph 29, 2008, p. 37. 220 CYI, From hand out to hand up, vol. 2, 2007. 221 One of the six COAG principles for Indigenous program and service delivery is the ‘Indigenous engagement principle’, which states that ‘engagement with Indigenous men, women and children and communities should be central to the design and delivery of programs and services’ (National Indigenous Reform Agreement).

Evaluation overview
59
delivery and empowering Indigenous leadership of policy and program design and delivery. Former Treasury Secretary Ken Henry has argued that ‘an absence of effective engagement of Indigenous Australians in the design of policy frameworks that might improve social and economic incentives and build capabilities’ is one of the key causes of Indigenous disadvantage, along with poor economic and social incentives and the underdevelopment of human capital and of capability in general.222
While the rationale for the partnership structure is clear, the inclusion of an Indigenous non-government organisation as a high-level partner in the peak governance arrangements for the trial has posed challenges for government. First, partnering with an Indigenous organisation involves stepping into the Indigenous political arena, potentially attracting criticism from those who do not support that organisation. Second, such power-sharing arrangements tend to confound the bureaucracy’s orthodox decision-making and approval processes. For example, the Project Board was initially responsible for authorising projects under the Service Procurement Fund, which was intended as a flexible pool of funds available to the partners to support the trial’s implementation. The delivery of projects such as the Parenting Program to meet identified gaps was funded through Cape York Partnerships under this fund. However, during the course of the trial, changes regarding the approval processes for the fund, such as the application of the Queensland Department of Communities’ standard procurement processes and the Minister’s requirements derived from the Community Services Act 2007, reflect the inherent tension between the intended flexible and responsive nature of the fund and conventional government funding processes.
The Queensland and Australian governments’ original agreement to support the trial was a conscious decision to implement a reform package designed by the CYI and to be delivered in partnership by Cape York regional organisations and various government agencies. Yet, the participation of Indigenous non-government organisations as partners in both the high-level governance of the trial through the Project Board and the frontline delivery of trial projects inevitably requires a re-think of conventional government processes around decision-making and procurement.
In approving the extension of the trial in mid-2012, the Queensland Government requested reforms to the governance arrangements to change the Project Board’s mandate from managerial to advisory. This may mitigate the challenges noted above, but could be seen as a departure from the original tripartite partnership model and a return to a more traditional governance model based on greater bureaucratic control.
The trial’s unprecedented governance model involving two levels of government partnering with a non-government organisation in the high-level government management of a reform program deserves fuller analysis through a separate governance evaluation. Whatever the structural considerations might be, there can be no doubt that the vision and advocacy of the CYI has been central in sustaining the impetus for the implementation of the trial.
A final issue regarding the trial’s governance arrangements is the level of involvement of existing Indigenous community representative structures. Representative bodies in all of the four communities agreed to the implementation of the trial by the end of 2007. The planned trial governance structures included scope for the local Indigenous leaders and Community Justice Groups to be involved in the local implementation committees and for community mayors and local leaders to have input at the Project Board level. As noted above, SPRC found that the local implementation committees only operated for a short time in two of the communities. Some mayors have attended Project Board meetings on a handful of occasions during the trial.
A specific review of the interaction of the trial governance with existing community governance structures has been outside the scope of the current evaluation, so in-depth assessment of this issue is not possible. However, the evaluation activities have revealed some community concerns about the
222 K Henry, ‘Creating the right incentives for Indigenous development’, address to the Cape York Institute Conference, Cairns, 26 June 2007.

Cape York Welfare Reform—Evaluation
60
level of integration of the trial governance with existing community governance structures.223 Part of the rationale for the trial’s design was to depart from the traditional reliance on Indigenous community councils to deliver a range of social and welfare services that are beyond their core local government functions and often challenge their service delivery capacity. On the other hand, these councils continue to play central leadership roles in their communities and their support for an agenda such as welfare reform is important for it to succeed. An effective partnership with the local council has clearly been a challenge for the trial in Hope Vale, and a specific review of the trial governance would be useful in evaluating the impact of such issues.
If aspects of the trial are to be implemented in any other Indigenous communities in the future, it will be important to take heed of lessons from the trial in regard to governance design issues.
1.8 Conclusions
1.8.1 Progress in terms of the program theory The discussion in this chapter provides the basis to assess the trial’s progress in terms of the nine-phase program theory proposed in the original evaluation framework (see Figure 1.2).
The program theory considers the first two outcomes as being the essential foundations and enablers for the trial. The trial quickly progressed through Outcome 1 in the program theory in the early years as the FRC and various supporting services and activities in the Social Responsibility and Education streams were developed, implemented and communicated to the communities. As discussed in Section 1.7.1, however, there has been a lack of progress in implementing program elements in relation to the Economic Opportunity and Housing streams. Also, the evaluation has found that there has been insufficient communication and assistance to service providers about the specific changes to service delivery that are necessary for each service to be reoriented to the principles underpinning welfare reform (see Section 1.7.3).
The story is similar for Outcome 2, with solid progress in the Social Responsibility and Education streams but less in the other streams. The strong support for the FRC and income management (with the exception of Hope Vale, which is more ambivalent) demonstrates that community members understand and accept the incentives and drivers under the trial. The acceptance of the incentives is evident in the strong take-up of support services and opportunities under the trial.
The evaluation has found that behaviour change is occurring consistent with Outcome 3 in relation to many of the desired behaviours. Many residents are responding to the drivers and incentives inherent in the FRC and income management model. Parents are being more disciplined in sending their children to school, especially in Aurukun. Significantly, the acceptance of the trial’s incentives and drivers is demonstrated by the fact that residents who have had contact with the FRC tend to have much more positive views about it than those who have not. In addition, services such as MPower, parenting programs and the Wellbeing Centres are increasingly being accessed voluntarily, rather than only as a result of FRC orders.
Evidence that individuals and families are beginning to gain respite from daily living problems as per Outcome 4 is discussed at length in Section 1.7.2. Significant findings include: increased school attendance; improved money management through BasicsCard and MPower; the reduced crime rate in Aurukun; perceptions that children are happier, healthier and more active; and positive self-reported perceptions that life is on the way up for most people.
223 Qualitative findings from the social change survey included the observation that ‘In terms of improving the operation and effectiveness of the CYWR trial, community members want more communication, consultation and more of a feel that they and their representative structures like local Councils are being listened to’ (Colmar Brunton, Social change research study: aggregate report, 2012, p. 41). This issue was also raised by service providers who responded to the service delivery survey, J Putt 2012, pp. 59–60.

Evaluation overview
61
Figure 1.2 Program theory
Source: Courage Partners, 2008.
Progress around the more fundamental behavioural changes represented by Outcome 5 is more ambiguous. Section 1.7.2 spells out the evidence in the evaluation that people are taking a greater personal responsibility for issues and raising expectations, particularly in areas such as sending children to school, caring for children and families and their needs, and accessing supported self-help to deal with problems. However, much less progress has been made in encouraging the transition from welfare into employment or business ownership.
The increased capability of individuals in Outcome 6 is said to have been achieved when individuals and families are moving off income management, reducing reliance on support services, increasing participation in later years of education, training and employment, caring for the community
1. Appropriate policies and strategies are developed and communicated
2. Individuals, (families and communities) understand and accept incentives and drivers in Trial and believe that support and opportunities will be available to them if they participate
5. Individuals and families are motivated to take greater personal responsibility and begin to raise their expectations of themselves and their families
4. Individuals and families begin to gain respite from daily living problems and see potential for better lives.
3. Individuals increase their participation in opportunities and respond to drivers and conditions
6. Individuals increase capability in learning, working, personal family and community functioning.
7. Individuals apply capability to pursuing opportunities in education, real employment and sustaining functional families and communities.
8. Beliefs, expectations, aspirations and obligations of individuals, families and communities continue to evolve, supporting and sustaining change.
Essential foundations and enablers for Trial
Behaviour change
Long term lasting change
9. Rebuilt social norms leading to strong responsible communities.
Cape York Welfare Reform—Evaluation
62
environment, taking up private home ownership and acting on aspirations for a better life.224 The trial has not yet brought about significant behaviour change in these areas.
Outcome 7 involves individuals applying this capability to pursuing opportunities in education, employment and family functioning. Again, there is not yet evidence of this outcome being achieved in terms of indicators such as substantially improved educational outcomes, greater family income, and marked reductions in violence, alcohol abuse and drug use.
Outcome 8 envisages a continuing evolution of beliefs, expectations, aspirations and obligations of individuals, families and communities in order to support and sustain change. The evaluation framework did not assume that evidence of this outcome would exist in the life of the trial. Similarly, the framework suggested that it would be highly unlikely within the term of the trial to see the ultimate Outcome 9 of rebuilt social norms leading to strong, responsible communities. Consistent with this view, there is not yet substantial evidence of these long-term indicators for outcomes 8 and 9.
Thus, in terms of the theory of change, the trial has largely established the foundations and enablers under outcomes 1 and 2 and started to bring about the behaviour change envisaged through outcomes 3, 4, and 5. However, this success relates more to the streams of Social Responsibility and Education than it does to Housing and Economic Opportunity.
The theory of change illustrates the long-term nature of the agenda to rebuild social norms. Progress to the middle of the continuum is probably the best that could be expected in a three- to four-year timeframe. This is particularly so when many of the trial activities did not commence or become effectively functional until some years into the trial. The assessment by service providers reported in the service provider survey reflects a realistic assessment of what is possible in the timeframe: ‘Service providers were in the main positive about the impact of the trial on communities and their residents. Many believed the signs were promising, but it was too soon to expect major changes in key outcome areas’.225
1.8.2 Further observations about the trial’s progress There are a few aspects of the trial’s progress that warrant further comment.
The differential progress between the Education and Social Responsibility streams and the Housing and Economic Opportunity streams deserves greater consideration. It is likely that the lack of progress in the latter areas is the result of the delayed and more difficult implementation of the trial’s activities in those areas. In this case, it might be hoped that there will be greater progress in the next few years. It is also clear that the challenges for Indigenous communities are greatest in relation to creating sustainable employment and business opportunities and fundamentally altering community members’ housing circumstances. Alternatively, it might be argued that there is a natural sequence between the Education and Social Responsibility streams and Housing and Economic Opportunity streams. Behaviour change around social responsibility creates a stabilised community environment, while the education initiatives ensure that children gain better education levels. Together, these are vital preconditions for greater employment and business enterprise and greater capacity for improving homes or moving to private home ownership. There is, however, a risk of failing to consolidate on the progress that is being made if job and business opportunities are not available at the time that human capital is developing and positive incentives are being put in place. The trial was designed as a ‘comprehensive and holistic’ response to both social and economic circumstances226, so a lack of progress in the economic opportunity sphere will threaten the success of the entire venture.
The evaluation has also revealed different levels of ‘buy-in’ and commitment across the four trial communities. The largest demonstrable impact is in Aurukun, which is perhaps not surprising as it exhibited the highest levels of social dysfunction prior to the trial. Hope Vale has proven to be the
224 Courage Partners 2010, p. 65. 225 J Putt 2012, p. 13. 226 CYI, From hand out to hand up, p. 8; Courage Partners, Attachment A.

Evaluation overview
63
anomaly, as the levels of support for the trial and the FRC are the lowest there, according to the social change survey. However, apart from the FRC, which is seen as the symbolic flagship of the trial, the various other support services and opportunities seem to have attracted the same level of approval in Hope Vale as in other communities. Furthermore, in Hope Vale as in the other communities, people who had been exposed to the FRC were more likely to support it.227 The lower levels of endorsement of the trial in Hope Vale therefore may not reflect a lack of success of the trial activities in that community, but rather a lower level of access and participation in the activities. The authors of the social change survey separated respondents into four population segments that seemed to exhibit different response patterns. Hope Vale had by far the highest proportion of what was termed the ‘spectators’ segment (people who attended neither the FRC nor a service) at 56 per cent of the respondents, compared to 37–38 per cent in the other communities.228 This group contained a higher proportion of males, people without children, people who work for the private sector or other organisations, and people who expressed less strong views about community values.
Within communities, the segmentation analysis indicates that the trial has clearly had differential impacts on different subsets of the community. The residents who indicated that their life had changed the most and who linked it to trial activities were in Segment 1 (those who had used the FRC plus support services) and Segment 4 (those who had just accessed support services). The residents reporting the least progress were the ‘harder to reach’ individuals and families in Segment 2 (who attend the FRC but do not attend any of the support services) and Segment 3 (who are spectators, attending neither the FRC nor any services). The spectators in Segment 3 are either complying with the behavioural obligations (and therefore not being called before the FRC), or they are outside the jurisdiction of the FRC because they are not on welfare or CDEP. Some of the latter group may be non-compliant, but they are beyond the reach of the trial unless they voluntarily access some of the trial’s support services and opportunities. From the trial’s perspective, it is the community members in Segment 2 who are most difficult to deal with. They are being called before the FRC, probably repeatedly, but are not taking up any of the support services or opportunities that might help to improve their lives. Extrapolating from the social change survey responses, the analysis suggests that in three of the communities this segment represents between 8 per cent and 15 per cent of the population, whereas in Aurukun it comprises 25 per cent.229 The initial improvement in indicators in Aurukun, such as school attendance, followed by the flattening off of progress is a good indication of how the trial can impact on those who are willing or able to change relatively quickly, leaving a more resistant group that the trial has limited ability to change. This finding begs the question whether stronger sanctions for the FRC, such as the ability to place 100 per cent of an individual’s income on Conditional Income Management (as opposed to the current maximum of 75%), might be necessary for the FRC to have impact on the individuals who are less amenable to change.
The evaluation has identified that a potential gap in the trial’s impact is in relation to many young people of high school age.230 The educational initiatives such as the CYAAA and the push to increase school attendance relate to primary school children. The main initiative for high-school-aged children is the changed ABSTUDY incentive to send them to boarding school but, for many of these children, their educational attainment is inadequate for them to survive in boarding schools. It is estimated that between a quarter and a half return to their home communities within six months. Back in the communities, there are few support services or opportunities available under the trial that cater specifically to their needs.231 Many are not re-enrolling in high school in or near their home communities. In Aurukun, DETE believes there are around 42 students of compulsory high school age who are not enrolled. The FRC has never received a formal notice to inform it about children who are not enrolled in school, in any of the four welfare reform communities. The FRC can only act if it is formally notified. A case management strategy is now in place to endeavour to re-enrol these young
227 KPMG 2010, p. 96; Colmar Brunton, Social change research study: aggregate report, 2012, p. 204. 228 Colmar Brunton, Social change research study: aggregate report, 2012, p. 71. 229 ibid., p. 71. 230 J Putt 2012, p.57; Colmar Brunton, Social change research study: aggregate report, 2012, pp. 40–41, 119. 231 Only 10% of the Wellbeing Centre’s clients are under 18 years of age (Royal Flying Doctor Service data, 2008–09 to 2011–12).

Cape York Welfare Reform—Evaluation
64
people in a boarding school out of community or in the local secondary school in 2013. Further attention is needed to ensure that these young people do not continue the cycle of passive welfare dependence and dysfunctional social behaviour. In addition to re-engagement with schooling232, a focus on training and employment opportunities and other forms of youth-focused capacity building are high priorities.
1.8.3 The big picture The past few decades of Indigenous affairs have been characterised by a hyperactive policy environment, often involving radical shifts between opposite poles, such as paternalistic state control and self-determination, or culturally specific programs and mainstreaming. In remote Indigenous communities in Queensland, regardless of the prevailing policy agendas, the story of social and economic conditions since the 1980s was largely one of stagnation or slow disintegration. The landmark Cape York Justice Study in 2001 documented the extent of the problems in Cape York Indigenous communities and, although the resulting alcohol management plans stabilised community conditions, the fundamental state of atrophy remained. The Queensland Government’s 2002 Meeting Challenges, Making Choices strategy augmented the alcohol restrictions with a concerted effort in the following years to coordinate and drive change through collaborative negotiation tables convened in remote Indigenous communities by senior public servants in the role of Government Champions. Cape York was also a site for the Australian Government’s COAG trials from 2002 to 2005.233 Government reforms have focused on partnership agreements with communities and new mechanisms to coordinate the multiple government agencies delivering services. Nevertheless, slight improvements in some indicators in the communities subject to these reforms could not mask the ongoing issues of poor educational outcomes, lack of economic opportunities, and crime, family violence and child abuse rates that are many times mainstream averages.234
It is important to evaluate welfare reform in the context of the limited progress from past efforts to improve the life circumstances of residents of remote Indigenous communities. There can be no quick fix to rectify challenges that have been decades in the making. However, the evaluation after only three years of the trial of welfare reform points to a level of progress that has rarely been evident in the reform programs previously attempted in Queensland’s remote Indigenous communities. The trial’s progress reinforces the notion that the problems of remote Indigenous communities will not be addressed solely by better coordinated and more extensive government services, which have often been the objectives of government reform efforts. Rather, sustainable improvement will require measures that also bring about fundamental behaviour and norm change, matched with genuine opportunities.
What is most promising is that some of the progress to date relates to subtle but fundamental shifts in behaviour that, if sustained and built upon, can be expected to yield significant longer term results. For example, improvements in school attendance and educational attainment will have life-changing implications for a new generation of children, while improved money management and a greater willingness to proactively take responsibility for addressing life challenges offers immediate hope for incremental improvements to adults’ quality of life.
These changes provide a foundation to launch residents of the communities on a pathway to greater engagement in the economy, although the current lack of opportunities in this regard remains the most significant challenge for the transition from welfare dependence to economic self-reliance and ongoing social stability.
232 From 2013, the Western Cape College will take responsibility for secondary education at Aurukun – see Chapter 8, Section 8.4.3. 233 Urbis Keys Young, Review of the Cape York COAG trial: Final report, prepared for the Office of Indigenous Policy Coordination, 2006. 234 Service Delivery and Performance Commission, 2007, Report on the Review of the Department of Communities, DSQ and the former DATSIP, 2007, p. 91; Department of the Premier and Cabinet, Meeting challenges, making choices: evaluation report, 2005.

Introduction
65
2 Introduction FaHCSIA
2.1 Chapter structure This chapter has been prepared by FaHCSIA on behalf of the three partners to the trial—the Australian and Queensland governments and the Cape York Institute for Policy and Leadership (CYI) to outline the history of the trial and to describe the projects that made up the trial, the funding commitments, the scope of the evaluation, the program theory that informed the evaluation strategy, and the governance and focus of the evaluation. It ends with an outline of the report in Section 2.11.
The Cape York Welfare Reform (CYWR) trial and consequent policy initiatives are a culmination of many years of welfare reform thinking. This chapter provides a brief history of the development of welfare reform in Cape York, including the establishment of Cape York Partnerships (CYP) and the CYI. The proposals for the CYWR trial were developed by the CYI and CYP through the preparation of the design reports From hand out to hand up volumes 1 and 2.
The CYWR trial is being conducted in four Cape York communities—Aurukun, Hope Vale, Mossman Gorge and Coen. A brief summary of the demography of the four CYWR trial communities is provided for context. The governance model established for the program management of the CYWR trial and changes to the model are outlined in this chapter.
The scope of this evaluation includes the four-year period of implementation and modifications to the trial between January 2008 and December 2011.235 More than 15 projects were implemented as part of the CYWR trial in the four trial communities. The projects fall into four streams: Social Responsibility, Education, Housing, and Economic Opportunity. This chapter provides a description of each stream, including the recommendations proposed in the design reports, the projects that were implemented under each stream as set out in the 2008 Project Board Agreement and any modifications, subsequently agreed initiatives, and complementary projects that have occurred since the commencement of the trial. Key and innovative projects under each stream are explained in more detail. This is followed by a summary of the funding commitments by the Australian and Queensland governments.
A description of the program theory of the CYWR trial, which informed the development of the evaluation strategy, is provided in this chapter. The evaluation framework and the governance arrangements of the evaluation are also shown. This chapter ends with a summary of the focus of this evaluation, followed by the chapter outline for this report.
This evaluation describes how the reforms were implemented, the implementation timelines and what has not been implemented, and assesses the impact of the reforms on the four communities. The evaluation focuses on the short-term and, where applicable, medium-term outcomes, as it is too early for longer term outcomes to have emerged. This report does not aim to attribute causality or separate out effects of individual programs; rather, it makes an assessment about the effectiveness of the CYWR trial as a welfare reform package. More information about the limitations of this evaluation is provided in Appendix D.
235
Although the trial has been extended to 31 December 2013, some projects do not yet have sufficient data available for the first half of 2012. To ensure consistency in data analysis between all projects, this report largely compares data from the start of the trial to December 2011. Also, although some Queensland Government departments have changed since the 2012 state election, departments referred to throughout this report reflect those in operation up to December 2011.

Cape York Welfare Reform—Evaluation
66
2.2 Development of welfare reform policy The policy concept of welfare reform in the Cape York Peninsula grew out of Noel Pearson’s book on passive welfare, Our right to take responsibility, which was published in early 2000.
Around that time, the Queensland Government provided funding for the development of an organisation to build partnerships between Indigenous individuals and families, government, non-government organisations and the corporate sector. The organisation, CYP, headed by Noel Pearson, was formed through an agreement between the Australian and Queensland governments and regional Indigenous organisations in Cape York Peninsula.
In 2002, the Australian Government supported CYP to develop reform initiatives after an inquiry into the problems associated with alcohol abuse in Indigenous communities. The inquiry, conducted by Justice Tony Fitzgerald, highlighted the need for reform:
In communities where massive alcohol consumption has virtually become the norm rather than aberrant behaviour, research suggests that the policy focus should be on facilitating long-term generational and cultural change, rather than just on modifying the practices of individual drinkers.236
A key reform initiative put forward by CYP was the establishment of a policy organisation dedicated to reform work. In 2003 the Queensland and Australian governments agreed to the formation of the CYI.
The CYI was officially established in 2004, with an independent board, under the directorship of Noel Pearson. In order to formulate its agenda, the CYI undertook in-depth discussions with Cape York leaders and identified major issues that were facing Cape York communities. This culminated in a holistic framework for social and economic reform in Cape York known as the Cape York Agenda. The end goal of the Cape York Agenda is ‘to ensure that Cape York people have the capabilities to choose a life that they have reason to value’.237
The CYI determined that the best way to progress the Cape York Agenda was to design and establish a welfare reform project. As this project was innovative from the outset, the first phase required extensive piloting of the new theory. It was decided to trial what became known as CYWR in four of the 15 discrete communities in Cape York. The four participating communities (Aurukun, Coen, Hope Vale and Mossman Gorge) were chosen because they expressed early interest in welfare reform. The boards or councils from each of the communities voluntarily signed up to the trial following an extensive community engagement process. The four communities constituted a range of Indigenous communities in terms of population, size, remoteness and retention of traditional Indigenous culture.
2.3 Demography of CYWR trial communities In 2011, the four participating communities ranged in population from around 100 in Mossman Gorge to around 1,500 in Aurukun (Table 2.1). In all the communities the majority of the population are Indigenous. According to 2011 Census data, the median age in all communities was in the mid-20s, with the exception of Mossman Gorge (31 years), which is higher than the national Indigenous figure of 21 years.
236
T Fitzgerald, Cape York Justice Study, November 2001, p. 15. 237
N Pearson, ‘Cape York agenda’, address to the National Press Club, Canberra, 30 November 2005.

Introduction
67
Table 2.1 Cape York Welfare Reform communities, estimated resident population, 2011 Census
Aurukun (LGA)a Coen (SA1)b Hope Vale
(LGA)a Mossman
Gorge (SA1)b Estimated resident population
2011 1,449 338c 1,071 103c Census count (2011)
% of population who are Indigenous 92 84 94 100 Median Indigenous age (years) 25 25 24 31
a A local government area (LGA) is a geographical area under the responsibility of an incorporated local government council or an incorporated Indigenous government council.
b Statistical area level 1 (SA1) is the lowest level of the main hierarchical structure of the Australian Statistical Geography Standard (ASGS), and is the smallest unit for the processing and release of census data.
c ABS, unpublished data, based on 2011 Census. Note: Data for smaller communities is not published. Sources for unpublished data are footnoted above. Source for published data: ABS, Regional population growth, Australia, cat. no. 3218.0, and ABS Indigenous Community Profiles.
2.4 History of the Cape York Welfare Reform trial The CYWR trial had the explicit task of reforming destructive social and economic conditions linked to passive welfare dependence and alcohol abuse across Cape York Indigenous communities.
The CYWR is a joint initiative of the Australian and Queensland governments, the Cape York regional organisations and the communities of Aurukun, Coen, Hope Vale and Mossman Gorge. Its overall aim is to rebuild social norms, re-establish Indigenous authority, increase engagement in the real economy, and move individuals and families from welfare housing to home ownership in the four participating communities.
The trial arose after the CYI (representing Cape York regional organisations and the four communities) approached the Australian Government in December 2005 with a proposal to develop a new approach to welfare. The Australian Government provided $3 million for the design phase, while the Queensland Government made in-kind contributions. In June 2007, the CYI provided the design report From hand out to hand up, outlining a comprehensive plan to rebuild social norms. Volume 2 of From hand out to hand up was completed in November 2007 and consolidated recommendations and added detail on some proposals. The design report notes that the starting point for the reform agenda was the idea that the social problems in Cape York were not only symptoms of dispossession and racism, but were also caused largely by a social norms deficit.238 The underlying policy principles of the design reports were that:
all welfare should be conditional
further government investment in capability building was needed
incentives needed to be fundamentally changed to encourage people to engage in the real economy.
After a 15–18 month engagement process accompanying the design phase, the board or council of each community formally signed on to the trial:
Mossman Gorge—11 September 2007
Coen—13 September 2007
Aurukun—4 December 2007
Hope Vale—19 December 2007.
238 CYI, From hand out to hand up, 2007, p. 7.
Cape York Welfare Reform—Evaluation
68
On 21 December 2007, the Australian and Queensland governments agreed to implement the CYWR trial based on the design reports. The Queensland Government established the Family Responsibilities Commission (FRC), an independent statutory body, via the Family Responsibilities Commission Act 2008. The Australian Government implemented complementary changes to social security law, recognising the FRC and requiring Centrelink to implement income management ordered by the FRC. Both governments made significant financial contributions to support the trial. Furthermore, FRC and associated income management measures are designed to be ‘special measures’ under the Racial Discrimination Act 1975 (Cth).239
In 2011 and 2012, the Australian and Queensland governments committed additional funding to extend and expand the CYWR trial for two further years to 31 December 2013. The extensions allow time to build on the gains made in education and social responsibility and allow further work on home ownership.
2.5 CYWR trial governance Oversight of CYWR trial is provided by the CYWR Project Board, comprising the Secretary of FaHCSIA for the Australian Government, the Director General of the Queensland Department of the Premier and Cabinet for the Queensland Government and the Director of the CYI. The three partners—CYI240, the Australian Government and Queensland Government—are jointly responsible for the program management of the CYWR trial. In order to establish the relationship and operational arrangements between the three partners, the Project Board Agreement was developed and endorsed in July 2008.
The Project Board is an administrative board established to resolve issues and support the establishment of the CYWR trial. The Project Board provides an overarching governance mechanism for the three trial partners and is responsible for:
overseeing the tripartite agreement to guide implementation of the CYWR trial
endorsing allocations from the Service Procurement Fund241
endorsing and oversighting the independent evaluation of the trial
fostering collaborative working arrangements across agencies and across levels of government
resolving blockages or impediments to achieve the delivery of government commitments.
The FRC Board plays an overarching advisory role for the operation of the FRC; however, neither the FRC nor FRC members are subject to direction by the CYWR Project Board.
Under the Family Responsibilities Commission Act 2008, the Family Responsibilities Board has the following functions:
to give advice and make recommendations to the Queensland Minister for Aboriginal and Torres Strait Islander and Multicultural Affairs and Minister Assisting the Premier about the operation of
239 Section 4 of Article 1 in the International Convention on the Elimination of All Forms of Racial Discrimination outlines a special measure as: ‘Special measures taken for the sole purpose of securing adequate advancement of certain racial or ethnic groups or individuals requiring such protection as may be necessary in order to ensure such groups or individuals equal enjoyment or exercise of human rights and fundamental freedoms shall not be deemed racial discrimination, provided, however, that such measures do not, as a consequence, lead to the maintenance of separate rights for different racial groups and that they shall not be continued after the objectives for which they were taken have been achieved’. The special measures allowance has been incorporated into Australian domestic law through the Racial Discrimination Act 1975 (section 8). 240 CYI's responsibilities as trial partner include oversight and coordination of the work of Cape York regional organisations charged with delivering trial elements. 2008 Project Board Agreement, pp. 10–11. 241
On 26 March 2009, following the transfer of the Indigenous Government Coordination Office from the Department of the Premier and Cabinet to the Department of Communities, releasing funds from the Service Procurement Fund became subject to ministerial approval.

Introduction
69
the FRC, including the action the board considers that the state or Commonwealth should take to help improve the operation of the FRC
to give advice and make recommendations to the FRC about the performance of its functions, if asked by the Commissioner
to consider reports given to the board under section 144 of the Act (the Commissioner is required to provide quarterly reports to the board, and the former minister tabled those reports in the Queensland Parliament242).
The governance processes associated with the trial were designed to ensure collective agreement between the partners, to reduce the risk of over-governing, duplication, poor coordination, and to clarify roles and responsibilities.
The CYWR governance model was designed to:
provide central coordination and monitoring
represent the roles of each of the partners
maintain a ‘place focus’
support effective and efficient implementation of central and local program elements
provide a framework for decision-making and reporting.
The 2008 Project Board Agreement proposed that service providers working in or with the four CYWR communities be required to reconsider service delivery to ensure that it is consistent with welfare reform principles and to enable a clear focus on supported self-help and individual choice.
During a series of high-level stakeholder meetings in 2010 and 2011, the trial partners agreed to develop a revised draft project board agreement. The revised CYWR governance arrangements propose that the Coordinator-General for Remote Indigenous Services be invited to join CYWR Project Board meetings as an observer. The revised draft project board agreement has not yet been agreed by the Project Board. The Queensland Government is developing new governance arrangements to involve community representatives from the four trial communities in an advisory capacity.
An attempt has been made to identify and resolve policy and implementation impasses through the ‘Pentagon’—an executive-level stakeholder group charged with breaking through obstacles. This approach has been applied, with some initial success, to address concerns about issues such as Indigenous home ownership.
2.6 The objectives, streams and projects of the CYWR trial The objectives of the CYWR trial as outlined in the 2008 Project Board Agreement were to:
restore positive social norms
re-establish local Indigenous authority
support community and individual engagement in the ‘real economy’
move individuals and families from welfare housing to home ownership.
242 Following the change of government in Queensland in 2012, the responsible minister no longer tables the reports in parliament. They are available on the Department of Aboriginal and Torres Strait Islander and Multicultural Affairs website.

Cape York Welfare Reform—Evaluation
70
Four broad and overlapping streams include a number of projects and activities designed to meet these objectives. The streams are:
Social Responsibility
Education
Housing
Economic Opportunity.
The history of the design of the streams and projects, as well as current projects and activities under the four streams, is discussed below.
2.6.1 Social Responsibility stream
The Hand out to hand up design reports argued that Cape York is socially underdeveloped. Basic social norms that are the glue to any society—such as sending children to school, respecting others, and taking care of one’s family and one’s house—have deteriorated significantly in Cape York communities. The design reports attributed this breakdown to changes over the past 30–40 years, with alcohol abuse and passive welfare dependence being key drivers. Furthermore, the reports argued that well-intentioned government services can unintentionally erode personal responsibility and entrench passive welfare-dependent behaviour.
The design reports recommended that a number of obligations be attached to all welfare payments available in the CYWR communities and that a state statutory authority consisting of a senior legal officer and local elders be empowered to enforce the obligations.
The design reports proposed that four obligations be attached to the receipt of welfare payments in the communities:
Each adult who receives welfare payments for a child should be required to ensure that the child maintains a 100 per cent school attendance record.
All adults must not cause or allow children to be neglected or abused.
All adults must not commit drug, alcohol, gambling or family violence offences.
All adults must abide by conditions related to their tenancy in public housing.
The key priorities under the Social Responsibility stream are to rebuild social norms, restore Indigenous authority and build stronger individuals and families.
The project areas in the Social Responsibility stream as set out in the 2008 Project Board Agreement were:
the Family Responsibilities Commission
Family Income Management, which transitioned into MPower in mid-2011
support services that would address drugs, alcohol, parenting and gambling
Conditional Income Management.
Subsequently, the Ending Family Violence Program and the Parenting Program were agreed through the CYWR Project Board and implemented.
Wellbeing Centres were funded separately from the CYWR trial by the Commonwealth Department of Health and Ageing and are not part of the trial governance, although they are formally recognised as a key enabling project in the 2008 Project Board Agreement.

Introduction
71
Key mechanisms for rebuilding social norms described in the design reports included encouraging and supporting volunteerism. The Community Action Fund (CAF) was implemented in the four CYWR communities for activities that promote volunteerism and build positive social norms.
Each program is outlined below.
Family Responsibilities Commission
The FRC is one of the key components of the CYWR trial. The FRC’s key objectives are to rebuild Indigenous authority and to restore social norms by reforming incentives to support socially responsible standards of behaviour at the individual, family and community levels.
The FRC applies to all community members, both Aboriginal and non-Aboriginal, who are welfare recipients or participating in the Community Development Employment Projects (CDEP) program and who reside in or have lived in Aurukun, Coen, Hope Vale or Mossman Gorge for at least three months since 1 July 2008, where the FRC has received information about one or more of the following ‘trigger events’:
A person’s child is absent from school for three full or part days in a school term without a reasonable excuse, or the person’s child of school age is not enrolled in school without a lawful excuse.
A person is the subject of a child safety report.
A person is convicted of an offence in the Magistrates Court.
A person breaches his or her tenancy agreement (e.g. by using the premises for an illegal purpose, causing a nuisance or failing to remedy rent arrears).
If one of the four trigger events occurs, the FRC receives a notification about the breach. A community member determined as a welfare recipient under the Family Responsibilities Commission Act243 receives a notice in accordance with the reporting obligations from the designated agency. The notice comes from the legislative authority:
School attendance notices are provided from the Queensland Department of Education, Training and Employment.
Child safety and welfare notices are provided by the Department of Communities, Child Safety and Disability Services.
Offence notices are provided by the Magistrates Court (Department of Justice and Attorney General).
Housing tenancy breach notices are issued by the Department of Housing and Public Works and community housing providers such as Bamanga Bubu Ngadimunku Inc (BBN) in Mossman Gorge.
For school enrolment notices, under the Family Responsibilities Commission Act the Queensland Department of Education, Training and Employment must give the FRC notice of a child’s non-enrolment.
243 Section 7 of the Act defines a community member as a person who is a welfare recipient and who also lives in one of the four CYWR communities or has lived there for a period of three months. Section 8 of the Act defines a welfare recipient where a person or the person’s partner is in receipt of welfare payments. In addition, CDEP participants receiving CDEP wages are considered welfare recipients and also come under the jurisdiction of the FRC; however, they cannot be income managed. Only people who come under the definition of a community member under the Act are within the jurisdiction of the FRC. Therefore, a person who is working (and therefore not receiving welfare payments) and lives in a CYWR community or who has been convicted of an offence in a CYWR community but lives elsewhere is not within jurisdiction and cannot be dealt with by the Commission (FRC, Quarterly report, no. 4, p. 11).

Cape York Welfare Reform—Evaluation
72
When the FRC receives a notification, it can hold a conference with the recipient of the notice to discuss their behaviour. The FRC strives to reach agreement with the person about what should happen in the first instance. After conferencing an individual, the Commission can take a range of actions to restore socially responsible behaviour, including:
family responsibility agreements
referrals to support services (agreed by the client)
notices to attend support services (ordered by the FRC)
income management
follow-up monitoring and case management
re-conferencing and intensive case management where required.
Over time, the FRC may employ all of these approaches with a client, particularly a person named in multiple notices.
The design reports recommended that the FRC have the power to direct people to support services in areas that contribute most to rebuilding social norms, such as money management services or student case management. The reports noted that there may be a need for further initiatives covering drug and alcohol services, child and maternal health services and gambling, and recommended that an audit be conducted of existing support services in the CYWR communities, particularly in relation to child and maternal health, but did not provide detailed program designs or funding proposals for those services.
The FRC can direct people to a number of support services, which have been specifically established as part of the trial or are new services that have been implemented concurrently with the trial. The FRC primary referral services are Student Case Management244, MPower (formerly Family Income Management), Ending Family Violence programs, parenting programs and Wellbeing Centres. Community members can also voluntarily seek assistance from these services.
The design reports recommended that all service providers working in or with the four communities reconsider service delivery to ensure that it was consistent with the principles of CYWR and to place a clear focus on supported self-help and responsibility at the individual and family levels.
MPower (formerly Family Income Management)
MPower replaced the Family Income Management program, which had been operating in a number of Cape York communities (including the four welfare reform trial sites) since 2001. MPower is a free and voluntary money management service designed to assist individuals and families to meet their basic material needs, develop financial literacy and build assets. MPower extended Family Income Management from a skill and capability development service to a fully integrated money management program that embeds key behavioural change elements of welfare reform: responsibility, capability, access and incentives.
Ending Family Violence Program
The Ending Family Violence Program was included in the CYWR trial in response to the need to deliver targeted family violence, substance abuse and general offending services to mutual clients of the FRC and Queensland Corrective Services.
The Ending Family Violence Program is a Queensland Corrective Services three-day intervention targeting Indigenous offenders who have been convicted of offences related to violence within their family and or community. The program, which is offered in all four CYWR communities, is based on a
244
Covered under the Education stream below.

Introduction
73
cognitive behavioural model, and utilises both active and experiential learning exercises that are culturally appropriate. The program aims to raise participants’ awareness of the impact of domestic violence on the family unit and to investigate options to assist them to change their lifestyle.
Parenting Program (It Takes a Village to Raise a Child)
The Parenting Program ‘It Takes a Village to Raise a Child’ is CYP’s Positive Parenting Program (referred to as ‘Triple P’). There are three parts to the program: Baby College, Positive Kids and Strong Families. Each part provides customised opportunity services to support the physical, emotional, social and intellectual development of the child from infancy to adulthood:
Baby College provides a college for new and expecting parents to socialise and learn together while they travel on the journey to parenthood. Parents are supported by experienced aunties, uncles and grandparents in the community and by parenting professionals. Parents graduate with a ceremony and certificate.
Positive Kids is delivered through the Cape York Aboriginal Australian Academy (CYAAA). The program works with parents to encourage positive behaviour management that optimises learning and prepares students for success in secondary school.
Strong Families supports families by helping parents to develop positive parenting skills so that they are able to meet the needs of their children. It engages families so that everything is done to ensure that families can stay together and stay strong.
Parenting consultants deliver the three courses with assistance from locally hired Indigenous ‘home crew’, whose role is to engage with families and increase uptake.
Conditional Income Management
In addition to referral to support services, the FRC also has the power to place a Conditional Income Management order on the welfare payments of individuals who breach their payment obligations. The design reports proposed that income management would underpin Indigenous authority and, like other conditionality measures, would create a deterrent against dysfunctional behaviour: people try to behave in responsible ways when they know there are consequences if they do not.
Income management under CYWR works as follows. The FRC advises Centrelink how much of a person’s welfare payment will be income managed. This is usually 60 or 75 per cent of a person’s welfare payments, to be used for essentials such as food, clothing, medicine, rent, electricity and basic household goods. The money cannot be spent on alcohol, tobacco, pornography or gambling. Income management does not reduce the total amount of a person’s payments from Centrelink, and the rest of their fortnightly entitlement is paid in the usual way.
The FRC orders income management by issuing an income management notice to Centrelink, which Centrelink must implement if the customer named in the notice receives a relevant income support payment. The FRC may also amend an income management notice to revoke the notice, extend the its duration or amend the percentage of fortnightly welfare payments that are income managed. In CYWR communities, individuals also have the choice to go onto income management voluntarily, if the FRC agrees.
The FRC can direct that the client be income managed for a period of from 3 months to 12 months, which is typical. The FRC may extend income management because:
it has received further notices about the person
the client has refused to engage with the FRC
the client has failed to follow through on commitments agreed with the FRC
the client has asked for the notice to be extended.

Cape York Welfare Reform—Evaluation
74
Wellbeing Centres
The Commonwealth Department of Health and Ageing has funded the establishment of Wellbeing Centres in the four communities, using funds sourced separately from funding for the CYWR trial. The Queensland Government also contributed to the establishment of Wellbeing Centres and their operational costs. These services are not technically part of the trial, although they are formally recognised as a key enabling project in the 2008 Project Board Agreement and offer new health services that are complementary to alcohol and welfare reforms.
The aim of the Wellbeing Centres is to implement and deliver integrated, community-based and culturally appropriate social health services through the provision of:
a holistic, systemic and community-based approach to treating drug and alcohol addiction and related mental health comorbidities, including family violence and gambling
clinical assessments, formal and informal counselling, support for individuals and their families, and support for community-driven activities that build community capacity
support for restoring social norms and empowering individuals to take responsibility for making positive choices about their health and wellbeing.
Community Action Fund
The CAF provides independent financial co-contributions to individuals and groups in the four CYWR communities for activities that promote volunteerism and build positive social norms, such as:
taking personal responsibility
developing positive and supportive relationships
promoting healthy living.
The CAF is jointly funded by the Australian and Queensland governments and is administered by CYP. The total funding for the four communities is:
$40,000 each for Aurukun and Hope Vale
$20,000 each for Coen and Mossman Gorge.
The CAF co-contribution for each project is capped at $3,000.
2.6.2 Education stream
The CYWR trial fosters social development to expand the range of capabilities, and thus the range of choices, people have available to them. The foundation of social development is rebuilding norms associated with the care and education of children.
The key priorities of the Education stream are to provide ‘best of both worlds’ education and to enable the take-up of responsibility for children’s education.
The design reports recommended that ‘demand’ for education could be increased by:
ensuring that incentives and laws support the wellbeing of children
providing supported self-help services to assist individuals to meet their parental responsibilities.
The design reports suggested that the measures aiming to increase the demand for education should be complemented by measures to improve the ‘supply’ of education by:

Introduction
75
improving the provision of education through intensive literacy instruction, known as MULTILIT245
increasing educational choice outside the communities by supporting mobility to attend boarding school.
The projects in the Education stream set out in the 2008 Project Board Agreement were:
MULTILIT
the Attendance Case Management Framework (now named Student Case Management)
Student Education Trusts (SETs)
ABSTUDY ‘bypass’.
Key projects in the Education stream—the Attendance Case Management Framework, SETs and MULTILIT—arose from the CYP Every child is special initiative.246 Learnings from these measures were incorporated into the design reports.
The most significant change in the projects since the 2008 Project Board Agreement was the establishment of the CYAAA, which replaced MULTILIT in three of the communities—Coen, Aurukun and Hope Vale.
Several developments have occurred at the national level since the Cape York reform agenda commenced.
The Council of Australian Governments (COAG) agreed on educational priorities and reform directions for the Australian education system:
Raising the quality of teaching
Ensuring that all students are benefiting from the schooling they receive, especially in disadvantaged communities
Improving the transparency and accountability of schools and school systems.
The COAG National Indigenous Reform Agreement and Smarter Schools National Partnerships, which include the Smarter Schools National Partnership for Low Socio-economic Status School Communities, are key means by which the Closing the Gap targets in education are being pursued.
Linked to the framework of national agreements and partnerships, the Aboriginal and Torres Strait Islander Education Action Plan 2010–2014 provides an overarching outline of activities to be undertaken at the national, state and local levels to close the gap between the educational outcomes of Indigenous and non-Indigenous students. The schools in the four welfare reform communities are focus schools under the action plan.
MULTILIT
MULTILIT (Making up Lost Time in Literacy) was developed by the Macquarie University Special Education Centre. It is an evidence-based approach for teaching low-progress students who are experiencing difficulties in learning literacy skills. MULTILIT was trialled in Coen as part of the Every child is special initiative in 2005–06. MULTILIT was incorporated into the design of the CYWR trial to improve the quality of educational supply, with the aims of:
closing the literacy achievement gap of Indigenous students 245
Making up Lost Time in Literacy—a remedial literacy intervention for low-progress readers based on explicit instruction. MULTILIT is a registered trade mark. 246
Every child is special was a research and development unit within CYP aimed at reforming Indigenous education by building student, family and community demand for high-expectation, high-quality education through family engagement and mutual accountability.

Cape York Welfare Reform—Evaluation
76
embedding outcomes-focused literacy instruction within the school
engaging families in improving literacy.
MULTILIT is a program for students in years 3–7. For younger children, the MINILIT (Meeting Initial Needs in Literacy) program was adapted from MULTILIT for year P–2 students.
During the 2009–10 financial year, the Australian Government transferred funding from MULTILIT to implement the CYAAA.
Cape York Aboriginal Australian Academy
Since the release of the design reports, education has been a significant area of new policy development by the CYI and CYP. The CYAAA model was described in the 2009 policy document The most important reform—Cape York Aboriginal Australian Academy and Noel Pearson’s 2009 Quarterly essay, ‘Radical hope: education and equality in Australia’.
CYAAA, which is a not-for-profit organisation, is a partnership between CYP and Education Queensland. It commenced operation in Aurukun and Coen in January 2010 and Hope Vale in January 2011, replacing MULTILIT in those communities.247 Its aim is to close the academic achievement gap between Indigenous and mainstream students and to support Cape York children’s bicultural identity by delivering a ‘best of both worlds’ education to Indigenous students.
The academy’s program incorporates three learning programs: Class, Club and Culture. The Class program uses the Direct Instruction technique to teach the mainstream curriculum in English literacy and numeracy. The Club program is aimed at enriching extracurricular artistic, musical and sport programs. The Culture program includes Indigenous culture and language programs. Both the Club and the Culture programs were designed with input from the communities.
Education Queensland is managing an evaluation of the CYAAA, which is expected to be completed in 2013.
Student Case Management (Attendance Case Management Framework)
The design reports outlined the Attendance Case Management Framework (now referred to as Student Case Management), which uses a behavioural management approach to set a community-wide expectation of 100 per cent school attendance by all students.248 Student case managers work with parents, students, schools and the broader community to set and meet the expectation of 100 per cent attendance. The case managers are based in schools in each community. They visit parents if a student is late to or absent from school and make referrals to services. They work closely with the FRC.
Student Education Trusts
SETs are a voluntary supported self-help measure. They are intended to rebuild parental responsibility and establish a social norm that parents can, with some planning, afford to meet their children’s education needs.
SETs support parents to save for their children’s educational and development-related expenses. Parents and carers make regular contributions to their child’s trust account, which can be withdrawn to meet immediate education-related expenses, as well as saved for future costs (such as the high costs associated with sending a child to boarding school).
247 In 2012, the CYAAA started the Mossman Gorge Tutoring Centre in Week 10 of Term 3. The tutoring centre provides one-on-one tutoring using Direct Instruction, as well as cultural and sporting activities. 248
The Attendance Case Management Framework used Professor Herbert C Kelman’s behavioural change model, which identifies three stages leading to behavioural change: compliance, identification and internalisation.

Introduction
77
In addition to being supported to save, families are helped to develop a better understanding of a child’s educational and developmental needs. SETs also aim to cultivate parents’ belief that, with planning, they are able to have high expectations for their children and that they can afford for their children to go on excursions and to sporting meetings, to have laptops and to meet ancillary costs associated with boarding school. The SET program also operates SETs fairs, where high-quality educational resources are sold, to improve family access to educational goods.
The SET program was funded as part of the Australian Government package of measures. Over time, the implementation of SETs has become integrated into MPower and the work of the student case managers.
ABSTUDY ‘bypass’
The design of the CYWR recommended that all secondary students be eligible for ABSTUDY and ABSTUDY away-from-home payments should they decide to attend a school that is far from their community, provided that they meet other eligibility criteria for ABSTUDY. This approach was intended to improve opportunities for students, as students in remote communities either entirely lack access to local state high schools or lack choice about schooling even though a local state high school may be present or reasonably accessible. This provision has sometimes been referred to as the ‘ABSTUDY bypass’ provision, as it enables students in the designated CYWR trial communities to bypass a school to which they may have reasonable access in order to attend another school of their choice.249
2.6.3 Housing stream
The design reports described housing provision in remote Australia as a central feature of Australia’s welfare system, second only to the provision of welfare payments. The reports also noted that social housing has special significance in Indigenous communities because of the lack of other housing options, such as private rental or home purchase.
Housing is one of four interrelated areas of welfare dependency being addressed by the CYWR trial. Housing reforms proposed by the design reports were:
normalising tenancy arrangements in social housing
the implementation of Pride of Place (PoP) initiatives in social housing
measures to shift from exclusively public provision of housing to significant levels of private home ownership.
As part of CYWR trial, the partners have agreed that the goal is to:
… shift from the current system of exclusively public provision of housing to a system based on home ownership, with public housing catering for a minority, not the majority of people.
The trial aims to bring private home ownership within reach for people living in remote Indigenous communities. This is distinct from the national goals of providing more public housing to address overcrowding. The design reports argued that home ownership brings with it pride, stability, security, responsibility and control of one’s familial environment—often for the first time. It can also be a means of pursuing financial aspirations, as well as creating individual assets that can be passed on to future generations.
Developments that occurred around the time of release of the design reports were:
249 Aurukun and Coen already had access to this facility prior to the trial, so the ABSTUDY bypass was introduced only in Hope Vale and Mossman Gorge as part of the trial.

Cape York Welfare Reform—Evaluation
78
Queensland Government reforms rolled out from 2006 onwards concerning a single model of social housing in Queensland
the Hope Vale Welfare Reform Agreement, signed between the Hope Vale Aboriginal Shire Council and the Australian Government in May 2007 (this also involved a Pride of Place Agreement and agreement by the council to divest tenancy management responsibilities to the Queensland Department of Communities)
the passage of legislation by the Queensland Parliament in 2008 enabling the provision of 99-year leases on communal land
the bilateral agreement between the Australian and Queensland governments to implement the National Partnership Agreement on Remote Indigenous Housing.
The project areas in the Housing stream as set out in the 2008 Project Board Agreement were:
mainstream tenancy
PoP
home ownership.
Mainstream tenancy
The design of the CYWR recommended that tenancy arrangements be normalised for existing social housing in Indigenous communities. The aim is to make tenancy management arrangements in the four welfare reform communities comparable to those for mainstream social housing. Normalising tenancy arrangements involves:
normalising rents so that rents better reflect market rates, or are at least consistent with mainstream social housing rates
normalising tenancy agreements so that the rights and responsibilities of tenants and administrators are clearer and are the same as for other social housing
normalising tenancy management so that a professional approach is taken and residential tenancy agreements are enforced consistently (this includes housing authorities fulfilling their obligations to upgrade houses to meet public housing standards).
These initiatives are designed to provide a basis for developing increased personal responsibility and individual incentives commensurate with the rights and responsibilities of mainstream social housing tenants. Under CYWR, breach of a tenancy agreement is one of the triggers that could see individuals and families referred to the FRC.
Pride of Place
In the design of the CYWR, PoP was put forward to embed the central themes of responsibility and reciprocity, reinforcing the central message of welfare reform. PoP was intended to develop capabilities for care of housing as a precursor to home ownership. PoP encourages families to take pride in, and responsibility for, the condition of their homes and backyards. Up to $15,000 is available for backyard improvement to families in the four welfare reform communities who have a current tenancy agreement, are up to date on their rent, and save $1,000 to contribute towards the renovations. Families are required to supply ‘sweat equity’ in the form of the physical labour. Families receiving PoP funds are also required to sign up to the MPower program to assist them with their budgeting skills.
Home ownership
The design reports proposed that there must be a continuum of housing options available in communities, ranging from social housing to private home ownership. This requires supporting policy

Introduction
79
and legislative settings to enable people to choose private home ownership, as well as measures to encourage and support people to move from social housing to home ownership.
The partners are working on a range of complex land administration issues that must be worked through before 99-year leases are taken out:
the valuation methodology and policy covering the sale of social housing and land
land administration (e.g. land-use agreements, planning, surveying)
the sustainability of home ownership for homebuyers, trustees and councils
systematically resolving issues on a community-by-community basis.
Home ownership cannot occur unless underlying land tenure and land administration issues are resolved. Different land tenure arrangements exist in each of the welfare reform communities. The Queensland Government’s Remote Indigenous Land and Infrastructure Program Office, which has been established to support the implementation of the National Partnership Agreement on Remote Indigenous Housing, is relevant to CYWR. The office undertakes land use planning, the negotiation of Indigenous land-use agreements, and land and infrastructure surveys.
A prerequisite for home ownership is a land administration system that does not place undue burden on the prospective home owner. Land administration in remote Indigenous communities is underdeveloped, and a complex series of steps must be taken before a private interest in land for home ownership purposes can be created. Although the Remote Indigenous Land and Infrastructure Program Office and other parts of the Queensland Government are addressing many land administration issues, in some cases there are many steps that a prospective home owner must take before home ownership becomes possible.
2.6.4 Economic Opportunity stream
The design reports described welfare reform as a process of moving from passive welfare dependence to engagement in the real economy. This includes individual engagement in labour markets, private property ownership and limits on the role of governments in people’s lives that are similar to those experienced by people living in mainstream Australia.
The design reports argued that a ‘welfare pedestal’ exists in Cape York communities, where the structure of incentives encourages people to obtain welfare and remain on it. A particular concern of the design reports was that young people aspired to be on CDEP rather than to get real jobs or pursue further education. Similarly, the reports noted that Indigenous people in the communities were disengaged from the real economy despite low unemployment nationally during 2007. The design reports proposed that incentives be restructured to support individual engagement in the real economy through:
CDEP reform, including measures to address CDEP cross-subsidisation and limit entry by young people to CDEP
better linkages between CDEP and employment services, with more on-the-ground staffing of employment services to improve supervision and case management
the development of mobility schemes to promote access to jobs outside the communities.
The design reports made a range of broad proposals concerning infrastructure, business development and mentoring, including:
expanding business support mechanisms
developing business-friendly communities
Cape York Welfare Reform—Evaluation
80
investing in roads and accommodation for businesspeople and service providers
investing in business premises
reforming land tenure arrangements to enable the granting of 99-year leases.
Consistent with these broad proposals, the project areas in the Economic Opportunity stream as set out in the 2008 Project Board Agreement were:
business precincts (including ‘lighthouse’ projects)
mentoring and up skilling
real full-time jobs
mobility.
Additionally, village opportunity hubs (O-Hubs) were included as an enabling project that evolved over time and that was later included as part of the trial.
There are two elements in the Economic Opportunity stream: the employment element and the economic development element.
The major priorities of the stream are to make communities more business friendly, provide business development support and create employment opportunities. Major activities under this stream include the establishment of business precincts in Aurukun and Hope Vale to make it more attractive for businesses to establish and operate; the provision of business support services to local individuals and groups in business development; the provision of small business support to local enterprises; the provision of support to Indigenous people from CYWR communities to seek employment outside their community through a work opportunity network250; the conversion of selected CDEP positions to real full-time jobs; and the preparation of people for employment by providing specific training and support through a job readiness program.
Employment
The receipt of either of two categories of welfare and employment payments may place a person under the jurisdiction of the FRC. These are:
CDEP wages
income support (IS) payments.
Some people in receipt of IS have participation requirements attached to their payments. They may participate in CDEP projects, but their main income is an IS payment and not CDEP wages.
The design reports recommended that support be provided for Indigenous Australians who wish to relocate voluntarily to areas with greater job opportunities. The 2008 Project Board Agreement included a mobility project under Structured Training and Employment Projects (STEP).
Economic development
The design reports envisaged that business support services for local people would be available to provide mentoring, skills development activities and business loans, and to aid business development.
Business loans and business development are supported through Indigenous Business Australia (IBA) to implement welfare reform. IBA received a capital appropriation from the Australian
250
At the time of writing the work opportunity network is in the design phase.

Introduction
81
Government for business loans, along with departmental funds for the support of new Indigenous businesses in Cape York communities.
The CYWR governance structures agreed that each community should have ‘lighthouse’ projects or special projects. These developments are progressed under governance structures for CYWR and those of the National Partnership Agreement on Remote Service Delivery and are funded from various sources. The Aurukun and Hope Vale business precincts are lighthouse projects and are intended to create significant long-term economic benefits for the local community and the region.
Three projects originally identified in the 2008 Project Board Agreement were:
CHALCO (Aurukun)
Gateway Project/Visitors Centre (Mossman Gorge)
Millers Block–Hope Valley Estate (Hope Vale).
A lighthouse project for Coen was not identified at the beginning of the CYWR trial.
Over the course of the trial, additional lighthouse projects were identified:
Ranger activity in Coen
Aurukun Business Precinct
Hope Vale Business Precinct
Aurukun tavern redevelopment/sports precinct
Hope Vale Horticultural Project.
The development of the Aurukun business precinct has been delayed due to a range of local factors, including land tenure, commercial viability, business arrangements with the Aurukun Shire Council and funding arrangements.
The design reports stated that ‘Village hubs are spaces in which norm modelling and transmission can take place between community members. External service providers can teach knowledge and skills but they cannot transmit and build social norms.’
A village opportunity hub (O-Hub) is a ‘one-stop shop’ where people can access opportunities that improve their lives. Families can come in, browse the range of opportunities and talk to one of the team about planning for their futures. The diverse range of opportunities includes sorting out family finances, finding a job, taking care of children’s education needs, getting help with parenting, beautifying the family backyard or buying the family home.
An O-Hub is a welcoming environment that combines the friendliness of a village meeting place with the purposefulness of a market and the professionalism of a business.
O-Hubs are customised to enhance the ‘user experience’ and maximise family participation in the opportunities. The hubs are staffed by local Indigenous leaders who ‘live the values’ they promote. They lead highly specialised teams of mostly local people to ensure local decision-making on family engagement and the promotion of opportunity products. Engagement with local leaders and positive role models is a key challenge.
Visitors are greeted as they walk in by a large welcome wall written in a local language. Two long shelves feature a range of dioramas of the opportunity products, so families can see and understand what the offers mean to them. Family photos from past and present that show positive images of families at work and at play hang in each room, and positive messages in local languages appear throughout the building.

Cape York Welfare Reform—Evaluation
82
2.7 Funding commitments by the Australian and Queensland governments
2.7.1 Introduction
Funding for the trial needs to be looked at separately to determine what was unique and only occurred in Cape York and what was occurring more widely in remote Australia. For example, the FRC operates only in Cape York, whereas CDEP reform is occurring across remote Australia.
The scope of the CYWR trial also needs to be considered. Projects not governed by the CYWR Project Board, such as Wellbeing Centres and the CYAAA, are not included in the summary below.
The CYWR was jointly funded by the Australian and Queensland Governments. The funding package for the initial four-year period from January 2008 to December 2011 was $88 million, with supplementary funding of $44.94 million. However, it should be noted that these figures combine funding for standard government services modified to fit with welfare reform, together with the additional funding for innovative CYWR projects, and this needs to be unpacked. These figures do not clearly show the cost of those aspects of the CYWR which are unique to welfare reform. The makeup of these figures needs to be disaggregated to understand the extent of funding for initiatives unique to the four CYWR communities, as opposed to funding for initiatives that were occurring more widely in remote Australia. For example the FRC only operates in the four communities, whereas reform to CDEP is occurring all across remote Australia. Both of these are included in the funding package described above.
Another factor that confounds the funding picture is that where funds are provided for education and health services, such as the CYAAA or the Wellbeing Centres, it is not clear how much of these funds are additional to the level of funding that would have normally been provided to deliver schools or alcohol and other drug services in the four CYWR communities. These figures cannot be used to estimate the cost effectiveness of the CYWR without further information about what would have been spent in these places in the absence of the CYWR.
The costs of establishing and operating the FRC also need to be considered in the context of the small number of people that are within jurisdiction. Any estimate of the unit cost of the FRC would reflect the costs of establishing a unique organisation for a small number of clients.
The detailed list of funding commitments over the initial four years (2008 to 2011), the Hope Vale Agreement and the commitments made by each government for extension of the CYWR into 2012 and 2013 are shown in Appendix C.
2.7.2 Disaggregation of normal and additional funding
The whole of the CYWR funding commitment over its first four years is described below in terms of its unique and unusual elements and also the initiatives that are occurring elsewhere, in either a modified or a standard form. This is summarised below under these four categories, unique, unusual, modified and standard, to indicate the extent of each type of commitment. Figures from the original commitments are shown, with supplementary funding (such as normalising tenancy) only included where a project is governed by the CYWR Project Board.
The unique and unusual elements amount to about half of the $88 million commitment at $42 million. Unique and unusual elements cover the FRC, SETs, Student Case Management, the CAF, Conditional Income Management, PoP, ABSTUDY ‘bypass’, the Aurukun business precinct, and project management of the CYWR by CYP. While Conditional Income Management is used elsewhere in Australia, it is shown in the unusual category because the model used in CYWR reflects the principles of the welfare reform approach. The remaining half of the $88 million commitment covers modified or standard services available elsewhere in remote Australia (such as money

Introduction
83
management, support for schools, parenting programs and programs addressing family violence). The Wellbeing Centres are also in one way unusual because they provide facilities located in the four communities, but the services they deliver are not unusual. Wellbeing Centres make up the largest amount of supplementary funding ($24.4 million).
Unique elements: $21.024 million (average $5.26 million per year)
FRC—both governments have provided funds towards the establishment and ongoing operations. For the first four years the combined commitment of $13.7224 million includes:
– $3.5 million towards establishment251, provided by the Australian Government to the Queensland Government
– $10.224 million to support ongoing operations of the FRC from the Queensland Government over four years (average $2.556 million per year).
SETs ($3.0 million), Student Case Management ($4.1 million), and the CAF ($0.2 million) are other unique elements funded by the Australian Government.
The Queensland Government also provided $60,000 in 2008–09 for CAF activities through their Service Procurement Fund.
Unusual elements: $21.82 million (average $5.5 million per year)
Conditional Income Management ($8 million), the PoP program ($2 million), ABSTUDY ‘bypass’ ($2.6 million), and constructing a business precinct in Aurukun ($3 million) were funded by the Australian Government over four years.
On-going financial assistance for the program management of CYWR by Cape York Partnerships and CYI ($3.32 million was provided by the Queensland Government and $2.9 million by the Australian Government).
Modified elements: $8 million (average $2 million per year)
Other initiatives which occur elsewhere but were modified to be used in CYWR include MULTILIT ($6.3 million), and FIM/MPower ($1.7 million), funded by the Australian Government.
Standard elements: $37.43 million (average $9.36 million per year)
Other reforms being implemented elsewhere (i.e. across remote Australia) which are also being implemented in CYWR communities include CDEP reform ($8 million), employment and mentoring services ($6 million), business loans ($2 million), and normalising tenancy ($1.43 million)252 and are funded by the Australian Government.
The Parenting Program and the Ending Family Violence Program were funded by the Queensland Government through existing programs that operated elsewhere in Queensland or through the Service Procurement Fund—an allocation set aside by Queensland Government of $20 million for the purposes of rolling out CYWR programs. The Australian Government also made small contributions to these programs (see Appendix C).
The CYAAA was also funded from the Queensland Government’s Service Procurement Fund and from Australian Government funding redirected from the MULTILIT program.
As shown in Table 2.2, this profile of funding allocation adds to $88.27 million, including the original commitments and small parts of supplementary funding (for FRC and normalising tenancy). Supplementary funding for Wellbeing Centres is not shown in this table.
251 Supplementary funding. 252 Normalising tenancy is from supplementary funding.

Cape York Welfare Reform—Evaluation
84
Table 2.2 Unique, unusual, modified and standard profile of the original funding commitment (initial four year period from January 2008 to December 2011)
Projects $m Unique elements: $21.024 million (average $5.26 million per year)
FRC 13.7 SETs 3.0 ACM 4.1 CAF 0.2
Unusual elements: $21.8 million (average $5.4 million per year) CIM 8.0 PoP 2.0 ABSTUDY bypass 2.6 Aurukun Business Precinct 3.0 CYP and CYI Project Management of the CYWR 6.2
Modified elements: $8 million (average $2 million per year) MULTILIT 6.3 FIM/MPower 1.7
Standard elements: $37.43 million (average $9.36 million per year) CDEP reform 8.0 Employment and mentoring services 6.0 Business loans 2.0 Normalising tenancy 1.4 Services e.g. Parenting Program, Ending Family Violence, CYAAA 20.0
Total 88.3 Note: Refer to Appendix C for more details.
The CYWR was jointly funded by the Australian Government and Queensland Government. The detailed list of commitments by each government over the initial four years, and the commitments for 2012 and 2013, are shown in Appendix C. Both governments have committed further funds for extension of the CYWR into 2012 and 2013 (see Table 2.3).
Table 2.3 Summary of Australian and Queensland government funding commitments for the CYWR, 1 January 2008 to 31 December 2013
Australian
Government Queensland Government Total $m
Original commitment: 1 January 2008 – 31 December 2011 $48.0 $40.0 $88.0 Supplementary funding $44.6 $16.6 $61.2 First CYWR Extension: 1 January – 31 December 2012 $16.1 $1.6 $17.7 Second CYWR Extension: 1 January – 31 December 2013 $11.8 $5.7 $17.5 Total $120.5 $63.9 $184.4
2.8 Program theory and evaluation framework In recognition of the innovative and complex nature of CYWR, a program theory was developed to support the development of the evaluation framework. The reforms are a complex set of strategies that aim to produce multiple forms of social change.
Social change is characterised by interconnected and interrelated causality. To help understand and capture the scale of change that was behind the design of the CYWR trial, Courage Partners was commissioned to prepare the trial’s evaluation framework and program theory, which was released in March 2009. The program theory links the chain of assumptions about how the measures were supposed to work. The evaluation framework has guided the conduct of the evaluation.

Introduction
85
The evaluation framework and program theory draws on the design reports and other implementation material and describes all projects associated with the CYWR trial. The framework sets out a theory of change describing how all the projects are intended to work together to produce outcomes for individuals and families. Change is designed to be embedded over a long period.
From July to December 2008, Courage Partners conducted a review of literature (including volumes 1 and 2 of From hand out to hand up and the overall project plan for 2008–09) and conducted workshops with the CYWR trial partners to explore the factors influencing the success of the trial. The workshops were attended by staff from the Welfare Reform Program Office, the Queensland Government departments involved in the trial, and FaHCSIA’s national and state offices. A second workshop was used to discuss a revised theory of change, the evaluation questions and signs of success for the trial as a whole.
Courage Partners had ongoing discussions with the trial partners to take stock of the background issues leading to the establishment and implementation of the trial and developed a single theory of change that encompassed all of the streams of effort in the trial. Courage Partners consulted with key stakeholders within the Australian and Queensland governments and the CYI to test the thinking behind the evaluation framework and to finalise it.
The trial takes a holistic approach to a multidimensional set of policy problems and is particularly challenging to assess because of the complex nature of the four streams of trial activities, the broader policy and implementation context in which those activities are taking place, the history of the communities, and the interrelated nature of the issues they are trying to address. The evaluation framework and program theory highlight the major challenges in evaluating the trial as a complex system and propose some overarching principles, key design features and methods that could be used in a comprehensive evaluation strategy.
The program theory details an outcomes hierarchy that includes short-, medium- and long-term outcome indicators to support lasting long-term change.
2.8.1 The theory of change
The program theory of change provides the theoretical and conceptual framework for understanding how the CYWR trial is intended to work by identifying the assumptions underpinning the intervention and how the planned strategies are linked to the expected impacts and outcomes. The development of the theory of change, commonly called ‘program logic’, is used to:
… surface the implicit theory of action inherent in the proposed intervention in order to delineate what should happen if the theory is correct and to identify short, medium and long term indicators of changes which can provide evidence on which to base evaluations.253
Making the theory of change explicit makes planners and evaluators focus on how the programs and measures that are being implemented will give individuals and families the capabilities needed to adopt new values, identities and behaviours. Courage Partners suggests that a theory of change and associated signs of success are not set in stone and that they should be revisited. This could be undertaken in the future based on the data used in this evaluation.
The CYWR trial is a particularly complex initiative, so it is not unusual that a number of theories of change apply to various features of the trial. Courage Partners used an approach that is consistent with common practice in evaluation, which is to use the evidence base for the initiative to reflect back on the evaluation and theory of change research and validate the theory of change with stakeholders. It did not find authoritative theoretical sources to inform how change might evolve in Australian
253
Scott London, Understanding change: the dynamics of social transformation, 1996, p. 53.

Cape York Welfare Reform—Evaluation
86
Indigenous individuals and their communities—particularly in such a complex initiative where a number of change theories may apply concurrently.254
The theory of change underlying the CYWR trial stresses the importance of individual responsibility, and postulates that social norms can influence individual and whole-of-community experiences that make up daily life. The trial aims to see whether the restoration of Indigenous authority can play a role in restoring prosocial norms through the social psychological processes of compliance, persuasion and internalisation of norms and values, as described by Kelman in 1958.255
The evaluation aims to examine whether the trial is catalysing and sustaining significant change—whether it is altering patterns of social interaction, values, customs and institutions in ways that will significantly improve the quality of life for individuals and families in the four communities. This reflects the key principles of the reforms: that the measures should work actively, offering individuals and families reasons to change their behaviour, and that the ultimate success of the reforms will depend on how community members respond to the choices and opportunities on offer.
Below is an outline of the theory of change at the strategic level across the four elements of the trial. It is necessarily broad to encompass the range of outcomes sought for individuals, regardless of the particular programs or support services they might participate in.
Figure 2.1 Program theory
Essential foundations and enablers for the CYWR trial:
1. Appropriate policies and strategies are developed and communicated
2. Individuals (families and communities) understand and accept incentives and drivers in trial and believe that support and opportunities will be available to them if they participate.
3. Behaviour change:
Individuals increase their participation in opportunities and respond to drivers and conditions.
Individuals and families begin to gain respite from daily living problems and see potential for better lives.
Individuals and families are motivated to take greater personal responsibility and begin to raise their expectations of themselves and their families.
Individuals increase capability in learning, working, personal, family and community functioning.
Individuals apply capability to pursuing opportunities in education, real employment and sustaining functional families and communities.
4. Long-term lasting change:
Beliefs, expectations, aspirations and obligations of individuals, families and communities continue to evolve, supporting and sustaining change.
Rebuilt social norms leading to strong responsible communities.
Source: Adapted from Courage Partners, Evaluation framework and program theory for the Cape York Welfare Reform Trial, 2009.
254
See Courage Partners, Evaluation framework and program theory for the Cape York Welfare Reform Trial, 2009, p. 53, for key references used to inform this view of change. 255
H Kelman, ‘Compliance, identification and internalization: three processes of attitude change’, Journal of Conflict Resolution. 1958, vol. 2, pp. 51–60. The work of Kelman is a basis for the philosophy of the From hand out to hand up report concerning social norms.

Introduction
87
2.8.2 The program theory explained In the program theory, Courage Partners sought to recognise the scale of the change that is contemplated in the CYWR trial and suggested that, for the individuals and families involved, this change is likely to be great and entail:
people changing their own behaviours (e.g. giving up drugs or alcohol)
people taking on new paradigms and learning new behaviours, attitudes and skills
people making changes in their relationships or interactions with other people
significant change on the part of service providers and government policymakers, which involves behaviour change at the personal level for staff working in those services or in policy roles.
For individuals, there are benefits and costs that may be significant. The possible benefits, such as better health, better employment, greater skills and capacities, may take time to occur, while the immediate future may call for significant effort to change behaviour in the hope of longer term gains. Courage Partners states that:
It is well established in change theory that loss tends to be more keenly felt than gain, and that people tend to discount future costs or benefits compared to more immediate costs or benefits. So the loss of a CDEP income and the certainty of that known activity may be more keenly felt and valued as negative compared with the future gain of a better paid, but so far unknown and not yet experienced new job and work conditions. These common reactions to loss and valuing of immediate rather than future gains tends to mean that people are reluctant to change unless the pain of staying where they are, that is of not changing, is perceived to be greater than the pain of making the changes.256
2.8.3 Project-level logic maps
A theory of change is a useful tool to support communication, planning, monitoring and evaluation, as well as the development of evaluation questions and as a ‘parent logic’ for a series of more detailed nested ‘offspring’ logics. These project-level logics can be in the form of separate logics for each of the individual projects or activities that form the basis for the theory of change. This would help to ensure that the design, monitoring, evaluation and reporting for each of the components are clearly linked to the overall ‘parent logic’. The nested logics would be a key source of evaluation questions concerning the impact of each of the components. These nested project-level logic maps were developed by the CYI during 2011 and 2012.
Project-level logic maps have been developed for the 15 individual programs that were part of the CYWR trial, as well as for the CYAAA and Wellbeing Centres and some specific activities under the Economic Opportunity stream, such as job readiness and small business support. Each project logic diagram begins with a priority statement about what the program is aiming to achieve. This is followed by a description of the project, major stakeholders and constraints on each project or activity. Short-term, medium-term and long-term outcomes are set out in the next layer, and the final layer in the diagram shows measurable indicators.
2.8.4 Timeframe for change
One issue for the evaluation is the timeframe for change of this nature. The long-term outcomes in this program theory may take years or decades to be achieved and sustained. The behaviour change outcomes could occur in the medium term, perhaps by the end of 2011. The short-term outcomes at the lower end of the Courage Partners hierarchy are foundations and enablers for the trial and should be evident within the life of the trial.257
256 Courage Partners 2009, p. 57. 257 ibid., p. 5.

Cape York Welfare Reform—Evaluation
88
The first stage of implementation focused on short-term outcomes to establish the essential foundations and enablers for the trial. The most important of these has been establishing the FRC as the key driver of change in social norms and as a vehicle for restoring Indigenous authority and leadership. Consequently, Stage 1 of the evaluation process concentrated solely on an implementation review of the FRC.
Other planned development features that support the FRC concept and the change process include a number of enabling projects. They are concerned with the program theory’s short- to medium-term outcomes and are linked to behaviour change and capability building. The CYWR trial enabling projects are covered by the four streams (Social Responsibility, Education, Housing and Economic Opportunity), as discussed above.
The CYWR trial operates as an integrated strategy across the four streams on the assumption that change in one stream will affect other streams, or may be a necessary condition for change in another. Underpinning each of the streams is the assumption that the trial will offer the necessary incentives to individuals to change behaviours, based on people in communities responding to the choices offered.
2.8.5 Evaluation framework
The evaluation framework developed by Courage Partners proposed four key evaluation questions:
Was the reform implemented as agreed by the three partners?
Are social norms and behaviours changing?
Have governance arrangements supported changes in service provision and social norms and behaviours?
Has service provision changed in a way that supports norm and behaviour change?
In 2008, the evaluation framework and program theory suggested three key products, as part of a staged evaluation approach:
Stage 1—an implementation review of the FRC
Stage 2—a substantial progress review covering implementation issues, early trends and performance data
Stage 3—an outcomes evaluation for individuals, families and communities, as a final report on the outcomes of the trial overall.
Stage 1 has been completed. A report titled Implementation review of the Family Responsibilities Commission was produced by KPMG and is available on the FaHCSIA website.258
Stages 2 and 3 were undertaken together and form the basis for this report covering both progress and outcomes.
The overall evaluation questions that this report aims to cover are:
Has the trial been implemented as planned?
To what extent have the intended outcomes been achieved, and what were the factors influencing success?
What are the unintended effects of the trial?
258 http://www.fahcsia.gov.au/our-responsibilities/families-and-children/publications-articles/implementation-review-of-the-family-responsibilities-commission-2010.

Introduction
89
What factors have contributed to observed outcomes (intended and unintended), and to what extent can the trial outcomes be attributed to the activities of the trial?
How well have the different needs and circumstances of the communities been addressed?
What have been the barriers to implementation?
What works and for whom?
What are the contextual factors that are influencing the trial outcomes?
The limits to the ability of this evaluation to cover these evaluation questions based on the evidence available are noted in Appendix D.
2.9 Evaluation governance High-level oversight of the evaluation was provided by the CYWR Project Board.
A steering committee, composed of representatives from each of the partners, was established to oversee the completion of the evaluation. The steering committee oversaw the quality and accuracy of the evaluation.
Two external evaluation advisers, Professor Deborah Cobb-Clark and Dr Annie Holden, provided advice and feedback on the overall evaluation strategy and the methodology and approach to impact analysis, as well as guidance to the steering committee. They also advised on draft reports and oversaw the quality of evidence used in the final report. In addition to the evaluation advisers, Dr Kate Reynolds, a social psychologist, also contributed specialist advice and analysis regarding social norms theory (covered in Chapter 5).
2.10 Focus of the evaluation The focus of this evaluation is on assessing whether the CYWR trial has set the foundations for, and made progress towards, changing social norms and rebuilding Indigenous authority in the four participating communities.
Characteristics of an outcome or summative evaluation are that it:
addresses the key evaluation questions
determines the range and extent of outcomes expected against the objectives of the trial overall and the four streams, and against the outcome hierarchy in the program logic
determines whether the program has been implemented as planned and how implementation has affected or contributed to outcomes
provides evidence to support accountability reporting
synthesises the range of evaluation and other information from the history and context of the initiative
informs decisions about the continuation of the program and the replication of program elements in other contexts.
The policy environment of the CYWR trial is dynamic, and the trial has evolved. Throughout the trial, some projects were modified or merged with new projects (e.g. CYAAA, which replaced MULTILIT, and MPower, which replaced Family Income Management). Some new supporting projects were added and other enabling projects evolved over time for inclusion in the trial, such as Wellbeing Centres and village opportunity hubs, provided significant complementary services to the trial, and so need to be considered at least in part in this evaluation.

Cape York Welfare Reform—Evaluation
90
It is important to ensure that the evaluation is focused on the original theory of change as implemented by the 2008 Project Board Agreement.
Therefore, the focus of this evaluation is on the four streams and the original 15 projects as agreed in the 2008 Project Board Agreement:
Social Responsibility stream:
the Family Responsibilities Commission
support services, including Ending Family Violence programs and parenting programs
Conditional Income Management
Family Income Management (now known as MPower)
Education stream:
MULTILIT
Attendance Case Management Framework (now known as Student Case Management)
SETs
ABSTUDY
Housing stream:
mainstream tenancy
PoP
home ownership
Economic Opportunity stream:
business precincts (including lighthouse projects)
mentoring and up-skilling
real full-time jobs
mobility.
Further related enabling projects that evolved over time, such as the Wellbeing Centres, the village opportunity hubs and the CYAAA, support the goals of welfare reform but are not individually evaluated in this report. However, the progress of the Wellbeing Centres, opportunity hubs and CYAAA are covered in part in this report to provide contextual information, as they may have a bearing on the outcomes of the trial. Evaluations of Wellbeing Centres and CYAAA are being conducted separately.
2.11 Approach to the evaluation This independent evaluation of the CYWR trial has been conducted by a number of expert authors, each focusing on one or more of the four key evaluation questions.
FaHCSIA, on behalf of the three partners—the Australian and Queensland governments and the CYI—prepared this chapter to provide a factual account of the CYWR trial. This chapter assists with scoping of the evaluation and provides background on the CYWR trial.

Introduction
91
The Social Policy Research Centre (SPRC)259 based at the University of New South Wales prepared several chapters: Chapter 3 covering the progress of implementation, Chapter 7 focusing on the FRC, and Chapter 8 providing analysis of outcomes data. The role of SPRC was to assess evidence on whether the CYWR trial effected significant change towards its four initial objectives (restore positive social norms, re-establish local Indigenous authority, support community and individual engagement in the real economy, and move individuals and families from welfare housing to home ownership). This included assessing whether the CYWR trial was implemented effectively, as well as informing future government decision-making and social policy formulation for both the wider community and the Indigenous community.
A key source of evidence about change is survey data, which provides the perspective of the people affected by the reforms. In order to provide a place-based assessment of change, Colmar Brunton Social Research was contracted to conduct a social change survey in each of the four trial communities. The survey aimed to capture general behaviour or attitudes in the communities to social responsibility, economic opportunity, education and housing. The findings from the survey are presented in Chapter 4 in this report. In addition, Michael Limerick and SPRC also examine the survey findings alongside other outcome data in chapters 1 and 8, respectively. The Social change research study aggregate report, which presents a detailed analysis of this research, is published separately on the FaHCSIA website.
Chapter 5 on social norm change was produced by Professor Kate Reynolds from the Australian National University. The chapter uses the data from the social change survey to examine the social psychology of social norms and behaviour change in relation to the role of the FRC, leadership and responsibility. This builds on the theoretical foundation of the theory of change proposed in the Hand out to hand up design reports concerning the role of social norms in activating change.
Chapter 6, focusing on service delivery, was prepared by Dr Judy Putt. It is a summary of perceived changes to service delivery during the CYWR trial years and draws on a survey of service providers and consultations by Migration Plus. Those two studies were commissioned as part of the CYWR evaluation, and full reports are available separately on the FaHCSIA website.
Additional research by Dr John von Sturmer captured individual experiences of change since the commencement of the CYWR evaluation. This research is available separately on the FaHCSIA website and is also drawn upon in Chapter 1.
Chapter 1 was produced by Dr Michael Limerick. It provides a synthesis of all available evidence against the four key evaluation questions for the CYWR evaluation, covering implementation, behaviour change, service delivery reform and governance. The chapter is based on all available information from individual evaluations conducted on the CYWR trial. The various data sources were used to test the program theory of the CYWR trial, and to examine the extent to which the early outcomes and changes predicted by the logic models have since emerged.
The specific methodologies used to analyse change are described in each chapter of this report.
Ethics clearance for the research in this evaluation was granted by two ethics committees. The University of New South Wales Human Research Ethics Committee provided clearance for the outcome evaluation conducted by SPRC. The Cairns and Hinterland Health Service District Human Research Ethics Committee provided ethics clearance for the social change survey conducted by Colmar Brunton, the service provider survey by Dr Judy Putt (for FaHCSIA), the service delivery study conducted by Migration Plus, and the research conducted by Dr John von Sturmer.
The following tables list the chapters and their authors, as well as the appendixes and the additional reports that have informed this evaluation report.
259 Authors from SPRC were Professor Ilan Katz and Margaret Raven.

Cape York Welfare Reform—Evaluation
92
Table 2.4 CYWR Evaluation Report chapter outline
Chapter no. Chapter name Author Foreword FaHCSIA Glossary FaHCSIA 1 Overview Dr Michael Limerick 2 Introduction FaHCSIA 3 Implementation SPRC 4 Social change survey Colmar Brunton 5 Authority, leadership, and social norms Professor Kate Reynolds et al. 6 Service delivery Dr Judy Putt, FaHCSIA 7 Family Responsibilities Commission SPRC 8 Outcomes SPRC
Table 2.5 CYWR Evaluation Report appendixes
No. Content/report Author A Summary of FRC Implementation Review findings SPRC B Project performance summary FaHCSIA C Funding commitments by the Australian and Queensland governments FaHCSIA D Evaluation methods used by SPRC SPRC
Table 2.6 Reports commissioned as part of the evaluation
Report Author Social change survey aggregate report Colmar Brunton Service delivery: results from a service provider survey Dr Judy Putt, FaHCSIA Consultation paper regarding desktop research and qualitative analysis of service delivery trends apparent from the CYWR initiatives: Focus area Aurukun
Migration Plus
Summary of case studies of individual and family experience of change Dr John von Sturmer

Implementation
93
3 Implementation The Social Policy Research Centre
3.1 Introduction This chapter outlines the implementation of the Cape York Welfare Reform (CYWR) trial. It includes information on lessons, facilitators, and adjustments associated with the trial’s implementation260 and, where the implementation has been less successful, outlines some of the barriers to implementation. The chapter should be read in conjunction with the Project Performance Summary (Appendix B) prepared by FaHCSIA, which sets out in detail the planned and actual implementation of each of the components of the CYWR and the performance of those components.
The chapter commences with some of the key findings on progress in implementing the CYWR, followed by a brief summary of the methodology used by the Social Policy Research Centre (SPRC) to produce this chapter, Chapter 7 ‘Family Responsibilities Commission’ and Chapter 8 ‘Outcomes’. This is followed by a more in-depth presentation of the progress to date for each project under the four streams—Social Responsibility, Education, Economic Opportunity, and Housing.
Chapter 3 also includes an analysis of the implementation of the CYWR as it relates to governance arrangements, service delivery, community participation, project monitoring data, compliance effects, and progress against the program logic.
The assessment of the effectiveness of the implementation of the CYWR must acknowledge the innovative nature of the CYWR, which is more complex and comprehensive than the majority of programs implemented by governments in Indigenous communities and which involves governance arrangements that are unprecedented in Australian program delivery. There was no template from which program implementers could work and as a result it was difficult to anticipate and prevent many of the implementation challenges which arose. Those challenges have included not only the practical difficulties common to many programs, but also ideological challenges and legal issues (see sections 3.5 and 3.6 for more detail). It is noted in the methodology section that service fragmentation and overlap, lack of administrative capacity, antagonism between service providers, workforce and staffing issues and lack of adequate facilities are problems that are common to all program implementation in Australia (and internationally) and, in particular, remote Indigenous communities. This should be taken into account when assessing the effectiveness of the CYWR and the associated interventions.
Despite all the challenges of implementing such a complex and novel set of reforms, the CYWR has been implemented successfully. Nevertheless, Section 3.6 indicates areas where service coordination could be improved and identifies some of the key barriers and facilitating factors associated with the successful implementation of the CYWR.
3.2 Key findings
3.2.1 Overall Implementation of the CYWR has varied across the four streams, the governance arrangements,
service delivery and community participation. Implementation in the four CYWR communities has also differed considerably.
260 It should be noted that this report is not an evaluation of individual projects conducted as part of the CYWR.

Cape York Welfare Reform—Evaluation
94
Most of the services were welcomed both by community members and by service providers. The CYWR has helped to fill a significant gap in service provision in the communities. Understandably, the more coercive components—the Family Responsibilities Commission (FRC) and Student Case Management—have been more controversial and divisive in some communities, as have related policies such as the alcohol management plan policy. This is evidenced by the social change survey and stakeholder consultations.
3.2.2 Governance The three-way partnership is an innovative and unique governance arrangement. Inevitably, the
partnership has created tensions and challenges for all three partners and has caused some delays in the implementation of certain components of the CYWR. Nevertheless, the partnership has continued throughout the trial. Strategic governance has been affected by personnel changes mainly within the Australian and Queensland government partners and went through a difficult period in 2010 and 2011. Strategic governance appears to have recently improved.
Governance and coordination resources have been reduced over the course of the trial. Many of the planned management and coordination components of the welfare reform were never implemented or were quickly abandoned in order to adapt to the realities of program implementation. Many of the governance arrangements which were set out in the initial agreement and the Welfare Reform Action Plan (WRAP) have not materialised or have been discontinued. However, this is likely to be a result of over planning rather than under delivery.
3.2.3 Context
The CYWR has been implemented in a particularly complex and changing policy, legal and funding environment and this has made implementation more challenging than may have been anticipated. However Indigenous social policy has been in a state of flux for many years and therefore it is likely that these issues would have had to be faced to some degree in any period of implementation.
The CYWR was implemented after alcohol management plans (AMPs) were introduced (in Aurukun and Hope Vale) and before remote service delivery (RSD) was introduced in the four communities. Those two policies, in particular, have interacted with the CYWR and have affected its implementation in both positive and negative ways. On the one hand, they complemented the reform and are based on similar philosophies. On the other hand, AMPs caused divisions in some communities and the RSD was divisive at the strategic governance level and often had a competing agenda.
3.2.4 Implementation of different components
Some components of welfare reform were implemented very quickly and effectively—most significantly the FRC, which is the backbone of the reforms. The FRC has continued to function effectively in all four communities despite significant challenges. The social change survey confirms that the FRC is now respected and valued by many community members and is seen as a driving force for change in the communities. Some of the projects were in place early in the CYWR implementation and have now become embedded in the communities. Other projects have suffered from staff turnover, lack of facilities or accommodation and other logistic problems in some communities and are much less well established.
Two of the streams, Economic Opportunity and Housing, have not yet been fully implemented or are just beginning to be implemented in some communities, although considerable work has been undertaken in preparing for their implementation. This has led to other interventions being less effective than they might have been if all streams had been fully implemented. The logic model of the CYWR indicates that; projects, services and the FRC need to be complemented by home ownership and employment as key elements of norm change.

Implementation
95
Home ownership has proved to be a very challenging legal and administrative issue, not least because each of the communities operates under different land tenure systems. Some progress has already been made in modifying the land tenure system, and the partners have agreed on a methodology for pricing land, but not yet for valuing houses. It appears that existing arrangements are not far short of the minimum requirements for implementation of home ownership, but significant take-up of home ownership is unlikely to occur until that threshold is crossed.
The CYWR captures employment through changes to the Community Development Employment Projects (CDEP) Program, including the CDEP job conversions and the proposal to provide employment by building business precincts in the communities. The Gateway to Mossman Gorge development has been built and is operational. The land for the Hope Valley Estate has been cleared for housing, and services (such as power and water) are being installed prior to house building. The CHALCO project in Aurukun (a bauxite mine and aluminium refinery) did not go ahead after CHALCO withdrew its development proposal in mid-2011.
3.2.5 Relationships and consultations
Relationships between service providers are important for the implementation of services in communities throughout Australia, and have been extremely important in determining the effectiveness of implementation in the four CYWR communities. Where staff members from different organisations have been able to develop trusting and productive working relationships, services have worked well together despite differing remits and working arrangements. Where personal relationships between staff from different organisations have been fractious or distant, this has often resulted in staff becoming defensive and unwilling to go beyond strict agency protocols. Service provider relationships may have also had an impact on the effectiveness of some of the interventions for clients and community members.
Despite the considerable effort put into consultation on welfare reform in the four communities prior to their signing up, some stakeholders in the communities and beyond feel that consultation has been variable and patchy and that the welfare reform did not ‘sell’ itself in the four communities.
3.2.6 Gaps
Although there has been the considerable investment in new services in the four communities, there remain gaps in service provision; for example, in relation to intensive alcohol, tobacco and other drugs treatment and services for young people who are not in education, employment or training.
3.3 Methodology used by SPRC SPRC prepared several chapters of this report using a combination of methodologies. The methodology used in this chapter and chapters 7 and 8 is briefly described here and detailed in Appendix D. More detail about the methodology used for chapters 7 and 8 is described in those chapters. Further discussion on the limitations and interpretation of findings is in Appendix D.
SPRC’s role was to assess the evidence and to determine whether the CYWR had effected significant change in moving towards its four initial objectives: restore positive social norms, re-establish local Indigenous authority, support community and individual engagement in the real economy, and move individuals and families from welfare housing to home ownership. This included assessing whether the CYWR trial had been implemented effectively, and informing future government decision-making and social policy formulation for both the wider community and the Indigenous community.

Cape York Welfare Reform—Evaluation
96
The From hand out to hand up design reports and the Courage Partners evaluation framework261 provided the basis for the design of the evaluation methodology for the CYWR. The research questions and performance indicators were taken from the evaluation framework. However, the evaluation methods used by SPRC had to be adapted to accommodate the practicalities of the evaluation. For example, the evaluation framework required the outcome evaluation to be conducted by the end of 2011, but this had to be pushed back. In addition, not all the signs of success identified by Courage Partners have been measured.262 However, the overall methodology of chapters 3, 7 and 8 accords with the original framework.
3.3.1 Evaluation methods
The methods used by SPRC to produce chapters 3, 7 and 8 involved the following components:
Qualitative data collection
– workshops with stakeholders
– interviews with key stakeholders
– site visits to the four CYWR communities.
Data analysis—the implementation, FRC, and outcomes chapters draw on the following five sources of data
– analysis of administrative data provided by FaHCSIA and the Queensland Government and from the FRC
– analysis of project progress reports, FRC annual and quarterly reports and summaries of information from other significant projects that are part of the reforms
– qualitative interviews and workshops with key stakeholders who have had responsibility for implementing the reforms
– analysis of policy and other documents and reports that have been provided to SPRC
– analysis of the findings from Colmar Brunton’s social change survey in the four communities, the service providers survey and the Migration Plus service delivery consultation paper.263
Qualitative data collection
Four workshops were conducted with stakeholders during the project to assist with project design, to provide an update on progress and to workshop the findings related to the implementation and outcomes of the trial.
Interviews were also conducted with 62 key stakeholders to gain their views on the successes and challenges of the trial. The interviews were also utilised to contextualise and explain findings from the quantitative analysis. This allowed a meaningful interpretation of findings. Interviews were conducted face to face, by telephone and in the context of workshops.
The questions asked in the interviews included:
Has the trial been implemented as planned?
To what extent have the intended outcomes been achieved and what were the factors influencing success?
What are the unintended effects of the trial?
261 Courage Partners, Evaluation framework and program theory for the Cape York Welfare Reform trial, 2009, pp. 70–79. 262 Some of these signs of success are conceptual and not easily measured. 263 Migration Plus, Consultation paper regarding desk top research and qualitative analysis of service delivery trends apparent from the CYWR initiatives: Focus area Aurukun, report prepared for FaHCSIA, Canberra, 2012.

Implementation
97
What factors have contributed to observed outcomes (intended and unintended) and to what extent could the trial outcomes be attributed to the activities of the trial?
How well have the different needs and circumstances of the communities been addressed?
What have been the barriers to implementation?
What works and for whom?
Interviews were conducted with people from the following organisations and service providers: Wellbeing Centres; health clinics; Queensland Police–Citizens Youth Clubs; justice groups; FRC Commissioners; schools; police; the Cape York Aboriginal Australian Academy (CYAAA); the Queensland Government, including Child Safety Services; FRC administrators; local councillors; Indigenous knowledge centres; Cape York Partnerships (CYP); the Cape York Institute for Policy and Leadership (CYI); and FaHCSIA.
Data analysis
On the basis of each data source, a judgement was made as to the level of analysis and reporting that was appropriate. Depending on what data are available, the level of analysis could be at the overall CYWR level, the Queensland discrete Indigenous community level, or the individual level using unit record data about people. The potential for linking datasets was considered. The best ways to benchmark each dataset by providing trend data or comparisons to other sites were also considered.
Data for discrete Indigenous communities in Queensland were used predominately in the Outcome chapter. Outcome variables were directly measured at the community level using these data, including school attendance, educational attainment, offences, hospitalisation, and employment. Unit record data for school attendance in the CYWR communities were compared to those in comparison communities. Another approach used in the Outcome chapter was to match FRC data with school attendance data to more rigorously test the link between FRC conferences and any changes in subsequent school attendance. Census data was also used. Appendix D and Section 8.2.2 of the Outcome chapter provide more information on data analysis approaches.
Further analysis of FRC data examined the way people flow through the system. This starts where clients breach any of the social obligations defined in the CYWR and goes through to conferencing, service referral and income management. The analysis also compared outcomes of people with different levels of interaction with the FRC and focused on changes in patterns of response to the FRC over time. Section 7.4 of the FRC chapter provides more information on the data analysis approach using the FRC data.
Project performance data from projects funded by the CYWR were examined. This part of the analysis was undertaken with FaHCSIA who provided information about the data and the contextual issues. Project performance data for CYWR projects are described for reference in Appendix B.
A detailed description of the data analysis conducted by SPRC is provided in Appendix D.
3.3.2 Challenges of the evaluation
The challenges and limitations associated with evaluating the CYWR included:
limitations of the administrative datasets
contextual factors of the four CYWR communities (described below)
absence of benchmarking for some datasets
planning for the evaluation
evaluation timescales

Cape York Welfare Reform—Evaluation
98
challenges with the FRC data
theory of change timescales.
Those challenges and limitations are discussed in detail in Appendix D.
3.3.3 Ethics approval
Ethics approval to conduct the progress review and outcome evaluation conducted by SPRC was sought from the University of New South Wales Human Research Ethics Committee and gained on 29 May 2012. The reference number of the approval is HREC Ref: # HC12081.
3.3.4 Boundaries—scope of CYWR An important contextual factor relating to the implementation and evaluation of the CYWR is that the trial crosses over with other policy measures in the four communities, including264:
the national welfare reform agenda
Alcohol management plans (AMPs)
the Council of Australian Governments (COAG) Indigenous reform program
CDEP reform and Indigenous employment reform
Remote service delivery (RSD).
Although the specific interventions and components of the CYWR are well documented, the boundaries of the CYWR and its interface with other initiatives are not always clear. The crossover with other policy measures makes it difficult to specify the boundaries of the CYWR, and thus to discern whether changes in social norms are due to CYWR or to other policy measures. This is particularly the case for Wellbeing Centres and the CYAAA, neither of which was identified in the WRAP or the initial agreement, but both of which have become enabling projects of welfare reform in the four communities. Similarly, the AMPs in the two communities of Aurukun and Hope Vale appear to have had a significant impact and are closely related to the welfare reform agenda, but are not officially part of the CYWR.
These challenges in interpreting the data are not necessarily problems for the welfare reform itself. No social intervention can operate in isolation and so interaction with other policies and programs is an inevitable part of program implementation. In evaluations of large-scale programs which are implemented in many sites this issue can be taken into account to some extent because the effects of other programs tend to ‘wash out’ in the analysis. However, because the CYWR is an intensive intervention in a small number of communities, disaggregating the effects of specific interventions and the welfare reform as a whole is more difficult than for interventions such as the Northern Territory Emergency Response, which have been implemented in a large number of communities.
The CYWR does not cover the whole lifespan of people; the majority of interventions are aimed at working-age people, and parents in particular. According to many of the stakeholders (and reported in the service provider survey) there continue to be gaps—in particular, gaps in early years programs, interventions to support disengaged youth and support services for elders. Although those gaps may not necessarily be addressed by the CYWR, those three age groups present matters that are different for each of the four communities. Additionally, across the communities it was reported that there are not enough support services for children and young people. This is in relation to child mental health workers, child health, and children and young people who are not attending school.
Alcohol, and to an extent other drugs, underpin much of the social dysfunction in the four communities, and yet there are few effective services to directly address those aspects for individuals. 264 Cape York Welfare Reform, Welfare Reform Action Program (WRAP) Plan, Phase 1 (July 08 – June 09), Draft, 2008, p. 11.

Implementation
99
Despite support services for people with alcohol-related conditions being available through the Wellbeing Centres, a number of key informants argued that services for people with problems with alcohol, tobacco and other drugs are inadequate.
The next section gives an overview of the boundary issues in relation to AMPs and RSD.
Alcohol management plans
Alcohol reforms were not a specific component of the CYWR. However, as the Cape York Welfare Reform Agreement states, ‘there is considerable and close alignment between the aims of Welfare Reform and Alcohol Reform’.265 They both aim to create safe and responsible communities.
AMPs were introduced into 15 communities in Queensland by the Queensland Government in 2002.266 This was done following the findings released in the Cape York Justice Study (by Tony Fitzgerald).267 Mossman Gorge and Coen are not Deed of Grant in Trust communities. However, people within the communities have access to declaring their homes as dry places under the Justice, Land and Other Matters Act 1984. Aurukun and Hope Vale are both subject to AMPs, which legislate for varying degrees of prohibition on the sale and possession of alcohol, including:
Aurukun—zero alcohol carriage limit (including no home brew or home brew equipment)268
Hope Vale—11.25 litres (one carton of 30 cans) of light or mid-strength beer; or 750 ml (one bottle) of non-fortified wine.269
Alcohol carriage limits apply not only to individuals, but to the maximum amount that can be transported in a vehicle, boat or aircraft regardless of the number of passengers. This amount is per person on foot or per vehicle, boat or aircraft.
Additionally, the Liquor Act 1992 (Qld) imposes the following penalties for possessing illegal alcohol270:
first offence, $37,500
second offence, $52,500 and/or six months imprisonment
third offence, $75,000 and/or 18 months imprisonment.
In the welfare reform communities where AMPs exist, some participants in the stakeholder consultations included AMPs (and in Aurukun the closure of the Three Rivers Tavern) as key components of the CYWR, despite the fact that AMPs have been in existence since 2002, six years prior to the implementation of the CYWR. This was because of the similarities in the objectives of these interventions, and because those convicted of an offence for the possession of alcohol would come under the jurisdiction of the FRC. Due in part to the introduction of AMPs, there was resistance to the CYWR in one community, and therefore proponents and opponents of the CYWR associated it with alcohol restrictions.
265 CYI, Australian Government & Queensland Government, Cape York Welfare Reform Trial Project Board Agreement (Version – Final REF: WRPBA), 21 July 2008, p. 21. 266 The State of Queensland, Community alcohol limits, Department of Aboriginal and Torres Strait Islander and Multicultural Affairs, 12 April 2012, http://www.indigenous.qld.gov.au/atsis/government/programs-and-initiatives/alcohol-reforms/community-alcohol-limits. 267 Queensland Parliamentary Library, Tackling alcohol issues in Indigenous communities – the Indigenous communities Liquor Licences Bill 2002 (Qld) and the Community Services Legislation Amendment Bill 2002 (Qld), Queensland Parliamentary Library, 2002, http://www.parliament.qld.gov.au/documents/explore/ResearchPublications/ResearchBriefs/2002/2002026.pdf. 268 The State of Queensland, Aurukun alcohol limits, Department of Aboriginal and Torres Strait Islander and Multicultural Affairs, 12 April 2012, http://www.indigenous.qld.gov.au/atsis/government/programs-and-initiatives/alcohol-reforms/community-alcohol-limits/aurukun-alcohol-limits. 269 The State of Queensland, Hope Vale alcohol limits, Department of Aboriginal and Torres Strait Islander and Multicultural Affairs, 12 April 2012, http://www.indigenous.qld.gov.au/atsis/government/programs-and-initiatives/alcohol-reforms/community-alcohol-limits/hope-vale-alcohol-limits. 270 The State of Queensland, Aurukun alcohol limits.

Cape York Welfare Reform—Evaluation
100
Remote service delivery
The four CYWR communities are also identified communities in the National Partnership Agreement on Remote Service Delivery (RSD Agreement)—signed in 2009 by the Australian Government and the New South Wales, Queensland, Northern Territory, South Australian, and Western Australian governments.271 The RSD Agreement is part of the COAG National Indigenous Reform Agreement, which is aimed at closing the gap in Indigenous disadvantage. The RSD Agreement specifically aims to ‘implement a new remote service delivery model that clearly identifies service standards, roles and responsibilities and service delivery parameters’.272 The objectives, outcomes and outputs of the RSD Agreement cross over with some of the desired changes in the CYWR, in particular in promoting personal responsibility as a key policy objective.
The following goals of RSD and the CYWR broadly overlap:
increase economic and social participation wherever possible, and promote personal responsibility, engagement and behaviours consistent with positive social norms (objective)
local planning developed and completed with governments and stakeholders in the identified communities.
Additionally under the RSD Agreement, the Queensland Government is responsible for the ‘delivering all land tenure components’.273 This aspect supports the CYWR objective of home ownership.
Inclusion of the four welfare reform communities as RSD communities274 was not initially supported by Cape York community organisations, and held up the progress of the local implementation plans and caused some dissension in the strategic governance of the trial. The interaction between the two initiatives was documented in the revised draft project board agreement prepared in July 2010275, stating ‘The COAG Remote Services Delivery National Partnership Agreement (RSD NPA) supports the efforts of the CYWR through concentrating attention and effort on how government services are to be delivered and integrated (i.e. the service delivery model) in Indigenous communities’.
The revised draft project board agreement notes the intent is for RSD to fit into the ideological approach of CYWR—rather than services being delivered from outside of the community, service delivery must be Indigenous-led with programs co-designed by Indigenous people based on specific community need and should incorporate a strong personal responsibility component. Nevertheless, the introduction of RSD caused some tension in the strategic management of the CYWR trial and for some time was seen as a hindrance to progress. It appears that the issue has now been resolved.
3.4 Progress to date This chapter should be read in combination with the project performance summary (Appendix B) prepared by FaHCSIA, which describes the progress to date of each of the components of the CYWR against its performance targets. In this chapter SPRC take a more holistic view and identify some of the barriers and facilitating factors associated with the CYWR and the strengths and weaknesses of the CYWR as a whole.
The CYWR was designed to include 15 projects across the four streams of Social Responsibility, Education, Economic Development, and Housing (Figure 3.1). The next sections provide an overview of the implementation story to date for each of the streams.
271 Commonwealth of Australia, What is remote service delivery?, Australian Government, Office of the Coordinator General for Remote Indigenous Services, 2012, http://cgris.gov.au/site/rsd.asp. 272 COAG, National Partnership Agreement on Remote Service Delivery, 2008, p. 3, http://cgris.gov.au/userfiles/file/national_partnership_on_remote_service_delivery_with_amended_schedule[1].pdf. 273 ibid., point 20(d), p. 8. 274 In Queensland there are two other RSD communities: Doomadgee and Mornington Island. 275 The revised draft project board agreement has not yet been agreed to by the Project Board.

Implementation
101
Figure 3.1 Cape York Welfare Reform projects
Social Responsibility Economic Opportunity
Family Responsibilities Commission (FRC)
Support services and supported self-help
Conditional Income Management orders
Family Income Management (FIM) Program (now called MPower)
Business precincts (Aurukun and Hope Vale)
Mentoring and business support services
Real full-time jobs (CDEP reforms and enhanced employment services)
Mobility initiatives to support people seeking employment outside of the community
Education Housing
Making up Lost Time in Literacy (MULTILIT) and Meeting Initial Needs in Literacy (MINILIT) programs
Attendance Case Management Framework (now called Student Case Management)
Student Education Trusts (SETs)
ABSTUDY away from home entitlements
Mainstream tenancy
Pride of Place initiative home improvement funds
Home ownership initiatives
CYI, Australian Government, and Queensland Government, Cape York Welfare Reform Trial Project Board Agreement.
3.4.1 Implementation of programs
This section describes the implementation of the programs under each stream as set out in the 2008 Project Board Agreement.
The 2008 Project Board Agreement included some further enabling projects that evolved over time for inclusion in the CYWR. They included the Wellbeing Centres and the village opportunity hubs (originally called Village Hubs).
The CYWR drew on a number of pre-existing projects and introduced new projects specifically designed to meet the objectives of the trial. Existing projects, already active in the communities, started engaging with the communities as part of the CYWR in January 2008. Full operation of the CYWR commenced with the opening of the FRC Cairns office on 1 July 2008. Although the implementation of some projects was delayed for a number of reasons, those projects were gradually rolled out over the course of the trial. The implementation of some projects was staggered across the four communities.
The first tranche of projects implemented on 1 January 2008 included:
Family Income Management (FIM)—in all communities
Student Education Trusts (SETs)—in all communities except Aurukun, which began implementing SETs in August 2008
Making up Lost Time in Literacy (MULTILIT)—in all communities except Aurukun. MULTILIT commenced in Aurukun in January 2009. MULTILIT was transitioned to the CYAAA in Aurukun and Coen in January 2010 and in Hope Vale in January 2011276
Attendance Case Management Framework—began filling positions and consulting with communities in Hope Vale, Mossman Gorge and Coen in January 2008 Aurukun in the last quarter of 2008
ABSTUDY adjustment
a work placement scheme—funded through the STEP Mobility Project
276 In 2012, the CYAAA started the Mossman Gorge Tutoring Centre in Week 10 of Term 3. The tutoring centre provides one-on-one tutoring using Direct Instruction, as well as cultural and sporting activities.

Cape York Welfare Reform—Evaluation
102
improved employment services—delivered by the Indigenous Employment Program (IEP), followed by Job Services Australia (JSA) in July 2009.
Projects implemented on 1 July 2008 included:
FRC—with conferencing commencing in the four communities from 12 August 2008
Conditional Income Management—in all communities
Wellbeing Centres—began early implementation in the four communities on 1 July 2008 with the contracting of the Royal Flying Doctor Service (RFDS). Full implementation of Wellbeing Centres commenced in March 2009 in Mossman Gorge, April 2009 in Aurukun, May 2009 in Hope Vale and sometime in early 2009 in Coen.
Projects implemented after July 2008 and during 2009 and 2010 included:
Community Action Fund—had Project Board approval on 27 October 2008 and was rolled out in all communities on 22 January 2009
Ending Family Violence Program—was approved in March 2010 and began operating in May 2010 in all communities
Parenting programs—in all communities, except for Aurukun. A parenting program run by Aurukun Shire Council was operating prior to the CYWR and transitioned to CYP on 1 July 2011. Funding for parenting programs in the other three communities was approved on 29 May 2009. However, implementation of the parenting programs in the other three communities did not occur until September 2010
Pride of Place (PoP)—received Project Board approval in December 2008 but underwent some funding issues which held up implementation. PoP was finally implemented in Coen and Hope Vale in the last quarter of 2009, in Aurukun in January 2010 and in Mossman Gorge in May 2010. The project was further revised in July to September 2010 and the new PoP model was implemented in all communities in the last quarter of 2010.277
Preliminary CDEP reforms—were implemented in Hope Vale, Coen, Mossman Gorge and Aurukun between 1 November 2008 and 30 June 2009, in response to proposals in the design reports278. These changes resulted in the closure of CDEP to new entrants or readmissions from 1 November 2008 until 1 July 2009.
To support sustainable employment outcomes, a project to convert identified CDEP positions into real jobs—by November 2009, 40 Australian Government and 31 Queensland Government CDEP positions had been converted into properly paid jobs.
A timeline illustrating the implementation of the main projects is provided in Chapter 1.
The rollouts for each of the key programs and projects under each stream are described below.
3.4.2 Social Responsibility stream
Family Responsibilities Commission
One of the key components of the CYWR is the FRC. On 13 March 2008, the Queensland Government passed the Family Responsibilities Commission Act 2008. The FRC office in Cairns officially opened on 1 July 2008, with conferencing commencing in Coen on 12 August 2008, followed by the other three communities. Since then the FRC has circuited fortnightly to the four communities,
277 Pride of Place was further redesigned in July 2012 and now also includes support to families for backyard improvements. See footnote ‘152’ on p.45 for more details. 278 The CDEP reforms did not adopt all of CYI’s original design recommendations.

Implementation
103
changing to monthly conferences in Coen from early 2009.279 The FRC comprises a commissioner and 19280 local commissioners who are respected community members appointed by the Queensland Governor in Council.
MPower (formerly Family Income Management)
From the commencement of the CYWR in January 2008 to March 2011 the CYWR money management service was delivered under the FIM program, which has been operational in a number of Cape York communities, including the four CYWR communities, since 2001.
FIM transitioned to MPower in April 2011. MPower was trialled in Aurukun from 3 May 2011, followed by the other three CYWR communities on 6 June 2011, and was fully operational in all communities by July 2011.
MPower is delivered through the village opportunity hubs in the four CYWR communities.
Ending Family Violence Program
The Ending Family Violence Program has been continuously run by Queensland Corrective Services, within the Department of Community Safety, in the CYWR communities. The program was operating prior to the CYWR for Queensland Corrective Services clients. In response to the need to target the reduction in family violence beyond prison and parole clients, family violence and general offending, the program was made available to mutual clients of the FRC and Queensland Corrective Services and to specifically referred FRC clients in March 2010. Queensland Corrective Services commenced the delivery of Ending Family Violence programs in CYWR communities in May 2010 on the request of the Queensland Department of Communities, Child Safety and Disability Services.
Over the course of the CYWR, the delivery of the Ending Family Violence Program has remained with Queensland Corrective Services as it is a specialised program solely owned by Queensland Corrective Services, but the acquittal of the funding has varied depending on the source of the funding. During 2010, the first half of 2011 and the second half of 2012, the Department of Communities, Child Safety and Disability Services provided funding to Queensland Corrective Services to deliver the program. In the second half of 2011, the Australian Government, through the Department of Health and Ageing, required the RFDS to administer the funding and to assist Queensland Corrective Services to deliver the program through the CYWR Wellbeing Centres.
Positive Parenting Program (It Takes a Village to Raise a Child)
In April 2009, the CYWR Project Board approved CYP as the purchaser of parenting services for the four welfare reform communities. Funding for the CYP parenting program was approved on 29 May 2009. The parenting program offered through CYP has been available in Coen, Mossman Gorge and Hope Vale since September 2010. A parenting program, run by Aurukun Shire Council, was available in Aurukun prior to the CYWR. In July 2011, the Aurukun Parenting Program was transitioned to the management of CYP.
There was a one-year delay in operationalising the CYP parenting program due to a lack of initial capacity in communities for local delivery, and because of funding variations due to changes to the delivery model. The existing service in Aurukun continued in the interim and programs were designed for the three remaining communities, where parenting programs had not yet begun.
Parenting services are based at the village opportunity hubs in Coen and Mossman Gorge, and at the purpose-built parenting centres at Aurukun and Hope Vale.281
279 FRC annual report, 2009, pp. 11, 54. 280 As at 2 December 2011. 281 In Hope Vale, the old opportunity hub was converted into a purpose-built parenting hub in September 2012.

Cape York Welfare Reform—Evaluation
104
Since the April 2009 agreement, intensive effort has been invested in developing parenting programs to be delivered by appropriately qualified providers. Retention and recruitment of qualified staff to deliver the programs have been ongoing concerns in all communities and have resulted in inconsistent levels of support being available to community members.
Conditional Income Management
Conditional Income Management has been available in the four CYWR communities since 1 July 2008 when the FRC commenced operation.
Wellbeing Centres
Funding was provided to the RFDS in June 2008 to start the establishment and implementation of Wellbeing Centres in the four communities. In the first six months of funding, the RFDS began initial implementation activities, including:
recruiting for some core positions
working with the FRC to develop referral pathways and protocols
introducing the communities to the concept of Wellbeing Centres
initiating and supporting related community activities, such as the establishment of the first Women’s Group in Aurukun; working with the Department of Communities, Child Safety and Disability Services to deliver youth activities; and initiating meetings with community members on projects such as cultural camps
focusing on establishing relationships with other service providers for collaborative planning
establishing Local Advisory Groups in each community
providing, for the first time, clinical responses to referrals, including from the FRC and self-referrals.
Forty-six clients were referred to Wellbeing Centres during this early implementation phase.
The construction of buildings to house the Wellbeing Centres was completed in all communities in early 2009, allowing a full complement of staff to commence work at full capacity.
Full implementation of the Wellbeing Centre in Mossman Gorge commenced in March 2009, followed by Aurukun in April 2009, Hope Vale May 2009 and Coen sometime in early 2009.
Community Action Fund
The Community Action Fund initiative was approved by the CYWR Project Board on 27 October 2008, and the rollout of the program commenced on 22 January 2009. Funding from the Queensland Government was provided to CYP in April 2009, and by the Australian Government in June 2009282.
3.4.3 Education stream
MULTILIT
MULTILIT was trialled in Coen as part of the Every Child is Special project in 2005–06. Implementation of MULTILIT as part of the CYWR began in Coen in February 2008, followed by Hope Vale and Mossman Gorge in March 2008. Implementation of MULTILIT in Aurukun was delayed until January 2009 because of accommodation and administration issues.283
282 The $60K CAF allocation from Queensland government matched the Commonwealth’s allocation and was set aside for each year. 283 WRAP MULTILIT Project Plan progress report, first quarter 2008, p. 12.

Implementation
105
Implementation during 2008 and 2009 involved establishing a MULTILIT tutorial centre in each school in the four communities and training MULTILIT teachers who provided support directly to students who required additional literacy assistance. MULTILIT also included an after-school reading club for parents so that they could read with their children and engage in their education.
During the 2009–10 financial year, the Australian Government transferred funding from MULTILIT to implement the CYAAA.
Cape York Aboriginal Australian Academy
At the 16 November 2009 CYWR Project Board meeting, the Project Board endorsed a proposal to implement the CYAAA in Aurukun and Coen in January 2010. The CYAAA was implemented in Hope Vale in January 2011. The CYAAA Mossman Gorge Tutoring Centre commenced in Week 10 of Term 3 2012.284 The CYAAA replaced MULTILIT in those communities. The Queensland Department of Education, Training and Employment is responsible for staffing (e.g. for positions such as principal), and CYAAA provides the curriculum and ‘Club and Culture’ (programs of CYAAA).
Student Case Management (formerly Attendance Case Management Framework)
CYP was funded to implement the Attendance Case Management Framework (now known as Student Case Management). During the first half of 2008, CYP began to staff the positions and undertake community consultations in Coen, Hope Vale and Mossman Gorge. Full implementation of the model commenced on 1 July 2008, coinciding with the implementation of the FRC across the CYWR communities. Implementation of the model in Aurukun was delayed due to difficulties associated with recruitment and the deployment of a successful candidate in the absence of suitable residential accommodation285 and started from January 2009.
Components of the Attendance Case Management Framework were previously trialled in the Coen community under the Australian Government Department of Education, Training and Employment’s and CYP’s Every Child is Special trial, which ran between 2004 and 2007.
Student Education Trusts
The SETs model was developed during the Every Child is Special project in Coen, with the first family signing up to SETs in March 2006. SETs was later incorporated into the design of the CYWR.
The implementation dates for SETs were different in the four communities. In Coen and Mossman Gorge, SETs was operating prior to the CYWR and in Hope Vale it commenced operation in January 2008. Implementation of SETs in Aurukun was postponed until August 2008286 because CYP and the tripartite partners were waiting for the implementation of necessary local infrastructure and agency alignment to support the initiative.287
SETs was funded as part of the Australian Government package of measures. Over time, implementation of SETs has become integrated into MPower and the work of the student case managers.
ABSTUDY adjustment
ABSTUDY operated in the four CYWR communities prior to the trial. It was incorporated into the CYWR on 1 January 2008 and adjusted to allow students from Hope Vale and Mossman Gorge288 to attend a school of their choice.
284 The tutoring centre provides one-on-one tutoring in Direct Instruction as well as cultural and sporting activities. 285 Cape York Partnership, Attendance Case Management Framework progress report, fourth quarter 2008, p. 18. 286 SETs annual progress report 2008, pp. 7, 11. 287 FRC quarterly report, first quarter 2008. 288 Aurukun and Coen already had access to this facility prior to the CYWR due to their remote location.

Cape York Welfare Reform—Evaluation
106
3.4.4 Housing stream
Mainstream tenancy
Tenancy management commenced in Coen during 2001, with the housing tenants of the Coen Regional Aboriginal Corporation (CRAC). In 2007, CRAC went into administration, with properties managed under a Deed of Corporation Agreement between FaHCSIA, CRAC and the Administrator. In 2011–12, 15 houses and three duplexes were transferred from CRAC to the Queensland Government for additional social housing stock in Coen. Agreements were signed and house refurbishments commenced. In Mossman Gorge tenancy management commenced in 2008. Housing management is currently provided by the Queensland Government and a locally based Indigenous community housing organisation.
The Queensland Government commenced management of tenancies in Aurukun on 30 November and Hope Vale in late November 2009.
Pride of Place
In December 2008, the CYWR Project Board agreed that CYP would lead the implementation of PoP in the four communities. The service agreement between the Indigenous Coordination Centre (ICC) and CYP was varied in late June 2009 to allow for an increase in funding for capital and project management activities.
CYP commenced implementing PoP in Coen and Hope Vale in the last quarter of 2009. Commencement of activities was delayed in Aurukun to January 2010 and Mossman Gorge to May 2010.
The model was revised in mid-July 2010 and the new model was implemented in all communities in October 2010.
Home ownership
To make home ownership a possibility in the four welfare reform communities, a number of legislative, policy and administrative issues needed to be resolved.
First, home ownership (having a secure interest in land allotment) had to be possible under Queensland legislation governing Aboriginal land. Second, a raft of policy issues needed to be resolved, including the valuation methodology for the land and social housing, exiting home ownership (e.g. what happens to the house), support for home owners, and local council/land trustee policy on issuing of leases. Third, administrative arrangements needed to be put in place to provide information to the local communities, scope and assess home ownership expressions of interest, process home loan applications, implement land-use planning and surveying, and enable the Indigenous shire councils and land trustees to set up land administration systems (in respect of lands held in trust).
Those matters have required effort on the part of a range of players: several Queensland Government departments, Australian Government agencies (FaHCSIA and Indigenous Business Australia), the Cape York Regional Organisations, the Indigenous shire councils of Hope Vale and Aurukun, local Indigenous community leaders and organisations (such as Bamanga Bubu Ngadimunku Inc (BBN) in Mossman Gorge), and service deliverers (such as CYP—money management).
The design reports recommended that home ownership should be a fair, affordable and financially rational choice for members of the welfare reform communities. The design reports proposed that the sale price of existing social housing should use a valuation methodology based on estimated market value calculated via the rental return method.

Implementation
107
Progress
In 2008, to enable individuals to secure an interest in land in Indigenous Deed of Grant in Trust (DOGIT) areas (including Hope Vale), the Queensland Government amended the Aboriginal Land Act 1991 and the Torres Strait Islander Land Act 1991 to provide for private residential leases of up to 99 years. This provides security to lenders for a mortgage over the land, allowing individuals to borrow money to buy or construct a home.
Over 2009 and early 2010, there was considerable tripartite discussion about methodologies for valuing houses and land. The then Queensland Government adopted the position that the sale price of existing social housing should be based on depreciated replacement cost, as replacement value is the conventional accounting approach. By mid-2010, after ongoing discussions between the partners, Queensland moved to a market-based, rather than cost-based, methodology for valuing social housing. Official agreement to this was given via the Queensland Cabinet submission on home ownership principles. However, the micro policy associated with determining the actual sale price of social housing has not yet been resolved.
The Queensland Government also agreed to review its market-based approach to valuing land for leasehold purposes. A methodology based on a flat amount of $4,000 for up to 2,000 square metres, with an additional amount for larger blocks, was decided.
In December 2010, the former Queensland Department of Environment and Resource Management (DERM) released a discussion paper which outlined general proposals to amend the Aborigines and Torres Strait Islanders (Land Holding) Act 1985289. The aim was to resolve outstanding issues in relation to ‘Katter leases’. A consultation paper was released by DERM in December 2010 on the threshold issue of the methodology for valuing the price of land for sale290. Legislation to amend the Land Holding Act was tabled in the Queensland Parliament in 2011, but lapsed when parliament was prorogued before the 2012 state election.291
In 2011, the Queensland Government agreed to a series of policy principles to progress home ownership in all discrete Queensland Indigenous communities.
Also in 2011, the former Department of Communities released a Queensland Indigenous Home Ownership discussion paper, which described the actions that the Queensland Government was taking to enable home ownership on Indigenous communal lands292. These communal lands included Aboriginal DOGIT lands, Torres Strait Islander DOGIT lands, and the Mornington and Aurukun Shire lease lands. Consultations on the issues raised by this paper occurred in 2011. FaHCSIA notes that a number of policy issues were raised in relation to home ownership, including valuation, the need for community policies around land allocation, the circumstances in which social housing would be released for sale and questions around supports for home buyers and land trustees to establish and maintain a home ownership system on Indigenous land.
In June 2011, FaHCSIA funded Cape York regional organisations to develop an approach to achieving native title consent for home ownership across Cape York communities, to further develop policy on home ownership and to provide support to individuals in communities to achieve home ownership outcomes. A tripartite governance mechanism was established. By June 2012 no home ownership outcomes had been achieved, as some of the policy and administrative prerequisites for home ownership had not been resolved.
289 Queensland Government, December 2010, Aborigines and Torres Strait Islanders (Land Holding) Act 1985 Discussion Paper. http://www.derm.qld.gov.au/indigenous/land/land_holding_act.html. 290 http://www.derm.qld.gov.au/indigenous/land/index.html. 291 The Aboriginal and Torres Strait Islander Land Holding Bill 2012 was tabled in Queensland Parliament in August 2012 and was referred to a committee. The committee was due to report at the end of October 2012. 292 Queensland Government, 2011, Home Ownership on Indigenous Communal Lands Discussion Paper, http://www.communities.qld.gov.au/housing/community-and-homelessness-programs/indigenous-housing-and-homelessness-programs/indigenous-home-ownership-discussion-paper.

Cape York Welfare Reform—Evaluation
108
The Queensland Government elected in March 2012 made commitments to supporting Indigenous home ownership293, including:
working with all trustees, individual community members and other stakeholders to remove the barriers to sustainable home ownership on Indigenous land in Queensland by addressing land tenure issues; ensuring councils have the capacity to undertake land administration activities, including the issuing of 99-year leases; resolving the outstanding issues with the Aborigines and Torres Strait Islanders (Land Holding) Act 1985; and getting rid of land tenure agreements that see Indigenous people forced to lease land from the government in some communities
removing the bureaucratic roadblocks to give a fair deal for home ownership for Indigenous Queenslanders by continuing to work with all those communities and community leaders who have been advocating for home ownership over recent years and working with those mayors and trustees who wish to investigate how to open up their communities to more commercial investment.294
More information on the matters that need to be addressed before home ownership can take place in DOGIT areas is provided in Appendix B, Section B.4.3, Land administration.
3.4.5 Economic Opportunity stream
Employment
Between 1 November 2008 and 30 June 2009, preliminary CDEP reforms were implemented in Aurukun, Coen, Hope Vale and Mossman Gorge in response to proposals in the design reports. These changes resulted in the closure of CDEP to new entrants or readmissions from 1 November 2008 until 1 July 2009. At the same time, a project to convert CDEP positions to sustainable, properly paid jobs began. By November 2009, 40 Australian Government and 31 Queensland Government positions had been converted into real jobs.295
The job conversions were designed to improve long-term employment outcomes in the CYWR communities. Among the positions were those for a broadcaster in Aurukun, arts centre support workers in Hope Vale and Mossman Gorge, and home and community care workers in all four communities.
National reforms to CDEP followed on 1 July 2009. Those reforms involved the closure of CDEP activities in all non-remote locations, including in Mossman Gorge. Furthermore, receipt of CDEP wages began to be phased out, with all new participants in CDEP receiving an income support payment, as opposed to a CDEP wage. Existing participants as at 30 June 2009 (known as ‘grandfathered participants’) have been able to continue accessing wages.
The CDEP Program has been extended to 30 June 2013. To provide stability for both providers and participants, the Australian Government has decided to leave current CDEP arrangements in place, including CDEP wages, as part of the new Remote Jobs in Communities Program, which will start on 1 July 2013. The new program will aim to provide a more integrated and flexible approach to employment and participation services for people living in remote areas of Australia. The four main programs currently delivering employment and participation services and community development in remote Australia—JSA, Disability Employment Services, CDEP and IEP—will be rolled into the new integrated service296.
293 http://rti.cabinet.qld.gov.au/charter-letters/charter-letters-glen-elmes.aspx. 294 Significant progress has been achieved during 2012, with both levels of government providing an extra focus on addressing the barriers to home ownership on Indigenous land across Queensland. By September 2012, 52 expressions of interest for home ownership in Coen and Hope Vale had been assessed by the Queensland Government Home Ownership Team and Indigenous Business Australia. Home ownership outcomes are expected to be achieved in the first half of 2013. 295 DEEWR unpublished data. 296 http://jennymacklin.fahcsia.gov.au/node/1842.

Implementation
109
Conditions for CDEP participation were also changed in the four welfare reform communities. Specific changes enabled the FRC to give force to its rulings for CDEP participants. From 1 November 2008, all CDEP participants had to sign forms acknowledging that they would cooperate with the FRC as an eligibility condition for continuing with CDEP. Cooperation included attending FRC conferences and acting on agreements reached with the FRC. If the CDEP participant did not cooperate, the FRC would advise the Cairns ICC which would investigate whether the person had failed to meet the eligibility conditions for participation. If this were the case, the person would be exited from CDEP, possibly becoming ineligible to participate in CDEP for 12 months.
Services and support are available in Cape York to support Indigenous Australians to find ongoing employment, both within and outside their communities.
In 2008–09, in preparation for JSA services being established in the CYWR communities from 1 July 2009 onwards, the Australian Government Department of Education, Employment and Workplace Relations (DEEWR) contracted providers of the IEP to deliver more intensive case management style assistance to CDEP participants and other job seekers in the communities of Aurukun, Coen, Hope Vale and Mossman Gorge. The initiative focused on intensive work preparation and the development of foundation skills geared at preparing people for employment opportunities expected to emerge in their communities, or to access mobility options for jobs in other locations.
A STEP Mobility Project was delivered to support people from the CYWR communities who sought mobility to take up job opportunities in other regions. This project followed on from the previous Work Placement Scheme that DEEWR contracted directly with CYP. The Mobility Project was implemented by Mission Australia, working with CYP and the private sector. The project ran until 31 December 2009 and involved pre- and post-placement support (including assistance with finding accommodation), training and mentoring, and mobility placements with employers in Victoria, primarily in the meat industry.
Economic development
Business precincts and lighthouse projects
Funding was agreed with the Hope Vale Aboriginal Shire Council in early February 2010 for construction of a new business precinct. Tenders were awarded in April 2010 and construction was delayed until October 2010. Tenants began to occupy the business precinct in mid-2012, after the official opening on 29 June 2012. The Aurukun Business Precinct is expected to be opened in February 2013.
Construction of the Gateway Tourism Centre in Mossman Gorge (now referred to as the Mossman Gorge Visitor Centre) commenced in November 2010. The centre was officially opened on 7 August 2012.
With the support of the Economic Opportunity stream leader, a horticultural project for Hope Vale was endorsed by the CYWR Project Board in November 2009. As a result, the Hope Vale horticulture industry is stimulating individual farming business enterprises and producing fresh fruit and vegetables for external markets as well as the Hope Vale community.
While not formally a lighthouse project, the Coen ranger activity is part of the Working on Country initiative. Two ranger groups (Lama Lama and Kalan) began in August 2009 under Balkanu’s management with funding from DEEWR. Up to 20 rangers in total have been employed.
Opportunity Hubs
Prior to the CYWR, individuals and families had limited access to life-improving products and services. In 2010, CYP began rolling out village opportunity hubs (O-Hubs) in all four communities.

Cape York Welfare Reform—Evaluation
110
Indigenous architect Kevin O’Brien was commissioned to custom design the first O-Hub in Aurukun in October 2010. Construction commenced soon after, with landscaping and interior fit-out taking place in January and February 2011. The O-Hub has family meeting rooms, office space, and iBank facilities for clients to use internet banking and shopping.
Indigenous leaders were appointed to lead each O-Hub in late 2010.
The new Hope Vale O-Hub forms part of the new business precinct with a similar customised fit-out based on the Aurukun design. CYP’s MPower, PoP, SETs and Wise Buys programs moved into the new O-Hub in late August 2012. The hub from which those services previously operated has been transformed into the parenting hub for CYP’s It Takes a Village to Raise a Child parenting program.
The Mossman Gorge O-Hub was completed and operational in March 2012. The O-Hub currently supports all CYP opportunity products, including MPower, PoP, It Takes a Village to Raise a Child, SETs and Wise Buys.
Development of the Coen O-Hub is still subject to funding negotiations.
3.5 Factors affecting variation in implementation As highlighted in Section 3.4, the implementation of programs was staggered between programs and between communities for a number of reasons. Four main reasons for the uneven nature of implementation included strategic issues, the status of existing projects, the nature of communities, and pragmatic and practical issues.
Strategic issues—for example, the development of new policies and programs which interacted with the CYWR, such as RSD (discussed above). Another strategic issue was the complex legal situation regarding home ownership in Indigenous communities. Perhaps the most significant of these issues related to the challenges and complexities surrounding the tripartite agreement and the nature of the CYWR Project Board. Although these arrangements were crucial for the success of the CYWR, the practicalities of gaining agreement from three partners for all strategic decisions inevitably slowed down some decision-making.
Existing projects versus new projects—existing projects commenced before or at the same time as the FRC commenced conferencing. New projects and, in some cases, revised delivery models of projects, required Project Board agreement, the development of funding agreements, infrastructure development, and training and recruiting of staff before they could be fully implemented in communities.
Nature of communities—some programs were rolled out in some communities and not others due to reasons specific to the community. For example, recruitment of student case managers in Aurukun was delayed because of recruitment and accommodation issues. SETs was postponed in Aurukun, and therefore was not implemented at the same time as in the other communities, because of a lack of necessary local infrastructure and agency alignment required to support the program.
Pragmatic and practical issues—often a number of factors combined at critical moments to delay implementation. For example, slower than anticipated funding releases and concerns about program design affected the rollout of the parenting program. Workforce and recruitment issues impacted on service delivery through Wellbeing Centres. The process to secure alternative funding and some modifications to program design occurred during the implementation phase of the Ending Family Violence Program.

Implementation
111
3.6 Barriers and facilitating factors associated with implementation
3.6.1 Interactions with other agencies
One common finding across the four communities was that some CYWR initiatives tended not to interact well with other services for a number of reasons:
Structural—they are not set up to facilitate interaction or, in some cases, are not allowed to refer to particular services. There is also some overlap between CYWR interventions and other services and this can cause tensions between service providers.
Ideological—some services feel that they should only work with people who volunteer for a service, whereas others believe that a degree of compulsion is justified.
Turf wars—there is a great deal of competition and tension between services (not only CYWR services) in these communities.
Overall, however, the interactions between services appear to be improving in most communities and many of the challenges have been ironed out over the past few years. A great deal of effort has been put in, particularly by the FRC, to improve relationships with service providers.
There is some overlap between CYWR interventions and other services and this has occasionally caused tensions between service providers. Although there are monthly service providers’ coordination meetings in each community, these are seen by many stakeholders as ineffective. The feedback from SPRC consultations about interagency forums in the communities has been that they are generally not very effective and that agency representatives are mainly concerned with defending the interests of their own agencies rather than looking more holistically at the needs of the community. This finding has been confirmed by the service providers survey and the Migration Plus report.
Additionally, a number of instances were mentioned in which agency rules and protocols impeded collaborative practice and client-focused interventions. For example:
refusing to do outreach and insisting that clients come to their premises for a service
sticking rigidly to service protocols, such as age of clients
providing interventions that were not culturally appropriate
fly-in fly-out (FIFO) (including drive-in drive-out) arrangements reducing service availability on Fridays and weekends, often when they are most needed.
In some cases service providers were bound by policies or protocols of their agencies. But interestingly SPRC found that sometimes these were interpreted differently in different communities, indicating that these rules are generally flexible enough to allow for services to better cater for the needs of clients.
As discussed below, there was evidence of good collaboration and cooperation when individual service providers were prepared to be flexible. In many cases where services do work well together it is because individuals have developed good working relationships to ensure that clients get a holistic service.
There is also service overlap and competition in each of the communities, not only between the CYWR programs and other agencies, but also between other agencies. This was raised as a concern

Cape York Welfare Reform—Evaluation
112
in the CYWR WRAP which lists ‘competing government priorities or programs within CYWR communities’ as a constraint.297
Many stakeholders believe that further work should be done to increase collaboration between CYWR interventions and other initiatives in the communities, and between service providers more generally at both the strategic and operational levels.
Generally there was some evidence that services were sometimes more structured around the needs of agencies than those of clients. Again this issue is not confined to CYWR communities and is a generic concern for human service provision, but is nevertheless an important barrier to implementation of the CYWR.
As discussed above interagency tensions are prevalent in all communities and there is no indication that these are worse in the CYWR communities than in other Indigenous communities in Australia. Indeed, one of the major reasons for the implementation of the RSD is the recognition that service provision in Indigenous communities is often uncoordinated and fractured.
3.6.2 Ideological issues
There are tensions between services over issues such as the basic philosophy of the CYWR and other programs (which are about improved coordination in service delivery or improving wellbeing rather than promoting individual responsibility) and these have led to some issues around implementation and working together.
Perhaps more fundamentally, there is no agreement about the actual meaning of ‘personal responsibility’ and the way that different service providers are expected to promote it. Although the service providers’ survey confirmed that the majority of providers agree with the high-level philosophy, it also confirmed this tension in service provision. There is no road map or identified process for facilitating the operationalisation of personal responsibility for different service providers, and thus services are essentially left to interpret this philosophy as they see fit.
3.6.3 Indigenous authority and elders
One of the objectives of the CYWR was to re-establish Indigenous authority. The CYWR model situates Indigenous authority within the FRC. From hand out to hand up states:
A statutory body of this composition would not only provide the gravitas and stature of a Crown body, but critically, would give power to local Indigenous people to take responsibility for the enforcement of the obligations and the rebuilding of social norms. The FRC should be vested with powers to make decisions (and not recommendations to Centrelink), so that actions occur in a timely manner and local authority is built.298
The FRC is the CYWR’s main vehicle for restoring Indigenous authority in the four CYWR communities. To this end a great deal of work has been done to appoint, train and support FRC Commissioners and community members who volunteer for the role.
While From hand out to hand up acknowledged the role of leaders at the regional and community levels, it also argued that the FRC needed to build local authority and that ‘restoring Indigenous authority and law is central to the rationale for piloting the FRC’.299
The role of elders in building Indigenous authority was addressed in From hand out to hand up, which stated, ‘A FRC model which only uses elders as advisors is not the Institute’s preferred option,
297 Cape York Welfare Reform, Welfare Reform Action Program (WRAP) Plan, Phase 1 (July 08 – June 09), Draft, 2008, p. 11. 298 CYI, From hand out to hand up, 2007, p. 10. (See also pp. 8–10 for an overview of how Indigenous authority is positioned). 299 ibid., p. 53.
Implementation
113
because it is less likely to develop the Indigenous authority which is crucial to rebuilding social norms in Cape York communities’.300
The consultations indicated that the FRC Commissioners are providing leadership in their communities. In some communities, commissioners have been recognised by community members and some have been elected as councillors to the local council. The election of commissioners to the local council certainly indicates a level of support for the FRC Commissioners, and the authority that they have built through their roles as commissioners. The social change survey also showed that just over half the population of the four communities endorses the role of the FRC.
However, concerns were also expressed that the FRC is suppressing and supplanting the role of the councils, justice groups and elders in some of the communities. The CYWR eschewed using traditional Indigenous authority structures such as clan elders, Aboriginal congress, traditional owners, land councils and local councils to restore Indigenous authority, arguing that these bodies and institutions had failed in the past and that a new mechanism needed to be developed.
In some communities this appears to be very successful, in particular where these other bodies were dysfunctional and ineffective or where the FRC was able to engage effectively with them. In other communities, authority has been fractured and the FRC has been in conflict with other sites of authority, such as the council.
Many of the participants in the consultations expressed the view that restoring Indigenous authority did not appear to be as much a priority for the rest of the CYWR interventions, which were more focused on delivering their projects and to a lesser extent on promoting individual responsibility.
3.6.4 Working relationships Relationships between individual staff members in different agencies have been very important influences on the effectiveness of implementation in all four communities. On the whole it appears that relationships between service providers improved over the welfare reform period, possibly due to the introduction of the RSD agenda. However, there is still a lack of trust between services in some communities.
Where staff members from different organisations have been able to develop trusting and productive working relationships, services have worked well together despite differing remits and working arrangements. On the other hand, where personal relationships between staff from different organisations have been fractious or distant, this has often resulted in staff becoming defensive and unwilling to go beyond strict agency protocols. Service provider relationships may have also affected the impact of some of the interventions on clients and community members.
Relationships in these services were sometimes constrained by long-established interaction patterns between agencies, particularly when the individuals involved had been working in the communities for some time. On the other hand, the rapid staff turnover in some services, and the FIFO nature of some of the work, created other barriers to the development of trusting relationships and good communication between providers.
It is important to note that these findings are not dissimilar to findings from implementation evaluations of a number of place-based initiatives. Relationships are increasingly being recognised as important influences on the delivery of effective interventions in a whole range of contexts.301 Nevertheless, these have taken on particular salience in the CYWR where loyalty to particular individuals and community factions has become a feature of the program.
300 ibid., p. 54. 301 K Bell & M Smerdon, Deep value: A literature review of the role of effective relationships in public services, Community Links, London, 2011.

Cape York Welfare Reform—Evaluation
114
3.7 Governance arrangements
3.7.1 Introduction This section seeks to describe how the governance arrangements for the CYWR were put in place, how those arrangements have evolved and whether they have supported the objectives of the CYWR. This section also outlines any changes in this model and any lessons learned. For a more in-depth discussion of the governance model, refer to Chapter 2, Section 2.5.
The CYWR was established with a wide range of components to assist with the governance of the trial. It was based on four streams (with stream managers) to deliver particular projects and with supporting governance mechanisms at the local level (local implementation committees), as well as the whole-of-project level (Project Board). The governance arrangements, with the exception of the Project Board, have not operated as originally planned. This is partly the result of the excessively bureaucratic structure of the original plan, which involved multiple levels of governance and lines of accountability (e.g. to stream leaders, local coordinators and program managers).
The governance structure for the CYWR was established in the Cape York Welfare Reform Board Agreement.302 As Figure 3.2 shows, the governance structure includes:
the tripartite Project Board (Cape York Institute, Australian Government, Queensland Government)
program offices
local implementation committee
mayors and local leaderships
stream managers.
Figure 3.2 Cape York Welfare Reform proposed governance model in 2008
CYI/AG/QGTripartite Project Board
Program OfficeCYI, AG, QG coordinators
Housing
Education
Economic Opportunity
Social Responsibility
Local implementation
committeeMayor
Government champion
Local program office
Community justice group
Local implementation
committeeMayor
Government champion
Local program office
Community justice group
Local implementation
committeeMayor
Government champion
Local program office
Community justice group
Local implementation
committeeMayor
Government champion
Local program office
Community justice group
Mayors and local leadership
Stream managers
WRAP(Program Plan)
LIPAAurukun
LIPAHope Vale
LIPACoen
LIPAMossman Gorge
Local program office
(Aurukun)
Local program office
(Hope Vale)
Local program office(Coen)
Local program office
(Mossman Gorge)
Program coordination and planning
Program and project delivery
302 CYI, Australian Government & Queensland Government, Cape York Welfare Reform Trial Project Board Agreement.

Implementation
115
AG = Australian Government; CYI = Cape York Institute for Policy and Leadership; LIPA = local Indigenous planning agreement; QG = Queensland Government; WRAP = Welfare Reform Action Plan. Source: Cape York Institute, Australian Government & Queensland Government, Cape York Welfare Reform Trial Project Board Agreement.
3.7.2 Tripartite Project Board (Project Board)
In 2010 the Project Board engaged in discussion to revise the CYWR governance structure to incorporate the Pentagon, village opportunity hubs and Lighthouse Projects Team. Despite efforts in 2010 and early 2011 to revise the tripartite agreement, the agreement was not endorsed.
3.7.3 Welfare Reform Action Program
WRAP was a component of the governance structure of the CYWR which sought to act as a ‘whole-of-trial program aimed to assist the trial, and specifically the stream managers, in implementing the trial’. A draft WRAP was developed for phase 1 (July 2008 – June 2009) of the trial (dated 26 August 2008). No further revisions were made to the WRAP after August 2008, and it appears as though the WRAP was underutilised in the governance of the CYWR.
3.7.4 Program offices and stream managers
The WRAP indicated that the CYI coordinator would lead the coordination of program office activities on behalf of the other members, and that the program office would appoint stream managers to manage the CYWR across the four streams.303 The stakeholder interviews, particularly with service providers under the Social Responsibility stream, revealed that there was some confusion about who the stream managers were for the CYWR. The exception to this was the Education stream, which was coordinated by CYAAA, and the Economic Opportunity stream, which was coordinated by Balkanu.
3.7.5 Local planning and coordination Under the CYWR 2008 Project Board Agreement and the WRAP, the CYWR included local program offices (LPOs), local Indigenous planning agreements (LIPAs), and local implementation committees (LICs) to assist with planning and coordinating the CYWR in each of the four CYWR communities. Under the WRAP, the LPO is listed as having responsibility for304:
developing a LIPA which identifies the WRAP activities for that community (the LIPA was to be endorsed by the LIC)
day-to-day coordination of CYWR projects at the community site
being a point of contact for the community in relation to CYWR projects and services
providing regular activity reports to the program office on WRAP activities in the community
educating community members on the intent and extent of the CYWR
working with the stream managers, project managers and the LIC to ensure effective coordination of activities in their community
administering the Community Action Fund.
The LPOs in each of the communities were small office spaces. In all the communities they were co-located in the same building as other CYWR programs, government agencies, or non-CYWR services. The mix of these differed across the four communities. For example, in one community the LPO was located in the same building as the justice group and the CYP. In another community, it was located with the Police–Citizens Youth Club. The LPOs appeared to act in a similar manner to the Village Hubs, in that people were drawn to these places to find out information on CYWR activities.
303 Cape York Welfare Reform, Welfare Reform Action Program (WRAP) Plan, Phase 1 (July 08 – June 09), Draft, 2008, p. 14. 304 ibid., pp. 13–14.

Cape York Welfare Reform—Evaluation
116
LICs for the four CYWR communities were part of the original governance arrangements. While interagency meetings occurred in each of the communities, LICs were not established in all the four CYWR communities as originally designed. They were established in Coen and Mossman Gorge in the early stages of the trial but were disbanded within a year when it was determined that it was more efficient to incorporate discussions of CYWR issues into existing committee meetings. Steps were taken to establish LICs in Hope Vale and Aurukun but they did not come to fruition.
3.7.6 Restoring Indigenous authority The CYWR has had to steer a fine line between adherence to program fidelity on the one hand and adapting to community circumstances on the other. It is also not clear who ‘the community’ or ‘community leaders’ should be: the elected council, Indigenous elders, the whole community, or should authority be disbursed to different groups within the community?
Some stakeholders commented that CYWR has provided a number of employment opportunities for people in the community but they are seldom in positions of responsibility and the jobs they occupy often do not provide opportunities for advancement. There also appears to be a widespread feeling that consultations since the implementation of CYWR have not been effective, despite the intensive work during the development phase prior to the start of the CYWR. As noted by Kate Reynolds et al in Chapter 5, individuals may be more willing to abide by the FRC’s decisions if they feel they have been heard and their views respected. If the community is to continue to endorse the goals and directions of social change inherent in the trial, it may be necessary to revisit and adjust the narrative surrounding the FRC and the objectives of the CYWR overall in the future.
Restoration of Indigenous authority appears to have been largely focused on the FRC, through developing Local Commissioners and has not become a theme of the welfare reform agenda more broadly. The FRC has acted as the CYWR’s main vehicle for restoring Indigenous authority. In Chapter 5 Kate Reynolds et al found that endorsement of the FRC was associated with stronger leadership, community engagement and personal responsibility. For example, where people surveyed said they endorse the FRC they also agreed that more individuals are making an effort to make the community better for themselves and family than three years ago.
All this must be seen within the context of the phase of development of the CYWR trial. Virtually all the energy has been devoted towards implementing the various components of the trial and ensuring that they operate effectively. It is possible that once effectively implemented, the CYWR can move to the next phase in which the programs will be much more tailored towards the needs of specific communities.
There did not seem to be a specific plan as to how local people could take control of the components other than the expectation that local community members should be employed in the service and then develop the skills which could perhaps allow them to take over. The exception was the FRC, where there is a conscious process of developing Commissioners’ skills to facilitate Local Commissioners to continue.
3.7.7 Mayors and local leadership There have been different levels of support from the mayors and councils of local communities. One community in particular had strong mayoral support, while another community council was resistant to the CYWR. There was a great deal of debate in the communities about the remit of the local councils (which in fact differ in the four communities) and whether councils should stick to the ‘Three Rs’ (rates, roads and rubbish) or whether they could or should take responsibility for other activities such as the services run by the CYWR. Although there was also some disagreement about the underpinning philosophy of the CYWR, many of the tensions around welfare reform appeared to arise from questions of ‘ownership’ of the programs and services (and funding), rather than about the basic nature of the CYWR itself.

Implementation
117
3.7.8 Projects and service delivery Stakeholders perceived that most of the CYWR projects were valuable (as confirmed by the service providers survey) but reported that some were not very different from services outside CYWR communities or those that had been offered previously. For example, in some communities existing parenting programs had been discontinued before the CYWR began. Other services were seen as less effective for various reasons, including staff turnover or lack of engagement by the communities. Some projects such as Wellbeing Centres and parenting programs were more easily implemented in some communities than others because it was easier to recruit and train staff. For some projects, such as PoP, views were mixed. PoP seems to have been beneficial for some people who accessed it but in some communities there were delays. For example, there was a delay in getting the partners’ agreement that CYP would lead the work in Hope Vale. There were reports that some premises had deteriorated subsequent to PoP upgrading. It was intended that PoP would work in concert with home and normalising tenancy arrangements, with a carryover effect of making properties more attractive for private sale. As is described below, this has not eventuated in the communities and so PoP has not yet been able to serve all of its original purpose.
The points raised above are not comments on, or evaluations of, the individual projects but illustrations of two main issues. First, inevitably some projects in a complex intervention will suffer delays and challenges, and governance arrangements should be flexible enough to deal with these. Second, the logic model of the CYWR involves the interaction of a range of services and policy developments. When one area (such as home ownership or employment) takes longer to implement, this affects other projects within the reform.
3.7.9 Community participation
Eighteen months of intensive consultations occurred prior to the communities joining the CYWR, as documented in volume 2 of From hand out to hand up. Nevertheless, following the implementation of the CYWR, stakeholders reported that communities felt that they had not been adequately consulted and that as stakeholders they had not been kept fully informed. Those concerns were reported by most stakeholders, including those who strongly supported the welfare reform agenda in the communities.
SPRC is not able to comment on the adequacy of the post-implementation consultation process, but it is obviously a matter of concern that so many stakeholders believed that welfare reform had not been adequately ‘sold’ in the communities. Having said this, there will always be community members who do not feel adequately consulted. This finding must also be considered in the light of some of the governance issues facing the welfare reform process. Welfare reform has to tread a fine line. On the one hand, it has to ensure that programs and projects adhere to the basic design and philosophy. The program theory does not allow communities to implement those initiatives which they value and drop those which they wish to discontinue. Ensuring that the reform is true to the program theory requires close scrutiny and management of projects and coordination of different aspects of the reform, and it is understandable that the welfare reform is seen as a total package. On the other hand, community ownership of and engagement with the welfare reform process are fundamental components of the reform, which aims to rebuild Indigenous authority.
Inevitably the program has been implemented differently in the four communities because their circumstances and contexts are so different. It is not immediately apparent, for example, that each of these four communities needed exactly the same 15 programs. One key tension in the trial is the question of how much authority and control the communities have over the trial. On the one hand the CYWR trial is a ‘package’ and the theory of change does not really allow for communities to ‘cherry pick’ those initiatives which they value and drop those which they wish to discontinue. On the other hand Indigenous authority implies that the community would ultimately control what happens in their jurisdiction.

Cape York Welfare Reform—Evaluation
118
Furthermore, as is described elsewhere in this report, the ‘messaging’ around individual responsibility and community commitment is complex, and project managers and community members do not always understand the relationship between sanctioning people to behave in certain ways and promoting individual responsibility. Thus community ownership and consultation have been significant issues for the welfare reform agenda. Although welfare reform has inevitably been implemented differently in each community, this does not appear to be as a result of consultation with community members about the specific priorities and preferences of individual communities.
3.7.10 Project monitoring data
Agencies have to report monthly to the FRC on client progress and, in some instances, this has created a heavy burden of reporting. The service provider survey reports a lack of transparency and accountability in some of the programs and services, and reports that service provision data have been unreliable. Project monitoring and governance should be significantly streamlined if a high level of accountability can be maintained.
3.7.11 Relationship to other reforms
The CYWR partners have engaged in detailed discussions on the relationship between the RSD strategy and the CYWR. Where the focus of RSD is on reforming the way government services are delivered in remote Indigenous communities, CYWR is a holistic, Indigenous-led innovation designed to restore social norms, rebuild Indigenous authority and create genuine and sustainable economic and employment futures for Indigenous people. Under RSD, there is an expectation that LIPs will describe a range of activities communities wish to implement. Plans were drafted for the four CYWR communities. Those plans, known as ‘accords’, reflect the driving role of CYWR in the four communities. The first of the accords was signed in Aurukun in November 2011 by Aurukun Shire Council and Australian and Queensland government representatives. The remaining accords are expected to be finalised in early 2013. Although capturing a range of community-agreed actions, the accords supplement the central reform agenda of the CYWR communities.
More discussion on the relationship of the CYWR to other reforms is provided in the section on the boundaries and scope of the CYWR in Appendix D.
3.8 Conclusion The implementation of the CYWR should be seen in the light of the innovation, complexity and scale of the trial. There were no precedents for a program of this scale and comprehensiveness and the CYWR has therefore been required to develop and adapt its governance structures and implementation processes as it progressed. Furthermore, the context in which the trial has had to operate has itself become more complex and fluid, with a number of overarching national policies interacting with the welfare reform agenda. Judgements about the implementation and impact of the CYWR should also be seen in the context of program implementation within remote Indigenous communities, which is notoriously challenging.
Overall, the majority of the elements of the CYWR have been implemented as originally planned, although the timescales for some projects have inevitably slipped. The Economic Opportunity and Housing streams have been significantly delayed but this has been due not to poor implementation but to the significant legal and logistical barriers to those programs.
Given the complexities and ambition of the CYWR, it has been effectively implemented. At the strategic level, the governance arrangements have held together and have continued through the trial. The tripartite arrangement has sometimes appeared fragile and has not always led to smooth or responsive decision-making, but has delivered the intended strategic direction. The tripartite structure and, in particular, the Project Board, continue to be fundamental components of the CYWR.

Implementation
119
Some of the governance structures have fallen away. In some cases this has been a positive step, in that the original plans appear to have been cumbersome and overly bureaucratic, but it has also resulted in a loss of coordination and coherence. This difficult tension for the welfare reform is likely to continue. For welfare reform to maintain its radical edge, it requires close monitoring and strong leadership. However, monitoring and coordination are very expensive and burdensome and the resources (and energy) needed to be devoted to coordination, quality assurance and scrutiny can distract from the actual task of program delivery. Coordination is itself a resource-intensive process and as such should focus on better services for clients and not be seen as an end in itself.
At the operational level, the welfare reform initiatives have had a number of governance and accountability challenges. Service providers and managers have worked hard to address those challenges and a number have now been successfully overcome. However, in an initiative as complex as the CYWR it is likely that some of those challenges will remain for some time.
The introduction of the RSD has also created governance issues not originally anticipated; however, in the most part the RSD has complemented the reform as it is based on a similar philosophy.305 The draft project board agreement was revised in July 2010 but has yet to be agreed to by the Project Board. This indicates that although the arrangements have held over the past four years, they are still rather fragile.
The FRC has been implemented according to the original program logic, but if anything the FRC has become even more significant to the CYWR, by taking on a range of tasks including coordinating services, quality assurance of program data and mediating between warring factions in some communities. The FRC has worked hard to ensure succession planning in the face of significant obstacles and personal challenges for Commissioners.
The FRC was planned as a short-term measure (and was initially only legislated to operate for 3.5 years). Yet no exit strategy for the FRC has been developed. The rate of notifications has not declined, and the social change research study, although finding significant improvements, still indicates that there are a range of problems to be addressed around behaviour, Indigenous authority and wellbeing. Thus the problems that the FRC is addressing have not been fully resolved in these communities. Many stakeholders who were consulted believed that should the FRC be discontinued as is implied in the program theory, there will clearly need to be a robust mechanism for taking forward Indigenous authority and leadership of welfare reform in the communities. If the FRC is replaced with other bodies or functions they would need to be demonstrably as effective as the FRC at carrying out these tasks.
305 Chapter 3, Section 3.2.3.


Social change survey
121
4 Social change survey Colmar Brunton Social Research
4.1 Introduction This chapter summarises the key results from the social change survey conducted by Colmar Brunton Social Research (CBSR). The survey took place between February and April 2012 in the four Cape York Welfare Reform (CYWR) trial communities of Aurukun, Coen, Hope Vale and Mossman Gorge. CBSR worked with local research teams and was grateful for the determination and professionalism displayed by the teams. CBSR acknowledges the assistance of councillors, traditional owners, partners to the trial, community stakeholders and, most especially, the 582 community members who completed the survey.
The social change survey was designed to test aspects of the CYWR trial relating to the theory of change. The theory of change underlying the trial stresses the importance of individual responsibility, and postulates that social norms can influence individual and whole-of-community experiences that make up daily life. The CYWR trial aims to see whether the restoration of Indigenous authority can play a role in restoring prosocial norms through the social psychological processes of compliance (e.g. the enforcement of laws), persuasion and internalisation of norms and values (self-reinforcing behaviours) as described by Kelman in 1958.306
The establishment of the Family Responsibilities Commission (FRC) is a key driver of change in social norms and as a vehicle for restoring Indigenous authority and leadership in the four trial communities. Other features that support the change process include a number of enabling or supporting projects, such as Wellbeing Centres and MPower. These were covered in the survey, as they are concerned with the program theory’s short- to medium-term outcomes and are linked to behaviour change and capability building. The CYWR projects fall under the four streams described in Chapter 2: Social Responsibility (including the FRC), Education, Housing and Economic Opportunity.
The purpose of the social change survey was to assess whether progress has been made towards changing social norms and rebuilding Indigenous authority in the four CYWR trial communities. The survey reached 582 respondents. It captured local people’s perceptions of change and their attitudes to social norms and was complemented by participatory qualitative research. Further information about the survey results is available in the full report by CBSR.307
This chapter begins with an overview of the key findings of the survey. The research objectives and methodological aspects of the study are outlined, followed by a demographic profile of the survey participants. Findings from both qualitative and quantitative research are presented, covering what is changing and why, the most significant changes, differences in people’s responses to reform (clustering responses into change segments), perceptions of social issues, restoring Indigenous authority, participation in the real economy, housing, and the impact of the reform initiatives. The quantitative survey data were analysed to determine whether there were specific segments of the communities that could be defined by three sets of variables collected in the survey: perceptions of individual change, the factors driving change, and exposure to reform initiatives and supporting services.
306 HC Kelman, ‘Compliance, identification, and internalization: three processes of attitude change’, Journal of Conflict Resolution, 2 (1958), 1: pp. 51–60. 307 Colmar Brunton Social Research, Social change research study: aggregate report, report prepared for FaHCSIA, Canberra, 2012.

Cape York Welfare Reform—Evaluation
122
The four communities have each been presented with their individual community reports. Ethics approval was obtained for the social change survey from the Human Research Ethics Committee of the Cairns and Hinterland Human Health Service District, Queensland Health. To maintain the privacy and confidentiality of survey respondents, this chapter comprises a summary of aggregated survey responses by participants in the four trial communities.
4.2 Key findings The quantitative survey reached 582 respondents, representing at least 35 per cent of the estimated combined adult population of the four communities. Many people also participated in qualitative research which was used to identify the biggest changes and what would make the community better in an open participatory way. This was conducted during the survey phase, allowing the qualitative research to complement the structured quantitative survey.
4.2.1 Perceptions of change in people’s lives Over half of respondents felt that their own lives were on the way up (54%). Reasons given for
this were having a new job / working harder / diversity (18%); attitudes changing (12%); housing (5%); seeing changes in oneself (5%); and having a happier life (5%). Only 2 per cent said their life was on the way down, and 44 per cent said there was no change.
4.2.2 Changes over the past three years When asked about changes in social and safety issues, 52 per cent of respondents felt that more
people were trying to be better parents; 24 per cent felt more people were trying to give up grog, smoking or gambling; and 33 per cent felt there was less fighting between families.
Three-quarters of respondents agreed that things are changing because people put in the effort to make the community better for themselves and their families (77%).
More than half (61%) agreed that people are working together to fix problems, and just over half (51%) felt people in general show more respect for elders and leaders.
4.2.3 Impact of reform initiatives over the past three years
Of people who attended an FRC conference, 90 per cent said that they followed up and did what they talked about with the FRC; of those, 66 per cent said that the FRC made things better for them.
Two-thirds (66%) of respondents felt that the community would be a better place to live if everyone followed up on their talks with the FRC and did what was discussed at the FRC conference. Overall, 65 per cent of respondents felt that people should go to the FRC if they don’t take their kids to school.
Three-quarters of participants felt willing to ask for help with problems if they needed it and slightly more would encourage their family to seek help if they had problems (82%).
4.2.4 Drivers of change
The most significant drivers of individual change are indicated by those survey questions in which respondents were significantly more likely to state that their life is on the way up: that leadership was stronger than it was three years ago; that they had completed education higher than Year 12; that they had followed up on and done what they had talked about with the FRC; that they or their family had used the Wellbeing Centre; that they had middle-sized households; and that they or their family had used MPower.

Social change survey
123
4.2.5 Change segments A clustering of responses shows that people answer questions in similar ways, forming four
segments based on quantitative survey analysis:
Segment 1—people who are reforming and changing (with positive life outcomes and fully exposed to reform services and programs)
Segment 2—people who are battling on their own (with slightly positive life outcomes and only partially exposed, with only the FRC and no services or programs)
Segment 3—people who report no change, spectators to the reform (no change or negative life outcomes and not exposed to any reform services or programs)
Segment 4—people who are strivers or self-help seekers (with positive life outcomes and exposed to the services and programs of the reform, but without having been to the FRC).
4.2.6 Restoring Indigenous leadership Around half (51%) of respondents felt that the FRC made leadership in their community stronger,
almost a quarter (24%) felt there had been no change, and 13 per cent felt the FRC had made leadership less strong in the community.
4.2.7 Participation in the real economy
Of the 51 per cent of respondents employed, 23 per cent worked in a public service job, 19 per cent worked for private organisations and 9 per cent worked in CDEP or equivalent positions.
4.2.8 Housing
Most people (95%) wanted to make their home a nice place to live in, although overcrowded houses, with relatives coming and going on a daily or weekly basis, made it harder to keep homes clean.
Over half of community members surveyed were interested in using a home ownership scheme in the future (58%).
4.2.9 What still needs to happen to make the community a better place The most important issue respondents identified was more housing and development (19%).
The second most important issue was the creation of employment (18%). People expressed a desire for employment to be created through the development of new houses.
Activities and services for young people, or the continuance of activities, was the third most important issue cited by respondents (13%).
4.3 Research objectives The overall objective of this survey was to investigate whether social norms and behaviours are changing. Specifically, the research provides evidence on whether the CYWR trial effected significant change towards the four objectives of the trial:
1. Restoring positive social norms
2. Re-establishing Indigenous authority
3. Increasing community and individual engagement in the ‘real economy’
4. Transitioning people from welfare housing to home ownership.

Cape York Welfare Reform—Evaluation
124
4.4 Methodology
4.4.1 Principles informing the methodology In the development of the social change survey design, CBSR considered the evaluation principles (discussed below) that should underpin the design and conduct of the evaluation, as outlined in the CYWR evaluation framework prepared by Courage Partners (2009).308
Emphasis of the evaluation is on learning—The Social Change Survey describes the experience of those individuals involved in the CYWR trial. People may have different exposure to and experience with the CYWR trial. Therefore, it was important that survey data were collected at an individual level and not from group or peer interviews. This was also the opportunity for the voices of the community members to be incorporated into the evaluation. It is the individual’s opportunity to comment on what they perceive has changed, why or why not, what they think, feel and see as being the key influences and constraints of change. There are many different views based on differing experiences. It is important that evaluators learn from these results and do not dismiss or discredit those individual voices in the four communities regardless of whether they are reflective or contrary to system and policy level contextual information. It is their perception of ‘reality’ that is essential to understanding the impact of the trial and learning how communication, implementation, processes and initiatives may be improved.
Focus on problem solving—CBSR has delivered the individual community descriptive reports of the results to each community. The intention was that the community reports would assist with policy-level planning and that individual communities could use the results for community-level planning and problem solving.
Good practice—CBSR incorporated elements of other methodologies used in the evaluation of Indigenous programs and on the evaluation of complex social interventions based on changing behaviour, such as the Community Safety and Wellbeing Research Study 309 conducted as part of the Northern Territory Emergency Response evaluation, and the Evaluation of New Income Management.310 A key feature of good practice is the adoption of as much of a participatory research style of approach as is feasible.
Explore the conditions and context—As outlined in the good practice approaches cited above, the design was not constrained to a restrictive quantitative questionnaire. The qualitative research allowed participants to verbalise their perceptions of the opportunities and constraints of the CYWR trial even where those perceptions might fall outside the known parameters of the research set by the program logic. This is a key feature of participatory style research, in which participants are able to offer their views even if those views go beyond the boundaries set by the research program.
Capture the degree and nature of change—The design included individual, family and community level perceptions to capture people’s experience of the trial.
Limited intrusion—To limit intrusion into people’s lives and living circumstances, the sample design intercepted people in a wide range of places as they went about their daily lives around the community. Other, more intrusive, random household or individual selection sampling was not considered respectful and appropriate.
Local resources—Local research assistants were employed and trained with CBSR guidance and under an agreed approach with the Cape York Partners. The approach involved the local community
308 Courage Partners, Evaluation framework and program theory for the Cape York Welfare Reform Trial, 2009. 309 Bowchung Consulting, Community safety and wellbeing survey: consolidated report, September 2011. 310 Social Policy Research Centre, University of New South Wales, Australian Institute of Family Studies, Evaluation framework for new income management, December 2010.

Social change survey
125
in the data collection with the aims of developing their skills, introducing efficiency and improving the integrity of the information collected.
Build trust—An essential part of the CBSR approach was to recognise the need to build trust between local community members, service providers, program staff and the evaluation team. CBSR recognised that this would take time that was not available under the contractual requirements to deliver the social change survey. To address this issue, the approach used by CBSR, and supported by FaHCSIA, resulted in the employment of an Indigenous project manager, Robert Corrie, who had worked in the four communities over the past few years. As an individual, he was already respected and trusted by local community members, service providers and program staff. The research team also had great respect for him and placed their trust in his guidance on how to work respectfully with the four communities.
The application of the above principles in the design of the methodology culminated in the following research design.
4.4.2 Research design The research involved three phases311:
Phase 1 involved exploratory qualitative research, which assisted in the design of the quantitative survey (described further below).
Phase 2 involved administering a quantitative questionnaire to 582 community participants. The quantitative questions were largely driven by the particular issues that were relevant to the community, as expressed in Phase 1. Most interviews lasted between 30 minutes and one hour.
Phase 3 involved a qualitative participatory component using a voting technique to identify the most significant change and biggest challenges, and involved 464 participants.
The three partners also reviewed and refocused the quantitative survey to cover the program logic of the CYWR trial. The research results were reported back to each of the communities.
4.4.3 Limitations and challenges of the research
There are various limits to any survey. This survey was not aiming to attribute causality or to separate out effects of programs, but to look at the combined effect of the trial as a whole. The content of the survey questionnaire was limited by time constraints, so interviews were kept as short as possible to help improve response rates and reduce respondent fatigue. The need for privacy and confidentiality about individual responses in these very small communities meant that the extent of community data shown in the final report is limited, and the results are mostly presented in aggregate rather than by community. Further information about the limitations is available in the full report by CBSR.312
Despite these challenges, the survey collected a wealth of data from community members using both the quantitative survey and participatory qualitative approaches, contributing many significant insights into the implementation and early impacts of the CYWR.
The results of the survey should be used in conjunction with other components of the evaluation, particularly the analysis of the survey data by Reynolds, Subasic and Jones in Chapter 5.
311 For a more detailed description of the research design, see Colmar Brunton, Social change research study: aggregate report, 2012. 312 Colmar Brunton, Social change research study: aggregate report, 2012.

Cape York Welfare Reform—Evaluation
126
4.4.4 Field work
Ethics approval
Ethics approval to conduct the study was sought from the Human Research Ethics Committee (HREC) of the Cairns and Hinterland Health Service District, Queensland Health, and was gained on 15 December 2011. The HREC reference number is HREC/11/QCH/92-750.
Formal consent process
Formal consent was gained through formal leadership structures such as local councils, Indigenous organisations and the traditional owners, who are respected and recognised as having the right to provide consent for the community. Consent for community participation was confirmed in writing. The written consent was provided to FaHCSIA and included as part of the ethics submission.
Local researchers
A total of 34 local community members were recruited and trained to undertake Phase 2 and Phase 3 of the research. The first day of field work involved training the local researchers. First, CBSR researchers introduced the project and what it involved. Then they went through the training manual, highlighting the need to be impartial (that is, to collect people’s stories neutrally, word for word) and to ensure participant confidentiality. The training also covered issues such as effective probing and interviewer safety. The rest of the day involved training researchers in the use of the iPads and going through the survey question by question. Local researchers were paired up to interview each other as their first interview under the careful watch of CBSR researchers.
Ongoing interviewer observation from CBSR staff, encouragement and mentoring each day in the field ensured that interviews were conducted effectively and objectively. Learning by doing, supported by observation and immediate feedback by CBSR staff, proved to be the most effective training approach. Observational interviews were conducted with all local researchers to ensure that they were administering the survey appropriately. Additional training was provided if required.
Every morning, CBSR researchers verbally updated the local researchers on the overall progress of the interviews and on what targets needed to be met to achieve a sample that was more representative of gender, age and the locations where people lived.
Quantitative survey
Most participants were recruited using intercept interviewing at locations around the community as they went about their daily lives, in people’s homes or at their places of work.
At the start of each interview, the participant was taken through an information/consent form, which they were asked to sign (or, occasionally, the researcher signed the form on the participant’s behalf if they were not comfortable putting their name to paper). The form was collected by the researcher at the end of the interview.
Most people were happy to participate once they were given a full explanation of the subject matter. Community members very much enjoyed having their say, and some spoke of their sincere wish that the government would listen to their views.
In all locations, iPads were used to collect the data. Feedback from the local researchers was that they really enjoyed using the iPads, as it made the data collection process more interactive for them as interviewers and for the people they were interviewing.
Generally, the surveys were completed as single interviews out of earshot of other people, allowing participants to give considered, private and personal answers.

Social change survey
127
There was some overlap between participant samples in each phase of the research, but overall at least 35 per cent of the estimated adult population aged 17 or over313 participated in the quantitative survey (or 582 respondents out of an estimated population of 1,669 people). A demographic profile of the participants in the survey is outlined in Table 4.1. A cross-section of people in each community participated in the study, producing a representative sample of women and men, people of different ages, and family groups.
Table 4.1 Profile of survey participants
Total—all
communities Aurukun Coen Hope Vale Mossman
Gorge
(n = 582) (n = 195) (n = 90) (n = 247) (n = 50)
Gender Male 49% 53% 47% 47% 44% Female 51% 47% 53% 53% 56%
Age 16–24 years old 25% 20% 31% 27% 20% 25–44 years old 43% 43% 39% 45% 48% 45–64 years old 28% 32% 21% 26% 32% 65+ years 4% 5% 9% 2% 0%
Length of residence Always lived in this community 84% 87% 79% 85% 73% Lived most of the time in this community 12% 10% 16% 11% 14% Only live in this community some of the time 5% 3% 6% 5% 12%
Frequency of visiting homelands Regularly 33% 27% 46% 36% 22% Occasionally 49% 55% 43% 47% 48% Not applicable/I don’t have homelands to visit 10% 11% 7% 9% 20% Not applicable/Live on homelands 3% 3% 2% 2% 8% Prefer not to say 4% 4% 2% 6% 2%
Base: All survey participants, n = 582. Note: some columns may not add to 100% due to rounding.
Qualitative research
One of the key elements of this research was to employ a participatory action research approach. This approach was facilitated during field work in a number of ways.
Phase 1 of the research involved exploratory qualitative research with community members and key stakeholders—most of whom were also Indigenous community members. The qualitative interviews asked participants to tailor some aspirational statements that captured the essence of CYWR trial to fit the community and to talk about how things would be if people were living / not living out those statements in their daily lives. People were also asked whether more or less people were behaving in ways consistent with the statements compared to three years before. This information fed into the design of the quantitative survey in Phase 2.
Phase 3 of the research involved the qualitative participatory component, in which a voting technique was used to find out about the most significant changes and challenges. In Phase 3, the quantitative survey was used as a starting point to delve deeper into what community members thought about the changes identified most often in Phase 2 and the challenges to be overcome to make their community a better place to live, through probing after each question. After analysis of those responses by the CBSR and local researchers, a list of ‘biggest change’ items and ‘what could make the community a better place to live’ items was generated towards the end of the field work in each community. These
313 Data is from the ABS 2006 Census adjusted by the Queensland Government Office of Economic and Statistical Research. The estimated resident adult population, 30 June 2010 (people aged 17 years or over) is estimated by applying the proportion of the 2006 Census Collection District population aged 17 years or over to the total Estimate Residential Population data. Based on this the population of the four communities aged 17 or over in June 2010 is estimated to be 1,669.

Cape York Welfare Reform—Evaluation
128
items were then voted on as the first, second or third most significant to the individual through a ‘voting’ process.
The list of ‘biggest change’ and ‘what would make the community better’ items for each community is presented in Appendix D of the full report.314
Participants very much enjoyed receiving quick feedback on the issues arising out of this technique. They also valued the opportunity to prioritise their top three choices.
4.5 Research findings
4.5.1 What is changing and why? This section investigates what has changed over the past three years in the communities, what has changed in terms of leadership and social issues, and whether life has changed for children. A baseline survey was not undertaken prior to the CYWR trial to allow direct comparison, so this research must rely on the perceptions of community members to measure change over the three-year period.
Perceptions of community change
To assess whether people think that things had changed in their community, they were asked in the survey to say whether they thought their community was on the way up, was on the way down, or had not changed. Overall, 58 per cent felt that the community was on the way up, 6 per cent felt that the community was on the way down and 36 per cent felt that there had been no change. There were no significant differences between the perceptions of men and women or between those of different age groups.
Overall, infrastructure changes such as more housing and buildings (13%) were the most common reason given for why the community was on the way up. This was especially so for Aurukun (18%), Hope Vale (13%) and to a lesser extent Coen (8%), but not at all for Mossman Gorge (0%). More services and support, such as MPower, Wellbeing Centres, Pride of Place and Student Education Trusts, was the second most common reason for the community being on the way up (11%). The third most common reason offered was more jobs (11%). Community members also felt that there were more kids going to school (8%).
Changed attitudes, such as more people trying to be better parents, more people working and more people using services to get help, were also given as a reason for change in the community (7%). Community members also felt that there were other reasons such as community involvement, a reduction in social problems, better money management and less humbugging, but this was in smaller proportions (<4%) and tended to be community specific.
In an open-ended question, community members were asked to identify the biggest change they had seen in their community in the past three years. The sections below explore the perceptions of each community separately, as community-specific changes were identified.
Aurukun
One-third (33%) of community members in Aurukun thought that more houses and buildings or housing upgrades were the biggest change in the community since the inception of the reforms. In second place, a quarter of community members (25%) felt that more kids going to school was the biggest change. In third place, approximately 1 in 10 people (13%) felt that more jobs were the biggest change. Twelve per cent felt that having more services, such as the FRC, contributed to more kids going to school. Also identified were a reduction in social problems such as drinking, drug use
314 Colmar Brunton, Social change research study: aggregate report, 2012.

Social change survey
129
and petrol sniffing (5%); attitudes changing (4%); the BasicsCard (3%); and less fighting and domestic violence (3%). One per cent said there had been an increase in binge drinking, and 13 per cent said there had been no change.
Coen
The community members in Coen felt that more kids going to school (22%) and improvements in education (21%) were the biggest changes to have occurred in the community since the inception of the CYWR. The football field upgrade, the sporting grounds upgrade and sports and activities were thought to be biggest change by 10 per cent of community members. Some people (9%) thought the biggest change was because initiatives such as the FRC, the Parenting Program, student case management and improvements at the school (such as Direct Instruction and more teaching of culture offered through the Cape York Aboriginal Australian Academy) were helping to support parents to send their children to school. Participants also identified a reduction in social problems like drinking, drug use and petrol sniffing (9%); more houses and buildings and housing upgrades (6%); and more jobs (2%). One per cent said there are people moving into the community, and that people are not employed (3%). Seven per cent said there had been no change.
Hope Vale
More than half of community members surveyed (55%) felt that more houses, buildings and housing upgrades were the biggest changes in the community since the inception of the reforms. The second most cited changes were more services and support, such as MPower, the Wellbeing Centre, Pride of Place and Student Education Trusts, and more kids going to school (both 9%). More jobs (7%), attitudes changing (3%) and less drinking, drug use and petrol sniffing (2%) were also identified as the biggest change. Two per cent said that people were not employed, and 18 per cent said there had been no change.
Mossman Gorge
Just over two-fifths (42%) of community members in Mossman Gorge thought that the Gateway training and employment hub and more jobs were the biggest change in the community since the inception of the reforms. Those respondents thought that this was the biggest change because the Gateway has provided more ‘real’ jobs and training opportunities and that this has resulted in more people working.
The second biggest change was more services and support, such as MPower, the Wellbeing Centre, Pride of Place and Student Education Trusts (30%).
The third biggest change was more kids going to school (12%), which was largely thought to be due to additional services such as student case management and less alcohol, drinking, drug use and petrol sniffing (4%) and the BasicsCard (2%). There was also a perception that less family fighting and domestic violence (8%) and the Pride of Place project (6%) were other changes. However, others noted more binge drinking (2%) and that people are unemployed (2%). Six per cent identified no change.
Most significant changes
Improvements in school attendance, more jobs, more housing and more services such MPower and Wellbeing Centres were common themes nominated in both the exploratory research (Phase 1) and in qualitative responses to the survey (Phase 2) as positive changes perceived by the community.
In addition, people were offered an opportunity to vote for what they thought were the most significant changes. This was done in a participatory qualitative manner, to ensure that the issues identified were those issues that were most important to local people (Phase 3).
After the completed interviews were analysed towards the end of field work in each community, lists were compiled of the biggest changes that had occurred in the past three years, as identified by the

Cape York Welfare Reform—Evaluation
130
respondents. CBSR presented these lists to community members, and participants were asked to vote for the first, second and third most significant changes that they thought had occurred over that period. It should be noted that, of the 462 community members who participated in this stage of the research, some might not have participated in the quantitative survey.
Each community had slightly different views about which changes were most significant (shown in Table 4.2 and discussed separately below).
Table 4.2 Most significant changes in the past three years
Aurukun Coen Hope Vale Mossman Gorge 1st More kids going to school. More kids going to school. More kids going to school. The Gateway training and
employment hub. 2nd More houses. More jobs. More houses. Introduction of more services,
such as MPower, Apunipima (Cape York Health Council), the FRC and the Wellbeing Centre.
3rd More jobs; more people working.
Less grog and less binge drinking.
More services and support, such as MPower, the Wellbeing Centre, Pride of Place, Student Education Trusts.
More kids going to school.
4th Stronger leaders. Quality of teaching better with Direct Instruction and the academy.
More binge drinking. BasicsCard.
5th More services, such as the FRC, the Wellbeing Centre, MPower.
More services and support, such as MPower, the Wellbeing Centre, Pride of Place, Student Education Trusts.
Attitudes changing, such as more people trying to be better parents, more people working, more people using services to get help.
More jobs.
Aurukun
In Aurukun, common themes expressed in the exploratory phase, qualitative responses to the survey and Phase 3 voting were improvements in school attendance, more houses, more jobs, stronger leaders, and more services such as MPower and the Wellbeing Centre.
Coen
In Coen, improvements in school attendance, more jobs, and more services such as MPower and the Wellbeing Centre were common themes expressed in both the exploratory and survey qualitative research.
As well as improvements in housing and services infrastructure, participants also felt that attitudes (in relation to school attendance, people trying to be better parents, more people working, and more people using services to get help) were changing.
The inclusion in the survey responses of less grog and less binge drinking in the top five biggest changes in the past three years may be linked to the introduction of the BasicsCard, which prohibits income-managed funds being spent on alcohol.
Hope Vale
In Hope Vale, results for the biggest change were very consistent with the survey results. Improvements in school attendance, housing and services, in particular, were common themes expressed in both the exploratory phase and in qualitative responses to the survey.

Social change survey
131
As well as improvements in housing and services infrastructure, participants also felt that attitudes and behaviour (in relation to school attendance, people trying to be better parents, more people working, and more people using services to get help) were changing.
The inclusion of more binge drinking in the top five changes in the past three years indicates that alcohol abuse is a key issue yet to be resolved, and in fact is perceived to have become worse. Some detractors of welfare reform feel that the alcohol management plan has encouraged binge drinking because consumers substitute beer for wine and spirits and need to consume all their alcohol as soon as possible so they do not get caught out.315
Mossman Gorge
More access to jobs and training through the Gateway has improved employment prospects in Mossman Gorge and is seen as the biggest change. There have also been improvements in school attendance, employment and services. These were common themes expressed in both the exploratory and survey qualitative research.
Perceived reasons for change in the community
Community members were asked whether life was better than it was three years ago and the reasons for that change (if any). Participants were read out a series of statements about possible reasons for change in the community. They were then asked how much these statements sounded like their community on a scale of 1 to 10, where 1 sounded nothing like their community and 10 sounded exactly like their community.
Around two-thirds felt that things were getting better because of better services and support (67%). Overall, 64 per cent felt that things were getting better because people were more committed to making the community a better place. About half felt things were getting better because the FRC has made clear what standards of behaviour are important to build up the community (50%) and because people who have influence in the community are helping people to change (56%).
There was a statistically significant difference between men (67%) and women (61%) who thought positively (rating of 7–10) about people being committed to making the community a better place. Men were more likely than women to score a 10 when asked if ‘this was exactly like their community’ (36% versus 27%)
Men were more likely than women to think that people in the community who have influence are making it better (58% versus 54%).
Community members aged 45 to 64 years were more likely to be positive on all these statements than younger people.
Changes in children
Community members were also asked whether life had changed for children over the past three years in relation to food, physical activity, overall happiness and respect.
Almost two-thirds (63%) of respondents felt that children were eating healthier food. Half felt that kids are happier than they were three years ago (54%) and that kids were more active (50%).
On the question of children’s respect for their parents and elders, community members tended to be more divided: just over a quarter felt that kids had more respect (27%), while the other three-quarters (73%) felt that the level of respect had stayed the same (34%) or was worse (39%).
315 Under the Hope Vale alcohol management plan some non-fortified wine is allowed, see Section 3.3.4.

Cape York Welfare Reform—Evaluation
132
Changes in community cohesion
Community members were asked to rate how much they agreed or disagreed with statements about changes in community cohesion over the past three years. Generally, community members felt that certain aspects of community cohesion had improved over that time, and three-quarters agreed that things were changing because people were willing to put in an effort to make the community better for themselves and their families (77%), but there were some who disagreed (14%). Sixty-one per cent agreed that people were working better together to fix problems and 23 per cent disagreed. Half (51%) also felt that people in general showed more respect for elders and leaders, while a third (33%) disagreed.
Changes in social problems
Community members were asked about the impact the reforms had had on social and safety issues in their community. Overall, about half (52%) felt that more people were trying to be better parents; one-quarter (24%) felt that more people were trying to give up grog, smoking or gambling; almost half (46%)felt that this had stayed the same; and a just under a quarter (23%) felt that fewer people were trying to give up those activities.
Around a third of community members felt that there was less fighting between families (33%) and less fighting in families (36%), but similar proportions felt that this had not changed (36% fighting between families and 40% fighting in families).
Around a third of participants (36%) felt there had been an increase in vandalism or deliberate damage to property over the past three years, while a third (33%) felt there was less.
Perceptions of change in people’s personal lives
On the question of whether things had changed in community members’ personal lives, respondents were given three options: on the way up, on the way down, or no change. Overall, just over half (54%) indicated that their lives were on the way up, 44 per cent said there was no change and 2 per cent said their life was on the way down. There were no significant differences between the perceptions of men and women; however, 25–44 year olds were more likely to say that their life was on the way down than respondents in other age groups.
Having a new job, working harder and job diversity was the most commonly mentioned reason for people’s lives being on the way up (18%). Attitudes changing (12%), housing (5%), seeing changes in oneself (5%) and having a happier family life (5%) were also reasons thought to be driving positive individual change. People who said their life was on the way down cited unemployment, health issues, housing, no help, no interest in the community and boredom as the reasons for feeling that way.
4.5.2 Drivers of change
Data were investigated to identify the underlying associations between people’s perception of change in their lives and other survey responses to better understand the drivers of individual change. This analysis did not consider the level of exposure in program reform initiatives but used both the services and demographics as potential drivers or predictors. Using a logistical regression model, employment status and perception of strong leadership changes over the past three years were the strongest drivers of positive individual change. This was followed by whether the person had followed up on talks with the FRC, or used the Wellbeing Centre. Members of households with 5–10 people and those with higher levels of education also had a high prevalence of positive individual change.
Therefore, if the participant stated that:
leadership was stronger than it was three years before, they were twice as likely to state that their life was on the way up

Social change survey
133
they had completed education beyond Year 12, they were 1.78 times more likely to state that their life was on the way up
they had followed up on and done what they had talked about with the FRC, they were 1.71 times more likely to state that their life was on the way up
they or their family had used the Wellbeing Centre, they were 1.49 times more likely to state that their life was on the way up
they had 5–10 people in their household (this was the middle household size range), they were 1.41 times more likely to state that their life was on the way up
they or their family had used MPower, they were 1.40 times more likely to state that their life was on the way up
they were not working, they were 0.38 times more likely to state that their life was on the way down or that there had been no change.
4.5.3 Change segments A form of segmentation analysis was undertaken to determine whether similar people answered questions in similar ways. The quantitative survey data were analysed to identify whether there were specific segments of the communities that could be defined by three sets of variables collected in the survey: perceptions of individual change; the factors driving change; and exposure to reform initiatives and supporting services.
Based on similarities in their responses, community members were segmented into four groups. This approach is a probability-based classification in which survey participants are assigned to clusters based on the likelihood of membership of each cluster, based on the answers they gave to a wide range of questions. A ‘latent class’ segmentation model was used. The technical advantage of this technique is its ability to handle different variable types easily, including missing data. It uses the underlying distributions of the data to help identify which segment a case belongs to; that is, it uses means and variance, unlike distance-based cluster procedures.
The segmentation used probability to identify the following four segments:
1. Segment 1—Reforming and changing (positive life outcome and fully exposed to reform services and programs). These people were the most likely to state that their life was on the way up and that they had been to and followed up on FRC talks. They were likely to be in a ‘Dry Home’ program, and they or their family were likely to have used all or most services. This group were also most likely to show stronger sentiment for desirable social norms and were making an effort to change their behaviour. This group, by virtue of having a high proportion of people being asked to go to the FRC, is assumed to be a group that did not conform to social norms prior to the trial. They also still have a high probability of identified social problems in their families.
2. Segment 2—Battling on their own (slightly positive life outcome and only partially exposed, to only the FRC, and no services or programs). These people were likely to state that their life was on the way up (however, they had the lowest positive skew out of the three positive groups). They had been to and followed up on FRC talks but had not used family or education services and were less likely to have the BasicsCard. This group was also most likely to show sentiment for desirable social norms. They were making an effort to change their behaviour, but were doing so on their own without the support mechanisms of the services and programs available. It may be that they had not been referred to services, did not believe they needed services, or were not willingly accessing the services. This group, by virtue of having a high proportion of people being asked to go to the FRC, is assumed to be a group that did not conform to social norms prior to the trial.

Cape York Welfare Reform—Evaluation
134
3. Segment 3—No change, spectators to the reform (no change or negative life outcome and not exposed to any reform services or programs). These people were most likely to say there had been no change in their life or that their life was on the way down. They are not likely to have been asked to attend an FRC meeting, and as a result are unlikely to have attended or followed up on FRC talks. They or their families had not used any services or programs, and they did not see the reforms as ‘for them’. Since they had not been asked to go to the FRC, it is assumed that at least some of them are conforming to social norms. The qualitative research indicates that there may be a subset in this group who are not conforming to social norms but who have not been ‘caught out’, or that their working status has left them untouched by the reforms. Qualitative research also shows that some of this group feel that life was fine before the reforms and still is today, so the response of ‘no change’ cannot be assumed to be a negative one. This group is less likely to show sentiment for desirable social norms.
4. Segment 4—Strivers or self-help seekers (Positive life outcome and exposed to the services and programs of the reform but have not been to FRC). These people were more likely to say there had been positive change in their life. They were not likely to have been asked to attend an FRC meeting, so it was unlikely that they attended or followed up on FRC talks. They have used MPower and wellbeing services for themselves or their family and are likely to have used other services as well. Because they have not been asked to attend the FRC, they can be assumed to be conforming to social norms. However, they are seeking help, so there must be underlying reasons for this. They support desirable social norms and have tried to change their behaviour by using services.
Figure 4.1 shows the logic of the community segments and the proportions in each segment.
Figure 4.1 Community segments
Base: All survey participants, n = 582.
Among the four communities, Aurukun has significantly more Segment 1 and fewer Segment 3 respondents. Coen and Mossman Gorge have significantly more Segment 4. Hope Vale has significantly more Segment 3 and less Segment 1.
Segment 3 has significantly fewer women than men, and Segment 4 has significantly more women than men. Qualitative research shows that the women are more likely to identify problems and seek help, and that men are more likely to refuse to talk about problems or seek help.
Given that some of the triggers for FRC involvement are child related, it is unsurprising that Segment 1 is more likely to be living with children and that Segment 3 is less likely to be living with children.
1, 19%
2, 18%
3, 45%
4, 18%Exposure to FRC
Exposure to services
Individual life
outcome
Been to FRC and followed up
on talks?
Used services?
Used services?
Segment 1 Way up
Segment 2 Way up
Segment 4 Way up
Segment 3 Way down/No
change
No
Yes
No
No
Yes
Yes

Social change survey
135
Segment 2 respondents are more likely to live on their homelands, and Segment 3 less likely.
Segment 3 is more likely to include young people 16 to 24 years old and old people aged over 65 years. The other segments are more likely to include middle age groups. Segment 1 is less likely to include those over 65 years.
Segment 2 respondents are less likely to have a higher than school-level education.
4.5.4 Perceptions of social issues
Children’s education
Consistent with respondents’ perception that more children had been going to school over the past three years, three-quarters of the 214 community members who had children of school age in their households reported that their child attended school on a daily basis (77%) or most days (10%), not many days (2%) or not at all (6%).
People who stated that they had been asked to go to an FRC conference were more likely than respondents overall to state that their child attended school most days (14%), and slightly less likely to say that their child attended every day (74%). People who said they had not been asked to the FRC were less likely than respondents overall to say that their child attended most days (4%), and a large majority said their child attended every day (82%).
Segment 3 respondents, who are mostly those not asked to go to the FRC, were more likely than other segments to state that their child went to school every day rather than most days. Spontaneous comments demonstrated that attendance is understood to be the desirable social norm, but also that parents need to support and encourage their children’s education.
Of the 214 community members with school-age children, 45 per cent felt that a statement about attending parent nights or volunteering at the school ‘sounded like them’, 66 per cent felt that the school is better in the community since the Cape York Aboriginal Australian Academy took over, and 86 per cent supported the children in the community going to boarding school during high school.
Wellbeing
Generally, people felt good about themselves, reporting that they frequently feel full of life (77%) and happy (82%), have lots of energy (76%) and feel calm and peaceful (71%).
Overall, Segment 2—people who are described above as battling on their own with slightly positive life outcomes and exposed to the FRC but not using services or programs—were more likely than the other segments to rate themselves full of life, happier, having lots of energy and feeling calm and peaceful all the time. People who were working tended to say ‘all the time’ for all four statements more often than those not working who tended to say ‘some of the time’.
There was some misunderstanding over what ‘full of life’ meant in a traditional community like Aurukun. Some people thought that if they were ‘not full of life’ that must mean that they were either dead or close to death. Therefore, they may have rated themselves very highly as being full of life all or most of the time.

Cape York Welfare Reform—Evaluation
136
The qualitative research suggested the following:
Some316 people remarked that they were happier now than they used to be because they were off gunja (marijuana) and/or grog, that they were working hard or that they had moved into a new or better house.
‘[The Wellbeing Centre and FRC] helped me with my problems.’
‘I have cut down on drinking and gambling and have started to save money.’
Some parents and grandparents said they were happier because children in their care were now going to school.
‘Helped with education needs of my children … my wellbeing is better now.’
Some people linked a more calm and peaceful community to welfare reform changes such as the FRC, MPower and the Wellbeing Centre, as well as to less binge drinking.
‘Wellbeing Centre helped me get off the grog and stop fighting at home.’
Some people in Aurukun felt that it was easier to feel calm and peaceful since the tavern closed.
Perceptions of social problems
Gunja, gambling and grog still continue to cause problems within families (about 40% reported at least one of these issues in their family). Notably, a quarter chose not to answer this question, suggesting that this figure may be somewhat understated.
Understandably, those who have been fully engaged in the reform initiatives (those in Segment 1) are those who had more significant problems in their families and were also less likely to refuse to talk about it. Segment 2 was more likely to refuse to talk about it, and that segment was less likely to use services. People who had been asked to go to the FRC were more likely to say that they had problems with grog and gunja than those who had not been asked to go to the FRC.
Young people (16 to 24 years old) were the least likely to say there were no problems at all in their family (24%). People working in CDEP were most likely to state that there were problems with grog (30%) and gunja (18%) in their family. People working for private organisations were also more likely to state that there were problems with grog and gunja in their family (29% grog, 20% gunja).
The qualitative research showed that people are changing their attitudes towards social problems. While there might still be problems in the community, the following statements show disapproval of grog and gunja.
‘Too much grog and gunja coming in all the time.’
‘Gunja, grog and gambling and cause problems and I am sick of it.’
‘There's a change of attitude in people. They don't want to see grog and gunja in the community so when people sell it, people dob.’
‘I gave up sly grog a long time ago. The fines were not worth it. I woke up to myself. Now we get support.’
‘BasicsCard helps my mum stay off the grog.’
316 Qualitative summaries use ‘few’, ‘some’ or ‘most’ to give an indication of how many people feel a certain way about a particular issue. Small sample sizes and non-random selection of participants in qualitative research means it is not meant to be definitive about the proportion of participants who feel a certain way.

Social change survey
137
4.5.5 Seeking help Three-quarters of participants felt they would be willing to ask for help with their problems if they needed it (75%), a similar proportion said they would volunteer to help others (75%), and slightly more felt they would encourage their family to seek help if they had problems (82%). People aged 45 to 64 were more likely than other age groups to encourage their family to seek help (88%), ask for help themselves (81%) and volunteer to help others (88%).
People who reported no change and who are clustered in Segment 3 (described above) as spectators to the reforms were the least likely to rate the three statements as sounding ‘exactly like them’ (score 10). This segment tends not to be exposed to any reform services or programs.
When asked about the impact it would have on the community if everyone sought help for their problems, more than 8 in 10 (83%) believed that their community would be a lot better or a bit better place if everyone did so. Segment 3 were less likely to state that it would be a lot better (56%) than Segment 1, who had high exposure to services (68%). Those not working were less likely to state that it would be a lot better (53%) than those working (67%). Young people aged 16 to 24 were less likely to state that it would be a lot better (53%) than older people (64%).
4.5.6 Restoring Indigenous leadership Overall, almost three-quarters of community members felt that most people were willing to speak up and get involved (74%) and that there was respect for community leaders (71%). About two-thirds felt there was strong leadership in their community (68%) and that people worked together to fix their problems (67%).
There were also statements that there had been improvements in local Indigenous leadership and stronger leadership.
‘A lot of the elders are stepping up and being confident.’
‘Strong leadership now.’
The qualitative research suggests that inter-clan rivalry, competition and tension reduces the community’s capacity to work together to fix problems.
[This community] won't go ahead until our leaders work with the community on all issues that affect the wellbeing of this community. Unfortunately at this present time it’s me, myself and I, no-one else.
The qualitative research suggests that the community is being held back by disagreements over welfare reform at the higher levels. Some also feel that welfare reform has undermined local Aboriginal authority because welfare reform projects and the Cape York Partnership are not listening to the views of the elected council representatives and local traditional owners.
About half (51%) of participants felt that the FRC has made leadership in their community stronger, almost a quarter felt there had been no change (24%), and 13 per cent felt that the FRC had made leadership less strong in the community.
Nearly all participants considered themselves motivated to make their life better for themselves and their family (91%) and their community (82%). Approximately two-thirds also agreed that governments already do enough, so people should do more to help themselves (69%), and felt that families look after their old people (69%).
Welfare reform is working for people who want to make it work.

Cape York Welfare Reform—Evaluation
138
People who reported no change and who are described above as spectators to the reforms (Segment 3) were less likely than people in other segments to state that they are motivated to make their life better for themselves and their family (69% versus 84%).
Segment 3 had significantly more people who did not feel that leadership was strong than people who thought it was strong.
4.5.7 Participation in the real economy Half of community members reported working in the previous week (51%). Twenty-three per cent reported working in a public service position, 19 per cent reported working for private organisations and 9 per cent reported working in CDEP or equivalent positions. Segment 4 was more likely than the other segments to report working in the private sector (20% versus 11%).
Of the 291 people who were not working, 73 per cent would be willing to take a good job in the community and 56 per cent felt they would be willing to leave the community if they were offered a good job. Over a third of people who were not working felt that they did not have the skills or confidence to look for a job (37%). People in Segment 2—described above as battling on their own with slightly positive life outcomes, exposed to the FRC but not using services or programs—were less likely to say that they did not have the skills or confidence to look for a job than the other segments (4% versus 11%). Segments 2 and 3 were less likely to say that they would take a good job in the community, and Segment 1—described above as reforming and changing (with positive life outcomes and fully exposed to reform services and programs) was the least likely to leave the community for a good job.
Among the 295 people who had worked in the past week, around 7 out of 10 (71%) felt they would be willing to leave the community if they were offered a good or better job.
When asked about perceptions of other people’s attitudes towards working in the community, 6 out of 10 community members (62%) agreed that ‘Most people if offered a good job in this community would take it’. Just under half (48%) also felt that ‘Most people if offered a job outside of the community would take it’.
4.5.8 Housing
Ninety-four participants in the survey (15%) lived in a ‘dry home.317 Of those, 81 per cent said it was working well for them and their families. Most (71%) felt supported by the FRC, the Wellbeing Centre, the police and the Parenting Program. Generally, they felt that the support helped inform people about the decision to have a dry home, but 9 per cent felt there was no support. Segment 1 members are more likely to have a dry home than other segments (29% versus 12%).
Community members were asked about their beliefs about keeping their home neat and tidy and wanting to make it a nice place for their family to live. Most people felt that they wanted to make a nice place for their family to live in (95%) and that it was easy to keep their home neat and tidy (86%). While most participants desired to have neat and tidy homes, standards of cleanliness, even in terms of the relative standard observed in these communities, were observed to vary greatly. Some also felt that overcrowded housing, with relatives coming and going on a daily or weekly basis, also made it harder for people to keep their houses clean. Women were more likely than men to want to have a nice home (score 10—77% versus 69%).
Over half the community members (58%) were interested in using a home ownership scheme in the future. Sixteen per cent were not sure whether they would be interested, suggesting that there was perhaps a lack of understanding about this offering. Another common response to this question was
317 Dry place declarations in the home are included in community alcohol management plans. Households can declare their house to be a ‘dry home’ where alcohol cannot be consumed or brought into the home.

Social change survey
139
that ‘it all depends’ on such things as how much extra people would have to pay, how nice their house would be, and where in the community it would be located.
A lack of certainty about these issues contributed to some people being very cautious in their answers. CBSR suggests using caution with this finding, and that further research may be required when all of the details of the scheme can be tested.
Those aged 65 years or older were less likely to show interest in using a home ownership scheme (23% said yes) compared to the 16–24-year age group (48%) and the 25–64-year age group (64%). Those who were working were more likely to be interested in a home ownership scheme. Segment 1 was more likely to be interested in home ownership than other segments (64% versus 54%).
4.5.9 The impact of reform initiatives
Programs and services
Just over two-thirds of community members (69%) mentioned that they or a member of their family had used one or more of the services provided by the CYWR trial. MPower was the most commonly used service at 42 per cent, followed by the Wellbeing Centre (39%) and employment services (31%).
The following demographic differences were observed:
Services were most commonly used by community members aged 24 to 64 years than by young people 16 to 24 years old or people over 64 years.
Men were more likely than women to say they had not used any of these services (30% versus 14%).
Women were more likely than men to use MPower (53% versus 31%), a Wellbeing Centre (47% versus 31%), the Parenting Program (23% versus 7%) and Student Education Trusts (33% versus 12%).
After it was determined which services participants had used, they were asked whether or not the services they used were helpful. Two-thirds (66%) reported the services to be useful.
Impact of the FRC
Community members were asked about their involvement with the FRC. Forty per cent, or 236 people, had been asked to go to an FRC conference. Of those, 206 (88%) actually attended. Of the 206, nearly all (194, or 90%) said that they followed up and did what they talked about with the FRC. Of those who followed up, 66 per cent said that FRC made things better for them.
Young people (16 to 24 years old) were more likely than older people to say that following up on their FRC talks made things better for them (79% versus 66%).
Two-thirds (66%) of community members felt that the community would be a better place to live if everyone followed up on their talks with the FRC and did what was discussed at the FRC conference. Only 7 per cent felt it would make the community a bit worse. Segment 1 was most likely to say that things would be a lot better (41%).
Overall, over half the community members (56%) felt the FRC was good for the community. Around the same proportion wanted the FRC to keep helping people (55%) and felt that they supported people when they are being helped by FRC (58%). Smaller proportions felt that there was less humbugging/cadging (40%) or that it was easier to say no to humbugging since the FRC started (42%).
Overall, 65 per cent of community members felt that people should go to the FRC if they don’t take their kids to school. Segment 1 (81%) and Segment 2 (75%)—those who had been to the FRC—were

Cape York Welfare Reform—Evaluation
140
more likely to agree with that statement than Segment 3 (63%) and Segment 4 (64%)—those who were not exposed to services and had not been to the FRC.
Impact of the BasicsCard
Community members were asked a series of questions in relation to the BasicsCard. A fifth (20%) of had a BasicsCard at some point in time. Of those, 78 per cent reported that it made their life better.
Overall, 69 per cent of all community members agreed that if people spend their money on things other than rent and food, and then cannot pay for their rent and food, they should be put on the BasicsCard.
4.5.10 What still needs to happen?
Participants were asked to provide their ideas about what would make their community a better place to live. Verbatim comments were recorded as first, second and third most important. Responses were coded and then weighted by the level of importance.
Overall, more houses and more development (19%) was the most important issue; the creation of employment was the second most important issue (18%).
The verbal responses showed a desire for employment to be created through the building of new houses.
The type of jobs created was also important. People spoke about training that leads to real (lasting) jobs for local people, and especially for the young people (7%).
The third most important thing to make the community a better place to live was more activities and services for young people, or the continuance of activities for young children (13%). More kids going to high school / boarding school / kids enjoying school (7%) and help for people to stop alcohol use, gunja use, gambling and family violence and improve parenting (6%) were also mentioned.
Ideas that people had to improve their community that specifically speak to the mechanics of the reform initiatives involved consultation (4%), and working together and more equality in decision-making (3%).
Service providers
‘All service providers on same page.’
‘All service providers working together, better structure for FRC and clan leaders and justice group.’
‘Outside agencies should work with council and community.’
‘Have service providers come out and about.’
‘Service providers need to get out into the community.’
Consultation, communication, community responsibility and equity
‘Consult directly with community about what is needed to help the community, do things the way they want things done in a way they understand.’
‘When setting up groups and committees get a cross-section of the community.’
‘People to communicate a whole lot more in this community.’
‘Community needs to meet on a regular basis to talk about our problems.’

Social change survey
141
‘People running the place from outside should be within the community.’
‘Government people should come and talk to community people and not one person outside who live outside of this community.’
‘Hard to say. Maybe people can start talking for themselves instead of government.’
‘More communication between community and government.’
Finally, there were a few comments from people who spoke about ‘what would the community be like if it was better’ and who made aspirational statements about social norms.
‘When we are working together as one, then we will be strong place.’
‘When every one of your nephews and nieces graduate from school, college or university and find a good job would be nice.’
‘When more elders talk to people in community about being good people it will be better.’
‘Leadership will make our community a better place to live and for our future generations.’
‘We are making a better place for our children to live in and to grow up in so they can be proud of their community.’
‘Involve the whole community in culture. Important to hand down culture to younger generation so they know their history, their identity, grandparents and what they done, know who they are, what they are and what they stand for.’
‘Everybody in community to be proud of themselves and their children and to lead their family into the future.’
‘To live as a community, to have a proud community.’
Most significant challenges for communities
The significant challenges voted for across all four communities were:
more houses or improved housing (19%)
more jobs or lasting employment (18%)
more activities for young people (13%).
Each community had slightly different priorities (Table 4.3).

Cape York Welfare Reform—Evaluation
142
Table 4.3 Most significant challenges for the future
Aurukun Coen Hope Vale Mossman Gorge 1st More houses More real lasting jobs for
local people, especially for young people.
More real lasting jobs for local people, especially for young people.
Service providers working together more.
2nd Keep culture strong, more investment in homelands, taking kids out bush.
More houses. More houses. More real lasting jobs for local people.
3rd More jobs.
Services like council and Cape York Partnerships (MPower, Wellbeing Centre, school) working together better.
More training that leads to real lasting jobs for local people, especially for young people.
More activities for young people.
4th Stop the violence.
More activities and services for young people.
Keep the animals out of town (horses, cattle and mangy dogs).
Help stop the grog, gambling and violence.
5th More activities, sports, music, discos for young people.
More access to fuel in wet season.
Everyone treated equally; no favouritism for some families over others.
Improved housing.
4.6 Conclusions The social change survey measured the current perceptions, attitudes and feelings of community members. This research tells us that people perceived that there had been positive changes in the community since the introduction of the CYWR trial three years before, particularly in relation to more houses, services and infrastructure; more employment; more kids going to school; and, to a lesser extent, changes in attitudes to parenting and seeking help. However, progress on issues such as grog, gunja and gambling, violence, vandalism and delinquent youth (such as young people walking around at night and getting into trouble) has been less pronounced, and community members felt that more needs to be done to mitigate these problems.
A comparable measure of people’s beliefs and attitudes prior to the CYWR trial was not undertaken. Therefore, we cannot conclude whether there have or have not been changes in social norms. Both the quantitative and the qualitative data from the research show us that prosocial norms are present. While there are still perceived social problems, the qualitative research shows that community members have expressed a desire to reduce those problems.
Where community members have been exposed to the CYWR trial services and programs (including the BasicsCard and the FRC), most of them felt that this had made things better. There was general support for the FRC and for the BasicsCard to be used as a measure to help people get their children to school or pay for food and rent.
To improve the operation and effectiveness of the CYWR trial, community members wanted more communication, consultation and more of a feeling that they and their representative structures, such as local councils, are being listened to. Moving closer towards what community members feel is a genuine partnership would enhance engagement with welfare reform initiatives, programs and services. Research participants suggested that combining the activities of the FRC with existing local justice groups or councils of elders groups would be one way to achieve this.
If changes in social norms, behaviour and perceptions of community members are to be identified over time, the social change survey would need to be repeated in the future. It may be too soon to tell whether the CYWR trial is making a difference. The results of this survey should be used to better understand the perceptions of the community—information that is vital to the improvement, enhancement and sustainability of the CYWR.

Social change survey
143


Authority, leadership and social norms
145
5 Authority, leadership and social norms
Katherine J Reynolds, Emina Subasic and Benjamin Jones, Research School of Psychology, The Australian National University, Canberra
5.1 Introduction Chapter 5 provides a closer look at the theory of social and behaviour change underpinning the CYWR trial: the relationship between authority endorsement, strong leadership, responsibility beliefs, and community outcomes.
A critical question for this evaluation is whether there is any evidence to date that the FRC and related elements of the Cape York Welfare Reform (CYWR) trial have impacted on community leadership and individual and family responsibility, and which, if any, of those factors are important in understanding self-reported current community behaviours and perceptions of behaviour change.
While Chapter 4 looks at people’s attitudes and perceptions about the CYWR trial, this chapter looks more closely at the responses from the social change survey and extends on the work of the previous chapter from a social psychology framework. This is because the theory of social norm and behaviour change that underpins the CYWR trial is grounded in social psychology, and this field of study has long been interested in how groups shape behaviour, with social identity318 playing a key role in predicting, describing and explaining group behaviour in various contexts.
Of particular interest for this chapter are some explanatory variables from the social change survey:
endorsement of the Family Responsibilities Commission (FRC) (e.g. ‘I want the FRC to keep helping people’)
perceptions of strong leadership (e.g. ‘There is strong leadership in this community’, ‘Most people in this community have respect for the community leaders’)
levels of individual and family responsibility (e.g. ‘I want to work hard to make things better for myself and my family’, ‘I am motivated to make things better for my community’).
Note that there may be other structural and demographic variables which could have been predictive of community change and current behaviour, but since the focus of this report is explicitly on the CYWR trial logic, including the role of the FRC and associated leadership and social norm processes, these were the explanatory variables included in the subsequent analyses.
An insight into group memberships and social identity processes is important in understanding attitude and behaviour change. When people define themselves as members of a particular group they tend to adopt that group’s norms, values and beliefs. Group norms shape people’s behaviour because they become ‘self’; they come to define ‘who we are’ and make the coordination of attitudes, goals and behaviour possible. The more people think a group is important and self-defining for them, the more likely they will be to act in line with the norms, values and beliefs that define that group. According to social identity theory and self-categorisation theories, this is because norm change happens at the group or community level, rather than individually. In other words, it is a group-based
318 H Tajfel, ‘La catégorisation sociale’, in S Moscovici (ed.), Introduction à la psychologie sociale, Larousse, Paris, 1972, pp. 272–302, p. 31.

Cape York Welfare Reform—Evaluation
146
process, wherein a change in ‘our’ shared aspirations and goals can produce change at the level of individual attitudes and behaviours.
Understanding how group memberships can influence social norms is relevant to the CYWR trial. If norms are a set of guidelines for how people think, feel and behave, then when the current standards are in focus, ‘descriptive norms’, people will adhere to them. However, people will be more likely to adhere to ‘aspirational norms’ if what people (as group members) ought to do is in focus. Where there is a problem with current behaviours (e.g. high rates of binge drinking), focusing on the descriptive norm (how widespread a behaviour actually is) or aspirational norm can lead to a shift in positive social behaviour, as people strive to meet the approved norms, goals and values of their group.
In the four CYWR trial communities, aspirations or aspirational norms are already held by some, but for others different group memberships and associated standards are at work. In order to encourage people to adopt aspirational norms that can lead to long-term positive behaviour changes, this chapter emphasises the importance of building belonging and connection to the community (and wider Australian society). This is particularly relevant to the role of the FRC and local Indigenous Commissioners.
While behaviour changes are shaped through group memberships, they are influenced in three ways. Kelman’s319 theory of influence describes three methods of influence: compliance, identification and internalisation:
Compliance occurs when people feel they do not have a choice and believe they must obey instructions. However, when a person complies with directives, their actions may be inconsistent with their beliefs, causing an internal tension referred to as ‘cognitive dissonance’.
Identification with others, such as a social leader, can play a role in influencing people. Their sense of identity is relevant to whether they bond with a leader by accepting his or her ideas. People may want to associate with particular leaders and accept their rules and values. When a person hears messages from a leader with whom they identify, they are more inclined to accept and believe what that person is saying, and less inclined to challenge or question the points raised.
Internalisation occurs when there is full internal acceptance of an idea or belief, and consistency between attitudes and behaviours. This often requires significant cognitive processing, as people need to think about what has been said and how to fit those ideas into their existing beliefs and values (or adjust them as needed). An internalised idea has to make sense to the person.
Kelman’s theory aligns with the CYWR trial in important ways. The Cape York Institute’s design report From hand out to hand up320 proposes a connection between Kelman’s theory and the CYWR trial. The report suggests that laws involve compliance: people are involuntarily and directly required to comply with the law, sometimes against their own preference. Incentives, on the other hand, involve identification: people identify with the particular behaviours which incentives encourage (e.g. FRC conferencing, Wellbeing Centres, MPower). This idea of internalisation has been developed over the last three decades of research into social identity and self-categorisation theories concerning social identity, social influence and persuasion. Importantly, norms impact on behaviour when they are internalised as part of one’s self-definition or self-concept. According to the design report, when norms are internalised by individual community members, people have taken in the values and behaviours established by the norms, and there is internal motivation to abide by and uphold the norms. Norms are ultimately much more powerful and effective in determining behaviour than laws alone, because the people concerned have internalised the values and behaviours underpinning the norms.
319 HC Kelman, ‘Compliance, identification and internalization: three processes of attitude change’, Journal of Conflict Resolution, 2(1), 1958, pp. 51–60. 320 CYI, From hand out to hand up, Cape York Welfare Reform Project, Aurukun, Coen, Hope Vale, Mossman Gorge: design recommendations, May 2007.

Authority, leadership and social norms
147
One of the key mechanisms for promoting the internalisation of norms in the four CYWR trial communities is for influential group members (leaders or leadership bodies) to play a key role in defining, shaping and reinforcing group norms. From hand out to hand up: design recommendations, states that ‘Only a small number of leaders who have internalised the norms is required in order to rebuild a social norm, even though it is likely that most community members will behave in a certain way because they “identify” with the alignment of incentives’. The FRC Commissioners play ‘an important role in changing behaviour in communities from simply complying with a law to rebuilding a social norm’.321
In order to have impact, social psychological research also shows that leaders need to be perceived as representing the group (‘being one of us’) and acting in the interest of the group. Thus, in order to be effective among those not adhering to the agreed aspirational norms the FRC would need to be seen as a legitimate authority in the eyes of those community members. It is only by achieving this that the FRC might shape the norms and values of the entire community in sustainable ways.
5.1.1 Approach to this analysis
To assess the effectiveness of the FRC, leadership and responsibility and their impact on perceptions of change and self-reported behaviours requires further analysis of the social change survey. Based on the trial logic and social psychology, this chapter examines the rationale that a shift from compliance to internalisation occurs as a result of acceptance by community members of a statutory authority (i.e. the FRC) as a legitimate authority, as well as the level of acceptance by community members that new and defining community standards are operating. Also examined is how widespread community beliefs are in terms of perceptions that things can change and are improving for community members and the community as a whole. This may be important in building further momentum towards social norm and behaviour change. This awareness that different or higher standards are achievable is referred to in social psychology as ‘self-efficacy’.322
The methods used to assess the overall aims of this chapter involved running a series of hierarchical and logical regression analyses from the 582 responses to the social change survey. This included developing appropriate and statistically reliable measures of the key variables of interest, checking for the reliability of relationships between survey questions to ensure alignment with the underlying construct, and conducting hierarchical and logistical regression to investigate which explanatory variables are better predictors of outcome variables. In addition to this, correlational analyses were also conducted and reported. Further details on the methods used are outlined below.
A distinction was made in this analysis between survey items classified as measuring explanatory variables (i.e. endorsement of the FRC, perceptions of strong community leadership and levels of individual and family responsibility) and survey items that can be classified as measuring outcome variables (perceptions of prosocial behaviour change in the community, current prosocial behaviour).
Outcome variables were further reduced to two distinct outcome variable scales: perceptions of change (i.e. child wellbeing, community engagement, leadership, community and personal improvement), and current reported behaviours and attitudes (i.e. wellbeing indicators including feeling calm, happy and full of life and energy, health support seeking, home living and community engagement). These were assessed against the three explanatory variables. The process and results are explained below.
5.2 Key overall findings On the basis of the CYWR trial logic and further analysis of the social change survey responses, we found support for the trial logic among the variables of interest in the following ways: 321 CYI, From hand out to hand up, Cape York Welfare Reform Project, Aurukun, Coen, Hope Vale, Mossman Gorge: design recommendations, May 2007, p. 52. 322 A Bandura, ‘Self-efficacy: toward a unifying theory of behavioural change’, Psychological Review, 84, 1977, pp. 191–215.

Cape York Welfare Reform—Evaluation
148
The survey found strong endorsement for the FRC, with 55 per cent agreeing ‘I want the FRC to keep helping people’, 58 per cent agreed that ‘I support people in this community when they are being helped by the FRC’, and 56 per cent agreed ‘I was not sure about the FRC when it first came in but now I see they are good for the community’.
The more respondents endorsed the FRC, the more likely they were to say that things were ‘on the way up’ (rather than ‘the same’ or ‘on the way down’) both for their community and for themselves personally.
– Respondents who reported stronger endorsement of the FRC were also more likely to report strong leadership and higher levels of improved responsibility. The majority reported that there is strong leadership and agreed that ‘there is strong leadership in (community)’ and ‘most people in (community) have respect for the community leaders’. Most people report that ‘I want to work hard to make things better for myself and my family’ and ‘I am motivated to make things better for the community’. This analysis found a strong relationship among these explanatory variables—FRC endorsement, perceptions of strong leadership and levels of responsibility.
– The next question in this analysis was whether these explanatory variables explain the responses to the outcome variables in the survey regarding perceptions of change in both community engagement and leadership. The questions used as outcome indicators were: perceptions of community engagement change (‘Most people in (community) work together to fix their problems’; ‘Most people in this community are willing to speak up and get involved’) and leadership change (‘People here show more respect for elders and leaders now than 3 years ago’). The analysis showed that survey participants perceive their communities to be working better together to solve problems and that there is more respect for elders and leaders compared to before the trial.
When considered alone, FRC endorsement contributed significantly to explaining perceptions of change in both community engagement and leadership, contributing over 20 per cent of the variance in these variables, accounting for some of the variability in people’s answers to these questions about change. If people endorsed the FRC they were also more likely to report positive change in community engagement and leadership. But we needed to test if this factor was operating alone. Adding perceptions of strong leadership and levels of responsibility to the model significantly strengthened the explanation of perceived change and also reduced the strength of FRC endorsement in explaining the levels of perceived change in community engagement and leadership. Strong leadership in particular was important in explaining perceived change. These findings suggest that it is partly through affecting leadership and responsibility that the FRC impacts on the outcomes measured (i.e. perceptions of change in community engagement and leadership).
People’s endorsement of the FRC was the most likely to impact positively on an individual’s feelings of wellbeing, attitudes to health support seeking, and their desire to improve living conditions in the home. These current behaviours and attitudes are also used in this chapter as proxy outcome indicators.
The strength of the relationship between explanatory variables (perceptions of strong leadership and levels of responsibility, in addition to endorsement of the FRC) against outcome variables (perceptions of change and current behaviour and attitudes) indicated that, although there were similar levels of support for both leadership change and community engagement, the contribution of individual predictors differed in an important way. Views about the presence of strong current leadership were found to contribute more than FRC endorsement to perceptions of leadership change. The pattern was reversed for perceptions of change in community engagement, where it was found that FRC endorsement had a stronger impact than views about current leadership. The role of responsibility was almost identical in both models.

Authority, leadership and social norms
149
Current community leadership and FRC authority therefore seem related but distinct in people’s responses. People’s views about the presence of strong current leadership are related to perceptions of leadership change (i.e. agreement that there is more respect for elders in the last three years). However, endorsement of the FRC matters more to people’s perceptions of change in community engagement. People who endorse the FRC are more likely to agree that people are working better together to fix problems and are willing to put in an effort to make the community better for themselves and family than in 2008.
In this analysis of the 582 responses to the social change survey, we found support for the theory of change. Results demonstrate that endorsement of the FRC, strong leadership and individual and family responsibility are correlated with each other and the outcome variables of interest, in line with what would be predicted by the trial logic.
In the context of social psychology concerning community norm and behaviour change, these results suggest that institutional authority, community leadership and individual and family responsibility warrant careful consideration and systematic investigation. It is also possible that widespread beliefs that things can change and are improving may be important in building further momentum towards social norm and behaviour change.
From a social psychological perspective and the trial logic, the success of the FRC (and other aspects of the trial) depends on the ongoing (re)definition and enactment of the community’s shared aspirations and goals. It is this group process that affects social norms and is a key component of producing sustainable change at the level of individual attitudes and behaviours.323
5.3 Theory and process of change A central aspect of the CYWR trial concerns social norms and social norm change. Building on theory and research across the social and behavioural sciences, the From hand out to hand up reports argue that part of the explanation for current social behaviours is a lack of social order and lack of strong positive community social norms. It is also recognised that such social norms can be changed through new institutions (such as the FRC), services and incentives.
More specifically, drawing on the work of Kelman324, norm and behaviour change is conceptualised on a continuum from compliance to identification to internalisation. Compliance relates to a change of behaviour due to extrinsic rewards and punishments (e.g. the enforcement of laws), whereas internalisation denotes a shift towards intrinsic and self-reinforcing behaviour change.
It is argued that a central aim of the CYWR trial is to restore social norms and local Indigenous authority. The introduction of the FRC is a critical part of the trial, as it is a key mechanism for shifting behaviour from compliance-type responses to internalisation.
Based on the trial documents, one way to conceptualise the FRC is that it is an authority with powers to uphold social order through compliance-type incentives (e.g. do X to ensure payment Y). As a result, the community should experience respite from negative events and have direct evidence that things ‘can improve and be different’. This awareness that different or higher standards are achievable is referred to in social psychology as ‘self-efficacy’.325 Specifically, when one has high self-efficacy, one is more likely to initiate and persist with behaviours aimed at achieving a desired result. Empirical evidence suggests that high levels of self-efficacy predict behaviour change in a variety of
323 JC Turner, KJ Reynolds & E Subasic, ‘Identity confers power: the new view of leadership in social psychology’, in J Uhr & P ’t Hart (eds), Public leadership: perspectives and practices (pp. 57–72), ANU E-Press, Canberra, 2008. 324 HC Kelman, ‘Compliance, identification and internalization: three processes of attitude change’. 325 A Bandura, ‘Self-efficacy: toward a unifying theory of behavioural change’.
Cape York Welfare Reform—Evaluation
150
domains; including social skills, smoking cessation and sports performance.326 A belief that things can change and improve can build community momentum towards social norm and behaviour change.
But the FRC is also designed to build wider consensus around a (new) set of values and beliefs concerning what is appropriate behaviour and to ensure that individuals and families are supported in ways that enable such behaviour to flourish. To the extent that it is seen as a legitimate authority, the FRC thus serves an important leadership function. Senior members of the FRC are Indigenous, and local Indigenous counsellors and elders are in place to support the community members and the activities of the FRC. Such leadership is considered vital in influencing others through clarifying and communicating a new community narrative and identity (‘who we are’), building cohesion and mobilising the community to work more effectively together to solve problems, and modelling behaviour surrounding the new emerging social norms (that the FRC is working to shape and uphold).
Another way to think about the FRC, therefore, is that it is a place where the meaning of being a community member and associated ‘norms’ are negotiated and defined. It reflects and clarifies for all members of the community the specific behaviours that are considered acceptable or unacceptable.
It also serves to support individuals and families, through case management and the coordination of services, to develop the skills and capabilities necessary to participate and live up to the (aspirational) community standards.
It is expected that over time these behaviours will become internalised as a new community standard and will be self-reinforcing. An indication of internalisation will be evidence that individuals and families are taking more responsibility for their economic and social conditions and are working better together to improve community life. This process is shown in Figure 5.1, which shows how the activities of the FRC are intended to create change in community functioning at the observable behavioural level through a process of social norm change, strengthening community leadership and evoking a sense of individual and family responsibility. Conceptually, therefore, people’s engagement with and endorsement of the FRC, as well as their perceptions of strong leadership and internalisation of individual/family responsibility norms, are explanatory variables that make change in current behaviours possible.
The theory of social norm and behaviour change that underpins the CYWR trial is well grounded in social psychology theory and research. In this chapter, the aim is to explain in more detail the social psychology of social and behavioural change and then apply this analysis to the responses from the trial social change survey. A critical question is whether there is any evidence to date that the FRC and related elements of the CYWR trial have impacted on community leadership and individual and family responsibility and whether these factors are important in understanding perceptions of behaviour change and self-reported current community behaviour.
326 For a review, see A Bandura, Social foundations of thought and action: a social cognitive theory, Prentice Hall, Englewood Cliffs, NJ, 1986.

Authority, leadership and social norms
151
Figure 5.1 Conceptual representation of explanatory variables shaping outcomes such as community behaviour and behaviour change
5.3.1 How norms, identity and leadership affect behaviour and functioning
In social psychology there is a direct focus on the impact of group norms, values and beliefs on individual behaviour and functioning. Social norms are accepted or implied rules on how group members should or do behave. They define for group members what are the appropriate or ‘right’ attitudes and behaviours. Often the term descriptive norm is used to describe the current group standard for behaviour (‘what we do’) and the term injunctive or aspirational norm is used to describe the more desirable standards of behaviour (‘what we should or ought to do’).327
If norms are a set of guidelines for how we think, feel and behave, then when the current standards (a descriptive norm) are in focus people will adhere to them. However if what we, as group members, ought to do (an aspirational norm) is in focus, people will be more likely to adhere to them. Where there is a problem with current behaviours (e.g. high rates of binge drinking), focusing on the descriptive norm (how widespread a behaviour actually is) or aspirational norm can lead to a shift in positive social behaviour, as people endeavour to meet the approved norms, goals and values of their group.
Initial stages of the CYWR trial involved discussions in communities regarding life in the community—what is good about living in the community and what is bad about living in the community. This process was followed up with more detailed discussions about community values and community aspirations in areas such as education, child wellbeing, healthier living and respect for elders. As a result, a set of community values that can be understood to represent aspirational norms were defined (see Table 5.1).
327 RB Cialdini, RR Reno & CA Kallgren, ‘A focus theory of normative conduct: recycling the concept of norms to reduce littering in public places’, Journal of Personality and Social Psychology, 58, 1990, pp. 1,015–26.
Functioning of FRC through CYWR
trial (July 2008) plus activities in education, housing and creating
economic opportunity
Outcome
Sustained behaviour change in line with community aspirations
Explanatory processes
Social norm change
Strong leadership
Individual and family responsibility
Capabilities

Cape York Welfare Reform—Evaluation
152
Table 5.1 Community values that represent aspirational norms for CYWR communities
CYWR trial, 2006–2007 Engagement phase We will respect ourselves, our families, our children and our place. We will love our children and will do everything to nurture, protect and educate our children. Our community will be a place that works together to build a better place for our children and families. We will be an example for other communities in the Cape by addressing our problems with alcohol, drugs, gambling, violence, and welfare dependency so that we can lead healthier, more active lives. We acknowledge the importance of ‘hard’ work as a key to open the doors to the good life. Work is central for the survival of our culture. We will honour and protect our culture. We value the rules that our old people set through our culture, they guide us and teach us to be respectful and wise.
The impact of social norms on behaviour is recognised in many disciplines in the social and behavioural sciences (e.g. sociology, economics). While some disciplines have difficulty explaining the process through which social norms come to impact directly on one’s attitudes and behaviour, social psychology has devoted considerable attention to the question of how groups shape behaviour.
One central mechanism is social identity. An important insight is that people can define themselves as individuals (‘I’ and ‘me’) and as group members (‘we’ and ‘us’). Personal identity or the personal self is used to describe situations where individuals perceive themselves to be distinct and different from others (‘I’ and ‘me’). On the other hand, a social identity or the social self (‘we’ and ‘us’) refers to an individual’s ‘knowledge that he [or she] belongs to certain groups together with some emotional and value significance to him [or her] of the group membership’.328
When people define themselves as members of a particular group they take on the norms, values and beliefs of the group. So group norms come to shape behaviour because they become ‘self’; they come to define ‘who we are’ and make the coordination of attitudes, goals and behaviour possible. The more people think the group in question is important and self-defining for them, the more likely they will be to act in line with the norms, values and beliefs that define the group.
This insight into group memberships and social identity processes is important in understanding attitude and behaviour change. Norm change is something that happens at the level of the group or community, rather than individual by individual. In other words, it is a group-based process whereby a change in ‘our’ shared aspirations and goals produces change at the level of individual attitudes and behaviours.
For many in the CYWR trial communities, aspirations or aspirational norms (see Table 5.1) already shape behaviour, but for others different group memberships and associated standards are at work. It is necessary to build belonging and connection to the community (and wider Australian society) so that the broader aspirational norms can have a sustainable impact on behaviour.
Importantly, influential group members (leaders or leadership bodies) are an integral part of defining and shaping group norms. Research demonstrates that, in order to have impact, leaders need to be perceived as representing the group (‘being one of us’) and acting in the interest of the group or community of interest. Thus, in the context of the CYWR trial, in order to be effective among those not adhering to the agreed aspirational norms, the FRC would need to be seen as a legitimate authority in the eyes of those community members. It is only through achieving this that the FRC would be able to shape the norms and values of the entire community in sustainable ways.
In line with this theory and research, the endorsement of the FRC is a critical first step in the FRC having influence and impact on community norms and behaviour. To move beyond compliance to internalisation, the FRC needs to be accepted as a legitimate authority. Through this process it is expected to have impact in defining (new) community standards, strengthening leadership, and building norms of individual and family responsibility. 328 H Tajfel, ‘La catégorisation sociale’, p. 31.

Authority, leadership and social norms
153
5.4 Design and limitations of this analysis
5.4.1 Survey questions A social change survey connected to the outcomes evaluation of the CYWR trial was administered among a broad range of residents, across various communities within which the trial was implemented.
The survey was designed in consultation with a range of parties and implemented in the field by Colmar Brunton Social Research. Its primary purpose was to assess community perceptions of the impact (positive or otherwise) of the CYWR trial, along a variety of key dimensions. The survey was administered one-on-one by an interviewer.
Participants were contacted from various sections of each community and asked whether they were willing to participate. If the participant agreed, the interviewer would then go through the survey with the participant. The survey proper was broken up into various sections, asking questions about:
demographics (e.g. gender, age, residential status)
perceptions of community change (e.g. antisocial behaviours, child wellbeing, community leadership)
education (e.g. child school engagement, parent education levels)
employment (e.g. employment status, type of employment)
housing (e.g. home tidiness standards, ownership intentions)
wellbeing (e.g. feeling calm, happy, full of life and energy, health problems, substance abuse issues, willingness to seek help)
leadership and responsibility (e.g. perceived community leadership and solidarity, willingness to take responsibility)
the FRC (e.g. FRC attendance, perceived impact of the FRC)
programs and services (e.g. service usage, perceived service benefits)
overall impressions (e.g. overall community improvement, overall personal life improvement, reasons for improvement).
5.4.2 Model for analysis Given the reasoning underpinning the trial, and related social psychological theory and research, it is possible to go beyond demographics and description and to explore a range of relationships among central variables measured in the survey. In particular, it is possible to distinguish between explanatory and outcome variables. For example, in the context of the CYWR trial and the trial logic (see Figure 5.1), endorsement of the FRC by community members, strong leadership and individual and family responsibility are seen as predictors or variables that explain observed changes (or lack thereof) in people’s behaviour. They should also be positively related to each other, so that the more people endorse the FRC, the stronger they perceive community leadership to be and the more likely they are to subscribe to individual/family responsibility values promoted by the trial. In turn, these explanatory variables should predict a range of trial outcomes, as described below.
Of particular interest for this chapter are the following explanatory variables:
endorsement of the FRC (e.g. ‘I want the FRC to keep helping people’)
perceptions of strong leadership (e.g. ‘There is strong leadership in this community’, ‘Most people in this community have respect for the community leaders’)

Cape York Welfare Reform—Evaluation
154
levels of individual and family responsibility (e.g. ‘I want to work hard to make things better for myself and my family’, ‘I am motivated to make things better for my community’).
Note that there may be other structural and demographic variables which could have been predictive of community change and current behaviour, but since the focus of this report is explicitly on the CYWR trial logic, including the role of the FRC and associated leadership and social norm processes, these were the explanatory variables included in the subsequent analysis.
Outcomes of the trial include perceptions of change when comparing community life before the beginning of the trial and at survey, and also self-reported current behaviour. It is possible to assess the kinds of behaviour that are currently evident within the communities against the standards defined by the aspirational norms (see Table 5.1). More specifically, the social change survey also included items to assess perceptions of behaviour change (e.g. ‘In the past 3 years have you noticed any change with children in this community?’, ‘People in this community are working better together to fix problems now than they were 3 years ago’) and current behaviour, such as seeking health support (e.g. ‘I am willing to ask for help with my problems when I need it’, ‘I encourage my family to seek help when they have problems’) and community engagement (‘Most people in the community work better to fix their problems’, ‘Most people in the community are willing to speak up and get involved’).
5.4.3 Limitations There are a variety of limitations with a cross-sectional survey (conducted three years into the trial) when it comes to drawing conclusions about the impact of the trial and evidence of social norm and behaviour change. Two notable limitations are the lack of baseline measures or a comparison ‘control’ group or community (who have ‘matched’ features but who were not exposed to the interventions). If similar measures had been obtained before the trial was announced, it would be possible to better analyse whether things had changed by comparing data across time. Such a design, however, still makes it difficult to assess the actual impact of the trial per se. It is possible that other factors, such as time and broader policy initiatives independent from the trial interventions, could explain any observed change.
Given the lack of an experimental design, it is possible to highlight a relationship between the explanatory and outcome variables but not to determine whether one variable (or a different variable not assessed, for example) causes the relationship. Even so, there are sound theoretical and logical reasons to distinguish the explanatory from the outcome variables in the present model, which supports the analysis strategy.
There are some other limitations pertaining more to the construction and administration of the survey itself. First, the questions are positively framed, such that there could be some acquiescence on behalf of the participants, artificially inflating the relationship between some measures. Second, given that the participants were in the presence of others while performing the survey (most notably the interviewer), there could have been a tendency to report more positive change or better outcomes as a function of social desirability concerns. Third, in this survey respondents were asked specifically to make comparisons between ‘before the trial and now’, which required them to remember community life three years prior and make comparisons to the current day. Such judgements are open to a range of issues concerning memory and recall. Finally, the survey items were designed with concerns around the survey’s length and complexity, which meant that many areas could not be assessed in detail.
In the next section we look more closely at whether there is evidence to support these predictions that emerge from the alignment between the CYWR trial and current social psychological theory and research, and social and behavioural change processes.

Authority, leadership and social norms
155
5.5 Analysis of social change survey data, with a focus on the FRC, leadership and responsibility
5.5.1 Analysis strategy
The analysis strategy involved a number of stages that included two steps.
Step 1: Developing appropriate and statistically reliable measures of key variables (e.g. endorsement of the FRC, leadership, responsibility, perceptions of behaviour change, current behaviour) and providing descriptive statistics (means, standard deviations, distributions) for those variables.
Regarding the formation of scales described in tables 5.3 and 5.4, using reliability analysis it is possible to assess the relationships between individual survey items or questions to determine whether they are measuring the same underlying construct. So, for example, responses to three separate questions deemed to be measuring FRC endorsement (‘I want the FRC to keep helping people’, ‘I support people in this community when they are being helped by the FRC’, and ‘I was not sure about the FRC when it first came in but now I see they are good for the community’) were first tested for reliability—whether or not they form a reliable overall measure of this construct. A reliable scale is composed of items that have a similar pattern of responses for each participant (e.g. if a person is someone who highly endorses the FRC, their ratings of each separate question measuring FRC endorsement should also be high). A reliability coefficient (Cronbach’s alpha) greater than .65 indicates that the items reliably measure an underlying construct. For FRC endorsement, a Cronbach’s alpha of .93 indicates very high reliability and means that participants’ responses were very similar across each of the three items, warranting the creation of the FRC endorsement scale. The scale was constructed by averaging participants’ responses on the three separate ‘FRC endorsement’ items, giving us an overall assessment of the extent to which each participant endorses the FRC.
Step 2: Hierarchical regression (and logistic regression for variables with categorical response options such as ‘more’, ‘less’, ‘on the way up’, ‘on the way down’, ‘about the same’) was used to investigate whether some explanatory variables (FRC endorsement, leadership, responsibility) are stronger or better predictors of outcome variables (perceptions of behaviour change, current behaviour). This is achieved by testing models in which explanatory variables compete with each other for predictive power in a given outcome. Correlational data are also to be reported.
5.5.2 Defining explanatory and outcome variables Before discussing the findings in more detail, it is necessary to define key explanatory and outcome variables.
The explanatory variables centre on concepts of Indigenous leadership and internalisation of personal/family responsibility, in line with the trial logic and related social psychological research, and include FRC endorsement, leadership and individual/family responsibility (see Table 5.2).
Outcome variables are divided into two groups: perceptions of change and current behaviour. In the following sections, we first focus on scale formation and descriptive statistics—explaining how key measures were constructed (e.g. what specific questions were used in combination to measure a particular construct) and what the mean level or average responses were for each construct. Then the relationships between constructs are explored in more detail, focusing in particular on expected patterns of correlations and the extent to which the findings are in line with the trial logic (Figure 5.1; see below for more detail).

Cape York Welfare Reform—Evaluation
156
Table 5.2 Definition of key explanatory and outcome variables
Key explanatory variables Perceptions of change Current behaviour and attitudes Endorsement of the FRC Child wellbeing change Wellbeing Leadership Community engagement change Seeking health support Responsibility Leadership change Home living Community improvement Community engagement Personal improvement
5.6 Step 1: Scale formation and descriptive statistics
5.6.1 Key explanatory variables All of the key explanatory variables were assessed on a 10-point scale (1 = ‘nothing like me’ to 10 = ‘exactly like me’) and were shown to be highly reliable (Cronbach’s alpha well above .65). Table 5.3 shows that average levels of FRC endorsement, leadership and responsibility were all above the midpoint of the scale (5.5). These results indicate that community members are supportive of the FRC, perceive strong leadership in communities and are quite highly motivated to work hard to make things better for themselves, their family and the community more broadly.
Table 5.3 Scale formation details and descriptive statistics for the key explanatory variables
Scale name Items Alpha n Mean SD FRC endorsement (1–10 scale)
I want the FRC to keep helping people .93 519 6.97 3.01 I support people in this community when they are being helped by the FRC
I was not sure about the FRC when it first came in but now I see they are good for the community
Leadership (1–10 scale)
There is strong leadership in this community .844 542 6.72 2.58 Most people in this community have respect for community leaders
Responsibility (1–10 scale)
I want to work hard to make things better for my family .78 558 8.82 1.78 I am motivated to make things better for my community
SD = standard deviation; n = number
5.6.2 Outcome variables—perceptions of change
Measures of perceptions of change are shown in Table 5.4. These include community engagement change, child wellbeing change, community improvement and personal improvement.
Perceptions of community engagement change (‘People are working better together to fix problems than in 2008’, ‘People are willing to put in an effort to make the community better for themselves and family than in 2008’, alpha = .76) and leadership change (‘People show more respect for elders than in 2008’) were assessed on a 5-point scale (1 = strongly disagree, 5 = strongly agree). On average, both community engagement change (M = 3.65) and leadership change (M = 3.19) were rated above the midpoint of the scale. These results indicate that, on average, survey participants perceive their communities to be working better together to solve problems and that there is more respect for elders and leaders compared to before the trial started.
Child wellbeing change was measured with a 3-point scale assessing whether, in the past three years, there had been an increase (‘more’), no change (‘about the same’) or a decrease (‘less’) in a particular outcome. Responses to four single-item measures of child wellbeing (healthy eating, child activity, happiness and respect for elders) were analysed separately. Since these are categorical (rather than continuous) measures, it is possible to look at proportions of responses in each category. Overall, more people perceived positive change (compared to no change or negative change) for the following aspects of child wellbeing change: healthy eating (more = 51.2%, same = 38.7%, less = 10.0%), child activity (more = 62.3%, same = 26.8%, less = 10.9%), and happiness (more = 54.9%,

Authority, leadership and social norms
157
same = 36.5%, less = 8.6%). However, perceptions were more ambivalent regarding respect for elders (more = 28.5%, same = 33.0%, less = 38.5%).
Community improvement and personal improvement were measured with a 3-point scale, assessing whether for the community, or for the respondent personally, things were generally ‘on the way up’, ‘the same’, or ‘on the way down’. The responses on this measure indicate that both community life and personal life are on the way up and improving for a large proportion of survey respondents (community: way up = 58.9%, same = 34.7%, way down = 6.5%; personal: way up = 56.1%, same = 41.4%, way down = 2.5%).
Based on understandings of efficacy and collective efficacy (see above) the perception that there had been personal and community improvement during the period of the trial could in and of itself be important in leading to increased efforts for improvement in the future.
Table 5.4 Scale formation details and descriptive statistics for the key perceptions of change variables
Variable name Items Alpha n Mean SD Community Engagement scale (5-point scale)
People are working better to fix problems now than they were 3 years ago Things are changing because people are willing to put in an effort to make this community better for themselves and their families
.762 536 3.65 1.02
Leadership change (5-point scale)
People show more respect for elders and leaders now than 3 years ago
n/a 568 3.19 1.33
Child wellbeing (3-point scale)
In the past 3 years have you noticed any change in children in terms of food?
n/a 582 2.38 0.68
In the past 3 years have you noticed any change in children in terms of their levels of activity?
n/a 582 2.52 0.68
In the past 3 years have you noticed any change in children in terms of happiness?
n/a 582 2.46 0.65
In the past 3 years have you noticed any change in children in terms of respect?
n/a 582 1.88 0.80
Community Improvement
Thinking about all these questions and thinking about you community, do you think the community is on the way up, way down, or has stayed the same?
n/a 572 2.52 0.61
Personal Improvement What about you? Do you think things are on the way up, way down or still much the same?
n/a 569 2.51 0.55
n/a = not applicable
5.6.3 Outcome variables—current behaviour and attitude measures Participants reported a relatively high level of current reported behaviours and attitudes (all means well above the midpoint of the relevant scale) that are in line with aspirational norms endorsed by the trial. Table 5.5 shows that these include self-reported wellbeing, seeking health support, home living and community engagement. In all cases, a higher score is used to indicate more positive outcomes that are in line with aspirational norms. Therefore, community members report that on these dimensions their current behaviour is broadly in line with community values and aspirations.

Cape York Welfare Reform—Evaluation
158
Table 5.5 Scale formation details and descriptive statistics for current reported behaviour and attitude measures
Scale name Items Alpha n Mean SD Wellbeing (1–4 scale)
In the past 4 weeks, how often did you feel calm and peaceful? .81 554 3.21 0.63 In the past 4 weeks, how often have you been a happy person? In the past 4 weeks, how often did you feel full of life? In the past 4 weeks, how often did you have lots of energy?
Health support seeking (1–10 scale)
I am willing to ask for help with my problems when I need it I encourage my family to seek help when they have problems
.77 556 8.82 1.92
I am willing to volunteer to help others Home living (1–10 scale)
It was easy for me to keep my home neat and tidy I want to make my home a nice place for my family to live
.75 568 9.06 1.47
Community engagement (1–10 scale)
Most people in this community work better together to fix their problems Most people in this community are willing to speak up and get involved
.77 551 6.47 2.39
5.7 Step 2: Relationships between key variables
5.7.1 Correlations among explanatory and outcome variables
In line with Step 2 of the analysis strategy, it is possible to look at the general pattern of relationships between variables and, in particular, the relationship between explanatory (measures 1, 2 and 3; see Table 5.5) and outcome (measures 5–13) variables. This analysis could not be conducted where responses were categorical (i.e. child wellbeing change, community improvement, personal improvement).
The patterns of relationships observed are in line with expectations based on the trial logic and social-psychological research (Table 5.6). When it comes to relationships among explanatory variables, those community members who reported stronger endorsement of the FRC (1) were also more likely to report strong leadership (2) and higher levels of responsibility (3).
When it comes to the relationship between the FRC and outcome variables, it is clear that those community members who endorsed the FRC were also more likely to report positive change in leadership (4) and changes in community engagement (5), as well as overall levels of community engagement (6). Endorsement of the FRC was also positively related to current aspects of community life, including wellbeing (7), seeking health support (8), and a desire to improve living conditions in the family home (9). For all of these measures, the more that people endorsed the FRC, the more likely they were also to report perceptions that things had changed for the better and behaviours were in line with aspirational community norms. Similar patterns of significant, positive relationships were also observed for the remaining explanatory variables, leadership and responsibility, so that an increase in perceptions of strong leadership and endorsement of individual/family responsibility also increased perceptions of change and current (normative) behaviours.
These results overall show us that the FRC and its endorsement are positively related to strong leadership and individual and family responsibility, and that all of the explanatory variables are also positively related to perceptions of change and current behaviours in line with the aspirational norms.

Authority, leadership and social norms
159
Table 5.6 Correlations among measures where p < .01 (correlations between explanatory and outcome variables are highlighted)
Measures 2 3 4 5 6 7 8 9 1. FRC endorsement .390 .344 .462 470 .412 .339 .448 .311 2. Leadership .216 .518 .442 .649 .275 .275 .207 3. Responsibility .225 .255 .281 .229 .529 .489 4. Leadership change .626 .427 .288 .267 .140 5. Community engagement change .412 .288 .277 .207 6. Community engagement .334 .347 .275 7. Wellbeing .311 .303 8. Health support seeking .459 9. Home living Note: In a sample of this size, very small correlations are often significant but may not be meaningful. Therefore, only those outcome variables that correlated with FRC endorsement (as the central explanatory variable) at r = .30 or higher were included.
5.7.2 Distinguishing between the contributions of different explanatory variables
It is also possible, using hierarchical and logistic regression analyses, to investigate the strength of the relationships between the predictor variables (FRC endorsement, leadership and responsibility) and outcome variables. This allows an exploration of the relative contribution that leadership and responsibility play in addition to endorsement of the FRC in explaining variance in the outcome of interest. In these analyses, a relationship of approximately ß = .10 (where ß is the standardised regression coefficient) or greater is considered to be noteworthy.
It is also possible to examine whether, as the trial logic suggests (see Figure 5.1), the impact of the FRC on the outcome variables of interest is explained by the impact of the FRC on local community leadership and individual and family responsibility. Specifically, it is argued that engagement with (and endorsement of) the FRC should affect outcomes such as current behaviour directly, but also by enhancing the perception of strong Indigenous leadership and the internalisation of individual/family responsibility values.
In this section, the focus is on exploring whether this pattern of findings is evident for a range of outcomes. The explanatory contribution of FRC endorsement is accounted for first (Block 1 of the hierarchical regression) and then other explanatory factors are included in the model (leadership, responsibility; Block 2). It is expected that the overall amount of variance explained by all three predictors would be greater than the amount of variance explained by FRC endorsement alone. Further, if the strength of the relationship between the FRC and the outcome is reduced significantly when leadership and responsibility are also entered into the model, that is an indication that the trial logic is supported by the data—that a given outcome is not only a function of FRC endorsement, but also an increase in perceptions of strong leadership and endorsement of individual/family responsibility.
Note that it is only possible to conduct hierarchical regression analysis for outcomes measured on a continuous scale. For categorical variables (with response options such as ‘more’, ‘less’, ‘the same’), including child wellbeing, community improvement and personal improvement, logistic regression analyses have been conducted and are reported in Table 5.8 and further below. The key difference here is that for logistic regression all explanatory variables are considered simultaneously (equivalent to Block 2 of hierarchical regression).
As shown in Table 5.7, when considered alone, FRC endorsement contributed significantly to explaining both community engagement change and leadership change, contributing over 20 per cent of variance in these variables. Adding leadership and responsibility to the model significantly increased the amount of variance explained (as shown by a significant R2 Change statistic) and also reduced the contribution of FRC endorsement. Leadership in particular was an important additional

Cape York Welfare Reform—Evaluation
160
explanatory variable (the larger the ß, the more impactful the predictor variable is). These findings suggest that it is partly through affecting leadership and responsibility that the FRC impacts on these outcomes.
Table 5.7 Hierarchical regression results demonstrating the relationships between explanatory variables and perceptions of leadership change and community engagement change
Block 1 Block 2
ß Sig. ß Sig. Leadership change
FRC endorsement .456 < .001 .283 < .001 Leadership .377 < .001 Responsibility .082 < .05 R2 .208 < .001 .339 < .001 R2 Change .132 < .001
Community engagement change FRC endorsement .474 < .001 .328 < .001 Leadership .280 < .001 Responsibility .095 < .05 R2 .225 < .001 .303 < .001 R2 Change .078 < .001
Note: β is the standardised regression coefficient indicating the relative impact on the outcome variable of one standard deviation change in each individual predictor. R2 is a statistic indicating the overall proportion of variance in the outcome variable explained by all predictors included at a particular block or step of the regression analysis.
While the overall model accounts for a similar amount of variance for both leadership change and community engagement change, the contribution of individual predictors differs for the two outcome variables in an important way. Current leadership contributes more than FRC endorsement to perceptions of leadership change, while this pattern is reversed for perceptions of community engagement change, such that FRC endorsement has a stronger impact than leadership. The role of responsibility is nearly identical in both models.
With respect to current community life (see Table 5.8), the hierarchical regression analyses revealed a similar pattern of results. Considered on its own (Block 1), FRC endorsement contributed significantly to explaining levels of wellbeing, seeking health support and community engagement, and all three predictors were significant when entered together (Block 2). The impact of the FRC was reduced, and the overall amount of variance explained increased, with the addition of leadership and responsibility as explanatory variables (Block 2). Therefore, again we find that the impact of FRC endorsement on these outcome variables is explained at least in part by the relationship between FRC endorsement and leadership and responsibility. For home living, the pattern was slightly different. Both responsibility and FRC endorsement were significant predictors (Block 2). However, there was no significant effect for leadership.
In general, these findings indicate that endorsement of the FRC, as well as a sense of strong community leadership and taking responsibility to make things better for one’s family and the community more broadly, are important explanatory variables in accounting for current community behaviour.

Authority, leadership and social norms
161
Table 5.8 Hierarchical regression results demonstrating the relationships between explanatory variables and current behaviours (including wellbeing, health seeking behaviour, community engagement and home living)
Block 1 Block 2
ß Sig. ß Sig. Wellbeing
FRC endorsement .336 < .001 .222 < .001 Leadership .153 < .005 Responsibility .163 < .001 R2 .113 < .001 .160 < .001 R2 Change .047 < .001
Health seeking behaviour FRC endorsement .468 < .001 .289 < .001 Leadership .042 ns Responsibility .474 < .001 R2 .219 < .001 .422 < .001 R2 Change .203 < .001
Community engagement FRC endorsement .414 < .001 .153 < .001 Leadership .570 < .001 Responsibility .110 < .005 R2 .172 < .001 .468 < .001 R2 Change .297 < .001
Home living FRC endorsement .328 < .001 .148 < .005 Leadership .069 ns Responsibility .449 < .001 R2 .107 < .001 .290 < .001 R2 Change .187 < .001
ns = non-significant Note: β is the standardised regression coefficient indicating the relative impact on the outcome variable of one standard deviation change in each individual predictor. R2 is a statistic indicating the overall proportion of variance in the outcome variable explained by all predictors included at a particular block or step of the regression analysis.
It is also relevant to assess whether the relative contribution of individual predictor variables differs across each outcome variable. For wellbeing, FRC endorsement has the most impact (β = .222), while leadership (β = .153) and responsibility (β = 1.63) have similar impact. For community engagement, we can see that leadership is by far the strongest predictor (β = .570), compared to the impact of FRC endorsement (β = .153) and responsibility (β = .110). However, for both health seeking behaviour and home living, we see a completely different pattern. For health seeking, responsibility is by far the strongest predictor (β = .474), with FRC having less impact (β = .289) and leadership having a non-significant impact (β = .042). Similarly, for home living, responsibility is the dominant predictor in the model (β = .449), with FRC endorsement having less impact (β = .148) and leadership again having a non-significant impact (β = .069).
As noted above, logistic regression analyses were conducted for each of the child wellbeing change items (healthy eating, activity, happiness and respect for elders; response options were ‘more’, ‘less’, ‘about the same’) and community improvement and personal improvement measures (response options were ‘on the way up’, ‘on the way down’, ‘about the same’). The results can be seen in Table 5.9.

Cape York Welfare Reform—Evaluation
162
Table 5.9 Logistic regression results for the relationship between explanatory variables and categorical measures of perceived change
Child WELLBEING ß Sig. Children—healthy eating FRC endorsement .127 < .001 Leadership .179 < .001 Responsibility .041 ns Total variance explained .150 (15%) < .001 Children—activity FRC endorsement .067 < .1 (Marg.) Leadership .227 < .001 Responsibility .004 ns Total variance explained .128 (12.8%) < .001 Children—happiness FRC endorsement .192 < .001 Leadership .236 < .001 Responsibility .062 ns Total variance explained .255 (25.5%) < .001 Children—respect for elders FRC endorsement .103 < .005 Leadership .351 < .001 Responsibility -.087 ns Total variance explained .249 (24.9%) < .001 Community improvement FRC endorsement .216 < .001 Leadership .093 < .05 Responsibility -.071 ns Total variance explained .168 (16.8%) < .001 Personal improvement FRC endorsement .174 < .001 Leadership .036 ns Responsibility .241 < .001 Total variance explained .174 (17.4%) < .001 ns = non-significant Note: β is the standardised regression coefficient indicating the relative impact on the outcome variable of one standard deviation change in each individual predictor.
In relation to children’s wellbeing, both FRC endorsement and leadership were significant predictors. For example, with respect to healthy eating, the three key predictors explained 15 per cent of the overall variance in responses. Both FRC endorsement (ß = .13, p < .001) and leadership (ß = .18, p < .001) were significant predictors, meaning that for each unit increase on the 1–10 Endorsement scale, there was a 13 per cent increase in the probability that the survey respondent would indicate a more positive response in relation to healthy eating. For each unit increase on the 1–10 Leadership scale, there would be a 18 per cent increase in the probability of a more positive response for healthy eating. There was no significant effect for responsibility. A similar pattern of results was observed for other measures of child wellbeing. Overall, for most indicators of child wellbeing, the more people endorsed the FRC and perceived community leadership to be strong, the more likely they were to also report improvement in the wellbeing of children.
There were also significant results for the overall perceptions of both community improvement and personal improvement. For both of these measures, participants were asked whether things were ‘on the way up’, ‘on the way down’, or ‘about the same’. For community improvement, the three key predictors explained 16.8 per cent of the variance. Both FRC endorsement (ß = .22, p < .001) and leadership (ß = .09, p < .05) were significant predictors of perceived community improvement, while responsibility was not. Therefore, for each one unit increase on the 1–10 Endorsement scale, there was a 22 per cent increase in the likelihood of being in a higher category for perceived improvement in the community, and for each unit increase in the 1–10 Leadership scale, there was a 9 per cent increase in this same probability.
For personal improvement, the three predictors combined explained 17.4 per cent of the variance. Both FRC endorsement (ß = .17, p < .001) and responsibility (ß = .24, p < .001) were significant

Authority, leadership and social norms
163
predictors of perceived personal improvement, while leadership was not. Therefore, for each unit increase in the 1–10 Endorsement scale, there was a 16 per cent increase in the probability that participants would be in a higher category on the perceived personal improvement scale, and that for each unit increase on the 1–10 Responsibility scale, there was a 24 per cent increase in this same probability.
Overall, the logistic regression results demonstrate that the more people endorsed the FRC, the more likely they were to also say that things were ‘on the way up’ (rather than ‘the same’ or ‘on the way down’) for the community and themselves personally. For community improvement, the same pattern was observed for leadership (but not responsibility). For personal improvement, the same pattern was observed for responsibility (but not leadership).
5.8 Summary of findings and policy implications Overall, these findings indicate that there is a perception among community members that things have changed over the period since the trial started.
For example, there was evidence that almost 59 per cent of respondents indicated that community life was on the way up and 56 per cent indicated that personal life was on the way up.
Furthermore, in relation to child wellbeing, between 50 per cent and 60 per cent of respondents indicated that children were eating healthier food, and that children were more active and happier compared to the time before the trial started. There is also support for the idea that there is more respect for elders and leaders than three years ago and that people in the community are working better together and are putting in more effort to make the community a better place to live.
Responses from the social change survey also indicate that on average the activities of the FRC are endorsed by community members and that there are strong leadership and motivations towards individual and family responsibility in solving difficulties and problems. With respect to current aspects of community life (wellbeing, seeking health support, home living and community engagement), the results indicate that behaviour in these communities is aligning with community aspirations.
The findings of the social change survey go further than this. There is some support for the trial logic in that endorsement of the FRC was related to leadership and responsibility outcomes and also outcome variables of interest. The main results can be summarised as follows:
The more respondents endorsed the FRC, the more likely they were to say that things were ‘on the way up’ (rather than ‘the same’ or ‘on the way down’) both for their community and for themselves personally.
In terms of the relationships among the explanatory variables (FRC endorsement, perceptions of strong leadership and levels of responsibility), respondents who reported stronger endorsement of the FRC were also more likely to report strong leadership and higher levels of improved responsibility.
When considered alone, FRC endorsement contributed significantly to explaining both community engagement change and leadership change, contributing over 20 per cent of the variance in these variables. Adding perceptions of strong leadership and levels of responsibility to the model significantly increased the amount of variance explained and also reduced the contribution of FRC endorsement to community engagement and leadership change. Strong leadership in particular was an important explanatory variable. These findings suggest that it is partly through affecting leadership and responsibility that the FRC impacts on these outcomes.
Endorsement of the FRC was the most likely to impact positively on an individual’s wellbeing, seeking health support, and desire to improve living conditions in the home.

Cape York Welfare Reform—Evaluation
164
The strength of the relationship between explanatory variables (perceptions of strong leadership and levels of responsibility, in addition to endorsement of the FRC) against outcome variables of interest indicated that, although there were similar levels of support for both leadership change and community engagement change, the contribution of individual predictors differed in an important way. Current leadership was found to contribute more than FRC endorsement to perceptions of leadership change. The pattern was reversed for perceptions of community engagement change, where it was found that FRC endorsement had a stronger impact than leadership. The role of responsibility was almost identical in both models.
It is difficult to determine in a trial such as this whether these explanatory factors are the cause of perceptions of community change or prosocial current behaviour. What can be concluded is that there is alignment between the factors identified within the trial logic as being central to prosocial community change and the available evidence. These results in the context of theory and research in social psychology (and related fields) suggest that in areas of community norm and behaviour change institutional authority, community leadership and individual and family responsibility warrant careful consideration and systematic investigation. It is also possible that widespread beliefs that things can change and are improving may be important in building further momentum towards social norm and behaviour change.
Given the central role that endorsement of the FRC plays in the current findings, better understanding the factors that lead to such endorsement is one direction for future work. Through its functioning, the FRC negotiates its own ongoing legitimacy as an authority and can increase the likelihood that it will be widely endorsed and valued. Research on distributive and procedural justice demonstrates that a sense that individuals have been treated with respect (that they have been able to ‘have a say’ and ‘be heard’) will add to people’s willingness to abide by the FRC’s decisions.329 In addition, for the community more broadly, continually developing the narrative surrounding the FRC and its role and its successes, revisiting whether it is upholding the ‘right’ community values, and identifying areas for improvement through the lens of the local community are essential to its viability and impact in the future.
From a social psychological perspective and the trial logic, the success of the FRC (and other aspects of the trial) depends on the ongoing (re)definition and enactment of the community’s shared aspirations and goals. It is this group process that affects social norms and is a key component of producing sustainable change at the level of individual attitudes and behaviours.330
329 SA Haslam, RA Eggins & KJ Reynolds, ‘The ASPIRe model: actualizing social and personal identity resources to enhance organizational outcomes’, Journal of Occupational and Organizational Psychology, 76, 2003, pp. 83–113. 330 JC Turner, KJ Reynolds & E Subasic, ‘Identity confers power: the new view of leadership in social psychology’, in J Uhr & P ’t Hart (eds), Public leadership: perspectives and practices (pp. 57–72), ANU E-Press, Canberra, 2008.

Service delivery
165
6 Service delivery Dr Judy Putt
In the evaluation framework for the Cape York Welfare Reform (CYWR) trial developed by Courage Partners331, one of the four key questions was whether service provision changed in a way that supports norm and behaviour change. In order to consider this question, Chapter 6 summarises information about the impact of the CYWR trial on service delivery, and the results of research and consultations that were undertaken among service providers.
In the first half of 2012, two separate but complementary projects were conducted to investigate the views of service providers and regional representatives of service organisations on four key areas: the trial and components related to services; changes in service delivery and in outcome areas; current service delivery and practice; and suggestions on how to support future reforms.
FaHCSIA conducted an online survey of service providers who work in the four communities, both those who are resident in those communities and those who visit them. In addition, an external consultant, Migration Plus, undertook more in-depth consultations with service providers in Aurukun, and two regional forums were held in Cairns to contribute to both of these studies.
This chapter presents the main findings from the two projects. More detailed reports are available as standalone documents.332
6.1 Key findings Most staff working as service providers (70%) who participated in the survey saw the trial as
beneficial, and both the survey and consultations indicated that the overwhelming majority know of the key objectives of the trial. There was some doubt, however, about organisations’ commitment to the trial and understanding of its practical implications for service delivery.
The extent of local jobs for Indigenous people is indicated by two sources of data (described in Section 8.8). Together, the Community Development Employment Projects (CDEP) conversion process and the trial itself have led to the creation of 221 properly paid full- and part-time jobs in the four communities. In addition, 41 per cent of service providers surveyed thought there were more local people in paid jobs. These data support the conclusion that the CYWR trial has generated more jobs for Indigenous people in the service sector. Over a quarter of the respondents to the service provider survey (27%) said they were of Aboriginal and/or Torres Strait Islander background—a far higher proportion than in a similar survey in Northern Territory communities. However, it is not known whether they are local residents or whether they hold full-time or senior positions.
The Family Responsibilities Commission (FRC) has had a big impact on social services: 44 per cent of survey participants said it had a lot of impact on their service in the local community. Most comments about the FRC from service providers were positive, but 41 per cent of survey participants said they would like to see changes, including improved liaison and a bigger role and wider mandate for the FRC.
331 Courage Partners, Evaluation framework and program theory for the Cape York Welfare Reform trial, report to FaHCSIA, March 2009. 332 J Putt, Service delivery: results from the survey of service providers, report for the evaluation of the Cape York Welfare Reform trial, FaHCSIA, 2012; Migration Plus, Consultation paper regarding desk top research and qualitative analysis of service delivery trends apparent from the CYWR initiatives: focus area Aurukun, report for FaHCSIA, 2012.

Cape York Welfare Reform—Evaluation
166
In some quarters, there was also disagreement among service providers about the practice of ‘active’ service delivery—an area in which a reorientation of services was expected as part of the trial. For some, it meant putting the responsibility to access services on clients and community members, while others stressed the need for more proactive community engagement and an outreach approach with individual clients.
Signs of positive changes in the local community reported by service providers surveyed were more children going to school, followed by more high school children going to boarding school, more families managing their money well, and more local people in paid jobs. However, the most common survey response to a list of social problems, among those who had been around long enough to comment, was that they were about the same as three years ago.
The key areas of service delivery that have changed under the trial are community engagement and fostering of individual and family responsibility. It appears that FRC Local Commissioners have become an important part of services’ community engagement approach.
Collaboration and the sharing of information between services were also viewed by many as having improved in the past three years, and just over one-third of survey respondents said that communication, information sharing and collaboration are currently generally effective. However, consultations and survey responses suggest many would still like to see improvements, especially in relation to visiting services and at the regional level.
Gaps in service delivery identified by service providers included health specialists, youth services and programs, and interagency case management.
Challenges and barriers to effective service delivery were reported by service providers to relate to politics, including family/clan rivalries and a perceived tension between Cape York regional organisations and government services; staffing; and poor community engagement. Other issues related to inadequate knowledge among service providers about local service delivery and inadequate accountability for and transparency of services.
Future reforms to service delivery advocated by service providers related to improving governance, cooperation and community engagement—all of which have to be responsive to the distinct character and challenges of service delivery in each community. A number of suggestions emerged from the consultations relating to better induction of staff, agency protocols, greater clarity about expectations of service practice, and strategic monitoring and review frameworks that are shared across sectors and the region.
6.2 Context The challenges of remote service delivery are well recognised and include the costs and logistical challenges of providing for a small and dispersed population. Enduring issues in recent years include lack of expertise and capacity at the local level and short-term funding for multiple services and agencies, which result in a confusing and often uncoordinated array of providers and services.333
Recurring themes underlying policy responses include the need to improve the range and capacity of services in remote settings but also to streamline and more effectively integrate their delivery. Key policy trends in remote service delivery include shifts away from discrete program delivery to delivery by mainstream services and a preference for a more regionalised approach to the coordination and management of services.334 However, in the context of remote Indigenous communities, a parallel strand emphasises the importance of locally driven responses and planning through community engagement processes. It is not that coordination and engagement are expected to result in actual 333 M Limerick, R Morris and M Sutton, Local government service delivery to remote Indigenous communities: review of service delivery models and approaches in various jurisdictions, report for Australian Centre of Excellence for Local Government, May 2012. 334 Queensland Government, Meeting Challenges, Making Choices: evaluation report, Department of Aboriginal and Torres Strait Islander Policy, Brisbane, 2005; M Limerick et al., Local government service delivery to remote Indigenous communities, 2012.

Service delivery
167
outcomes, but that they are viewed as enablers of development without which outcomes cannot be achieved efficiently or effectively.335
Over the past decade there has been an increase in the funding of services to remote Aboriginal communities336 and a reshaping of the structural arrangements in place to support service provision, driven in part by the Council of Australian Governments’ (COAG’s) National Indigenous Reform Agreement and the National Partnership Agreement on Remote Service Delivery. Signed in early 2009, the agreement committed governments to work with communities to improve community capacity and service delivery outcomes in 29 remote communities across Australia.
Both national and Queensland Government reforms have affected some but not necessarily all of the four Cape York communities. Cape York was the trial site in Queensland for the earlier Indigenous Communities Collaboration Project, which was established by COAG. Hope Vale and Aurukun were also two of the 19 communities in the Queensland Government Meeting Challenges, Making Choices strategy, implemented in 2002 to address alcohol and other substance abuse and violence. From a service delivery perspective, the strategy aimed to improve community engagement and improve the recruitment, training and retention of public sector personnel to strengthen service delivery. All four CYWR communities were selected as remote service delivery (RSD) communities after the trial commenced.
In a sense, the CYWR trial is a unique model of regionalisation in which additional services are provided by regional Aboriginal organisations such as Cape York Partnerships and Balkanu, and policy leadership and development are provided by the Cape York Institute for Policy and Leadership (CYI). This is overlaid or underpinned by RSD mechanisms for local and regional coordination, and the trial is overseen by the specific CYWR governance arrangements.
6.2.1 Impetus for reform to service delivery under the trial
The report on the design recommendations for the CYWR states:
Weakness in the service delivery system exists in the area of non-crisis intervention. However, improvements in service delivery alone are not the solution to dysfunctional behaviour, because passive service delivery is also part of the welfare problem in Indigenous communities. Governments cannot focus on unconditional income support as constituting passive welfare to the exclusion of passive service delivery.337
It is recognised that many elements of service delivery in the welfare state do not constitute passive welfare, and reference is made to ‘legitimate public services such as infrastructure, transport, law and order, health and education services’.338 According to the design report, the critical test to assess whether services amount to passive welfare is to ask whether the service seeks to undertake or support a responsibility that would normally be assumed by individuals, families or communities.
According to the 2008 Project Board Agreement339, the Project Board recognised that there were potential improvements in how services were delivered and integrated in Indigenous communities. The agreement stated that initial work would focus on the capacity and readiness of the service
335 Allen Consulting Group, ‘Coordination and engagement’, in Northern Territory Emergency Response: evaluation report 2011, FaHCSIA, Canberra, 2011. 336 Australian Government funding under the Indigenous-specific National Partnership Agreements with the states and territories, several of which relate specifically to remote communities, is outlined in the Prime Minister’s report on Closing the Gap, 2012, http://www.fahcsia.gov.au/our-responsibilities/indigenous-australians/publications-articles/closing-the-gap/closing-the-gap-prime-ministers-report-2012. 337 CYI, From hand out to hand up, 2007, p. 43. 338 ibid., p. 44. 339 CYI, Australian Government and Queensland Government, Cape York Welfare Reform Trial Project Board Agreement, 21 July 2008.

Cape York Welfare Reform—Evaluation
168
system to respond to referrals from the FRC, but stressed that additional work was needed on the ‘redesigning of the service system as a whole’.340
6.2.2 Changes to services under the trial
All four communities have very distinct histories and character linked to their size, the nature and extent of colonisation, mission pasts, location, language groups and proximity to regional centres. This, along with the different times that new CYWR programs and services started in each community in the past three or more years, has affected service delivery in each community.
Some indication of the services available in the communities soon after the CYWR trial commenced is provided by the RSD baseline mapping of services undertaken in 2009 and 2010.341 As is to be expected, the range of services in each community is affected by the community’s size and location. All four communities had an arts centre, and three communities had a church, schools, and police stationed in the community. Mossman Gorge had very few services in the community (a general store, an aged care service, a parenting service, a medical centre and a Wellbeing Centre were listed), as it is only five kilometres from the town of Mossman where there are multiple services, such as a hospital, primary and high schools, a post office and a Centrelink customer service centre.
Another difference in services apparent from the RSD baseline mapping is the role of local government in providing services and generating employment in two of the communities. Aurukun, with its own local government, was listed as having had a council guesthouse and council offices that included a library and postal services. Hope Vale has an Aboriginal shire council, and at the time of mapping it included a joinery and building works. Coen falls within the Cook Shire Council area and seemed to have had more privately owned businesses, such as a caravan park, a guesthouse, a hotel, two general stores, a café and a bank, and a chamber of commerce (although it currently has only a bank agency, and the chamber of commerce has ceased).
The rollout of programs as part of the trial has had an impact on the range and provision of services in the four communities. In the trial’s design, there were references both to the need for additional support services to work with the FRC and to a basic ‘re-orientation’ in all services to support the trial.342 In three of the four streams of the trial—Economic Opportunity, Housing and Education—the trial resulted in a realignment of or complementary activities to mainstream services. These included the Cape York Aboriginal Australian Academy (CYAAA) and student case management in the education sector; business support and the mainstreaming of employment services; and services that provided advice and training relating to tenancy management, home ownership and land management. The majority of new or expanded social services under the trial fell within the Social Responsibility stream and include FRC case management, the Ending Family Violence Program, the Parenting Program, MPower, Wellbeing Centres, and student case management. A description of these services, along with performance information, is provided in Chapter 3 and Appendix D.
Although the FRC is not a direct provider of services aside from case management, its introduction affected a range of existing services and institutions, such as courts, schools and Centrelink, and forged relationships with new or expanded services such as the Wellbeing Centres, the Ending Family Violence Program, MPower, Student Case Management and the Parenting Program (now called ‘It Takes a Village to Raise a Child’) (see Chapter 7 for data on FRC notifications, referrals and client liaison). A number of innovative programs were also introduced or expanded as part of the trial with the aim of increasing opportunities in schooling, and business but are not directly part of the matrix of ongoing social service delivery in the communities (e.g. Student Education Trusts, Pride of Place and business precincts).
340 CYI et al., Cape York Welfare Reform Trial Project Board Agreement, 2008, p. 21. 341 FaHCSIA, Aurukun: baseline mapping report, 2010; FaHCSIA, Coen: baseline mapping report, 2010; FaHCSIA, Hope Vale: baseline mapping report, 2010; FaHCSIA, Mossman Gorge: baseline mapping report, 2010. 342 CYI, From hand out to hand up, 2007.

Service delivery
169
Key areas of service delivery that existed before the trial and have continued since the trial commenced include Centrelink, policing, Home and Community Care (HACC) funded services for older people, health clinics, and shire services. In two communities (Aurukun and Hope Vale), the councils are potential employers of local Indigenous people. Also, under the CYWR trial Hope Vale Aboriginal Shire Council was funded to set up a business precinct. From a social services point of view, they may be contracted to run HACC services, crèches or early childhood services, and recreational activities.
Several new services were established, and existing services were extended or reformed. The Australian and Queensland governments funded the establishment and ongoing operations of the FRC, as well as a range of new or expanded social services, including Student Case Management and MPower. The Parenting Program and Ending Family Violence Program343 were funded by the Queensland Government. The CYAAA was also established. The Australian Government has funded Wellbeing Centres (run by the Royal Flying Doctor Service) and employment services. Changes in CDEP reform and the normalisation of tenancy in the four communities were examples of broader reforms, which are also occurring across Australia (see Section 2.7 for detail on the funding of services).
A considerable proportion of the trial funding for key services and programs has been provided to three not-for-profit organisations that work together in the Cape York region, each with its own area of interest: Balkanu (economic development); CYI (policy) and Cape York Partnerships (program delivery). The latter is responsible for multiple programs under the four CYWR streams, including MPower, Student Education Trusts, Pride of Place, a work placement service (up to December 2009) and the Parenting Program.
It has been estimated that a total of at least 118 new local service delivery jobs have been created in the four communities as a result of the trial—42 in Aurukun, 38 in Hope Vale, 18 in Coen and 20 in Mossman Gorge. Of the 118 jobs, 38 are in the CYWR Opportunity Hubs, 37 in the FRC344, 36 in Wellbeing Centres, and seven in student case management. In addition, through the CDEP conversion process, 103 full-time paid jobs have been created in the CYWR communities, including 40 to support Australian Government service delivery and 31 to support Queensland Government services (see Section 8.8 for further information about employment).
6.2.3 The relevance of service delivery to the evaluation
Service provision is a critical element of the trial, as changes to social norms are supported and facilitated by services that respond to individual need and address social problems. In the 2008 Project Board Agreement345, individuals and families are identified as the principal partners of welfare reform. Other partners, which include state and federal governments and service providers in non-government, regional and contracted organisations, are described as enablers and providers of assistance and frameworks that support individuals and families to develop and strengthen self-determination and individual choice and responsibility. Service providers who work in the four communities are therefore vital stakeholders who are responsible for implementing various elements of the trial and, through their practice, supporting the aims of the trial.
A reorientation in the delivery of services could also play an important role in meeting the stated aims of the trial relating to supporting local Indigenous authority and community and individual engagement in the ‘real economy’ through the provision of services by Indigenous organisations and the employment of local Indigenous people in services.
343 Although the Queensland Government funded the Ending Family Violence Program for the majority of the time, the Australian Government funded the program from July to December 2011. 344 This does not include an additional 51 Cairns-based support staff. Local Commissioners are not included in this figure. 345 CYI et al., Cape York Welfare Reform Trial Project Board Agreement, 2008.

Cape York Welfare Reform—Evaluation
170
From a service provision point of view, in the short term the trial was expected to have increased service provision and demand on services and changed the way services are delivered. Under the evaluation framework, a stream is ‘repositioning government services’, with signs of success listed as including ‘active service delivery’346, responsive rather than interventionist services that respond to increased demand, and timely and appropriate use of services.347,348
As part of the evaluation of the trial, it was important to examine separately the impact of the trial on service delivery for signs of ‘repositioning’, including the contribution of services to outcomes. Those who work in service delivery in the four communities participated in the evaluation primarily through two projects—an online survey and consultations.
The rest of this chapter outlines key results from these projects.
6.3 Methodology of the survey and consultations With the support of key organisations and brokers, service providers in a wide range of government and non-government sectors were contacted and invited to participate in an online survey. The aim of the survey was to investigate whether service providers who work in the four communities believed the trial had been beneficial and had contributed to changes in service delivery and in the community—and to investigate perceptions of current service delivery, including availability and gaps, community engagement and inter-service collaboration. Of the 128 service providers who participated in the survey:
42 per cent worked in Aurukun, 23 per cent in Coen, 20 per cent in Hope Vale and 15 per cent in Mossman Gorge
65 per cent had worked in the community for less than three years
41 per cent were resident in community
49 per cent worked for government organisations
23 per cent worked for one of the Cape York regional organisations
64 per cent were female
27 per cent reported being of Aboriginal and/or Torres Strait Islander background
45 per cent had five or more years’ experience working in Indigenous remote communities in Queensland.349
To complement the survey, Migration Plus consulted regional service providers and those in one community, Aurukun. For its review of service delivery issues, Migration Plus undertook a qualitative analysis of literature and stakeholder interviews.350 The aim was to examine whether service provision had changed in a way that supports norm and behaviour change by covering four key topic areas: service coordination and collaboration; barriers and facilitators to change; service availability; and service standards. A focus place-based case study of service delivery was undertaken in Aurukun, using a cross-sectoral approach to the sampling of services for stakeholder consultations. In Cairns and Aurukun, consultations were undertaken with representatives from the FRC, Cape York Partnerships (particularly regarding MPower), the Royal Flying Doctor Service (regarding Wellbeing
346 O’BrienRich Research Group, Desk-top research into active service delivery and related philosophies of service delivery, report provided to FaHCSIA, March 2010. 347 Courage Partners, Evaluation framework and program theory for the Cape York Welfare Reform trial, report to FaHCSIA, March 2009. 348 The program logic developed by CYI earlier includes a range of short- and longer term outcomes for 15 projects or programs associated with the trial. It provides more detail on what is expected of specific programs and will inform future evaluations of individual programs, such as those currently in train for the Wellbeing Centres and CYAAA. 349 For more detail on the methodology and the sample, see J Putt, Service delivery, 2012. 350 For more detail on the approach taken, see Migration Plus, Consultation paper, 2012.

Service delivery
171
Centres), HACC, Community Enterprises Australia, CYAAA and the Aurukun school, police, probation and parole, local government, the Regional Operations Centre of FaHCSIA, and CYI.
A forum was held in Cairns in July 2012, convened jointly by FaHCSIA and Migration Plus, to report back on preliminary findings from the survey and consultations. The 29 participants from the government and non-government sectors provided useful feedback that assisted in the interpretation of the results.
6.3.1 Limitations of the research
The findings from both research projects represent the views and opinions of people who work and in many cases live in the four communities, and their perspectives are shaping everyday practice and the delivery of services. Based on feedback from the forum and the available evidence, the survey sample seems to represent a good cross-section of both local and visiting service providers from the non-government and government sectors. The survey enabled a larger group than that accessed through consultations to convey their views and, in this sense, was a more democratic opportunity for this stakeholder group to communicate their views. A survey also has the advantage of showing the diversity of opinion among the stakeholder group.
However, there are limitations to the research undertaken with service providers. For instance, no ‘comparison’ group of service providers in other communities was surveyed to see whether similar findings applied in other contexts. In addition, because a comprehensive list of staff working across sectors and agencies either in communities or as visiting providers was not available, it was not possible to develop a robust sampling frame for the survey. Due to resource and time constraints, the consultations occurred only in one community. To adopt a more systematic approach to sampling service providers and to undertake more extensive consultations in all of the four communities would have involved additional time and resources that were not available. Most resources available to the evaluation were committed to other elements of the evaluation, most notably research with local residents and the analysis of outcome data.
6.4 Perceptions of the trial
6.4.1 Alignment of service delivery In its consultations, Migration Plus found that in general service providers had an awareness and understanding of the expectation to align service delivery in the local community to optimise support for the trial. Most participants in the service provider survey (70%) indicated that they thought the trial was beneficial and, when presented with eight objectives for the trial, the overwhelming majority (86%) agreed that individual and family responsibility and giving local people more opportunities were very important objectives of the trial.
The survey results suggest that most service providers are aware of the trial and its objectives. Migration Plus found, however, that there was in some cases a lack of understanding or disagreement about what the CYWR really meant for their own service or for service delivery more broadly. A similar theme emerged in the survey responses. As Figure 6.1 shows, 43 per cent of survey participants said that the roles and responsibilities of their own organisation under the trial were always clear. In contrast, only 8 per cent said that the roles and responsibilities of other organisations were always clear. According to 21 per cent, organisations always demonstrate a commitment to the trial. This would suggest greater confidence in their own service’s commitment to the trial and the practical implications for their service than in other services.

Cape York Welfare Reform—Evaluation
172
Figure 6.1 Service provider perceptions of organisations’ roles, responsibilities and commitment under the trial (%)
7.1
17.7
17.7
4.4
1.8
0
13.3
40.7
29.2
31.9
31.9
31.9
43.4
8
21.2
0 10 20 30 40 50 60 70 80
Roles and responsibilitiesof my organisation are
clear
Roles and responsibilitiesof other organisations are
clear
Organisations demonstratecommitment to trial
Percentage
Always
Most of the time
Some of the time
Never
Don't know
Note: n = 113. Source: CYWR Service Provider Survey data.
6.4.2 Interaction with the FRC A key component and innovation of the trial was the introduction of the FRC (see Chapter 7). From both FRC data and attendance at FRC conferences reported by local residents in the social change survey351, it is apparent that the FRC has had some form of contact with most adults in the four communities, though less so in Coen. Not all of this contact is formal, as Local Commissioners seem to be involved in support and mediation in a more informal capacity.
Service providers also reported being affected by the FRC, and most said that their service had regular contact with it. Survey participants responded as follows:
72 per cent said that their service had regular contact with the FRC and its Commissioners. Of those that had regular contact, 56 per cent said that many of their clients were referrals from the FRC.
44 per cent were of the opinion that the FRC had a lot of impact on their service in the local community.
83 per cent of free text comments were positive about the impact of the FRC on the community and/or on services. The Local Commissioners were singled out by many for praise.
41 per cent would like to see changes in how their service works with the FRC, referring often to a need to improve liaison and feedback or to a bigger role and a wider mandate for the FRC.
351 Colmar Brunton, Social Change Research Study: aggregate report, report prepared for FaHCSIA, Canberra, 2012.

Service delivery
173
The scepticism and resistance to the FRC found in earlier reviews352 seems to have dissipated: both local residents and service providers are now mostly positive about its role and efficacy. In some quarters, nonetheless, there remains opposition to such an intervention, but these were lone voices among the service providers. The majority of service providers’ comments related to improving communication between the FRC and services, or recommendations for an expanded role and authority. Several survey participants also expressed the view that the FRC’s focus and actions required a rejuvenation as the effect was wearing off.
6.4.3 Other services
There was less enthusiastic endorsement from service providers in the survey for key services that had been introduced or redesigned during the trial. Client data indicate that Wellbeing Centres and MPower are well utilised, and many people are referred to these services by the FRC. They are well known among service providers: almost all service providers in the survey said they had operated in the past year. For the most part, they were largely seen as effective, although there was a subset of participants who were critical, which seemed linked to a high turnover in staff and the style of engagement with clients. Participants in the education sector took the opportunity in their text responses to highlight the achievements of student case managers and the difference they and the CYAAA had made, although those subjects were not listed in the questionnaire. Several participants referred to a ‘dogmatic’ adherence to the Direct Instruction technique, but the overwhelming majority were very positive about recent reforms in education. Participants who worked in education were also supportive of Student Education Trusts, and this is reflected in the mostly positive responses about the program.
Smaller, targeted programs or services had rather mixed results. Although the FRC refers many clients to the Ending Family Violence Program, only 41 per cent of participants indicated that the program had operated in the past year, and information supplied to FaHCSIA on the program suggests that it has been run less frequently and has had staffing problems in that time. According to the survey participants, Pride of Place seems to have worked well in some places but less so in others, and there was a concern that improvements did not last and the program did not generate sustainable outcomes. Just over 70 per cent of participants said the Parenting Program and Pride of Place had operated in the local community; however, these programs were the most frequently chosen by the 91 respondents to this question as having the least impact.
Most survey participants said that employment services had operated in the community, but little was said about those services. This might be because many participants had limited contact with the services, and in one community there seemed some dissatisfaction with the way the service had been running. Although a number of participants stressed the importance of developing employment and business opportunities, this was not raised within the context of service delivery, either as a vehicle to provide employment or as a means of providing job skills or business development. Instead, it was tied to local politics or the disadvantages of being a remote community.
6.4.4 Employment of local Indigenous people
The service sector is a key area of employment of local people in remote communities. Almost one-third of participants in the survey were Indigenous people. This was a far higher proportion than among those who participated in a similar survey in Northern Territory remote communities (Putt and FaHCSIA 2011), where it was 10 per cent of the sample. Two sources of data on the extent of local jobs—those created as part of local service delivery of the trial and CDEP conversions—support the conclusion that the CYWR trial has generated more jobs for Indigenous people in the service sector (see Section 8.8.3). Moreover, the Migration Plus report noted that there were many signs of social
352 Aboriginal and Torres Strait Islander Services (ATSIS), Cape York Welfare Reform: consultation report, report to the Hon Curtis Pitt, Minister for Disability Services, Mental health and Aboriginal and Torres Strait Islander Partnerships and the Hon Jenny Macklin, Minister for Families, Housing, Community Services and Indigenous Affairs, 2011; KPMG, Implementation review of the Family Responsibilities Commission, final report, September 2010, for FaHCSIA.

Cape York Welfare Reform—Evaluation
174
capital building as a flow-on effect of the CYWR (e.g. the election of several FRC Commissioners as shire councillors).
6.5 Perceptions of changes in the past three years Service providers who participated in the survey were in the main positive about the impact of the trial on communities and their residents. Out of the total sample of 128 staff, participants responded as follows when asked about perceived changes in outcome areas:
67 per cent said more children were going to school
42 per cent said more high school kids were going to boarding school
42 per cent said more families were managing their money well
41 per cent said there were more local people in paid jobs
38 per cent said that looking after houses had improved.
The only questions in the whole survey that showed statistically significant differences across the four communities, related to perceived changes in outcome areas. There were no statistically significant differences across the four communities in responses to more children going to school and more high school kids going to boarding school; however, there were statistically significant differences across the four communities in their responses to perceived changes in local people in paid jobs; families managing their money well; and looking after houses. The responses to these questions by community are as follows:
Mossman Gorge had the highest number of respondents who thought that more local people were in paid jobs than three years ago at 61 per cent, followed by Coen (57%), Hope Vale (43%) and Aurukun (26%).353
Two thirds of Hope Vale respondents thought that more families were managing their money (67%), followed by Mossman Gorge (53%), Coen (35%) and Aurukun (30%).
Fifty per cent of respondents from both Mossman Gorge and Hope Vale said looking after houses had improved in the past three years followed by Coen at 30 per cent and Aurukun at 26 per cent.
The most common response (35%–45%) to a list of social problems was that they were about the same. However, a higher proportion of participants said that there was less drinking of alcohol (26%), fighting in or between families (24%) and vandalism (29%) than said that there was more.
Many respondents noted improvements in the community in open-text comments, such as in children’s attendance at school, access to services and support for some individuals and families. However, these data show that even though many service providers believed that the signs were promising, it was too soon to expect major change in longstanding and entrenched attitudes and lifestyles. Service providers obviously understood that the objectives of the trial were to inculcate individual and family responsibility, but some referred to structural and cultural factors that militate against it, while others stressed that it would take many years to achieve. The latter point was stressed by some interviewees in the Migration Plus consultations.
In relation to perceptions of changes in service delivery in the past three years (Figure 6.2), key results included the following:
Over one-third of survey participants could not answer, mainly because they had not been working in the community for long enough.
353 These differences are broadly consistent with changes with employment found in the 2006 and 2011 census results, with Aurukun having the smallest change.

Service delivery
175
About one-fifth of all participants said they believed that there had been no change in the way services work with other local service providers, or in their own service’s engagement with the local community and way of operating to support the trial.
Over half of all participants thought that their service’s engagement with the local community had changed, and 50 per cent said that services had changed to encourage individual and family responsibility under the trial.
These results indicate that the most likely areas of service delivery and practice to have changed under the trial relate to community engagement and the fostering of individual and family responsibility. However, it was apparent in open-text comments in the survey and from the Migration Plus consultations that there were differing views on how best to foster individual responsibility among clients, with some practitioners arguing against outreach and proactive engagement in the community. Confusion and disagreement among service providers about the concrete application of these aims is not surprising, given that Migration Plus found little evidence of induction of new practitioners, and given that many services (aside from programs run by the Cape York regional organisations and the Wellbeing Centres) had not changed or developed formal policies for services under the trial.
Figure 6.2 Service provider perceptions of changes in services in the past three years (%)
39.8
37.8
27.4
36.6
10.6
22.5
20.4
19.7
49.6
39.6
52.2
43.8
0 10 20 30 40 50 60 70 80
Services encouragingindividual and family
responsibility as a result ofthe trial
Your service's way ofoperating to support the
trial
Your service's engagementwith local community
Your service's way ofworking with other local
service providers
Percentage
Yes
No
Don't know
Note: The number of responses varied by question between 111 and 113. Source: CYWR Service Provider Survey data.
Of those survey participants who felt they could comment on changes in the past three years, the majority said there had been improvements in the sharing of information and collaboration between services. Overall, a common view was that there was better coordination and communication among service providers and fewer gaps than had existed before. The Migration Plus consultations elicited the same result. There was less evidence from the survey that participants thought that collaboration had produced concrete outcomes for clients, although some thought that it may have increased through the FRC acting as a broker and supervisor of cases. Various mechanisms to improve coordination, such as monthly interagency meetings in the community, the Regional Operations

Cape York Welfare Reform—Evaluation
176
Centre and the government coordination officers, were touched upon by several participants, but less so than might have been expected given the explicit focus and function of those mechanisms.
From the survey and consultations, it appears that one of the two RSD objectives (better coordinated government services for Indigenous people in identified communities) has been achieved, but the achievement of the other (providing simpler access) is less certain. Despite the Wellbeing Centres being flagged by several participants as providing access to a wider range of services than existed before, it is not known from the Colmar Brunton social change research study whether local residents believe there is now ‘simpler’ access to government (and non-government) services.
6.6 Perceptions of current service delivery and practice Persistent and widespread challenges in service delivery relate to the accessibility of services and the recruitment and retention of skilled staff. The responses to the service provider survey showed that perceptions of the significance of the latter two issues varied by community. As Table 6.1 shows, the service providers who participated in the survey and worked in Mossman Gorge were more likely to have worked there for a longer period but to not be resident in the community compared to Aurukun respondents. Recruitment and retention were perceived to be a big issue by fewer respondents in Mossman Gorge, followed by those who worked in Hope Vale, Coen and Aurukun. Based on the survey results, service providers who worked in government organisations, compared to those in non-government organisations, were nearly twice as likely to see staff recruitment and retention as a big issue.
Table 6.1 Community differences in staff and in workforce issues (%)
Participants worked three or more years in
the community (%) Participants resident in
the community (%) Recruitment perceived
to be a big issue (%) Retention perceived to
be a big issue (%) Aurukun 27 56 67 63 Coen 46 45 54 39 Hope Vale 24 32 33 29 Mossman Gorge 53 5 27 21 Total of all participants 35 41 51 45
Source: CYWR Service Provider Survey data.
Over half of the survey participants (59%) did not reside in their nominated community. Of those, 33 per cent said they had visited the community a total of at least 60 days in the past year, while 16 per cent had visited for a total of less than 10 days. Compared with non-resident service providers, participants who resided in the community were more likely to say there was regular consultation with FRC Commissioners and attendance at community meetings, and were more likely to want to see changes to how the FRC worked with their service. They were less positive than visiting service providers about how local service providers worked together. They reported more changes in several outcome areas, such as money management and looking after houses. These differences might be because local providers have a more informed view than visiting practitioners, because the latter are basing their opinions on what they have experienced or observed elsewhere, or both.
According to survey participants, the services most commonly based in the community (except for Mossman Gorge) include a medical centre, police, general store, arts and cultural centre, primary school and church. There was less knowledge among participants of whether certain listed services were provided as visiting or resident services: at least one-fifth did not know whether a sobering-up shelter, Aboriginal legal service, men’s or women’s centre, night patrol, or family and domestic violence service were available. This is not to say that those services do or do not operate in a given community, but it suggests that a considerable number of service providers are not aware of the range of services provided, which has implications for interagency coordination and referrals.

Service delivery
177
6.6.1 Engagement with local communities The most common response among all survey participants to questions about collaboration and community engagement was to indicate that it occurred ‘some of the time’ (42%–50% of participants):
38 per cent said that communication is generally effective most of the time, which was a slightly higher proportion than who said that information sharing and working collaboratively with the local community occurred most of the time.
14 per cent did not know whether organisations worked collaboratively with the local community.
When asked about how their service engages with the local community (Figure 6.3), survey participants responded as follows:
76 per cent said they consulted often with local community members
63 per cent said they consulted often with local leaders
54 per cent said they consulted often with FRC Commissioners
48 per cent said they often routinely seek client feedback
45 per cent said they often attend community meetings.
Less frequent forms of community engagement were attendance at regular meetings of a local advisory group, using a local Indigenous interpreter, and attendance at local council meetings. Based on these results, local service providers do not always seem to know much about opportunities to more formally seek feedback from the community about their services. Community engagement by participants’ services was largely by informal means, such as meeting often with local community members and leaders. For some services, the Local Commissioners appear to play a critical role: just over half of the survey participants consulted them as a form of community engagement. The survey questionnaire did not probe what the service or organisational provider consulted about—depending on the service, it may have centred on individuals and families (as clients or potential clients) or it may have included more substantial feedback on the direction and responsiveness of the service.

Cape York Welfare Reform—Evaluation
178
Figure 6.3 Service providers’ perceptions of the frequency of various forms of community engagement by their service in the community (%)
8.9
9.8
2.7
19.8
8.9
17.1
24.3
16
1.8
6.3
0.9
18.9
3.5
24.3
11.7
3.6
5.4
10.7
4.5
19.8
11.5
18
13.5
10.7
21.4
19.6
15.3
24.3
31
13.5
26.1
21.4
62.5
53.6
76.6
17.1
45.1
27
24.3
48.2
0 10 20 30 40 50 60 70 80
Consult with local leaders
Consult with FRCCommissioners
Consult with localcommunity members
Attend local councilmeetings
Attend communitymeetings
Use local Indigenousinterpreters
Regular meetings of localadvisory group
Routinely seek clientfeedback
Percentage
Often
Occasionally
Rarely
Never
Don't know/inapplicable
Note: n = 111–113. Source: CYWR Service Provider Survey data.
The survey showed that there are currently strained or weak relationships between some providers, and not necessarily a strong sense of shared ways of working together or modes of practice. Organisational and sectoral rivalries and personality clashes are inevitable and are often exacerbated in small community settings. For example, research with local service providers in Northern Territory remote communities found that many indicated that only some organisations work well together or only work well together some of the time. Negative comments were made about visiting services or the lack of engagement with the local community, and several stressed how much coordination is personality driven.354
354 J Putt and FaHCSIA, ‘Research into community safety, wellbeing and service provision’, in Northern Territory Emergency Response: evaluation report 2011, FaHCSIA, Canberra.

Service delivery
179
6.7 Improving service delivery and supporting future reforms Several interviewees in the Migration Plus consultations referred to gaps in service delivery in key areas of social development, including adolescent support, child mental health and psychological assessments. Most survey participants (63%) said there were gaps in service delivery. Perceived gaps in services included:
specialists (e.g. child mental health, dentists) and case management
specific programs, such as a children’s shelter, a men’s shed, and living skills
programs for youth, including those who drop out of boarding school.
Survey participants also perceived as gaps in a more general sense:
duplication and lack of coordination
the lack of jobs, business investment and financial services for small business
local leadership and community control
research and data, and the review and consolidation of services.
Barriers to improving service delivery, according to survey participants, related to three key areas:
politics (in particular, a perceived gulf between Cape York regional organisations and government), divisiveness caused by family/clan groups within communities, local council resistance, or the Queensland Government being slow to support the trial
service delivery and providers, including poor staff, difficulties in recruitment and retention, housing and inadequate communication and coordination within a community and/or with the regional centre
local community engagement, either because it needs more input from local people or because of local people’s disinterest.
The main themes raised by survey participants to improve service delivery as a means of supporting future reform sought to address many of the barriers or gaps that had already been canvassed, and as a result reflected similar concerns:
politics: cooperation between the government and Cape York organisations, more council involvement, improvement in the governance of local organisations
service delivery: more collaboration and communication, more follow-up, more services, more incentives, stronger monitoring, a more coordinated approach to service delivery
local community engagement: consulting with communities on the design of programs, more engagement, consultations with both community and council.
Based on comments made in the survey, although local services were perceived to collaborate and communicate reasonably well by many participants, this was most apparent within certain sectors and in certain communities. In the consultations on service delivery, Migration Plus found some strong relationships between certain services but did not think that this translated into a ‘holistic’ approach by service providers. Coordination in service delivery was seen as needing improvement both locally and regionally by many participants. Fly-in fly-out service delivery was seen by some as particularly problematic, because too many service staff are based in Cairns.
There was an underlying tension in survey responses between Cape York regional organisations and other service organisations. Those who worked in Cape York organisations were more likely to report positive outcomes from the trial and to emphasise the importance of trial objectives, but this did not translate into a discernible difference in responses to many questions, including those about gaps and

Cape York Welfare Reform—Evaluation
180
measures to improve service delivery. Statistical tests found no significant differences in the responses to key questions between those who work for Cape York regional organisations and other sectors, or between the government and non-government sectors. Instead, the tension appeared to be about the perceived commitment to the trial and an alleged ‘silo’ mentality of other parties. In addition to these organisational politics, participants suggested that resistance by key powerbrokers and the council, and family rivalries, were contributing to a less than optimal trial outcome, most notably in one community. A number of participants seemed to argue that the trial had ‘empowered’ many individuals and families, but not necessarily the community as a whole.
Accountability was a recurring theme in the survey results. There were calls for better monitoring, reliable data and regular reviews of services and programs. A significant number of service providers did not want to comment or did not feel confident about commenting on services other than their own, and several participants suggested a need for improved communication and transparency about what was being done and achieved by programs and services, so that there could be a more empirical basis for opinions of programs. There is a view among service providers that the trial has resulted in considerable expenditure on additional services, and there was a strand of opinion that questioned whether it could be rationalised or used more efficiently.
In its report, Migration Plus listed barriers to changes that would support the trial and that were raised by stakeholders, including service providers trying to achieve long-term goals within a short timeframe and the lack of incentives for service providers to support the trial in standard government tendering processes for service delivery funding agreements. Based on its consultations, Migration Plus recommended the introduction of an induction program, including local cultural awareness training for all service providers; recruitment policies and procedures to support welfare reform; and protocols for cooperation between agencies, including sharing of data.
Several services—the Wellbeing Centres and CYAAA—are being evaluated as standalone programs. However, based on its consultations, Migration Plus argues that post-implementation reviews should be conducted for all services and programs. Using the CYI program logic to establish a monitoring framework, it suggests a combination of qualitative and quantitative measures to monitor and report on programs and services in the future.
6.8 Conclusion The four Cape York communities have been subject to major policy and program changes in recent years, including the CYWR trial, and as RSD communities. There has been a large investment by the Australian and Queensland governments in services and programs as part of the trial. The 128 service providers who participated in the survey were by no means the total population of service providers who are resident or work in the communities. Even so, this sample size indicates there is at least one individual service provider for every 23 local residents (adults and children) in the four communities. Although this seems quite high, it is impossible to assess as there is no national or regional data on the ratio of staff to local residents in remote service delivery.
If nothing else, the trial seems to have produced a complicated array of services, some of which are very closely tied to the FRC and provide practical assistance to individuals and families to help them achieve positive change. Whether the number and range of services meet one of the stated objectives of the National Partnership Agreement on Remote Service Delivery—to raise the standard and range of services delivered to Indigenous Australians to be broadly consistent with those provided to other Australians in similarly sized and located communities—is less easy to determine. One reason is that it is not obvious which towns or communities should be compared to the four Cape York communities, each of which has its own distinctive characteristics, including size and location.

Service delivery
181
In the original evaluation framework for the trial, signs of success for repositioning government services included guidelines, effective processes, and responsive and active service delivery.355 Survey participants seemed confident that their own services were working hard to support the trial’s objectives and to respond to local circumstances. However, according to Migration Plus, there was not much understanding of what the goals and pathways inherent in the CYWR meant for their services.
There is a lack of clarity about whether the CYWR should lead to fundamental changes to service practice. The Migration Plus report on the consultations on service delivery states that there is a need to develop formal policies and procedures to create welfare reform service delivery (emphasis added), but before that occurs it seems that there needs to be a broader debate and agreement about what this might translate into. In the social services, the consultations and the survey revealed that there was disagreement between providers over the best approach to foster individual and family responsibility—some argue that a self-help model results in the onus being placed on clients to enter their service’s premises and ask for assistance. This is not a new debate and, given the diversity of people who live in the communities, it seems that a more tailored approach to individuals depending on their needs and expectations, combined with proactive engagement in the community, is required. In any future discussions among the full constellation of service providers, it would be useful to examine ways of encouraging community engagement, in addition to client engagement.
Greater engagement with the community and more active participation and support from key government services and from local government were some of the changes advocated by survey participants. This was also a view held by some local residents. Although the most important issues for local Indigenous residents related to more housing and more real jobs, followed by more activities and services for young people, the social change research study indicated that they would like to see service providers work together better and/or have more contact with the community.356
Realistically, a significant number of services will continue to be delivered as visiting services. Surveyed service providers advocated more attention to address staffing challenges in specific community settings and the quality and frequency of visiting services. Reduced tensions between providers and better collaboration, as well as community engagement, may occur if there is greater clarity about expectations of service practice and delivery in any future reforms. However, without a concrete purpose and more detailed implementation frameworks (and a focus on outcomes357), service providers are likely to keep advocating more collaboration and engagement without necessarily seeing those aspirations converted into action or obvious benefits to themselves and local residents.
As several survey participants noted, a lot of energy and time has been dedicated to setting up or redesigning discrete programs under the trial, and there has not been the opportunity to reflect on how to strengthen networks locally and regionally or on the alignment of services across programs. Developing some shared or common output indicators and agreed models of service delivery across sectors and organisations, in line with more strategic funding frameworks, seems an important first step in building on achievements to date.
The dynamics and investment in service delivery vary between the four communities. There are distinct challenges associated with each, from a larger more remote community like Aurukun to a smaller community like Mossman Gorge, where people go to a nearby town to access many services. Having a local council in two of the communities is another factor that affects the management and delivery of services. Service providers’ perceptions of each community and their views on service delivery often reflected political issues, family and clan rivalries, and intersectoral tensions specific to
355 Courage Partners, Evaluation framework, 2009. 356 Colmar Brunton, Social change research study: aggregate report, 2012. 357 As advocated in J Stewart, S Lohoar and D Higgins, Effective practices for service delivery coordination in Indigenous communities, resource sheet no. 8, for the Closing the Gap Clearinghouse, December 2011.

Cape York Welfare Reform—Evaluation
182
that community and highlighted the need to consider local service delivery configurations, as well as the more structural organisational and regional factors that affect services, in future reforms.
Many issues related to service delivery identified through the survey are likely to be found in other remote Indigenous communities358 and certainly predated the trial.359 In other RSD communities, there may have been similar trends in service provision and practice, because the service delivery aims of the RSD initiative are similar to CYWR objectives. With reforms to service delivery in the Cape York and other RSD communities, there remains an unresolved tension between ‘normalising’ Indigenous people as citizens who require services, and previous and ongoing arrangements for a distinct self-controlled service sector.360 However, what makes the CYWR trial distinctive from a service delivery perspective are the innovations introduced through the creation of the FRC and a number of programs aiming to support the restoration of social responsibility, and the trial’s governance structure. The impact of these is examined and discussed in other parts of the evaluation report.
358 For example, see Allen Consulting Group, Coordination and engagement, 2011; J Putt, S Middleton, J Yamaguchi and K Turner, Community safety: results from the service provider survey in the Northern Territory, FaHCSIA, Canberra, 2011; M Limerick et al., Local government service delivery, 2012; S Fisher, R Elvin, S McFallan, P Memmott, T O’Rourke, S Peter, R Porter, O Stanley, P Sullivan, D Tedmanson and M Young, Desert services that work: demand responsive approaches to desert settlements, final report for Core Project Five, Desert Knowledge Cooperative Research Centre, 2010; S Prout, The entangled relationship between Indigenous spatiality and government service delivery, CAEPR working paper no. 41, 2008, ANU College of Arts and Social Sciences, 2008, which examines Indigenous spatiality and service delivery. 359 J Finlayson, Service provision and service providers in a remote Queensland community, discussion paper no. 133, Centre for Aboriginal Economic Policy Research, Australian National University, Canberra, 1997; Queensland Government, Meeting challenges, making choices, 2005. 360 P Sullivan, The policy goal of normalisation, the National Indigenous Reform Agreement and Indigenous National Partnership Agreements, DKCRC working paper no. 76, Ninti One, Alice Springs, 2011.

Family Responsibilities Commission
183
7 Family Responsibilities Commission The Social Policy Research Centre
7.1 Introduction This chapter covers the operations of the Family Responsibilities Commission (FRC), a central part of the Cape York Welfare Reform (CYWR) trial. The FRC is at the very centre of the welfare reform process. Welfare reform is associated with the FRC more than any other of the projects or initiatives, and it is the FRC more than any other component of the CYWR trial that makes the trial unique. This chapter includes a detailed analysis of FRC unit record data extracted from the FRC operational database, information from the social change survey and interviews with stakeholders, including the FRC and service providers. It complements the chapters by SPRC on implementation and outcomes. This chapter should be read in conjunction with those chapters.
The chapter starts with an outline of the role of the FRC and the challenges involved in its implementation. The next section outlines the approach to data analysis and provides analysis of the FRC administrative data relating to information about breaches of the specified social obligations (trigger events), notices for clients who are in jurisdiction, conferences, case management, service referral and income management for clients of the FRC. These data are a source of rich information about how people have interacted with and responded to the FRC. It does not, however, cover people who breach the social obligations but who are found to be outside of jurisdiction of the FRC.
The data on trigger events, notices, clients, conferences and case plans were extracted from the FRC operational database. This was a full extract of all clients and notices for the observation period from July 2008 to December 2011 and is not based on a sample. As the sizes of the communities differ significantly, so do the number of FRC clients from each place.
The chapter also provides an overview of perceptions of the FRC from the social change survey and stakeholder consultations. This is followed by a section on the quality of FRC data and its relationship to measured outcomes. Outcomes of the trial can be assessed through a range of outcome indicators listed in Chapter 8.
7.1.1 Jurisdiction and role
The FRC was established in July 2008 and began operating almost immediately.
The FRC comprises a Commissioner, and 19 Local Commissioners who are respected community members appointed by the Queensland Governor. The key objectives of the FRC are to rebuild Indigenous authority and to restore social norms by reforming incentives to support socially responsible standards of behaviours at the individual, family and community levels.
The FRC applies to all community members, both Indigenous361 and non-Indigenous. FRC jurisdiction applies to people who are welfare recipients362 or whose partners are welfare recipients, or
361 Aboriginal and Torres Strait Islander people. 362 The meaning of welfare recipient is defined in section 8 of the FRC Act. A person is a welfare recipient if (a) under the Social Security Act, Part 3B, the person or the person’s partner is an eligible recipient of a category P welfare payment; or (b) under the Social Security Act, Part 3B, neither the person nor the person’s partner is an eligible recipient of a category P welfare payment, but the person or the person’s partner is an eligible recipient of a category R welfare payment; or (c) the person is a CDEP scheme participant. A category P welfare payment is defined as a social security benefit or a social security pension (other than age pension and carer payment) or ABSTUDY living allowance. A category R welfare payment is defined as an age pension, carer payment, service pension, income support supplement or Defence Force Income Support Allowance. Definitions are found in the Social Security and Other Legislation Amendment (Welfare Payment Reform) Bill 2007; http://www.austlii.edu.au/au/legis/cth/bill_em/ssaolaprb2007684/memo_0.html.

Cape York Welfare Reform—Evaluation
184
Community Development Employment Projects (CDEP) participants where they reside in or have lived in Aurukun, Coen, Hope Vale or Mossman Gorge for at least three months since 1 July 2008, and where the FRC has received a notice concerning one or more of the following trigger events:
a person’s child is absent from school for three full or part days in a school term without a reasonable excuse, or the person’s child of school age is not enrolled in school without a lawful excuse
a person is the subject of a child safety report
a person is convicted of an offence in the Magistrates Court
a person breaches his or her tenancy agreement; for example, by using the premises for an illegal purpose, causing a nuisance or failing to remedy rent arrears.
The FRC receives information from notifying agencies if a person living in one of the four CYWR communities breaches a social obligation specified by the trigger events listed above.
The notifying agencies responsible for providing information about a trigger event or incident to the FRC are:
The Department of Education, Training and Employment
The Department of Communities, Child Safety and Disability Services
The Department of Justice and Attorney-General (Magistrates Court)
The Department of Housing and Public Works or the provider of social housing.
The FRC can hold a conference with a client, at which the FRC talks with the client about their behaviour. The FRC strives to reach agreement with the client about what should happen in the first instance. After conferencing a client, the Commission can take a range of actions to restore socially responsible behaviour, including:
case management, including referrals to support services (agreed by the client)
income management
follow-up monitoring
re-conferencing and intensive case management (Active Family Pathways) where required.
Over time, the FRC may employ all of these approaches with a client, particularly for a person named in multiple notices. Appendix A provides details of the FRC process taken from the KPMG review.
7.1.2 Terminology for FRC operations
The terms used in this chapter are based on the Family Responsibilities Commission Act 2008 (FRC Act) and guidelines used by the FRC. To assist readers, four key terms are described here:
Community member—people come under FRC jurisdiction if they or their partners are welfare recipients, or if they are CDEP participants, who reside in or have lived in Aurukun, Coen, Hope Vale or Mossman Gorge for at least three months since 1 July 2008.363 This includes all people, both Indigenous364 and non-Indigenous.
363 Section 7 of the FRC Act defines a community member as a person who is a welfare recipient and who also lives in one of the four CYWR communities or has lived there for a period of three months since 1 July 2008. Section 8 of the FRC Act defines a welfare recipient as a person or the person’s partner who is in receipt of welfare payments. In addition, CDEP participants receiving CDEP wages are considered welfare recipients, come under the jurisdiction of the FRC and can be income managed by being exited from CDEP wages arrangements and moved on to income support. Only people who come under the definition of a community member under the Act are within the jurisdiction of the FRC. Therefore, a person who is working (and therefore not receiving welfare payments) and lives in a CYWR community, or who has been convicted of an offence in a CYWR

Family Responsibilities Commission
185
Trigger events—represent a breach of the social obligations as defined in the FRC Act. The FRC examines information provided by the notifying agencies about a trigger event and then determines whether the person or persons named in the agency notice are in jurisdiction.
Notices—are information about the trigger event. The community members identified in a trigger event and under FRC jurisdiction are recorded on the FRC operational database. Several people may be identified in notices about a trigger event, and each person identified is registered as an FRC client if they are in jurisdiction. Notices detail the date, trigger event type and person to be held accountable.
Client—a community member identified in an agency notice who is within jurisdiction and is aged 17 years or over.
Further definitions of terms are shown in the glossary of this report.
7.2 Key findings
7.2.1 Overall The primary purpose of this chapter is to explore and describe the patterns of breaching of the social obligations specified as triggers for the FRC in the trial, and how people have responded to the FRC over time.
In the first three years of the trial, half of the adult population in the four CYWR communities had direct contact with the FRC for breaching at least one social obligation specified as a trigger event. This illustrates the extent of the problem of people breaching their social obligations in the trial communities. The most common breaches of social obligation related to people committing crimes, particularly in Aurukun, and people not sending their children to school.
When community members breached a social obligation, the majority (82%) were asked to attend an FRC conference; of these two-thirds attended, indicating that the majority of people accepted the authority of the FRC. Sixty per cent of clients who were asked to attend a conference were put on a case plan. The FRC starts case managing a client when the FRC has agreed with a client or directed them to attend services. Over 90 per cent of people who were referred to services attended at least one of their service referral appointments.
Below are key findings illustrating the level of social responsibility, the acceptance of authority, the level of compliance with the FRC, service referral rates, and the effectiveness of the FRC. These sections compare results from the start of the trial to the end of the reporting period (July 2008 to December 2011).
7.2.2 Level of social responsibility
Level of exposure to the FRC
Half of the adult population in the four CYWR communities in 2010 were notified to the FRC and therefore had breached at least one social obligation listed as a trigger event. The majority of people on income support or CDEP in the four CYWR communities in 2010 had a notice (76%).
The number of notices per year did not change considerably during the course of the trial. In addition, there was little change in the proportion of FRC clients who were subject to a further notice within a year.
community but lives elsewhere, is not within jurisdiction and cannot be dealt with by the Commission (based on FRC quarterly report, no. 4, p. 11). 364 The term ‘Indigenous’ is used here to include Aboriginal and Torres Strait Islander peoples.
Cape York Welfare Reform—Evaluation
186
A high proportion of clients had ongoing involvement with the FRC for most or all of the trial period to date. Just under a third of clients received notices in one year, around a quarter received notices for two of the four years and around 40 per cent received notices in three or four years.
By 2011, the FRC was dealing primarily with existing clients and the proportion of new clients had declined to less than 10 per cent of all clients. This could indicate that by the third year of the trial the FRC had reached most people in the four communities who were breaching their social obligations.
Incidents within the FRC’s jurisdiction
The majority of the trigger events involved clients from Aurukun (58%) and Hope Vale (29%), with 6 per cent from Coen and 8 per cent from Mossman Gorge. This reflects the size of these communities.
Most trigger events were the result of magistrates court convictions, followed closely by school attendance issues.
In some circumstances, several adults may be involved in a trigger event, allowing the FRC to talk to any responsible adults involved in a matter concerning a child. This allows the FRC to take a holistic approach to case management (see Section 7.2.4). All magistrates court convictions resulted in one notice for one client only. Most school attendance triggers (73%) led to notices against one carer. In contrast, only 37 per cent of child safety and welfare triggers led to notices against one client.
Magistrates court notices were highly variable over time across the four communities; however, there was a rising trend until around the middle of 2010 and then a decline in 2011.
Between July 2008 and December 2011, there was a clear increase in school attendance notices (driven by Hope Vale) and a decreasing trend in child safety notices (driven by Aurukun). There were few housing tenancy notices, and most occurred in the first months of 2010.
Women were subject to more notices than men (5,249 and 3,911, respectively). The gender differences in numbers of notices can mostly be explained by women being largely responsible for school attendance and child safety notices, which formed 45 per cent and 11 per cent of all notices, respectively, while men were mainly responsible for magistrates court notices.
7.2.3 Acceptance of the FRC’s authority
There are two sources of information on which to base assessments of the acceptance of the FRC authority—perceptions reported by the community members in the social change survey and the FRC administrative data on client participation shown below.
The social change survey noted a relatively high level of support for the FRC in the CYWR trial communities. Overall, over half of the community members felt that the FRC is good for the community, and around the same proportion want the FRC to keep helping people and would support people when they are being helped by the FRC.
Overall, 65 per cent of community members surveyed felt that people should go to the FRC if they do not take their kids to school.
Of the surveyed people who had attended an FRC conference (205 people, 35% of all survey respondents), 90 per cent said that they followed up and did what they talked about with the FRC; of those, 66 per cent said that the FRC made things better for them. Two-thirds (66%) of respondents felt that the community would be a better place to live if everyone followed up on their talks with the FRC, and did what was discussed at the FRC conference.

Family Responsibilities Commission
187
7.2.4 Client participation
Conference attendance
Most clients with notices (82%) were asked to attend a conference. Around 90 per cent of all clients asked to a conference attended at least once. The average attendance rate at conferences was around 66 per cent.
Sixty per cent of conferenced clients were put on a case plan; the remainder were not put on a case plan and therefore were not required to attend a referral service.
Case management and service referral attendance
Some 82 per cent of all case-managed clients had from one to three service referrals. Around 93 per cent of all clients referred to a service attended the service at least once. The average service referral attendance rate was 41 per cent, based on attendance reports submitted every time a client had to attend a service.
The case plan monitoring process requires service providers to report their assessment of progress made by case-managed clients in addressing issues. The majority of clients (83%) were assessed as having made progress on less than 10 per cent of occasions. This assessment of progress is ambiguous and should be used with caution, as it may be subject to subjective views of different case managers and it is possible that their assessments would widely differ from each other.
Income management
Income management, which can be compulsory or voluntary, is used in the CYWR as both a sanction and a support for clients.365 Income management is the only sanction available to the FRC for non-attendance at conferences. It is the last resort used by the FRC when persuasion and other forms of authority have not resulted in individuals changing their behaviour. Income management is sometimes imposed to help people who are in financial crisis or who have chronic difficulties managing their finances. Income management is also provided voluntarily to a small number of people who ask to be placed on income management, usually to avoid financial harassment.
Clients were more likely to be put on income management as the number of notices served against them increased.
One-third (419) of clients (34% of 1,257 clients), reflecting even proportions of men and women, were put on income management.
Of clients on income management, 32 per cent had their income management period extended at least once, and 32 per cent had their income management revoked.
7.2.5 Effectiveness of the FRC
The FRC data do not provide direct information on outcomes, as the FRC database is a record of administrative processes. From an analytical perspective, the best approach would be to link FRC data with outcome data to assess the impact of the FRC on these outcomes, which was only possible for data on unexplained absences from school. The next chapter provides a detailed assessment of the impact of the FRC on school attendance (Section 8.4). Nevertheless, the FRC, as a key component of the welfare reform, is likely to have community-level effects beyond the people who are brought before it.
The FRC works in an administratively complex environment but is operating effectively despite these challenges. There are, however, some issues that could be considered if the FRC is to
365 There were 30 clients on voluntary income management (7% of all income managed clients between July 2008 and December 2011).

Cape York Welfare Reform—Evaluation
188
continue, particularly concerning streamlining the administrative processes, improving case management, succession planning so that Local Commissioners can take more responsibility, and continuing to strengthen ties with service providers and other projects.
The role of the FRC in conducting conferences and putting some clients on income management is well understood by service providers and other stakeholders. However, what is less well understood is the role that the FRC plays in case management. The FRC refers clients to services and tries to support those clients who access those services. The FRC also monitors whether clients actually attend other services and programs. While this places a burden on service providers and the FRC, it also allows the FRC to monitor and assist clients as they seek and receive assistance. It would strengthen future FRC practices if there were more formalisation of case managers’ assessments of clients’ progress.
The FRC has been implemented according to the original program logic, but if anything the FRC has become even more significant to CYWR by taking on a range of tasks, including coordinating services, quality assurance of program data and mediating between warring factions in some communities. The FRC has worked hard to ensure succession planning in the face of significant obstacles and personal challenges for Local Commissioners.
The FRC was planned as a short-term measure and was initially only legislated to operate for 3.5 years. As yet, no exit strategy for the FRC has been developed. The rate of notifications has not declined, and the social change survey, although finding significant improvements, indicates that there are a range of problems still to be addressed involving behaviour, Indigenous authority and wellbeing. Thus the problems that the FRC is addressing are still prevalent in these communities. Many stakeholders who were consulted believed that if the FRC is discontinued (as is implied in the program logic), there will clearly need to be a robust mechanism for taking forward Indigenous authority and leadership of welfare reform in the communities. If the FRC is replaced by other bodies or functions, they would need to be demonstrably as effective as the FRC at carrying out these tasks.
7.3 Role and implementation
7.3.1 Role The FRC is at the centre of the CYWR process. Welfare reform is associated with the FRC more than any other of the projects or initiatives, and it is the FRC more than any other component of the CYWR trial that makes the trial unique. The FRC has a different status from the other projects, in that it is constituted in an Act of Parliament and therefore has a statutory remit. In the welfare reform process, the FRC acts as a fulcrum for the reform and has driven much of the reform agenda in the four communities. The social change survey found that identification and interaction with the FRC was a major factor in community members’ engagement with welfare reform. Without the FRC, it is arguable that the reforms would not be very different from a range of initiatives that are taking place in Indigenous communities across Australia.
The stated aims of the FRC are to:
Restore socially responsible behaviour and local authority in the WR communities and to help people resume primary responsibility for the wellbeing of their community and the individuals and families of the community. (FRC Act, section 4)
However, the FRC serves a number of other roles in the CYWR trial, including:
being the primary referrer to many of the services (although self-referrals are increasing)
taking responsibility for ensuring that clients receive services and that services address the needs of the client

Family Responsibilities Commission
189
monitoring the efficiency of reporting of services.
As the main referrer to other services, the FRC often takes the role of coordinating service provision to its clients, and sometimes has taken a more strategic role in attempting to coordinate services in the communities.
The FRC was initially legislated to function until December 2011. The Commission has been extended for two years.
The implementation of the FRC was evaluated in 2010 by KPMG. That evaluation found that, despite some significant challenges, the FRC had been effectively implemented and was making progress towards its primary goals of changing social norms and restoring Indigenous authority in the CYWR trial communities. The evaluation report made a number of recommendations for the better functioning of the FRC, some of which appear to have been subsequently implemented.
7.3.2 Implementation
The initial phases of set-up were very challenging for the FRC. Challenges included:
inadequate administrative processes
lack of services for clients and lack of follow-through from some services
ideological differences with service providers
staffing issues
Commissioners who were not appropriate for the role
poor facilities for holding conferences in some communities.
Despite these challenges and complex administrative arrangements, the FRC has continued to operate efficiently in all four communities throughout the period of the CYWR trial.
Many of these issues were also documented in the KPMG implementation review. The review recommended that:
development of the FRC system should be progressed, focusing on the linkages and cooperation between the Commission, notifying agencies and support services
forward planning for the volume of clients likely to enter the FRC system and the associated required resourcing should be undertaken
ongoing communication with community members about the FRC, to grow broader understanding about the consequences of negative behaviour and the supports for change to align with community values which it provides, should be continued (KPMG, p. 6).
This evaluation did not find concerns about resourcing, but the concerns about linkages and communication are ongoing.
Because the FRC is innovative and unique, it is very difficult to assess the effectiveness of the implementation of the FRC or to gauge the extent to which the problems and challenges it has encountered are ‘teething problems’ common to all innovative interventions, or whether some are systemic problems that are inherent in the model. Clearly, the tension between its roles of providing the main focus for restoring authority and being the primary referrer to services has caused some tensions for the FRC. However, it has worked very hard to resolve these issues.
7.4 Data analysis approach Data about trigger events and the clients identified in notices serve two purposes in this analysis.

Cape York Welfare Reform—Evaluation
190
First, they provide a proxy indicator for various levels of social responsibility in the CYWR trial communities. Because the triggers are automatic when a person breaches one of the specified social obligations, the number of trigger events and notices provides a proxy of the incidence of those domains (crime, schooling, housing tenancy and child welfare) in the communities. However, the four domains are not exactly equivalent as proxies. For example, child and welfare notices are partly determined by such factors as awareness of the issue and people’s willingness to report, and magistrates court notices only reflect a subset of all crime. Like all administrative data, these datasets are also subject to changes in definitions and in reporting processes, and therefore provide an indication rather than a direct measure of changes over time.
The second purpose is to provide an indication of the effectiveness of the FRC. Ideally, any person who is under the jurisdiction of the FRC will attend a conference, attend the services which the FRC recommends or abide by a family responsibility agreement. Subsequent notices to the FRC can thus be seen as a sign that problems persist. Of course, some problems are complex and deep seated, and are unlikely to be resolved after dealing with one notice. Nevertheless, in general terms, the rate of subsequent notices, attendance at the FRC and time between notices are all indicators of the effect that the FRC is having on its clients. However, this analysis similarly provides only a proxy indicator of the effectiveness of the FRC because a range of other factors affect the rate of subsequent notices, including the availability of services, the movement of people into and out of the four trial communities and other eligibility issues related to the functioning of the Commission.
It should also be noted that, while the majority of notices relate to the trigger event, the FRC has some discretion and there are cases in which the trigger event may not relate directly to the issue or issues that are addressed by the FRC. A person may be notified for school attendance but be referred to the Wellbeing Centre, MPower or parenting service for a different issue, which can emerge in the conference. The FRC also draws from the Commissioners’ own knowledge of the community and the family in its decisions to conference or to refer. From a data analysis point of view, this means that there is not always a direct relationship between trigger events, conferences, referrals and outcomes.
7.5 Effectiveness of the FRC The primary purpose of this chapter is to examine the FRC administrative data to seek to understand the pattern of people’s interaction with the FRC over time and to look for any signs of change. The analysis uses data on trigger events and notices, clients, conference attendance, service referrals and income management to describe how people have responded to the FRC over time.
The theory of change asserts that the authority of the FRC plus the capacity developed by people using support services and opportunities will both persuade, and enable people to change their behaviour through identification with leaders, increased efficacy, and initial agreement and eventual internalisation of the social norms and aspirations of the trial.
Some analysis of patterns has been conducted. This includes:
the exposure of the population of the four communities to the trial, indicated by the proportion of the adult population and the in-jurisdiction population involved in the FRC during the trial
the concentration of behaviours that breach the social obligations, as indicated by the range in the trigger events and the number and type of unique individuals involved
the extent of repeated breaching of social obligations, as indicated by repeat notices to the same people over time
acceptance of the FRC’s authority and clients’ participation and response to notices to attend conferences, indicated by attendance rates at conferences

Family Responsibilities Commission
191
clients’ responses to FRC case plan recommendations, particularly engagement with services following referrals, indicated by attendance at services, and service providers’ assessment of progress against their goals
the impact of income management, indicated by examining whether clients are more or less likely to have a notice about another trigger event after being placed on income management
the direct impact of FRC conferences on school attendance is covered in Chapter 8, based on matching FRC data with students attendance records.
This chapter uses the FRC data relating to triggers, notices, clients, conferences, case management and income management to provide a description of the nature of the FRC processes. It also examines the outcomes for subgroups, particularly by age and gender, members of different communities and people subject to the different types of notices.
7.5.1 Summary of FRC data The FRC data tell us about the way people flow through the system of conferencing and service referral. The process begins when a person breaches a social obligation. This trigger event results in a notifying agency informing the FRC about the adults and any children involved in the matter. The FRC process then establishes whether people named in information about the trigger event by the notifying agencies are living in the communities and are in jurisdiction (i.e. whether they are in receipt of income support payments or CDEP wages).
The FRC determines whether the people identified in agency notices are in jurisdiction366 by matching them with Centrelink and CDEP records367, identifying unique clients and registering them on the FRC database. Notices are only recorded on the database for clients who are within jurisdiction. Clients of the FRC may have multiple notices because information about a trigger event can identify multiple people who have breached social obligations. The FRC decides who to call to conferences and schedules appointments. At conferences, the FRC may place clients on case plans and refer them to services, or order income management, or both.
Table 7.1 presents the number of trigger events, notices, appointments, conferences, case plans and income management orders, and the number of FRC clients. The first recorded trigger event in the dataset was received by the FRC on 10 July 2008. Trigger events were received for people in all four communities on that day. The last trigger event shown in these data was recorded on 23 December 2011. For simplicity, the data have been taken to cover the period from the establishment of the FRC on 1 July 2008 to the end of 2011.
Information on 7,737 trigger events about a breach of one of the social obligations regarding crime, school attendance or enrolment, child safety or welfare, or tenancy was provided by notifying agencies.
There were fewer trigger events (7,737) than notices (9,170) because several people may be identified in information about a trigger event and each person identified as being in jurisdiction is registered as an FRC client, and a notice is recorded for them. This was particularly the case for school attendance, as the information provided to the FRC may identify two or more adults responsible for the care of the child. The counts of processes such as notices, conferences and income management were larger than the counts of FRC clients for each of these processes, because a FRC client may be served with a number of notices, attend more than one conference or have more than one case plan or period on income management.
366 Data for people with notices who are not within jurisdiction are not included in this chapter. Due to privacy restrictions, the FRC does not have information on unique individuals who are identified in notices but are outside its jurisdiction. 367 The FRC legislation enables data matching and also sets out privacy protections that limit the information that the FRC may hold.

Cape York Welfare Reform—Evaluation
192
The number of notices (9,170) was much larger than the number of individual FRC clients (1,257) because over time one client may be issued with multiple notices. Of the 1,257 clients 1,062 were asked to attend conference appointments (i.e. they were given a notice to attend). The lower number of appointments is because the FRC may deem that a client does not require an appointment. Slightly fewer clients with appointments were conferenced (1,002). Of the 1,257 clients, 484 were income managed and 663 had case plans. On average, each client was subject to 7.3 notices over the period from July 2008 to December 2011. On average, each trigger event led to 1.2 notices.368
Table 7.1 Summary of FRC activity showing numbers by activity and FRC client counts, from July 2008 to December 2011
Trigger events Notices Appointments
scheduled Conferences
attended Case plans Income
management Number in each activity
7,737 9,170 5,034 3,818 993 484
FRC client counts 1,257 1,062 1,002 663a 424 a This total includes 25 clients who were on Active Family Pathways case plans. Source: FRC data for 1 July 2008 to 31 December 2011.
7.5.2 Population profile
To provide context for the analysis in this chapter, the potential population within jurisdiction over the course of the trial, the proportion of the adult population notified and the number of new clients by year is provided first.
Potential population in jurisdiction
The potential population of people within jurisdiction living in the four CYWR communities is made up of people on income support and CDEP. This potential population ranged from 1,276 in 2008 to 1,057 in 2011 (Table 7.2). While the potential population on CDEP declined over the four-year period, with reforms to CDEP (described in Chapter 2), there was some increase in the number of income support recipients, from 641 in 2008 to 965 in 2011.
Table 7.2 shows that in the last six months of 2008, 35 per cent of the potential population of people on income support or CDEP in that year became clients of the FRC, but this rose in 2009 to 69 per cent. By 2011, 74 per cent of the potential population on income support or CDEP in that year were clients of the FRC.
Table 7.2 Potential population in jurisdiction (on income support or CDEP) and FRC clients, 2008 to 2011
Potential population FRC clients
Year Income support
recipientsa CDEP participants
on CDEP wages Total
Clients with notices in that
year
as % of potential population
2008 641 635 1,276 443 35 2009 818 276 1,094 751 69 2010 1,011 112 1,123 852 76 2011 965 92 1,057 787 74 a Data on the number of partners of people on income support are not available. Source: FRC data for 1 July 2008 to 31 December 2011 for FRC clients, DEEWR and FaHCSIA for income support and CDEP (see CYWR monitoring report, Appendix B).
The spread of clients by community was very similar to the spread of the potential population by community. There was only a slight difference for Mossman Gorge (9% of FRC clients were from Mossman Gorge, compared with 7% of the potential population). Thirty-four per cent of FRC clients were from Hope Vale compared with 35 per cent of the potential population, and 10 per cent of FRC
368 The relationship between triggers, notices and clients is summarised as follows: 7,737 triggers x 1.2 notices per trigger = 1,257 clients x 7.3 notices per client = 9,170 notices.

Family Responsibilities Commission
193
clients were from Coen compared with the 11 per cent of the potential population. The share of FRC clients was the same as the share of the potential population for Aurukun (47%).
Proportion of adult population notified
The potential population in jurisdiction described above excludes people who are employed or not in receipt of income support. In contrast, we can compare the number of clients to estimates of the adult population of the CYWR communities aged 17 or over in 2010.
Half of the population of the CYWR communities in 2010 were notified to the FRC and therefore had breached at least one social obligation listed as a trigger event (852 clients had notices in 2010 out of an estimated adult population of 1,669.369)
New clients, by year
If a person breaches a social obligation specified under CYWR as a trigger event, and the FRC receives information from a notifying agency, they will become a new client of the FRC if they fall within its jurisdiction. As shown in Table 7.3, the number of new clients changed considerably year on year. The FRC only operated for the last six months of 2008, but even so nearly 450 people triggered their first notice in this period. The number remained more or less the same for 2009 but then dropped in both the subsequent years. This indicates that by 2011 the FRC was dealing primarily with existing clients and the proportion of new clients had declined to less than 10 per cent of all clients who have received notices (see Table 7.1).
Table 7.3 New and existing FRC clients, 2008 to 2011
Year of notice New clientsa Existing clients with notices in that year
All clients with notices in that year
% who were new clients
2008 443 n/a 443 100 2009 430 321 751 57 2010 262 590 852 31 2011 122 665 787 16 n/a = not applicable a The total number of new clients was 1,257. Source: FRC data for 1 July 2008 to 31 December 2011.
7.5.3 Trigger events and notices
When an incident has occurred, such as a child missing three days of school in a term, which results in a notifying agency informing the FRC about the matter, this is referred to as a trigger event. Trigger events are only shown for clients within the jurisdiction of the FRC. If a person who is not in jurisdiction breaches a social obligation, that does not become a trigger event. This chapter does not provide information about such situations.
This section looks at the make-up of the trigger events based on the number of clients identified in each trigger event, the number of notices by community, the demographic differences and the trends in notices over time.
Trigger events, by number of notices
One or more persons can be included in information about a trigger event. Most trigger events (84% or 6,469) led to a notice against one client only. A further 15 per cent (1,138) led to notices against two clients. The remaining 130 trigger events (1%) resulted in notices served against three to six
369 Source: Estimated Resident Population (ERP) produced by OESR, Queensland Treasury, based on the 2006 Census. The estimated resident adult population (people aged 17 years or over) is derived by applying the proportion of the 2006 Census collection district population aged 17 years or over to the total estimated residential population for the four communities at 30 June 2010.

Cape York Welfare Reform—Evaluation
194
clients. This explains the larger number of notices than trigger events (1,433 more notices than trigger events) shown in Table 7.1.
Table 7.4 shows that all magistrates court convictions resulted in one notice for one client only. Triggers were therefore equivalent to notices in these cases. Most school attendance triggers (73%) led to notices against one carer. In contrast, only 37 per cent of child safety and welfare triggers led to notices against one client, while 63 per cent led to notices against two or more clients.
Table 7.4 Trigger events and notices, by type
Trigger events Notices Rate of notices per
trigger event Magistrates Court 3,888 3,889 1.0 School attendance 3,171 4,106 1.3 Child safety and welfare 544 1,012 1.9 Housing tenancy 134 163 1.2 Total 7,737 9,170 1.2 Source: FRC data for 1 July 2008 to 31 December 2011.
Of those trigger events that involved two or more individuals, only six breaches led to notices being served against individuals from different CYWR communities.
The number of trigger events leading to only one notice declined year on year, reflecting the decreasing trend in Magistrates Court notices from 2009 to 2011, while the number resulting in two notices increased, a result of the increasing trend in school attendance trigger events.
Trigger events by community
The majority of the 7,737 trigger events involved community members from Aurukun (58%), 29 per cent from Hope Vale, 6 per cent from Coen and 8 per cent from Mossman Gorge, although the percentage of the adult population notified in each community was about the same, in all communities. Magistrates court triggers made up the highest number of breaches, followed closely by school attendance triggers.
The type of trigger event varied according to the size of the community. Although the number of magistrates court trigger events was greater in all communities, in the larger communities of Aurukun and Hope Vale school attendance accounted for almost half of all triggers (Table 7.5). In the smaller communities of Coen and Mossman Gorge, more than 60 per cent of triggers were linked to a magistrates court conviction. Housing tenancy accounted for less than 4 per cent of notices in all communities.
Table 7.5 Trigger events, by type and community
Magistrates Court School
attendance Child safety and
welfare Housing tenancy Total Aurukun 2,113 2,039 270 27 4,449 Hope Vale 1,088 925 175 72 2,260 Coen 298 73 59 9 439 Mossman Gorge 389 134 40 26 589 Total 3,888 3,171 544 134 7,737 Source: FRC data for 1 July 2008 to 31 December 2011.

Family Responsibilities Commission
195
Trigger events, by year
Table 7.6 shows that there was a clear increasing trend in school attendance trigger events (driven by Hope Vale) and a decline in child safety and welfare trigger events in 2011(driven by Aurukun). Housing tenancy trigger events were flat, and almost all occurred in the first months of 2010.370
Magistrates court trigger events were variable over time across the four communities. Significant dips in the number of these trigger events occurred in the first quarter of 2009 and the second quarter of 2010 and in 2011. This was largely driven by trigger events in Aurukun (as 54% of all notices involved clients from there).
Table 7.6 Trigger event notices, 2008 to 2011
Year Magistrates Court School attendance Child safety and
welfare Housing tenancy 2008 328 211 124 2 2009 1,241 914 146 22 2010 1,276 954 175 83 2011 1,043 1,092 99 27 Total 3,888 3,171 544 134 Source: FRC data for 1 July 2008 to 31 December 2011.
7.5.4 Notices and clients
This section examines the types and number of notices and the number of clients. As discussed above, a notice is recorded when a community member named by an agency in relation to a trigger event is identified as being in jurisdiction and is therefore recorded on the FRC database as a client.
This section commences with a discussion on the number of notices per client, followed by an analysis of the average number of notices per client by year. The data are further analysed to assess the difference by community and by demography. They also show the probability of clients receiving repeat notices at different stages of the trial to assess whether clients are likely to receive fewer notices over time in accordance with the program logic.
Number of notices per client
This section examines the number of notices per client. Table 7.7 shows that there was a wide range in the number of notices per client. Half of the clients (50%) received four notices or fewer until December 2011, followed by 21 per cent of clients who received five to eight notices over the course of the trial. The remaining 29 per cent received nine or more notices. On average, clients were subject to 7.3 notices.
Table 7.7 Number of notices per client
Number of notices Clients
(no.) Proportion
(%) Notices
(no.) Proportion
(%)
01–04 626 50 1,387 15 05–08 269 21 1,707 19 09–12 148 12 1,525 17 13–16 79 6 1,131 12 17–20 46 4 827 9 21 or more 89 7 2,593 28 Total 1,257 100 9,170 100 Source: FRC data for 1 July 2008 to 31 December 2011.
370 This anomaly in housing notifications was due to an agreement by Hope Vale Council to divest tenancy management responsibilities to the Queensland Department of Communities. See Chapter 8 for a full explanation.

Cape York Welfare Reform—Evaluation
196
Notices and clients, by calendar year
Table 7.8 shows that, apart from the first year of the trial (in which the FRC only operated for six months), the average number of notices per client did not change significantly from year to year—indicating that the number of clients and the number of notices remained stable during the course of the trial.
Table 7.8 Average number of notices per client, 2008 to 2011
Year Clients Notices Notices per client 2008 443 781a 1.8 2009 751 2,572 3.4 2010 852 3,002 3.5 2011 787 2,815 3.6 a This figure refers to notices in the second half of 2008. Source: FRC data for 1 July 2008 to 31 December 2011.
Clients subject to notices, by year
Table 7.9 indicates the number of FRC clients who received notices in one, two, three and four years of the trial (in fact the data are available for the three-and-a-half year period from July 2008 to December 2011, so the number in the four-year category is lower than would be expected if the full four-year dataset had been available). Just under a third of clients received notices in one year, around a quarter received notices in two of the four years, and around 40 per cent received notices in three or four years. Taking into account the caveat above, this indicates that a high proportion of clients had ongoing involvement with the FRC for most or all of the trial period to date.
Table 7.9 Number of clients receiving notices in one, two, three and all four years of CYWR
Location One year Two years Three years Four years Total Aurukun 152 151 161 124 588 Hope Vale 155 124 82 63 424 Coen 55 29 32 10 126 Mossman Gorge 44 34 26 15 119 Total 406 338 301 212 1,257 % 32% 27% 24% 17% Source: FRC data for 1 July 2008 to 31 December 2011.
Notices and clients per community
The average number of notices per client in Aurukun (9.0) was particularly high, mainly because of the high rate of unexplained school attendance absences in Aurukun (see Table 7.10).
Table 7.10 Average number of notices per client
Community Clients Notices Notices per client Aurukun 588 5,293 9.0 Hope Vale 424 2,691 6.3 Coen 126 515 4.1 Mossman Gorge 119 671 5.6 Total 1,257 9,170 7.3 Source: FRC data for 1 July 2008 to 31 December 2011.
Clients with notices, by age and gender
Clients, by age
Over half the clients (53%) who received one notice or more were in the 25 to 44 year age bracket, followed almost equally by 45–54 year olds (17%) and 25–34 year olds (16%). Only 4 per cent of

Family Responsibilities Commission
197
clients were under 20 years of age. Table 7.11 shows that the age profile is similar across the communities.
Table 7.11 Age profile of clients, by community
Client age groups Aurukun Coen Hope Vale Mossman Gorge Total under 20 23 2 20 9 54 20–24 83 24 76 18 201 25–34 158 36 121 33 348 35–44 168 28 100 25 321 45–54 95 21 70 22 208 55–64 45 11 25 11 92 65+ 16 4 12 1 33 Total 588 126 424 119 1,257 Source: FRC data for 1 July 2008 to 31 December 2011.
Clients, by gender
The overall trend was for males to receive fewer notices than females. Of the 626 clients who received between one and four notices, 57 per cent (354) were male and 44 per cent (272) were female. However, of the 148 clients who received 9 to 12 notices, 51 per cent (76) were female and 49 per cent (72) were male. Among those who received more than 12 notices, the proportion of females was even greater.
The gender differences in numbers of notices can mostly be explained by women largely having school attendance and child safety and welfare notices, which form 45 per cent and 11 per cent of all notices, respectively, while men mainly had magistrates court notices.
There were differences in the type of notices by community in respect of males and females. Females in all communities except Coen were subject to more notices than males.
Repeat notices
The rate of notices subsequent to engagement with the FRC may be one possible indicator of clients’ responses to the FRC over time. Table 7.12 sets out the proportion of clients who received a further notice from the FRC within different periods following a notice (within the next quarter, the next six months or the next year) or never received another notice. It should be interpreted as follows. Of those clients notified in the first quarter of 2009, 53 per cent received their next notice(s) within the next quarter, 65 within the next six months, and 83 per cent within the next year. Nine per cent were never notified again.
Table 7.12 Percentage of clients receiving a subsequent notice over time, by quarter
2008 2009 2010
Year Q3 Q4 Q1 Q2 Q3 Q4 Q1 Q2 Q3 Q4 Quarter 31 37 53 53 59 54 55 55 51 56 Six months 58 55 65 67 72 70 67 68 67 66 Year 75 75 83 79 84 81 77 79 79 81 Never 7 9 9 13 10 12 n/a n/a n/a n/a n/a = not applicable
The table shows that after the FRC was active for six months around half the clients were likely to have received another notice in the next quarter. This likelihood remained much the same throughout the course of the trial. The probability of receiving a subsequent notice within six months also remained steady throughout the duration of the CYWR trial, as did the probability of receiving a subsequent notice within a year. Overall, Table 7.12 indicates that clients of the FRC were as likely to be subject to another notice within a year during 2010 as they were at the beginning of the trial.

Cape York Welfare Reform—Evaluation
198
7.5.5 Appointments and conferences This section examines the number of appointments for conferences scheduled and conferences actually attended. Appointments are made with clients who are served with a notice to attend a conference. A conference is held between the FRC Commissioners and the person who has had an appointment scheduled.
The FRC administrative data show a total of 5,034 appointments scheduled371 for the period from 1 July 2008 to 31 December 2011, corresponding to an average of 120 appointments per month. Appointments can be rescheduled for a range of reasons, many of which are considered legitimate by the FRC (clients are not penalised for not attending where there is a legitimate reason). For example, appointments may be cancelled by the FRC because of deaths in the community, clients may not be available due to medical evacuation, or travel back to community may be delayed due to the wet season. The FRC does not hold quantitative data on the reasons for rescheduling appointments.
Appointments were made in respect of 82 per cent of all clients. Of those appointments, 3,320 were attended, giving a conference attendance rate of around 66 per cent, which remained fairly constant throughout the trial. Women had a higher attendance rate (70 per cent compared with 60 per cent for men).
The appointments were made in respect of 1,062 clients, corresponding to an average of 4.7 appointments per client.
Of the 1,714 appointments not attended, 498 (29%) led to a decision in absentia: this was usually a warning, or an invocation or extension of income management. Decisions in absentia involved 345 clients.
The difference in non-attendance between men and women is largely due to lower attendance by young men (11–20 years of age) in Hope Vale, who were twice as likely as young women not to attend conferences.
A conference was deemed to have occurred when a client attended an appointment, when they walked in of their own accord or when a decision was made in absentia. There were 3,818 conferences, corresponding to an average of around 90 conferences per month.372
There were also 35 ‘walk-in’ conferences, where a client approached the FRC of his or her own accord. The first of these was recorded in the first quarter of 2010, one and a half years into the trial. The number of walk-in conferences each quarter ranged between two and ten.373
Warnings, personal responsibility programs and voluntary agreements
Clients are issued with a warning and ordered to comply with a case plan if they are not adhering to the behaviour expected of them.
The FRC issued a total of 122 warnings against 116 clients, 80 of which were in the last quarter of 2011. Sixty clients were put on personal responsibility programs (recording of these ceased in
371 Conference appointments are scheduled by the FRC to meet with people who have been served a notice to attend a conference. 372 The relationship between attended appointments, walk-ins and decisions in absentia is as follows: 3,285 attended appointments + 35 walk-ins + 498 decisions in absentia = 3,818 conferences. 373 Recording of data only commenced in 2010 for this category, as the FRC database changed in early 2010 and the previous database did not have the capacity to record the category of walk-ins. Also, the data in the current database may not reflect all walk-in conferences, as it is administratively easier to record a conference than a walk-in, so this figure is not complete and should be viewed only as indicative.

Family Responsibilities Commission
199
2010).374 There were 31 voluntary agreements to begin, modify or end a case plan or income management.
7.5.6 Case plans
Clients who enter into an agreement, or who are ordered to attend community support services, are case managed by the FRC. Monitoring of clients is done through case plans. The purpose of a case plan is to provide a framework or tool to encourage and/or direct clients to engage with a community service provider in order to address personal circumstances affecting the client’s ability to display and maintain socially responsible standards of behaviour.
The Active Family Pathways (AFP) framework is offered to selected individuals and families requiring assistance and support to navigate services and agencies to access the personal assistance they require. The model is voluntary, and collaboration between the Commissioners, local coordinators and case management teams, and encourages clients to identify strategies to restore their primary responsibility for improvement in their lives and those of their families.
The FRC executes the requirement of the Act in respect of a case management role. The treatment of clients is left to the individual CYWR service providers. The FRC has some case management oversight based on the reporting by individual service provider staff that would be considered experts in their fields.
Case plans and Active Family Pathways case plans
About 53 per cent of all clients issued with a notice were managed under one of two types of case management arrangement (663 clients). Of those, the majority (638 clients) were put on a case plan and 25 clients were put on an AFP case plan. The FRC starts case managing a client when the FRC has agreed or directed a client to attend services. As part of case management, the FRC receives monthly reports from service providers about whether the client is attending a service and whether any progress is being made. A small number (25) of FRC clients are more intensively case managed through the AFP service. AFP case plans have only been used since the last quarter of 2010.
In 3,818 conferences, 993 case plans and 26 AFP case plans were instituted, meaning that a case plan was made in roughly one in every four conferences. Of these, 13 per cent or 127 case plans and AFP case plans were discontinued before the end of the plan. This may be because clients reported that they were not comfortable attending a particular service provider, in which case a new case plan could be developed. At times, case plans are ended because a client has completed all requirements, or due to ill health or death.
At the conclusion of conferences, Local Commissioners may decide that no action is necessary, reprimand the client, encourage the client to enter into a family responsibility agreement, direct the client to relevant community support services, or place the client on a Conditional Income Management order. Of the clients conferenced, 40 per cent were not referred to a service. This could be because there was no appropriate service available or they did not need a service.
Table 7.13 shows the number of clients who were put on a case plan, by community, age group and gender. The total number of males who were subject to a case plan was 312 and the total female number was 322, showing that men and women were almost equally subject to being put on a case plan. The largest age group subject to a case plan was 21 to 30 years.
374 Personal responsibility programs included tasks such as walking children to school, and the FRC reports that it was not viable to record such activities in the new database in 2010. They were not enforceable and were not specified in the Act and were phased out. Warnings are recorded instead.

Cape York Welfare Reform—Evaluation
200
Table 7.13 Clients subject to case plans, by community, age and gender
Age and gender 11–20 21–30 31–40 41–50 51–60 61–70 M F M F M F M F M F M F Total Aurukun 28 28 59 61 57 69 30 26 12 7 3 – 380 Hope Vale 15 14 29 31 19 16 10 15 3 1 – – 153 Coen 4 6 4 11 7 4 5 4 – – – – 45 Mossman Gorge 3 5 10 9 5 8 12 2 – 5 1 – 60 Total 50 53 102 112 88 97 57 47 15 13 4 – 638 Source: FRC data for 1 July 2008 to 31 December 2011.
Service referrals
Referrals to service providers
During the conferencing process, Commissioners may decide to refer the client to local providers of support services. These include Wellbeing Centres to address alcohol and/or drug misuse, gambling, parenting or social health related issues; parenting programs to assist in implementing good parenting practices; MPower, a money management component to assist with budgeting and meeting priority financial needs of individuals and families; the Student Case Management Framework to assist parents to ensure that children attend school; the Ending Family Violence Program to assist the client in addressing offending and violent behaviours and misuse of drugs and alcohol; or other appropriate support services.
Clients can be referred to different service providers, or to one service provider, for a variety of issues. Case-managed clients were referred to a number of different service providers, ranging from one to seven service providers per client. Some 68 per cent of all case-managed clients were referred to one or two service providers. On average, case-managed clients were referred to just over two service providers. Coen clients were referred to the largest number of service providers (an average of 2.4 service providers).
There were 1,383 referrals to service providers for all case-managed clients, one-third of which (458 referrals or 33%) were to Wellbeing Centres. Many referrals were to FIM/MPower services (21%) and Probation and Parole (16%). Some 10 per cent of all referrals were to school attendance officers (Table 7.14).

Family Responsibilities Commission
201
Table 7.14 Case-managed FRC clients and service providers
Community Aurukun Coen Hope Vale Mossman
Gorge Total Clients, by the number of service providers they were referred to:
1 112 14 70 22 218 2 142 14 50 17 223 3+ 131 16 35 22 204
Total 385 44 155 61 645 Clients, by type of service provider referred toa: Wellbeing Centre 233 38 137 50 458 FIM/MPower 265 27 59 23 299 Probation and Parole 146 9 39 23 217 School attendance officer 110 5 23 7 145 CYP Parenting Program 21 13 17 22 73 Parenting Program—Aurukun 45 45 Others 33 13 10 10 66 Total 853 105 285 135 1,378 a Clients may attend more than one service provider or have more than one service referral; thus the vertical sum will be more than the total number of
clients per community. Note: These data are based on 645 case plans. These numbers differ slightly from those shown elsewhere in this chapter due to data cleaning required to prepare the data for analysis. The data extract used here contained 1,257 unique FRC clients, 85 per cent of whom were conferenced (1,073 people). Lower numbers are shown elsewhere due to data cleaning to remove records with missing values. Source: FRC data for 1 July 2008 to 31 December 2011. Table prepared by FaHCSIA.
Type of service referral
The FRC also holds data on the type of service that the client is referred to, in addition to the service provider (shown above). The services that clients were referred to included addressing money management issues, drug and alcohol abuse, school attendance, domestic violence and parenting skills. Table 7.15 provides details of service referrals by type.
Clients can be referred to multiple services within a single service provider. There were 1,539 referrals, which is an average of 2.4 referrals per case-managed client. The number of referrals varied: 82 per cent of clients had from one to three referrals, and 18 per cent of clients had four to eight referrals.
Aurukun had the highest proportion of clients with more than one service referral (73%); Hope Vale had the lowest proportion of clients with more than one service referral (60%) (Table 7.15).

Cape York Welfare Reform—Evaluation
202
Table 7.15 Case-managed FRC clients, by number and type of service referral
Community Aurukun Coen Hope Vale Mossman
Gorge Total Clients, by the number of service referrals:
1 103 14 62 18 197 2 125 12 48 18 203 3 85 6 25 11 127 4+ 72 12 20 14 118 Total 385 44 155 61 645 % with more than one referral 73% 68% 60% 70% 70%
Clients, by type of service referrala: Budget and savings plan 247 23 55 21 346 Alcohol Tobacco and Other Drugs Services (ATODS)
149 23 56 33 261
Ensuring school attendance 112 5 23 7 147 Ending Family Violence 118 18 1 137 Multiple programs 81 5 25 9 120 Counselling 48 12 23 9 92 Ending Offending Program 34 9 22 22 87 Parenting Skills 21 13 17 22 73 Parenting Program 45 3 11 3 62 Men’s Group 34 1 13 4 52 Strong Spirit, Strong Mind 35 35 Anger Management Program 12 3 11 5 31 Active Family Pathways 10 7 2 7 26 Domestic Violence Program 12 3 6 3 24 Associated services 9 6 7 1 23 Women’s Group 11 1 1 13 Other 5 5 Dry house 2 2 Healthy Cooking Program 1 1 Total 948 113 326 150 1,537
a Clients may attend more than one service provider or have more than one service referral; thus the vertical sum will be more than the total number of clients per community.
Source: FRC data for 1 July 2008 to 31 December 2011. Table prepared by FaHCSIA.
Service attendance and progress
Client attendance at services can be measured in two ways. One measure is whether clients attended any service appointment at all during the period of their service referral. Around 93 per cent of all clients referred to a service attended a service at least once.375
A second measure is whether clients attended all referrals for every month of their case plans that they were required to attend and is a tougher standard. The average service referral attendance rate was 41 per cent, based on attendance reports submitted every time a client had to attend a service.376
Table 7.16 looks at all case-managed clients during the period from 1 July 2008 to December 2011 who had completed their case plan by 31 March 2012 (572 clients). Over that period, 572 clients had a completed case management plan and had a service attendance report submitted by the service provider. For every referral, clients are required to attend the service at least once per month for the duration of their case plan. The CYWR is aimed at changing behaviour and helping people find
375 The FRC often walks the client to their first service appointment and introduces them to the service provider. This is counted as an attendance. 376 In the implementation review of the FRC (2010), KPMG used a quite different service attendance rate, which was based on all referrals made and all referrals attended, rather than on unique client numbers. Using KPMG’s method, the attendance rate per referral was 80 per cent for the whole three and a half years of the trial, much higher than the 61 per cent reported by KPMG for the first year of the FRC.

Family Responsibilities Commission
203
solutions to issues that affect their ability to meet social obligations. Thus, it is important to look at client attendance at an individual level when producing an overall attendance rate.
The ‘service attendance rate per client’ for the 572 clients with completed case plans was 41 per cent. Only 22 clients (4 per cent of the total) attended all referrals for every month of their case plans.
Table 7.16 Service attendance rate based on each case-managed client
Community Aurukun Coen Hope Vale Mossman
Gorge All CYWR Average attendance rate (%) 42 42 38 45 41 Distribution of FRC clients by services attendance rates (number of clients)
0% 23 2 11 5 41 1–49% 198 25 79 22 324 50–99% 108 12 47 18 185 100% 15 2 3 2 22 Total number of clients 344 41 140 47 572
Distribution of FRC clients by services attendance rates (proportion) 0% 7 5 8 11 7 1–49% 58 61 56 47 57 50–99% 31 29 34 38 32 100% 4 5 2 4 4
Source: FRC data for 1 July 2008 to 31 December 2011. Table prepared by FaHCSIA.
Table 7.17 shows the types of services and issues clients were addressing with the help of service providers and the attendance rates of the different programs. For example, 58 clients attended an Ending Offending program, and the attendance rate for that program was the highest for all programs (66%). The largest group of clients (287 clients) comprised those referred to develop a budget and savings plan; however, these clients attended only about one-third of all service appointments they were required to attend.
Table 7.17 Types of services and attendance rates
Service referral type Client count Average attendance rate (%) Budget and savings plan 287 34 Alcohol, tobacco and other drugs issues 210 34 Ensuring School Attendance 137 61 Multiple programs 117 38 Counselling 70 41 Ending Family Violence 62 57 Parenting Program 59 40 Ending Offending Program 58 66 Men’s Group 52 31 Strong Spirit, Strong Mind 33 43 Parenting Skills 31 45 Anger Management Program 26 32 Domestic Violence Program 20 32 Active Family Pathways 18 42 Women’s Group 13 42 Source: FRC data for 1 July 2008 to 31 December 2011. Table prepared by FaHCSIA.
The service providers have to record and report on the progress made by case-managed clients in addressing their issues. Service providers assess clients’ progress and record either ‘yes’ or ‘no’ at

Cape York Welfare Reform—Evaluation
204
each interaction/service appointment. This assessment is determined at the discretion of service providers and may vary by service.377
The overwhelming majority of clients (83%378) were assessed as having made progress on less than 10 per cent of occasions, and 436 people were assessed as not having made progress at all. Only 2 per cent (13 people) were assessed as having made progress on more than half of their interactions with a service provider, and only two people were assessed as having made progress every time they were assessed. Given the challenging nature of the issues involved in many of the service referrals (such as alcohol addiction or violent behaviour), it is not clear what level of progress could be expected.
Service providers are required to provide a monthly progress report to the FRC to access each client’s progress as part of their case management. Each case manager provides their opinion as to whether the client has willingly changed their actions and behaviour to progress to their goals in the FRC case plan. This assessment of progress is ambiguous, as it may be subject to subjective views of different case managers. It is up to the case manager to determine what behaviour and actions the client would need to display to be assessed as progressing. Different service providers were used in the trial, and it is possible that their assessments could differ widely from each other. It would strengthen future FRC practices if there were more formalisation of case managers’ assessment of clients’ progress.
7.5.7 Income management
The FRC has the capacity to direct that part of a person’s income support payments be managed by Centrelink in order to pay for the priority needs of the individual or their family. Most income-managed clients are placed on income management by the FRC (referred to as ‘Conditional Income Management’), while a few people have asked to be placed on voluntary income management. Under the FRC legislation, people who are on income support or CDEP wages can be directed by the FRC to income management.379
Of the 3,818 conferences, 484 led to a client being income managed380, 188 led to an extension of income management, and 147 led to income management being revoked. Over the period from 1 July 2008 to December 2011, 424 clients were put on income management; 60 clients were put on income management more than once.
This section covers both conditional and voluntary income management. The majority of income management clients were directed by the FRC to Conditional Income Management; only 7 per cent (30 clients) were on voluntary income management.
Income management, by number of clients
Of the 424 clients who were put on income management, 136 (32%) had their income management period extended at least once, and 134 (32%) had their income management revoked. The average duration of income management was just under one and a half years (16.8 months).
The number of clients on income management rose to a maximum of 261 in the last quarter of 2010 and then fell (Figure 7.1).
377 The progress rate is based on all case-managed FRC clients for the period from July 2008 to December 2011 who had a progress record (599 people). 378 Data on progress are available for only 599 out of the 645 case plan clients. 379 While they are in jurisdiction, partners of people on income support who are themselves not on income support cannot be income managed. 380 The number of conferences leading to income management exceeds the number of people who were income managed over the period as some people are subject to more than one period of income management. In addition, some conferences also lead to more than one person being income managed.

Family Responsibilities Commission
205
Figure 7.1 Numbers of FRC clients on income management, by quarter
0
50
100
150
200
250
300
Q3 Q4 Q1 Q2 Q3 Q4 Q1 Q2 Q3 Q4 Q1 Q2 Q3 Q4
2008 2009 2010 2011
Quarter
Nu
mb
er
Source: FRC data for 1 July 2008 to 31 December 2011.
Income management, by age, gender and community
Table 7.18 shows the number of clients subject to income management, by community, age group and gender. About half of the clients subject to income management were men (210) and half were women (214). Figure 7.2 shows the age groups of all income management clients at December 2011 (data provided by Centrelink). The vast majority of income management clients were recorded as Indigenous: only five clients are not identified as Aboriginal or Torres Strait Islander in these data.381
Most clients were able to communicate in English, and only 1 per cent (six people) required an interpreter in their dealings with Centrelink.
Table 7.18 Clients subject to income management, by community, age and gender
Age and gender 11–20 21–30 31–40 41–50 51–60 61–70 M F M F M F M F M F M F Total Aurukun 16 15 37 43 35 42 10 18 5 4 – 3 228 Hope Vale 15 7 19 18 16 11 12 14 2 1 – – 115 Coen 2 1 3 7 4 5 3 3 – – – – 28 Mossman Gorge 5 3 9 7 4 8 10 1 2 3 1 – 53 Total 38 26 68 75 59 66 35 36 9 8 1 3 424 Source: FaHCSIA Income management program data, unpublished.
381 This section has been provided by FaHCSIA and provides slightly different numbers from the previous analysis of FRC data because the data were extracted slightly earlier and were extracted from Centrelink records by FaHCSIA Income Management Program Branch. However, the overall trends are very similar.

Cape York Welfare Reform—Evaluation
206
Figure 7.2 Population pyramid—all income management clients, December 2011
12 10 8 6 4 2 0 2 4 6 8 10 12
Under 20
20–24
25–29
30–34
35–39
40–44
45–49
50–54
55–59
60–64
65–69
70–74
75 or over
Ag
e g
rou
p
Percentage
Females
Males
Source: Centrelink data.
Fifty-eight per cent of all income management clients had a ‘Single’ relationship status recorded with Centrelink (123 were separated, 103 were single and 12 were widowed), and 42 per cent were shown as partnered (167 income management clients were shown in de facto relationships and nine were married).
A large proportion of all income management clients (68%) were not recorded with Centrelink as the primary carers of a dependent child. The remaining 32 per cent (134 people) were listed as the primary carer of at least one child (14% caring for one dependent child, 9% caring for two children, 6% caring for three children, and 3% caring for four children or more). This indicates that income management was not primarily used as a method for ensuring that children were well cared for.
Income management characteristics
On 25 November 2011, there were 848 current recipients of a main income support payment in the four Cape York communities.
The income support status of clients who are income managed (which can be current, suspended or cancelled) is presented in Table 7.19. Compared with clients currently on income management, a larger proportion of previous income management clients had an income support status of ‘cancelled’, which is one of the reasons for cessation of income management reported later. However, it is important to note that the policy operates so that if a client’s income support payment is cancelled during a period of income management, a later reinstatement of the client on income support also reinstates and continues the current period of income management.

Family Responsibilities Commission
207
Table 7.19 All income management clients, by income support status, December 2011
Income management status Income support status
Current Suspended Cancelled Total Currently on income management 132 17 0 149 Previously on income management 179 26 60 265 Total 311 43 60 414 Source: Centrelink data.
Some clients who had ceased to be income managed were no longer on a main income support payment on 2 December 2011, but on a supplementary payment such as Family Tax Benefit or Child Care Benefit (2%).
Income management and notices
Of all income managed clients 231 (56%) had only one notice, 116 (28%) had two, 47 (11%) had three and 20 (5%) had four notices or more. Compared with the overall pattern of multiple notices, in which 50 per cent of FRC clients had from one to four notices, income management clients had fewer notices.
Compared to the group of clients who were previously income managed, a larger proportion of current income management clients had multiple notices. While 67 per cent of clients who had ceased income management had only one notice, only 36 per cent of current income management clients (54 clients) had only one notice and 64 per cent had two or more notices. This is likely to be in part because of the duration of the trial, but is also consistent with the hypothesis that people who have more recently been subject to income management are resistant to change and less likely to respond to the sanction of income management.
Of those 150 clients on income management in December 2011, 23 per cent (or 35 clients) had been on income management for one year or longer. Most had been income managed for less than 12 months (44% for between three and 12 months and 33% for less than three months).
Clients previously on income management
Between 1 July 2008 and 2 December 2011, 264 clients started and concluded a period of income management. There were no substantial differences in the characteristics of clients who had ceased being income managed and clients who were currently being income managed.
Of the 264 previously income managed clients, 179 were still on income support (68%), a further 26 had a suspended income support status (10%), and 59 were no longer on income support and receiving a main income support payment, and had a status of ‘cancelled’ (22%).
Of all the 264 previously income-managed clients, 122 (46%) were income managed until the end of the income management period. A further 46 (18%) were not on income support, or had no partner on an income support payment/trigger payment.382 About a third (36%) or 96 people had their income management requirement revoked by the FRC, making them no longer eligible for income management.
Gender and income management
Although equal numbers of males and females were placed on income management for the trial as a whole, the split by gender varied from community to community as shown in Table 7.20. In Aurukun and Coen, some 55 per cent of income-managed clients were female. In Hope Vale and Mossman
382 People who leave an income support payment, but have been referred to income management prior to leaving income support, have an income management note pending, and will be placed on income management as soon as they return to income support.

Cape York Welfare Reform—Evaluation
208
Gorge, 57 and 58 per cent, respectively, of income-managed clients were male. This is possibly a result of the greater number of school attendance notices in Aurukun than in the other communities.
Table 7.20 Gender of clients on income management, by community
Community
Males Females
N % N % Aurukun 103 45 125 55 Hope Vale 64 57 49 43 Coen 13 43 17 57 Mossman Gorge 31 58 22 42 Total 211 50 213 50 Source: Centrelink data.
Relationship between number of notices and income management
Clients on income management had, on average, fewer notices than FRC clients who were not income managed. However, clients with more notices were more likely to be put on income management as the number of notices recorded against them increased. Figure 7.3 shows the proportion of clients who were placed on income management, by the number of notices served.
Figure 7.3 Proportion of clients placed on income management, by number of notices
0
20
40
60
80
100
1 2 3 4 5 6 7 8 9 10 11 12 13 14 15 16 17 18 19 20 21 22 23 24 25 26 27 28 29 30
Number of notices
% c
lien
ts p
lace
d o
n i
nco
me
man
agem
ent
Source: FRC data for 1 July 2008 to 31 December 2011.
The effect of income management
One way of testing the effectiveness of income management is to identify whether the number of notices declines after clients have been on income management.
Income management had mixed effects on the number of subsequent notices for clients. In Hope Vale, and Coen, the average quarterly number of notices fell once a client had been placed on income management, as shown in Table 7.21, dropping by 9 percentage points or more (in Coen it

Family Responsibilities Commission
209
fell from 0.57 to 0.43, a fall of 14 percentage points, in Hope Vale it fell by 10 percentage points and in Mossman George it fell by 9 percentage points). This was not the case in Aurukun, where the average number of notices increased by 7% after people had been income managed.
Statistical testing of the data in Table 7.21 shows that the differences observed in Hope Vale and Coen were significantly different at the 80 per cent confidence level from those from Aurukun, but that Mossman Gorge and Aurukun were not significantly different from each other. None of the communities was significantly different at the 90 per cent confidence level. Thus there are some indications that being placed on income management by the FRC was more likely to be associated with subsequent lower rates of notification for residents of Hope Vale and Coen than it was in Aurukun or Mossman Gorge, but there was no overall significant difference in the number of notices per quarter before and after being income managed.
Table 7.21 Average number of notices for clients per quarter, by use of income management
Community Income management
Before Aftera Difference Aurukun 0.95 1.02 0.07 Hope Vale 0.91 0.81 –0.10 Coen 0.57 0.43 –0.14 Mossman Gorge 0.68 0.59 –0.09 Trial-wide 0.88 0.87 –0.01 a All notices received after the quarter in which the client was placed on income management for the first time. Includes notices for clients who may no
longer be on income management, as well as those who have been put on a second or third period of income management. Source: FRC data for 1 July 2008 to 31 December 2011.
7.6 Community and stakeholder views about the FRC This section focuses on community members’ views of the FRC as expressed in the social change survey and stakeholder views captured through interviews conducted by SPRC as part of the evaluation. The views of community members and stakeholders help to provide an on-the-ground perspective of the FRC, which complements and assists in interpreting the FRC administrative data in the preceding section. This section is structured around the themes of acceptance of authority, client participation, the effectiveness of the FRC and views about the future of the FRC.
7.6.1 Acceptance of authority The social change survey noted a relatively high level of support for the FRC in the CYWR trial communities. Overall, over half of the respondents felt that the FRC is good for the community; around the same proportion want the FRC to keep helping people and indicated that they support people when they are being helped by the FRC. Smaller proportions felt there was less humbugging/cadging or that it was easier to say ‘No’ to humbugging/cadging since the FRC started. Overall, 65 per cent of community members felt that people should go to the FRC if they do not take their kids to school.
Two-thirds of community members felt that the community would be a better place to live if everyone followed up on their talks with the FRC and did what was discussed at the FRC conference. Only 7 per cent felt the FRC would make the community a bit worse. Those with most contact with the FRC were most likely to say that the community would be a lot better.
The survey concludes that, given that high proportions of community members had appeared before the FRC, this is a good endorsement of the FRC’s work and an indication that communities endorse this kind of leadership.

Cape York Welfare Reform—Evaluation
210
7.6.2 Client participation Among the survey respondents who said that they attended a conference appointment, nearly all (90%) said that they followed up and did what they talked about with the FRC. Of those, 66 per cent said that the FRC made things better for them.
Young people (16 to 24 years old) were more likely than older people to say that following up on their FRC talks made things better for them.
Although there was no direct question about income management in the social change survey, there was a question about the BasicsCard. As reported in the social change survey, the BasicsCard appeared to be valued by community members. A fifth of respondents had a BasicsCard at some point in time. Of this group, 78 per cent reported that it made their life better. Also, around 70 per cent of people agreed that those who do not spend money on rent and food and then cannot pay for them should be put on the BasicsCard.
7.6.3 Effectiveness of the FRC
Administrative complexity
Administering the FRC has been a challenging task. With relatively few resources, the Commission has developed sophisticated mechanisms for administering notices, conferences, decisions, referrals and service provision.
The process of issuing and acting upon a notice is complex and requires a great deal of administrative input, both from the FRC and from notifying agencies. Part of the challenge relates to checking whether individuals named for trigger events are in jurisdiction, both geographically, in terms of the trigger event and whether they or their partner are welfare recipients or CDEP participants. Clients also have to be tracked down and served with a direction to attend a conference to discuss the notice, which imposes a significant administrative burden on the Commission. Over time, some of these processes have been simplified and streamlined, but they are still administratively burdensome.
The FRC operational record-keeping system can provide client data, but this is only one of its multiple functions. Its primary purpose is executing legislative requirements, particularly processing notices, conducting conferences and recording conference outcomes. From the start, the FRC has kept paper records and over time more records have been entered into the database. A major challenge has been to work out what data should be recorded for reporting and evaluation. The database was changed in early 2010, and this improved data collection and recording. From an evaluation point of view, however, the data produced by the system are patchy and not easily analysed, as is described below. For example, for data to be made available for this analysis a number of people had to spend several weeks cleaning and checking data before they could be analysed.
Reports to the FRC from agencies are sometimes inconsistent and not always reliable, despite considerable effort having been put into streamlining them.
Notices and trigger events
The relationship between the provision of information by notifying agencies and the timeliness of subsequent FRC actions has been queried by a number of stakeholders. One particular issue relates to the time from the breach of the social obligation by a person (recorded as the trigger event by a notifying agency) to the FRC issuing the notice to the person to attend a conference. This is not an issue for school attendance notices, which are provided very shortly after a child has missed three days of schooling without valid reasons. However, child safety and welfare and magistrates court notices are provided to the FRC by the notifying agency when the trigger event is resolved (i.e. when a person has been convicted in the Magistrates Court or a notice of a concern report is resolved). This means that there can be several months between the trigger event and the FRC serving a notice

Family Responsibilities Commission
211
to attend a conference, with further time being spent on conferencing the client and referring the case to appropriate services. The event may therefore no longer retain much meaning to the individual concerned.
In many cases, therefore, trigger events serve the purpose of making a client available to the FRC rather than presenting a specific concern that needs to be addressed by the Commission. Given that a high proportion of families have multiple problems, there are very likely to be concerns which need to be addressed, even if they do not relate directly to the trigger event. Nevertheless, these time gaps result in many clients reportedly feeling that notices and conferences can seem somewhat random. Furthermore, in child safety and welfare cases in particular, a great deal of work may have already been undertaken with the family and there is a risk of duplication of effort. Reportedly, this issue has been somewhat mitigated by communication between the FRC and child safety caseworkers aimed at avoiding duplication and providing a complementary service. Although triggers and notices to the FRC are automatic, the FRC only conferences a minority of notices, so trivial matters or issues already being addressed may not result in conferences. The decision to conference is based on a number of factors, not only the nature of the breach. It relies on the Commissioners’ knowledge of the individuals and the community and their judgement about whether a conference will benefit the family. Thus, although conferences may be appropriate to deal with matters in each family, there is sometimes a tenuous relationship between trigger events, notices and people’s actual dealings with the FRC.
There is also a perception by some stakeholders that FRC intervention is ‘double dipping’—that individuals feel they have already been through the court or child safety and welfare services, and therefore that further intervention is not necessary or appropriate. The FRC’s counter to this is that its remit is different from that of the courts, child safety authorities or schools, and that FRC intervention is supplementary to the courts, probation and child safety rather than overlapping with them. This perception, however, appears to point to a continuing communication gap between the FRC and some sections of the communities, about the role and remit of the FRC as it relates to other statutory institutions.
Another matter raised by several stakeholders is that some of the trigger events can be relatively trivial (e.g. a malicious or mistaken report to Child Safety will be classified by that agency as a ‘concern report’, which will require no further action, and a child arriving late for school is now classified as an unexplained absence). These reports are resolved quickly, so the notice will be made soon after the event, but again the relationship between the trigger event and the FRC conference can be rather tenuous.
As respected members of the community, FRC Commissioners are also sometimes called upon to provide support, advice, mediation and other interventions within the community, further extending the remit of the FRC beyond the formal processes of notices, and this ensures that the authority of the FRC extends beyond its formal remit. This appears to be particularly significant in Aurukun, where the FRC has become a strong source of authority in the community.
Income management
Income management is the only sanction available to the FRC other than the sanction implicit in being subject to a notice and confronted in a conference. It is the last resort, which is used when persuasion and other forms of authority have not resulted in individuals changing their behaviour. However, income management is also used in two other circumstances:
Income management is sometimes imposed to help people who are in financial crisis or who have chronic difficulties managing their finances, to stabilise their spending and (generally in combination with MPower) to help them budget appropriately and manage their resources.
Income management is also provided voluntarily to a small number of people who ask to be placed on income management, usually to avoid financial harassment.

Cape York Welfare Reform—Evaluation
212
Thus income management acts as both a sanction and a support to clients.
Income management is used rather sparingly by the FRC, with a maximum of approximately 20 per cent of clients being income managed at any one time. The consultations indicated that income management is effective for some people whose lives have been dislocated and who need some form of authority exerted in order to provide a framework in which they can take responsibility for addressing their issues. The social change survey also confirmed that, for some people, income management had contributed to children being healthier. The data indicate that some community members had become habituated to income management or had found ways around it. This appears in some cases to have produced unintended consequences, such as clients on income management harassing relatives for access to alcohol or drugs. It appears that for this group income management (and welfare reform more generally) has little effect. Indeed, the program logic acknowledges that there will always be a section of the community who do not adhere to mainstream norms, and this is also confirmed by the social change survey, which identified a proportion of the population who were resistant to change.
As noted above, income management (along with the FRC itself) is also only available to be used for people who receive welfare payments, and therefore cannot be imposed on those in paid employment. If, as intended by the CYWR trial program logic, increasing numbers of adult members of the communities obtain paid employment, the FRC will have less and less capacity to sanction those individuals should they breach the specified social obligations. However, as the data in this section demonstrate, this is far into the future; currently, the number of notices to the FRC is still high and a large proportion of the adult population is still within the FRC’s jurisdiction.
The CYWR model of income management is far more targeted than that in the Northern Territory and even the targeted models that have been implemented in Western Australia and the ‘place based’ income management programs. Clients on income management in the CYWR trial communities are case managed to a much higher degree, and their progress is closely monitored by the FRC as well as the other case management arrangements. This approach appears to be successful, and has a number of advantages for the individuals concerned and for the communities more generally, as is evidenced by the results of the social change survey.
Case management
Case management plays a key role in ensuring that clients receive services, that the services meet the clients’ needs and that they have the impact that is expected. Services in the CYWR trial communities are fragmented and patchy, and therefore it is important for clients to be provided with a mechanism for ensuring that the services are working to common purpose and are effective. This was recognised in the FRC Act and in the original planning of the CYWR trial.
The KPMG report indicates that there have been a number of changes of plans for case management for the FRC. Initially, it was expected that each community would appoint a number of case managers, but this was changed when plans for the Wellbeing Centres were developed. The Wellbeing Centres were expected to take over case management responsibility for FRC clients, but that arrangement never eventuated and part-time case managers were appointed by the FRC. Currently, there is no comprehensive system of case management in place in the four communities. Much of the case management process consists of CYWR-funded services reporting back monthly to the FRC about the progress of cases, taking into account confidentiality issues. This imposes a heavy reporting burden on services and has also caused some tensions when FRC Commissioners seek more information and service providers are reluctant to do so. In some cases, this communication issue has been addressed by initiating regular meetings between the FRC and some service providers.
Nevertheless, there is still no comprehensive case management system in which the range of service providers and the FRC can meet together with the client to discuss progress. This would be very

Family Responsibilities Commission
213
onerous for agencies if applied to all families conferenced by the FRC, but could be implemented for complex and challenging cases.
The FRC implements a case management approach, which is activated at the start of a referral process. The FRC receives monthly reports from service providers about whether clients are attending services and what progress has been made. There were difficulties in ensuring a case management approach for three reasons:
Questions were raised about reporting on the attendance of clients to some programs, and the accuracy of that reporting.
Differences in approaches to services (some providers prefer to seek voluntary engagement) appear to influence the relationship between FRC and some service providers.
There appears to be a limited culture of case management in the four trial communities and no real mechanism to ensure that clients are provided with coordinated and complementary services.
Other issues
Differing ideologies: As we have noted above (and as both the service provider survey and the Aurukun case study of service delivery have confirmed), not all service providers are committed to reconfiguring service provision to encompass the idea of individual responsibility. Even where service providers agree in principle that individual responsibility is important, they often differ as to what this means in practice. Some service providers have different beliefs from the FRC about how to facilitate people taking responsibility, believing that individuals should take responsibility for engaging with services. Some also believe that the FRC should accompany people to services in order to facilitate referrals (see the ‘Case management’ section above). The social change survey did not identify this as a particular issue for community members who accessed services, and it will not necessarily affect outcomes. Nevertheless, it is a significant issue for some service providers and for the FRC.
Recruitment and retention of Commissioners: Many Commissioners have other jobs which are very time consuming. Some have been in post for a number of years. The FRC is working on succession planning, and there are a number of younger Commissioners in each community. However, this is proving challenging, perhaps due to the uncertainty of the future of the FRC. There is a tension here, in that Commissioners need to be individuals who can act as role models for the community. There are not many individuals in the communities who are able to be effective role models, and often those people are in demand for other jobs and leadership roles. There is real concern for the wellbeing of some of the Commissioners, who may become overburdened.
Pay differentials: FRC Commissioners and coordinators are reimbursed, and some stakeholders believe that this has resulted in resources being drawn from other community groups such as justice groups, which are voluntary. On the other hand, without payment it would be virtually impossible to recruit Commissioners, especially young people, and it is right to pay Commissioners for their contribution and their time.
7.6.4 Views about the future of the FRC
It is beyond the remit of this evaluation to recommend what the future of the FRC should be. This section reports on a number of suggestions provided by participants in the consultations, including FRC Commissioners and other stakeholders. The consultations produced a wide range of views about the CYWR trial and in particular the FRC, and there was no consistent view as to whether and how its functions should be carried on in the future. It is also noteworthy that opinions varied by community. Despite this diversity, there was a strong theme among participants that there should be a clear exit strategy and a smooth transition to the next phase of the CYWR trial. Indigenous communities have often received short-term initiatives which have been withdrawn after short periods,

Cape York Welfare Reform—Evaluation
214
leaving communities less likely to engage in the next initiative, and stakeholders were concerned that this should not be the case for the CYWR trial.
In the consultations, many stakeholders felt strongly that the decisions about the future of the FRC should involve the communities as far as possible and be as transparent as possible. One potential issue that was raised was the possibility that the FRC (or its successor) should operate differently in the four CYWR communities. This will have significant resource and operational implications for the communities.
Other suggestions provided by stakeholders for the future of the FRC included:
continue functioning as now but with some administrative changes, including a review of the trigger events, case management approaches and administrative arrangements for reporting
succession planning to hand over the FRC to Local Commissioners once Commissioner Glasgow retires
merge the FRC with other bodies already operating in the communities (such as the justice groups)
establish Murri courts in the four communities to take over some of the functions of the FRC
establish the FRC in other Cape York communities that do not have the various services to see whether the FRC model would work without extra interventions
discontinue the FRC and build the capacity of Indigenous elders and traditional authorities in the communities
improve the capacity and rigour of existing state functions (magistrates courts, probation services, schools, police and so on) to ensure compliance by the population with laws and regulations
increase the power of the FRC by giving it authority to withhold benefits as well as to manage incomes
extend the jurisdiction of the FRC to those in work as well as those on income support.
It is clear that there are still continuing challenges relating to the administration of the FRC, despite considerable work having been done to streamline its operations and further improve its interaction with other agencies, both within welfare reform and beyond. It is very important that communities are involved in decision-making about the future of the FRC in their community, and it is quite possible that different communities will have different views about that future role.
7.7 Challenges in using the FRC data for evaluation The FRC data were designed primarily for case management purposes and not for evaluation or reporting. The data required significant ‘cleaning’ before analysis could be carried out. The problems that prevented straightforward analysis appear to stem from the design of the data software.
For example, the ‘conference’ data demonstrate some of these challenges. Records of all appointments are kept by FRC staff. The outcome of the appointment is recorded in three key fields: ‘Attended’ (true/false), ‘Conference outcome’ (various values) and ‘Conference action’ (various values).
The ‘outcome’ and ‘action’ fields are not sufficient to describe what may actually occur during an appointment. As a result, FRC staff have taken to creating several database records per conference. On one occasion, 48 records were created for a single appointment. These multiple records must be collapsed into one so that further analysis can be performed.

Family Responsibilities Commission
215
In collapsing the records, an analyst must ensure that no information in any of the up to 48 records is lost. This task was complicated by the fact that the values in the ‘outcome’ and ‘action’ fields were inconsistently recorded. For example, income management was referred to as ‘income management’ or simply ‘IM’. A voluntary agreement between a client and the FRC—an important monitoring variable—was flagged in one of three different ways: either the ‘outcome’ contained the word ‘voluntary’, the ‘action’ contained the word ‘voluntary’, or both. (Analysis of voluntary agreements was made even more complex by the lack of consistency as to whether an outcome was described as a ‘voluntary agreement’, an ‘agreement’ or a ‘decision’. Suffice to say that all manner of combinations were observed in the dataset, and algorithms had to be coded to check for them all.)
In addition to these problems, analysing the progress of clients on income management was made difficult by the way income management was recorded. For example, clients often had their income management extended. In some FRC records, this was indicated by recording the conference action as ‘income management extension’. In other cases, extension of income management was indicated by revoking the income management program and then invoking a new one. Checking for such cases required complex checks of the start and end dates of the income management program. (An additional check was created to flag income management invocations as extensions when the invocation took place within a fortnight of a previous program ending.) When these checks were performed, the number of income management invocations and extensions varied by as much as 25 per cent from the number that basic analysis of the data would have revealed.
FRC staff confirmed that the database was causing them difficulties. If the database is to be redesigned, the following design principles will aid analysis in the future.
Descriptive fields such as ‘Conference outcome’ and ‘Conference action’ should be avoided. Rather, these categories should be determined from more fundamental variables. For example, each record should include Attended (true/false); Warning issued (true/false); Voluntary agreement (true/false); Income management level at the start and at the end of conference (e.g. as 0, 60 or 70%); and the income management start date, expected end date at the start of the conference and expected end date at the end of the conference, all in one record. This would allow an analyst to determine, simply and without ambiguity, the status of a client at the beginning of a conference; whether income management was invoked, extended, modified or revoked; and which of those decisions were voluntary. Similar variables should be recorded for case plans.
7.7.1 FRC data and outcomes FRC data can tell us about outcomes and how they have changed over time. Of course, the FRC data are not ideal for monitoring trends in outcomes—ideally, we would use direct data on the outcomes themselves.
It is worth focusing on the FRC triggers and the outcome data that are available on the issues that the triggers are designed to address—school attendance; crime and safety; child safety and welfare; and tenancy management. Ideally, to evaluate the impact of the FRC we would match FRC data for individual FRC clients with outcome measures. Unfortunately, this is only possible for school attendance data. A detailed analysis of school attendance, showing that the FRC appears to have had an important positive impact, is provided in the next chapter.
Unfortunately, we do not have good outcome data that we can match to FRC data for child safety and welfare reports or convictions in the Magistrates Court.
While the only outcome data for particular clients that can be linked with FRC data are for school attendance, it is still worth looking at how the FRC data relate to published outcome data.

Cape York Welfare Reform—Evaluation
216
School attendance
The next chapter provides a detailed assessment of the impact of the trial and the FRC on school attendance. This chapter shows that the number of notices for school attendance has increased over the trial. Although this appears to be at odds with improvements in measured school attendance, there is no conflict between these two findings, as the number of unexplained school absences per FRC conference has fallen over the course of the trial.
In Aurukun, the number of absences per conference (that relate to school attendance) fell from 30 in 2009 to 17 in 2010 and to 12 in 2011. Thus, while there are more notices and conferences, they relate to fewer absences. What drives overall school attendance rates is not the number of notices for school attendance, but rather the number of unexplained absences. It is also important to remember that a school attendance notice is triggered for only three unexplained absences per term, so some notices relate to relatively minor school attendance issues.
Magistrates court notices
Convictions in the Magistrates Court represent only a small proportion of all crime. A more valuable approach, from an analytical perspective, would therefore be to link FRC data for particular clients with data on recorded offences. Unfortunately, this type of analysis was not possible because of practical difficulties involved in using crime data, especially the lack of identification of unique individuals in both the police and the justice data. Figure 7.4 shows that a comparison of the data on magistrates court notices with reported offences in the communities shows a much closer trend, even though there is a far less direct relationship between reported offences and notices.383 Both sets of data show an initial rise in incidence and then a drop, with a slight rise in 2011–12 (much less pronounced in FRC data). Thus they are both likely to be relatively good proxies for the overall level of crime in the communities over time.
383 Reported offences may not lead to a conviction and, if they do, this may not be in the Magistrates Court. Also, there is potentially a long time lag between a reported offence and a conviction.

Family Responsibilities Commission
217
Figure 7.4 Reported offences and FRC magistrates court notices, 2008–09 to 2011–12
1,635
1,930
1,457 1,578
834
1,346
1,141 1,169
-
500
1,000
1,500
2,000
2,500
2008–09 2009–10 2010–11 2011–12*
Off
ence
s
Year
Reported offences
FRC magistrates
Note: 2012 police data do not include June 2012 and are therefore slightly lower than the final figure. Notices for Quarter 2 of 2012 are not available and have been extrapolated from the previous three quarters. Source: Queensland Police and FRC.
Child safety and welfare
There is little reliable data in Australia on the underlying level of child abuse and neglect. Official child protection data do not provide such a measure, so linking FRC data with child protection data would not provide an indication of the impact of the FRC on outcomes in this domain.
Housing tenancy
As we have noted separately, the notices to the FRC for housing tenancy related triggers showed a rather strange pattern, with a low number initially, a rising number in 2010 in Hope Vale and Aurukun, and then dropping to a small number in any community after 2010. This pattern is explained in detail in the next chapter.
7.7.2 Discussion of the FRC data This analysis serves to illustrate the complexities of using administrative data as proxies for outcomes in communities. The ‘story’ behind the data and the precise definitions of the datasets are as important as the data themselves. This is a generic problem for all key performance indicators and not only for the CYWR trial, but it shows that all such data should be treated with some caution. Furthermore, without the context of equivalent data from comparison communities, the actual numbers are difficult to link to specific conclusions about effectiveness. FRC data are subject to further complexities as they were generated primarily for case management and accountability purposes rather than evaluation. Nevertheless, the analysis shows the value of FRC information for better understanding the operation and effectiveness of the welfare reform.


Outcomes
219
8 Outcomes The Social Policy Research Centre, with assistance from FaHCSIA
8.1 Introduction This chapter reports on the outcomes for Cape York Welfare Reform (CYWR) in the four communities. It relies primarily on administrative data relating to school attendance, crime, child safety, housing and employment supplied by the Queensland Government and FaHCSIA as well as data provided by the Family Responsibilities Commission (FRC) and other projects within CYWR. In Chapter 3, Section 3.3 and Appendix D, the Social Policy Research Centre has noted some of the limitations of these data and also the fact that CYWR has only been in place for four years.
The chapter commences with key findings under the four streams and then presents outcomes for some key indicators, including school attendance, educational attainment, child safety, crime, employment and economic development, and housing. Where practical, outcomes for the four CYWR communities are compared to comparison communities.
The chapter includes a detailed analysis of unit record data on school attendance. It focuses on educational attainment and outcomes before analysing data on child abuse and neglect, community safety (including trends in offences and hospitalisations for assault), employment outcomes and the receipt of income support payments. It concludes with an analysis of housing and selected data from the 2011 Australian Bureau of Statistics (ABS) Census of Population and Housing. Further information about outcomes in the CYWR communities and other discrete Indigenous communities in Queensland can be accessed on the Queensland Department of Aboriginal and Torres Strait Islander and Multicultural Affairs website.384
8.2 Methodology
8.2.1 Outcome indicators This chapter focuses on key outcome indicators that relate to CYWR. The methodology used in the evaluation is outlined in Chapter 3 and Appendix D. As outlined in Chapter 1, CYWR has four streams: Social Responsibility, Education, Economic Opportunity and Housing. A key focus for the Social Responsibility stream is the role of the FRC. As noted in Chapter 7, the FRC receives notices based on ‘trigger’ events, including a child being absent from school for three full or part days in a school term without a reasonable excuse, a child of school age not being enrolled in school without a lawful excuse, a person being the subject of a child safety report, and a person being convicted of an offence in the Magistrates Court or breaching his or her tenancy agreement. This chapter focuses on key outcomes that relate to those trigger events, including data on school attendance and educational attainment, child safety, crime, employment and housing.
The chapter does not just focus on outcome indicators that relate directly to activities under the CYWR. For example, rather than exclusively focusing on convictions in the Magistrates Court, which are FRC triggers, the chapter also looks more broadly at crime data, as the goal of CYWR is to rebuild social norms, which includes contributing to reductions in offending, including domestic violence. The chapter has a key focus on one of the four evaluation questions for CYWR: Are social norms and behaviour changing?
384 http://www.datsima.qld.gov.au/atsis/government/programs-and-initiatives/reports/quarterly-bulletin-on-key-indicators-in-queenslands-discrete-indigenous-communities-january-march-2012.

Cape York Welfare Reform—Evaluation
220
This chapter should be read in conjunction with Chapter 4 (Social change survey), because it includes information on changes in key outcomes, including changes in overall community wellbeing, the perceived effectiveness of the FRC in changing social norms, and the incidence of community violence and fighting.
8.2.2 Data sources and analysis
The Queensland Government regularly publishes aggregate data for discrete Indigenous communities in Queensland. These data have been useful because a key challenge for any evaluation is getting access to data and information. A great deal of useful outcome data has been collected and analysed for this evaluation. However, as noted in Chapter 3, the data that are available are not always ideal. For example, while official child protection (safety) data are available they do not provide an indication of the underlying level of child abuse and neglect. Indeed, data on the true level of child abuse and neglect are very rarely collected for any community in Australia. Since data on the actual level of crime are also lacking, we had to use police data on offending. While very useful, those data do not provide a full picture, as much crime is not reported to police. The best way to analyse changes in the underlying level of crime is to use crime victimisation surveys. Unfortunately, surveys of that nature are rarely conducted at a community level. While data from crime victimisation surveys would have been ideal, the police data that are available are very useful. It is worth noting, in this context, that many studies in Australia and overseas use police data to analyse trends in crime over time. On a positive note, the social change survey collected some data on community violence and how it is perceived to have changed over time in the four CYWR communities. In addition, data on hospitalisations for assault provide important complementary information.
In some instances, the outcome variable can be directly measured at a community level. For example, we have reliable data on school attendance, educational attainment and employment.
It is also worth noting that some contextual variables such as data on the condition of the social housing stock were not available for this evaluation.
An important issue for the evaluation relates to causality and attribution – that is, relating changes in outcomes to the CYWR trial. Compiling community-level outcome data, while useful, does not provide information on policy effectiveness. Aggregate outcome data are affected by many factors, many of which do not relate to either CYWR or other policies. Ideally, any outcome evaluation should make some attempt to isolate the additional impact of the trial itself. This is very challenging, as many policy settings can affect outcomes and it is difficult to isolate the impact of one policy on these outcomes. This is a large challenge for this evaluation, as so many policies have affected the CYWR communities. It is simply impossible to isolate the impact of any specific policy on outcomes with complete precision. Nevertheless, the analysis in this chapter provided a good overview of outcomes in the CYWR communities to date in key areas identified in the program logic.
Two broad approaches have been used in this evaluation to attempt to estimate the impact of CYWR on outcomes. The first approach involves comparing trends in outcomes with those in other Indigenous communities in Queensland. This allows the evaluation to test whether changes in the four CYWR communities are part of an overall trend or whether they are specific to those communities. While useful, this method has some important limitations (as noted in Chapter 3). The most important limitation is that this methodology does not allow attribution to any specific factor that is driving changes in the affected population.
The second approach uses unit record data on school attendance to isolate the impact of the FRC. This analysis required FRC data to be matched with school attendance data385, thus allowing for more
385 The FRC unit record data were extracted from the FRC administrative database. Matching of Queensland Department of Education, Training and Employment (DETE) data and FRC data was undertaken by obtaining a list of school students from DETE showing names, dates of birth and unique DETE student identifiers. The FRC holds DETE student identifiers but does not enter them into its client management database. The DETE list of students was compared manually with an FRC extract

Outcomes
221
rigorous analysis than a simple comparison with other communities. Three analytical components have been used in the second approach:
Unit record data on school attendance were analysed to see whether any changes occurred after FRC conferences. If changes in outcomes occurred immediately after an action on the part of the FRC, those improvements were less likely to have been caused by some other factor.
The unit record data were analysed to compare changes in school attendance for students who were in scope of the FRC and those who were not (students in scope had parents or carers who were within the FRC’s jurisdiction). This method allowed us to assess whether improvements in school attendance had been concentrated among students whose attendance patterns would have attracted action on the part of the FRC. While useful, this method should be treated with some caution as there may have been spill-over effects because the attendance patterns of children who are not covered by the FRC may have been indirectly affected.
Students in the CYWR communities were matched with students in other communities, based on sex, age and initial attendance patterns. This comparison allowed for a rigorous assessment of whether changes were part of a broader trend in remote Indigenous communities.
Unfortunately, as noted in Chapter 7, the only outcome data that could be linked with the FRC unit record data were for school attendance. It was also not possible to undertake a more rigorous assessment of the impact on school attendance of other programs, such as student case managers, due to the absence of unit record data that could be linked with data on school attendance for individual students.
With the limitations noted above, the level of data matching and analysis that was possible for this report was considerably better than for many other evaluations in Australia. Many other evaluations have to rely on simple ‘before and after’ comparisons using aggregate data.
8.3 Overall key findings This section presents key findings under the four streams of Social Responsibility, Economic Opportunity, Education and Housing. Key findings specific to the key indicators are presented at the start of each relevant section.
8.3.1 Summary of key findings
Overall, there is clear evidence that the wellbeing of residents in the four CYWR communities has improved over the CYWR years. Crime rates are down, infrastructure and services have improved, school attendance has risen or been maintained at high levels, and people appear happier. In no major dimension have outcomes deteriorated in these communities. Nevertheless, these communities still face considerable challenges, and progress to date has been fragile and tentative.
In some instances, it is difficult to establish the extent to which these changes can be attributed directly or indirectly to CYWR, and it is not clear whether the four communities are faring better than similar comparison communities in Queensland, all of which have seen some improvements in outcomes over the CYWR period. Attribution is also difficult because of the range of initiatives in the communities that are not part of CYWR.
The changes have affected some communities (and some sections of the communities) more than others.
which listed children in the care of FRC clients. Most names and dates of birth were matched directly by comparing these records. To complete the matching of all records, a small number had to be checked and confirmed by FRC staff based on their local knowledge, due to minor differences in spellings of names or the recording of dates of birth.

Cape York Welfare Reform—Evaluation
222
8.3.2 Education School attendance has shown a large increase during the CYWR period in Aurukun, the
community where rates were the lowest at the beginning of CYWR. Statistically significant improvements in school attendance were evident across two of the four communities from 2008 to 2011 (Aurukun and Mossman Gorge). School attendance rates in Coen stayed high throughout the trial and showed no statistically significant change, while there was a small statistically significant decline in school attendance in Hope Vale over the trial period. The change in Aurukun is greater than in any other Indigenous community in Queensland, and there are indications that it is related to the actions of the FRC. It is also clear that the improvements in Aurukun are not part of a general trend in Indigenous communities in Queensland.
It is difficult to assess changes in educational performance in the CYWR and other Indigenous communities in Queensland using the published National Assessment Program—Literacy and Numeracy (NAPLAN) data.386 In addition, the Cape York Aboriginal Australian Academy (CYAAA) is being separately evaluated.
According to the service provider survey and the social change survey, Education has been the CYWR stream that has had the most impact. Data from the 2011 Census shows that there was an increase in educational attainment among Indigenous Australians in the four CYWR communities from 2006 to 2011; however, a similar trend was evident for the comparison communities. On a less positive note, there is a significant challenge in Aurukun where a sizeable number (42) of young people of compulsory secondary school age have returned from boarding school but are now not enrolled in school. However, as described below, recent steps and decisions have been taken to address this issue.
8.3.3 Social Responsibility
The evidence of change in the Social Responsibility stream is complex. On one hand, there have been statistically significant decreases in crime rates in the four communities, and the social change survey indicated a majority view that things were getting better and people were taking more responsibility for their lives. On the other hand, while the overall offence rate showed a statistically significant decline during CYWR, a similar trend was apparent in the comparison communities. The key difference is that in the CYWR communities, unlike the comparison communities, the improvement has reversed a statistically significant upward trend prior to the commencement of CYWR. Hospitalisation rates for assault have shown a statistically significant decline over the CYWR period; however, a similar trend is also evident in the comparison communities.
There was a large statistically significant fall in serious assaults resulting in injury in Aurukun in mid-2008. This large fall, which was not evident in other communities, appears to reflect the impact of the reduction in trading conditions and subsequent closure of the Three Rivers Tavern from March 2008.
The percentage of Indigenous people who were volunteers rose at a faster rate in Aurukun than in any other CYWR or comparison community from 2006 to 2011. This may be reflective of an improvement in community cohesion in Aurukun; however, care is required in interpreting this finding as the changes are small.
8.3.4 Economic Opportunity
Employment data from the 2011 Census shows rises in non-CDEP (Community Development Employment Projects) employment in the four communities from 2006 to 2011. Although increases were evident in other Indigenous communities in Queensland, the increases in Coen and Hope Vale were among the highest across all these communities. The CDEP conversion
386 This is further elaborated later in this chapter.

Outcomes
223
process, which is not unique to the four CYWR communities, has resulted in the creation of 103 properly paid jobs. In addition, a total of 118 extra jobs based in the four communities have been created as a result of direct service provision through CYWR. The ‘lighthouse’ projects, which are intended to bring employment to communities, are underway or about to start in Hope Vale and Mossman Gorge, but their effects on employment and economic activity have not yet been felt.
The number of job placements made by Job Services Australia providers in the CYWR communities has risen over the course of CYWR.
Data on income support payments suggest that the proportion of adults on income support payments has increased during the life of CYWR, but this reflects a gradual shift in payment arrangements for CDEP recipients away from CDEP wages and onto income support payments. The number of working-age adults in the four communities who are reliant on either income support payments or CDEP wages has fallen.
8.3.5 Housing Progress has been made in normalising tenancy, and 442 rental agreements are now in place in
the four CYWR communities.
A significant amount of work has been undertaken to address the legal and policy issues around home ownership. Progress has been made in the communities in terms of housing and infrastructure, and each community has benefited from new houses and house refurbishments. Home purchases in three of the communities have not been affected by the reform. In Coen, people are already able to buy their own homes, but there have not been increases in private home ownership in that community.
8.4 School attendance outcomes
8.4.1 Key findings Attendance rates in Aurukun have risen over the CYWR period, with a statistically significant gain
in 2009 sustained through to 2011. The timing of this improvement appears to be related to the intervention of the FRC.
Improvements in school attendance in Aurukun are not part of a broader trend and have not been matched in other communities.
The other CYWR communities started with relatively high attendance rates, which have been broadly maintained through the period of CYWR.387
A significant number of students from the CYWR communities are supported to attend high school elsewhere under Transition Support Services.388 ABSTUDY ‘bypass’ also supports students attending high school elsewhere.
FRC conference periods were followed by reductions in unexplained absences from schools in Aurukun, but this trend is diminishing over time. This may indicate that there is a group of students whose school attendance is very hard to address.
8.4.2 Introduction
This section provides an assessment of trends in school attendance in the four CYWR communities.
It first provides an overview of the published data on school attendance for the four communities and compares trends in those communities with trends in other Indigenous communities in Queensland.
387 The reduction in unexplained absences and the associated increase in school attendance for students from Mossman Gorge from 2008 to 2011 was statistically significant (see this chapter), but not large. 388 Of the four communities, only Aurukun has high school education in the community.

Cape York Welfare Reform—Evaluation
224
The section then provides an overview of further analysis conducted using unit record data from the Queensland Department of Education, Training and Employment (DETE). Importantly, the unit record data allow for a more rigorous assessment of trends.
Differences between primary and high school provision in the four CYWR communities
Schooling differs in each of the four CYWR communities (Table 8.1). The Aurukun school campus (previously part of Western Cape College, but part of the CYAAA since January 2010) provides schooling to children up to Year 10, although the numbers of students beyond Year 8 are now very small (six in Term 1 of 2012). It is by far the largest school in the four communities. Hopevale school (part of the CYAAA since January 2011) provides primary school for the community (primary schools in Queensland go to Year 7). Some primary school students also attend school in Cooktown, as do high school students who commute from Hope Vale. Other high school students board in schools across Queensland. Coen has a small local primary school. Primary school students from Mossman Gorge attend school in nearby Mossman.
Table 8.1 Student enrolment numbers in the CYWR communities, 2008 to 2011
Aurukun Coen Hope Vale Mossman Gorge Mean enrolment 205 41 127 29 2008 201 35 137 32 2009 216 43 128 30 2010 185 45 119 26 2011 217 42 123 27 Source: Queensland DETE, unpublished quarterly data for the discrete Indigenous communities.
8.4.3 School attendance
This section presents outcomes on school attendance, the nature of absences (explained and unexplained), the impact of the FRC on school attendance, comparisons of school attendance rates in the CYWR communities and comparison communities, and transitional support services. Unfortunately, the school attendance data collected prior to 2008 are not comparable with more recent data, and for that reason data prior to 2008 are not analysed.
It is not possible to assess whether changes in the published school attendance data are statistically significant, as no standard errors or confidence intervals are available. Nor has it been possible to use standard statistical techniques to make this assessment, as the number of observations from 2008 to 2012 is too small. However, it is possible to make such an assessment with the unit record data that were obtained for this evaluation. That assessment is provided after the published data are described.
Analysis of school attendance data
Figure 8.1 shows the published school attendance rates from the Queensland discrete Indigenous communities reports for the school in Aurukun (formerly Western Cape College), which provides education up to Year 10.389 The school attendance rate for Aurukun rose from 46.1 per cent in Term 1 of 2008 to 70.9 per cent in Term 1 of 2012, a rise of 24.8 percentage points. The data include all full-time students, Indigenous and non-Indigenous, and therefore include both primary and high school students as described above.
Figure 8.2 shows the school attendance rates for the school in Coen.390 The rate at Coen has remained high throughout CYWR.
Figure 8.3 shows the attendance rates for the school in Hope Vale.391 The rate at Hope Vale rose from 80.6 per cent in the first term of 2008 to 84.6 per cent in the first term of 2012.392 389 The school in Aurukun became part of the CYAAA in January 2010. 390 The school in Coen is a primary school. It became part of the CYAAA in January 2010.

Outcomes
225
Figure 8.1 School attendance rates in Aurukun, Term 1, 2008 to 2012
46.1
37.9
44.5 43.5
56.1
63.266.0
61.665.9
57.754.1
64.8
73.770.1
58.861.4
70.9
0
10
20
30
40
50
60
70
80
90
100
1–08 2–08 3–08 4–08 1–09 2–09 3–09 4–09 1–10 2–10 3–10 4–10 1–11 2–11 3–11 4–11 1–12
Term–year
Att
end
ance
rat
e (%
)
Source: http://www.datsima.qld.gov.au/atsis/government/programs-and-initiatives/reports.
391 The school in Hope Vale is a primary school. It became part of the CYAAA in January 2011. 392 This chart does not include children who attend Cooktown State School.

Cape York Welfare Reform—Evaluation
226
Figure 8.2 School attendance rates in Coen, Term 1, 2008 to 2012
91.3
96.8
87.4
94.1 95.3 93.6 92.990.4
94.992.2
89.0 87.6
93.5
86.6 86.588.6
91.5
0
10
20
30
40
50
60
70
80
90
100
1–08 2–08 3–08 4–08 1–09 2–09 3–09 4–09 1–10 2–10 3–10 4–10 1–11 2–11 3–11 4–11 1–12
Term–year
Att
end
ance
rat
e (%
)
Source: http://www.datsima.qld.gov.au/atsis/government/programs-and-initiatives/reports.
Figure 8.3 School attendance rates in Hope Vale, Term 1, 2008 to 2012
80.6
87.683.3 81.5
88.2 86.9
76.6
84.187.3
83.580.8 80.6
89.9
78.675.1
77.5
84.6
0
10
20
30
40
50
60
70
80
90
100
1–08 2–08 3–08 4–08 1–09 2–09 3–09 4–09 1–10 2–10 3–10 4–10 1–11 2–11 3–11 4–11 1–12
Term–year
Att
end
ance
rat
e (%
)
Source: Unpublished data provided by the Office of Economic and Social Research.

Outcomes
227
Figure 8.4 School attendance rates in Mossman Gorge community, Term 2 2008 to Term 1 2012
60.9
75.878.7 80.1 81.6
78.0 79.584.2
79.182.3
77.774.3
79.5
72.5 72.168.9
0
10
20
30
40
50
60
70
80
90
100
2–08 3–08 4–08 1–09 2–09 3–09 4–09 1–10 2–10 3–10 4–10 1–11 2–11 3–11 4–11 1–12
Term–year
Att
end
ance
rat
e (%
)
Notes: Mossman Gorge community attendance is calculated by combining the attendance for school-identified students from Mossman State School and Mossman State High School. Mossman Gorge 2008 Term 1 data were not provided for this analysis. Source: http://www.datsima.qld.gov.au/atsis/government/programs-and-initiatives/reports.
Figure 8.4 shows the published attendance rates for students from Mossman Gorge who attend Mossman State School393 and Mossman State High School. The figure shows that the school attendance rate for students from Mossman Gorge ranged from a low point of 60.9 per cent to a high of 84.2 per cent.
It is clear that the biggest change in school attendance has occurred in Aurukun, with the other communities maintaining relatively high attendance rates throughout the CYWR period. However, this raises the question of whether the increase is part of a broader trend across other Indigenous communities in Queensland. The clear answer to this question is ‘no’. The increase in the school attendance rate in Aurukun from the first term of 2008 to the first term of 2012 (24.8 percentage points) is the fastest increase among the 17 Indigenous communities for which the Queensland Government regularly publishes data.394 There was no overall upward trend in school attendance rates in Indigenous communities in Queensland; nor was there an overall state-wide trend from 2008 to 2012.395 It should be acknowledged that school attendance rates in Aurukun have increased from a
393 Mossman State School is not part of the CYAAA. 394 Given possible seasonal impacts on the data, it is important to compare school attendance rates for the same terms across different years. If this approach is adopted, the increase in the school attendance rate in Aurukun from each term in 2008 to the equivalent terms in 2011 and 2012 was greater than in the other 17 communities for three out of five instances. In two of the comparisons, the improvement in school attendance rates in Mornington Island was greater than in Aurukun. The 17 communities are Bloomfield River/Wujal Wujal, Bwgcolman Community School/Palm Island PY – 10, Cherbourg, Doomadgee, Hope Vale Campus of CYAAA, Kowanyama, Lockhart, Mornington Island, Mossman Gorge Community, Napranum Community, Northern Peninsula Area State College/Bamaga, Pormpuraaw, Aurukun Campus of CYAAA, Coen Campus of CYAAA, Western Cape College – Mapoon, Woorabinda State School, and Yarrabah. 395 From Term 1 2008 to Term 1 2012, average school attendance rates fell in nine of the 17 Indigenous communities for which the Queensland Government regularly publishes school attendance data, and rose in the other eight communities. There is no evidence of any overall upward trend in school attendance rates from 2008 across Indigenous communities in Queensland. The COAG Reform Council’s Report on the National Education Agreement for 2011 was released in November 2012. The report shows that there was very little change in school attendance rates from 2008 to 2011 for Indigenous students in government

Cape York Welfare Reform—Evaluation
228
low base, so there has been more room for a large rise.396 On the other hand, there was nothing inevitable about the increase in school attendance, because school attendance rates in remote Indigenous communities can be persistently low for extended periods.397
It is also worth noting that, while there has been no overall upward trend in school attendance rates among Indigenous communities in Queensland398, Aurukun is not the only school to experience an improvement in school attendance. For example, the average school attendance rate in Mornington Island rose from 59.9 per cent in Term 1 2008 to 74.4 per cent in Term 1 2012. Other schools have seen their attendance rates fall. For example, Doomadgee (which is similar in population and level of remoteness to Aurukun) saw its school attendance rate fall from 67.4 per cent in the first term of 2008 to 57.2 per cent in the first term of 2012.
Recent growth in the number of high school students attending boarding school is an important factor to consider when analysing trends in school attendance in the CYWR communities (as noted earlier there is no high school in Hope Vale, Coen or Mossman Gorge).399 Transition Support Services (TSS) is an initiative of DETE designed to assist students in remote communities when they have to move away from home to attend high school (it should be noted that TSS is not a component of the CYWR). The number of students assisted by TSS provides good data on the number of children from Aurukun, Coen and Hope Vale who attended high school outside their community. In 2011, this program supported 53 students from Hope Vale to attend high school outside Hope Vale—down slightly from 56 students in 2008. In 2011, 22 students from Coen were assisted to attend high school outside the community—down from 28 in 2008. These figures are shown in tables 8.2 to 8.4. Additional information on the number of students assisted to go to high school elsewhere is provided in this section.
The most significant change has occurred in Aurukun, where the number of students assisted to attend high school outside Aurukun nearly doubled from 39 students in 2008 to 78 students in 2011. Importantly, most of the increase over this period (22 students) reflected an increase in the number of Year 8 to Year 10 students from Aurukun who were going to school elsewhere. This large shift may explain why the high school attendance rate in Aurukun, unlike the primary school attendance rate, did not rise from 2008 to 2011. The high school attendance rate in Aurukun fell from 35.5 per cent in Term 1 2008 to 25.3 per cent in Term 1 2012.
However, as explained below, there is an ongoing issue in Aurukun with high-school age children who have left boarding school but who have not re-enrolled in school. The improvement in attendance rates in Aurukun is solely related to the primary school, where the rate rose from 50.2 per cent in the first term of 2012 to 71.7 per cent in the first term of 2012.400,401
schools in Queensland. By year level, the largest increase was an increase of only 2 percentage points for Year 8. All the other changes (for years 1 to 10) were 1 percentage point or less. 396 The school attendance rate for the Aurukun campus of the CYAAA was 60.0 per cent in Term 2 2012. While this is down from Term 2 2011 (70.1%) it is still considerably higher than it was in Term 2 2008 (37.9%). These data were not analysed for this evaluation. 397 There has been no improvement in overall school attendance rates in remote communities in the Northern Territory in recent years, and some communities have persistently low attendance rates that show no sustained improvements to date. John Taylor has shown that school attendance rates at Wadeye have been consistently low since 1980. See his Demography as destiny: Schooling, work and Aboriginal population change at Wadeye, CAEPR Working Paper no. 64/2010. 398 From Term 1 2008 to Term 1 2012, average school attendance rates fell in nine of the 17 Indigenous communities for which the Queensland Government regularly publishes school attendance data, and rose in the other eight communities. There is no evidence of any overall upward trend in school attendance rates from 2008 across Indigenous communities in Queensland. The COAG Reform Council’s Report on the National Education Agreement for 2011 was released in November 2012. The report shows that there was very little change in school attendance rates from 2008 to 2011 for Indigenous students in government schools in Queensland. By year level, the largest increase was an increase of only 2 percentage points for Year 8. All the other changes (for years 1 to 10) were 1 percentage point or less. 399 It has been a strategy of the Cape York regional organisations since early 2000 to encourage parents to send their children to boarding school, supporting this via initiatives such as Student Education Trusts (Cape York Partnerships), secondary school scholarships (Cape York Leaders Program) and the Year 7 to 8 Leadership Camp (CYAAA). 400 The fact that the overall attendance rate in Aurukun has risen by a greater amount reflects a compositional shift. The proportion of all students in Aurukun who are secondary students has fallen since 2008. As secondary students have, on

Outcomes
229
Analysis of unit record data
In order to undertake a more rigorous assessment of trends in school attendance rates, FaHCSIA obtained unit record data from DETE.
The FRC unit record data were extracted from the FRC administrative database. The DETE and FRC data were matched by obtaining a list of school students from DETE showing names, dates of birth and unique student identifiers. The FRC holds student identifiers but does not enter them into its client management database.
The DETE list of students was compared manually with an FRC extract which listed children in the care of FRC clients. Most names and dates of birth were matched directly by comparing these records. To complete the matching of all records, a small number had to be checked and confirmed by FRC staff based on their local knowledge, due to minor differences in spellings of names or the recording of dates of birth.
The key focus for the analysis was data for unexplained absences402, which occur where the parent or guardian has not provided a legitimate reason to the school for the child’s absence. Absences due to illnesses or legitimate family obligations are not counted in these data, as they are classified as explained absences. It is important to focus on unexplained absences, as the trigger for FRC intervention is a child being absent from school for three full or part days in a school term without a reasonable excuse. The data on unexplained absences used below are the data that are used by DETE to inform the FRC.
Total unexplained absence rates
For the unexplained absence rates, a weekly average was calculated from the unit record data. Within an individual school year, the general pattern of unexplained absences is one of fewer absences at the beginning of the year and again at the end, with higher absence rates in the middle of the year.
Figure 8.5 shows the unexplained absence rate403 for school students in Aurukun. There was a sharp drop in the rate in 2009, followed by a rise in 2010 and a new decline in 2011. In 2011, the unexplained absence rate was considerably lower than it was in 2008 and lower than in 2009.
In 2008, only around one-third of enrolled students in Aurukun were in school on any given day. This figure roughly doubled to around two-thirds of students in school on any given day in 2011.
The trend line in Figure 8.5 is provided for illustrative purposes (it does not fully capture any trends within each year). However, the raw data show a clear reduction in the unexplained absence rate in Aurukun from 2008 to 2011.404
average, lower attendance rates than primary school students, the marginal impact of this shift has been to raise the overall attendance rate in Aurukun. 401 It should also be noted that the Attendance Case Management Framework initiative was targeted to primary school age children only. 402 This includes both unauthorised absences and absences that are not explained. In the unit record data provided by DETE both the term ‘unauthorised absence’ and the term ‘unexplained absence’ are used. Both categories were used in this analysis noting that these data are the data that are provided to the FRC as a person’s child being absent from school for three full or part days in a school term without a reasonable excuse, or the person’s child of school age is not enrolled in school without a lawful excuse. Throughout this chapter the term ‘unexplained absence’ is used. 403 Using unit record data for each day, unapproved absences for each student were tallied across the school year. Daily absence numbers were calculated, and weekly absence numbers were calculated by summing across for each day in a week (mostly five-day weeks, but some holidays make for shorter weeks—these were accounted for). Absence rates were calculated by multiplying student enrolments by the number of days in the week—this number is the denominator. The weekly absence count is the numerator. 404 The polynomial trend line shown in the chart has a better fit than other possible alternatives. The weekly absence rate was fitted to a linear, logarithmic, exponential and polynomial curve. In each case the polynomial curve presented here was the best fit for both figures 8.5 and 8.6 (noting that 8.6 is effectively the inverse of 8.5). Aurukun r2 = 0.462 p < 0.001 for the polynomial and for all the other models the r2 was less than 0.350.

Cape York Welfare Reform—Evaluation
230
Figure 8.5 Unexplained absence rate in Aurukun, by week, 2008 to 2011
0
10
20
30
40
50
60
70
1 8 15 22 29 36 43 50 57 64 71 78 85 92 99 106 113 120 127 134 141 148 155
Week
Per
cen
t
2008 2009 2010 2011
— Underlying trend
Figure 8.6 shows weekly attendance rates for Aurukun. The decline in unexplained absences is matched by a rise in school attendance over the CYWR period.
It is important to test whether the changes are statistically significant. The fall in the unexplained absence rate in Aurukun from 2008 to 2011 was highly significant (p = 0.000). There was no statistically significant change in Coen, which maintained a low unexplained absence rate and a high school attendance rate from 2008 to 2011. The unexplained absence rate for students from Mossman Gorge showed a statistically significant fall from 2008 to 2011 (p = 0.000).405 The unexplained absence rate in Hope Vale showed a statistically significant increase from 2008 to 2011 (p = 0.025). However, the increase in Hope Vale was very small (a 3.1% point rise in the unexplained absence rate).406
It is worth looking at the pattern of changes across each year. In Aurukun the unexplained absence rate was statistically significantly lower in 2009, 2010 and 2011 than it was in 2008; however, there were no statistically significant differences between 2009, 2010 and 2011. In Coen there were no statistically significant differences between any of the years, while in Hope Vale the unexplained absence rate was statistically significantly higher in 2011 than it was in any of the other years; however, the difference was small. There were no other statistically significant differences in Hope Vale between any of the other years. For students from Mossman Gorge, the unexplained absence rate was statistically significantly higher (and the school attendance rate lower) in 2008 than in any of the other years. The unexplained absence rate for students from Mossman Gorge was also statistically significantly lower than in any of the other three years in 2010.
405 This may appear to be surprising when this outcome is compared with Figure 8.4; however, the low school attendance figure for Term 2 2008 should be noted. In addition, this comparison, unlike Figure 8.4, includes data for the first term of 2008. The change from 2008 to 2012 while statistically significant was not large. The increase in the school attendance rate for students from Mossman Gorge that was associated with the decline in the unexplained absence rate was only 6.5 percentage points. 406 Statistically significant changes should not be conflated with meaningful changes. A very small change may be statistically significant but would be less meaningful than a large statistically significant change.

Outcomes
231
Figure 8.6 School attendance rate in Aurukun, by week, 2008 to 2011
0
10
20
30
40
50
60
70
80
90
100
1 8 15 22 29 36 43 50 57 64 71 78 85 92 99 106 113 120 127 134 141 148 155
Week
Per
cen
t
2008 2009 2010 2011
— Underlying trend
Explained absences
As shown in Figure 8.7, explained absences in Aurukun have not changed in any important way since the start of the CYWR, and therefore the changes over time in attendance are solely due to changes in unexplained absences, rather than unexplained absences reducing because more absences are explained. Thus the improvement in the school attendance rate in Aurukun reflects declines in unexplained absences, not explained absences.407
The several spikes of around 20 per cent represent a single day in the week (often Friday) when many students were absent with an explanation.
407 Explained absences did not play an important role in trends across the other three communities either.
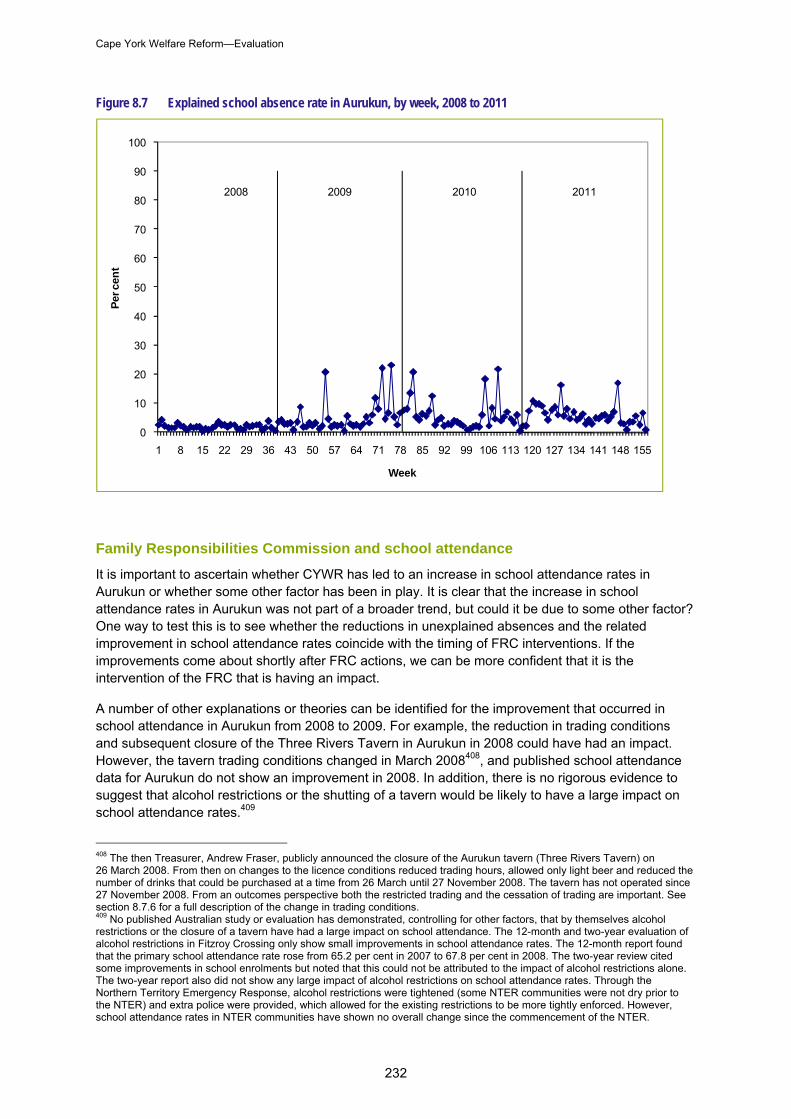
Cape York Welfare Reform—Evaluation
232
Figure 8.7 Explained school absence rate in Aurukun, by week, 2008 to 2011
0
10
20
30
40
50
60
70
80
90
100
1 8 15 22 29 36 43 50 57 64 71 78 85 92 99 106 113 120 127 134 141 148 155
Per
cen
t
Week
2008 2009 2010 2011
Family Responsibilities Commission and school attendance
It is important to ascertain whether CYWR has led to an increase in school attendance rates in Aurukun or whether some other factor has been in play. It is clear that the increase in school attendance rates in Aurukun was not part of a broader trend, but could it be due to some other factor? One way to test this is to see whether the reductions in unexplained absences and the related improvement in school attendance rates coincide with the timing of FRC interventions. If the improvements come about shortly after FRC actions, we can be more confident that it is the intervention of the FRC that is having an impact.
A number of other explanations or theories can be identified for the improvement that occurred in school attendance in Aurukun from 2008 to 2009. For example, the reduction in trading conditions and subsequent closure of the Three Rivers Tavern in Aurukun in 2008 could have had an impact. However, the tavern trading conditions changed in March 2008408, and published school attendance data for Aurukun do not show an improvement in 2008. In addition, there is no rigorous evidence to suggest that alcohol restrictions or the shutting of a tavern would be likely to have a large impact on school attendance rates.409
408 The then Treasurer, Andrew Fraser, publicly announced the closure of the Aurukun tavern (Three Rivers Tavern) on 26 March 2008. From then on changes to the licence conditions reduced trading hours, allowed only light beer and reduced the number of drinks that could be purchased at a time from 26 March until 27 November 2008. The tavern has not operated since 27 November 2008. From an outcomes perspective both the restricted trading and the cessation of trading are important. See section 8.7.6 for a full description of the change in trading conditions. 409 No published Australian study or evaluation has demonstrated, controlling for other factors, that by themselves alcohol restrictions or the closure of a tavern have had a large impact on school attendance. The 12-month and two-year evaluation of alcohol restrictions in Fitzroy Crossing only show small improvements in school attendance rates. The 12-month report found that the primary school attendance rate rose from 65.2 per cent in 2007 to 67.8 per cent in 2008. The two-year review cited some improvements in school enrolments but noted that this could not be attributed to the impact of alcohol restrictions alone. The two-year report also did not show any large impact of alcohol restrictions on school attendance rates. Through the Northern Territory Emergency Response, alcohol restrictions were tightened (some NTER communities were not dry prior to the NTER) and extra police were provided, which allowed for the existing restrictions to be more tightly enforced. However, school attendance rates in NTER communities have shown no overall change since the commencement of the NTER.

Outcomes
233
Another possible cause of improved school attendance in the CYWR communities may have been the impact of alcohol management plans. However, this seems unlikely to be a relevant factor in explaining the increase in school attendance in Aurukun in 2009, given that the alcohol management plan in Aurukun became effective on 30 December 2002 and the alcohol carriage limit under this plan410 has not changed since 2002. In addition, unpublished Queensland Police data show that reported liquor offences relating to the alcohol management plan in Aurukun rose from 164 in 2007–08 to 197 in 2008–09 and 277 in 2009–10.
One theory that is mentioned in the literature about factors affecting school attendance relates to the impact of school principals. Some of this literature considers whether school principals can themselves bring about large changes in school attendance. However, no published Australian study or evaluation that controls for other factors has demonstrated such an effect in remote Indigenous communities and the international evidence on this issue is not strong.411 It is very difficult to isolate the impact of a school principal on school attendance, controlling for other factors. However, a change of school principal cannot explain the large increase in school attendance rates that occurred in Aurukun in 2009, as the same principal was at the school in 2008 and 2009.412
Another possible cause of the rise in school attendance in Aurukun could have been the student case managers (SCMs). However, while SCMs were in place in Aurukun in 2009, the records show that this service had some difficulties setting up. At the time there was poor cooperation between SCMs and the school, and the SCMs were understaffed and experienced some staff turnover. This gives further weight to the view that it was the FRC that had the most important impact on school attendance in Aurukun in 2009, although SCMs may have played a role in sustaining high levels of attendance. It is difficult to assess the impact of SCMs on school attendance in the absence of unit record data on the activities of SCMs that could be linked to attendance data for individual students.
It is also worth noting that the CYAAA was not responsible for the large rise in school attendance that occurred in Aurukun in 2009, as the CYAAA did not commence in Aurukun until 2010.
Given its relative size, and the fact that it accounts for the majority of improved school attendance from 2008 to 2011, some of the analysis below focuses on Aurukun. Importantly, the significant rise in school attendance rates that occurred in Aurukun from 2008 to 2009 reflects changes in school attendance for students who are in scope of the FRC (children whose parents are not in receipt of income support payments or CDEP payments are not subject to the FRC).
To assess the impact of the FRC, absence data for individual students was matched with FRC data. By matching data on unexplained absences for individual students with FRC data on every conference held (that related to that student), including the reason(s) for that conference and its date it was possible to assess patterns of school attendance for students who were the subject of a conference before and after each conference. For each student an attendance record and conference record covering the three school years from 2009 to 2011 was developed. These data are used in Figure 8.8.
410 Aurukun has had a zero carriage limit since 30 December 2002. Hope Vale had a carriage limit of 9 litres of light or mid-strength beer plus 2 litres of unfortified wine from 14 April 2004; this was then revised on 2 January 2009 to 11.25 litres of light or mid-strength beer or 750 ml of non-fortified wine. Coen and Mossman Gorge do not have carriage limits in place but have dry place declarations. As reported in the January–March 2012 Queensland quarterly bulletin on key indicators in discrete Indigenous communities, there are seven dry place declarations in Mossman Gorge and 12 in Coen. 411 See Indicated truancy interventions: Effects on school attendance among chronic truant students, the Campbell Collaboration, 2012. This systematic review highlighted deficiencies in the existing literature and cited only one study that met the minimum standards to be included in the review, which looked at the impact of school leadership on truancy. The EPPI-Centre published A systematic review of the impact of school head teachers and principals on student outcomes in September 2003. This review also cited limitations in the literature and concluded that ‘It is widely recognised that leadership is not exclusively located in the head teacher or senior management of the school. Hence one tentative conclusion from these findings is to suggest that leadership that is distributed among the wider school staff might be more likely to have an effect on the positive achievement of student outcomes than that which is largely, or exclusively, “top-down”’. 412 Since the start of the CYWR until December 2012, Hopevale campus had had five principals; Aurukun, four principals; and Coen, 10 principals. The fact that Coen has had 10 principals has not had an adverse impact on school attendance.

Cape York Welfare Reform—Evaluation
234
By analysing the difference before and after conferences it is possible to be more confident that it is the FRC rather than some other factor that is affecting outcomes. It is important to emphasise that these data are for individual students who were the subject of a conference. This means that there is no overlap between the weeks before the conference and the weeks after the conference. Such an overlap could occur if the data were based on simple averages across all students, as a conference week for one student may be four weeks after a conference for another student. By focusing on individual students, we can avoid this type of confounding effect. Also by focusing on individual students it is possible to avoid any confounding effect that would come about if data for students who were not the subject of a conference for school attendance were included in the analysis.
The FRC is charged with the task of holding a conference with certain members of the CYWR communities under specific circumstances. While the FRC began its activities in 2008, it only started operating at the beginning of the financial year (1 July) and not very many conferences were held until late in the calendar year. The 2008 school year was, therefore, excluded from this analysis.
For the 2009 school year (which is not the same as the calendar year), the FRC had 13 conference weeks (that is, the FRC scheduled conferences with the carers of students during 13 weeks of the year). Only 12 of these were used because the final conference was too close to the end of the school year to demonstrate any impact on attendance rates.
The analysis focuses on changes in attendance patterns after the conference for students who were the subject of a conference for school attendance. Ten of the 12 weeks display an increase in attendance after the conference for these students. This provides some confidence that the FRC had an impact. For the two weeks that did not show an increase in attendance after the conference, the before and after rates are very similar. Across the whole 12 weeks of conferences, the mean absence rate in the four weeks prior to a conference for students who were the subject of a conference were 44 per cent, while in the four weeks after the conference mean absence rate was 33 per cent—a relative reduction of 25 per cent. This is shown in Figure 8.8. These results are based on a conference count of 365.413
During the 2010 school year, the FRC held conferences in 14 weeks of the year (not counting conferences scheduled in the second week of school at the beginning of the first term because there are not four weeks of school prior to this date). Five of these weeks had worse attendance patterns after the conference than before. Overall, across the whole year a smaller improvement was observed. The absence rate was 48 per cent in the four weeks prior to the conferences and dropped to 46 per cent for the four weeks after the conference. Using a similar counting procedure as for 2009, there were 449 conferences in 2010.
413 The analysis includes students who had more than one conference in separate weeks but does not include both instances of the few individuals who had two conferences in one week and, as mentioned before, does not include the last round of conferences for the year because there were not four weeks of school afterwards.

Outcomes
235
Figure 8.8 Unexplained school absence rate in Aurukun before and after FRC conferences, 2009 to 2011
4448 47
33
46 46
0
10
20
30
40
50
60
70
80
90
100
2009 2010 2011
Year
Ab
sen
ce r
ate
(%)
Before
After
In 2011 the FRC held conferences in 15 weeks of the school year (not counting a final round scheduled in the final week of the fourth term). Six of the weeks had worse attendance patterns after the conferences than before. As in 2010, the overall attendance for the year showed only a small improvement. Absences were 47 per cent in the four weeks prior to the conference, dropping to 46 per cent for the four weeks after. In 2011 there were 512 conferences.
The fall in the unexplained absence rate after conferences in 2009 was statistically significant (p < 0.001), as was the fall in 2010 (p < 0.05). However, the difference in 2011 was not statistically significant (p > 0.1).414
Taken at face value, these results suggest that the FRC had a large impact on school attendance rates in 2009 but a smaller impact in 2010 and 2011. From the published data on school attendance and the unit record data on unexplained absences, it is clear that the large improvement in school attendance that occurred was sustained into 2010 and 2011. Indeed, the unexplained absence rate in Aurukun showed no statistically significant change from 2009 to 2011—the improvement that occurred from 2008 to 2009 was maintained. However, it is also clear that the FRC had a lesser effect on the students it dealt with in 2011 than with the students it dealt with in 2009.
414 Equivalent analysis was conducted for students from Coen, and Hope Vale and Mossman Gorge. In the case of Coen there is little to report as the number of unexplained absences from school is very small. In the small number of cases from Coen that did come before the FRC in 2009, 2010 and 2011 the unexplained absence rate from school was lower in the four weeks after the conference than it was in the four weeks prior to the conference but, given small numbers, the difference was not statistically significant. In Hope Vale there was also a lower unexplained absence rate for students that were the subject of a conference in the four weeks after a conference, than there was in the four weeks before the conference in 2009, 2010 and 2011. However, the differences were not statistically significant. In this case the unexplained absence rate for Hope Vale students who were the subject of a conference was small (relative to Aurukun). For students from Mossman Gorge who were the subject of a conference for school attendance the same pattern applies: the unexplained absence rate was lower in the four weeks after the conference than it was in the four weeks before the conference in 2009, 2010 and 2011. In the case of Mossman Gorge none of the differences for individual years were statistically significant but there was a statistically significant difference at the 10 per cent level (but not the 5 per cent level) across three years combined.

Cape York Welfare Reform—Evaluation
236
In understanding the pattern shown in Figure 8.8 it is worth noting that, in 2009, there were almost two conferences per student on average. In 2010 and 2011, this number had risen to almost four per student. As noted above, there were 365 cases where students were the subject of a conference in 2009, 449 in 2010 and 512 in 2011. This suggests that the number of students who were the subject of a conference at some time during each year was considerably higher in 2009 than it was in 2010 and 2011.415 This means that the interventions in 2009 had a lasting impact on some students and they were therefore subject to fewer subsequent conferences. This may indicate that the students with whom the FRC was dealing in 2010 and 2011 may have been a somewhat more challenging group. There also appears to be a group of students for whom FRC conferences seem to be having a limited effect, given that there is no statistically significant difference in the unexplained absence rate before and after conferences for students in Aurukun who were the subject of a conference in 2011.
The sustained impact of the FRC on the school attendance of a number of students is confirmed by the fact that children who were the subject of a conference for school attendance in 2009 had a 16 per cent lower unexplained absence rate one year after their 2009 conference than they had one month prior to their conference in 2009.
Further evidence that the FRC had a sustained impact on school attendance in Aurukun is provided in Figure 8.9, which shows that the unexplained absence rate for individual students who were the subject of a conference in 2009 dropped from 44 per cent one month before the conference to 35 per cent in the month of the conference and 34 per cent one month after the conference month. Importantly, two months after the conference month the unexplained absence rate for students who were the subject of a conference was still considerably lower at 38 per cent than it was prior to the conference (this is a statistically significant decline). If the FRC were having only a transitory effect, then the absence rate two months after the conference month would have returned to a level similar to that prior to the conference.
Figure 8.9 Unexplained school absence rate in Aurukun before and after FRC conferences, 2009
46 44
35 3438
0
10
20
30
40
50
60
70
80
90
100
2 months before 1 month before Conference month 1 month after 2 months after
Ab
sen
ce ra
te (%
)
Months relative to conferences
415 365 divided by two is greater than both 449 and 512 divided by four.
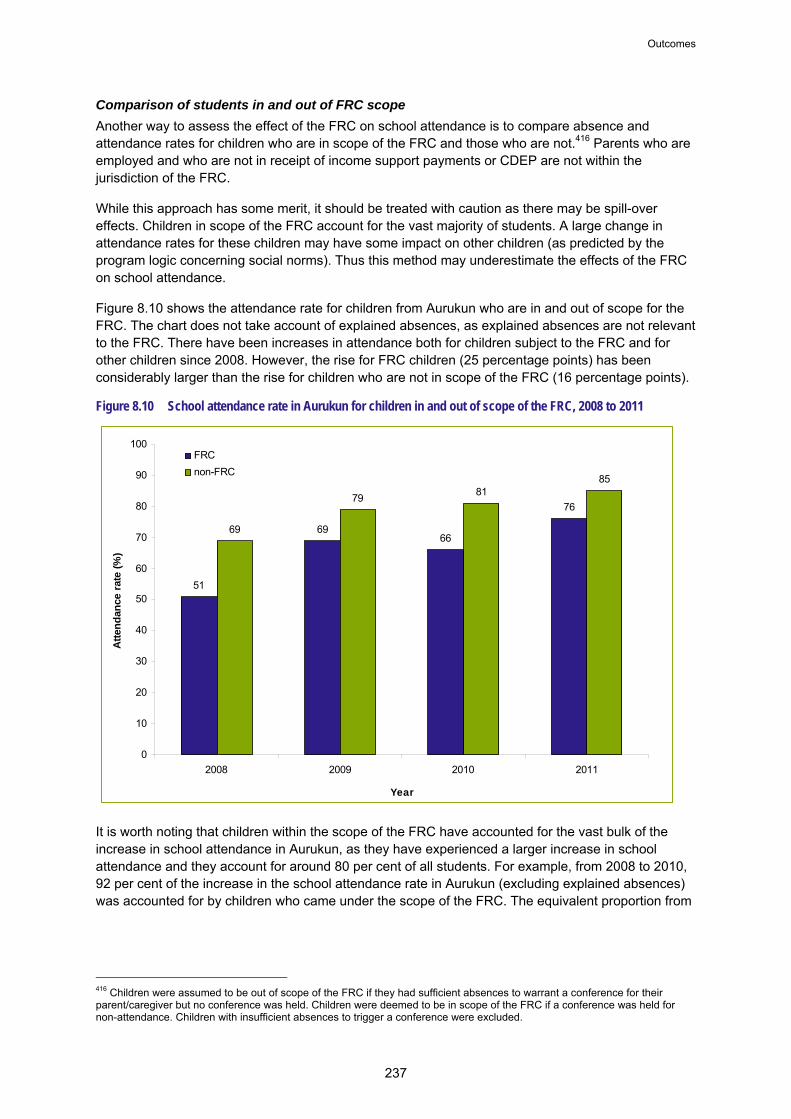
Outcomes
237
Comparison of students in and out of FRC scope
Another way to assess the effect of the FRC on school attendance is to compare absence and attendance rates for children who are in scope of the FRC and those who are not.416 Parents who are employed and who are not in receipt of income support payments or CDEP are not within the jurisdiction of the FRC.
While this approach has some merit, it should be treated with caution as there may be spill-over effects. Children in scope of the FRC account for the vast majority of students. A large change in attendance rates for these children may have some impact on other children (as predicted by the program logic concerning social norms). Thus this method may underestimate the effects of the FRC on school attendance.
Figure 8.10 shows the attendance rate for children from Aurukun who are in and out of scope for the FRC. The chart does not take account of explained absences, as explained absences are not relevant to the FRC. There have been increases in attendance both for children subject to the FRC and for other children since 2008. However, the rise for FRC children (25 percentage points) has been considerably larger than the rise for children who are not in scope of the FRC (16 percentage points).
Figure 8.10 School attendance rate in Aurukun for children in and out of scope of the FRC, 2008 to 2011
51
6966
76
69
7981
85
0
10
20
30
40
50
60
70
80
90
100
2008 2009 2010 2011
Year
Att
end
ance
rat
e (%
)
FRC
non-FRC
It is worth noting that children within the scope of the FRC have accounted for the vast bulk of the increase in school attendance in Aurukun, as they have experienced a larger increase in school attendance and they account for around 80 per cent of all students. For example, from 2008 to 2010, 92 per cent of the increase in the school attendance rate in Aurukun (excluding explained absences) was accounted for by children who came under the scope of the FRC. The equivalent proportion from
416 Children were assumed to be out of scope of the FRC if they had sufficient absences to warrant a conference for their parent/caregiver but no conference was held. Children were deemed to be in scope of the FRC if a conference was held for non-attendance. Children with insufficient absences to trigger a conference were excluded.

Cape York Welfare Reform—Evaluation
238
2008 to 2009, when the large rise in school attendance in Aurukun first became apparent, was just under 90 per cent.417
Comparison with other communities
As noted above, the improvement in school attendance that has occurred since 2008 in Aurukun was not part of a broader trend. To more rigorously test this, FaHCSIA obtained unit record data on school attendance for Palm Island, Doomadgee, Kowanyama, Lockhart, Mornington Island, Pormpuraaw, Mapoon and Indigenous students who attend school in Weipa.418
This section uses three kinds of analysis to examine changes in school attendance since the start of CYWR in the CYWR communities compared with the comparison communities. The three approaches are to look at the overall trend in school attendance, examine cohorts of students from Year 2 to Year 5, and match individual student records for students in the CYWR communities with students in comparison communities by school year and gender.
As Figure 8.11 shows, in 2008 the average attendance rate in the comparison communities was 4 percentage points above the CYWR communities. By 2011, the average school attendance rate in the CYWR communities was 6 percentage points higher than in the comparison communities, which is a net turnaround of 10 percentage points.419 This net change is statistically significant.
As Figure 8.11 is based on the full unit record file, the data are effectively weighted by student numbers. This means that communities with a relatively large number of students have a larger weight than communities with a smaller number of students.
Another way to compare trends in school attendance across the four CYWR communities with the comparison communities is to follow a student cohort through time. As an example of a cohort, a student who was in Year 2 in 2008 would be in Year 3 in 2009, Year 4 in 2010 and Year 5 in 2011.
Figure 8.12 shows the Year 2 to Year 5 cohort from 2008 to 2011. In 2008, the Year 2 cohort in the four CYWR communities had a 3 percentage point lower attendance rate than students in the comparison communities.420 By 2011, this situation had changed so that these students (who were now in Year 5) had a 9 percentage point higher attendance rate than children in the comparison communities. This represents a net turnaround of 12 percentage points. Similar net turnarounds are evident for the other relevant cohorts.
The cohort analysis confirms that as children age their attendance patterns tends to drop. A particular drop is noticeable in a number of communities when children move into high school (Year 8 in Queensland).
417 For this calculation, the share of children who are in scope of the FRC was held constant from 2008 to 2009. The share of children under the scope of the FRC rose from 2008 to 2009. If this factor is taken into account, then children under the scope of the FRC accounted for more than 100 per cent of the increase in the school attendance rate from 2008 to 2009. 418 To address ethical requirements, matching of unit record data was conducted by FaHCSIA and de-identified data was provided to the SPRC. These comparison communities were suggested by DETE for the purpose of this analysis. 419 As this chart was based on unit record data, the data are effectively a weighted average for the CYWR and comparison communities where the weights are provided by the number of students in each community. In other words, communities with a smaller number of students are not inappropriately given the same weight as larger communities. 420 This analysis is based on the full unit record file, which includes all enrolled students shown across all the communities covered by the figure.

Outcomes
239
Figure 8.11 School attendance rates, CYWR and comparison communities, 2008 to 2011
68
80 80 81
7274 75 75
0
10
20
30
40
50
60
70
80
90
100
2008 2009 2010 2011
Year
Att
end
ance
rat
e (%
)
CYWR
Comparison
Gap 6% ahead
Gap 5% ahead
Gap 6% ahead
Gap 4% behind
Figure 8.12 Attendance rates for children who were in Year 2 in 2008, Year 3 in 2009, Year 4 in 2010 and Year 5 in 2011, CYWR and comparison communities
76
84 84 85
79
74 75 76
0
10
20
30
40
50
60
70
80
90
100
2008 2009 2010 2011
Year
Att
end
ance
rat
e (%
)
CYWR
Comparison
Cape York Welfare Reform—Evaluation
240
We have already noted that the most important year-on-year improvement occurred in 2008 and 2009 in Aurukun. This section uses individual student data in the CYWR communities and comparison communities to better understand the impact of the reforms.
Individual students in the four welfare reform communities were matched to similar students in the comparison communities to more rigorously test whether the changes in the four CYWR communities were unusual. By matching at this level, factors such as a compositional shift towards younger students who tend, on average, to have better school attendance patterns than older students can be controlled for. This approach allows for a more rigorous comparison than is possible with aggregate school attendance data, as the aggregate data does not control, among other things, for compositional shifts in the age profile of the school population.
All the matches for this exercise were based on the gender of students and their year level. Thus, Year 3 female students in the CYWR communities are compared with Year 3 female students in the comparison communities. Students were also matched according to the number of days they were absent from school in 2008. This then allows us to test whether students with similar levels of school attendance in the comparison communities experienced a comparable increase in school attendance to children in the welfare reform communities. Individual students were not matched to other individual students in some key categories; rather, the match was based on ranges. For example, Year 3 boys in the four CYWR communities who were absent from school for 10–30 days in 2008 were matched with Year 3 boys in the comparison communities who were also absent from school for 10–30 days in 2008.
Figure 8.13 provides a comparison of changes in attendance from 2008 to 2009 for female students in the four CYWR communities and the comparison communities. The horizontal axis shows the number of days that students were absent in 2008. The vertical axis shows the change in attendance days from 2008 to 2009. A rise suggests an improvement in attendance, whereas a decline shows a worsening. Some of the changes are not surprising. For example, a child who was absent for less than 10 days could not move into a better category because it is not possible to be absent for less than zero days. However, it is also clear that female students in the CYWR communities showed a faster rate of increase in school attendance from 2008 to 2009 than students in the comparison communities.
Figure 8.14 shows absences for male students, and indicates a similar pattern to Figure 8.13. Male students in the four welfare reform communities experienced a greater increase in school attendance than students in the comparison communities.
The difference in the mean change in school attendance from 2008 to 2009 for male and female students in CYWR communities and the matched male and female students in the comparison communities is statistically significant.421
Transitional support
As noted above, a significant number of students from the four communities are eligible for support to attend secondary school outside their communities. As noted, in Section 8.8.6, changes were made to ABSTUDY, including a bypass so that students could attend boarding schools even where they have a local secondary school option.
Support is provided through TSS422, which is funded by DETE. TSS supports remote Indigenous students and their families in their transition to and through the secondary phase of schooling.
421 In both cases p < 0.001. 422 The TSS data presented in this section is for those students who are supported by the TSS and therefore does not reflect all students who are receiving education services out of community, such as some students who go to private boarding schools on scholarships. In addition it does not include students from the community of Mossman Gorge.

Outcomes
241
Students who graduate from remote primary schools on Cape York, the Northern Peninsula Area and the Torres Strait often have to leave their home communities in order to attend secondary school.
Figure 8.13 Changes in school attendance from 2008 to 2009 for female students in CYWR and comparison communities matched on school year and unexplained absences in 2008
-30
-20
-10
0
10
20
30
40
50
60
<10 10–30 30–60 60–90 >90
2008 absence count (days)
Mea
n c
han
ge
in a
tten
dan
ce d
ays
2008
–09
CYWR
Comparison

Cape York Welfare Reform—Evaluation
242
Figure 8.14 Changes in school attendance from 2008 to 2009 for male students in CYWR and comparison communities matched on school year and unexplained absences in 2008
-30
-20
-10
0
10
20
30
40
50
60
<10 10–30 30–60 60–90 >90
2008 absence count (days)
Mea
n c
han
ge
in a
tten
dan
ce d
ays
2008
–09
CYWR
Comparison
TSS assists students and their families to manage transition-related challenges and to develop opportunities. This support is provided by community support officers who work to prepare and support students and their families to select, apply and transfer to a secondary school that ‘best fits’ their needs and resources.
At the major regional centres (Cairns, Atherton Tablelands, Townsville, Charters Towers, Ingham, Rockhampton, Yeppoon, Brisbane, Ipswich and Toowoomba) there are transition support officers who meet students weekly at their secondary schools to help them to orientate to their new schools and community and to remain enrolled until they complete Year 12.
Table 8.2 shows a large increase in the total number of students from Aurukun who were assisted by the TSS to attend a secondary school away from their home community in 2009 (62) compared to 2008 (39). As noted above, most of this increase was accounted for by Year 8 to Year 10 students despite the fact that the school in Aurukun goes to Year 10. By 2011, the total number of students from Aurukun assisted by TSS was 78.
While the increase in the number of children receiving support to attend boarding school outside Aurukun with assistance from TSS is positive, DETE estimates that retention rate of students from Aurukun is relatively low at 50 per cent. This means that 50 per cent of secondary age students from Aurukun who are supported to attend boarding school return to Aurukun as a result of a de-enrolling event ( this includes self-exclusion, parental withdrawal, exclusion or cancellation of enrolment). On returning to Aurukun, a significant number of these school-aged children do not enrol at the Aurukun campus of CYAAA and are therefore not enrolled in any school. DETE estimates that there are

Outcomes
243
currently423 42 children in Aurukun of compulsory secondary school age who are not enrolled in school.
TSS is notified by the boarding school when a student is excluded. TSS then advises up to five entities in the community (including the council, the school principal, the Community Justice Group and the family). The TSS has been working closely with the FRC, despite the fact that TSS are not required to under legislation. TSS provides details, for example, of the flight the student is arriving on. It is the local school principal who is responsible for trying to get students back to school.
The non-enrolment of around 42 secondary students of compulsory school age in Aurukun is an ongoing issue that is currently being addressed. The FRC has never received a formal agency notice to inform them about children who are not enrolled in school in any of the four welfare reform communities and the FRC can only act upon a notice. Even if the FRC know that children in the community are not enrolled in school they cannot formally convene a conference as they cannot bring a parent/carer to conference without a notice.
The DETE has noted that since August 2012 these young people have been individually case managed by the Aurukun Multi-Agency Case Management Team facilitated by the DETE’s far North Queensland Region and Transition Support Service. The FRC has also been involved in this process. The team has met every three weeks since late August. As a result, identified youth have been supported to gain entry to boarding schools outside the community for the start of 2013, or if they have not been successful in this process, then the remaining students have been referred to enrol at Western Cape College, with programs based in Weipa and Aurukun. Another issue is that the nature of the secondary school at Aurukun has changed over time. In 2010, the Aurukun campus became part of the CYAAA and since that time the number of years 8–10 students has declined, among other things due to a deliberate strategy by the CYAAA to encourage students to attend boarding school. The CYAAA argues that the secondary school program is no longer viable.424
Some stakeholders noted that there has also been some confusion about the continuation of the secondary campus at Aurukun. This issue has now been resolved.
From the commencement of the 2013 school year, DETE advise that Western Cape College will assume responsibility for the provision of secondary education for students based in Aurukun. This has now been approved by the Minister for Education, Training and Employment. Secondary education will be provided by a small number of teachers based at the Aurukun campus under the educational leadership of Western Cape College. Secondary students enrolling at Western Cape College will be encouraged to attend the Weipa campus and live at the Weipa residential facility.
Western Cape College will case manage students to engage in the secondary program at Aurukun or to transition to the residential college and secondary school at Weipa. Western Cape College and the CYAAA will also work together to ensure that secondary school age young people in Aurukun are enrolled in a secondary school for the 2013 school year. These arrangements will be evaluated in mid- to late 2013 to inform the future of the secondary department at Aurukun from the start of the 2014 school year.
423 November 2012. 424 It has been the CYAAA’s plan since 2010—at the request of the Aurukun mayor—to close the Aurukun secondary campus. According to the CYI the Aurukun campus has never offered an appropriate secondary curriculum. The CYI also argues that numerous attempts have been made to meet the needs of post-Grade 7 students but none have been deemed to meet currently accepted standards for Australian secondary education. The only appropriate option that has led to success for some students has been boarding school. Since CYAAA commenced operations in 2010, the Aurukun campus staff and Transition Support Officers have worked to assist Aurukun secondary school students to transition to schools of their parents’ choice outside Aurukun. As a result, only six students remained enrolled in secondary school in Term 1 2012.

Cape York Welfare Reform—Evaluation
244
The existing TSS will continue to support Year 7 students to apply and transition to boarding schools, and will support all students who are at boarding school to complete their schooling.425
Formal agency notices could be provided to the FRC if ongoing issues involving students not being enrolled in school continue. Once the FRC receives a formal notice, it can then arrange conferences and attempt to assist the student to successfully enrol in school.
It is also worth noting that the number of students who were assisted by TSS to attend Year 12 in Aurukun is significantly lower than for all other year levels. For example, 13 students were supported to attend Year 10 in 2008, and by 2010 this number had decreased to eight Year 12 students. Similarly, 11 students were supported to join the Year 10 cohort in 2009, and by 2011 the number of students attending Year 12 declined to just two. However, in 2011, 24 students from Aurukun were receiving support to attend Year 11. If a reasonable number of those students transition to Year 12, this could lead to a large rise in the number of students who have been supported to Year 12. In 2011 a total of 26 students from Aurukun were supported to attend school in either Year 11 or Year 12, which is up from only 9 students in 2008 and 15 students in 2010.
Table 8.2 Aurukun students transitioning to boarding schools, by year level, 2008 to 2011
Year 8 Year 9 Year 10 Year 11 Year 12 Total 2008 11 6 13 7 2 39 2009 12 20 11 14 5 62 2010 15 14 25 7 8 69 2011 17 18 17 24 2 78
Table 8.3 shows a decrease (from 28 to 22) in the number of students from Coen who transitioned to a secondary boarding school outside their home community from 2008 to 2011.
Table 8.3 Coen students transitioning to boarding schools, by year level, 2008 to 2011
Year 8 Year 9 Year 10 Year 11 Year 12 Total 2008 7 8 0 8 5 28 2009 0 6 7 6 8 27 2010 2 3 6 6 5 22 2011 6 2 3 6 5 22
Table 8.4 shows that in Hope Vale the number of students who transitioned to a secondary school outside their home community increased from 56 in 2008 to 64 in 2009. The figure remained stable in 2010 but decreased from 64 in 2010 to 53 in 2011.
Similarly to Aurukun, a smaller number of students at Hope Vale were supported by TSS at Year 12 level. In 2008 six students were in the Year 11 cohort and by 2009 the student number in Year 12 had decreased to four. Similar decreases were seen in the retention rate of Year 11 students in other years.
425 The Cape York regional organisations will continue to encourage parents to send their students to boarding school through financial saving programs, scholarship programs and transition preparation activities such as leadership camps. The Cape York Leaders Program will continue to support boarding school students on scholarship.

Outcomes
245
Table 8.4 Hope Vale students who transitioned to a destination school, by school year, 2008 to 2011
Year 8 Year 9 Year 10 Year 11 Year 12 Total 2008 13 12 17 6 8 56 2009 16 15 11 18 4 64 2010 18 15 10 7 14 64 2011 16 15 13 6 3 53
DETE is not able to provide specific data on which schools TSS students were attending; however, it is able to provide the data by school region only. Table 8.5 shows data for the 2011 enrolment cohort.
Table 8.5 TSS students attending boarding schools in each region for the 2011 cohort
Community Aurukun Coen Hope Vale Region Cairns 2 1 3 Townsville 3 2 2 South-east Queensland 5 – 1 Central Queensland – 1 – Total schools 10 4 6
According to DETE, there is no school that any group of students from any community or year level attends more than another. This is reflected in all the data from across all communities that have students attending boarding schools. Many parents in the communities that TSS works with have stated that they do not want all the children from one community going to the same school, for a variety of social, cultural and gender reasons.
8.5 Educational outcomes
8.5.1 Key findings There has been an increase in educational attainment in the CYWR communities, although this is
part of a broad trend in Queensland Indigenous communities.
It is difficult to discern any clear trends in the NAPLAN data for either the CYWR communities or other Indigenous communities in Queensland; however, improvements in NAPLAN results for Coen are evident. The CYAAA will be the subject of another evaluation.
8.5.2 Introduction
This section provides an analysis of educational attainment outcomes over the course of CYWR. Although increasing educational attainment was not a direct objective of CYWR, it is a contextual outcome. This section starts with an analysis of the changes in the level of schooling attained from 2006 to 2011, followed by a comparison of NAPLAN results in reading and writing between the CYWR communities and comparison communities over the course of CYWR. The data in this section should be used with caution due to the small numbers in the dataset.
8.5.3 Educational attainment
Table 8.6 shows both the proportion of adult Indigenous Australians whose highest level of schooling is Year 12 and the minimum schooling rate, which is the proportion of Indigenous people aged 20–64 years who left school before Year 10 (these data therefore do not include people still in school). Rises in the proportion of people who have a Year 12 level of schooling suggest that the level of educational achievement is improving, as is the minimum schooling rate. These census data are for people who live in the four CYWR communities and do not cover people who have moved to another community.

Cape York Welfare Reform—Evaluation
246
Table 8.6 shows that the level of educational attainment varies across the CYWR communities and across other Indigenous communities in Queensland. The proportion of Indigenous people aged 15 and over with a Year 12 level of schooling in 2011 is much lower in Aurukun than it is in Coen and Hope Vale.
The table suggests that the level of educational attainment among Indigenous people in the CYWR communities has improved from 2006 to 2011—the proportion of people with a Year 12 or equivalent level of schooling has risen, while the minimum schooling rate has fallen except for Mossman Gorge. (Data for Mossman Gorge is subject to variance, due to the small population size of the community.) However, this is part of a broader trend that is evident for other Indigenous communities in Queensland.
The Council of Australian Governments (COAG) has set a target to at least halve the gap in Year 12 attainment between Indigenous and non-Indigenous students by 2020. Progress against this target is measured with data on the proportion of 20–24 year olds with a Year 12 or equivalent level of educational attainment.426
Table 8.7 shows the data that are used for the Year 12 target for Indigenous communities in Queensland. The data should be treated with caution, as the number of 20–24 year olds in some communities can be small. The key conclusion from the table is that the improvement in Year 12 or an equivalent level of attainment in the CYWR communities, between 2006 and 2011, appears to be part of a broader trend apparent in most of the comparison communities.
426 A Certificate II level qualification is considered to be equivalent to a Year 12 for this target.

Outcomes
247
Table 8.6 Percentage of Indigenous Australians completing Year 12, and the minimum schooling rate of 20–64 year olds who left school before Year 10, Cape York communities and comparison communities, 2006 and 2011
Community
Yr 12 highest level of schoolinga 15 years and over
Minimum schooling ratea 20 to 64 years
2006 2011 2006 2011 % % % %
Aurukun 2.8 7.0 46 27.1 Cherbourg 13.1 17.2 42.5 36.6 Coen 24.2 28.9 35 26.1 Doomadgee 5.0 10.5 31 24.7 Hope Vale 17.6 25.7 43 26.5 Kowanyama 12.0 19.0 30.2 25.5 Lockhart River 10.3 19.1 45.8 16.9 Mapoonb 13.6 14.0 41.0 46.8 Mornington 16.8 18.2 39 33.7 Mossman Gorge n.a. 7.3 21 60.6 Napranumb 14.4 18.0 45.7 25.2 NPA – Bamaga and surroundsc 38.1 49.4 19.6 7.9 NPA – Injinoob 23.0 29.6 32.1 23.1 NPA – New Mapoonb 26.1 32.2 25.0 19.5 NPA – Seisiab 38.7 50.5 19.6 14.6 NPA – Umagicob 17.7 22.8 11.9 29.6 Palm Island 13.1 18.7 34.9 34.6 Pormpuraaw 8.2 13.0 55.3 38.3 Woorabindab 14.9 12.2 22.6 24.2 Wujal Wujalb 14.7 21.0 39.5 30.5 Yarrabah 20.2 22.7 26.7 20.3 Indigenous Queensland 28.7 33.2 25.3 20.1 Indigenous Australia 22.2 26.7 33.6 25.3 n.a. = data not available; NPA = Northern Peninsula Area a Excludes those people who did not state their highest level of schooling. b Between the 2006 Australian Standard Geographical Classification (ASGC) and the 2011 Australian Statistical Geography Standard (ASGS),
geographical descriptors for these Indigenous locations were modified to better reflect the population distribution. No communities or living areas have been excluded as a result of those modifications; nor have any additional communities or living areas been included.
c Between the 2006 ASGC and 2011 ASGS, geographical descriptors for this Indigenous location were modified to include some additional outstations. Source: ABS, 2006 and 2011 censuses.

Cape York Welfare Reform—Evaluation
248
Table 8.7 Indigenous education Year 12 attainment rates of 20–24 year olds for the Cape York communities and comparison communities, 2006 and 2011
Education attainment rate of 20–24 year olds 2006 2011 Change
% % % point Aurukun 4.0 13.1 9.1 Cherbourg 33.9 36.1 2.2 Coen 53.0 72.7 19.7 Doomadgee 7.0 10.2 3.2 Hope Vale 44.0 56.6 12.6 Kowanyama 18.8 27.5 8.7 Lockhart River 0.0 25.5 25.5 Mapoona 21.4 46.2 24.7 Mornington 23.0 18.2 –4.8 Mossman Gorge n.a. n.a. n.a. Napranuma 27.6 46.2 18.5 NPA – Bamaga and surroundsb 83.3 75.6 –7.7 NPA – Injinooa 40.0 52.8 12.8 NPA – New Mapoona 37.5 55.6 18.1 NPA – Seisiaa n.a. n.a. n.a. NPA – Umagicoa 35.7 68.2 32.5 NPA total 59.2 66.9 7.6 Palm Island 30.9 35.7 4.8 Pormpuraaw 8.6 17.1 8.6 Woorabindaa 44.3 33.8 –10.4* Wujal Wujala 45.0 68.2 23.2 Yarrabah 32.3 43.2 10.8* *% point change note: Where figures have been rounded, some discrepancies may occur between sums of the component items and totals due to rounding. n.a. = not available; NPA = Northern Peninsula Area a Between the 2006 ASGC and 2011 ASGS, geographical descriptors for these Indigenous locations were modified to better reflect the population
distribution. No communities or living areas have been excluded as a result of the modifications; nor have any additional communities or living areas been included.
b Between the 2006 ASGC and 2011 ASGS, geographical descriptors for this Indigenous location were modified to include some additional outstations. Source: ABS, 2006 and 2011 censuses.
8.5.4 NAPLAN results As noted in this report, CYAAA campuses have introduced Direct Instruction over the past two years; however, it is too early in the implementation of this program to come to any definitive conclusions. CYAAA is the subject of another evaluation that will look at school performance in depth. Table 8.8 shows the percentage of children at or above national minimum standards in reading and numeracy for the four CYWR communities.
While some improvements are evident, the data in this table (and for other Indigenous communities in Queensland) should be treated with caution, as NAPLAN results are very sensitive to changes in the number of students who participate in the tests, especially in small schools. In addition, the Australian Curriculum, Assessment and Reporting Authority does not generate standard errors for the percentage of students who meet national minimum standards at a school level and for this reason it is not possible to assess whether any changes are statistically significant. Table 8.8 and Table 8.9 show considerable year-on-year variability for the individual schools, making patterns over time difficult to assess, especially over short periods. Large changes in the percentage of children meeting national minimum standards can relate to very small numbers of students. It should also be noted that by focusing only on the percentage of students who meet national minimum standards, changes for students who are performing above or below this point on the distribution will be missed.
Outcomes
249
According to the CYAAA, at the Coen campus, average scores (excluding writing)427 have improved in 10 out of the 12 categories since 2010. In 2012, all Year 3 Coen students met national minimum standards in every NAPLAN category.428 In the Aurukun campus, average scores have improved in seven out of the 12 categories since 2010.
NAPLAN data do not as yet provide a clear or consistent determination of outcomes from which a robust analysis can be drawn. It is also difficult using published data on the proportion of Indigenous students meeting national minimum standards to discern any clear trends for other Indigenous communities in Queensland. It is not possible to identify any clear upward or downward trends given that the data are based on small numbers of students in individual schools in particular years. For instance, at Doomadgee in 2012, 53 per cent of Year 3 students achieved the minimum standard for reading. Although this was an increase on the 17 per cent achieved in 2008, the equivalent rates in 2009, 2010 and 2011 were 55 per cent, 68 per cent and 75 per cent, respectively.
Students in CYAAA schools start from a very low base compared to those in mainstream schools who meet national benchmarks. Thus, the assessment of progress must look to the rate at which students are progressing towards closing the gap. Students who start school years behind their peers will take years to catch up.
The CYAAA advises that the majority of the students who are at grade level based on CYAAA test data are in Prep, Grade 1 and Grade 2. This is to be expected, as these students have the narrowest educational gap to close. This progress is not reflected in NAPLAN results, as the youngest students to sit the test are in Grade 3. Thus, NAPLAN scores should start reflecting significant differences between CYAAA schools and other schools from 2013.
Detailed rate of progress analysis using several literacy and numeracy benchmark tests for students at all grade levels will be adopted in the evaluation of the CYAAA.429
427 In 2011, the NAPLAN writing assessment was changed to a persuasive writing assessment. It was a narrative writing assessment between 2008 and 2010. Therefore, the 2011 and 2012 writing assessments cannot be compared with writing assessments from earlier years. 428 This is not shown in Table 8.8 due to the small number of students involved. 429 This evaluation will focus on educational outcomes but will also include qualitative information and analysis.
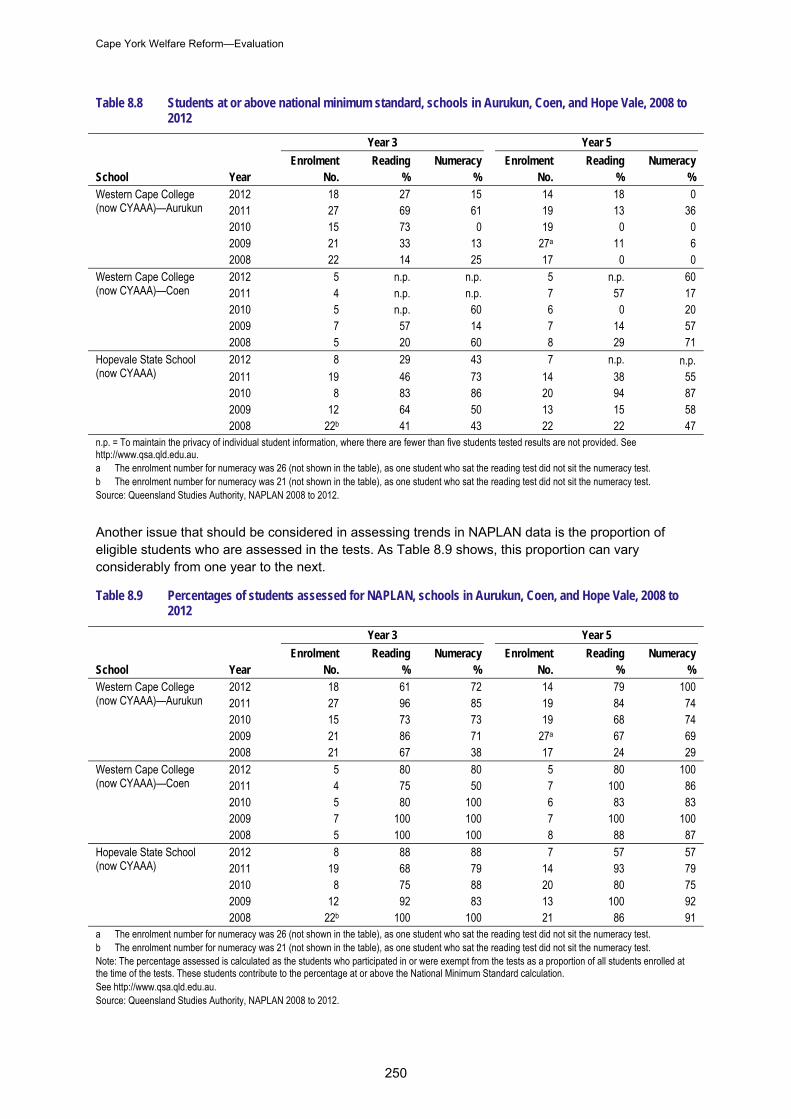
Cape York Welfare Reform—Evaluation
250
Table 8.8 Students at or above national minimum standard, schools in Aurukun, Coen, and Hope Vale, 2008 to 2012
School Year
Year 3 Year 5
Enrolment Reading Numeracy Enrolment Reading Numeracy No. % % No. % %
Western Cape College (now CYAAA)—Aurukun
2012 18 27 15 14 18 0 2011 27 69 61 19 13 36 2010 15 73 0 19 0 0 2009 21 33 13 27a 11 6 2008 22 14 25 17 0 0
Western Cape College (now CYAAA)—Coen
2012 5 n.p. n.p. 5 n.p. 60 2011 4 n.p. n.p. 7 57 17 2010 5 n.p. 60 6 0 20 2009 7 57 14 7 14 57 2008 5 20 60 8 29 71
Hopevale State School (now CYAAA)
2012 8 29 43 7 n.p. n.p. 2011 19 46 73 14 38 55 2010 8 83 86 20 94 87 2009 12 64 50 13 15 58 2008 22b 41 43 22 22 47
n.p. = To maintain the privacy of individual student information, where there are fewer than five students tested results are not provided. See http://www.qsa.qld.edu.au. a The enrolment number for numeracy was 26 (not shown in the table), as one student who sat the reading test did not sit the numeracy test. b The enrolment number for numeracy was 21 (not shown in the table), as one student who sat the reading test did not sit the numeracy test. Source: Queensland Studies Authority, NAPLAN 2008 to 2012.
Another issue that should be considered in assessing trends in NAPLAN data is the proportion of eligible students who are assessed in the tests. As Table 8.9 shows, this proportion can vary considerably from one year to the next.
Table 8.9 Percentages of students assessed for NAPLAN, schools in Aurukun, Coen, and Hope Vale, 2008 to 2012
School Year
Year 3 Year 5
Enrolment Reading Numeracy Enrolment Reading Numeracy No. % % No. % %
Western Cape College (now CYAAA)—Aurukun
2012 18 61 72 14 79 100 2011 27 96 85 19 84 74 2010 15 73 73 19 68 74 2009 21 86 71 27a 67 69 2008 21 67 38 17 24 29
Western Cape College (now CYAAA)—Coen
2012 5 80 80 5 80 100 2011 4 75 50 7 100 86 2010 5 80 100 6 83 83 2009 7 100 100 7 100 100 2008 5 100 100 8 88 87
Hopevale State School (now CYAAA)
2012 8 88 88 7 57 57 2011 19 68 79 14 93 79 2010 8 75 88 20 80 75 2009 12 92 83 13 100 92 2008 22b 100 100 21 86 91
a The enrolment number for numeracy was 26 (not shown in the table), as one student who sat the reading test did not sit the numeracy test. b The enrolment number for numeracy was 21 (not shown in the table), as one student who sat the reading test did not sit the numeracy test. Note: The percentage assessed is calculated as the students who participated in or were exempt from the tests as a proportion of all students enrolled at the time of the tests. These students contribute to the percentage at or above the National Minimum Standard calculation. See http://www.qsa.qld.edu.au. Source: Queensland Studies Authority, NAPLAN 2008 to 2012.

Outcomes
251
8.6 Child safety outcomes
8.6.1 Key findings—Child safety There is no clear trend in substantiated child abuse or neglect for either the CYWR communities or the comparison communities.
8.6.2 Substantiated child abuse or neglect
It is accepted that official data on substantiated child abuse and neglect do not provide an indication of the underlying incidence of issues, as results can be affected by reporting levels. In addition, results for small communities should be treated with caution because of the small population sizes involved.
Table 8.10 shows the rate per 1,000 of individual children who were the subject of a substantiated incidence of child abuse or neglect for the 17 Indigenous communities for which the Queensland Government regularly releases data.
The Queensland average substantiation rate for child abuse and neglect in 2010–11 was 5.5 per 1,000 children aged 0–17 years. All of the communities, apart from Mossman Gorge, had a considerably higher rate than this state average in 2010–11.
It is only possible to assess changes over time for two of the CYWR communities from 2009–10 to 2011–12: Aurukun and Hope Vale. Aurukun saw no statistically significant change in the substantiation rate from 2009–10 to 2011–12, while Hope Vale experienced a statistically significant increase. As Table 8.10 shows, there was no clear overall pattern from 2009–10 to 2011–12: there were four statistically significant increases and four statistically significant declines.
Table 8.10 Distinct children subject to substantiated notifications by community and year (rate per 1,000), 2009–10 to 2011–12
Community of child’s residence Rate
2009–10 Rate
2010–11 Rate
2011–12
Significant difference between 2009–10 and
2011–12 rates Aurukun 44.2 36.6 21.8 Cherbourg 22.7 60.6 54.9 Coen n.a. 106.8 72.7 n.a. Doomadgee 35.6 40.1 14.2 Hope Vale 20.8 88.1 61.5 Kowanyama 63.4 66.3 35.4 Lockhart River 153.8 84.3 59.2 Mapoon n.a. 73.2 n.a. n.a. Mornington Island 37.5 21.0 34.4 Mossman Gorge 0.0 0.0 0.0 n.a. Napranum 97.8 47.1 25.9 Northern Peninsula Area 20.2 29.7 7.7 Palm Island 30.0 24.6 33.2 Pormpuraaw 24.8 82.1 80.2 Woorabinda 25.6 38.7 55.6 Wujal Wujal 53.6 67.3 89.1 Yarrabah 7.1 19.5 9.8 n.a. = not available Statistical evidence of an increase Statistical evidence of a decrease No statistical evidence of detectable change Source: http://www.datsima.qld.gov.au/atsis/government/programs-and-initiatives/reports.
Cape York Welfare Reform—Evaluation
252
8.7 Crime outcomes
8.7.1 Key findings Overall, the crime figures show the following patterns:
In the CYWR communities there was a statistically significant upward trend in the overall offence rate (per 1,000) prior to CYWR. This was followed by a statistically significant decline during CYWR. In the comparison communities, there was also a statistically significant decline in the offence rate during the period of CYWR, but this did not reverse a statistically significant upward trend.
The total offence rate in the comparison communities was consistently lower than in the CYWR communities over the CYWR period, as was the assault rate (per 1,000). However, there were no statistically significant trends in the assault rate in the CYWR communities or comparison communities either before or during CYWR.
The hospitalisation rate for assault was statistically significantly lower in the CYWR period in the CYWR communities than it was before CYWR, but a similar trend is evident in other Indigenous communities in Queensland.
The rate of offences involving alcohol or other substances showed a statistically significant decline in both the CYWR communities and comparison communities during CYWR. However, in the case of the CYWR communities, this reversed a statistically significant upward trend before the commencement of CYWR.
There was a substantial decrease in the subcomponent of serious assaults leading to injury in Aurukun between the pre-CYWR and CYWR periods. A similar decrease did not occur in the other three CYWR communities. The timing of this one-off decrease (starting in early 2008) and its pattern (which shows the decrease was concentrated in serious assault cases leading to injury that also involved alcohol or other substance abuse) indicate that this Aurukun-specific change in the overall rate of serious assaults leading to injury is likely to be closely related to the reduction in trading conditions and subsequent closure of the Three Rivers Tavern in Aurukun from early 2008.
8.7.2 Introduction
This section looks at crime data and trends in the CYWR communities and comparison communities and firstly examines the published data on offences against the person and hospitalisations for assault. This is followed by an analysis of unpublished data about differences in trends in offenders and victims, crime involving alcohol, serious and non-serious assaults and total offences reported. In this section we report on criminal offences in the CYWR communities between the years 2004–05 and 2011–12. The data are compared with data for seven other Indigenous communities in Cape York: Mapoon, Napranum, Wujal Wujal, Kowanyama, Lockhart River, Pormpuraaw and Northern Peninsula.430 These data have been provided by Queensland Police.
Given changes in the population over time and differences in population across communities it is important to control for population size. For this reason the crime data are reported both for the total count and as a rate per 1,000 people. Data are also presented in two time formats. Most of the tables and charts present annual data in each of the financial years between 2004–05 and 2011–12. Quarterly data are used for regression analyses to estimate trends in the crime rate at various periods in the CYWR communities and comparison communities and to test for statistically significant differences.
430 For robustness, we have also on occasion done further analyses, including two additional comparison communities from outside Cape York: Mornington Island and Doomadgee.

Outcomes
253
It is important to test whether any observed changes are statistically significant. For this reason where possible the incident data provided by Queensland Police has been converted into quarterly data using the date of the reported offence. Regression analysis has been conducted with quarterly data to determine whether there were any statistically significant differences in either the levels or in the quarterly trends in reported offences431 before and after the start of CYWR. This regression analysis also controls for changes in the number of police in each community.
8.7.3 Offences, offenders and victims The level of offences and types of offences recorded by police provide a useful indicator of the level of crime in a community. Of course, some care is required as not all offences come to the attention of the police. This section looks at published data on offences against the person reported to the police and confirmed as such and unpublished data on various other types of offences and on offenders and victims432 for each of the four CYWR communities.
Offences against the person—annual data
Table 8.11 shows published data on offences against the person, as rates per 1,000 people, in the four CYWR communities and in other Indigenous communities in Queensland. The analysis compares pre-CYWR years (2004–05 to 2007–08) to the CYWR years (2008–09 to 2010–11).
All four CYWR communities saw a decrease in offences against the person433 from pre-CYWR years (2004–05 to 2007–08) to CYWR years (2008–11). Aurukun had a decrease from a mean of 141.2 per 1,000 in the pre-CYWR years to 96.8 in the CYWR years. However, this fall was not statistically significant. Hope Vale had a decrease from a mean of 52.5 in pre-CYWR years to 45.0 in CYWR years, which is not statistically significant. There are only three years of data for Mossman Gorge, and the small population makes for high year-on-year variability. In Coen, offences against the person changed from 112.6 per 1,000 to 112.3, which is a negligible change that is not statistically significant.
Collectively, the four CYWR communities434 saw a decrease in offences against the person from 108.4 per 1,000 to 81.7. This is also not a statistically significant decrease.
Across the comparison communities, there was also a small fall in the rate of offences against the person from a mean of 86.8 offences pre-CYWR to 72.9 during the CYWR years. This change was not statistically significant. Generally, at the commencement of CYWR, the CYWR communities began with a higher offence rate than many of the non-CYWR Queensland Indigenous communities. However, after three years of CYWR, the CYWR communities were similar to the other communities.
431 'Offence’ refers to any act or omission by a person or persons for which a penalty could be imposed by the Australian legal system. Offences have been classified by the 2011 edition of the Australian and New Zealand Standard Offence Classification (ANZSOC). Reported offences information is produced based on ‘reported date’ i.e. the date an incident was reported to or became known to police. The reported date may not necessarily be the date when the offence occurred. This is particularly the case for homicide and related offences and sexual assault offences where, in some instances, the time difference between when the offence(s) occurred and the report/detection date may be substantial. 432 ‘Victim’ refers to a person, premises, an organisation or a motor vehicle depending on the type of offence which allegedly involved in a criminal incident that is proceeded against and recorded by police for one or more offences. Offences have been classified by the 2011 edition of the ANZSOC. Reported offences information is produced based on ‘reported date’ i.e. the date an incident reported to or becomes known to police. 433 Offence against the person describes the number of personal offences reported to police, such as homicides, assaults and sexual assaults. 434 In these calculations each community was weighted by population size.

Cape York Welfare Reform—Evaluation
254
Table 8.11 Offences against the person (rates per 1,000), by community, 2004–05 to 2010–11
Cape York community Pre-CYWR years CYWR years
2004–05 2005–06 2006–07 2007–08 2008–09 2009–10 2010–11 Aurukun 184.0 180.9 119.6 141.9 85.3 90.2 114.3 Coen 86.2 77.2 107.4 159.3 125.9 125.9 85.1 Hope Vale 56.1 60.4 54.6 56.4 43.3 49.3 42.5 Mossman Gorge n.a. n.a. n.a. 129.0 161.3 90.3 n.a. Cherbourg 77.5 73.6 73.5 101.8 70.1 72.4 70.6 Doomadgee 112.3 93.6 93.2 95.4 62.1 52.4 50.6 Kowanyama 89.7 98.3 112.6 106.2 64.0 94.3 47.6 Lockhart River 99.5 152.3 128.5 122.5 92.1 135.7 62.4 Mapoon 20.9 16.3 19.5 15.4 22.8 18.8 22.4 Mornington Island 147.6 89.3 107.7 100.8 152.6 85.2 67.2 Napranum 53.8 69.5 55.1 39.3 47.4 40.9 34.7 Nthn Peninsular Area 41.3 55.7 54.3 50.0 57.0 47.8 27.2 Palm Island 67.3 153.5 88.1 100.3 104.4 121.6 115.7 Pormpuraaw 104.7 164.1 108.7 93.0 62.4 66.6 74.5 Woorabinda 146.8 121.8 140.5 101.4 137.8 91.2 88.0 Wujal Wujal 58.8 67.4 80.5 101.7 59.7 76.7 33.9 Yarrabah 69.9 79.2 80.5 69.3 62.6 61.6 74.6 n.a. = not reliably coded to this location Source: Adapted from Queensland Government, Annual highlights report for Queensland’s discrete Indigenous communities, July 2010 – June 2011, http://www.datsima.qld.gov.au/atsis/government/programs-and-initiatives/reports/annual-highlights-report-july-2010-june-2011.
Reported total offences
The analysis in this section deals with the total number of offences. This is followed by more detailed analysis of the offences in specific categories in the CYWR and comparison communities.435
It should be noted that offences are recorded in the calendar year in which they are reported, but that the offenders may not be identified in the same calendar year. Therefore, data on offences and offenders should not be directly compared.
Figure 8.15 shows the rate per 1,000 of reported offences in the CYWR communities and the comparison communities for the years 2004–05 to 2011–12.436 Overall, the rate in the comparison communities was lower than in the CYWR communities. There was a very similar trend in the crime figures over the eight years in the CYWR communities and the comparison communities.
435 Following discussions with the Office of Economic and Statistical Research in the Queensland Treasury, FaHCSIA obtained detailed data for the following comparison communities: Lockhart River, Mapoon, Napranum, Northern Peninsula Area (Bamaga, Injinoo, New Mapoon, Seisia and Umagico) and Pormpuraaw. All of these communities are located in Cape York. Mornington Island and Doomadgee, for which police data were also obtained, were identified as additional comparison communities outside the Cape. 436 The population data used in this analysis is based on ABS, Regional population growth, Australia, cat. no. 3218.0, 30 March 2012.

Outcomes
255
Figure 8.15 Reported offences, CYWR communities and comparison communities, 2004–05 to 2011–12
0
100
200
300
400
500
600
700
800
900
2004–05 2005–06 2006–07 2007–08 2008–09 2009–10 2010–11 2011–12
Pre-CYWR years CYWR years
Financial year
Off
ence
s p
er '0
00 p
eop
le
CYWR
Comparison
Source: Unpublished Queensland Police data.
Tables 8.12, 8.13 and 8.14 provide more details on different categories of police data in the CYWR communities and comparison communities.
Table 8.12 shows total offences, domestic violence related offences437 and public order offences.438 It demonstrates that, for the dimensions of crime shown in the table, the changes have been similar in the CYWR communities and the comparison communities. However, the raw data do not indicate whether any changes have been statistically significant.
437 The domestic violence classification is determined by the officer responding to the offence and entered as a yes/no/unknown or not stated code. The count of domestic violence offences here includes all coded as ‘yes’ only. 438 Count of offences reported to police and confirmed as such by the police under ASOC 13. These include trespass, disorderly conduct, liquor and tobacco offences, offences against public order sexual standards, cruelty to animals, criminal intent, offensive conduct, offensive behaviour and offensive language. The date of the offence used to allocate it to a year is the date the offence is reported. The count is based on the National Crime Recording Standard published by the Australian Bureau of Statistics.

Cape York Welfare Reform—Evaluation
256
Table 8.12 Reported offences, domestic violence offences and public order offences and rate per thousand in the CYWR communities and the comparison communities, 2004–05 to 2011–12
Pre-reform years CYWR reform years 04–05 05–06 06–07 07–08 08–09 09–10 10–11 11–12
Total reported offences
CYWR communities 1,141 1,424 1,149 1,770 1,635 1,930 1,456 1,573 Comparison communities 1,920 2,205 2,140 2,091 2,869 2,778 2,329 2,112 CYWR communities (per ‘000) 474 593 480 733 669 785 587 630 Comparison communities (per ‘000) 326 371 357 340 461 442 359 320
Domestic violence offences CYWR communities 178 205 155 142 118 175 153 136 Comparison communities 355 464 427 328 255 325 237 277 CYWR communities (per ‘000) 74 85 64 59 49 73 64 57 Comparison communities (per ‘000) 60 79 73 56 43 55 40 47
Proportion domestic violence reported offences
CYWR communities 15.6 14.4 13.5 8.0 7.2 9.1 10.5 8.6 Comparison communities 18.5 21.0 19.9 15.7 8.9 11.7 10.2 13.1
Public order reported offences
CYWR communities 326 519 379 717 623 814 488 580 Comparison communities 510 536 603 462 860 901 705 592 CYWR communities (per ‘000) 135 216 158 297 255 331 197 232 Comparison communities (per ‘000) 87 90 101 75 138 143 109 90
Source: Unpublished Queensland Police data.
Quarterly trends in reported total offences
To more rigorously assess any significant changes in the levels and trends in specific offence types, regression analyses using quarterly data were carried out. The initial analysis reported below is for total reported offences (per 1,000 population).
Figure 8.16 displays the reported total offence rate by quarter for the 32 quarters from July–September 2004 to April–June 2012 in the CYWR communities and selected comparison communities.
The quarterly data for the total offence rates are analysed separately for the four CYWR communities and the comparison439 communities in the pre-CYWR period (2004–05 to 2007–08) and the CYWR period (2008–09 to 2011–12). Four trend lines are estimated to cover the pre-CYWR and CYWR periods for the two community groups.
These trend lines are derived from an ordinary least squares regression of the total offence rate with a quarterly time period indicator. Community level data for each quarter are used for these trend regressions, and the slope of these trend lines gives the average quarterly change in the offence rate over the relevant time periods for all four CYWR communities and all seven Cape comparison communities.440
439 Comparison communities consist of the following seven Cape communities: Kowanyama, Napranum, Wujal Wujal, Lockhart River, Mapoon, Northern Peninsula Area and Pormpuraaw. For robustness, we have also on occasion done further analyses, including two additional comparison communities from outside Cape York: Mornington Island and Doomadgee. 440 The linear trend estimates are based on community level quarterly data rather than on a regression of the aggregate value of the offence rate for all of the CYWR trial and all of the comparison communities in order to increase the sample size for the regression analyses. It is often difficult to detect statistically significant trends with small sample sizes, such as the 16 observations that would result in each time period if the offence rate data were aggregated across all of the CYWR communities, and across all of the comparison communities. Our approach allows us to detect a statistically significant average trend across the CYWR trial and comparison communities, allowing for the community level data to have more random fluctuations than would be the case with aggregated data. Regressions with aggregated or averaged data can often overstate the underlying statistical relationships because aggregating or averaging usually reduces the random variability of the underlying community level data.

Outcomes
257
Figure 8.16 Trends in the offence rate per quarter in the CYWR communities and comparison communities
0
50
100
150
200
250
300
Jul-0
4
Oct
-04
Jan-
05
Apr
-05
Jul-0
5
Oct
-05
Jan-
06
Apr
-06
Jul-0
6
Oct
-06
Jan-
07
Apr
-07
Jul-0
7
Oct
-07
Jan-
08
Apr
-08
Jul-0
8
Oct
-08
Jan-
09
Apr
-09
Jul-0
9
Oct
-09
Jan-
10
Apr
-10
Jul-1
0
Oct
-10
Jan-
11
Apr
-11
Jul-1
1
Oct
-11
Jan-
12
Apr
-12
Quarters
Off
ence
rat
e p
er'0
00
CYWR
Comparison
Pre-CYWR trends CYWR trends
Note: Offence rate is per 1,000 population using 2006 ABS Census derived Estimated Resident Population data. Source: Unpublished Queensland Police data.
During the CYWR period, the offence rate showed a statistically significant decline in both the CYWR and comparison communities. This decline was somewhat greater in the CYWR communities (3.92 fewer offences per 1,000 persons per quarter) than in the comparison communities (3.21 fewer offences per 1,000 persons per quarter), but these two values are not significantly different from each other.
Prior to CYWR, there was a clear upward trend in the offence rate in the CYWR communities that was not seen in the comparison communities. In that period, the CYWR communities saw a statistically significant increase (3.72 more offences per 1,000 persons per quarter), while the small increase observed in the comparison communities was not statistically significant (0.12 more offences per 1,000 persons per quarter).
Table 8.13 also presents the results of more detailed statistical analysis that tests for the significance of the estimated coefficients on the quarterly trends in the offence rate and for the significance of differences when comparing across the CYWR and comparison communities and across the two time periods (pre-CYWR and CYWR).441
441 The linear trend estimates based on ordinary linear regression analyses assumes the underlying statistical variation in the data generating process has a normal distribution. We have opted to report the estimated trends based only on the linear regression model. Trends can also be estimated from models with more complex distributions, such as a Poisson process or a negative Binomial, to describe the underlying data generation process in reference to the various computed offence rates per quarter. These more complex models in turn impose their own restrictive assumptions about the data generating process (such as equal mean value and variance for the Poisson distribution) which would affect the reliability of the estimates. We are not attempting to estimate a fuller model that explains the determinants of the offence rate in these communities. The linear regression model is used as a data descriptive process to estimate an average quarterly trend. We then use the statistical properties of the linear regression model for the CYWR and comparison communities, assuming normally distributed errors, to test for statistical significance of the estimated coefficients. In several instances we have also estimated the trend coefficients based on a negative binomial regression model. Though the estimated coefficients differ from the linear regression model, in

Cape York Welfare Reform—Evaluation
258
These tests are based on two simple estimation models. Model 1 contains a simple linear time trend on a quarterly basis (i.e. using just the quarterly data underlying Figure 8.16).
In Model 2, the quarterly trend is estimated by adding one more explanatory variable controlling for the numbers of police personnel in each community (as a rate of police numbers per 1,000 persons).442 Given that changes in the available police resources can have a significant independent effect on recorded offence rates, the estimates of trends under Model 2 are expected to be more robust. While the quarterly rates of change in the offence rate calculated from Model 2 differ slightly from those in Model 1, the substantive conclusions (and significance test results) are almost always the same whether we control for police numbers or not.443
The extra inference from Model 2 is that the estimated coefficient on police numbers is significantly negative, indicating that, everything else being the same, as police numbers increase the offending rate decreases.444
During the pre-CYWR period, the CYWR communities experienced a statistically significant increase in the offence rate. The rate declined significantly in the CYWR period. In both periods the estimated quarterly rates of change in the offence rate were significantly different from zero, and also differed significantly from each other in both Model 1 and Model 2. This is a robust result showing that offence rates declined significantly in the CYWR communities after the introduction of CYWR.
In the comparison communities there was no significant trend during the pre-CYWR period, but statistically significant declines were observed in those communities during the CYWR period. On comparing the rate of decline for the CYWR and comparison communities during the CYWR period, the quarterly rate of decline was slightly higher in the CYWR communities. But the correct statistical inference is that there are no significant differences in the declines observed between the two groups of communities. Both groups of communities experienced similar rates of quarterly declines in the offence rate per 1,000 population during the period of CYWR. The only difference was that the decline in the CYWR communities reversed a statistically significant upward trend that occurred before the commencement of CYWR.
most cases the statistical inference about which trend estimates are significantly different from zero and also different from each other do not change. 442 The police data used are available only at the annual level, so the same police rate value is applied to each of the four quarters in that year. Also police data are not available separately for Napranum, Mapoon and the Northern Peninsula Area which share a common police post. So the same number of police personnel has been allocated to each of these three communities. 443 The one difference between the results in Model 1 and Model 2 in Table 8.13 is in relation to the statistical inference about significant differences in the quarterly trend in the all offence rate in the comparison communities. The estimates in Model 1 showed a significant decreasing trend in the comparison communities in the trial period (i.e. the trend coefficient of -3.21) and it also showed this trend rate was significantly different from the corresponding rate in the pre-trial period (of 0.12). In Model 2 these two estimated coefficients (-2.89 and 0.08) are no longer significantly different from each other. Note, however, that this difference in the inference from models 1 and 2 is not based on major changes in the estimated coefficients and standard errors. In Model 1 the hypothesis that the pre-trial and post-trial trends in the all offences rate were significantly different from each other was barely accepted (with a computed p value slightly below 0.05). In Model 2 with the addition of the police numbers, the estimated corresponding coefficients and standard errors have altered only slightly, but it leads to the p-value on the above test being over the critical 0.05 threshold that determines whether we reject or accept a specific hypotheses being tested with 95% confidence level. 444 It is difficult to interpret this as a causal relationship without more elaborate statistical analyses to account for the well known complexities of accurately estimating the effects of police numbers on crime. That was not our intention in estimating Model 2. It was estimated to show that the inference on whether the pattern of offending rates observed in the CYWR and comparison communities did not change when we also take into account the difference in the police number across these communities.

Outcomes
259
Table 8.13 Estimated trend coefficient and test of significance on rate of all offences using quarterly data from 2004–05 to 2010–11 in the CYWR and comparison communities
Estimated trend coefficients (change per quarter) Inference on tests of significance
Model 1 R2 = 0.22 Sample N = 351
CYWR communities
Comparison Cape communities
Hypothesis: trend in CYWR communities (≠0)
Hypothesis: trend in comparison communities (≠0)
Hypothesis: trend varies by locale
Pre-CYWR period
3.72 0.12 Yes p = 0.02*
No p = 0.92
No p = 0.07
CYWR period
-3.92 -3.21 Yes p = 0.01*
Yes p = 0.01*
No p = 0.72
Inference on hypothesis that trend varies by time period in each locale: Yes
p = 0.00* Yes p = 0.05*
Model 2 R2 = 0.27 Sample N = 351
CYWR communities
Comparison Cape communities
Trend in CYWR communities (≠0)
Trend in comparison communities (≠0)
Trend varies by locale
Pre-CYWR period
3.90 0.08 Yes p = 0.01*
No p = 0.93
No p = 0.05
CYWR period
-3.73 -2.89 Yes p = 0.01*
Yes p = 0.01*
No p = 0.66
Inference on hypothesis that trend varies by time period in each locale: Yes
p = 0.00* No p = 0.07
Note: Model 1 estimates trend using a time period indicator only (in quarters) for the comparison and CYWR communities. Model 2 adds in a second variable controlling for police numbers per 1,000 people in the communities. P-values are reported and significance is tested at the 5 per cent level, meaning that p-values less than 0.05 are significant results, and these are indicated with an asterisk (*).
To test the robustness of the analysis in Table 8.13, it was repeated with the addition of Mornington Island and Doomadgee as additional comparison communities. The inclusion of these two communities, however, did not change the general results—similar declines in offence rates were observed during the CYWR period across both the CYWR and the broader group of comparison communities. The rates of declines were not statistically different across the CYWR and the comparison communities.
Since the offence rate declined in the comparison communities as well during the CYWR period, this suggests that factors other than CYWR may have contributed to the decline in the offence rate within the CYWR communities. Unfortunately, it is not possible to break down the total change in the offence rate observed in the CYWR communities into the contribution made by the activities of CYWR and the contribution made by other general factors that may have also affected both the comparison communities and the CYWR communities during this period.
In conclusion, while there was no statistically significant difference in the rate at which offences declined in the CYWR period between the comparison communities and the CYWR communities, the decrease in the CYWR communities reversed a statistically significant upward trend that was not evident in the comparison communities.
Regression analysis was also conducted on other offence categories shown in Table 8.12. For public order offences, there were no statistically significant trends in either the CYWR or comparison communities before or during the CYWR period. None of the quarterly trend coefficients were

Cape York Welfare Reform—Evaluation
260
significantly different from zero.445 The absence of significant trends also applied for the rate of domestic violence offences (per 1,000 people).
Offenders and unique offenders
Table 8.14 shows the number of offenders446, unique offenders and public order unique offenders in both the CYWR and the comparison communities. The key difference between the number of offenders447 and the number of unique offenders is that a single offender may be charged with multiple offences during an incident(s) in a year, and therefore counted more than once in reported offender data for that year (depending on the number and types of offences committed during an offending incident and the number of victims involved). However, the offender will only be counted once in unique offender data irrespective of the number of offences and incidents they are charged with during the year.
The data on the number of unique offenders is available only at an annual level. This limits the number of observations available to test for differences in the average trend in the rate of unique offenders between the CYWR and comparison communities in the pre-trial and trial period.
Fitting a simple linear trend on the annual data for the combined sample of the four CYWR communities shows that there are no statistically significant trends in the rate of unique offender rates448 in the pre-trial period or in the four years of the trial period. There was a tendency for the rate of unique offenders to increase in the pre-trial period, but this is not statistically significant at conventional test levels (p values of 0.05 or less).
A similar conclusion holds for the seven comparison communities.
445 The analyses of the public order offences data was the only instance where there was a substantive difference between the results of our preferred linear regression model and the results from an alternative model, based on the negative binomial distribution. In contrast to the results reported above from the linear regression model, the results from the negative binominal model show a significant decline in the public order offence rate in the comparison communities during the trial period, while there was not a corresponding significant decline in the four CYWR communities in this period. In relation to other offence categories, while the estimated trend coefficients differed between the linear regression and the negative binomial models, they did not lead to major differences in the statistical inference about what trends were significant and how they differed across the CYWR and comparison communities. 446 'Offender’ refers to a person allegedly involved in a criminal incident that is proceeded against and recorded by police for one or more offences. Offences have been classified by the 2011 edition of the Australian and New Zealand Standard Offence Classification (ANZSOC). Offender information is produced based on ‘action date’ i.e. the date that police have taken legal action against an individual i.e. arrested, summoned, notice to appear, cautioned etc. The action date may not necessarily be the date when the offence occurred or reported to police. This is particularly the case for homicide and related offences, sexual assault offences and breaks and enters, where in some instances the time difference between when the offence(s) occurred or the report/detection date and the offender proceeded against may be substantial. 447 Offender statistics are based on offence counts. The data refer to the number of offences cleared or solved through an action against an offender. Offender count data do not equate to unique offender counts; nor do they equate to the number of offences cleared. For example, an offender charged with motor vehicle theft, unlawful entry, assault and other theft would be included four times in any offender breakdown by age and sex. The financial year is that in which the offender was actioned for a reported offence reported by a victim or detected by police. Offender and recorded offences are derived from the Queensland Police Records and Information Management Exchange (QPRIME, 2007) database. 448 It is customary to represent the rate of unique offenders as the number of unique offenders divided by the size of the population of persons aged 10 and above. We do not have accurate annual data on the number of persons aged 10 and above in each of the CYWR and comparison communities. Hence in Table 8.14 and in the linear regression analyses we have represented the rate of unique offenders per 1,000 total population. A simple adjustment of applying a constant fraction of the total population to derive the population aged above 10 years would change the level of the rates reported in Table 8.14 by that fraction, but it would not affect the trends in the rate of unique offenders over time, nor the results of our regression analyses.

Outcomes
261
Table 8.14 Number of offenders and rate per 1,000 in the CYWR communities and the comparison communities
Pre-reform years CYWR reform years 04–05 05–06 06–07 07–08 08–09 09–10 10–11 11–12
Offenders
CYWR communities 1,347 1,871 1,624 1,954 1,527 1,936 1,510 1,559 Comparison communities 1,837 2,263 2,195 1,972 2,630 2,725 2,157 1,850 CYWR communities (per ‘000) 560 780 678 809 625 787 609 624 Comparison communities (per ‘000) 312 381 366 321 422 434 333 280
Unique offenders
CYWR communities 488 624 602 688 717 858 623 686 Comparison communities 954 1041 1026 945 1255 1329 1123 963 CYWR communities (per ‘000) 203 260 251 285 293 349 251 275 Comparison communities (per ‘000) 162 175 171 154 201 212 173 146
Public order unique offenders
CYWR communities 281 396 309 428 448 551 364 416 Comparison communities 460 445 499 370 624 649 532 428 CYWR communities (per ‘000) 117 165 129 177 183 224 147 167 Comparison communities (per ‘000) 78 75 83 60 100 103 82 65
Source: Unpublished Queensland Police data.
Offences against the person
Table 8.15 shows data on offences against the person and the number of victims of such offences in the CYWR and the comparison communities. This is a different dataset on offences against the person than is provided in Table 8.11, which is based on published reports. Table 8.15 offences against the person were compiled from unpublished Queensland Police data for all reported offences, and certain categories of those offences have been classified as offences against the person.449
Also, a key difference between the data on victims and unique victims is that a person could be a victim of several offences. If a person was the subject of three offences, this would be counted as three victims; however, in this situation there would be only one unique victim.
Table 8.15, which reports the annual rates, suggests that the rates of offences against the person has fallen in the CYWR years for both the CYWR and comparison communities.
More detailed regression analyses using the quarterly data on the rate of offences against the person reveal that the mean rate for offences against the person in the CYWR period was significantly lower for the comparison communities but not for CYWR communities.
These quarterly regressions also show that there were no statistically significant trends in quarterly changes in the rate of offences against the person in either the CYWR or comparison communities before or during the CYWR period. None of the quarterly trend coefficients was significantly different from zero.
449 Count of offences reported to police and confirmed as such by the police under ASOC 13. These include trespass, disorderly conduct, liquor and tobacco offences, offences against public order sexual standards, cruelty to animals, criminal intent, offensive conduct, offensive behaviour and offensive language. The date of the offence used to allocate it to a financial year is the date the offence is reported. The count is based on the National Crime Recording Standard (NCRS) published by the Australian Bureau of Statistics.

Cape York Welfare Reform—Evaluation
262
Table 8.15 Number of and rate per 1,000 of offences against the person and victims of offences against the person in the CYWR communities and the comparison communities
Pre-reform years CYWR reform years
04–05 05–06 06–07 07–08 08–09 09–10 10–11 11–12 Offences against the person
CYWR communities 298 284 227 276 207 211 217 224 Comparison communities 410 537 491 467 386 423 274 324 CYWR communities (per ‘000) 124 118 94 115 86 88 90 93 Comparison communities (per ‘000) 70 91 83 79 66 72 47 55
Victims
CYWR communities 255 245 189 256 184 198 207 205 Comparison communities 342 460 435 428 360 398 260 306 CYWR communities (per ‘000) 106 102 79 106 75 80 83 82 Comparison communities (per ‘000) 58 77 73 70 58 63 40 46
Unique victims
CYWR communities 183 184 154 206 141 170 170 182 Comparison communities 276 359 342 339 291 337 229 255 CYWR communities (per ‘000) 76 77 64 85 58 69 69 73 Comparison communities (per ‘000) 47 60 57 55 47 54 35 39
Source: Unpublished Queensland Police data.
The police data on victims and unique victims are available only at an annual level for each of the CYWR and comparison communities. A simple linear trend was also fitted to the annual data on unique victims (expressed as a rate per ‘000 population) in a similar manner to the analyses of the unique offenders data. No significant trends were observed for the average rate of unique victims in the CYWR communities or in the seven comparison communities in the Cape, either during the pre-CYWR or CYWR periods.450
8.7.4 Alcohol and other substances
Offences involving alcohol and other substances
Alcohol and illicit substances can be a key driver of crime in the CYWR communities (and in communities more generally). Thus it is important to consider changes in reported offences that involve alcohol and other drugs.
In June 2007, the Queensland Police migrated their data from the CRISP data system to the QPRIME data system, and increased the number of categories that could be used to record abuse of various substances (including alcohol). Prior to this data collection change, a large number of these substance abuses were recorded at the subcategory level of alcohol-related offences. Since this change in the data collection occurred over the period being reviewed, to capture all comparable offences we have had to use the broader category of substance-related offences. Data for alcohol-related offences alone are not available on a consistent basis across the period analysed.
Figure 8.17 presents the number of offences per 1,000 involving alcohol and other substances451 in the CYWR and the comparison communities. The data show that over the eight years under study,
450 The annual data summarised in Table 8.15 shows a decreasing trend in the rate of unique victims in the comparison communities in the CYWR period that is not seen in the CYWR communities. However, the linear regression estimates (with 56 annual observations over the seven comparison communities) shows that this decreasing trend is not statistically significant. Overall, there are no statistically significant trends in the annual rate of unique victims at any period in the comparison communities or in the CYWR communities. 451 Offender substance involvement is the police officer’s perception that one or more offenders involved in an incident is affected by alcohol, drugs, a volatile substance or a combination of those substances. Volatile substance involvement was introduced in June 2007, with the introduction of QPRIME. Offender substance involvement = alcohol, drug, volatile substance, many substances, no alcohol/drug/volatile substance, unknown or not stated. The unknown or not stated numbers have not been included in any calculations.

Outcomes
263
the rate of alcohol and substance abuse offences was always slightly higher in the CYWR communities.
Figure 8.17 Offences involving alcohol and other substances (rate per 1,000) in the CYWR and comparison communities, 2004–05 to 2011–12
0
100
200
300
400
500
600
2004–05 2005–06 2006–07 2007–08 2008–09 2009–10 2010–11 2011–12
Pre-CYWR years CYWR years
Financial year
Off
ence
s p
er '0
00 p
eop
le
CYWR
Comparison
Source: Unpublished Queensland Police data.
Regression analyses using the quarterly data on the rate of alcohol and other substance abuse offences confirm that the CYWR communities had a statistically significant increasing trend in offences involving alcohol or other substances in the pre-CYWR period. This was not observed in the comparison communities or in the expanded set of communities that included Mornington Island and Doomadgee. In the CYWR period, the rate of substance abuse offences fell significantly in both the CYWR and comparison communities, with a slightly higher quarterly decline in the CYWR communities. However, these two declining rates were not statistically different from each other.
This pattern of significant changes in the trends of alcohol- and substance-related offences closely mirrors the pattern reported above for the rate of all offences reported, which also showed a significant increasing trend in the pre-CYWR period in the CYWR communities, and a significant declining trend in the CYWR period in both the CYWR and comparison communities.
The individual comparison and CYWR communities have differing alcohol management plans (AMPs). Of the four CYWR communities, only Aurukun and Hope Vale have alcohol restrictions in place and are covered by 168B and 168C of the Liquor Act 1992 (Aurukun has a zero carriage limit and Hope Vale has a carriage limit, while Coen and Mossman Gorge do not have AMPs). Figure 8.18 compares the number of offences per 1,000 involving alcohol or other substances in Aurukun and the comparison communities that also have zero alcohol carriage (Kowanyama, Lockhart River, Napranum, Pormpuraaw and Wujal Wujal). Compared to Aurukun, the comparison communities had a higher offence rate involving alcohol and other substances.

Cape York Welfare Reform—Evaluation
264
Figure 8.18 Offences involving alcohol and other substances (rate per 1,000) in communities with zero carriage limits in Cape York, 2004–05 to 2011–12
0
100
200
300
400
500
2004–05 2005–06 2006–07 2007–08 2008–09 2009–10 2010–11 2011–12
Pre-CYWR years CYWR years
Financial year
Off
ence
s p
er '0
00 p
eop
le
CYWR zero carriage—Aurukun
Comparison zero carriage
Source: Unpublished Queensland Police data.
The quarterly regression analyses on the rate of alcohol and substance abuse was repeated separately only for those communities that had a zero carriage limit during the entire 2004–05 to 2011–12 period. These regressions compare the trends in this offence category between Aurukun and the five other comparison communities in the Cape noted above.
This regression analysis showed an interesting difference. In Aurukun there was a statistically significant upward trend in the rate of alcohol and substance abuse in the pre-CYWR period, but that rate of change fell to zero in the CYWR period. However, in the other five communities with zero carriage limits, there was no increasing trend in the pre-CYWR period but a significant decreasing trend in the CYWR period.
8.7.5 Assaults A significant type of offence against the person is assault because it is an indicator of interpersonal violence, results in significant harm and often triggers the need for health care. Therefore, this section examines differences in trends in serious and non-serious assault and then goes on to examine the published data on hospitalisations for assault.
Overall assault rates
A particular concern for the welfare reform agenda is the number of assaults, and how the rate of assaults has changed over the CYWR years. This is important because assaults are perhaps the best proxy for people failing to show respect for each other and for social norms.
Figure 8.19 shows the rate of assaults per 1,000 population in the CYWR communities and comparison communities for the years preceding CYWR and during the CYWR years. Consistent with the overall rate for all reported offences, rates of assault were higher in the CYWR communities throughout the period under study.

Outcomes
265
Figure 8.19 Rate of assault (per 1,000), CYWR communities and comparison communities, 2004–05 to 2011–12
0
10
20
30
40
50
60
70
80
90
100
2004–05 2005–06 2006–07 2007–08 2008–09 2009–10 2010–11 2011–12
Pre-CYWR years CYWR years
Financial year
Ass
ault
s p
er '0
00 p
eop
le
CYWR
Comparison
Note: Includes serious assault and common assault (sexual assault and stalking are not included). Source: Unpublished Queensland Police data.
Regression analyses of quarterly data on the rate of assaults (per 1,000) in the CYWR and comparison communities showed that there were no statistically significant trends in the assault rate in either set of communities before or during the CYWR period. None of the quarterly trend coefficients estimated were significantly different from zero, implying that no statistically significant differences occurred either across the two sets of communities or across the two time periods.
Serious versus non-serious assaults
One hypothesis about the effect of CYWR is that the welfare reforms have reduced the seriousness of crime, as opposed to the overall rate. If this were the case, the incidence of serious crime could be expected to drop in relation to the incidence of non-serious crime in CYWR communities as opposed to comparison communities. In order to test this, we looked at the rate of serious assault (serious assault resulting in injury and serious assault not resulting in injury) compared to the rate of common assault. Table 8.16 shows that the rate of serious assaults has been lower in the CYWR period in the CYWR communities, but that this is true for the comparison communities as well.
Table 8.16 Serious assault and common assault per 1,000, CYWR communities and comparison communities, 2004–05 to 2011–12
Pre-CYWR years CYWR years 04–05 05–06 06–07 07–08 08–09 09–10 10–11 11–12
CYWR communities: serious assault 56 51 39 52 37 43 42 39 Serious assault resulting in injury 49 43 38 47 32 35 35 34
CYWR communities: common assault 39 38 26 34 25 26 33 32 Comparison communities: serious assault 35 45 40 33 27 29 20 25
Serious assault resulting in injury 32 40 36 30 24 27 18 23 Comparison communities: common assault 16 25 19 22 18 23 12 15 Source: Unpublished Queensland Police data.

Cape York Welfare Reform—Evaluation
266
Regression analyses of quarterly data (conducted separately for all serious assault cases and only for serious assault cases resulting in injury) in the CYWR and comparison communities showed that in both cases there was no significant trend in the assault offence rate in any set of communities either before or during the CYWR period. None of the quarterly trend coefficients estimated were significantly different from zero, implying that no statistically significant differences occurred either across the two sets of communities or across the two time periods.
Hospitalisation rates for assault
In addition to police offence data, it is also worth looking at data on hospitalisations for assault. With such small populations, the hospitalisation rate varies from year to year (Table 8.17). Three of the four CYWR communities saw a decrease in hospitalisations for assault from pre-CYWR years to CYWR years; however, none of these decreases in individual communities was statistically significant.
Table 8.17 Hospitalisation rates for assault per 1,000, by community, 2004–05 to 2010–11
Cape York community
Pre-CYWR years CYWR years 2004–05 2005–06 2006–07 2007–08 2008–09 2009–10 2010–11
Aurukun 12.3 38.8 22.1 22.5 15.9 14.9 10.7 Coen 20.7 7.0 18.5 14.8 11.1 3.7 7.4 Hope Vale 43.3 33.1 27.3 32.4 20.4 34.9 37.8 Mossman Gorge 190.1 124.1 77.4 141.9 161.3 90.3 64.6 Cherbourg 40.0 38.5 45.7 40.4 42.9 39.5 47.6 Doomadgee 13.0 11.2 27.4 14.6 17.7 8.9 23.4 Kowanyama 9.4 9.3 8.2 5.3 7.9 6.9 5.0 Lockhart River 6.6 21.5 23.4 14.9 18.1 9.7 7.8 Mapoon 41.8 12.2 15.6 3.8 11.4 7.5 15.0 Mornington Island 24.9 28.3 42.2 40.7 27.6 39.0 38.1 Napranum 23.4 34.2 29.7 24.0 25.9 18.3 26.3 Nthn Peninsular Area 11.3 13.6 9.8 4.1 4.9 6.1 5.1 Palm Island 22.1 43.3 24.7 32.8 27.8 29.3 38.8 Pormpuraaw 28.1 15.5 15.5 13.5 17.8 5.9 7.1 Woorabinda 37.0 48.7 59.9 46.5 42.5 26.9 26.0 Wujal Wujal 81.2 33.7 20.1 29.1 0.0 5.7 5.6 Yarrabah 26.7 21.7 20.7 20.0 16.3 17.9 15.4 Source: Adapted from Queensland Government, Annual highlights report for Queensland’s discrete Indigenous communities, July 2010 – June 2011, http://www.datsima.qld.gov.au/atsis/government/programs-and-initiatives/reports/annual-highlights-report-july-2010-june-2011.
Aurukun decreased from a mean of 22.9 per 1,000452 in pre-CYWR years to 15.4 in CYWR years; Coen decreased from a mean of 18.7 to 7.4 in CYWR years; and Hope Vale decreased from a mean of 36.0 pre-CYWR to 27.6 in CYWR years. Mossman Gorge saw a small increase in hospitalisation rates for assault during CYWR years, going from a mean of 123.8 pre-CYWR, to 125.8 during CYWR years, although again the increase was not statistically significant.
When collectively the results are combined for all four CYWR communities, the hospitalisation rate for assaults decreased from 32.3 to 24.7 per 1,000 during CYWR years. This is a statistically significant decline calculated using a 95 per cent confidence interval.
When all 12 of the comparison communities are combined, there was a decrease in the hospitalisation rates for assault from 25.0 to 20.2 per 1,000, which is also a statistically significant decline.
Of the four CYWR communities, hospitalisation for assault rates were notably higher for Mossman Gorge than for any other community in the dataset. It should be noted that Mossman Gorge is the 452 The mean hospitalisation rates were calculated using the methods contained within the Association of Public Health Observatories Technical Briefing 3: Commonly used public health statistics and their confidence intervals. They are not simple means of the annual values.

Outcomes
267
smallest CYWR community (with 155 people resident) but very close to the town of Mossman and one that gets visitors from elsewhere.
The hospitalisation rates for assault were higher in the four reform communities than the comparison communities; however, the difference was not statistically significant.
8.7.6 Offence rates at individual CYWR community level
The data for the offence rates for various categories aggregated over all the CYWR communities and presented in the previous sections mask a great deal of diversity in the CYWR communities (and among the comparison communities). In this section we present a few categories of offence data at the level of individual CYWR communities.
Table 8.18 provides information on all reported offences in the four CYWR communities between 2004–05 and 2011–12. It shows that the rate of total reported offences rose over that period in all communities except for Aurukun (although it also had an increase in the pre-CYWR period, the subsequent decline in the CYWR period was large enough to lead to an overall decline between 2004–05 and 2011–12).
Table 8.18 Rate of reported total offences per 1,000, by individual CYWR community, 2004–05 to 2011–12
Pre-CYWR years CYWR years 04–05 05–06 06–07 07–08 08–09 09–10 10–11 11–12
Aurukun 720 881 664 1,063 625 910 706 616 Coen 393 495 370 796 985 1,018 527 503 Hope Vale 232 302 329 309 630 537 446 670 Mossman Gorge 445 676 721 527 755 Source: Unpublished Queensland Police data.
At the level of the quarterly data on total offences by community, we tested whether the trends estimated only for Aurukun in the pre-CYWR and CYWR periods differed from the corresponding trends in the other three communities. No statistically significant differences were found. Despite Aurukun being a substantially larger community, the specific trends in the total offence rate observed there were similar to the trends in the other three CYWR communities.
Table 8.19 provides data by individual community for serious assaults resulting in injury. This table shows a very different pattern for Aurukun, which experienced large declines in the number and rate of serious assaults causing injury—a decline that was not matched by the other three communities.
In the pre-CYWR period in Aurukun, the average annual rate of serious assaults causing injury was 61.5 per 1,000 persons. In the CYWR period, this rate fell to an annual average of 33.0 per 1,000.
When this information is converted to quarterly data, the statistical analyses also show a significant decline in the mean value of the assault rate between the pre-CYWR and CYWR periods for Aurukun. This significant decline in the mean value of the rate for serious assault causing injury is not found in the statistical analyses for the other three CYWR communities.
Also in Aurukun, although there was a significant negative trend in this assault rate even in the pre-CYWR period between 2004–05 and 2007–08, there was an additional sharp fall in 2008–09, the first year of the CYWR period. The rate of serious assault causing bodily injury was reduced by more than half, falling from 56 per 1,000 in 2007–08 to 26 per 1,000 in 2008–09, and this dramatic decrease was more or less maintained in the subsequent years.

Cape York Welfare Reform—Evaluation
268
Data from the Queensland Police cannot uncover the factors behind this sharp fall in 2008–09, but it was probably related to the reduction in trading conditions and subsequent closure of the Three Rivers Tavern in Aurukun from early 2008.453
Table 8.19 Serious assaults resulting in injury per 1,000, by individual CYWR community, 2004–05 to 2011–12
Pre-CYWR years CYWR years 04–05 05–06 06–07 07–08 08–09 09–10 10–11 11–12
Count of offences Aurukun 82 73 61 65 31 38 58 33 Coen 12 8 7 10 14 20 10 18 Hope Vale 23 19 20 25 14 20 15 24 Mossman Gorge 14 20 8 5 11
Rates per ‘000 population Aurukun 72 64 54 56 26 31 48 27 Coen 41 28 26 37 52 74 36 62 Hope Vale 27 22 24 30 17 24 18 28 Mossman Gorge 90 138 54 34 75 Source: Unpublished Queensland Police data.
The mechanisms through which the reduction in trading conditions and subsequent closure of the Three Rivers Tavern are likely to have contributed to the fall in the rate of serious assaults causing injury in Aurukun become clearer when this assault rate is broken down into two components: serious assaults causing injury that involved alcohol or substance abuse by the offender, and serious assaults causing injury that did not involve alcohol or substance abuse.454
Figure 8.20 plots the quarterly data on the rate per 1,000 for these two types of serious assaults causing injury in Aurukun, over the eight-year period from 2004–05 to 2011–12.
The reduction in trading conditions for the Three Rivers Tavern from March 2008 corresponded approximately to the end of the pre-CYWR period in these quarterly data. Therefore, comparisons between the levels of these offences in the pre-CYWR period and at the start of the CYWR period in the second half of 2008 (the quarter beginning in July 2008) can help identify the effects of the reduced trading and closure of the tavern on serious assaults causing injury.
The Queensland Department of Justice and Attorney-General reports that new conditions were placed on the licence of the Three Rivers Tavern in 2008 following investigation of alcohol related harm and violence in Aurukun. This resulted in the closure of the tavern until the Council could comply with the conditions. The then Treasurer, Andrew Fraser, publicly announced the closure of the Aurukun tavern on 26 March 2008. The licence conditions from March 2008 reduced trading hours from 15 hours per week down to 9 hours per week, allowed only light strength beer and reduced the number of drinks that patrons could purchase at a time. 455 The tavern has not operated since
453 See http://statements.qld.gov.au/Statement/Id/57242. 454 In the Queensland Police records, it is not feasible to consistently single out only serious assault offences leading to injury that involved alcohol. That would have been a more appropriate category of offence to analyse the effect of the closure of the tavern in Aurukun, but the coding structure used for this database means that a particular offence involving alcohol abuse is also part of a broader category that includes other drugs and substance abuse. 455 From the 26 March 2008 the new licence conditions included: an approved nominee must be on site for the tavern to trade; only light strength beer (less than 3 per cent alcohol/volume) could be sold or supplied; no premixed spirits with a meal in the lounge bar; patrons could only be sold one drink at a time, and only be in possession of one drink at any time within tavern; no alcohol to be taken off site; and hours of trade were Mon–Wed 4.30 pm to 7.30 pm (9 hours per week). Before 26 March 2008 licence conditions included: medium and light strength beer of less than 4 per cent alcohol/volume, and premixed spirits of up to 5.5 per cent alcohol/volume with a meal in the lounge bar; patrons could only be sold two drinks at a time, and only be in possession of two drinks at any time within tavern; no alcohol to be taken off and hours of trade were Mon–Fri 3 pm to 6 pm (15 hours per week).

Outcomes
269
27 November 2008456. In examining outcomes both the period of restricted trading which reduced the amount of alcohol that could be sold and the subsequent cessation of trading are important.
Figure 8.20 shows that the rate of serious assault causing injury that involved alcohol or substance abuse were declining in Aurukun even during the pre-CYWR period. However, there was an additional one-off sharp fall in this rate after the December quarter of 2007 (quarter 14 in the pre-CYWR period). From its peak (at 14.7 offences per 1,000 in quarter 14), the rate fell continuously in the next three quarters to reach a localised low rate of 2.5 offences per 1,000 in the quarter beginning in July 2008 (quarter 17 in the count from July 2004, which also corresponds to the start of the CYWR period).
From a regression analysis allowing for different constants at the end of the pre-CYWR period (quarter 16) and at the beginning of the CYWR period (quarter 17), this drop in the beginning of the CYWR period was statistically significant for the rate of serious assault causing injury that involved alcohol or substance abuse, but not so for the other category of serious assault causing injury that did not involve alcohol or substance abuse.
Figure 8.20 Rate of serious assaults causing injury in Aurukun (per 1,000 population), July 2004 to April 2012
0
2
4
6
8
10
12
14
16
18
20
Jul-0
4
Oct
-04
Jan-
05
Apr
-05
Jul-0
5
Oct
-05
Jan-
06
Apr
-06
Jul-0
6
Oct
-06
Jan-
07
Apr
-07
Jul-0
7
Oct
-07
Jan-
08
Apr
-08
Jul-0
8
Oct
-08
Jan-
09
Apr
-09
Jul-0
9
Oct
-09
Jan-
10
Apr
-10
Jul-1
0
Oct
-10
Jan-
11
Apr
-11
Jul-1
1
Oct
-11
Jan-
12
Apr
-12
Quarters
Rat
e p
er '0
00 p
eop
le
Substance involved
No substance involvedTavern closure
Source: Unpublished Queensland Police data.
For robustness, we also undertook regression analyses to check whether the pattern observed for these two types of serious assaults causing injury varied between Aurukun (where tavern conditions were restricted prior to closure) and the other three CYWR communities (which experienced the common interventions of CYWR). The regression results again clearly indicate that the significant drop-off in serious assaults causing injury that involved alcohol or substance abuse at the start of the
456The tavern was closed voluntarily by the council for one week during October 2008, as a result of large scale street fighting, in order to mitigate the possibility of further violence being fuelled by a regulated alcohol source. As a result of Queensland Government policy to divest all council-operated canteen licences across Queensland, the council-held licence for the tavern lapsed on 27 November 2008. An application for a new licence was lodged in 2009. However, community objections were received and the application was withdrawn. No licensed premises for the general public have operated in the community since 27 November 2008.

Cape York Welfare Reform—Evaluation
270
CYWR period was unique to Aurukun.457 In the other three communities, there were no statistically significant differences in either the levels or the quarterly trend rates observed in this offence category involving alcohol or substance abuse before or during CYWR.
For the other category of serious assaults causing injury that did not involve alcohol or substance abuse, the regression analysis to determine whether Aurukun also differed from the other three CWYR communities in this offence category showed no significant differences between Aurukun and the other three communities. There was neither a significant one-off decrease in Aurukun at the start of the CWYR period, nor significant differences in the quarterly trend in this offence category between Aurukun and the other three communities.
This starkly divergent pattern observed in the rate of serious assaults causing injury that involved or did not involve alcohol or substance abuse in the CYWR period in Aurukun is a clear pointer to the selective effects of the reduced trading conditions and subsequent closure of the tavern. The reduced of trading is very likely to have contributed to the one-off decrease in the rate of offences involving alcohol or substance abuse observed at the beginning of the CYWR period, and which was maintained throughout the CYWR period, without any significant increasing or decreasing trend. On the other hand, the reduced trading conditions and subsequent closure of the tavern are not seen to have resulted in a reduction in the rate of serious assaults causing injury that did not involve alcohol or substance abuse. However, when put together, the total rate of serious offences leading to injury still had a one-off significant decline at the beginning of the CYWR period in Aurukun—a decline that can be related to the restriction and cessation of trading of the Three Rivers Tavern.
8.8 Employment outcomes
8.8.1 Key findings Across the four CYWR communities, a number of local Indigenous people are now employed
under normal wages and conditions through the CDEP job conversion process.
A number of local service delivery jobs have been created in each of the CYWR communities as a result of CYWR.
Census data show rises in non-CDEP employment from 2006 to 2011 in the CYWR communities. However, increases were also evident in other Indigenous communities in Queensland. The increases in non-CDEP employment in Coen and Hope Vale from 2006 to 2011 were among the highest for all Indigenous communities in Queensland.
Despite increases in non-CDEP employment from 2006 to 2011, employment levels in both the CYWR and other Indigenous communities in Queensland remain low.
Job placements through Job Services Australia (JSA) have increased steadily across all four communities over the course of CYWR.
8.8.2 Introduction
In this section, we report against outcomes in employment and economic development. The section starts with a description of Census employment data and is followed with an outline of the additional jobs created from increased service delivery as a result of CYWR and the number of former CDEP positions converted into real jobs as a result of the CDEP conversion process. This is followed by information on the number of job placements through JSA. The section concludes with a detailed description of income support, CDEP and ABSTUDY.
457 This statistical significance of the difference in the constant term in the CYWR period for Aurukun versus the other three CYWR communities is significant at the 10 per cent level only.

Outcomes
271
8.8.3 Trends in employment Between 1 November 2008 and 30 June 2009, preliminary CDEP reforms were implemented in Hope Vale, Coen, Mossman Gorge and Aurukun, as a partial response to proposals in the design reports. These changes resulted in the closure of CDEP to new entrants or readmissions from 1 November 2008 until 1 July 2009. Furthermore, from 1 November 2008, all CDEP participants in the CYWR communities were required to sign a form acknowledging that they would cooperate with the FRC as an eligibility condition for continuing as a CDEP participant.
Following from these reforms, national reforms to CDEP took place from 1 July 2009. These reforms involved the closure of CDEP activities in all non-remote locations, which saw the closure of the CDEP in Mossman Gorge. Furthermore, receipt of CDEP wages began to be phased out, with all new participants in CDEP receiving an income support payment (typically Newstart), as opposed to a CDEP wage. Existing participants at 30 June 2009 (known as ‘grandfathered participants’) have been able to continue accessing wages.
COAG has set a target to halve the gap in employment outcomes between Indigenous and non-Indigenous Australians within a decade. The employment target is measured with data on the proportion of 15–64 year olds who are employed (the employment rate).
Table 8.20 shows the employment rate using Census data for all the Indigenous communities in Queensland for which the Queensland Government regularly publishes outcome data. Results are shown with and without CDEP positions. The ABS has historically treated CDEP participants as being employed, as in the past CDEP participants were paid a CDEP wage that was similar to the amount paid to a Newstart recipient. However, in recent years the total number of CDEP participants has fallen and there has been a shift in the composition of CDEP participants, many of whom are now in receipt of income support payments rather than CDEP wages.
As many people do not consider CDEP to be equivalent to a normal job, analysts often focus on trends in non-CDEP employment. This is also valid, as the key policy goal is to increase the number of Indigenous people in non-CDEP jobs, not to increase the number of CDEP participants.
Table 8.20 shows that the Indigenous employment rate (the percentage of Indigenous people aged 15–64 who are employed) fell from 2006 to 2011 for all Indigenous communities in Queensland; however, those falls were entirely explained by falls in the number of CDEP participants—as shown in Table 8.20, the non-CDEP employment rate458 rose in every community shown from 2006 to 2011.
A key factor behind increases in non-CDEP employment in these communities is the CDEP conversion process through which former CDEP positions were converted into properly paid jobs. Another factor is the creation of extra jobs through CYWR.
The changes in the non-CDEP employment rate in the four CYWR communities follow the same pattern as in other communities. However, it is worth noting that the improvements in Coen have been greater than in any other community, while the increase in Hope Vale was the third highest increase shown in the table. This is consistent with the fact that both Coen and Hope Vale have seen a relatively high number (given the size of each community) of additional properly paid jobs created through both the CDEP conversion process and CYWR.
Across the four communities, a total of 103 positions were created through the CDEP conversion process—29 in Aurukun, 39 in Hope Vale, 21 in Coen and 14 in Mossman Gorge. In addition to the CDEP conversion process, a significant number of jobs have been created in each of the communities as a result of CYWR. A total of 118 local service delivery jobs have been created as a result of CYWR—42 in Aurukun, 38 in Hope Vale, 18 in Coen and 20 in Mossman Gorge.
458 The proportion of the Indigenous population aged 15-64 who are employed in a non-CDEP job.

Cape York Welfare Reform—Evaluation
272
Together, the CDEP conversion process and CYWR have led to the creation of 221 properly paid jobs in the four communities.459
While increases in the non-CDEP employment rate are positive, the vast majority of adults in the four CYWR communities are not employed—most of them are outside the labour force, with a smaller number unemployed. This pattern is fairly consistent across all the communities shown in Table 8.20.
Table 8.20 Indigenous employment rates in CYWR communities, 15-64 years, 2006 and 2011
Location
Employment rate
2006 2011 Change
with CDEP without
CDEP with CDEP without
CDEP with CDEP without
CDEP % % % % % point
Aurukun 42.0 8.0 21.6 16.1 -20.4 8.1 Cherbourg 47.3 20.4 27.5 24.1 -19.8 3.7 Coen 72.0 22.0 49.6 45.4 -22.4 23.4 Doomadgee 52.0 24.0 32.1 25.3 -19.9 1.3 Hope Vale 71.0 15.0 42.9 35.8 -28.1 20.8 Kowanyama 62.9 22.5 35.0 25.1 -28.0 2.6 Lockhart River 46.3 22.0 44.8 35.1 -1.5 13.1 Mapoona 67.7 21.1 42.1 28.3 -25.5 7.2 Mornington 33.0 8.0 32.0 24.8 -1.0 16.8 Mossman Gorge 45.0 3.0 20.3 14.9 -24.7 11.9 Napranuma 45.1 12.5 30.0 25.8 -15.1 13.3 NPA – Bamaga and surroundsb 67.5 46.4 55.6 55.6 -11.9 9.1 NPA – Injinooa 70.0 29.1 40.1 33.0 -29.9 3.9 NPA – New Mapoona 64.2 26.5 51.7 43.8 -12.5 17.2 NPA – Seisiaa 73.5 44.1 63.5 63.5 -10.0 19.4 NPA – Umagicoa 62.3 22.1 44.1 44.1 -18.2 22.0 NPA total 67.2 35.7 51.0 48.3 -16.2 12.7 Palm Island 39.5 19.4 37.3 27.9 -2.1 8.5 Pormpuraaw 64.0 17.3 44.9 32.3 -19.1 15.0 Woorabindaa 56.3 18.8 31.1 27.9 -25.2 9.1 Wujal Wujala 59.0 12.5 46.2 30.2 -12.8 17.7 Yarrabah 66.6 17.1 20.0 19.4 -46.6 2.3 NPA = Northern Peninsula Area a Between the 2006 ASGC and the 2011 ASGS, geographical descriptors for these Indigenous locations were modified to better reflect the population
distribution. b between the 2006 ASGC and 2011 ASGS, geographical descriptors for this Indigenous location were modified to include some additional outstations. Source: ABS, 2006 and 2011 censuses.
Table 8.21 shows the number of Indigenous people who were employed in a non-CDEP job in 2006 and 2011. The data show that the number of Indigenous people in non-CDEP employment rose in all the communities shown in the table. While the numbers can be affected by population growth, they confirm the pattern on non-CDEP employment rates shown in Table 8.20.
459 Unpublished Australian Government and Queensland Government data.

Outcomes
273
Table 8.21 Indigenous non-CDEP employment in CYWR communities, 15-64 years, 2006 and 2011
2006 2011 Change Location Number Number Number Aurukun 50 114 64 Cherbourg 113 171 58 Coen 27 54 27 Doomadgee 111 167 56 Hope Vale 72 207 135 Kowanyama 139 152 13 Lockhart River 68 101 33 Mapoona 28 45 17 Mornington 73 134 61 Mossman Gorge 0 11 11 Napranuma 59 129 70 NPA - Bamaga and surroundsb 170 255 85 NPA - Injinooa 62 70 8 NPA - New Mapoona 43 77 34 NPA - Seisiaa 30 54 24 NPA - Umagicoa 27 60 33 NPA Total 332 516 184 Palm Island 206 395 189 Pormpuraaw 63 129 66 Woorabindaa 75 139 64 Wujal Wujala 25 55 30 Yarrabah 229 281 52 NPA = Northern Peninsula Area a The geography has been modified between 2006 ASGC and 2011 ASGS for these ILOCs to better reflect the populated areas. b The geography has been modified between 2006 ASGC and 2011 ASGS for this ILOC and for 2011 includes some additional outstations. Source: ABS, 2006 and 2011 censuses.
Changes to CDEP in remote communities also need to be taken into account in assessing changes in measured unemployment rates. While the unemployment rate is an often-quoted statistic, it can be highly misleading for remote Indigenous communities. At the time of the 2006 Census, recipients of Newstart in remote communities were not required to actively look for work because of remote area exemptions. This has important implications for the unemployment rate. If a Newstart recipient is not actively looking for work, they will not be classified as being unemployed by the ABS in Census or other data, by definition. Many of these people will be classified by the ABS as being outside the labour force.
Remote area exemptions (RAEs) were removed in Cape York in April 2007. All RAEs across Australia had been removed by early 2008. In summary, RAEs were in place in remote Indigenous communities at the time of the 2006 Census but had been removed by the time the 2011 Census was conducted. This explains why the measured unemployment rate rose from 2006 to 2011 in all but two communities (Table 8.22).
It would obviously not be valid to infer from Table 8.22 that labour market conditions have worsened in Indigenous communities in Queensland. In reality, the proportion of people who are employed in a properly paid job (as opposed to being outside the labour force or unemployed) has risen across all of these communities.

Cape York Welfare Reform—Evaluation
274
Table 8.22 Indigenous unemployment rates in CYWR communities, 15-64 years, 2006 and 2011
Location
Unemployment ratea 2006 2011 Change
% % % point Aurukun 10.0 29.8 19.8 Cherbourg 5.4 35.6 30.2 Coen 5.0 10.6 5.6 Doomadgee 7.0 24.3 17.3 Hope Vale 5.0 33.0 28.0 Kowanyama 1.0 16.2 15.2 Lockhart River 8.3 13.4 5.1 Mapoonb 4.3 5.6 1.4* Mornington 6.0 20.6 14.6 Mossman Gorge 0.0 40.0 40.0 Napranumb 8.2 24.6 16.4 NPA – Bamaga and surroundsc 6.4 8.9 2.5 NPA – Injinoob 9.1 5.6 –3.6* NPA – New Mapoonb 0.0 16.5 16.5 NPA – Seisiab 0.0 0.0 0.0 NPA – Umagicob 14.6 10.4 –4.2 NPA Total 6.7 9.2 2.5 Palm Island 16.9 28.9 12.0 Pormpuraaw 3.3 23.2 19.9 Woorabindab 5.9 33.8 27.9 Wujal Wujalb 7.1 19.2 12.1 Yarrabah 8.5 62.8 54.3 *% point change note: Where figures have been rounded, some discrepancies may occur between sums of the component items and totals due to rounding. NPA = Northern Peninsula Area a Unemployment rate = unemployed/labour force (%) b Between the 2006 ASGC and 2011 ASGS, geographical descriptors for these Indigenous locations were modified to better reflect the population
distribution. c Between the 2006 ASGC and 2011 ASGS, geographical descriptors for this Indigenous location were modified to include some additional outstations. Source: ABS, 2006 and 2011 censuses.
8.8.4 Job placements by Job Services Australia JSA commenced in the CYWR communities on 1 July 2009. Data from that date until December 2011 show that job placements through the JSA program have increased steadily across all four communities (Table 8.23).
Table 8.23 JSA job placement outcomes, CYWR communities, 1 July 2009 to 31 December 2011
Job placement counts Year 6-month block Aurukun Coen Hope Vale Mossman Gorge 2009 July – Dec 49 <20 40 <20 2010 Jan – Jun 23 <20 40 <20 2010 July – Dec 33 <20 64 <20 2011 Jan – Jun 42 29 76 <20 2011 July – Dec 61 35 80 <20 Total 208 97 300 38 Source: DEEWR data extraction at 14 March 2012.

Outcomes
275
8.8.5 Income support and CDEP CDEP reform was proposed in the Cape York area as a response to the perception that the structure of CDEP incentives encourages people to obtain welfare and remain on it, and that people aspire to CDEP jobs and to remain disengaged from the ‘real economy’ as described in Section 8.8.3. The reforms included transitioning of CDEP jobs into ‘normalised employment’ in salaried jobs in government service delivery, the closure of CDEP wages to new entrants and the closure of all CDEP activities in non-remote locations (such as Mossman Gorge). Additionally, from November 2008, CDEP was linked to the FRC reforms through a mechanism whereby CDEP participants had to sign forms acknowledging that they would cooperate with the FRC as an eligibility condition for continuing with CDEP.
Between 15 October 2008 and 16 December 2011, the FRC found that 53 CDEP participants had been non-compliant with the FRC. Of those participants:
25 were exited from CDEP due to FRC non-compliance
3 found employment and left CDEP before being exited
1 left CDEP voluntarily before being exited
14 were exited for other reasons (illness, incarceration or not meeting participation requirements)
10 had their FRC orders revoked. Of these 10, six were still on CDEP, one left due to illness, one left due to incarceration and two were exited for further non-compliance (these two people were included in the 25 exited due to FRC non-compliance at the first bullet point).
Trends in numbers of income support and CDEP wage recipients
The overall number of people on income support and CDEP in CYWR communities has declined over the past four years, from 1,276 in June 2008 to about 1,000 in June 2012 (Table 8.24). This is a decrease of about 21 per cent. This overall decline is the result of two separate trends:
a decreasing number of people on CDEP wages (note that some CDEP participants are now in receipt of income support payments rather than CDEP wages)
a smaller counteracting increase in the number of people on income support.
Since June 2008, the number of people on CDEP wages has decreased consistently from 635 to fewer than 20 by June 2012. On the other hand, the number of people on income support (which can include new CDEP participants) increased from 641 in June 2008 to 983 in June 2012—an increase of about 53 per cent.
The largest increase among income support recipients was for Newstart allowance, which more than trebled from June 2008 to June 2012. This increase in Newstart recipients represents almost 85 per cent of the total increase in income support recipients. The second largest increase was in the number of DSP recipients (which accounts for 12 per cent of the total increase). The only income support payment to see a decline in numbers was Parenting Payment Single, with the annual number of people on this payment decreasing by 19 between June 2008 and June 2012. All other payments saw an increase over this period.
When looking at trends over time, the pattern of transition from CDEP wages to income support becomes clearer. After initial CDEP reforms were introduced in CYWR communities in 2008, the CDEP population experienced a sharp and sustained decline. This decline was partially offset by a corresponding increase in the number of people on income support (Figure 8.21).
Overall, there has been a downward trend in the total number of people on income support and CDEP, with the decline in CDEP outstripping the increase in income support recipients.

Cape York Welfare Reform—Evaluation
276
Table 8.24 Income support recipients, by payment type, and CDEP participants on CDEP wagesa
Jun–08 Jun–09 Jun–10 Jun–11 Jun–12 No. No. No. No. No. 1. FaHCSIA payments
Age Pension 84 82 92 89 84 Carer Payment <20 21 26 32 40 DSP 112 125 132 147 154 Special Benefit <20 <20 <20 <20 <20 Other FaHCSIA paymentsb <20 <20 <20 <20 <20
2. DEEWR payments Newstart Allowance 131 292 426 408 421 Parenting Partnered 90 91 106 103 91 Parenting Single 129 119 123 107 110 Youth Allowance and ABSTUDYc 74 84 99 74 77 Other DEEWR paymentsd <20 <20 <20 <20 <20
Total income support recipients 641 818 1011 965 983 CDEP participants on CDEP wages 635 276 112 92 <20 Total income support and CDEP wages 1,276 1,094 1,123 1,057 <1,003 a CDEP wages is not an income support payment. Income support numbers include people on income support only, as well as on income support and participating in CDEP, categorised by the type of income support payment they receive. Only people who receive CDEP wages are shown under ‘CDEP participants on CDEP wages’. b Includes: Wife Pension (Age and DSP). c Includes Youth Allowance payments, ABSTUDY and Assistance for Isolated Children. d Includes Sickness Allowance and Widow Allowance. Note 1: If there are fewer than 20 people in receipt of specific income support payments, the information relating to them is confidential. Note 2: As numbers less than 20 are required to be supressed, the total is also expressed as a less than figure. Source: DEEWR Bluebook and FaHCSIA administrative data.
Figure 8.21 Number of income support recipients and CDEP wages recipients, CYWR communities, June 2008 to June 2012
0
200
400
600
800
1,000
1,200
1,400
June 2008 June 2009 June 2010 June 2011 June 2012
Nu
mb
er
Total income support and CDEP wages
Total income support recipients
CDEP wages
Source: DEEWR Bluebook and FaHCSIA administrative data in Table 8.24.

Outcomes
277
In interpreting these numbers it is important to consider whether other factors such as increased mobility could have affected the results. For example, perhaps a sizeable number of welfare recipients have left the CYWR communities. This does not appear to be the case. To test this, unpublished Centrelink data was analysed to see if the number of welfare recipients exiting the CYWR communities had increased over the period of the trial. This analysis provides no evidence to support such a hypothesis; in fact, the proportion of Centrelink benefit recipients in the CYWR communities who were also in the communities one year earlier was higher in June 2012 than it was in June 2009 and June 2010.
An analysis of income support data for comparison communities460 suggests a similar trend to the CYWR communities. The comparison communities also experienced a fall in the number of adults in receipt of either income support payments or CDEP wages, with the fall in the number of CDEP wage recipients more than offsetting a rise in the number of income support recipients. These trends are also consistent with the employment data which shows rises in non-CDEP employment in both the CYWR communities and the comparison communities. The employment data and the income support data imply that the fall in the number of individuals in the CYWR communities in receipt of either CDEP wages or income support payments is part of a broader trend in Indigenous communities in Queensland.
Trends in numbers of income support and CDEP wages recipients by community
Table 8.25 shows the number of income support and CDEP recipients for each of the four CYWR communities from June 2008 to June 2012. There are some marked variations among the communities, but the general pattern is that the total number of people on income support and CDEP wages declined between June 2008 and June 2012 in all four CYWR communities.
The largest numerical decline over this period occurred in Hope Vale, where the number of people on income support and CDEP wages fell in aggregate by more than 158 (which is approximately a 30 per cent decline). The biggest percentage decline in the number of people on income support and CDEP wages over this period occurred in Mossman Gorge (which is approximately a 35 per cent decline). In Coen and Aurukun, the combined total number of people on income support and CDEP wages decreased only marginally over this period, but the composition of that total changed, with more people on income support and fewer on CDEP wages.
Job Services Australia commencements
Figure 8.22 shows that the inflow into JSA has remained relatively stable at around 100 commencements per quarter. The initial change in the numbers shown in the third and fourth quarters of 2009 reflected the process of job seekers transitioning from Job Network to JSA. The stability in inflow over time from 2010 to 2012 is reflected in the low level of change in the active caseload from July 2009 to March 2012 (see Table 8.26). The slight growth in the active case load largely occurred in Aurukun.
460 The set of comparison communities used in this section differs slightly from the sets used in earlier sections. The comparison communities used here consist of Mapoon, Napranum, Wujal Wujal, Kowanyama, Lockhart River, Pormpuraaw, Doomadgee and Mornington Island. Overall across these communities, the reduction in the number of CDEP wage recipients from June 2008 to June 2012 was faster than the rise in income support recipients and, as a result, the total number of adults in receipt of either CDEP wages or income support payments fell. This pattern was evident in five of these eight communities.

Cape York Welfare Reform—Evaluation
278
Table 8.25 Income support (IS) and CDEP recipients, by community, 2008 to 2012
Jun–08 Jun–09 Jun–10 Jun–11 Jun–12 No. No. No. No. No. Aurukun CDEP wages 235 131 42 62 <20 IS (with CDEP participation) 25 <20 50 80 n.a. IS total 257 317 467 445 471 Total CDEP wages and ISa 492 448 509 507 <491 Coen CDEP wages 76 36 25 <20 <20 IS (with CDEP participation) <20 <20 <20 <20 n.a. IS total 76 94 99 100 126 Total CDEP wages and ISa 152 130 124 <120 <146 Hope Vale CDEP wages 271 87 45 <20 <20 IS (with CDEP participation) 52 <20 42 101 n.a. IS totala 228 326 372 345 321 Total CDEP wages and ISa 499 413 417 <365 <341 Mossman Gorge CDEP wages 53 22 <20 <20 <20 IS (with CDEP participation) <20 <20 <20 <20 n.a. IS total 80 81 73 75 65 Total CDEP wages and ISa 133 103 <93 <95 <85 All communities CDEP wages 635 276 112 92 <20 IS (with CDEP participation) 95 26 105 191 n.a. IS total 641 818 1,011 965 983 Total CDEP wages and ISa 1,276 1,094 1,123 1,057 <1,003 n.a. = suppressed a CDEP wages is not an income support payment. Income support numbers include people on income support only, as well as on income support and participating in CDEP, categorised by the type of income support payment they receive. Only people who receive CDEP wages are shown under ‘CDEP participants on CDEP wages’. Note 1: See explanatory notes to Table 8.24. Note 2: As numbers less than 20 are required to be suppressed, some totals are also expressed as a less than figure. Source: DEEWR Bluebook and FaHCSIA administrative data.
Figure 8.22 JSA initial commencements (community captured at job seeker level at time of commencement), 1 July 2009 to 31 March 2012
0
100
200
300
400
500
600
Q3 Q4 Q1 Q2 Q3 Q4 Q1 Q2 Q3 Q4 Q1
2009 2010 2011 2012
Quarter
Nu
mb
er
Notes: Figure shows initial commencements in JSA by job seekers resident in one of the CYWR communities represented. It is a count of individual job seekers commencing in JSA for the first time. It therefore avoids double-counting, and represents all job seekers who were resident in the communities at the time they were commenced in JSA. Data arranged by year and quarter. Source: DEEWR unpublished data.

Outcomes
279
Table 8.26 JSA recipients, by community and month, July 2009 to March 2012
Year Month Aurukun Coen Hope Vale Mossman Gorge
Total
2009 Jul 286 77 257 54 674 2009 Aug 301 77 263 54 695 2009 Sep 306 75 274 57 712 2009 Oct 325 74 263 51 713 2009 Nov 325 76 260 54 715 2009 Dec 334 75 248 52 709 2010 Jan 334 77 260 49 720 2010 Feb 348 71 264 51 734 2010 Mar 363 61 261 49 734 2010 Apr 354 62 273 55 744 2010 May 351 56 279 51 737 2010 Jun 350 54 274 46 724 2010 Jul 335 53 269 42 699 2010 Aug 331 56 256 47 690 2010 Sep 331 57 259 45 692 2010 Oct 312 53 245 40 650 2010 Nov 317 51 238 37 643 2010 Dec 309 51 229 35 624 2011 Jan 305 49 242 39 635 2011 Feb 315 56 240 40 651 2011 Mar 323 57 258 41 679 2011 Apr 311 53 235 38 637 2011 May 321 56 228 41 646 2011 Jun 323 58 216 42 639 2011 Jul 303 59 204 41 607 2011 Aug 294 59 215 37 605 2011 Sep 295 66 205 37 603 2011 Oct 296 65 206 33 600 2011 Nov 293 69 207 32 601 2011 Dec 292 59 207 32 590 2012 Jan 311 67 211 28 617 2012 Feb 332 72 209 27 640 2012 Mar 319 72 208 29 628 Notes: Data are points in time captured on the last day of each month and are not cumulative figures. As these data are points in time, a comparison should not be made with cumulative figures, including outcomes data. Table shows the active caseload, or the number of job seekers registered with JSA who were resident in one of the communities at the dates shown (based on the job seeker’s Community Code on their job seeker record). The data show all job seekers, not just Indigenous job seekers, although Indigenous job seekers make up the vast majority of the active caseload in these communities (over 96%). The data show job seekers in all streams, as well as when eligibility for a particular stream has not been determined. Source: DEEWR unpublished data.
8.8.6 ABSTUDY mobility provision
ABSTUDY contributes to the goals of CYWR as part of both the Employment and Education streams, but sits under the Education stream in the 2008 Project Board Agreement. The design of CYWR required ministerial approval to allow all secondary students to be eligible for ABSTUDY and ABSTUDY Away from Home payments should they decide to attend a school outside their community, provided that they met other eligibility criteria for ABSTUDY. This approach was intended to improve opportunities for students, as students in remote communities either entirely lack access to local state high schools or lack choice about schooling even should a local state high school be present or reasonably accessible. This provision has sometimes been referred to as the ‘ABSTUDY Bypass’ provision as it enables students in the designated welfare reform communities to ‘bypass’ a school to which they may have reasonable access in order to attend another school of their choice.

Cape York Welfare Reform—Evaluation
280
Table 8.27 shows the number of secondary school students in the CYWR communities who received ABSTUDY ‘away from home’ living allowance and those who received an ‘at home’ payment.
Data shows that a steady number of students in the CYWR communities took advantage of this provision over the welfare reform period; however, not all students received away from home benefits for the whole year.
Table 8.27 Number of secondary students in Aurukun, Mossman Gorge, Coen and Hope Vale receiving ABSTUDY At Home or Away From Home benefits in the calendar years 2008 to 2012
ABSTUDY secondary students in all four communities 2008 2009 2010 2011 2012 At Home (never away from home) 82 75 62 69 50 Away From Home (whole year) 83 129 100 90 83 Away From Home (part year) 53 42 57 51 66 Total 218 246 219 210 199 Source: Data provided by DEEWR based on Centrelink administrative data, DEEWR extract.
8.9 Housing
8.9.1 Key findings
Rents have increased in the CYWR communities from an average collection rate of $40–$60 per week to $108–$114 per week.
Across the four communities, 442 rental agreements are now in place.
There were 32 new houses and 197 refurbishments in the four CYWR communities.
As yet there is no private home ownership in Aurukun, Hope Vale or Mossman Gorge. Home ownership in Coen has remained steady through the CYWR period.
8.9.2 Introduction
This section assesses housing outcomes, focusing on housing tenancy and houses built and refurbished. Data are mainly confined to the CYWR communities.
8.9.3 Normalisation of housing tenancy arrangements
Housing notices
CYWR includes processes to normalise tenancy arrangements for existing social housing in Indigenous communities (as described in Chapter 2, Section 2.6.3). The aim is to make tenancy management arrangements in the four CYWR communities comparable to those for mainstream social housing by making rents better reflect market rates, or consistent with mainstream social housing rates, making rights and responsibilities of tenants and administrators clearer and the same as for other social housing, and ensuring consistent tenancy management by housing authorities.
To support the normalisation of tenancy arrangements, the mechanism for referring people to the FRC included a trigger for breaching a tenancy management agreement.
As we have noted in Chapter 7, notifications to the FRC for housing breaches were initially low, then rising in 2010 in Hope Vale and Aurukun, and subsequently dropping back to a small number after 2010. This is explained in the following paragraphs, and relates to policy and practice changes in Queensland Housing and to discussions between Queensland Housing and the FRC. Table 8.28 shows the numbers of people in rent arrears in the CYWR communities since June 2009.

Outcomes
281
Table 8.28 Number of households in arrears by four or more weeks, by location, June 2009 to December 2011
Location Number of households in arrears by 4 or more weeks
Jun–09 Dec–09 Jun–10 Dec–10 Jun–11 Dec–11 Aurukuna n.a. 48 39 48 42 53 Coen 0 2 2 1 1 6 Hope Vale 47 82 84 67 39 37 Mossman Gorge 2 2 1 1 1 0 Total 49 134 126 117 83 96 n.a. = not available a Tenancy management by the Department commenced October 2009. Note: Government managed social rental housing and remote Indigenous local government communities—government-managed social housing, Queensland. Government managed social rental housing comprises both the public rental housing program and the Aboriginal and Torres Strait Islander housing rental program. Source: Unpublished data produced by Data Development and Analysis, Queensland Department of Housing and Public Works, May 2012.
Figure 8.23 shows the number of households whose rent was in arrears at the end of each quarter across the four CYWR communities. The chart also shows quarterly data on the number of agency notices that the FRC received from Queensland Department of Housing and Public Works, by quarter. These data include notices for rent arrears and breaches of tenancy agreements.
Figure 8.23 Households in rental arrears by four or more weeks and housing tenancy agency notices received by the FRC, June 2009 to December 2011
0
20
40
60
80
100
120
140
160
Jan–
Mar
09
Apr–Ju
n 09
Jul–S
ep 0
9
Oct–Dec
09
Jan–
Mar
10
Apr–Ju
n 10
Jul–S
ep 1
0
Oct–Dec
10
Jan–
Mar
11
Apr–Ju
n 11
Jul–S
ep 1
1
Oct–Dec
11
Nu
mb
er
Households in arrears
Department of Housing notices received by FRC
Sources: FRC for number of department of housing notices; Queensland Department of Housing and Public Works for households in arrears data.
The apparently low number of households in arrears in June 2009 is accounted for by the fact that the Queensland Government began managing tenancies in Aurukun only in October 2009.
The apparent spike in housing notices is a statistical artefact that does not reflect a genuine change. The chart shows no clear trends in either the number of households in arrears or the number of housing notices issued. The only substantive point worth noting is that the number of agency notices

Cape York Welfare Reform—Evaluation
282
for housing breaches is low. For example, in the December quarter 2011 only 13 agency notices were received by the FRC.
Unfortunately, data on the quality of the social housing stock was not available for this evaluation.
Explanation for trend in rental arrears
Prior to the implementation of the CYWR, few people in the four communities regularly paid rent and there were no sanctions in place for not paying. The concept of rent normalisation was therefore a considerable change for most community members.
Normalising tenancy was seen as a stepping stone to home ownership for Indigenous people. By building people’s practical understanding of full tenant responsibilities, including the expectation that normalised rent will be paid, the intention was to enhance home ownership opportunities in the longer term.
Administrative arrangements, however, were inadequate and a robust system needed to be implemented to encourage personal responsibility and restore the norm around paying standard rents. This structural change entailed the transfer of social housing stock management in the CYWR communities to the Queensland Government.
When this occurred, rents rose significantly, although they were still below market rates. The average rent before the tenancy agreements was around $40 per week. Rent rose to $165 per week after tenancy agreements were set. It has since reduced to around $114 per week.
The introduction of tenancy management in line with the Department of Housing and Public Works’ One Social Housing System (OSHS), including the introduction of the Community Housing Rent Policy for Indigenous Councils from July 2009, brought about changes to rent payment practices in Indigenous communities.
Key changes that occurred in the CYWR communities of Aurukun, Hope Vale, Mossman Gorge and Coen were as follows:
Rents have increased from an average collection rate of $40–$60 per week to $108–$114 per week.
Social housing in these communities is managed according to OSHS, and tenancy arrangements comply with the Residential Tenancies and Rooming Accommodation Act 2008.
Under the National Partnership Agreement on Remote Indigenous Housing (NPARIH), where a social housing (minimum 40-year) lease is in place, the department has a direct landlord–tenant relationship as required by the NPARIH.
Tenancy agreements that outline the normal rights and obligations are in place.
On Indigenous communal land, a social housing (minimum 40-year) lease allows for direct tenancy management by the department as the landlord.
On Indigenous communal land, an agency appointment allows for tenancy management by the department as an agent on behalf of council.
On freehold land in Coen and Mossman Gorge and where the department is the trustee, direct tenancy management is in place as properties are part of the department’s social housing rental program.
The department has introduced a rent arrears strategy to address high levels of non-payment of rent in Aurukun and Hope Vale.
Prior to the CYWR, the foundations for normalising tenancy were already established in 2007 when FaHCSIA signed three Foundations for Welfare Reform agreements with Queensland Indigenous

Outcomes
283
communities: Hope Vale (May 2007), and Yarrabah and Palm Island (October 2008). These agreements were distinct from the CYWR agreement and were developed in response to interest from communities in pursuing home ownership and welfare reform activities. Central to the Hope Vale, Yarrabah and Palm Island agreements is a concerted effort to improve current rental stock, normalise tenancies and enhance opportunities to own property.
In Aurukun and Hope Vale, the councils collected minimal rent for the period they were managing housing. Either a flat rate was charged per household or a levy style arrangement, which varied from council to council, was used.
In Coen, there was Coen Regional Aboriginal Corporation housing that had rental agreements in place; however, rents were not consistently paid. Mossman Gorge contained some community housing and some Queensland Government housing.
The number of rental agreements in the four CYWR communities at 2 July 2012 was 442.461 The proportion that is managed by the Queensland Department of Housing and Public Works (DHPW) is shown in Table 8.29. Housing not managed by DPHW includes police housing, education housing, workers accommodation and transitional housing.
As at 2 July 2012, 78 per cent of tenancies in Aurukun and 22 per cent of tenancies in Hope Vale were managed by the Department of Housing and Public Words under a social housing (minimum 40 years) lease. The balance of the tenancies in the communities are managed by the department, under an agency appointment between council and the department. The existing tenancy agreement between council and tenant (with the department as agent) was terminated and a new agreement between the department as lessor and the tenant was created.
Table 8.29 Rental agreements in place for each community, as at 2 July 2012
Community
Managed by DHPW under a social housing
(minimum 40 years) lease
Managed by DHPW under an Agency
Appointment between council and the
department Total rental
agreements in place
Proportion managed by DHPW under a
social housing lease (%)
Aurukun 143 41 184 78 Hope Vale 48 171 219 22 Coen n.a n.a 29 n.a Mossman Gorge n.a n.a 10 n.a DHPW = Department of Housing and Public Works; n.a. = not available Source: Queensland Department of Housing and Public Works.
Prior to any of the 40-year leases being agreed between the councils and the Queensland Government, the Queensland Government had been acting as the agent for the councils in collecting rent for any of the tenancy agreements. However, the debt belongs to the councils. Debt accrued for the period of time in which the tenancy is active will be collected by the Queensland Department of Housing and Public Works (subject to council agreement to pursue the debt). However, when the tenancy is terminated the department will no longer pursue the debt. Debt accrued under an agency appointment belongs to council.
In Hope Vale (and Aurukun around the start of 2012), some of the existing tenancy agreements between the Council and the Tenant (where the department acts as agent) have been cancelled, and new agreements between the Queensland Government (as lessor under a 40-year lease) and the tenant have been created. Any old debts between the tenant and the council reside with the council;
461 Source for rental agreements is unpublished data from the Queensland Housing Department, 2 July 2012. This is point in time data only, based on the number of tenancy agreements in place in the communities. These data are not for the duration of the trial. Tenancy agreement numbers fluctuate as tenants move in and out of dwellings and as new constructions are completed and tenanted.

Cape York Welfare Reform—Evaluation
284
the Queensland Government is not responsible for their collection. In addition, these will (currently) not lead to a breach report to the FRC.
There are additional ad hoc tenancy terminations for a variety of reasons in the community, including succession of tenancy, tenancy transfers and the death of a tenant.
Process for issuing FRC breach notices
For the Queensland Government to issue a notice to the FRC, the tenant had to breach their agreement twice within a six-month period. If a tenant was overdue after seven days, a housing officer would contact the tenant to let them know. If they were still outstanding and had not made any agreement with the Queensland Government as to how they would pay, a breach would be issued.462
At that point, if the tenant made an agreement with the Queensland Government to pay what they could afford for their rent, they would still technically be in breach, but a second breach notice could not be issued.
Two breach notices have to be issued within a six-month period before a notice is sent to the FRC. Technically, once six months has passed from the first breach notice, the clock starts again for the two breach notices period.
As published by the FRC, the figures for notices issued in Hope Vale were 39 (January–March 2010) and 28 (April–June 2010), and 18 in Aurukun (April–June 2010). The FRC received an initial surge of notices from the Queensland Department of Housing and Public Works which they chose not to take any action on, as they believed it was beyond their remit to implement rent normalisation. As described above, rent normalisation was undertaken by Housing Queensland in line with its One Social Housing System, which brought about changes to rent payment. This resulted in a significant rise in the number of housing tenancy notifications due to arrears, from four in the 2008–09 financial year to 69 in 2009–10.463 To allow households to adjust to the changes in rent charged, the FRC Commissioners chose to monitor client progress rather than issue notifications in the first instance.
Policy for issuing FRC notices
Under the Family Responsibilities Commission Act 2008, the department is obliged to report breaches of a CYWR participant’s rental agreement to the FRC.
The breaches that may need to be reported are:
rent arrears
damage caused to the premises
interfering with the reasonable peace, comfort or privacy of a neighbour
using the premises for an illegal purpose
failure to keep the internal and external areas of the premises and inclusions clean
causing a nuisance by the use of the premises.
The breach is not required to be reported to the FRC if the tenant remedies the breach within the specified notice period (10 days).
The only exception is if the tenant has multiple breaches issued in a six-month timeframe.
462 When the Queensland Government acted on behalf of the councils (prior to 40-year lease agreements), the government had to go to the council to get approval before it could issue a breach notice. On many occasions, the council refused approval, and would never permit a breach notice to be issued for some families. 463 FRC annual report, 2010.

Outcomes
285
The issuing of a notice to remedy to a tenant must be reported to the FRC for the following notices:
1. Notice to remedy—rent arrears
When the notice to remedy issued for rent arrears has expired and the tenant has not responded to the notice and the tenant has refused to enter into an agreement to repay the outstanding amount, the breach must be reported to the FRC within five business days of the expiry of the notice to remedy.
2. Rent arrears agreement has failed
When a notice to remedy issued for rent arrears has expired and the tenant has not complied with the terms of their agreement to repay the outstanding amount, the breach must be reported to the FRC within five business days from the time the department becomes aware that the agreement entered into to repay the outstanding amount has failed.
Example: If it was agreed that a tenant would repay $10 per week as a way of repaying their rent arrears and the tenant does not pay the $10 per week instalments, the tenant has not complied with the terms of the agreement and the FRC must be notified.
3. Notice to remedy—nuisance, clean premises, and malicious damage
When a notice to remedy has been issued for matters relating to tenant nuisance; interference with reasonable peace, privacy and comfort of a neighbour; keeping premises clean; or malicious damage, and the tenant has not remedied the breach by the expiry of the notice, the breach must be reported to the FRC within five business days of the department becoming aware that the tenant has not remedied the breach.
4. Notice to remedy—illegal use of premises
The breach must be reported to the FRC within five business days from the time the department is advised (e.g. by the police) that the property is being used illegally.
Example: When a police notice has been received advising that a property has been or is being used for illegal purposes (such as for drug trafficking), a notice must be sent to the FRC within five business days from when the department receives the advice from the police.
5. Multiple notices to remedy issued within a six-month period
When two or more notices to remedy have been issued to the tenant within a six-month period for breaches relating to tenant nuisance; interference with the reasonable peace, privacy and/or comfort of a neighbour; keeping premises clean; malicious damage; and/or rent arrears, multiple breaches must be reported to the FRC within five business days from the day of issue of the second (and any subsequent) notice to remedy.
Example: if a notice to remedy is issued for rent arrears in January and a notice to remedy—other is issued in May for nuisance matters, the department must notify the FRC within five days from the date that the notice to remedy—other was issued for nuisance matters in May. This notification must occur regardless of whether the tenant remedied the first breach, or not, by the expiry of the notice period for the first breach. If the second notice to remedy is issued within the six-month timeframe, notification must be made to the FRC.464
8.9.4 Housing builds and home ownership
This section includes data on the number of new houses and refurbishments and home ownership. These data provide context for progress in achieving CYWR outcomes, including initiatives that are complementary to CYWR.
464 Queensland Department of Housing and Public Works, correspondence.

Cape York Welfare Reform—Evaluation
286
Table 8.30 provides the final numbers of houses built and refurbished in RSD locations by July 2012 in Queensland since NPARIH commenced nationally. No houses or refurbishments were completed in the 2008–09 financial year. Total numbers for the CYWR communities are 32 new houses and 197 refurbishments.
Under the NPARIH, RSD communities received priority for additional housing; however, the NPARIH is not part of CYWR.
Table 8.30 RSD site new housing and refurbishment completion totals, including 2009–10, 2010–11 and 2011–12
RSD location New houses Refurbishments Aurukun 20 49 Coen 0 47 Doomadgee 22 82 Hope Vale 12 101 Mornington Island 16 56 Mossman Gorge 0 0 Note: Knockdown rebuilds are not reported separately in this table. Source: RSD dataset.
It is well known that remote Indigenous communities rely almost exclusively on public and community housing. Home ownership in Indigenous communities tends to be very low, not least because land tenure arrangements mean that local people cannot generally own their own homes.
Data from the 2006 and 2011 censuses for home ownership in CYWR and other Indigenous communities in Queensland shows that there is virtually no home ownership in Indigenous communities in Queensland, and that this situation did not change from 2006 to 2011. The fact that there has been no change in home ownership during the CYWR reflects the time it has taken to reform land tenure arrangements.
8.10 Other outcomes
8.10.1 Introduction This section uses data from the 2006 and 2011 censuses to identify changes in the CYWR communities. It considers the number of Indigenous people who were reported as engaging in voluntary work in the 2006 Census compared to the 2011 Census. This outcome is important, as one of the signs of success of CYWR as outlined in the 2008 Project Board Agreement is defined as ‘active participation in services and volunteer actives by community individuals and family members’. This section also includes the median weekly income of Indigenous individuals and households in 2006 and 2011 to show any changes in this area over time.
8.10.2 Key findings
Aurukun saw a significant increase in the number of Indigenous adults undertaking volunteer work, which is not part of the broader trend.
There is no significant difference in changes in personal or household income between CYWR communities and other Indigenous communities in Queensland.
8.10.3 Volunteering
Table 8.31 shows the proportion of Indigenous people aged 15 or over who were reported in the Census to be engaged in voluntary work.
The data on voluntary work does not show a clear trend. The rise in the proportion of Indigenous adults undertaking voluntary work in Aurukun, from 2.8 per cent in 2006 to 18.2 per cent in 2011, was

Outcomes
287
the largest for any of the communities shown in the table and not just part of a broader trend. The large rise in the proportion of Indigenous people involved in voluntary work in Aurukun from 2006 to 2011 may reflect some of the positive impacts of CYWR. There is good evidence from the social change survey and from official school attendance data that Aurukun has experienced some significant improvements in outcomes since CYWR commenced. The increase in the proportion of people undertaking voluntary work, which may reflect greater community cohesion, may be part of this broader positive trend.
Table 8.31 Proportion of Indigenous people aged 15 or over who engaged in volunteer work, 2006 and 2011
Community
Voluntary worka 15 years and over
2006 (%) 2011 (%) Coen 3.8 10.1 Hope Vale 18.3 8.8 Aurukun 2.8 18.2 Mossman Gorge n.a. 9.3 Mornington 10.8 12.0 Doomadgee 7.4 3.9 Cherbourg 8.3 14.2 Kowanyama 19.3 14.7 Lockhart River 3.8 12.2 Mapoonb 15.3 14.7 Napranumb 7.8 10.5 NPA – Bamaga and surroundsc 20.3 17.6 NPA – Injinoob 12.6 5.5 NPA – New Mapoonb 17.9 15.3 NPA – Seisiab 23.3 27.6 NPA – Umagicob 38.1 9.6 Palm Island 4.2 5.8 Pormpuraaw 30.2 19.7 *Woorabindab 5.5 4.9 *Wujal Wujalb 8.0 13.6 Yarrabah 14.2 11.1 Indigenous Qld 16.2 13.7 Indigenous Australia 15.1 12.8 n.a. = not available; NPA = Northern Peninsula Area a 2011 data extracted from Tablebuilder; 2006 data excludes those people who did not state whether did or did not undertake voluntary work. b Between the 2006 ASGC and 2011 ASGS, geographical descriptors for these Indigenous locations were modified to better reflect the populated distribution. No communities or living areas have been excluded, and no additional communities or living areas been included, as a result of these modifications. c Between the 2006 ASGC and 2011 ASGS, geographical descriptors for this ILOC were modified to include some additional outstations. Source: ABS, 2006 and 2011 censuses.
8.10.4 Median weekly income Table 8.32 shows the median weekly income of Indigenous individuals and households in 2006 and 2011, and the percentage changes for each community, as well as for Queensland and Australia as a whole. Across Queensland, the median income of Indigenous individuals and households grew by 21 and 19 per cent, respectively, which is less than the change in national averages for the same measures (30 per cent and 25 per cent, respectively).
Indigenous individual median income increased by more than the 30 per cent national average in almost half of the Queensland Indigenous communities. The greatest increase to individual income was in the Northern Peninsula Area (NPA) community of New Mapoon (50%). Hope Vale was the only CYWR community where individual income was higher than the national average; the remaining

Cape York Welfare Reform—Evaluation
288
communities were below both the Queensland and Australian averages, including Mossman Gorge which had a decrease in individual median income of 9 per cent.
Queensland Indigenous communities showed more positive change in household median income than individual median income, with the greatest increase of 77 per cent recorded in the NPA (Injinoo). Two-thirds of the communities listed were above the Queensland average, and more than half were above the Australian average. Two of the CYWR communities—Coen and Hope Vale—showed increased median household income rates greater than the Queensland and Australian averages (76 per cent and 35 per cent, respectively). However, Mossman Gorge had a reduction in household median income of 26 per cent.
These findings indicate possible changes in the composition of earnings within individual households and also in household size. This is reflected in the different rates of change between median individual and household earnings within communities. For example, two of the CYWR communities, Coen and Mossman Gorge, had changes in median household incomes that were between three and four times greater than changes in individual median incomes. Around one-third of the communities had similar changes in individual and household incomes, including Hope Vale and Aurukun.
Overall, the findings do not show a significant difference between CYWR communities and other Indigenous communities in Queensland in changes in personal or household income between 2006 and 2011.

Outcomes
289
Table 8.32 Median weekly income of Indigenous individuals and households, 2006 and 2011
Community
Median personal income (weekly)
Change between 2006
and 2011
Median household income (weekly)
Change between 2006
and 2011 2006 2011 2006 2011 $ $ % $ $ %
Coen 259 302 16.6 687 1,208 75.8 Hope Vale 222 291 31.1 630 848 34.6 Aurukun 210 249 18.6 891 1040 16.7 Mossman Gorgea 264 240 -9.1 840 624 -25.7 Mornington 199 268 34.7 638 860 34.8 Doomadgee 218 272 24.8 1,107 1,094 -1.2 Cherbourg 226 281 24.3 585 777 32.8 Kowanyama 230 274 19.1 969 1,026 5.9 Lockhart River 214 284 32.7 858 1,048 22.1 Mapoonb 215 292 35.8 680 924 35.9 Napranumb 222 257 15.8 630 796 26.3 NPA – Bamaga and surroundsb
352 461 31.0 746 982 31.6
NPA – Injinoob 220 305 38.6 570 1,010 77.2 NPA – New Mapoonb 195 293 50.3 575 830 44.3 NPA – Seisiab 332 388 16.9 860 787 -8.5 NPA – Umagicob 222 302 36.0 565 572 1.2 Palm Island 216 283 31.0 849 1,161 36.7 Pormpuraaw 232 293 26.3 785 1,006 28.2 Woorabindab 192 272 41.7 468 717 53.2 Wujal Wujalb 227 255 12.3 706 850 20.4 Yarrabah 223 273 22.4 978 988 1.0 Indigenous Queensland 318 384 20.8 898 1,066 18.7 Indigenous Australia 278 362 30.2 791 991 25.3 NPA = Northern Peninsula Area a 2006 data are provided for place of enumeration. b Between the 2006 ASGC and 2011 ASGS, geographical descriptors for these Indigenous locations were modified to better reflect the population
distribution. No communities or living areas have been excluded as a result of the modifications; nor have any additional communities or living areas been included.
Note: Data are provided for place of enumeration unless otherwise indicated. Source: ABS, 2006 and 2011 censuses.


Summary of findings from the KPMG review
A.1
Appendix A Summary of findings from the KPMG Implementation Review of the Family Responsibilities Commission
A.1 Background In 2008 Courage Partners was engaged by FaHCSIA, on behalf of the Tripartite Partners, to design an evaluation framework for the Cape York Welfare Reform (CYWR) trials. In the Evaluation Framework and Program Theory for the Cape York Welfare Reform, Courage Partners recommended that an implementation review of the Family Responsibilities Commission (FRC) be undertaken. FaHCSIA, on behalf of the Tripartite Partners, engaged KPMG to undertake an implementation review of the FRC. This review was one of the first steps in the evaluation of the CYWR trials. The implementation review considered the first 18 months of the FRC’s 3.5-year term.
A.2 Objectives of the implementation review The objectives of the implementation review were to determine:
whether the FRC was being implemented effectively and in such a way that it was likely to achieve its stated objectives
what might need to be changed or added to assist the FRC to be effective during the current welfare reform period
what initial impacts can be observed in communities and in people’s behaviour, what are the intended and unintended consequences, how those impacts and consequences have come about, and to what extent the observed impacts might be attributed to the FRC or to other initiatives.
A.3 Findings of the implementation review The review made a number of findings on the implementation and objectives, including the following (KPMG, p. 5):
The FRC has been successfully established as an innovative new body in accordance with the requirements of the design and legislation.
The FRC’s jurisdiction is targeted appropriately and it is engaging community members in a very complex environment.
The process of establishing the FRC system has been more difficult than anticipated, but this is not unusual for changes in which collaboration across organisations at all levels is required, and issues are being worked through.
The FRC is progressing towards its objectives, and there are opportunities to further enhance its influence in the communities.
A.4 Initial impacts of the FRC The KPMG review also outlined four initial impacts of the FRC:
The FRC appears to contribute to restoring Indigenous authority by supporting local and emerging leaders in local commissioner roles.

Cape York Welfare Reform—Evaluation
A.2
With average attendance rates of around 60–70 per cent at conferences, which compares favourably with other conditional welfare initiatives, and the majority of clients reaching agreements with the FRC about what action they should take to improve their lives, there are signs that individuals are responding to the drivers and incentives created by the FRC.
There is growing awareness in the communities that the FRC is operational and will hold people accountable for certain behaviour, although this understanding is not yet broad or deep.
Story telling through face-to-face interviews with FRC clients reveals that some people have experienced an improvement in their lives and the lives of their families, although there are also signs that individual change is fragile, with many people breaching social obligations after having been in the FRC system.
Indicators of positive community-level change in school attendance, alcohol use and violence in two communities (Aurukun and Mossman Gorge) may be associated with the FRC and other initiatives, and underpin a higher level of acceptance of the FRC in those communities (KPMG, p. 6).
The KPMG report stated that three key issues required further attention:
Development of the FRC system should be progressed, focusing on the linkages and cooperation between the Commission, notifying agencies and support services.
Forward planning is needed to take account of the volume of clients likely to enter the FRC system and the associated resourcing required.
On-going communication with community members about the FRC, to grow broader understanding about the consequences of negative behaviour and the supports for change to align with community values which it provides, should be continued (KPMG, p. 6).

Project performance summary
B.1
Appendix B Project performance summary—July 2008 to December 2011
This report presents project performance information, grouped into each of the four streams—Social Responsibility, Education, Economic Opportunity and Housing.
The rationale for each stream and project is summarised, based on the information in the From hand out to hand up design reports and the CYWR 2008 Project Board Agreement. Project implementation and performance information are also summarised.
The data and information are largely collated from quarterly performance reports for each project.
B.1 Social Responsibility stream The From hand out to hand up design reports argue that basic social norms that are the glue to any society—such as sending children to school, respecting others, and taking care of one’s family and one’s house—have significantly deteriorated in Cape York communities. Specifically, the design reports state that ‘many Indigenous communities in Cape York now operate at a social order deficit, where negative social norms encourage and perpetuate binge drinking, violence, passivity, humbugging and a lack of parental engagement in their responsibilities to their children’. The design reports attribute this breakdown to changes occurring over the past 30 to 40 years, with alcohol abuse and passive welfare dependence being key drivers. Furthermore, the design reports argue that well-intentioned government services can unintentionally erode personal responsibility and entrench passive behaviour.
The design reports recommended that a number of obligations be attached to all welfare payments available in the welfare reform communities and that a state statutory authority consisting of a senior legal officer and local elders be empowered to enforce the obligations.
The four social obligations that the design reports recommended are attached to welfare payments in the communities:
Each adult who receives welfare payments with respect to a child should be required to ensure that the child maintains a 100 per cent school attendance record.
All adults must not cause or allow children to be neglected or abused.
All adults must not commit drug, alcohol, gambling or family violence offences.
All adults must abide by conditions related to their tenancy in public housing.
The project areas in the social responsibility stream set out in the 2008 Project Board Agreement are:
Family Responsibilities Commission (FRC)
Conditional Income Management
support service
MPower (previously Family Income Management).
Other projects covered here are:
Wellbeing Centres
Community Action Fund (CAF).

Cape York Welfare Reform—Evaluation
B.2
B.1.1 Family Responsibilities Commission The FRC commenced operations on 1 July 2008, with the passing of the Family Responsibilities Commission Act 2008 (Qld) by the Queensland Parliament. The FRC comprises the Commissioner, David Glasgow, who is a retired senior magistrate, and19465 Local Commissioners, who are respected community members appointed by the Queensland Governor. The commission appointed some new Local Commissioners in late 2011. The administrative arm of the FRC is known as the ‘Registry’. The key objectives of the FRC are to rebuild Indigenous authority and to restore social norms by reforming incentives and laws to support socially responsible standards of behaviour at the individual, family and community levels.
The Australian Government passed legislation enabling income management if ordered by the FRC, provided $3.5 million to support the establishment of the FRC and is implementing a range of support services. The Queensland Government is funding the operations of the FRC and other support services. The FRC, overseen by the Family Responsibilities Board, issues detailed quarterly and annual reports which are tabled in the Queensland Parliament.
The FRC has jurisdiction over Aboriginal and non-Aboriginal community members who are welfare recipients or Community Development Employment Projects (CDEP) Program participants who reside or have lived in Aurukun, Coen, Hope Vale or Mossman Gorge for at least three months since 1 July 2008 and where the FRC has received a notification that:
a person’s child is absent from school three full or part days in a school term without reasonable excuse
a person has a child of school age who is not enrolled in school without lawful excuse
a person is the subject of a child safety report
a person is convicted of an offence in the Magistrates Court
a person breaches his or her tenancy agreement—for example, by using the premises for an illegal purpose, causing a nuisance or failing to remedy rent arrears.
If the FRC receives a notification about a welfare recipient, the FRC can hold a conference with that person. When the FRC holds a conference, the panel may be convened either by the Commissioner and two Local Commissioners, or by three Local Commissioners as well as the people concerned. In a case which involves the imposition of an income management order, the conference must include the participation of Commissioner Glasgow.
During conferences, the FRC talks with people about their behaviour. The FRC strives to reach agreement with the person about what should happen in the first instance. After conferencing an individual, the Commission can take a range of actions to restore socially responsible behaviour, including by way of:
a family responsibility agreement
referrals to support services (agreed by the client)
notices to attend support services (ordered by the FRC)
income management
follow-up monitoring and case management
re-conferencing and intensive case management where required.
465 As at 2 December 2011.

Project performance summary
B.3
Over time, the FRC may employ all of these approaches with a client, particularly if that person is named in multiple notifications.
Performance information
An implementation review conducted by KPMG covering the first 18 months of FRC operations found that the FRC, despite numerous challenges and the complexity of operating within a remote environment, was implemented as intended in all four communities. Its structures and processes conformed to good practice principles and, during its first 18 months of operation, the FRC established its own foundations and enablers which contributed to supporting individuals behaving in ways consistent with community values and expectations of acceptable behaviour. KPMG noted that, while many challenges remained at that time, the FRC was addressing a number of these challenges as part of its continuing efforts to strengthen its role within the participating communities.
Notifications
The relevant Queensland Government agencies are required to notify the FRC where a community member is in breach of one of the four social obligations. The FRC establishes whether the notices are in its jurisdiction.
From July 2008 until June 2011, the FRC received 7,614 agency notifications466 that were processed within jurisdiction (Table B.1). During this period Aurukun had the largest number of notifications (4,419), accounting for 58 per cent of the total.
Table B.1 Agency notifications received by the FRC, within jurisdiction, by quarter and community, July 2008 to June 2011
Community
Jul–Sep
2008
Oct–Dec
2008
Jan–Mar
2009
Apr–Jun
2009
Jul–Sep
2009
Oct–Dec
2009
Jan–Mar
2010
Apr–Jun
2010
Jul–Sep
2010
Oct–Dec
2010
Jan–Mar
2011
Apr–Jun
2011 Aurukun 205 182 325 278 417 446 494 396 458 440 464 314 Coen 38 23 20 50 41 79 37 48 38 37 20 24 Hope Vale 87 173 110 251 160 214 220 255 172 208 159 205 Mossman Gorge 35 20 36 57 61 43 35 42 58 49 34 56 Total 365 398 491 636 679 782 786 741 726 734 677 599 Note: Excludes notifications that were not within jurisdiction. Totals for some quarters may differ from those in the FRC annual reports due to adjustments in later data extraction. Source: FRC, quarterly reports.
Notices for July 2008 through to June 2011 comprised:
3,320 magistrates court notifications
931 child safety notifications
144 tenancy breach notifications
3,219 school attendance notifications.
The FRC Annual report 2010–2011 showed that, from 1 July 2010 to 30 June 2011, 763 clients were subject to FRC agency notifications (representing 46 per cent of the adult population aged 17 and over, which is estimated to be 1,666). This compares to 715 and 833 clients who were subject to notifications in 2008–09 and 2009–10, respectively. During the 2010–11 financial year, Mossman Gorge had the most clients per number of adults in the community (70%), while Coen had the least (29%). Aurukun and Hope Vale had 51 and 41 per cent, respectively.
466 Agency notifications are statutory obligations under the FRC Act.

Cape York Welfare Reform—Evaluation
B.4
Conferences
A total of 4,229 notices to attend conferences were served by the FRC from July 2008 to June 2011 (Table B.2). The number of conference notices by quarter ranged from a low of 97 in the first quarter to a high of 608 in the tenth quarter. Over half (55.6%) of all conference notices were served in Aurukun (2,352).
Table B.2 Notices to attend a FRC conference, by community and quarter, July 2008 to June 2011
Community
Jul–Sep
08
Oct–Dec
08
Jan–Mar
09
Apr–Jun
09
Jul–Sep
09
Oct–Dec
09
Jan–Mar
10
Apr–Jun
10
Jul–Sep
10
Oct–Dec
10
Jan–Mar
11
Apr–Jun
11 Aurukun 38 72 156 186 171 232 161 283 194 399 217 243 Coen 13 10 11 21 25 29 33 19 16 23 22 16 Hope Vale 27 87 104 115 132 108 109 96 97 126 93 104 Mossman 19 32 25 49 29 37 24 35 28 60 24 79 Total 97 201 296 371 357 406 327 433 335 608 356 442 Note: The number of notices is the number of conferences that were scheduled in each community; not all were attended. Totals for some quarters may differ from those in the FRC annual reports due to adjustments in later data extraction. Source: FRC, quarterly reports.
Over the period, Aurukun showed an upward trend in the number of notices to attend conferences. Trends for Mossman Gorge, Coen, and Hope Vale were fairly constant (Figure B.1).
Figure B.1 Notices to attend FRC conference, by community and quarter, July 2008 to June 2011
0
50
100
150
200
250
300
350
400
450
Jul–S
ep 0
8
Oct–Dec
08
Jan–
Mar
09
Apr–Ju
n 09
Jul–S
ep 0
9
Oct–Dec
09
Jan–
Mar
10
Apr–Ju
n 10
Jul–S
ep 1
0
Oct–Dec
10
Jan–
Mar
11
Apr–Ju
n 11
Nu
mb
er
Aurukun
Coen
Hope Vale
Mossman Gorge
Note: Number of notices is the number of conferences that were scheduled in each community; not all were attended. Totals for some quarters may differ from those in the FRC annual reports due to adjustments in later data extraction. Source: FRC, quarterly reports.
Conference attendance numbers varied by community and quarter in the period from July 2008 to July 2011 (Table B.3). Aurukun typically had the highest number of attendances. Quarter 10 (October to December 2010) had the highest total number of conference attendances (393).

Project performance summary
B.5
Table B.3 Conferences attended, by community and quarter, July 2008 to June 2011
Community
Jul–Sep
08
Oct–Dec
08
Jan–Mar
09
Apr–Jun
09
Jul–Sep
09
Oct–Dec
09
Jan–Mar
10
Apr–Jun
10
Jul–Sep
10
Oct–Dec
10
Jan–Mar
11
Apr–Jun
11
Aurukun 28 57 120 120 105 174 132 215 151 293 176 205 Coen 8 6 8 9 5 9 26 12 11 17 13 12 Hope Vale 24 43 41 47 78 64 80 55 62 68 63 78 Mossman 10 4 10 22 8 11 14 18 16 15 8 33 Total 70 110 179 198 196 258 252 300 240 393 260 328 Note: The number of conferences is the number of conferences actually attended, not the number scheduled. Source: FRC, unpublished data.
Aurukun had the highest average attendance rate between July 2008 and June 2011, with 75.5 per cent of scheduled conferences attended. This was followed by Hope Vale at 58.7 per cent and Coen with 57.1 per cent over the same period. Mossman Gorge had the lowest average attendance, with only 38.3 per cent of scheduled conferences attended.
FRC case management
To monitor the quality and responsiveness of support which clients access and receive over time, the FRC has implemented a case management approach, which is activated from the start of a referral process. The FRC starts case managing a client when the FRC has agreed to direct or has directed a client to attend services. As part of case management, the FRC receives monthly reports from service providers about whether the client is attending services and whether any progress is being seen. A small number of FRC clients are case managed through the Active Family Pathways service.
Performance information
Table B.4 shows the number of referrals made by the FRC from July 2010 to September 2011, by referral type. Figures in this table represent the number of FRC referrals to services only. The figures do not indicate the number of people who access a service.
Table B.4 Referrals made by the FRC, by quarter and referral type, July 2010 to September 2011
Referral type Jul–Sep
2010 Oct–Dec
2010 Jan–Mar
2011 Apr–Jun
2011 Jul–Sep
2011 Total Family Income Management 10 29 8 30 24 101 Wellbeing centre 21 31 12 37 21 122 Student Case Managers 1 5 0 5 7 18 Parenting Program 5 18 10 23 20 76 Ending Family Violence Program 31 39 17 16 17 120 Active Family Pathways 0 5 0 10 7 22 Other 8 2 1 0 0 11 Total 76 129 48 121 96 470 Note: Figures represent the number of FRC referrals to services only. Figures do not indicate the number of people who access a service. Source: FRC, quarterly reports.
B.1.2 Conditional income management The From hand out to hand up design reports proposed that income management would underpin Indigenous authority and, like other conditionality measures, would create a deterrent against dysfunctional behaviour; in other words, people try to behave in responsible ways when they know there are consequences if they do not.
One of the powers of the FRC is its capacity to order income management. Income management under CYWR works by quarantining a percentage (usually 60% or 75%) of a person’s welfare payments for use on essentials like food, rent and electricity. Income management specifically reduces the amount of money available for dysfunctional uses and redirects some social security

Cape York Welfare Reform—Evaluation
B.6
payments to functional uses, such as food and clothing. It does not reduce the total amount of a person’s income support payment.467 In CYWR, income management can take two forms: Conditional Income Management, ordered by the FRC; and voluntary income management, requested by the client.
The FRC orders income management by issuing an income management notice to Centrelink, which Centrelink must implement if the customer named in the notice receives a relevant income support payment. The FRC may also amend an income management notice, to either revoke the notice, extend the duration of the notice or amend the percentage of fortnightly welfare payments that are income managed. The FRC typically orders income management for 12 months. The FRC may extend income management for a customer because:
the FRC has received further notifications about the customer
the customer has refused to engage with the FRC
the customer has failed to follow through on commitments agreed with the FRC
the customer has asked for the notice to be extended.
Performance information
Since the commencement of the trial, over 414 FRC clients have been income managed at some point. In December 2011, 150 clients were on income management. Almost all those on income management were directed by the FRC to Conditional Income Management; only eight people were on voluntary income management.
Of those 150 clients on income management, 23 per cent had been on income management for one year or longer. The majority had been income managed for less than 12 months (44 per cent for between three and 12 months and 33 per cent for less than 13 weeks).
Of those people who were no longer being income managed, 46 per cent were on income management for the entire FRC-designated time period, usually 12 months. A further 17 per cent were no longer within jurisdiction as they were no longer on an income support payment, and 36 per cent of people had had their income management requirement revoked by the FRC.
B.1.3 Support services
The design reports recommended that the FRC should have the power to direct people to support services in areas that contribute most to rebuilding social norms, such as money management services or student case managers. In line with this, it was recommended that all service providers working in, or with, the four communities would need to reconsider service delivery to ensure that it was consistent with the principles of CYWR and that there was clear focus on supported self-help and individual responsibility.
A number of new services have been established specifically as part of the trial; new services have also been implemented concurrently with the trial. The FRC primary referral services are student case managers (previously called ‘school attendance case managers’), the Wellbeing Centres, MPower (previously Family Income Management), and the Ending Family Violence Program. Community members can also voluntarily seek assistance from these services. The design reports also noted that further funding was likely to be required for drug and alcohol services and child and maternal health services, but did not provide detailed program designs or funding proposals for those services.
467 Includes Disability Support Pension, Age Pension, Parenting Payment, Newstart Allowance, Carer Allowance and Youth Allowance.

Project performance summary
B.7
In November 2009, the CYWR Project Board also endorsed five key policy issues as priorities for the Social Responsibility stream: family violence, parenting, gambling, child reunification, and nutrition. Those policies included:
early planning for investigating ways to incorporate the children’s safe houses to be established in Aurukun and Coen into an integrated framework addressing family violence, child safety and child reunification
development of a holistic nutrition strategy, with an emphasis on researching strategies to improve the nutrition of school age children, within either the home or school environment, to facilitate enhanced learning outcomes.
Ending Family Violence Program
The Ending Family Violence Program has been run continuously by Queensland Corrective Services, within the Department of Community Safety, in the CYWR trial communities. Prior to the trial, the program was operating for Queensland Corrective Services clients. In response to the need to target the reduction in family violence beyond prison and parole clients, family violence and general offending, the program was made available to mutual clients of both the FRC and Queensland Corrective Services and specifically referred FRC clients in 2010 under funding arrangements. As there were no programs available to address family violence under the current CYWR trial service provision, Queensland Corrective Services began delivering Ending Family Violence programs in CYWR communities in May 2010 on the request of the Department of Communities.
Over the course of the trial, program delivery has remained with Queensland Corrective Services as it is a specialised program solely owned by Queensland Corrective Services, but the acquittal of the funding has varied depending on the source of the funding. During 2010, the first half of 2011 and the second half of 2012, the Department of Communities provided funding to Queensland Corrective Services to deliver the program. In the second half of 2011, the Australian Government, through the Department of Health and Ageing (DoHA), required the Royal Flying Doctor Service (RFDS) to administer the funding and assist Queensland Corrective Services to deliver the program through the CYWR Wellbeing Centres.
Operations as part of the trial began in May 2010 when the Department of Communities entered into a memorandum of understanding (MOU) with Queensland Corrective Services (Department of Community Safety) to deliver the Ending Family Violence Program in the CYWR trial communities for one year. Queensland Corrective Services continued to provide access to the program for FRC clients over the next six months to assist in the completion of arrangements for FRC clients pending the new funding agreement. Upon finalisation of the MOU between the RFDS and Queensland Corrective Services, the Australian Government (DoHA) provided the RFDS with funding to assist in the logistics and co-facilitation of the Ending Family Violence Program in the CYWR trial communities from 1 July to 9 December 2011. In February 2012 the Queensland Government approved funding for the program until the end of 2012, and a new MOU between the Department of Communities and Queensland Corrective Services (Department of Community Safety) commenced.
The Ending Family Violence Program is a Queensland Corrective Services three-day intervention targeting Indigenous offenders who have been convicted of offences related to violence within their family and/or community. The Ending Family Violence Program is offered in all four CYWR trial communities, is based on a cognitive behavioural model and utilises both active and experiential learning exercises that are culturally appropriate. The program aims to raise participants’ awareness of the impact of domestic violence on the family unit and to investigate options to assist them to change their lifestyle.

Cape York Welfare Reform—Evaluation
B.8
Performance information
Clients are referred for 12 months to provide sufficient opportunity for them to attend. Table B.5 shows the number of clients referred to the Ending Family Violence Program by the FRC, as well as the number who have completed the program. Around five programs were run in five of the six quarters.
Table B.5 Ending Family Violence Program, number of referrals, completions and programs, by quarter, July 2010 to 9 December 2011
Jul–Sep
2010a Oct–Dec
2010 Jan–Mar
2011 Apr–Jun
2011b Jul–Sep
2011 Oct–Dec
2011 Total Referrals 31 39 17 16 17 34 154 Completions 23 14 16 n/a 14 20 87 Programs 6 4 5 4 5 5 29 a From July to September 2010, although there were no programs in Coen, referrals from the FRC were still made. b From April to June 2011 the FRC continued to refer clients, but programs were cancelled or rescheduled. Note: The number of people referred per quarter may not reflect the number of people who attended programs. Source: FRC, quarterly reports.
The Ending Family Violence programs conducted by Queensland Corrective Services for FRC clients began in the first quarter of 2010 in Aurukun, Hope Vale and Mossman Gorge. In Coen, programs began in the second quarter (May 2010). From 1 July to 9 December 2011, the programs were conducted in all communities under the MOU arrangements between the RFDS and Queensland Corrective Services (Department of Community Safety). The MOU between the RFDS and Queensland Corrective Services was originally intended to end on 1 December 2011; however, it was extended to 9 December 2011 to allow a program to be delivered in Hope Vale due to the large number of cancelled and rescheduled programs.
Approximately 20 clients were directed to attend each program. If clients failed to attend or there were more than 20 clients waiting for the program, they were scheduled to attend the next program. Cancellation and rescheduling of some programs also occurred due to logistics, staffing and sorry business. The number of people referred per quarter may not reflect the number of people who were able to attend programs.
Parenting program (It Takes a Village to Raise a Child)
The parenting program ‘It Takes a Village to Raise a Child’ is Cape York Partnerships’ (CYP’s) Positive Parenting Program468 (referred to as the Triple P program). There are three parts to the program: Baby College, Positive Kids and Strong Families. Each part provides customised opportunity services to support the physical, emotional, social and intellectual development of the child from infancy to adulthood:
Baby College provides a college for expecting parents to socialise and learn together while they travel on the journey to parenthood. Parents are supported by experienced aunties, uncles and grandparents in the community and by baby health and parenting professionals. Parents graduate with a ceremony and certificate.
Positive Kids is delivered through the Cape York Aboriginal Australian Academy (CYAAA). The program works with parents to encourage positive behaviour management that optimises learning and prepares students for success in secondary school.
Strong Families supports families by helping parents to develop positive parenting skills so that they are able to meet the needs of their children. It engages families so that everything is done to ensure that families can stay together and stay strong.
468 The Triple P program is a parenting program operating in Queensland beyond the four trial communities.

Project performance summary
B.9
The purpose of the parenting program is to support parents to take responsibility and raise happy, safe and healthy children. Elements of this program have been developed in response to community engagement. The Positive Parenting Program is open to all parents and carers through individual consultations or group sessions.
Services provided generally include:
one-on-one parenting support
one-on-one structured parenting programs—based on the Triple P parenting model
family group parenting programs—based on the Triple P parenting model
group parenting programs—based on the Triple P parenting model
living skills support—including in-home support
support for mothers and grandmothers groups.
In April 2009, the CYWR Project Board approved CYP as the purchaser of parenting services for the four welfare reform communities, and funding for the CYP parenting program was approved on 29 May 2009. The parenting program offered through CYP has been available in Coen, Mossman Gorge and Hope Vale since September 2010. In July 2011, the Aurukun Parenting Program, which until then had been run through the Aurukun Shire Council, was transitioned to CYP. There had been a one-year delay in operationalising the parenting services because communities initially lacked the capacity for local delivery and there had been several funding variations, so in that interim period the existing service in Aurukun continued and parenting programs were designed for the three remaining communities, which did not have existing programs.
Parenting services are based at the village opportunity hubs in Coen and Mossman Gorge, at the purpose-built parenting centre at Aurukun and at the old Opportunity Hub, which was converted into a purpose-built parenting hub in Hope Vale. All participants in the parenting program are Aboriginal and/or Torres Strait Islander.
Since the April 2009 agreement, intensive effort has been invested in developing parenting programs to be delivered by appropriately qualified providers.
The Aurukun Parenting Program run through the Aurukun Shire Council prior to July 2011 operated under a different service agreement, with different performance measures. Reporting under the program was inconsistent, and recruitment and retention of staff were challenging for the council. Due to this, data on the performance of the Aurukun Parenting Program is not available for the period prior to the transition to CYP in July 2011.
Performance information
Data for the Positive Parenting Program begins from September 2010, when the parenting program was implemented by CYP in all communities except Aurukun. Data for Aurukun begins in July 2011.
Table B.6 provides a breakdown of the active case plans or support plans per community from September 2010 to December 2011. The number of active case plans increased from 13 in July 2010 (in all communities except Aurukun) to 108 in December 2011 in the four communities.

Cape York Welfare Reform—Evaluation
B.10
Table B.6 Active case/support plans, per community, September 2010 to December 2011
Community Sep 10 Oct–Dec 10 Jan–Mar 11 Apr–Jun 11 Jul–Sep 11 Oct–Dec 11 Coen 3 7 21 17 11 15 Hope Vale 8 15 32 27 31 23 Mossman Gorge 2 10 12 19 50 25 Aurukun N/A N/A N/A N/A 41 45 Total 13 32 65 63 133 108 Note: The figures in the table are running totals; i.e. new and existing clients minus the number of clients who have completed their program. Source: Performance and output reports, Queensland Government Department of Communities, September 2010 to December 2011.
Retention and recruitment of qualified staff to deliver the program have been an ongoing concern in all communities, and this has resulted in an inconsistent level of support being available to community members. Retention and recruitment of staff have improved in all communities.
In Coen, linkages with outside agencies, particularly the school, have resulted in greater voluntary participation in the Positive Parenting Program. The majority of clients seeking information on the parenting program have heard about the program from other clients469 and through the opportunity hub, where individuals accessing other projects have taken the opportunity to speak with the parenting consultant. Many have used this confidential approach to accessing parenting information to avoid perceived stigma.
The parenting program in Hope Vale gained positive momentum at the beginning of 2011. The new opportunity hub setting provided an opportunity for community people to access information by reading notices displayed inside the office and by taking away brochures. Parenting consultants were usually available to speak to community members briefly, encouraging them to make an appointment to return for a more in-depth information session or to discuss specific parenting concerns. Consultants attended local community forums to display and hand out flyers and Triple P tip sheets, promoting the Positive Parenting Program. Family members of existing clients also began to show interest in the program.
Attendance and engagement of Mossman Gorge residents began to increase in 2011 as people became more informed about the parenting program in their community. The local consultant spent dedicated time interacting in the community by visiting homes and community groups promoting the service. Staff changeover in the community resulted in limited services in the last quarter of 2011.
Case plan numbers are not available for Aurukun prior to the transition of the parenting program to CYP. There were some staffing issues in Aurukun at the start of the transition to CYP as the service provider; however, the opportunity hub was able to provide additional support to all registered clients when that was required.
B.1.4 MPower (previously Family Income Management)
From January 2008 to March 2011, the CYWR money management service was delivered under the Family Income Management (FIM) program. From April 2011, FIM transitioned to MPower. MPower is a free and voluntary money management service designed to assist individuals and families to meet their basic material needs, to develop financial literacy and to build assets. MPower is delivered through the opportunity hubs in the four CYWR communities of Aurukun, Hope Vale, Coen and Mossman Gorge. MPower evolved from the former money management service—FIM. MPower was trialled in Aurukun from 3 May 2011 and in the other three welfare reform communities from 6 June 2011, and was fully operational in all communities by July 2011. MPower extended FIM from a skill and capability development service to a fully integrated money management program that embedded key behavioural change elements of welfare reform: responsibility, capability, access, and incentives.
469 CYP refers to clients as ‘principal partners’—Aboriginal people who engage with Cape York Partnerships to take up an opportunity product or service.

Project performance summary
B.11
MPower provides clients with access to (emergency) transactional support and training in specially designed money management tools to improve their money management capabilities. MPower planning helps clients with budgeting and goal setting and ongoing coaching sessions that support them to meet their commitments and achieve their plans. MPower also operates an iBank kiosk facility that offers independent or assisted access to telephone and internet banking. A Wisebuys program has also been introduced, providing a portal for online shopping so that clients can purchase goods, including food, at a reasonable price and source affordable freight services for the delivery of goods to their homes.
Under the CYWR, MPower is a primary referral point for the FRC. Clients may be referred to MPower services by the FRC on a voluntary or mandatory basis, and MPower provides the FRC with feedback on client participation and progress.
The objectives of MPower are to:
enable families to manage money so that basic material needs (food, clothing, shelter etc.) are covered
engage families to manage money as a means of tackling addictions to alcohol, drugs and gambling and to develop alternative ways for people to express cultural reciprocity
rebuild social norms and capabilities through financial literacy
enable families to build assets and realise aspirations through saving and disciplined money management
take the stress out of money management
establish mechanisms for government and philanthropic agencies to make direct investments into opportunity products.
Performance information
Because reporting methods and data collection may have changed during the transition of FIM to MPower, the data in tables B.7 and B.8 may not be comparable and, although it is not clear from the quarterly reports, there may also be differences in the definition of ‘participants’.
Table B.7 shows the number of active FIM participants for each of the CYWR communities from January 2008 to March 2011. Table B.8 shows the number of FIM clients immediately before the transition to MPower and at the end of the quarter after the transition (June 2011). The transition occurred on 3 May 2011 in Aurukun and 6 June 2011 in Coen, Hope Vale and Mossman Gorge. Due to changes in the MPower reporting format, participant numbers are not available after June 2011.
Table B.7 Active FIM participants, by community, January 2008 to March 2011
Community Jan–Jun
08 Jul–Dec
08 Jan–Jun
09 Jul–Dec
09 Jan–Mar
10 Apr–Jun
10 Jul–Sep
10 Oct–Dec
10 Jan–Mar
11 Aurukun 248 294 359 416a 439a 450a 487 487 364 Coen 237 253 254 250 271 170 276 276 50 Hope Valeb 250 114 130 107 107 144 169 169 124 Mossmanc 192 162 155 156 156 56 103 103 65 Total 927 823 898 513 534 370 1,035 1,035 603 a These figures include a small number of participants in Napranum from July 2009 to the project’s closure in Napranum on 30 June 2010. b Data for the Hope Vale site also includes Cooktown clients. From July 2009, FIM provided remote servicing to existing Cooktown clients only, via the
Hope Vale office. c Data for Mossman Gorge also includes a significant number of people who live in Mossman Township. Note: The data periods for 2008 and 2009 are half-yearly; from 2010 onwards, data are reported quarterly. Source: FIM, quarterly progress reports, January 2008 to March 2011.

Cape York Welfare Reform—Evaluation
B.12
Table B.8 FIM-transitioned and new participants to MPower, by community, April 2011 to June 2011
Community Ex-FIM clients New clients Total MPower clients Aurukun 169 19 188 Coen 17 2 19 Hope Vale/Cooktowna 29 3 32 Mossman Gorgeb 36 4 40 Total 251 28 279 a Data for the Hope Vale site also includes Cooktown clients. From July 2009, FIM provided remote servicing to existing Cooktown clients only, via the
Hope Vale office. b Data for Mossman Gorge also includes a significant number of people who live in Mossman Township. Source: FIM, quarterly progress reports, April 2011 to June 2011.
FIM faced many issues and challenges that affected client participation. FIM reported that retention and recruitment of staff had had an impact on client participation levels. In December 2010, three of the four communities received an increase of from one to three new staff members. Aurukun had the highest increase (three staff) and the highest recorded participation (487 participants). Mossman Gorge did not receive any new staff and had the lowest recorded participation—103 clients at December 2010 (Table B.7).
FIM reported that there had been a slow uptake in services by people referred by the FRC. In Aurukun, Coen and Hope Vale, FIM engaged with consultants to follow up with people referred by the FRC and had a dedicated presence at FRC hearings. These targeted client-focused strategies directed at FRC clients may have influenced the increase in client participation recorded over this time.
Initially, FIM reported that many of these communities did not have local access to a variety of services, including banking facilities, ATM machines and Centrelink agencies, and had difficulty setting up internet banking and savings accounts over the phone due to poor English language skills and privacy issues.470 Over the second half of 2010, the participation of FIM clients in the communities of Aurukun, Coen and Hope Vale peaked. The development of stronger relationships, partnerships and arrangements with the banks that made it easier for clients living in these communities may have contributed to the increase.
Pride of Place (POP), introduced in late 2009, may have also have contributed to the increase. Elder abuse and ‘humbugging’471 was a major issue, as relatives would often take away money and goods that clients had purchased. FIM began to transition clients from general ledger systems to banking and ‘lockable’ accounts to make humbugging more difficult.
In April–June 2010, Mossman Gorge reported a decline in the population who had moved out of the community due to a lack of housing and transportation and who had not been able to access FIM services. Action was taken to improve accessibility to other welfare reform activities in Mossman Gorge, but this improvement was not reflected in its participation rate of 56 clients—the lowest of the four communities.
The transition of FIM to MPower from April 2011 saw a significant drop-off in the number of active participants signed up to the money management service: only 42 per cent of FIM clients transferred to the new MPower program and there were low numbers of new sign-ups (Table B.8). This drop in participation is attributed to the general disruption of a transition period, as well staff shortages and the need to train all staff in new procedures. In future quarters the focus will shift to promotional activities and capacity building in each of the CYWR communities, and sign-up is expected to increase. Other impacts on the data may include changes in reporting methods and the level and quality of data collection; however, this is not clear from the quarterly reports.
470 Several banks refused to cooperate when told that MPower was helping clients open accounts and urged clients to attend a branch to open their account despite living in a remote community. 471 Humbugging is the practice of demanding money or goods from relatives.

Project performance summary
B.13
B.1.5 Wellbeing Centres The Wellbeing Centres are funded by the Australian Government Department of Health and Ageing with operational funds provided by the Queensland Government. Although the funding is external to the trial, Wellbeing Centres are formally recognised as a key enabling project in the 2008 Project Board Agreement.
Wellbeing Centres have been established since 2009 and are operated by the Royal Flying Doctor Service in all four trial communities. The aim of Wellbeing Centres is to provide mental health, alcohol and drug services which are focused on developing a holistic care plan for each client, including a clinical assessment and counselling, case coordination and referral services. People can self-refer to the Wellbeing Centres or may be referred by the FRC.
The model emphasises flexible services for individuals and their families, delivered directly from the Wellbeing Centres or from other locations (e.g. homes, schools and outstations). To enhance local autonomy and decision-making in the operational aspects of the Wellbeing Centres, local advisory groups, which have local Aboriginal and Torres Strait Islander community members, have been established in an advisory role.
Performance information
Table B.9 shows that at the end of December 2011 there were 441 active Wellbeing Centre clients, 21 per cent (93 people) of whom had been referred to the service by the FRC. The remainder accessed Wellbeing Centres through self-referral, family referral or other agency referral.
Table B.9 Active Wellbeing Centre clients, by community, December 2011
Community Total clients Number referred by the FRC Per cent referred by the FRC Aurukun 181 44 24.3% Coen 72 8 11.1% Hope Vale 116 27 23.3% Mossman Gorge 72 14 19.4% Total 441 93 21.1% Source: DoHA, Wellbeing centres monthly report, December 2011.
A full evaluation of the Wellbeing Centres in Cape York conducted from November 2011 to June 2013 will provide an evidence base for determining whether this service is improving the life outcomes of individuals in remote Indigenous communities.
B.1.6 Community Action Fund
CAF provides independent financial support to individuals and groups in the four CYWR communities for activities that promote volunteerism and build positive social norms, such as:
taking personal responsibility
developing positive and supportive relationships
promoting healthy living.
The CAF initiative falls under the Social Responsibility stream of the CYWR trial. The 2008 Project Board Agreement states:
The voluntary sector needs to be encouraged to allow greater role-modelling and ‘social capital’ to be built. Within healthy communities, voluntary groups like mothers’ groups, sporting teams and church groups are vital ways of building communities: they allow younger people to learn from others, relationships of trust to be developed and for social expectations to be made clear.

Cape York Welfare Reform—Evaluation
B.14
CAF is jointly funded by the Australian and Queensland governments and is administered by CYP. The total amount of funds for each of the four communities is:
$40,000 each for Aurukun and Hope Vale
$20,000 each for Coen and Mossman Gorge.
Australian Government CAF funds were notionally allocated to Hope Vale and Mossman Gorge, and Queensland Government CAF funds were notionally allocated to Aurukun and Coen. The CAF contribution limit for each project is $3,000.
Implementation
The CAF initiative, including associated funding, was approved by the CYWR Project Board on 27 October 2008. The original CAF process and application form were simplified and endorsed by the program office for rollout of the program on 22 January 2009. In April 2009, Cape York Partnerships for Welfare Reform received $60,000 in funding from the Queensland Government for CAF; the remaining $60,000 funding contribution was received from the Australian Government in June. The development of communication materials to assist local program offices (LPOs) to promote CAF was identified as a priority activity for the CYWR Communication Manager, who commenced on 27 May 2009. CAF communication materials were reconfirmed as a priority at the CYWR communication workshop in Cairns on 15 June 2009. In June, after reviewing the existing documentation available in relation to CAF and consulting with key stakeholders, the Communication Manager developed the following draft suite of communication materials:
CAF handbook for LPOs, including an objective, visual representation of the CAF process, and CAF guidelines
CAF application forms and sample application forms
CAF fact sheet
checklist for individuals or groups to assess whether their idea/activity meets the CAF criteria
posters encouraging community idea generation.
These communication materials were submitted to the program office for comment on 24 June 2009 and subsequently approved in early July. The materials were distributed to all LPOs between 22 and 28 July 2009. Communication advice about the CAF materials and their use was also provided to the Family Income Management consultants, to ensure a heightened level of awareness about CYWR initiatives among all stakeholders. Feedback received from LPOs about the CAF materials has been positive, indicating that the language and pitch of the material are appropriate.
Variation to CAF funding
As suggested by the Australian Government, in 2011 $144,809 of unspent funds from CAF were transferred to the Cape York Aboriginal Australian Academy School Readiness Full Service Case Management deficit, for expenditure in the 2010–11 financial year. Funding submissions in the CYWR communities were therefore put on hold from September 2011, and no funds were released during this time.
CAF program redesign in 2012
CAF was redesigned in late 2011 as the People Action Network, but was not implemented in 2012 as planned. While design work was being undertaken, no promotional activities were conducted for CAF.
CAF redesign work commenced, investigating the following areas:
identifying lessons learned from CAF and improvements that can be made

Project performance summary
B.15
developing measures to track CYP delivery to the People Action Network objectives
utilising the opportunity hub managers to drive and sit on the community forums
utilising the ABCD framework472 to conduct the People Action Network
researching the community groups currently active within Mossman Gorge, Aurukun, Hope Vale and Coen
delivering the People Action Network within CYP’s current resourcing numbers (noting the possible additional 0.5 FTE requirement for coordination of funds in Cairns)
basing the setup of community accounts on those accounts used for Pride of Place and Student Education Trusts
holding a co-design workshop with opportunity hub managers to discuss the People Action Network and how to drive volunteerism within the communities
preparing a first draft of the People Action Network concept design.
Reporting
Reports up to and including the first quarter of 2010–11 (July–September 2010) were done by the CYWR program office team. From October 2010, CYP took over this function. This transition may be the reason that participant numbers for projects during the second quarter of 2010–11 were not reported and also why the progress report for the third quarter of 2010–11 (January–April 2010) shows no activity.
Performance information
Table B.10 shows that 24 CAF grants were provided between January 2009 and December 2011, totalling approximately $49,823 and involving over 1,000 community members.
Table B.10 CAF performance data, by quarter, January 2008 to December 2011
Jan–Jun
09
Jul–Sep
09
Oct–Dec
09
Jan–Mar
10
Apr–Jun
10
Jul–Sep
10
Oct–Dec
10
Jan–Mar
11
Apr–Jun
11
Jul–Sep
11
Oct–Dec
11 Total $ expended (incl. GST)
2,846 5,809 10,451 2,000 6,770 9,897 6,500 – 2,550 3,000 – 49,823
# grants provided
1 2 5 1 3 4 5 – 2 1 – 24
# initiatives completed
1 2 5 1 3 4 5 – 2 1 – 24
# community members involved
76 550 157 11 66 37 5a – 3 100 – 1,005
a The number of community members involved was not reported for this quarter but is likely to have been higher than the number of applicants. Source: CAF, quarterly progress reports, January 2008 to December 2011.
In Aurukun, all four CAF applications were from the Aurukun Koolkan Early Childhood Centre and Family Support Hub. Funded activities were varied and included activities to support the understanding and expansion of child care services, as well as a Wik-Mungkan language program. In Coen, CAF was accessed only once. This application was from the Coen Community Dance Group and assisted with the cost of costumes and transport to perform at the Laura Dance Festival in June 2009. Mossman Gorge residents have accessed CAF three times. All three applications were to support local football teams in various activities, such as the All Blacks Carnival and the procurement of team jerseys.
472 ABCD is a framework, used to understand a present situation (A-space); find a purpose or vision for the future (B-space); invent, design and describe a pathway (C-space); and develop a program of actions to deliver how the vision will be achieved (D-space).

Cape York Welfare Reform—Evaluation
B.16
CAF activity in Hope Vale has accounted for the vast majority of overall CAF applications and funds expended, with 16 applications funded by CAF in Hope Vale since the program’s inception. CAF-funded activities in Hope Vale have been diverse, and applications from at least 13 different groups and individuals have been funded. Major activities included assistance with both individual and team sporting events, the Hope Vale Rodeo, community cultural events and participation in events outside of the community, such as the Country Music Festival and a school snow trip to Canberra.
In accordance with the CAF purpose of promoting social responsibility, applicants are also encouraged to make a financial contribution towards the activity they are seeking funding for. Throughout all four CYWR communities, individuals and groups have undertaken a variety of fundraising activities within their communities, including discos, raffles, talent quests, competitions, community sports events and family activity days, and have attracted donations and contributions from participants and local businesses.
B.2 Education stream CYWR fosters social development to expand the range of capabilities, and thus the range of choices, people have available to them. The foundation of social development is rebuilding norms associated with the care and education of children.
The design reports recommended that ‘demand’ for education could be increased by:
ensuring that incentives and laws support the wellbeing of children
providing supported self-help services to assist individuals to meet their parental responsibilities.
The measures recommended by the design reports to increase the demand for education should be complemented by measures to improve the ‘supply’ of education by:
improving the provision of education via MULTILIT (Making up Lost Time in Literacy).
increasing educational choice outside the communities by supporting mobility to attend boarding school.
Projects in the education stream include the attendance case management model, student education trusts and MULTILIT. These projects arose from the CYP Every Child is Special initiative, learnings from which were incorporated in the design reports. MULTILIT and MINILIT (Meeting Initial Needs in Literacy) were implemented in Coen, Hope Vale and Mossman Gorge from 2008 and Aurukun in 2009. In 2010, MULTILIT ceased in Aurukun and Coen and was replaced by the CYAAA. The CYAAA was implemented in Hope Vale from January 2011.
The project areas in the education stream that were set out in the 2008 Project Board Agreement are:
MULTILIT
attendance case management
student education trusts
ABSTUDY Mobility Provision.
The other project covered here is CYAAA.
B.2.1 MULTILIT (Making up Lost Time in Literacy)
MULTILIT was developed by the Macquarie University Special Education Centre. It is an evidence-based approach for teaching low-progress students who are experiencing difficulties in learning literacy skills. MULTILIT was trialled in Coen as part of the Every Child is Special initiative in 2005–06. MULTILIT was incorporated into the design of the trials to improve the quality of educational supply, with the aims of:

Project performance summary
B.17
closing the literacy achievement gap of Indigenous students
embedding outcomes-focused literacy instruction within the school
engaging families in improving literacy.
MULTILIT is a program for students aged three to seven years. For younger children, a MINILIT (Meeting Initial Needs in Literacy) program was adapted from MULTILIT for preschool to Grade 2 students.
Implementation during 2008 and 2009 involved establishing a MULTILIT tutorial centre in each school in the four communities and training MULTILIT teachers, who provide support directly to students who require additional literacy assistance. MULTILIT also included an after-school reading club for parents to read with their children and become engaged with their education.
Performance information
Enrolments of students in MULTILIT and MINILIT in each community per semester from Semester 1 2008 to Semester 2 2010 are shown in Table B.11. MULTILIT and MINILIT were funded and staffed to take on a maximum of 13 and 8 students, respectively, per semester. The students were selected for entry into the MULTILIT and MINILIT programs based on results from reading progress tests, completed by all available students at each school. Students targeted for entry into the program were shown to be about three to four years behind their average age peers in terms of performance on the measures of reading and related skills.
Enrolment in some semesters dropped over the course of the semester due to children moving out of the community. In some other cases, because there were fewer eligible students than positions available, maximum enrolment numbers were not reached.
Table B.11 MULTILIT and MINILIT enrolments per semester, by community, 1 January 2008 to 31 December 2010
Semester Aurukuna Coen Hope Vale Mossman MULTILIT MINILIT MULTILIT MINILIT MULTILIT MINILIT MULTILIT MINILIT 1 2008 n/a n/a 12 8 12 8 12 8 2 2008 n/a n/a 10 8 12 8 12 8 1 2009 12 8 13 7 12 8 13 8 2 2009 13 8 13 6 12 8 13 8 1 2010 CYAAA CYAAA CYAAA CYAAA 10 8 13 8 2 2010 CYAAA CYAAA CYAAA CYAAA 10 8 13 7 n/a = not applicable a Implementation of MULTILIT and MINILIT was delayed in Aurukun and did not commence until Semester 1 2009. Source: MULTILIT in Cape York Schools progress reports: Semester 1 2008 – Semester 2 2010.
The reading club was attended by both MULTILIT and MINILIT students, as well as other school students. The club commenced on 22 October 2008 in Coen and Hope Vale and on 26 March 2009 in Aurukun, and commenced informally in Term 1 2009 in Mossman Gorge due to delays in finding an appropriate venue. Despite extensive community engagement on attendance and participation, the involvement of family and community members in reading club activities was disappointing. While some community members expressed initial interest, competing commitments such as work and caring responsibilities resulted in poorer than expected participation rates. The overall attendance of students in reading club activities was also below expectations: many students attended sporadically, depending on other activities that were taking place in the community at the same time, and also notably on the weather, with lower attendance on days that were very hot or very wet. Despite these difficulties, attendance numbers did show improvement over the course of the program.

Cape York Welfare Reform—Evaluation
B.18
B.2.2 Cape York Aboriginal Australian Academy The CYAAA is a not-for-profit organisation, implemented in partnership with Education Queensland. The CYAAA incorporates three distinct but related learning domains:
Class: dedicated to teaching the mainstream curriculum in English literacy and numeracy
Club: enriching extracurricular artistic, musical and sport programs
Culture: comprehensive Indigenous culture and language programs.
The academy also places strong emphasis on community involvement in education, attendance, school readiness, parental participation, child health and wellbeing.
A major innovation of the academy is the implementation of ‘Direct Instruction’, an evidence-based, explicit instruction method proven to be highly effective in the teaching of literacy and numeracy to mainstream and disadvantaged children in Australia and internationally.
The CYAAA also has longer than standard school hours. The school day begins at 7.15 am with breakfast for all students. Club and/or culture activities are held from 2.30 pm to 4.45 pm each day.
Performance information
Table B.12 shows the numbers of students at or above grade-level literacy and numeracy in Aurukun and Coen from January 2010 to November 2011, and in Hope Vale from January 2011 to November 2011.
Table B.12 Students at or above grade-level literacy and numeracy, January 2010 to November 2011
Campus Total enrolled
(approx)
Students at or above grade level literacy
Students at or above grade level numeracy
Jan 10 Nov 11 Jan 10 Nov 11 Aurukun 201 0 61 0 82 Coen 40 1 17 2 20 Hope Valea 129 1 64 3 33 Total 370 2 142 5 135 a Hope Vale’s results are from January 2011. Source: CYAAA Progress Report, Semester 2 2011, and CYAAA key results briefing, September 2011.
The number of children at or above grade level in literacy and numeracy has increased substantially since the implementation of the CYAAA in Aurukun, Coen and Hope Vale.
In January 2010 no students were at or above grade level in literacy or numeracy in Aurukun. By November 2011 the number of students at or above grade level had increased to 61 students in literacy (29.9 per cent of total enrolled students), and 82 students in numeracy (40.8 per cent of total enrolled students).
Coen saw similar increases over the same period. The number of students at or above grade level in literacy increased from one student in January 2010 to 17 students (43.5 per cent of total enrolled students) in June 2011. Similarly, numeracy rose from two students at or above grade level in January 2010 to 20 (50 per cent of total enrolled students) in June 2011.
In the 11 months from January 2011 to November 2011, Hope Vale increased the number of students at or above grade level in literacy from one student to 64 students (49.6 per cent of total enrolled students). The number of students at or above grade level in numeracy in Hope Vale also rose, from three students in January 2011 to 33 students at November 2011 (25.6 per cent of total enrolled students).

Project performance summary
B.19
B.2.3 Attendance Case Management Framework (Student Case Management)
The design reports outlined an Attendance Case Management Framework (ACMF), now known as Student Case Management, which uses a behavioural management approach to set a community-wide expectation of 100 per cent attendance by all students at school. Student case managers are based in schools in each CYWR community and work with parents, students, schools and the broader community to set and meet the expectation of 100 per cent attendance. The project is underpinned by a belief that tackling the student attendance problem requires intensive work with both parents (to ensure their child attends school) and schools (to ensure they supply education for the full school day).
CYP has been funded to implement the ACMF. During the first half of 2008, CYP began to recruit and deploy staff and undertake community consultations in Coen, Hope Vale and Mossman Gorge. It conducted a ‘dry run’ in the second school term. Full implementation of the model commenced on 1 July 2008, coinciding with the implementation of the FRC across the CYWR communities. Implementation of the model in Aurukun was delayed by school management and started in January 2009.
Components of the ACMF were previously trialled in the Coen community under the Australian Government’s Department of Education, Training and Employment and CYP’s Every Child is Special trial, which ran between 2004 and 2007.
Student case managers visit parents if a student is late to or absent from school. If the student has three unexplained absences, the principal must report them to the FRC. The case managers make referrals to support services. The ACMF provides support to the communities by aiming to create the social norm of 100 per cent school attendance, thereby reducing the number of parents called before the FRC in relation to their child’s unexplained absences from school, and to prevent subsequent attendance breaches. In addition, case managers provide relevant data to schools in support of their reporting requirements to the FRC. Case managers also give reinforcement and recognise good attendance.
Food clubs have also commenced operations in Aurukun, Mossman Gorge and Hope Vale, providing students with healthy, nutritious meals for breakfast and lunch paid for by parents. This is part of school readiness measures to ensure that children are fed and ready to learn every day.
Performance information
Coen
The overall attendance rate of students in Coen remained high and fairly stable over the course of the trial. The percentage of absences (both full and part day) that were reasonably explained rose from 47.4 per cent of all absences in Term 4 2008 to 73 per cent in Term 4 2011. Similarly, the proportion of unexplained or unreasonably explained absences declined from 52.6 per cent to 27 per cent of all absences over the same period.
The top four reasons for absenteeism between Term 3 2008 and Term 4 2011 were illness of the child, family out of community for leisure/family reasons, funeral/bereavement, and child slept in/missed the bus.
Implementation
Coen implemented the ACMF from Term 1 2008. It has one student case manager. In Term 2 2010, Coen handed over the role of case management to the school due to consistent positive attendance. However, this decision was overturned in Term 2 2010 in order to maintain a consistent approach within all participating schools. By the end of Term 4 2010, the Coen case manager position had been made redundant. Since then, Coen had been covered by a floating case manager.

Cape York Welfare Reform—Evaluation
B.20
In Term 3 2009, a formal sign-in/sign-out system for students was established for the purposes of recording and managing short-term absences.
A school nurse was due to commence work at Coen in term 2 2011. However, accommodation issues have delayed the start date for this role.
Options for food clubs were being discussed with parents in Term 3 2010. In the interim, the case manager provided lunches each day for any student who did not have a lunch option.
Mossman Gorge
The percentage of absences (both full and part day) reasonably explained has varied significantly over the past three years, reaching a maximum of 69.6 per cent in Term 4 2008 and a minimum of 29 per cent in terms 1 and 2 2011. In Term 4 2011, 43 per cent of all absences were reasonably explained: the remainder were either unexplained or unreasonably explained.
The top four reasons for absenteeism between Term 3 2008 and Term 4 2011 were illness of the child, child is truant, child slept in/missed the bus, and family out of community for leisure/family reasons.
Implementation
Mossman Gorge implemented the ACMF in Term 1 2008. It has one student case manager.
In Term 2 2008, school readiness strategies were implemented in all communities. In Mossman Gorge, this involved a small number of parents leaving breakfast supplies at the school as a food emergency kit. The school principal and the case manager have worked together to implement anti-bullying and teasing strategies. Mossman Gorge, like Coen, has a formal sign-in/sign-out system in place for recording and monitoring short-term absences.
Food club began in Term 1 2010 and has experienced significant success, with all students signed up.
Hope Vale
In Hope Vale, the percentage of absences (both full and part day) reasonably explained has varied significantly over the past three years, reaching a maximum of 76.3 per cent in Term 2 2010 (but immediately preceded by a minimum of 19 per cent in Term 1 2010). In Term 4 2011, the percentage of absences reasonably explained accounted for 27 per cent of all absences; 73 per cent were either unexplained or unreasonably explained.
The top four reasons for absenteeism between Term 3 2008 and Term 4 2011 were illness of the child, child slept in/missed the bus, family out of community for leisure/family reasons, and funeral attendance/bereavement.
Implementation
Hope Vale implemented the ACMF in Term 1 2008. Currently, it has two student case managers. There were some initial difficulties relating to adherence to FRC guidelines, as Hope Vale did not enforce the 30-minute threshold for part-day absences. However, this was resolved by Term 2 2008. Roll-marking processes were tightened in Term 1 2011 to align with Education Queensland’s roll-marking policies.
Hope Vale also introduced a formal sign-in/sign-out system in the last quarter of 2009.
By Term 2 2011, a food club had been established. It provides lunches for approximately 40 students each day.
Project performance summary
B.21
Aurukun
The overall attendance rate in Aurukun has increased over the course of the trial. Despite this, the percentage of absences (both full and part day) that were reasonably explained remained very low, increasing only marginally from 5.9 per cent in Term 2 2009 to 10 per cent in Term 4 2011. The remaining 90 per cent of absences were either unexplained or unreasonably explained.
The top reasons for absenteeism between Term 2 2009 and Term 4 2011 were recorded as illness of the child, child slept in/missed the bus, no explanation offered/available, explanation pending, and child is truant.
Implementation
Aurukun implemented the ACMF in the last quarter of 2008 when two student case managers commenced work. However, weekly roll data was not allowed to be collected directly by the case managers due to conflict between the ACMF case managers and school management. This was rectified in the final quarter of 2009, when case managers were allowed to mark an attendance roll twice daily. Roll-marking processes were changed to align with Education Queensland’s roll-marking policies. With the introduction of the CYAAA, a new school principal commenced in Term 1 2010, bringing commitment to the value of the ACMF.
In Term 1 2010 Aurukun experienced staff shortages, which affected data collection. Staff shortages and lack of staff accommodation also occurred in Term 2 2011. They remain a challenge. The use of a Cairns-based floating case manager to back-fill roles has ensured the continuity of the project.
The school readiness proposal was also introduced in Term 1 2010. Case managers make observations of school readiness incidents, such as which students are attending food club.
In Term 3 2010, the CYP-run Aurukun Food Club began operations with healthy sign-up rates. A school nurse, working directly for CYAAA, also started.
During Term 2 2010, FRC attendance guidelines were replaced by new guidelines, which had an impact on the recording of school attendances during funerals and bereavement. The new guidelines affected all communities.
In the final term of 2010, case managers made parent visits, covering all unexplained absences across all four welfare reform communities. This was the first time since the inception of the project that this had been achieved and required approximately 3,000 visits throughout the term.
In Term 3 2011, a school-based youth health nurse commenced work at Aurukun in partnership with Queensland Health. A school nurse, working directly with CYAAA, had previously been employed in Term 3 2010, but she had resigned in the following term.
B.2.4 Student Education Trusts
Student Education Trusts (SETs) is a voluntary money management service aimed at helping to rebuild parental responsibility and establish a social norm that parents, with some planning, can afford to meet their child’s education needs from ‘birth to graduation’. SETs also works with education and child development services to set appropriate expectations of a child’s needs with families and works with education suppliers to improve family access to educational goods and services.
SETs supports parents to budget, plan and save for their child’s education expenses. Parents and carers make regular SETs contributions to their child’s trust account. Money can be withdrawn from the account to meet immediate education-related expenses or saved for future costs (such as the high costs associated with sending a child to boarding school). The positive effect of this is that no child need be disengaged from education due to limited resources. SETs consultants work with

Cape York Welfare Reform—Evaluation
B.22
educational institutions to establish as a ‘social norm’ the principle that parents can afford to meet their child’s education needs and to ensure that parents are given the responsibility to do so.
SETs was initially trialled in Coen under the Every Child is Special trial that ran between 2004 and 2007. SETs was launched as a part of the CYWR trial from Quarter 1 2008 in Coen, Mossman Gorge and Hope Vale. Implementation in Aurukun was postponed until August 2008 because of lack of support from school management.
SETs was operated by CYP until Quarter 1 2010, at which point it transitioned to the CYAAA. As of Quarter 2 2011, a full review of the SETs project was underway. It included reviews of the future direction of SETs and its processes and procedures and roles and responsibilities. As a result of this process, from Quarter 1 2012, the project was moved back under the management of CYP to be integrated into the functions of the opportunity hubs in each community. As a result of these transitions, changes were also made to the level of reporting.
Key functions
Central to the SETs model is the financial counselling SETs consultants473 provide to donors to ensure they continue to save the appropriate amount of funds and make the appropriate purchases of goods and services to support their child’s education needs. SETs consultants and case managers contact parents who have outstanding contributions by telephone or letter, and follow up with household visits in cases that require ongoing management.
A further function of SETs is to source high-quality educational items at a reasonable price, and to make them readily available in communities. Each year SETs holds book, toy and school supply fairs in each of the four CYWR communities as needed. The fairs are used not only to boost sign-ups, but to increase access to educational items for donors and to educate parents in the use of and need for educational books, toys and school supplies. In line with this, SETs also works with community stores and schools to increase the supply and quality of school supplies, educational toys and uniforms that families can purchase locally.
The main items purchased through SETs include school uniforms, books, stationery and other educational items such as laptops, school fees, backpacks, lunchboxes and school shoes. SETs can also be used for extracurricular activities such as dance classes, sports, graduation attire, school photos and school excursions, as well as the payment of day care or after-school care fees.
SETs staff also liaise with transition support officers and boarding school staff to gain a better understanding of the savings requirements for boarding schools and the best use of trust funds, including resource requirements, price lists and dates for relevant expenditure items (such as school trips). Over time, implementation of SETs has become more integrated into MPower and the work of the student case managers.
Performance information
Coen
The number of SETs accounts in Coen increased steadily over the three years from Term 1 2008 (108 SETs accounts) to Term 4 2011 (151 SETs accounts). Of the 151 SETs accounts at Term 4 2011, 129 were in the SETs target group. An additional four SETs account holders were active in further education, and 18 SETs accounts were non-active.474
473 Since the introduction of MPower, SETs consultants are now MPower consultants. 474 The SETs target group includes children from birth to the end of secondary school. Further Education Active: these students have finished secondary school and are active in further education. Further Education Non-Active: these students have left school but are not currently enrolled in further education. These SETs accounts remain open to allow students to use the funds should they wish to continue with their education; however, no financial consultation currently occurs. Youths who have finished secondary school, including those who have active/non-active SETs accounts, are not included in the SETs target group and do not count towards the target group with SETs accounts.

Project performance summary
B.23
Implementation
As SETs was initially trialled in Coen between 2004 and 2007, the majority of the SETs target population had already been signed up at the commencement of the project, and new sign-ups were limited to new-born babies and children moving into the community.
In Quarter 4 2008, changes to CDEP resulted in a significant negative impact on donor contributions in Coen. People who did not reapply for their CDEP jobs lost their places on CDEP. People who did reapply needed to re-sign deduction forms to allow SETs payments to continue. SETs was not aware that these changes were taking place and therefore did not have sufficient personnel in place to arrange for deduction forms to be re-signed. By Quarter 1 2009, SETs consultants had visited donors whose contributions ceased in Quarter 4, and many contributions were then restarted.
Mossman Gorge
The number of SETs accounts in Mossman Gorge more than doubled over the three years from Term 1 2008 (43 SETs accounts) to Term 4 2011 (109 SETs accounts). Of the 109 SETs accounts, 106 were in the target group and a further three were further education non-active. The target group with a SETs account had risen from 18 per cent at Term 3 2008 to 71 per cent at Term 4 2011.
Implementation
The SETs figures for Mossman include both Mossman Township and Mossman Gorge. While Mossman Township is not a part of the CYWR trial, SETs sought and received approval to allow Indigenous families in Mossman Township to participate in the project. This request was in response to a number of families in Mossman Township expressing interest in participating in SETs.
Levels of expenditure at the early childhood level of SETs are particularly high in Mossman as a result of SETs being used to cover day-care and after-school care fees. The use of SETs for this purpose is particularly high in Mossman, as day-care fees are higher in that community than at the other three trial sites.
Hope Vale
Hope Vale has experienced a large increase in the number of SETs accounts since the program’s inception, from four SETs accounts in Term 1 2008 to 168 in Term 4 2011. Of the 168 SETs accounts in Term 4 2011, 165 were in the target group and a further three were further education non-active. This raised the proportion of children in the target group with a SETs account from 4 per cent at Term 3 2008 to 60 per cent at Term 4 2011.
Implementation
In Hope Vale, the existing school nutrition program was a key challenge to SETs take-up. The program, while largely focused on meals, also included school uniforms. There was confusion in the school and within the community about the two programs and whether families could afford both. SETs worked with FIM (now MPower) and the school to educate families on the differences between the nutrition program and SETs; however, this approach was largely unsuccessful, and most parents advocated that there should be one program that did both.
As a part of the WRAP Education DEED475 negotiations in 2008, the school agreed to separate the materials component of the nutrition program by January 2009. Until then, SETs sign-up focused on those not participating in the nutrition program, including parents of babies and toddlers. In late 2008, SETs commenced the sign-up of parents involved in the nutrition program to allow them to save sufficient funds to be able to purchase school uniforms and books in time for the new school year in 2009.
475 The WRAP DEED is a MOU between the Queensland Government, individual schools and CYP. It was drafted by Education Queensland in conjunction with the Education stream partners to address the need for a consistent and policy-driven approach to the implementation of Education stream projects and to ensure all partners understood the detail of what they were committing to.

Cape York Welfare Reform—Evaluation
B.24
Sign-ups of parents with children transitioning to boarding schools were also hampered, as parents presumed that ABSTUDY would pay for boarding school costs and were not willing to immediately re-sign up to SETs for the next school year.
Aurukun
Aurukun also saw a major increase in the number of SETs accounts over the three years from Term 3 2008 to Term 4 2011, from 13 SETs accounts in Term 3 2008 to 240 in Term 4 2011. Of the 240 SETs accounts, 238 were in the target group, increasing the proportion with a SETs account from 4 per cent in Term 3 2008 to 87 per cent in Term 4 2011.
Implementation
Implementation of the Aurukun welfare reform education initiatives, including SETs, was postponed while waiting for the implementation of necessary local infrastructure and agency alignment. The two key reasons for the postponement of SETs included the following:
The Western Cape College Aurukun already had a system in place in which Centrepay deductions from welfare payments went directly to the school to meet the cost of meals and school equipment.
Issues of classroom availability, staff accommodation and school buy-in needed to be resolved before implementation could take place.
After implementation in August 2008, the parental financial support system for Western Cape College Aurukun remained as a key challenge to the uptake of SETs in Aurukun. Parents saw no value in contributing to SETs accounts while school uniforms and stationery were already covered by current deductions. After ongoing discussions with Western Cape College Aurukun, a new food program that only included food was introduced in Term 3 2010.
B.2.5 ABSTUDY Mobility Provision
The design of the CYWR required ministerial approval to allow all secondary students to be eligible for ABSTUDY and ABSTUDY Away from Home payments should they decide to attend a school outside their community, provided that they met other eligibility criteria for ABSTUDY. This approach was intended to improve opportunities for students, as students in remote communities either entirely lack access to local state high schools or lack choice in schooling even if there is a local state high school. This provision has sometimes been referred to as the ‘ABSTUDY bypass’ provision, as it enables students in the designated welfare reform trial communities to ‘bypass’ a school to which they may have reasonable access in order to attend another school of their choice.
Performance information
Table B.13 shows the number of secondary school students in the CYWR communities who received ABSTUDY ‘away-from-home’ living allowance and those who received an ‘at home’ payment between 2008 and 2012. Numbers are not shown by community due to the small cell sizes (less than 20). The number of students receiving Away From Home (whole year) and Away From Home (part year) allowances in aggregate rose from 136 in 2008 to 171 in 2009 and was 149 in 2012. There was a decline in numbers receiving At Home allowance over the five year period shown. In most years, around two thirds of students received Away From Home benefits for the whole year.

Project performance summary
B.25
Table B.13 Number of secondary students in Aurukun, Mossman Gorge, Coen and Hope Vale receiving ABSTUDY At Home or Away From Home benefits in the calendar years 2008 to 2012
ABSTUDY secondary students in all four communities 2008 2009 2010 2011 2012 At Home (never away from home) 82 75 62 69 50 Away From Home (whole year) 83 129 100 90 83 Away From Home (part year) 53 42 57 51 66 Total 218 246 219 210 199 Source: Data provided by DEEWR based on Centrelink administrative data, DEEWR extract.
B.3 Economic Opportunity stream The design reports describe welfare reform as a process of moving from passive welfare dependence to engagement in the real economy. This includes individual engagement in labour markets, private property ownership and limiting the role of governments in people’s lives so that it is similar to that experienced by people living in mainstream Australia.
There are two elements of the Economic Opportunity stream: the employment element and the economic development element.
The project areas in the Economic Opportunity stream set out in the 2008 Project Board Agreement are:
CDEP reform and enhanced employment services (real full-time jobs)
mobility assistance
business support services (mentoring and up-skilling)
business precincts and lighthouse projects.
Other projects covered here are Queensland Government initiatives.
B.3.1 Employment The design reports argued that a ‘welfare pedestal’ exists in Cape York communities, where the structure of incentives encourages people to obtain welfare and remain on it. A particular concern of the design reports was that young people aspired to be on CDEP rather than getting real jobs or pursuing further education. Similarly, the reports noted that Indigenous people in the communities were disengaged from the real economy despite low unemployment nationally during 2007. The reports proposed that incentives be restructured to support individual engagement in the real economy via:
CDEP reform, including measures to address CDEP cross-subsidisation and to limit entry by young people to CDEP
better linkages between CDEP and employment services, with more on-the-ground staffing of employment services to improve supervision and case management
the development of mobility schemes to jobs outside communities.
CDEP reform
Between 1 November 2008 and 30 June 2009, as responses to proposals in the design reports, preliminary reforms to CDEP were implemented in the four participating communities of Aurukun, Coen, Hope Vale and Mossman Gorge. The preliminary reforms were:
increased Structured Training Employment Projects (STEP), focused on improving work readiness

Cape York Welfare Reform—Evaluation
B.26
transitioning 94 CDEP positions into salaried jobs in Australian Government and Queensland Government service delivery
closure of CDEP to new entrants or readmissions from 1 November 2008 to 1 July 2009
all CDEP participants to maintain an active Job Network registration.
Conditions for CDEP participation were also changed in the four welfare reform communities. Specific changes enabled the FRC to give force to its rulings for CDEP participants. Since 1 November 2008, all CDEP participants have had to sign forms acknowledging that they will cooperate with the FRC as an eligibility condition for continuing with CDEP. Cooperation involves such things as attending FRC conferences and acting on agreements reached with the FRC. If the CDEP participant does not cooperate, the FRC advises the Cairns Indigenous Coordination Centre, which investigates whether the person has failed to meet the eligibility conditions for participation. If that is the case, the person is exited from CDEP and they may become ineligible to participate in CDEP for 12 months.
Following those reforms, national reforms to CDEP took place from 1 July 2009. They involved the closure of CDEP activities in all non-remote locations, which led to the closure of CDEP in Mossman Gorge. Receipt of CDEP wages began to be phased out, and all new entrants received an income support payment as opposed to a CDEP wage. Existing participants were able to continue to access CDEP wages until at least 1 April 2012, as long as they remained eligible.
Performance information Between 15 October 2008 and 16 December 2011, the FRC found that 51 CDEP participants had been noncompliant with the FRC. Of those participants:
25 were exited due to FRC noncompliance
three found employment and left CDEP before being exited
one left CDEP voluntarily before being exited
14 were exited for other reasons (illness, incarceration or not meeting participation requirements)
10 had their FRC orders revoked (of those, six are still on CDEP, one left due to illness, one left due to incarceration and two were exited for further non-compliance—these two are included in the 25 exited due to FRC noncompliance in the first bullet point).
Performance information—CDEP job conversions
As suggested by the design reports, 94 paid jobs were created and funded by the Australian and Queensland governments in the four CYWR communities. They included the following:
Forty jobs supporting Australian Government service delivery were funded as a part of the $48 million package of Australian Government measures to implement the reforms. There were 16 CDEP jobs conversions in Aurukun, four in Coen, 14 in Hope Vale and six in Mossman Gorge. The jobs have been created in the sectors of health and community care, education support, child care, art centre support, broadcasting, and language and culture. All of these positions have been filled at least once.
An additional 30 positions were converted as a part of the National Partnership Agreement on Indigenous Participation. All of these positions have been filled at least once.
The Queensland Government identified 24 jobs in CYWR communities where the CDEP program had been subsidising delivery of Queensland-funded services. All of these positions have been filled at least once.
The creation of these jobs provides new employees with normalised employment arrangements such as wages, superannuation and access to training and professional development.

Project performance summary
B.27
Improved employment services
In 2008–09, in preparation for Job Services Australia (JSA) services being established in the CYWR communities from 1 July 2009 onwards, DEEWR contracted providers of the Indigenous Employment Program (IEP) to deliver more intensive case management style assistance to CDEP participants and other job seekers in the communities of Aurukun, Coen, Hope Vale and Mossman Gorge. Approximately $3.5 million was spent implementing IEP projects, which engaged more than 300 participants in the four reform communities. The initiative focused on intensive work preparation and the development of foundation skills geared at preparing people for employment opportunities expected to emerge in their communities, or to access mobility options for jobs in other locations. Projects operating through IEP included:
a youth engagement project focusing on the Hope Vale community and Cooktown High School, aiming to engage disengaged youth and improve transitions between school and work
a work readiness project targeted at the expected jobs at the Mossman Gorge visitors centre development, under which 45 community members have undergone a pre-jobs guarantee selection process
work readiness projects in Aurukun with Rio Tinto and as part of a broader intensive work preparation program delivered through Western Cape College.
The initiatives ceased with the establishment of JSA services in the communities from 1 July 2009. Prior to that date, remote communities were exempt from many of the participation requirements applying to the non-remote population.
A further initiative to improve employment services in CYWR communities includes funding from July 2010 for Mossman Gorge community organisation Bamanga Bubu Ngadimunku Inc to support North Queensland and Torres Strait Marine Training Institute to deliver a project to provide entry-level requirements for participants.
Performance information
Table B.14 shows JSA job placements for each CYWR community from July 2009 to December 2011. Table B.15 shows JSA active caseloads from July 2009 to December 2011 in each community.
Table B.14 JSA job placement outcomes, by community, July 2009 to December 2011
Community Jul–Dec 09 Jan–Jun 10 Jul–Dec 10 Jan–Jun 11 Jul–Dec 11 Aurukun 49 23 33 42 61 Coen <20 <20 <20 29 35 Hope Vale 40 40 64 76 80 Mossman Gorge <20 <20 <20 <20 <20 Total all communities <129 <103 <137 <167 <196 Source: DEEWR data extraction at 14 March 2012.
Table B.15 JSA active caseload, by community, 1 July 2009 to 31 December 2011
Community Jul 09 Dec 09 Jul 10 Dec 10 Jul 11 Dec 11 Aurukun 285 327 356 321 328 292 Coen 64 73 67 54 58 59 Hope Vale 237 251 266 227 217 208 Mossman Gorge 49 52 46 35 37 32 Total all communities 635 703 735 637 640 591 Source: DEEWR data extraction at 14 March 2012.

Cape York Welfare Reform—Evaluation
B.28
Mobility assistance
The design reports recommended that support be provided for Indigenous Australians who wish to voluntarily relocate to areas with greater job opportunities, on either a seasonal, temporary or more permanent basis.
A STEP Mobility Project was delivered to support people from the trial communities who sought mobility to take up job opportunities in other regions. This project followed on from the previous Work Placement Scheme that DEEWR contracted directly with CYP. The Mobility Project was implemented by Mission Australia, working with CYP and the private sector. The project involved pre- and post-placement support (including assistance with finding accommodation), training and mentoring, and mobility placements with employers in Victoria, primarily in the meat industry.
Performance information
Fifty participants began pre-employment training in the STEP Mobility Project, and all completed the training. Of the 50, a total of 33 commenced employment outside Cape York. The project ceased on 31 December 2009.
B.3.2 Economic development
The design reports made a range of broad proposals concerning infrastructure, business development and mentoring. The proposals included:
expansion of business support mechanisms
more business-friendly communities
investment in roads and accommodation for businesspeople and service providers
investment in business premises
reforms to land tenure arrangements.
Business support mechanisms
The design reports envisaged that business support services for local people would be available to provide mentoring, skills development activities and business loans and to aid in business development.
To improve business support in CYWR communities, an economic opportunity stream leader was employed by Balkanu who reported to the CYWR Program Office. Work is underway on an overarching, multi-pronged strategy to bring together economic development efforts in the communities, focusing on:
building job opportunities with existing business
creating new business opportunities
cultivating a work and business ethos among young leaders
developing income streams to sustain the engagement of Indigenous people with the real economy.
Business loans and business development are supported through Indigenous Business Australia (IBA), which received a capital appropriation of $1.65 million for business loans along with departmental funds of $0.35 million for the support of new Indigenous businesses in Cape York communities.

Project performance summary
B.29
Performance information
At 30 June 2010, IBA had approved six loans (three in Hope Vale and three in Mossman Gorge) for $0.437 million. There have also been two preliminary enquiries for housing loan applications in Coen. IBA has also approved 34 business support applications for $0.376 million, of which $0.280 million has already been expended. Most business support applications came from Hope Vale and Mossman Gorge. There has been a broad cross-section of business support applications in areas ranging from agriculture to transport to food and hospitality.
Examples of other IBA activities in communities include the following:
In Coen, IBA through its ‘In Business’ workshops has assisted and supported the proprietors of Adai Cape York Investments in establishing a car hire business. As demand grows, it is envisaged that IBA, with continued mentoring of the business, may be able to assist with finance to enable Adai Cape York Investments to expand its car fleet.
In Aurukun, IBA conducted its initial ‘Into Business’ seminar on 22 July 2010. Seven people participated, and IBA advised that anyone interested in attending further workshops would be required to travel to Cairns. Balkanu Cape York Development Corporation has offered to provide accommodation and airfares for participants to attend the first seminar in Cairns.
IBA has also assisted with the start-up of a car hire business in Hope Vale and has provided continuing assistance through mentoring, skills development and promotion of the business outside Hope Vale. On 25 November 2011, it was confirmed that IBA will run the Home Ownership on Indigenous Land (HOIL) program in Hope Vale. This is the first time that HOIL will be run in Hope Vale and will open the door for IBA to assist first home buyers in securing first home owners’ loans and securing low interest loans from IBA.
IBA has also set aside over $1 million for the Hope Vale Banana Farm to assist growers in developing production once the farm is in operation. IBA has supported and assisted Hope Vale Council in the business planning associated with the banana farm.
Aurukun business precinct
IBA received a direct appropriation of $3 million under the $48 million Australian Government package of welfare reform measures for the construction of a business precinct in a Cape York community. IBA indicated to FaHCSIA in October 2008 that it was unable to progress the project because of a range of local factors, including land tenure, commercial viability and business arrangements with the Aurukun Shire Council. The CYWR trial partners agreed and obtained a change of authority for the funding from the Department of Finance and Deregulation and the Department of the Prime Minister and Cabinet. This enabled a grant of $3 million to be made to the Aurukun Shire Council in 2009–10 for the construction of the business precinct.
It has been agreed that $800,000 of the $3 million originally allocated for the construction of the business precinct will be used to construct a business opportunity hub opposite the site of the business precinct. Available funding was not sufficient to continue with the awarding of a contact for the construction of the precinct. The Aurukun Shire Council has sought the additional funding from various sources.
Hope Vale business precinct
FaHCSIA issued a funding agreement for $1.38 million to the Hope Vale Aboriginal Shire Council in early February 2010 for the construction of the new business precinct. Tenders were awarded in April 2010. Construction and works were to have commenced in mid-2010, but were delayed until October 2010. Many of the employees on the construction were local Indigenous tradespeople and skilled labourers. Tenants began to occupy the business precinct in mid-2012.

Cape York Welfare Reform—Evaluation
B.30
Lighthouse projects and other projects
The CYWR governance structures agreed that each community should have ‘lighthouse projects’, or special projects, in each community. These developments are progressed under governance structures for CYWR and those of the National Partnership Agreement on Remote Service Delivery and are funded from various sources. The Aurukun and Hope Vale business precincts are lighthouse projects.
Performance information
The Mossman Gorge Gateway Tourism Centre is the Mossman Gorge lighthouse project. The $19 million centre is being built by the Indigenous Land Corporation, in partnership with local leadership group Bamanga Bubu Ngadimunku and the people of Mossman Gorge, to create significant long-term economic benefits for the local community and the region. Construction of the tourist facility commenced in November 2010. The centre was officially opened in August 2012, with an opening staff of 66 persons, of which 60 are Indigenous, representing 90 per cent of the total staff profile.
The full development package includes an environmental and Indigenous interpretive centre, art gallery and cafe, along with guided culture walks.
A contractual requirement to employ 20 per cent Indigenous employees during construction has been met and, at certain periods during construction, exceeded. In October 2011 there were 15 Indigenous people working on the construction of the centre.
It is anticipated that on an ongoing basis there will be 40 jobs for local Indigenous people during the tourism low season and up to 70 jobs in the high season will be created in areas including retail, hospitality, tourism, guiding and interpretation, and administration. Approximately 200,000 vehicles bring more than 500,000 people to visit the gorge each year. Research has shown that, at the current rate of growth, visitor numbers may increase to as many as 780,000 per year.
Next to the visitor centre will be a centre for training up to 50 Indigenous trainees each year and residential accommodation for 20 trainees from Cape York communities.
In Coen, the lighthouse project is a ranger activity. In December 2011, 20 Kalan and Lama Lama rangers were working on country at the Running Creek and Toolka/Mount Croll nature reserves under the supervision of local Indigenous managers. Technical and administrative support is provided by Balkanu staff based in Cairns. Both groups are closely involved with the Queensland Department of Environment and Resource Management and the Queensland Parks and Wildlife Services in regard to land management, training for the rangers, funding support and future planning. The Lama Lama rangers continue to develop their base at Port Stewart, while the Kalan rangers operate from their land and sea centre in Coen.
In Hope Vale, in addition to the business precinct lighthouse project, the Hope Vale horticulture lighthouse project seeks to develop a Hope Vale horticulture industry, stimulating individual farming business enterprise. Land tenure in Hope Vale has meant that block holders have been unable to secure funding from IBA or mainstream lenders to make improvements to their properties, and for that reason a government investment of $0.15 million ($75,000 in Australian Government redirected Pride of Place funds and $75,000 from the Queensland Government from service procurement funds476) has been used to make investments in five farms to support the farming of niche crops. Westpac has supported a fellowship arrangement with Balkanu, and this person is working with families and individuals to develop their farms and business management skills and to hold discussions with retailers. The philanthropic Outback Spirit Foundation is another potential long-term partner for the horticultural initiative. 476 CYP did do a variation to their Program Management funds which was to be reimbursed from the Service Procurement Fund. However, due to underspend in the Program Management expenditure – the funds were never reimbursed to CYP.

Project performance summary
B.31
A joint venture between the Hope Vale Aboriginal Shire Council (HVASC), Balkanu and the Hope Vale Foundation, which is similar to a cooperative, will provide support to emerging horticulture activities producing fresh fruit and vegetables for external markets as well as the Hope Vale community. DEEWR has provided some IEP funding to support the development of this concept.
Other initiatives of the horticulture project include:
the Cape York Biofuel Project, in which Balkanu is working with the Queensland Office of Clean Energy, Ergon and Caltex to explore Cape York’s potential as a biodiesel plantation and production centre
a banana farm on a piece of freehold land, supported by HVASC
a dam, funded by FaHCSIA, to ensure a reliable source of water to the project.
Projects to catalyse small business activity in the CYWR communities are also underway, including arts marketing in Cape York and the production of crafts by inmates at the Lotus Glen Correctional Centre. Partnerships between Cairns-based and Cape York-based enterprises are being fostered. Funding for the Aurukun Women’s Sewing Group has been approved out of Queensland Government commitments to the Aurukun Business Development Fund.
Economic opportunity initiatives
Based on recommendations of the Project Board, the Queensland Government has funded key economic opportunity initiatives totalling $1.5 million in the four trial communities as part of the trial. Examples include:
$57,000 to the Aurukun Shire Council to contribute to the employment of a business development officer to support economic opportunity development in Aurukun
$75,000 to Balkanu Cape York Development Corporation (Balkanu) to support the Hope Vale horticulture project
$70,000 to Balkanu to contribute to the redevelopment of the Aurukun tavern into a multifunction community facility
$264,700 to Balkanu to provide an enterprise stimulus project across the four communities, involving matching 15 larger businesses within the Cairns Chamber of Commerce with 15 smaller existing (or potential) Cape York businesses
$80,000 to Balkanu to support the Cape York arts marketing project
$95,000 to Balkanu to support the land trust governance project
$60,688 to Balkanu to support Stage 1 of the Aurukun Sewing Centre (Stage 2, with a budget of $226,555, is currently awaiting ministerial approval. In addition, an initial $20,000 was provided to procure an accredited trainer to scope program implementation needs and repair machinery in the centre)
$225,000 to the Aurukun Local Program Office to support an initiative aimed at establishing a ‘work ready’ crew to maximise the community’s participation in economic opportunities and increase the number of Aurukun people employed.
Performance information
Other activities in the Economic Opportunity stream are as follows:
The Aurukun Village Opportunity Hub is now completed and operational.
The Aurukun Sewing Centre has successfully implemented Stage 1 and is awaiting approval of the next stage. A business plan indicates the potential for the business to be self-sustaining by the end of 2012.

Cape York Welfare Reform—Evaluation
B.32
The Aurukun tavern consultation report and business plan have been completed, expressions of interest have been sought from businesses interested in locating in the tavern space, and negotiations with potential tenants have been taking place.
An Aurukun development officer has been employed.
B.4 Housing stream The design reports describe housing provision in remote Australia as a central feature of Australia’s welfare system, second only to the provision of welfare payments. The design reports also note that social housing has special significance in Indigenous communities, given the lack of other tenure options such as private rental or home purchase.
Housing reforms proposed by the design reports are:
improved tenancy arrangements in social housing
implementation of PoP initiatives in social housing
measures to shift from exclusive public provision of housing to significant levels of private home ownership.
As part of CYWR, the partners have agreed that the goal is to:
Shift from the current system of exclusively public provision of housing to a system based on home ownership, with public housing catering for a minority, not the majority of people.
The trial aims to bring private home ownership within the reach of people living in remote Indigenous communities. This is distinct from the national goals of providing more public housing to address overcrowding. The design reports argue that home ownership brings with it pride, stability, security, responsibility and control of one’s familial environment—often for the first time. It can also be a means of pursuing financial aspirations and creating individual assets that can be passed on to future generations.
Developments which occurred around the time of release of the design reports included:
Queensland Government reforms concerning a single model of social housing in Queensland being rolled out from 2006 onwards
the Hope Vale Welfare Reform Agreement between the HVASC and the Australian Government in May 2007 (this also involved a Pride of Place agreement and agreement by the council to divest tenancy management responsibilities to the Queensland Department of Communities)
the Queensland Government’s amendments to the Aboriginal Land Act 1991 and the Torres Strait Land Act 1991 in 2008 to provide for leases of up to 99 years to enable individuals to secure an interest in land in Indigenous Deed of Grant in Trust areas (allowing lenders to secure a mortgage over the land and individuals to borrow money to buy or construct a home).
In addition, prior to the signing of the National Partnership Agreement on Remote Indigenous Housing, the Australian Government also provided $730,000 to Queensland to support normalising tenancy arrangements in Aurukun and $700,000 to normalise arrangements in Hope Vale.
The Cape York regional organisations have been funded with $2.14 million by FaHCSIA to support the Cape York Home Ownership project. The project extends beyond the four welfare reform communities.
The project areas in the housing stream set out in the 2008 Project Board Agreement are:
mainstreaming tenancy (normalising tenancy)

Project performance summary
B.33
Pride of Place
home ownership.
B.4.1 Normalising tenancy
The design of the CYWR recommended that tenancy arrangements be normalised for existing social housing in Indigenous communities. The aim is to see tenancy management arrangements in the four welfare reform communities comparable to those in mainstream social housing. Normalising tenancy arrangements involves:
normalising rents so that they better reflect market rates or are at least consistent with mainstream social housing rents
normalising tenancy agreements so that the rights and responsibilities of tenants and administrators are clearer and are the same as for other social housing
normalising tenancy management so that there is a professional approach and residential tenancy agreements are enforced consistently.
These initiatives are designed to provide a basis for developing increased personal responsibility and individual incentives commensurate with the rights and responsibilities of mainstream social housing tenants. Under the CYWR, a breach of a tenancy agreement is one of the triggers that could see individuals and families referred to the FRC.
Performance information
With the exception of 18 properties in Mossman Gorge, which are managed by Mossman Gorge community organisation Bamanga Bubu Ngadimunku, all social housing in the four CYWR communities is managed by the Queensland Department of Communities. This follows a decision in late 2011 to transfer the management of Coen Regional Aboriginal Corporation (CRAC) housing in Coen to the Queensland Department of Communities.
In Aurukun, FaHCSIA funded the Queensland Department of Housing with $730,000 in 2008–09 to assume tenancy management of all social housing. The implementation of normalised tenancy arrangements is continuing under the National Partnership Agreement on Remote Indigenous Housing (NPARIH).
In Coen, tenancy arrangements were a mix between houses managed by the Queensland Department of Communities and houses owned by CRAC, which is under voluntary administration. In February 2012, FaHCSIA and the Queensland Department of Communities reached agreement on the transfer of ownership of the CRAC dwellings to the Department of Communities. Processes are being finalised with the appointed administrator to effect the transfer.
The Hope Vale Welfare Reform Agreement signed on May 2007 included agreement by the Hope Vale Aboriginal Shire Council to transfer tenancy management to Queensland Housing. Supported by FaHCSIA funding of $700,000, Queensland Housing took over tenancy management of social housing in March 2008. The implementation of normalised tenancy arrangements is continuing under the NPARIH.
In Mossman Gorge, social housing is managed by two different agencies. Ten properties are managed by the Queensland Department of Communities, and 18 are managed by the Mossman Gorge community organisation Bamanga Bubu Ngadimunku.
In December 2011, there were a total of 423 government-managed social rental houses in the CYWR communities (Table B.16). This number has grown steadily over the course of the trial: there has been an 84 per cent increase in the number of houses managed by the Queensland Government in the CYWR communities since June 2009.

Cape York Welfare Reform—Evaluation
B.34
Table B.16 Government-managed social rental houses, by community, June 2009 to December 2011
Community Jun 09 Dec 09 Jun 10 Dec 10 Jun 11 Dec 11 Aurukun n/aa 152 162 165 172 177 Coen 23 29 29 27 27 29 Hope Vale 197 201 198 200 202 207 Mossman Gorge 10 10 9 10 10 10 Total 230 392 398 402 411 423 n/a = not applicable a Tenancy management by the Department of Housing commenced in October 2009 in Aurukun. Note: Government-managed social rental housing comprises both the public rental housing program and the Aboriginal and Torres Strait Islander Housing—rental program. Source: Queensland Department of Housing and Public Works, unpublished data, produced May 2012.
Further work on social housing is continuing under the NPARSD and NPARIH, as do discussions to resolve land tenure (see ‘Land tenure’ below and home ownership issues in CYWR communities).
B.4.2 Pride of Place
In the design of the CYWR, Pride of Place (PoP) was put forward to embed the central themes of responsibility and reciprocity, reinforcing the central message of welfare reform. PoP was presented as an innovative model that would mobilise people to take action, by building capabilities and personal responsibility for the care of housing, as a precursor to home ownership. PoP has two elements:
PoP Public aims to improve the amenity of public places.
PoP Private is designed to encourage families to take pride and responsibility for the condition of their homes and yards. Families are eligible for up to $15,000 (per property) in home improvement funds. In order to receive PoP funds, households have to reach a savings target, have a good rental payment record and agree to participate in the project, contributing ‘sweat equity’.
Families who sign up to this program also commit to doing an MPower Plan. MPower is a money management program run by CYP that assists families to meet their basic needs and create wealth. MPower coaches work with families to map out where they are in their lives, where they want to be and what they need to do to get there. Families also draw up a family budget, set goals and receive follow-up coaching sessions to help them stay on track.
In December 2008, the CYWR Project Board agreed that CYP would lead the implementation of PoP in the four communities. However, implementation was held up until early March 2009 due to a lack of funding assigned for project establishment or project management costs. The service agreement between Indigenous Coordination Centre and CYP was varied in late June 2009 to allow for an increase in funding for capital and project management activities. During that period, CYP used its Wise Buys477 program as a way of kick-starting the PoP program by signing up individuals to utilise their government bonus payments to order goods or as their financial contribution towards PoP.
CYP commenced implementing PoP in Coen and Hope Vale in the last quarter of 2009. Activities did not start in Aurukun until January 2010 and Mossman Gorge until May 2010.
A portion of PoP funds was redirected to support the CYAAA, economic development proposals in Hope Vale and the establishment of a Coen regional organisation in 2009–10. Underspends from 2008–09 were rolled over to 2009–10 and then to 2010–11.
477 ‘Wise Buys’ is part of MPower and is managed by CYP. It is a retail internet portal that increases families’ consumer knowledge and access to household goods and services at value-for-money prices.

Project performance summary
B.35
The PoP model was revised by CYP between mid-2010 and October 2010. The four months of revision involved:
analysis of community requirements
scoping out key activities
building and training a team
forming key partnerships with local suppliers.
Performance information
Key results for the revised PoP model from October 2010 to December 2011 included:
130 families engaged across four CYWR communities
78.6 per cent of families having met or exceeded their ‘sweat equity’ commitments
42 per cent of families having contributed $500 dollars or more of the required $1,000
300 garden design elements (flower beds, vegetable gardens, pergolas, BBQs, pathways etc.) delivered, in progress or scheduled.
The July–September quarter of 2011–12 saw the largest number of completions for a single quarter to date, with 13 completed households in the four communities. In particular, a blitz in Aurukun resulted in six completions within three months. A total of 57 garden improvement elements were completed in the four communities, and another 33 improvement elements were in progress at 30 September 2011. CYP has engaged Djarragun Enterprises to install 12 pergolas using local Indigenous workmen (who will be role models for other young men in the CYWR communities).
A quarterly review was held in late August 2011. This process involved the entire team coming together to report on progress and development across the four sites.
Table B.17 show the number of families engaged in PoP by community. ‘Prospects’ are defined as those families that are yet to be engaged, while ‘dormant’ families are those that have signed up but have made no financial contributions or have ceased contributions.
Table B.17 Families engaged in PoP, by community and activity status, October 2010 to December 2011
Community Prospects Dormant Signed and
active Total Households at
completion Aurukun 9 6 19 34 11 Coen 3 3 13 19 6 Hope Vale 1 4 53 58 15 Mossman Gorge 1 1 17 19 10 Total 14 14 102 130 42 Source: CYP Pride of Place Progress Report, 2nd quarter, 2011–12.
B.4.3 Home ownership
The design reports propose that there must be a continuum from social housing to private home ownership. This involves ensuring that the supporting policy and legislative settings are in place to enable people to choose private home ownership and that there are measures to encourage and support people to move from social housing to home ownership.
There are currently two major and overlapping strands of Indigenous home ownership activity in Cape York. FaHCSIA has engaged Cape York regional organisations to implement the Cape York Home Ownership Program to support up to 20 home ownership outcomes by 30 June 2012. This work is

Cape York Welfare Reform—Evaluation
B.36
funded separately from the CYWR trial and applies across a number of Cape York Indigenous communities.
At the same time, home ownership activities in the four CYWR communities have been boosted by an injection of $2.7 million to kick-start home ownership in the following areas as part of the trial extension:
$2.4 million for land development for home ownership purposes (Implementation of this aspect of the budget measure will be managed by FaHCSIA. At this stage, the sites for the developments have not been established.)
$200,000 to build capacity for trustees and councils to develop, manage and administer systems for home ownership
$100,000 to help local Indigenous people to achieve home ownership through case management.
Enabling home ownership outcomes first requires a number of components of work to be done by the partners, including addressing land tenure and land administration issues. These issues are covered in the sections ‘Land tenure’ and ‘Land administration’, below).
Cape York Home Ownership Program
The Cape York Home Ownership Program is a collaborative effort between the Cape York regional organisations (CYP, CYI, Balkanu and Cape York Land Council), the Queensland Government and the Australian Government to address home ownership outcomes for Indigenous people in Cape York. FaHCSIA has funded the Cape York regional organisations in a milestone-based arrangement to support up to 40 prospective home owners through the pathway to consideration of home ownership opportunities. This work is funded separately from the CYWR trial; however, the project objectives and activities are highly interrelated.
The objective of the project is to improve social and economic conditions in remote and discrete communities in Cape York by enabling opportunities for home ownership and supporting individuals through to home ownership.
The Cape York Land Council is also working to achieve native title consent for social housing construction and home ownership, through either Alternative Procedure Indigenous Land Use Agreements (AP ILUAs) or Area Indigenous Land Use Agreements (Area ILUAs). CYP is the lead agency coordinating the Cape York regional organisations’ efforts in the home ownership programs area.
Performance information
During the first half of the 2011–12 financial year (July to December 2011), progress, although slow, was made in the following areas:
Home Ownership on Indigenous Communal Lands Statement of Policy Intent—after CYI and CYP’s joint submission to the Queensland Government’s discussion paper on home ownership on Indigenous communal lands, the Queensland Government delivered its statement of policy intent. The statement addressed most of the issues raised by CYI and CYP. Further negotiation with the Queensland Government is required to realise sustainable and viable home ownership in Cape York.
Participating families—identification of the 40 participating families was begun.
Bayan Design—development of high-level concept, case studies, key messaging, home ownership indicator maps and supporting tools and systems. Design is ongoing and was due for completion by the end of 2011.

Project performance summary
B.37
Community Engagement Plan—preliminary work on coordinating Cape York regional organisations and council meeting dates to commence the engagement with community members was completed. Work also commenced on a community presentation (an education piece to notify community members of home ownership opportunities, costs and responsibilities). In accordance with local protocol, the Cape York regional organisations have also engaged with councils and trustees prior to arranging community sessions in those communities where native title has been determined or is pending. Only two Cape York communities have had native title determined (extinguished): Coen and Hope Vale.
Recruitment of employees—a number of interviews have been held to fill the project manager vacancy and other roles needed to deliver home ownership outcomes. A project development officer and project manager will commence in October 2011. The delay in recruitment affected the deliverables for the project plan and the overall project by some months.
House to Home Design—development of House to Home was planned to commence in early 2012. The delay is primarily in sourcing key resources.
AP ILUA—additional re-drafting and negotiations around the current draft AP ILUA proposal are ongoing.
Land tenure
Each of the four CYWR communities has different forms of land tenure. Issues involving the tenure of land need to be resolved in order to enable community members and businesses to buy property in these areas. The different types of land tenure in each community are as follows:
In Aurukun, the tenure is Aboriginal Shire Lease (with limited statutory leasing options) but a tenure change is currently underway to convert this lease to inalienable Aboriginal freehold under the ALA, thus enabling the conferring of the 99 year leasing option.
In Coen, there is some freehold individual title. Some parts of Coen are reserve land and there are also some perpetual leases.
In Hope Vale there are two main types of land tenure available for home ownership: there is the potential to issue 99-year residential leases on the communal DOGIT land in the township; and freehold opportunities will be available on the council-owned freehold block on the community known as ‘Millers Block’. Blocks are available for sale by Hope Vale Shire Council.
Mossman Gorge is located across two land tenures. These are Aboriginal reserve and an adjoining single block of freehold land (i.e. the land is not yet split into individual lots).
Because of each of these different underlying land tenures, specific approaches need to be adopted to progress home ownership while being worked through within a common framework.
Performance information
In Coen, freehold title to land and housing are available now. A number of households have expressed an interest in home ownership and have incomes that make ownership a sustainable option. However, follow-up has been limited.
In Aurukun, tenure change is currently underway to convert Aboriginal leasehold land to inalienable freehold land under the Aboriginal Land Act 1991 (Qld), thus enabling the 99-year leasing option.
In Hope Vale, works on the Millers Block subdivision are now complete and ownership of the subdivision has been handed over to the HVASC. Land is able to be leased immediately. Home ownership opportunities on Millers Block will be dependent on the establishment by council of a fair and transparent allocation system for the new blocks and an affordable housing model. Some opportunities within the township (through the sale of social housing to tenants) are also likely to emerge. These opportunities can be supported through the Cape York Home Ownership Project.

Cape York Welfare Reform—Evaluation
B.38
Home Ownership on Indigenous Land (HOIL) program loans will also become available on Millers Block, significantly improving the opportunities for home ownership in Hope Vale.
While home ownership in Hope Vale, Coen and Aurukun will be achievable once prerequisite land administration activities are in place and other current barriers are overcome, Mossman Gorge presents a more complicated scenario. Currently, this small community is located on two different forms of land tenure: an Aboriginal reserve and ordinary freehold land. On the Aboriginal reserve are 10 properties (seven houses and three two-bedroom units) managed by the Queensland Department of Communities. The ordinary freehold land is owned by Bamanga Bubu Ngadimunku, which manages 18 properties (nine houses, three duplexes, six single men’s quarters) funded by the Australian Government.
The reserve land has not been subdivided into individual lots, so municipal service delivery is not provided to each house by the Cairns Regional Council and home ownership is made more difficult. These arrangements also create a situation in which the Australian Government and the Queensland Government must support Bamanga Bubu Ngadimunku to deliver environmental health/municipal services to the community costing around $300,000 per year.
The Mossman Gorge Land, Housing and Infrastructure project is identifying arrangements that best satisfy the land, housing and infrastructure objectives. This work is being progressed using joint governance structures across CYWR, NPARSD and NPARIH.
Land administration
A precursor of home ownership is a land development and registration system that does not place undue burden on the prospective home owner. Land administration in remote places is underdeveloped and there is a complex array of land ownership conditions.
Before home ownership can take place in CYWR communities, several prerequisites need to be addressed. Governments and/or councils will need to have:
determined land valuation policies
developed legislatively compliant land-use planning schemes (there is an interim code against which development applications can be assessed)
undertaken high-level surveys of the boundaries and roads (network surveys)
resolved any tenure anomalies identified through the network surveys (such as overlapping property boundaries and roads)
determined the technical and planning approaches to allowing individual titles to be created and sustained over communal lands
considered land allocation policies at an individual level
developed a local system of land administration at the council level
initiated native title and cultural heritage settlements where required.
Any individual wanting to take out a lease on communal land will need to:
have the land and/or dwelling valued
determine whether native title applications or determinations exist and whether settlements have been reached with the traditional owners
commission an individual lot survey if one does not exist
obtain development approval as required (the nature of which is yet to be determined)

Project performance summary
B.39
make formal applications to the trustees for a lease and satisfy any condition of an agreement to lease (the trustee must consult with the traditional owners concerned with the land).
Performance information
Discussions about how to resolve these issues took place between the partners throughout 2010. The goal is to ensure that prospective home buyers in Indigenous communities can lease registered lots where all land administration issues have been addressed. At the state-wide level, this work is being undertaken in every discrete community by the Remote Indigenous Land and Infrastructure Program Office. The office was established to support the NPARIH work on 40-year leases, but its work is being adapted to also support other sorts of residential and commercial leases. This work program is expected to be completed by 2013.
As soon as policy settings are finalised, supports will be available for individuals seeking early leases. Indigenous Business Australia provides support in the form of concessional loans, establishment grants and individual case management.
House and land price valuation methods
The design reports recommended that home ownership be a fair, affordable and financially rational choice for members of the welfare reform communities. The design reports proposed that the sale price of existing social housing be determined using a valuation methodology based on estimated market value calculated via a rental return method.
Performance information
During 2009 and early 2010, the Queensland Department of Housing adopted the position that the sale price of existing social housing should be based on depreciated replacement cost, as replacement value is the conventional accounting approach. By mid-2010, after ongoing discussions between the partners, Queensland moved to a market-based, rather than cost-based, methodology for valuing social housing. Official agreement to this was given by the Queensland Cabinet on home ownership principles.
In 2010, the Queensland Government also agreed to review its market-based approach to valuing land and embarked on a formal consultation process on options for valuing communal lands in township areas for transfer to private ownership.
In April 2010, the Department of Environment and Resource Management consulted with key stakeholders, including Indigenous councils, native title representative bodies, the Cape York Institute and World Vision (Mapoon Home Ownership Project) on proposed valuation methodologies.
At the end of 2011, the land valuation method used was ‘nominal’ based valuation methodology. The nominal value is $4,000 for leases up to 2,000 m2 and $100 for each additional 100m2. The nominal value is expected to be reviewed every three years and is likely to increase in line with the consumer price index.


Funding commitments by the Australian and Queensland governments
C.1
Appendix C Funding commitments by the Australian and Queensland governments
C.1 Background detail on funding commitments This appendix should be read in conjunction with Section 2.7 of Chapter 2.
C.1.1 Australian Government In the lead up to the CYWR, FaHCSIA provided Cape York Institute with a total of $3 million from 2005–06 to 2007–08 for the purposes of welfare reform planning and implementation preparation.
Original four year commitment (1 January 2008 to 31 December 2011)
Funding for Australian Government development prior to 1 January 2008 is not shown.
The Australian Government committed around $48 million over four years at the inception of the CYWR. Not all projects were operational for the full four years, with some commencing in 2009 or 2010. The conversion of CDEP positions began in 2008–09. A total figure across the four years is shown by stream below:
Education ($16 million)
– $6.3 million for MULTILIT (Making Up for Lost Time in Literacy) teaching methodology
– $3.0 million for Student Education Trusts (SETs)
– $2.6 million for the ABSTUDY bypass
– $4.1 million for Student Case Management
Social Responsibility ($9.7 million)
– $8 million to implement Conditional Income Management, including the Basics Card
– $1.7 million to expand Family Income Management (i.e. MPower)
– A one-off contribution to establishing the FRC is shown below under supplementary funding
Economic Opportunity ($19 million)
– $3 million to build a business precinct in Aurukun
– $2 million for business loans
– $8 million to reform CDEP and to convert 41 CDEP places into real jobs
– $6 million for enhanced employment and mentoring services
Housing ($2 million)
– $2 million for the Pride of Place program
The residual component covers departmental administrative costs, indexing for out-years and evaluation. Evaluation funds committed by the Australian Government were $0.8 million, for an independent evaluation of the CYWR.

Cape York Welfare Reform—Evaluation
C.2
Supplementary Australian Government funded activities
In addition to the original $48 million commitment, the Australian Government also provided:
$3.5 million to the Queensland Government to establish the FRC
$1.43 million to fund normalised tenancy management in Aurukun ($0.73 million) and Hope Vale ($0.7 million).
Funding was also provided through other departmental sources to contribute to programs such as the Ending Family Violence Program, with one-off supplementary funding of $300,000 from DoHA in February 2011.
To help set up the Cape York Aboriginal Australian Academy, the Australian Government agreed to provide a contribution by diverting funding ($2.2 million) from MULTILIT. Other funds were provided by the Queensland Government (see below).
Wellbeing Centres in the four welfare reform communities were supported by the Australian Government commitment of $24.4 million for alcohol reform and other health services in Cape York over four years. This includes funding for:
Drug and Alcohol Treatment and Support Services—Wellbeing Centres, Wet Season Projects and Weipa Residential Rehabilitation ($21.7 million)
Child and Maternal Health New Directions Mums and Bubs program ($1.8 million)
Primary Health Care Services—includes Hope Vale GP ($0.9 million).
Funding of $15 million under the Hope Vale Welfare Reform Agreement, largely to support transition to home ownership, which dates to before the CYWR commenced, is also part of the overall Australian Government financial commitment to the CYWR. This included:
Millers Block subdivision ($8 million)
Home Loan Support ($5 million)
Hope Vale Business Precinct ($1.4 million)
Various elements ($0.6 million).
First CYWR extension (1 January 2012 to 31 December 2012)
Additional funding of $16.1 million was committed by the Australian Government to extend the CYWR to 31 December 2012. These funds ensure a full range of existing program commitments can continue. Home ownership has been boosted by the injection of new funding. The main features of the funding package are:
Indigenous leadership of the CYWR ($0.8 million)
Student Case Management ($1.4 million)
Co-contribution to FRC operating costs ($1.0 million)
Centrelink income management ($2.9 million)
Student Education Trusts ($0.7 million)
ABSTUDY bypass ($3.4 million)
Pride of Place ($1.3 million)
Advancing home ownership opportunities in Cape York (Kickstart Home Ownership) ($2.7 million)

Funding commitments by the Australian and Queensland governments
C.3
The residual component covers departmental administrative costs, indexing for out-years, evaluation, engagement and future direction support.
Second CYWR extension (1 January 2013 to 31 December 2013)
In May 2012, the Australian Government announced a further funding package of $11.8 million to extend the CYWR to 31 December 2013. The main features of the funding package are:
Student Case Management ($1.4 million)
Communications ($0.2 million)
Engagement ($1.0 million)
Program management (FRC) ($1.6 million)
Co-contribution to FRC operating costs ($1.0 million)
Community wellbeing ($0.1 million)
Centrelink income management ($2.4 million)
Student Education Trusts ($0.7 million)
ABSTUDY bypass ($1.2 million).
The residual component covers departmental administrative costs, indexing for out-years, evaluation, engagement and future direction support.
C.1.2 Queensland Government funding
Original four year commitment
The Queensland Government committed $40 million over four years to develop and implement the Cape York Welfare Reform. The original funding package helped support a range of activities including:
the Service Procurement Fund of $20 million to support the rollout of program initiatives, including:
– The Parenting Program
– Ending Family Violence
– Community Action Funds
– Arts Marketing Programs
– School Attendance initiatives through CYAAA
– Land Administration support
$10.224 million for the ongoing operations of the FRC ($2.5 million in 2008–09, $2.57 million in 2009–10, $2.651 million in 2010–11 and $2.503 million in 2011–12)
a co-contribution (with the Australian Government) to the evaluation of the CYWR ($0.85 million)
a contribution for project management of CYWR to Cape York Institute for one year
support for CYWR program management to Cape York Partnerships of $3.32 million for 2008–09 to 2010–11 and $1.5 million for 2011–12 and 2012–13.
Supplementary Queensland Government funded activities
The Queensland Government supported the implementation of the Cape York Aboriginal Australian Academy (CYAAA) in Aurukun and Coen in 2010 and Hope Vale in 2011 providing $1.38 million from

Cape York Welfare Reform—Evaluation
C.4
the Service Procurement Fund (comprising $697,500 from 2009–10 to 2010–11 and a further $685,000 approved in 2011–12).
A further $16.64 million supplementary funding was provided, which covered the following:
Implementation of the CYAAA in Aurukun and Coen in 2010 and Hope Vale in 2011 (DETE contributed $7.7 million as part of usual school funding)
core operations for Cape York Institute ($1.5 million over three years)
core operations for Cape York Partnerships ($350,000 per annum from 2008–09 to 2011–12 (total $1.4 million))
Operation funds for Wellbeing Centres of an additional $6.04 million were also provided by the Queensland Health in 2008–09 over four years.
CYWR extension funding (1 January 2012 to 31 December 2012)
Following a round of community consultations, the Queensland Government announced a funding package of $1.6 million on 18 August 2011 to extend the CYWR.
CYWR extension funding (1 January 2013 to 31 December 2013)
In August 2012, the Queensland Government announced it would contribute $5.65 million for the CYWR extension to 31 December 2013.

Evaluation methods used by the SPRC
D.1
Appendix D Evaluation methods used by SPRC
The research used to produce chapters 3, 7 and 8 involved the following components:
workshops with stakeholders
analysis of key documents
analysis of administrative data from Queensland and Australian government departments and from the Family Responsibilities Commission (FRC)
interviews with key stakeholders
site visits to the four Cape York Welfare Reform (CYWR) trial communities.
D.1 Workshops with stakeholders Four workshops were conducted with stakeholders throughout the project:
initial evaluation meeting (Canberra, Wednesday 15 February 2012)
second evaluation meeting (Brisbane, Thursday 23 February 2012)
third evaluation meeting (Canberra, Tuesday 24 July 2012)
final evaluation meeting (Brisbane, Friday 7 September 2012).
These workshops assisted with the project design, updating on progress and work-shopping the findings related to the implementation and outcomes of the trial.
D.2 Analysis of documents and outcomes data The implementation, FRC and outcomes chapters (chapters 3, 7 and 8, respectively) draw on the following five sources of data:
analysis of administrative data provided by FaHCSIA and the Queensland Government, and from the FRC administration
analysis of project progress reports, the FRC annual and quarterly reports and summaries of information from other significant projects, which are part of the reform
qualitative interviews and workshops with key stakeholders who have had responsibility for implementing the reforms
analysis of policy and other documents and reports provided to SPRC
analysis of the findings from the social change survey conducted by Colmar Brunton478 in the four communities, the service providers survey479 and the Migration Plus Service Delivery Consultation Paper480.
On the basis of each data source, a judgement was made as to the level of analysis and reporting that was advisable (e.g. for the whole trial, for the communities or at a sub-community level), the potential for linking datasets, and how best to benchmark each dataset by providing trend data or comparisons with other sites. 478 Colmar Brunton, Social change research study: aggregate report, report prepared for FaHCSIA, Canberra, 2012. 479 J Putt, Service delivery, results from the survey of service providers: Report for the evaluation of the Cape York Welfare Reform trial, FaHCSIA, Canberra, 2012. 480 Migration Plus, Consultation paper regarding desk top research and qualitative analysis of service delivery trends apparent from the CYWR initiatives: Focus area Aurukun, report prepared for FaHCSIA, Canberra, 2012.

Cape York Welfare Reform—Evaluation
D.2
D.3 Interviews with key stakeholders Interviews were conducted with key stakeholders to gain their views on the successes and challenges of the trial. The interviews were also utilised to contextualise and explain findings from the quantitative analysis. This allowed a meaningful interpretation of findings. Interviews were conducted face to face, by telephone and in the context of workshops.
Face-to-face interviews were undertaken in two rounds from mid-June to early July 2012. The visits lasted from one to three days. A team of three researchers undertook the first round of consultations from 18 to 22 June 2012 in Coen, Aurukun and Cairns. A team of two researchers undertook the second round of consultations from 3 to 6 July in Mossman Gorge and Hope Vale. There were 58 face–to-face interviews and four telephone interviews.
Table D.1 Consultations, by location, and telephone interviews
Location Date No. of people interviewed Coen 18 June 2012 5 Aurukun 19–21 June 2012 19 Cairns 22 June 2012 9 Mossman Gorge 3 July 2012 8 Hope Vale 4–6 July 2012 17 Sub-total Telephone interviews 23 July – 10 August 2012 4 Total 62 Note: Shading indicates Round 1 consultations.
D.4 Challenges and limitations There were a number of limitations and challenges to evaluating the CYWR trial. They included:
limitations of the administrative datasets
contextual factors of the four CYWR trial communities
absence of benchmarking for some datasets
planning for the evaluation
evaluation timescales
challenges with the FRC data
theory of change timescales.
D.4.1 Administrative datasets
Conducting any evaluation for small communities is a challenge, as data from sample surveys are rarely available at this level, and where they are available they are often not reportable because of privacy issues. This often means that a strong reliance has to be placed on Census data and on administrative data from agencies such as the police and hospitals. It is also not possible to accurately measure some outcomes in small communities due to small numbers, especially when the incidence of the particular outcome is low; for example, life expectancy.
Further, some data are not reliable indicators of underlying trends, even at the national level. For example, child protection data do not provide a good guide to the underlying level of child abuse and neglect, as indicated below.
It is well known that the best way of obtaining data on the underlying level of crime is to actually ask people about their experiences through sample surveys. This is a preferred approach, as a high proportion of crime is never reported to the police. Unfortunately, crime victimisation surveys do not

Evaluation methods used by the SPRC
D.3
provide data for small communities and, as a result, analysts generally have to rely on recorded crime data when assessing change for small communities.
We have, however, made extensive use of the data that are available and, in doing so, have identified some important trends which enable us to make reasonably robust conclusions about changes in outcomes for the populations in the four communities. This task has been made easier because the Queensland Government publishes outcome data on a quarterly basis for 17 discrete Indigenous communities. This allows for a high-level comparison of key outcome data for the four CYWR communities with data for other Indigenous communities in Queensland.
In a number of instances we have obtained more detailed comparative data, particularly on crime and school attendance, that allow for a more detailed comparison with other Indigenous communities in Queensland. A range of detailed analysis has also been conducted using unit record data for individual clients from the FRC. These data allow for a more rigorous assessment than is possible through a simple comparison of performance indicators.
The social change research study also provides useful data which has been triangulated with the FRC and administrative data for this evaluation. Nevertheless, it is important to highlight some of the key limitations of the data that were used.
All administrative datasets are limited in various ways, in particular by the fact that the small numbers of people in the four communities (and in Aboriginal and Torres Strait Islander communities generally) make it difficult to assess changes over time. Other limitations are described below.
D.4.2 Data are used as proxies for outcomes
All administrative data are counts of activity of agencies. This means that they generally count service events such as hospital admissions or arrests, rather than actual outcomes such as injuries or crimes. If crime is not reported it will not be entered into the data, and if it is reported and not recorded it will similarly not become part of the data. This means that most administrative data are proxies for outcome measurements rather than measurements of actual outcomes. This is more of a problem for some kinds of data than others. For example, school attendance is a very close proxy for the outcome. As long as school attendance is recorded accurately, it directly measures the days students attend and do not attend school. On the other end of the continuum, child safety notifications are known to be poor proxies for child abuse. They depend much more on people suspecting abuse of children and reporting that abuse, and the abuse being substantiated. Rates of reporting can change for all sorts of reasons other than changes in the prevalence of abuse, including greater awareness in the community, willingness of children and non-abusive relatives to report and agencies’ responses to incidents—a point acknowledged by the Australian Institute of Health and Welfare (AIHW).481 Datasets are also produced in different timescales depending on the event being measured. School attendance is apparent on the day the child misses school, but child abuse can be reported several months and sometimes years after the incident.
D.4.3 Reliability and completeness
All administrative data are reliant on people completing forms or databases and, even with very strict definitions, there are always differences in how individuals submit data. This is not generally a problem if large numbers of people are involved, but is a problem if there are small numbers and data are completed inconsistently or if the consistencies are systematic in any way. For example, if a police officer in one community prefers to ignore people who are drunk in the streets unless they are violent or disruptive but in another community a police officer charges all those people, the resulting analysis will show high levels of alcohol-related crime in the first community but not the second, even if the actual incidence is very similar.
481 Australian Institute of Health and Welfare (AIHW), Child protection Australia 2010–11, AIHW, 2012.

Cape York Welfare Reform—Evaluation
D.4
D.4.4 Changing definitions or practices The third major problem with administrative data is that changes in policies or procedures can look like changes in the incidence of a problem where there has been no change. In some cases, this is easy to measure and understand; for example, if a decision is made to record tenancy breaches only after four months of arrears rather than three months, this will result in a sudden fall in apparent rent breaches. As long as it is known that the threshold changed, and as long as the change was universal, this need not cause a problem. However, if agencies decide informally that referrals should be noted only if the client turns up for a session, whereas in the past a phone call would have been counted as a referral, this could look like a drop in provision of services, which does not actually reflect a change in outcomes.
For those reasons administrative data should always be considered with caution and, in particular, individual changes for specific communities from one year to another relating to a specific data item should not be considered a sign of real change. Only if a trend is sustained over time, and there are no hidden anomalies in the data, should the findings be considered robust in that particular domain.
D.4.5 Contextual factors in the four CYWR trial communities
The four trial communities (and comparison communities where reported on) are very different from each other and therefore aggregate data often hides significant variations in the patterns of change in the four communities (and in the comparison communities).
Another contextual factor that must be taken into account is that the boundaries of the CYWR trial are not always clear. Many other significant initiatives have been undertaken in the four welfare reform communities over the past four years, some of which are defined as ‘related enabling projects’ in the 2008 Project Board Agreement, such as the Cape York Aboriginal Australian Academy (CYAAA) and Wellbeing Centres. Others are closely linked to welfare reform but not a part of the trial as such (e.g. alcohol management plans) and yet others apply more generally to Indigenous communities, such as Community Development Employment Projects (CDEP) reform, housing construction and refurbishment. This makes it difficult to disaggregate the specific effects of welfare reform from other policies and programs in these four communities (see Chapter 3, Section 3.3.4 for more information).
D.4.6 Absence of benchmarking data
One of the key methods used to assess changes in the four welfare reform communities is to compare changes in outcomes with those in other Indigenous communities in Queensland. In some instances these comparisons have been made with all the Indigenous communities in Queensland for which the Queensland Government publishes quarterly data. In other instances, comparisons have been made with other Indigenous communities in Cape York.
Comparing outcomes in other communities should always be treated with caution, as other communities are also subject to changes, including through policy initiatives and measures. Also, extreme care needs to be placed on any comparison with a very small number of communities, as those communities may themselves be subject to unusual trends. Given those limitations, this evaluation has sought to make comparisons with a number of other communities rather than simply choosing one, two or four comparison communities.
While a range of benchmarking or comparative data are available, there are some gaps. For example, we would have access to better data on community safety at the community level and comparative data on the relative level of crime from crime-use surveys, but such data are rarely available at the community level. Ideally, we would also include data on the underlying level of child abuse and neglect but, as we indicate elsewhere, ascertaining the true level of child abuse and neglect is extremely challenging and these data are not available for Australia as a whole, let alone small, discrete communities.

Evaluation methods used by the SPRC
D.5
Another issue relating to benchmarking is that some of the components of the CYWR trial are unique and therefore it is not easily possible to contextualise findings. For example, the tripartite agreement and governance structure and the FRC are innovations that have not been replicated in any other program in Australia. It is therefore difficult to compare or contextualise the challenges they faced with implementation findings from other programs.
These limitations apply to evaluations of many complex programs and are not specific to the CYWR trial. The CYWR trial is different only in the sense that it is taking place in relatively few communities and that the range of outcomes it aims to affect is very wide.
The cost of the CYWR trial is difficult to contextualise as there are few benchmarks for programs that are as comprehensive or complex. Ideally, this would involve comparing data on all the additional resources and services that have been provided to the comparison communities over the period of the trial, as this would help contextualise the relative change in outcomes. While there is good information on the extra resources provided to the four welfare reform communities, similar detailed data for the comparison communities are not available. An economic evaluation of the CYWR trial is beyond the scope of this evaluation.
D.4.7 Program logic and planning
The CYWR trial has a very well developed program logic482, especially compared to many other initiatives in the welfare reform agenda. However, it does not specify timescales for expected changes. Thus it is not easy to ascertain whether progress to date is consistent with the theory of change.
The initial stages of the CYWR trial included some thought on the design and planning for the evaluation, such as the Welfare Reform Action Plan (WRAP) and the 2008 Project Board Agreement. However, key datasets, evaluation methods and comparison sites at baseline had not been identified in the early days of the CYWR reform. This is particularly the case for the social change survey (Chapter 4), which does not have a baseline or a comparative sample and relies principally on retrospective accounts of progress. Nevertheless, a significant amount of data has been collected for this evaluation, as is reported in Chapter 8.
D.4.8 Evaluation timescales
The initial plan for the evaluation was to check the findings of the quantitative analysis with key stakeholders to verify findings, but that was only possible for some of the analysis (particularly relating to school attendance and crime) due to tight project timescales.
D.4.9 Lack of time series data
The relatively short duration of the trial and the nature of the data make it difficult to identify long-term trends in many cases. This is combined with the point made above, that for very small communities trends are difficult to measure because small changes in demographics, data definitions or data collection methods can appear as large changes in outcomes and so several years of data are often required to establish trends, especially for events which occur relatively infrequently.
D.5 Interpreting the findings It is important when reading chapters 3, 7 and 8 to contextualise the findings of this evaluation in relation to the scale of the issues the CYWR trial is attempting to address, the scope of the initiative and the inherent challenges and difficulties in program implementation in remote Indigenous communities in Australia. The challenges of implementing even simple programs in remote
482 A more detailed description of the program theory is provided in Section 2.8. For the full report refer to Courage Partners, Evaluation framework and program theory for the Cape York Welfare Reform trial, 2009.

Cape York Welfare Reform—Evaluation
D.6
communities have been well documented. The Australian Public Service Commission in 2007 identified Indigenous disadvantage as one of a number of ‘Wicked Problems’—complex and intractable problems which successive policy regimes have failed to tackle effectively.483
Thus the scale of the undertaking for the CYWR trial should not be underestimated. As noted above, the trial is unique and innovative in a number of ways, not only in Australia but internationally. It is innovative not only in terms of the scale and range of activities involved, but also in its governance arrangements and implementation structure. In addition, it is based on a theory of change that has been carefully developed over a number of years, and was implemented after extensive consultations in the four communities. It is different from most mainstream programs that focus on particular sub-populations or outcome areas and which are often implemented by one government department (perhaps subcontracting to non-government organisations).
The CYWR trial is deliberately designed to challenge current ways of delivering programs in Indigenous communities, partly in response to the failure of previous approaches described above. As a result, it is difficult to compare the CYWR trial to other programs that have been implemented in Indigenous communities over the years. Obviously, it was difficult for the program designers to anticipate all the challenges and obstacles the reform was likely to face.
It should also be noted that some features of program implementation, especially when the programs are complex, are ubiquitous and are exacerbated in Indigenous communities. These challenges are evident not only in Australia and are well documented in the implementation literature internationally.484 They include:
service fragmentation and overlap
lack of administrative capacity
teething problems in which administrative and operational systems take longer to implement than expected and cause problems for service delivery
interagency rivalry and turf wars
differences of approach and service philosophy by agencies
overlap between agencies
overlap and tension between service providers, programs and policies
communication difficulties and agencies’ lack of knowledge about each other’s activities
workforce problems, in particular difficulties in recruiting staff who are committed to remaining in post for a sustained period, have the necessary skills to deliver the services and have knowledge and experience of working in Indigenous communities (and ideally are local or understand the specific context of the community)
challenges in engaging communities and consulting with them, and treading the line between overburdening communities with consultation and failing to consult adequately
funding timescales and difficulties relating to getting up to speed quickly and retaining staff commitment when it is known or suspected that funding is time limited
‘initiative effect’—in which most impacts occur in a short timescale, but fail to be maintained over the longer period because the urgency and commitment of those involved decreases over time as programs become ‘mainstreamed’ and staff no longer feel like pioneers or on the cutting edge, or new staff are appointed who are less committed or engaged
483 Australian Public Service Commission, Tackling wicked problems: a public policy perspective, 2007. 484 A Cameron and R Lart, ‘Factors promoting and obstacles hindering joint working: a systematic review of the research evidence’, Journal of Integrated Care, vol. 11, no. 2, 2003, pp. 9–17.

Evaluation methods used by the SPRC
D.7
displacement—in which problems occurring in the target community decrease, but they increase in other communities (e.g. when individuals with problematic behaviour move to another location) or are displaced to other activities (e.g. people take drugs rather than drinking alcohol).
As expected, all those factors were found in the implementation of the CYWR trial (all are likely to be found in any implementation of complex programs). Some issues are exacerbated in remote Indigenous communities, especially workforce problems and administrative logistic challenges. For a program as innovative and extensive as the CYWR trial, these challenges were always bound to arise and the evaluation findings must therefore be interpreted in this context. The evaluation should therefore not focus particularly on whether such challenges have arisen but rather gauge how effectively they have been addressed in the CYWR trial communities, and how they can be ameliorated in the future.