cytomegalovirus infection is a risk factor for tb disease in … expression of natural killer cell...
TRANSCRIPT

1
Cytomegalovirus infection is a risk factor for TB disease in 1
Infants 2
3
Julius Muller1, Magali Matsumiya1, Margaret A. Snowden3, Bernard Landry3, 4
Iman Satti1, Stephanie A. Harris1, Rachel Tanner1, Matthew K. O’Shea1, Lisa 5
Stockdale1,2, Leanne Marsay1 Agnieszka Chomka1,4, Rachel Harrington-6
Kandt1, Zita-Rose Manjaly Thomas1, Vivek Naranbhai5, Elena Stylianou1, 7
Stanley Kimbung Mbandi6, Mark Hatherill6, Gregory Hussey6, Hassan 8
Mahomed6, Michele Tameris6, J. Bruce McClain3, Thomas G. Evans3, Willem 9
A. Hanekom6, Thomas J. Scriba6, Helen McShane1 Helen A. Fletcher1,2 10
11
1The Jenner Institute, University of Oxford, Oxford, UK, OX3 7DQ; 2London 12
School of Hygiene & Tropical Medicine, London, UK, W1CE7HT; 3Aeras, 13
Rockville, USA, MD 20850; 4The Kennedy Institute, University of Oxford, 14
Oxford, UK, OX3 7LF; 5Wellcome Trust Centre for Human Genetics, University 15
of Oxford, Oxford, UK, OX37B; 6South African Tuberculosis Vaccine Initiative, 16
Institute of Infectious Disease and Molecular Medicine & Division of 17
Immunology, Department of Pathology, University of Cape Town, South Africa, 18
7935. 19
20
.CC-BY-NC-ND 4.0 International licensenot peer-reviewed) is the author/funder. It is made available under aThe copyright holder for this preprint (which was. http://dx.doi.org/10.1101/222646doi: bioRxiv preprint first posted online Nov. 30, 2017;

2
1
ABSTRACT 2
Immune activation is associated with increased risk of tuberculosis (TB) 3
disease in infants. We performed a case–control analysis to identify drivers of 4
immune activation and disease risk. Among 49 infants who developed TB 5
disease over the first two years of life, and 129 matched controls who remained 6
healthy, we found the cytomegalovirus (CMV) stimulated IFN-γ response at age 7
4-6 months to be associated with CD8+ T-cell activation (Spearman’s rho, 8
p=6x10⁻⁸). A CMV specific IFN-γ response was also associated with increased 9
risk of developing TB disease (Conditional Logistic Regression, p=0.043, OR 10
2.2, 95% CI 1.02-4.83), and shorter time to TB diagnosis (Log Rank Mantel-11
Cox p=0.037). CMV positive infants who developed TB disease had lower 12
expression of natural killer cell associated gene signatures and a lower 13
frequency of CD3-CD4-CD8- lymphocytes. We identified transcriptional 14
signatures predictive of risk of TB disease among CMV ELISpot positive 15
(AUROC 0.98, accuracy 92.57%) and negative (AUROC 0.9, accuracy 79.3%) 16
infants; the CMV negative signature validated in an independent infant study 17
(AUROC 0.71, accuracy 63.9%). Understanding and controlling the microbial 18
drivers of T cell activation, such as CMV, could guide new strategies for 19
prevention of TB disease in infants. 20
21
.CC-BY-NC-ND 4.0 International licensenot peer-reviewed) is the author/funder. It is made available under aThe copyright holder for this preprint (which was. http://dx.doi.org/10.1101/222646doi: bioRxiv preprint first posted online Nov. 30, 2017;
3
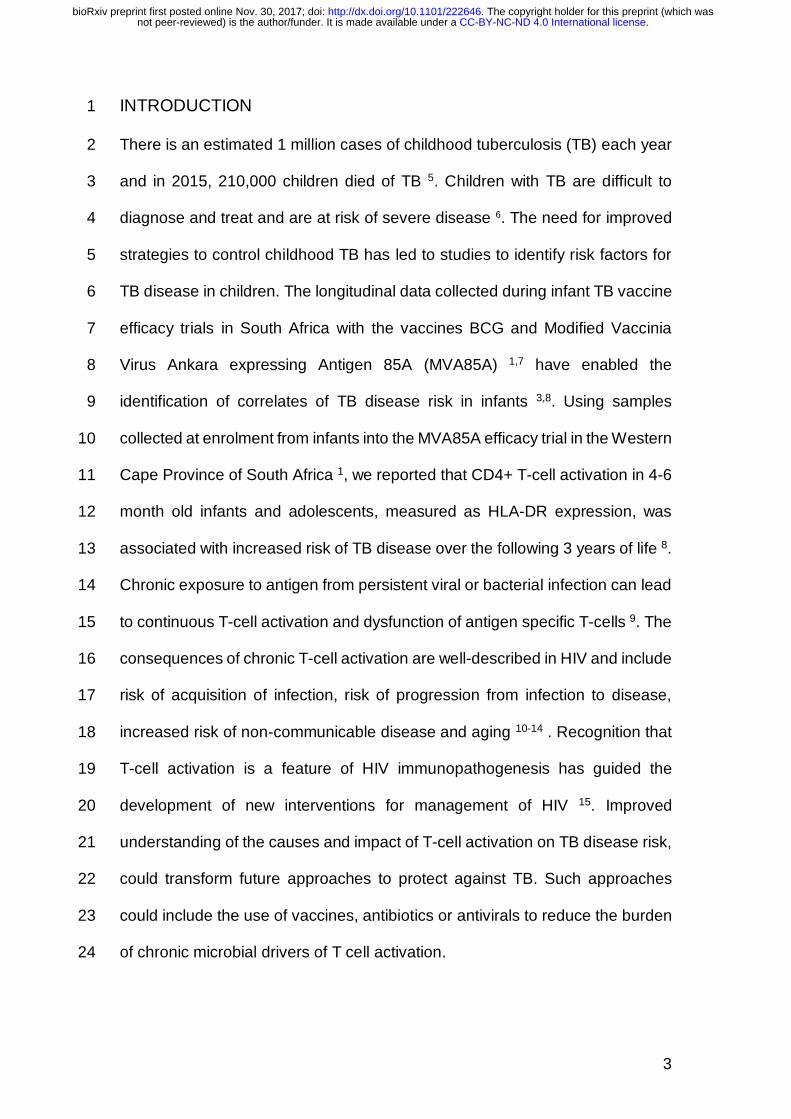
INTRODUCTION 1
There is an estimated 1 million cases of childhood tuberculosis (TB) each year 2
and in 2015, 210,000 children died of TB 5. Children with TB are difficult to 3
diagnose and treat and are at risk of severe disease 6. The need for improved 4
strategies to control childhood TB has led to studies to identify risk factors for 5
TB disease in children. The longitudinal data collected during infant TB vaccine 6
efficacy trials in South Africa with the vaccines BCG and Modified Vaccinia 7
Virus Ankara expressing Antigen 85A (MVA85A) 1,7 have enabled the 8
identification of correlates of TB disease risk in infants 3,8. Using samples 9
collected at enrolment from infants into the MVA85A efficacy trial in the Western 10
Cape Province of South Africa 1, we reported that CD4+ T-cell activation in 4-6 11
month old infants and adolescents, measured as HLA-DR expression, was 12
associated with increased risk of TB disease over the following 3 years of life 8. 13
Chronic exposure to antigen from persistent viral or bacterial infection can lead 14
to continuous T-cell activation and dysfunction of antigen specific T-cells 9. The 15
consequences of chronic T-cell activation are well-described in HIV and include 16
risk of acquisition of infection, risk of progression from infection to disease, 17
increased risk of non-communicable disease and aging 10-14 . Recognition that 18
T-cell activation is a feature of HIV immunopathogenesis has guided the 19
development of new interventions for management of HIV 15. Improved 20
understanding of the causes and impact of T-cell activation on TB disease risk, 21
could transform future approaches to protect against TB. Such approaches 22
could include the use of vaccines, antibiotics or antivirals to reduce the burden 23
of chronic microbial drivers of T cell activation. 24
.CC-BY-NC-ND 4.0 International licensenot peer-reviewed) is the author/funder. It is made available under aThe copyright holder for this preprint (which was. http://dx.doi.org/10.1101/222646doi: bioRxiv preprint first posted online Nov. 30, 2017;

4
Here, we report results from a case–control analysis of infants from the 1
MVA85A efficacy trial 1 which aimed to understand the drivers of immune 2
activation associated with TB risk in infants. 3
4
RESULTS 5
Activated CD8+ T-cells are associated with TB disease risk and correlate 6
with cytomegalovirus (CMV)-specific IFN-γ response 7
BCG-vaccinated case and control infants who were enrolled in an efficacy trial 8
of the candidate TB vaccine MVA85A were included in this study 1 (Figure 1). 9
HIV and M.tb uninfected infants without known TB exposure were randomized 10
at 16-24 weeks of age to receive a single intradermal dose of MVA85A or 11
placebo (Candin™, a candida skin test antigen)1. In contrast to our previous 12
analysis which focused on the sample collected at enrolment (Day 0), samples 13
collected from two time points, Day 0 (D0) and Day 28 (D28) following MVA85A 14
or placebo were combined for testing of both cellular parameters and 15
transcriptional signatures associated with risk of TB disease. We have shown 16
that the correlates of risk measured in our previous study were not affected by 17
intervention (MVA85A or placebo) 8. Only infants for whom a sample was 18
available at both D0 and D28 were included in the analysis (Figure 1). 19
Previously, we identified an association between TB disease risk over the first 20
two years of life and the frequency of activated HLA-DR+ CD4+ T-cells at age 21
4-6 months 8. We also found that the magnitude of BCG-specific IFN-γ 22
expressing cells and levels of anti-Ag85A IgG were associated with reduced 23
risk of TB disease 8. In our present analysis, with combined Day 0 and Day 28 24
samples from 49 cases and 129 controls (Figure 1), we confirmed our previous 25
.CC-BY-NC-ND 4.0 International licensenot peer-reviewed) is the author/funder. It is made available under aThe copyright holder for this preprint (which was. http://dx.doi.org/10.1101/222646doi: bioRxiv preprint first posted online Nov. 30, 2017;

5
finding of TB risk associating with HLA-DR+ CD4+, BCG-specific IFN-γ and 1
anti-Ag85A IgG (Table 1). In addition, we found frequencies of HLA-DR+ CD8+ 2
T-cells to be associated with TB risk (conditional logistic regression (CLR) OR 3
1.34, 95% CI 1.08-1.67, p = 0.008, FDR 0.092) (Table 1). The magnitude of 4
PPD-stimulated IFN-γ-expressing cells measured by ELISpot were also 5
associated with reduced TB risk (OR 0.71, 95% CI 0.51-0.98, p = 0.037, FDR 6
0.2) (Table 1). 7
8
.CC-BY-NC-ND 4.0 International licensenot peer-reviewed) is the author/funder. It is made available under aThe copyright holder for this preprint (which was. http://dx.doi.org/10.1101/222646doi: bioRxiv preprint first posted online Nov. 30, 2017;

6
1
2
3
4
Figure 1. Study design for immune correlates analysis. Infants who were enrolled in an efficacy trial of the candidate TB vaccine MVA85A were included in this study 1. Infants were randomized at 16-24 weeks of age to receive a single intradermal dose of MVA85A or placebo (Candin™, a candida skin test antigen)1.. Boxes indicate the number of case infant (red) or control infant (grey) samples available for combined Day 0 (D0) and Day 28 (D28) analysis. Analysis was restricted to infants where a frozen PBMC sample was available, live cells in PBMC were >50% (or PHA IFN-γ ELISPOT >=1000 SFC/million) and to infants where a sample was available for analysis from both the D0 and D28 time points. Control infants were excluded if the corresponding matched case was not in the analysis.
.CC-BY-NC-ND 4.0 International licensenot peer-reviewed) is the author/funder. It is made available under aThe copyright holder for this preprint (which was. http://dx.doi.org/10.1101/222646doi: bioRxiv preprint first posted online Nov. 30, 2017;

7
Table 1. Conditional Logistic Regression of combined Day 0 plus Day 28 infant 1
samples 2
Estimated Odds-Ratio (OR) of TB disease from a Conditional Logistic Regression of D0 + D28
immunological variable
Quantitative variable N
Case Est OR* 95% CI P value FDR value AUROC
CD3+ T cell 329 88 0.98 0.75-1.28 0.86 0.94
CD4+ T cell 329 88 0.79 0.6-1.03 0.087 0.29
HLA-DR+ CD4 T cell 329 88 1.59 1.3-2 <0.0001 0.002
0.64
CD4+CD25+CD127- 329 88 0.84 0.62-1.12 0.23 0.59
CD8+ T cell 329 88 1.23 0.98-1.53 0.074 0.28
HLA-DR+ CD8+ T
cell
329 88 1.34 1.08-1.67 0.008 0.092 0.59
CD14+CD16+ 329 88 0.93 0.73-1.18 0.57 0.82
CD14+CD16- 329 88 0.99 0.78-1.27 0.96 0.96
CD19+ B cell 328 88 1.13 0.87-1.4 0.39 0.69
BCG MGIA 146 50 0.82 0.52-1.29 0.39 0.69
85A ELISpot 324 91 0.87 0.63-1.2 0.39 0.69
BCG ELISpot 333 94 0.75 0.57-0.98 0.036 0.2 0.56
PPD ELISpot 270 79 0.71 0.51-0.98 0.037 0.2 0.57
TB10.3/10.4 ELISpot 270 79 0.96 0.74-1.23 0.72 0.83
.CC-BY-NC-ND 4.0 International licensenot peer-reviewed) is the author/funder. It is made available under aThe copyright holder for this preprint (which was. http://dx.doi.org/10.1101/222646doi: bioRxiv preprint first posted online Nov. 30, 2017;

8
EBV ELISpot 290 84 1.05 0.82-1.35 0.7 0.83
CMV ELISpot 319 91 1.01 0.8-1.23 0.9 0.94
FLU ELISpot 289 84 1.08 0.85-1.37 0.55 0.82
GAM.DEL (putative) 329 88 1.16 0.91-1.5 0.23 0.59
NK 16neg (putative) 329 88 0.96 0.63-1.4 0.63 0.82
NK 16pos (putative) 329 88 0.86 0.66-1.12 0.26 0.6
CD14+CD16+ /CD3+ 329 88 0.92 0.72-1.18 0.52 0.82
CD14+CD16- /CD3+ 329 88 0.96 0.74-1.22 0.68 0.83
Anti-Ag85A IgG 297 87 0.79 0.63-0.99 0.043 0.2 0.59
1
2
.CC-BY-NC-ND 4.0 International licensenot peer-reviewed) is the author/funder. It is made available under aThe copyright holder for this preprint (which was. http://dx.doi.org/10.1101/222646doi: bioRxiv preprint first posted online Nov. 30, 2017;

9
CMV and EBV are known drivers of T-cell activation 11,14 and with more than 1
95% seroprevalence in adults, South Africa is amongst the highest CMV burden 2
countries in the world (reviewed by Adland et. al., 16). We analyzed CMV and 3
EBV-specific IFN-γ ELISpot responses for evidence of an association between 4
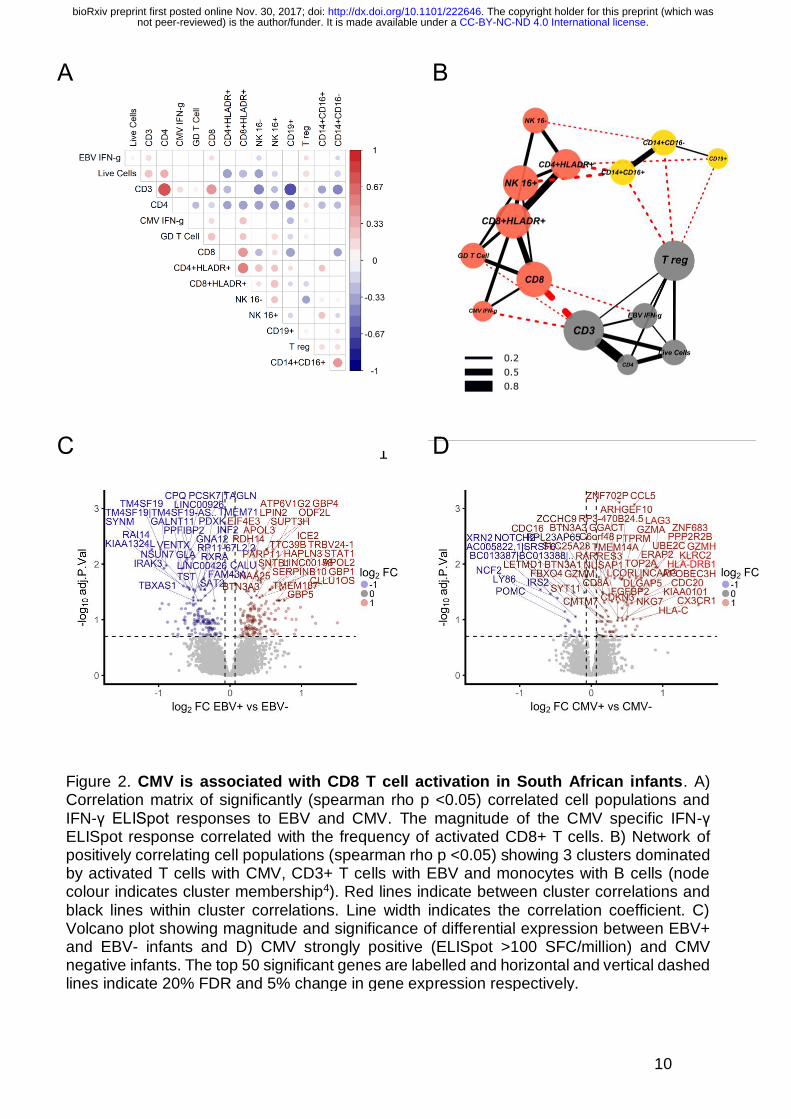
viral infection and T-cell activation in our infant cohort. Frequencies of activated 5
CD8+ T-cells correlated with the magnitude of the CMV-specific IFN-γ ELISpot 6
response (Spearman’s rho p = 6 x 10⁻⁸, Figure 2A), suggesting that CMV 7
infection is associated with CD8+ T-cell activation in this infant cohort. A 8
network representation of positively correlating cell populations 4 (spearman 9
rho p-value <0.05) revealed 3 clusters dominated by activated CD8+ and 10
activated CD4+ T-cells with CMV-specific IFN-γ ELISpot response, CD3+ T-11
cells with Epstein–Barr virus (EBV)-specific IFN-γ ELISpot response and 12
monocytes with B-cells (Figure 2B). 13
14
.CC-BY-NC-ND 4.0 International licensenot peer-reviewed) is the author/funder. It is made available under aThe copyright holder for this preprint (which was. http://dx.doi.org/10.1101/222646doi: bioRxiv preprint first posted online Nov. 30, 2017;
10
1
Figure 2. CMV is associated with CD8 T cell activation in South African infants. A) Correlation matrix of significantly (spearman rho p <0.05) correlated cell populations and IFN-γ ELISpot responses to EBV and CMV. The magnitude of the CMV specific IFN-γ ELISpot response correlated with the frequency of activated CD8+ T cells. B) Network of positively correlating cell populations (spearman rho p <0.05) showing 3 clusters dominated by activated T cells with CMV, CD3+ T cells with EBV and monocytes with B cells (node colour indicates cluster membership4). Red lines indicate between cluster correlations and black lines within cluster correlations. Line width indicates the correlation coefficient. C) Volcano plot showing magnitude and significance of differential expression between EBV+ and EBV- infants and D) CMV strongly positive (ELISpot >100 SFC/million) and CMV negative infants. The top 50 significant genes are labelled and horizontal and vertical dashed lines indicate 20% FDR and 5% change in gene expression respectively.
A B
C D
.CC-BY-NC-ND 4.0 International licensenot peer-reviewed) is the author/funder. It is made available under aThe copyright holder for this preprint (which was. http://dx.doi.org/10.1101/222646doi: bioRxiv preprint first posted online Nov. 30, 2017;

11
EBV had a strong effect on the blood transcriptome, with 296 genes 1
differentially expressed between infants with positive and negative EBV 2
responses (Figure 2C). CCL8, CXCL10 and IFIT3 had the greatest fold 3
increase in expression in EBV+ infants indicating strong induction of a Type I/II 4
IFN response, although we did not see a correlation between EBV ELISpot 5
response and T cell activation in this study (Supp Table 1). 6
The impact of CMV on the blood transcriptome was smaller, with only 14 genes 7
differentially expressed between CMV positive and negative infants (ELISpot 8
>17 SFC/million), although there were 103 differentially expressed transcripts 9
between CMV strongly positive (ELISpot >100 SFC/million) and negative 10
infants (Figure 2D and Supp Tables 2A and B). Differentially expressed 11
transcripts included HLA-DRB1, ZNF683, LAG3 and KLRC2 (NKG2C). ZNF683 12
is an important paralog of PRDM1 and together with CCL5 has been shown to 13
be highly induced in human CMV-specific CD8+ T-cells when compared to 14
naïve CD8+ T-cells 17. LAG3 is expressed on activated CD8+ and CD4+ T-cells 15
and LAG3+CD8+ T-cells are found in CMV infection 17,18. NKG2C+ natural killer 16
(NK) cells are expanded in response to CMV infection although CMV infection 17
can also induce the expression of NKG2C on CD8+ T-cells 19-21. 18
Expression levels of transcripts from total peripheral blood mononuclear cells 19
(PBMC) of infants with a CMV ELISpot response (>100 SFC/million) were 20
correlated with expression levels of transcripts published from CD8+ T-cells 21
isolated from adults at different stages of CMV infection 17. The highly 22
significant correlation of infant transcripts with CMV virus specific CD8+ T-cell 23
transcripts from adults confirms the prominence of an activated CD8+ T-cell 24
.CC-BY-NC-ND 4.0 International licensenot peer-reviewed) is the author/funder. It is made available under aThe copyright holder for this preprint (which was. http://dx.doi.org/10.1101/222646doi: bioRxiv preprint first posted online Nov. 30, 2017;

12
response in unstimulated PBMC of CMV ELISpot positive infants (Additional 1
Figure 1 A and B). 2
3
.CC-BY-NC-ND 4.0 International licensenot peer-reviewed) is the author/funder. It is made available under aThe copyright holder for this preprint (which was. http://dx.doi.org/10.1101/222646doi: bioRxiv preprint first posted online Nov. 30, 2017;

13
1
2 3
Additional Figure 1. Prominence of CD8 T cell specific transcripts from total PBMC of CMV ELISpot positive infants. A) Spearman’s rho from correlations of gene expression from total PBMC of infants with a strong CMV ELISpot response >100 SFC/million with CD8+ T cells isolated from adults who were naïve or infected with CMV (transcripts with <20% FDR). B) Scatter plot of 84 overlapping transcripts between PBMC of infants with a strong CMV ELISpot response >100 SFC/million and transcripts from CMV virus specific effector CD8 T cells from CMV infected adults (GSE24151).
A
B
.CC-BY-NC-ND 4.0 International licensenot peer-reviewed) is the author/funder. It is made available under aThe copyright holder for this preprint (which was. http://dx.doi.org/10.1101/222646doi: bioRxiv preprint first posted online Nov. 30, 2017;

14
Interestingly, there was almost no overlap in differentially expressed genes 1
between CMV and EBV positive infants with only seven genes significantly 2
differentially expressed in both comparisons at an FDR of 20% (Additional 3
Figure 2). 4
5
6
7
8
Additional Figure 2. Little overlap in expression in infants who are either EBV or CMV ELISpot positive. Scatterplot of fold changes in response to EBV infection (x-axis) plotted against changes in response to CMV infection (y axis). The almost horizontal linear regression line indicates stronger changes in response to EBV. At an FDR of 20%, seven genes are significantly differentially expressed in both comparisons.
.CC-BY-NC-ND 4.0 International licensenot peer-reviewed) is the author/funder. It is made available under aThe copyright holder for this preprint (which was. http://dx.doi.org/10.1101/222646doi: bioRxiv preprint first posted online Nov. 30, 2017;

15
Our cellular data suggests that CMV IFN-γ responses are associated with 1
activated HLA-DR+ CD8+ T-cells and transcriptional analysis supports the 2
presence of an activated CD8+ T-cell phenotype amongst total, unstimulated 3
PBMC from CMV IFN-γ ELISpot positive infants. 4
5
CMV antigen-specific T-cell responses, measured up to 3 years prior to 6
detection of TB, associate with risk of TB disease in infants 7
CMV is associated with increased risk of HIV infection and disease progression 8
11,12,14. To determine if viral infection is associated with TB risk in our infant 9
cohort, we analyzed CMV-specific and EBV-specific IFN-γ ELISpot responses 10
in cases and controls. Infants dual positive for both EBV and CMV (n=3) were 11
excluded from the analysis. A CMV specific IFN-γ ELISpot response (response 12
>17 SFC/million at either time point), measured up to 3 years prior to TB 13
detection, was associated with increased risk of TB disease (CLR, p=0.043, OR 14
2.22 95% CI 1.02-4.83) (Figure 3A). EBV alone was not associated with risk 15
(Figure 3B), although a combined CMV and EBV response was associated with 16
increased risk of TB disease (CLR, p=0.025, OR 2.3 95% CI 1.11-4.79) (Figure 17
3C). To further explore this association, we analyzed time to TB diagnosis in 18
TB cases. Infants with a positive CMV or CMV/EBV+ ELISpot response 19
developed TB earlier than negative infants (Log Rank Mantel-Cox p=0.037, 20
Figure 3D and 3E). 21
We analyzed data by vaccine group and saw no evidence that CMV positive or 22
CMV/EBV positive infants immunized with MVA85A were at greater or lower 23
risk of TB disease when compared to CMV negative infants immunized with 24
MVA85A (p = 0.8355 for CMV and p = 0.9177 for CMV/EBV). 25
.CC-BY-NC-ND 4.0 International licensenot peer-reviewed) is the author/funder. It is made available under aThe copyright holder for this preprint (which was. http://dx.doi.org/10.1101/222646doi: bioRxiv preprint first posted online Nov. 30, 2017;

16
1 2
3
4
5
6
7
8
9
10
11
12
13
14
15
16
17
18
19
20
Figure 3. CMV+ infants are at increased risk of developing TB disease A) We saw a higher proportion of case (red) infants among CMV+ (n = 18/32) when compared to CMV- infants (n = 35/140). B) There was no significant enrichment for cases among EBV positive infants (n = 3/7 compared to n = 46/162) although Infants positive for either CMV or EBV (C) were at increased risk D) CMV+ infants (red) develop TB disease earlier in follow-up when compared to CMV- infants (blue) and E) Infants positive for either CMV or EBV develop TB disease earlier than CMV/EBV- infants.
A
D E
C B
.CC-BY-NC-ND 4.0 International licensenot peer-reviewed) is the author/funder. It is made available under aThe copyright holder for this preprint (which was. http://dx.doi.org/10.1101/222646doi: bioRxiv preprint first posted online Nov. 30, 2017;

17
A CMV specific IFN-γ response measured at 4-6 months of age, up to 3 years 1
before disease is detected, was a risk factor for the development of TB disease 2
in South African infants and this risk was greatest during the first 10 months of 3
follow-up. 4
5
Transcriptional evidence of activated T-cells, Type I IFN responses and 6
NK cells in infants up to 3 years prior to detection of TB 7
Because CMV ELISpot positive infants were at greater risk of disease, we 8
stratified transcriptome data by CMV status to identify transcripts able to 9
classify case and control infants. When CMV+ and CMV- infants were analyzed 10
together, 16 genes were significantly differentially expressed between cases 11
and controls (Figure 4A and Supp Table 3). LAG3 and VCAM1, known markers 12
of T-cell activation 18,22,23, had the greatest fold increase in expression in case 13
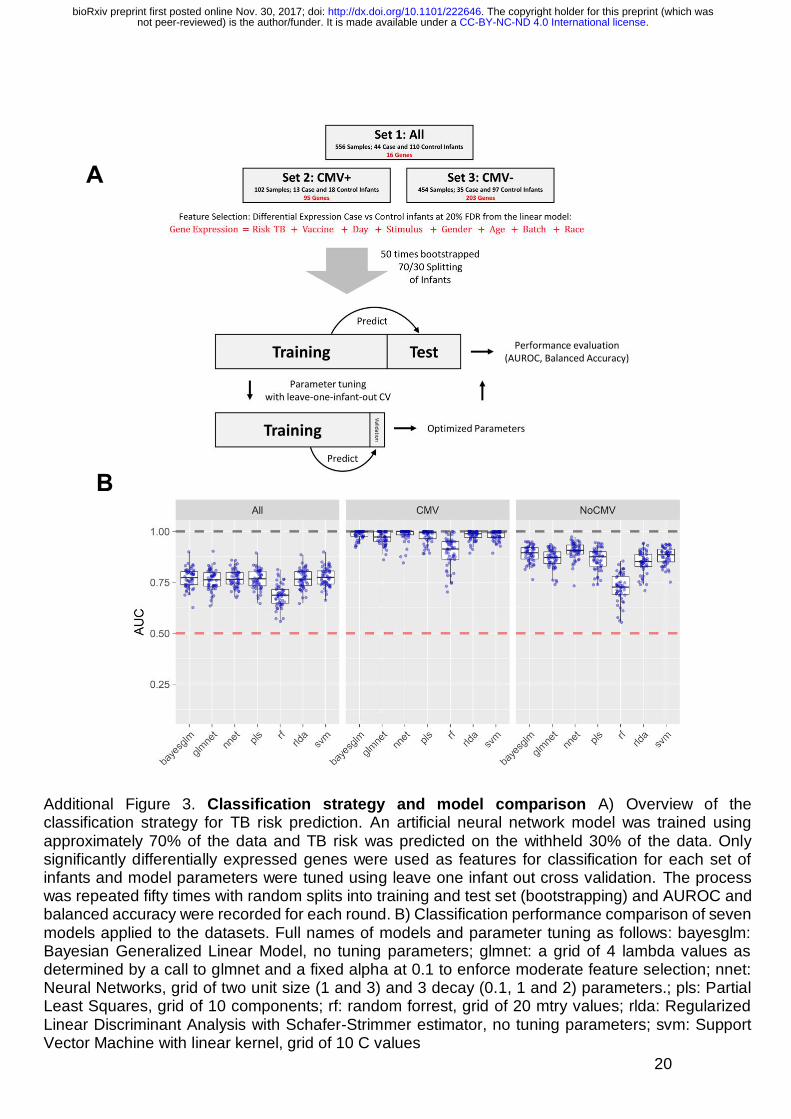
infants. To test our ability to classify infants into cases or controls we split 14
samples randomly into a 70% training set and 30% test set and trained an 15
artificial neural network (Additional Figure 3A). The process was repeated fifty 16
times with random splits into training and test set (bootstrapping) and AUROC 17
and accuracy were recorded to assess predictive stability (Additional Figure 4). 18
When all infants were included in the analysis we could classify infants into 19
cases and controls with an average accuracy of 67% (AUROC 0.77, 95% CI 20
0.69-0.85, Additional Figure 6 A). Prediction accuracies were comparable when 21
alternative, widely used classification algorithms were used (Additional Figure 22
3B). 23
24
.CC-BY-NC-ND 4.0 International licensenot peer-reviewed) is the author/funder. It is made available under aThe copyright holder for this preprint (which was. http://dx.doi.org/10.1101/222646doi: bioRxiv preprint first posted online Nov. 30, 2017;

18
1
A
B
D
E
F C
.CC-BY-NC-ND 4.0 International licensenot peer-reviewed) is the author/funder. It is made available under aThe copyright holder for this preprint (which was. http://dx.doi.org/10.1101/222646doi: bioRxiv preprint first posted online Nov. 30, 2017;

19
1
Figure 4. Transcriptomic correlates of risk of TB disease are different in CMV+ and CMV- infants Volcano plots showing magnitude and significance of differential expression between all case and control infants A), CMV+ case and control infants B) and C) CMV- case and control infants. The top 50 significant genes are labelled and horizontal and vertical dashed lines indicate 20% FDR and 5% change in gene expression respectively. D) Enriched modules for differential expression in case and control infants amongst all, CMV+ and CMV- infants. Each row contains one module with the number of genes indicated. Each significantly enriched module at a p-value < 0.05 is shown as a pie chart. The size of the pie corresponds to the AUROC in the cerno test, and intensity of the colour corresponds to the enrichment q-value. The red and blue colour indicates the amount of significant up and down regulated genes respectively, grey color indicates the remaining not significant genes within the category. The interaction term evaluates the statistical difference between changes in CMV+ and CMV- infants. E) AUROC of the classification performance of the artificial neural network model which was trained using approximately 70% of the data and risk of TB was predicted on the withheld 30% of the data (Additional Figure 3 A). The process was repeated fifty times with random splits into training and test set (bootstrapping) and the AUROC was recorded for each round for E) CMV+ and F) CMV- infants respectively.
.CC-BY-NC-ND 4.0 International licensenot peer-reviewed) is the author/funder. It is made available under aThe copyright holder for this preprint (which was. http://dx.doi.org/10.1101/222646doi: bioRxiv preprint first posted online Nov. 30, 2017;
20
Additional Figure 3. Classification strategy and model comparison A) Overview of the classification strategy for TB risk prediction. An artificial neural network model was trained using approximately 70% of the data and TB risk was predicted on the withheld 30% of the data. Only significantly differentially expressed genes were used as features for classification for each set of infants and model parameters were tuned using leave one infant out cross validation. The process was repeated fifty times with random splits into training and test set (bootstrapping) and AUROC and balanced accuracy were recorded for each round. B) Classification performance comparison of seven models applied to the datasets. Full names of models and parameter tuning as follows: bayesglm: Bayesian Generalized Linear Model, no tuning parameters; glmnet: a grid of 4 lambda values as determined by a call to glmnet and a fixed alpha at 0.1 to enforce moderate feature selection; nnet: Neural Networks, grid of two unit size (1 and 3) and 3 decay (0.1, 1 and 2) parameters.; pls: Partial Least Squares, grid of 10 components; rf: random forrest, grid of 20 mtry values; rlda: Regularized Linear Discriminant Analysis with Schafer-Strimmer estimator, no tuning parameters; svm: Support Vector Machine with linear kernel, grid of 10 C values
A
B
.CC-BY-NC-ND 4.0 International licensenot peer-reviewed) is the author/funder. It is made available under aThe copyright holder for this preprint (which was. http://dx.doi.org/10.1101/222646doi: bioRxiv preprint first posted online Nov. 30, 2017;

21
Additional Figure 4. Boxplots showing the relative importance of features used to train the classifier for each data set. For each repeat, features were ranked by variable importance and the relative rank was recorded. The lower the average number, the more often a feature has been assigned a high importance by the classifier during the fifty repeated predictions. The color indicates the Case vs Control infants log2 fold change estimate based on the differential expression analysis.
All
CMV+ CMV-
.CC-BY-NC-ND 4.0 International licensenot peer-reviewed) is the author/funder. It is made available under aThe copyright holder for this preprint (which was. http://dx.doi.org/10.1101/222646doi: bioRxiv preprint first posted online Nov. 30, 2017;

22
Additional Figure 5. Average prediction accuracies for risk of TB are very high in infants stratified by their CMV status. Box plots of probabilities assigned to each sample by the trained neural network. Each box plot represents one infant and contains stimulated as well as unstimulated samples and the results of fifty bootstrapped repeats of the prediction. Left and right panel divide the infants into cases and controls and point color indicates the classification decision by the model.
All
CM
V+
C
MV
-
.CC-BY-NC-ND 4.0 International licensenot peer-reviewed) is the author/funder. It is made available under aThe copyright holder for this preprint (which was. http://dx.doi.org/10.1101/222646doi: bioRxiv preprint first posted online Nov. 30, 2017;

23
In CMV+ healthy infants who developed TB in the following 3 years (cases), the 1
NK cell associated cytokine IL32 and the NK cell-specific lectin-like receptors 2
KLRC1 and KLRC3 were among transcripts with the greatest decrease in fold-3
change of expression and the highest predictive power (Figure 4B, Additional 4
Figure 4 and Supp Table 4). IL32 enhances maturation of monocytes to 5
macrophages and has been shown to be important for protection against 6
Mycobacterium tuberculosis (M.tb) 24. In our cellular analysis we observed 7
decreased frequencies of CD3-CD8-CD4- (triple negative) CD16- and CD16+ 8
natural killer cells in infants who develop TB disease in the next 3 years when 9
compared to CMV+ infants who do not develop disease (Additional Figure 6B). 10
In CMV- case infants, elevated expression of T-cell activation markers, 11
including LAG3 and VCAM1, markers of a type I/II IFN response including 12
IFIT3, and enhanced expression of a broad range of both activated and 13
inhibitory KIR receptors including KIR2DL1, KIR2DL3, KIR2DL4, KIR2DL5A, 14
KIR2DS3, KIR2DS5, KIR3DL1 and KIR3DL3 were observed (Figure 4C and 15
Supp Table 5). Modular pathway analysis showed enrichment for NK and KIR 16
cluster genes and a type I/II IFN antiviral immune response in CMV- case 17
infants when compared to controls (Figure 4D). However, we saw no evidence 18
of increased NK cell frequency in infants who develop TB disease in our cellular 19
analysis (Additional Figure 6B). 20
TB risk associated transcripts and immune pathways were different among 21
CMV+ and CMV- infants, as highlighted by a modular pathway analysis which 22
uses an interaction term to compare pathways associated with TB risk among 23
CMV+ and CMV- infants (Figure 4D and Supp Table 6). 24
.CC-BY-NC-ND 4.0 International licensenot peer-reviewed) is the author/funder. It is made available under aThe copyright holder for this preprint (which was. http://dx.doi.org/10.1101/222646doi: bioRxiv preprint first posted online Nov. 30, 2017;

24
When infants were stratified by CMV status we were able to classify cases and 1
controls within the CMV+ cohort with 92% average balanced accuracy and 2
within the CMV- cohort with 89% average balanced accuracy with an average 3
AUROC of 0.98 (95% CI 0.96-1) and 0.9 (95% CI 0.85-0.96), respectively 4
(Figure 4 E and F and Additional Figures 4). 5
6
7
.CC-BY-NC-ND 4.0 International licensenot peer-reviewed) is the author/funder. It is made available under aThe copyright holder for this preprint (which was. http://dx.doi.org/10.1101/222646doi: bioRxiv preprint first posted online Nov. 30, 2017;

25
1 2
Additional Figure 6. Classification into cases and controls using all samples. A) Classification performance of the artificial neural network using CMV+ and CMV- infants. B) CD16- and CD16+ (putative) NK cell frequencies among case and control infants with and without a CMV response
A
B
.CC-BY-NC-ND 4.0 International licensenot peer-reviewed) is the author/funder. It is made available under aThe copyright holder for this preprint (which was. http://dx.doi.org/10.1101/222646doi: bioRxiv preprint first posted online Nov. 30, 2017;

26
To validate the classifier signatures, we used raw data from an independent 1
cohort of 10-week-old South African infants vaccinated with BCG at birth and 2
unknown CMV status (GEO gene set GSE20716, Fletcher et. al. 3) Infants were 3
enrolled into an efficacy trial of intradermal or percutaneous delivery of 4
Japanese BCG at birth 7. A nested correlates of risk study was performed using 5
blood from 10-week-old healthy infants who developed TB disease within the 6
next two years 3,25. We sought to remove technical differences between the two 7
array data sets to enable validation of classifier signatures (Additional Figure 8
7A), however, we could not fully normalize expression between the two data 9
sets, most likely due to the age difference between infants in the two cohorts 10
(2-3 months in GSE20716 and 4-6 months in the MVA85A efficacy trial) 11
(Additional Figure 7B). Despite these cohort differences and the loss of more 12
than half of the genes in our signature due to microarray platform differences, 13
we were able to predict risk of TB using our CMV- classifier with an accuracy 14
of 63.9% and an AUROC of 0.71 (95% CI 0.63-0.79, Additional Figure 7C). 15
Next, we attempted to improve accuracy by prediction and removal of infants 16
with suspected CMV infection. The number of CMV positive infants with more 17
than one predicted positive sample was low (n = 5, Additional Figure 7C) and 18
excluding these infants lead to a slight but not significant improvement in 19
balanced accuracy of 65.6% and an AUROC of 0.74 (Additional Figure 7E). 20
.CC-BY-NC-ND 4.0 International licensenot peer-reviewed) is the author/funder. It is made available under aThe copyright holder for this preprint (which was. http://dx.doi.org/10.1101/222646doi: bioRxiv preprint first posted online Nov. 30, 2017;

27
1
2
3
4
5
6
7
8
9
10
11
12
13
A
B
D
C
E
.CC-BY-NC-ND 4.0 International licensenot peer-reviewed) is the author/funder. It is made available under aThe copyright holder for this preprint (which was. http://dx.doi.org/10.1101/222646doi: bioRxiv preprint first posted online Nov. 30, 2017;

28
1
Additional Figure 7. Validation of TB predictive biomarkers from CMV- infants in an independent cohort of BCG vaccinated infants Raw data and detection p values from an independent cohort of 10 week old South African infants vaccinated with BCG at birth (GEO gene set GSE207163) were used as a validation cohort for the classifier signatures from CMV+ and CMV- infants. 20589 Probes from 182 samples were mapped from Illumina HumanRef-seq 8 arrays to Gencode v.23 and 8 outlier samples were excluded A) The effects of time point (4 or 12 hours) and BCG Stimulation (stimulated or unstimulated) were removed and 9195 probes identified as overlapping between the two studies. B) We were only partially able to remove differences in gene expression due to study of origin. The differences observed in PC2 are driven by age, which was non-overlapping in the two studies, 2-3 months in GSE20716 and 4-6 months in the MVA85A efficacy trial.C) Using 55 genes differentially expressed between infants with very high or low CMV titres at an FDR of 5%, 5 infants were identified to have two or more CMV positive samples. D) The charts represents one dot per sample and red colour indicates samples classified as CMV+. The TB Risk dot plot shows samples with correctly predicted Case (TP) and Control (TN) status as well as samples with wrong Case (FP) and Control (FN) labels. E). Excluding all five suspected CMV+ infants we were able to improve risk of TB prediction accuracyon GSE207163slightly, with balanced accuracy of 65.6%.
.CC-BY-NC-ND 4.0 International licensenot peer-reviewed) is the author/funder. It is made available under aThe copyright holder for this preprint (which was. http://dx.doi.org/10.1101/222646doi: bioRxiv preprint first posted online Nov. 30, 2017;

29
Finally, we looked for enrichment of transcripts from the 16- peripheral blood 1
gene correlate of risk (CoR) signature associated with progression to TB 2
disease in M.tb infected adolescents2 among our CMV+ and CMV- infants. This 3
adolescent CoR signature was significantly enriched among case infants when 4
compared to controls and the enrichment was strongest amongst CMV- infants 5
(Additional Figure 8A). However, the adolescent CoR signature was not able 6
to accurately classify infants into cases and controls (Additional Figure 8B). 7
Including the CoR score in our infant network analysis we show that the CoR 8
score correlates with the frequency of inflammatory monocytes and with our 9
CMV- classifier signature (Additional Figure 8C). Our CMV+ classifier signature 10
is positively correlated with T cell frequency and negatively correlated with 11
monocyte and CD16+ NK cell frequency. 12
A network representation of positively correlating cell populations (Spearman’s 13
rho p-value <0.05) revealed 3 major clusters with the adolescent CoR and 14
infant CMV- classifier signature clustering together with inflammatory and 15
classical monocytes (Additional Figure 8D). 16
17
.CC-BY-NC-ND 4.0 International licensenot peer-reviewed) is the author/funder. It is made available under aThe copyright holder for this preprint (which was. http://dx.doi.org/10.1101/222646doi: bioRxiv preprint first posted online Nov. 30, 2017;

30
Additional Figure 8. Enrichment of TB predictive Correlate of TB Risk score (CoR) from adolescents among CMV- case infants when compared to controls, but no accuracy for prediction of TB in infants. Using a locked-down Illumina model published by Zak et al2 for prediction of TB progression, a blinded CoR score was derived for each infant. A) After unblinding, the CoR score was found to be significantly higher in case infants when compared to controls and the greatest difference in CoR score was between CMV- case and control infants B) However, despite enrichment in case infants, the CoR score was unable to accurately classify either CMV+ or CMV- infants as cases or controls. C) The CoR score correlates with the frequency of inflammatory monocytes and the CMV- infant classifier signature. D) Network of positively correlating cell populations (spearman rho p-value <0.05) showing a cluster containing the adolescent CoR score with monocytes, EBV ELISpot and the infant CMV- classifier score. Node colour indicates community membership and red and black edges are drawn between and within communities respectively (see methods). Edge width indicates the correlation coefficient.
A
D C
B
.CC-BY-NC-ND 4.0 International licensenot peer-reviewed) is the author/funder. It is made available under aThe copyright holder for this preprint (which was. http://dx.doi.org/10.1101/222646doi: bioRxiv preprint first posted online Nov. 30, 2017;

31
These findings further support distinct immunological correlates of risk of TB
disease in CMV+ and CMV- infants. Taken together our data show increased
T-cell activation, KIR receptor signaling and type I IFN response in CMV- case
infants and decreased NK cell associated transcripts in CMV+ case infants
when compared to their respective controls. Furthermore, we identified
transcriptomic signatures, which can identify infants with risk of TB disease with
high accuracy in CMV+ and CMV- infants and were able to validate the CMV-
biomarker signature in an independent study with moderate accuracy.
T-cell activation associates with lower mycobacterial antigen specific
immune response following immunization with MVA85A and BCG
To assess the impact of T-cell activation and CMV on the ability to mount an
antigen specific response following immunization with MVA85A, we examined
mycobacterial antigen specific IFN-γ responses and anti-Ag85A IgG in
MVA85A immunized infants at D28 following immunization with MVA85A. IFN-
γ responses to Ag85A, measured on D28, were inversely correlated with
activated CD4+ and CD8+ T-cell frequencies (Figure 5A and B). There was a
trend towards lower mycobacterial antigen specific IFN-γ responses and lower
anti-Ag85A IgG in CMV+ when compared to CMV- infants (p = 0.058, Mann-
Whitney U test) and Anti-Ag85A IgG was inversely correlated with CMV
ELISpot response in MVA85A immunized infants (Spearman’s Rho, p = 0.026,
Figure 5 C and D).
.CC-BY-NC-ND 4.0 International licensenot peer-reviewed) is the author/funder. It is made available under aThe copyright holder for this preprint (which was. http://dx.doi.org/10.1101/222646doi: bioRxiv preprint first posted online Nov. 30, 2017;

32
Figure 5. T cell activation is associated with lower mycobacterial antigen
specific immune response following immunization with MVA85A The D28 IFN-γ
ELISpot response to Ag85A was inversely correlated with both A) activated CD4 T cell and B) activated CD8 T cell frequency C) There was a trend for lower anti-Ag85A IgG in CMV+ compared to CMV- infants following immunization with MVA85A. D) anti-Ag85A IgG was inversely correlated with CMV ELISpot response. Mann Whitney U test and Spearman Spearman’s Rho correlation. Red = cases and grey = controls.
D C
A B
.CC-BY-NC-ND 4.0 International licensenot peer-reviewed) is the author/funder. It is made available under aThe copyright holder for this preprint (which was. http://dx.doi.org/10.1101/222646doi: bioRxiv preprint first posted online Nov. 30, 2017;

33
These data show that T-cell activation and CMV infection influence MVA85A
boosting of an antigen specific immune response.
DISCUSSION
We demonstrate, in healthy infants, that CD8+ T-cell activation and prior or sub-
clinical infection with CMV (defined by a positive CMV-specific T-cell response)
are associated with increased risk of developing TB disease over the next 3
years of life. We also show that CMV+ infants acquire TB disease earlier than
CMV- infants. These data complement our previous finding that CD4+ T-cell
activation was associated with TB disease risk in infants and adolescents from
a South African community with very high TB incidence 8. Previous studies have
reported that infection with CMV enhances the risk of HIV acquisition and
disease progression, through expansion of activated CD8+ T-cells, depletion of
naïve T-cells and T-cell senescence 11-14. In Gambian infants, CMV infection
induced profound CD8+ T-cell differentiation and activation which persisted up
to 2 years after infection 26,27. Consistent with this effect, we show that infants
with a positive T-cell response to CMV peptides have a transcriptional signature
associated with CMV specific CD8+ T-cells 17. However, among CMV+ infants,
T-cell activation markers were not differentially expressed between case and
control infants. In CMV+ infants, transcripts associated with NK cells were lower
in cases when compared to controls. A role for NK cells in protection from TB
disease has been demonstrated both in humans and animal models and it is
possible than an impaired NK cell response is associated with TB disease risk
among CMV+ infants 28-34.
.CC-BY-NC-ND 4.0 International licensenot peer-reviewed) is the author/funder. It is made available under aThe copyright holder for this preprint (which was. http://dx.doi.org/10.1101/222646doi: bioRxiv preprint first posted online Nov. 30, 2017;
34
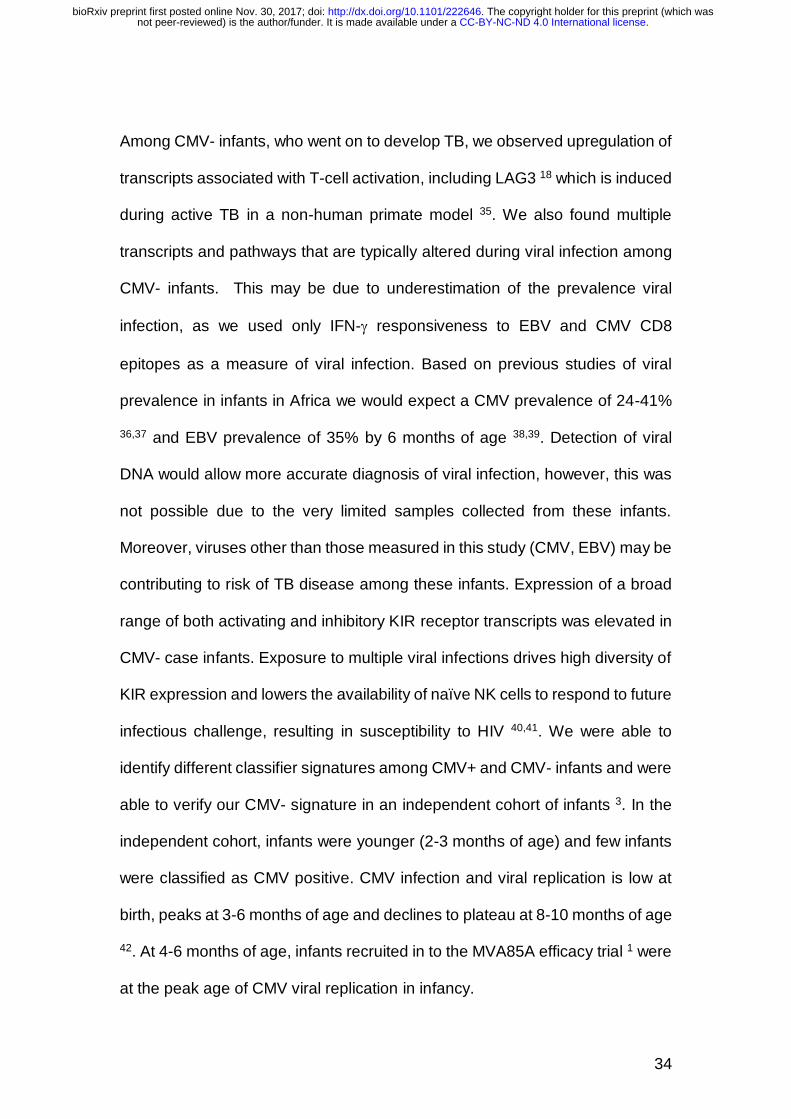
Among CMV- infants, who went on to develop TB, we observed upregulation of
transcripts associated with T-cell activation, including LAG3 18 which is induced
during active TB in a non-human primate model 35. We also found multiple
transcripts and pathways that are typically altered during viral infection among
CMV- infants. This may be due to underestimation of the prevalence viral
infection, as we used only IFN- responsiveness to EBV and CMV CD8
epitopes as a measure of viral infection. Based on previous studies of viral
prevalence in infants in Africa we would expect a CMV prevalence of 24-41%
36,37 and EBV prevalence of 35% by 6 months of age 38,39. Detection of viral
DNA would allow more accurate diagnosis of viral infection, however, this was
not possible due to the very limited samples collected from these infants.
Moreover, viruses other than those measured in this study (CMV, EBV) may be
contributing to risk of TB disease among these infants. Expression of a broad
range of both activating and inhibitory KIR receptor transcripts was elevated in
CMV- case infants. Exposure to multiple viral infections drives high diversity of
KIR expression and lowers the availability of naïve NK cells to respond to future
infectious challenge, resulting in susceptibility to HIV 40,41. We were able to
identify different classifier signatures among CMV+ and CMV- infants and were
able to verify our CMV- signature in an independent cohort of infants 3. In the
independent cohort, infants were younger (2-3 months of age) and few infants
were classified as CMV positive. CMV infection and viral replication is low at
birth, peaks at 3-6 months of age and declines to plateau at 8-10 months of age
42. At 4-6 months of age, infants recruited in to the MVA85A efficacy trial 1 were
at the peak age of CMV viral replication in infancy.
.CC-BY-NC-ND 4.0 International licensenot peer-reviewed) is the author/funder. It is made available under aThe copyright holder for this preprint (which was. http://dx.doi.org/10.1101/222646doi: bioRxiv preprint first posted online Nov. 30, 2017;

35
Our transcriptional evidence of antiviral immune responses in infants who
develop TB disease is also consistent with the observations of Zak et al. 2 who
reported increased expression of Type I/II IFN associated transcripts in M.tb-
infected adolescents who progressed to TB disease. Increased Type I/II IFN
transcripts have also been observed in patients with active TB disease, when
compared to M.tb-infected or uninfected controls 43-47. Recent data from the
M.tb-infected adolescent study has shown that an increased Type I/II IFN
response precedes a shift towards an elevated monocyte to lymphocyte ratio
and an increase in T cell activation, which are detected closer to the time of TB
disease 48. The authors suggest that the initial elevation in Type I/II IFN could
be driven by viral infection and that this could then trigger the immune events
that lead to TB susceptibility 48. Consistent with this we found a correlation of
the adolescent CoR score with an EBV response and with elevated
CD14+CD16+ inflammatory cells. We also observed significant enrichment of
the 16-gene CoR signature identified by Zak et al. among our CMV- case
infants2. However, the CoR signature was not able to accurately classify case
and control infants. In our study, the infants were not infected with M.tb, had no
symptoms of TB disease and no known exposure to TB in the household during
enrolment or when the blood samples were obtained. In addition, since incident
TB disease was diagnosed months to years after blood sample collection it is
unlikely that the elevated type I/II IFN associated transcriptomic signatures we
observed are a result of sub-clinical TB disease. Although there was no
evidence of BCG vaccine-induced disease in these infants we cannot rule out
.CC-BY-NC-ND 4.0 International licensenot peer-reviewed) is the author/funder. It is made available under aThe copyright holder for this preprint (which was. http://dx.doi.org/10.1101/222646doi: bioRxiv preprint first posted online Nov. 30, 2017;
36
that persistent, sub-clinical, replication of BCG vaccine could be driving a type
I/II IFN response in some infants.
All infants in this study received BCG at birth and the T cell response to BCG
peaks at 2-3 months of age 49. Viral infections during the development of the
BCG-specific immune response may impair the development of protective
immunity, as has been suggested by studies in Malawi 50. In the Gambia,
exposure to HIV in utero and being born in the wet season, associated with
increased respiratory and diarrheal disease, have been shown to impact the
BCG antigen specific T-cell response following vaccination 26,51. We observed
an inverse correlation between CD4+ and CD8+ T-cell activation and antigen
specific T-cell responses following immunization with MVA85A, suggesting that
T-cell activation may be associated with decreased vaccine boosting in infants.
This confirms previous observations where increased immune activation
associated with lower immune responses to MVA85A in both infants and adults
52,53 It could also explain why immune responses to MVA85A were lower when
administered within a week of vaccination with DTwP-Hib and hepatitis B in the
Expanded Programme on Immunization (EPI) schedule 54.
Childhood TB is difficult to diagnose and treat and improved strategies are
needed to control TB in children 5. We found that CMV infection was associated
with increased risk of developing TB disease in infants and that distinct immune
pathways were associated with TB disease risk in CMV+ and CMV- infants. We
suggest that viral infection can increase the risk of progression to TB disease
and may compromise the immune response to TB vaccines given in infancy.
Strategies which include the use of vaccines or antivirals to reduce chronic viral
.CC-BY-NC-ND 4.0 International licensenot peer-reviewed) is the author/funder. It is made available under aThe copyright holder for this preprint (which was. http://dx.doi.org/10.1101/222646doi: bioRxiv preprint first posted online Nov. 30, 2017;

37
infection in infancy could enhance TB vaccine efficacy, reduce TB risk and help
to reduce the global burden of childhood TB.
.CC-BY-NC-ND 4.0 International licensenot peer-reviewed) is the author/funder. It is made available under aThe copyright holder for this preprint (which was. http://dx.doi.org/10.1101/222646doi: bioRxiv preprint first posted online Nov. 30, 2017;

38
METHODS
Case-control design
BCG-vaccinated infants who were enrolled in an efficacy trial of the candidate
TB vaccine MVA85A were included in this study, ClinicalTrials.gov number
NCT00953927 1 (Figure 1). This trial was approved by the University of Cape
Town Faculty of Health Sciences Human Research Ethics Committee, Oxford
University Tropical Research Ethics Committee, and the Medicines Control
Council of South Africa. All infants received BCG within 7 days of birth. HIV and
M.tb uninfected infants without known TB exposure were randomized at 16-24
weeks of age to receive a single intradermal dose of MVA85A or placebo
(Candin™, a candida skin test antigen)1.
Transcriptomic analysis was performed using PBMC from infants who were
included in our previously described case-control study 8. Briefly, infants who
met the primary case definition for TB disease were included as cases and for
each case, three infants were randomly selected from a pool of controls (Figure
1). Infants were included in the control pool if they did not demonstrate M.tb
infection as defined by a positive QuantiFERON TB Gold In-tube test (Cellestis,
Australia); had not received TB treatment and had not received isozianid
preventive therapy during study follow-up. Matching was based on gender,
ethnic group, CDC weight-for-age percentile (± 10 points), and time on study (±
9 months).
Infant PBMC samples collected from two time points Day 0 (D0) and Day 28
(D28) were combined for testing of both cellular parameters and transcriptional
signatures associated with risk of TB disease. Only infants for whom a sample
.CC-BY-NC-ND 4.0 International licensenot peer-reviewed) is the author/funder. It is made available under aThe copyright holder for this preprint (which was. http://dx.doi.org/10.1101/222646doi: bioRxiv preprint first posted online Nov. 30, 2017;

39
was available at both D0 and D28 were included in the analysis resulting in
combined analysis of a maximum of 98 samples from 49 cases and 258
samples from 129 controls (actual numbers in analysis vary per availability of
assay data and are listed in Table 1, Figure 1).
Cell culture
PBMC were retrieved from liquid nitrogen storage, thawed and rested for 2
hours in media containing DNase to aid the removal of debris from dead and
dying cells. After 2 hours cells were counted and immediately transferred to cell
culture plates for stimulation for RNA extraction, ELISpot assays or
measurement of cell-surface markers assessed by flow cytometry. Viability of
thawed PBMC was assessed using flow cytometry with Live/Dead Violet stain
(Invitrogen). Phytohemagglutinin (PHA) was included as a positive control for
cell viability on ELISpot plates.
RNA processing
Rested PBMC (1 x 10⁶) were resuspended in single wells of 200l RPMI
supplemented with 10% FBS and L-glutamine. Cells were stimulated for 12
hours at 37°C in single wells containing live BCG SSI from pooled vaccine vials
(~2 × 10⁵ CFU/ml). After 12 hours of stimulation cells were pelleted and lysed
in RNA lysis buffer (RLT, Qiagen). RNA was extracted using the RNeasy Mini
Kit (Qiagen) per the manufacturer’s instructions with the following modification;
in the first step an equal volume of 80% ethanol was added to cells lysed in
RLT buffer, mixed and total volume transferred to an RNeasy column. RNA
was quantified by Nanodrop and stored at -80°C until use. Extracted RNA was
.CC-BY-NC-ND 4.0 International licensenot peer-reviewed) is the author/funder. It is made available under aThe copyright holder for this preprint (which was. http://dx.doi.org/10.1101/222646doi: bioRxiv preprint first posted online Nov. 30, 2017;
40
amplified and labeled with biotin using the Illumina Total Prep kit (Ambion) per
manufacturer’s instructions. Amplified RNA was assessed by nanodrop and
Bioanalyzer for quantity and quality prior to hybridization. Hybridization to
Illumina HT-12 arrays was performed per manufacturer’s instructions. Arrays
were scanned using an Illumina iScan machine and data extracted using
Genome Studio software.
Ex vivo IFN-γ ELISpot assay
The ex vivo IFN-γ ELISpot assay was performed as previously described using
a human IFN-γ ELISpot kit (capture mAb -D1K) (Mabtech) 8. Briefly, duplicate
wells containing 3 × 10⁵ PBMC were stimulated for 18 hours with antigen, PHA
or media alone. Antigens included a single pool of Ag85A peptides (2
μg/ml/peptide) (Peptide Protein Research); BCG (2 × 10⁵ CFU/ml (Statens
Serum Institute)); purified protein derivative (PPD) from M. tuberculosis (20
μg/ml) (Statens Serum Institute); peptide pools containing known CD8+ T-cell
epitopes from EBV (15 peptides), and CMV (5 peptides), (2 μg/ml/peptide,
ANASPEC). Results are reported as spot-forming cells (SFC) per million
PBMC, calculated by subtracting the mean of the unstimulated wells from the
mean of antigen wells and correcting for the number of PBMC. A response was
considered positive if the mean number of spots in the antigen well was at least
twice the mean of the unstimulated wells and at least 5 spots greater.
Cell surface flow cytometry
As previously described 8 PBMC were washed and stained with 5μl Live/Dead
Violet (Invitrogen) followed by surface staining with the following titrated
.CC-BY-NC-ND 4.0 International licensenot peer-reviewed) is the author/funder. It is made available under aThe copyright holder for this preprint (which was. http://dx.doi.org/10.1101/222646doi: bioRxiv preprint first posted online Nov. 30, 2017;

41
antibodies: 0.5μl CD3-AF700 (clone UCHT1, Ebioscience), 2μl CD4-APC
(clone RPA-T4, Biolegend), 2μl CD8-Efluor605 (clone RPA-T8, Ebioscience),
2μl CD14-PE/Cy7 (clone HCD14, Biolegend), 2μl CD16-AF488 (clone 3G8,
Biolegend), 1μl CD19-PE/Cy5 (clone HIB19, Biolegend), 2μl CD25-APC/Cy7
(clone BC96, Biolegend), 2μl CD127-NC650 (clone eBioRDR5, Ebioscience)
and 15μl HLA-DR-PE (clone L243 Biolegend). Fluorescence minus one (FMO)
controls were used to set gates for CD25, CD127 and HLA-DR. Samples were
acquired on a BD LSR II flow cytometer. Results are presented as percentages
of cells after excluding dead cells and doublets. CD4+ and CD8+ T-cells were
identified as CD3+ cells, while CD14+/− and CD16+/− cells were identified as
CD3− and CD19− populations. CD25+ CD27− populations were gated on the
CD4+ cells. The network representation of cell populations positively correlated
among all infants was done using the igraph package in R. To identify closely
related clusters (communities) within the network, the ‘cluster_optimal’ function
was used implementing an algorithm described in Brandes et. al.4
Transcriptional analysis
Raw, probe level summary values exported from Illumina GenomeStudio 2011
of Illumina HumanHT 12 V4 microarrays were imported into R using beadarray
55. Probes were background corrected using negative control probes followed
by quantile normalization using the neqc command 56. The analysis was
restricted to probes with a detection p-value of <0.01 in at least 10% of the
samples and probes matching to the transcript definition of the following
databases (in descending importance) with at most 2 mismatches, no insertions
.CC-BY-NC-ND 4.0 International licensenot peer-reviewed) is the author/funder. It is made available under aThe copyright holder for this preprint (which was. http://dx.doi.org/10.1101/222646doi: bioRxiv preprint first posted online Nov. 30, 2017;

42
and a minimum mapping length of 40 bases: GENCODE version 23, RefSeq
(refMrna.fa) and GenBank (mrna.fa) downloaded in August 2015 from
http://hgdownload.cse.ucsc.edu/goldenPath/hg38/bigZips/.
A linear model was fitted using limma 57 to determine differential expression
adjusted for vaccine, day, stimulus, gender, age, ethnicity and batch effects.
Array quality weights were incorporated 58 to account for between array quality
differences. To account for between patient correlations, the
duplicateCorrelation command from the limma package was used. Nominal p-
values were corrected for multiple hypotheses testing using the Benjamini-
Hochberg procedure 59. Due to the heterogeneity of the samples, a lenient cut
off at an FDR of 20% was chosen to identify genes as significantly differentially
expressed. In total 221, 101 and 16 probes mapping to 203, 95 and 16 genes
were significantly differentially expressed between Case and Control infants
within CMV-, CMV+ and the combined group respectively. For the comparison
of EBV+ versus EBV-, CMV+ versus CMV- and CMV strongly positive (ELISpot
>100 SFC/million) versus CMV- in total 334, 14 and 103 probes mapping to
296, 14 and 97 genes were significantly differentially expressed respectively.
Gene set enrichment analysis was carried out using the cerno test from the
tmod package in R. Modules for the enrichment analysis were taken from Li et
al.60. Datasets used for comparative analysis to CMV infected CD8 T-cells were
obtained from Gene Expression Omnibus by downloading GSE12589 and
GSE24151.
.CC-BY-NC-ND 4.0 International licensenot peer-reviewed) is the author/funder. It is made available under aThe copyright holder for this preprint (which was. http://dx.doi.org/10.1101/222646doi: bioRxiv preprint first posted online Nov. 30, 2017;
43
Classification
For classification into cases and control samples, we used normalized
microarray intensities adjusted for scan date, sample collection time point (Day
0 or Day 28) and stimulation (unstimulated or BCG stimulated). Features for
training were selected by using the significant probes at 20% FDR and selecting
only the probe with the highest average expression per gene giving the final
transcriptional signature size of 95, 203 and 16 genes for CMV+, CMV- and all
infants, respectively. Each infant was represented either by sets of two samples
(unstimulated and BCG stimulated either at Day 0 or Day 28) or by sets of four
samples (unstimulated or BCG stimulated at Day 0 and Day 28). To avoid
overfitting, we implemented a modified nested cross validation scheme such
that only complete sample sets per infant were assigned to either test or training
set at each splitting iteration during the cross-validation process.
Model training was performed using a neural network model as implemented in
the nnet package through the caret interface in R 61. In the outer loop, samples
were split 50 times with replacement into training (about 70%) and test sets
(about 30%) to evaluate model performance and feature importance. For model
parameter tuning in the inner loop, each training set was split into training and
validation sets using a leave-one-infant-out cross validation scheme and the
AUROC was recorded as performance metric over a grid of 4 size and 4 decay
parameter combinations. All accuracies stated in the manuscript are provided
as balanced accuracies62 to account for the imbalance of the case and control
infants within our cohort.
To validate our classification results, an independent cohort of 10-week-old
South African infants vaccinated with BCG at birth was obtained as raw
.CC-BY-NC-ND 4.0 International licensenot peer-reviewed) is the author/funder. It is made available under aThe copyright holder for this preprint (which was. http://dx.doi.org/10.1101/222646doi: bioRxiv preprint first posted online Nov. 30, 2017;

44
expression data from Gene Expression Omnibus by downloading GSE20716.
Study batch was removed with the ComBat command in R using parametric
adjustment, risk of TB as null model and the validation cohort as reference in
order to avoid any bias on the validation cohort, For prediction of risk of TB,
112, 50 and 5 probes overlapped between Illumina HumanHT 12 V4 and
Illumina HumanRef-8 V2 for within CMV-, CMV+ and the combined group
respectively. CMV status prediction was performed using 55 overlapping
probes which were differentially expressed between CMV negative and CMV
strongly positive (ELISpot >100 SFC/million) infants at an FDR of 20%. Only
infants with at least two positive samples were labelled as suspected CMV+.
Data availability
Raw and normalized expression data have been deposited at Gene Expression
Omnibus under the accession number GSE98550
Acknowledgements
We thank study participants and their families, the community of Cape
Winelands East district, and South African Tuberculosis Vaccine Initiative
(SATVI) personnel. This work was funded by Aeras and The Wellcome Trust
with support from the European Commission within the 7th framework program
(FP7) NEWTBVAC (Grant No. HEALTH-F3-2009-241745) and by the
European Commission within Horizon2020 TBVAC2020 (Grant No. H2020
PHC-643381). HM is a Wellcome Trust Senior Clinical Research Fellow.
.CC-BY-NC-ND 4.0 International licensenot peer-reviewed) is the author/funder. It is made available under aThe copyright holder for this preprint (which was. http://dx.doi.org/10.1101/222646doi: bioRxiv preprint first posted online Nov. 30, 2017;

45
REFERENCES
1 Tameris, M. D. et al. Safety and efficacy of MVA85A, a new tuberculosis vaccine, in infants previously vaccinated with BCG: a randomised, placebo-controlled phase 2b trial. Lancet 381, 1021-1028, doi:10.1016/S0140-6736(13)60177-4 (2013).
2 Zak, D. E. et al. A blood RNA signature for tuberculosis disease risk: a prospective cohort study. Lancet 387, 2312-2322, doi:10.1016/S0140-6736(15)01316-1 (2016).
3 Fletcher, H. A. et al. Human newborn bacille Calmette-Guerin vaccination and risk of tuberculosis disease: a case-control study. BMC Med 14, 76, doi:10.1186/s12916-016-0617-3 (2016).
4 Brandes, U. et al. On Modularity Clustering. IEEE Trans Knowl Data Eng 20, 172-188, doi:10.1109/TKDE.2007.190689 (2008).
5 Organisation, W. H. Global Tuberculosis Report 2016. (2016). 6 Lamb, G. S. & Starke, J. R. Tuberculosis in Infants and Children. Microbiol
Spectr 5, doi:10.1128/microbiolspec.TNMI7-0037-2016 (2017). 7 Hawkridge, A. et al. Efficacy of percutaneous versus intradermal BCG in the
prevention of tuberculosis in South African infants: randomised trial. BMJ 337, a2052, doi:10.1136/bmj.a2052 (2008).
8 Fletcher, H. A. et al. T-cell activation is an immune correlate of risk in BCG vaccinated infants. Nat Commun 7, 11290, doi:10.1038/ncomms11290 (2016).
9 Klenerman, P. & Hill, A. T cells and viral persistence: lessons from diverse infections. Nat Immunol 6, 873-879, doi:10.1038/ni1241 (2005).
10 Appay, V. & Sauce, D. Immune activation and inflammation in HIV-1 infection: causes and consequences. J Pathol 214, 231-241, doi:10.1002/path.2276 (2008).
11 Wittkop, L. et al. Effect of cytomegalovirus-induced immune response, self antigen-induced immune response, and microbial translocation on chronic immune activation in successfully treated HIV type 1-infected patients: the ANRS CO3 Aquitaine Cohort. The Journal of infectious diseases 207, 622-627, doi:10.1093/infdis/jis732 (2013).
12 Evans, T. G. et al. Expansion of the CD57 subset of CD8 T cells in HIV-1 infection is related to CMV serostatus. Aids 13, 1139-1141 (1999).
13 Gronborg, H. L., Jespersen, S., Honge, B. L., Jensen-Fangel, S. & Wejse, C. Review of cytomegalovirus coinfection in HIV-infected individuals in Africa. Rev Med Virol 27, doi:10.1002/rmv.1907 (2017).
14 Gianella, S. et al. Replication of Human Herpesviruses Is Associated with Higher HIV DNA Levels during Antiretroviral Therapy Started at Early Phases of HIV Infection. J Virol 90, 3944-3952, doi:10.1128/JVI.02638-15 (2016).
15 Klatt, N. R., Chomont, N., Douek, D. C. & Deeks, S. G. Immune activation and HIV persistence: implications for curative approaches to HIV infection. Immunol Rev 254, 326-342, doi:10.1111/imr.12065 (2013).
16 Adland, E., Klenerman, P., Goulder, P. & Matthews, P. C. Ongoing burden of disease and mortality from HIV/CMV coinfection in Africa in the
.CC-BY-NC-ND 4.0 International licensenot peer-reviewed) is the author/funder. It is made available under aThe copyright holder for this preprint (which was. http://dx.doi.org/10.1101/222646doi: bioRxiv preprint first posted online Nov. 30, 2017;

46
antiretroviral therapy era. Front Microbiol 6, 1016, doi:10.3389/fmicb.2015.01016 (2015).
17 Hertoghs, K. M. et al. Molecular profiling of cytomegalovirus-induced human CD8+ T cell differentiation. J Clin Invest 120, 4077-4090, doi:10.1172/JCI42758 (2010).
18 Triebel, F. et al. LAG-3, a novel lymphocyte activation gene closely related to CD4. J Exp Med 171, 1393-1405 (1990).
19 Djaoud, Z. et al. Amplified NKG2C+ NK cells in cytomegalovirus (CMV) infection preferentially express killer cell Ig-like receptor 2DL: functional impact in controlling CMV-infected dendritic cells. J Immunol 191, 2708-2716, doi:10.4049/jimmunol.1301138 (2013).
20 Nielsen, C. M., White, M. J., Goodier, M. R. & Riley, E. M. Functional Significance of CD57 Expression on Human NK Cells and Relevance to Disease. Front Immunol 4, 422, doi:10.3389/fimmu.2013.00422 (2013).
21 van Stijn, A. et al. Human cytomegalovirus infection induces a rapid and sustained change in the expression of NK cell receptors on CD8+ T cells. J Immunol 180, 4550-4560 (2008).
22 Graham, S. M. et al. A prospective study of endothelial activation biomarkers, including plasma angiopoietin-1 and angiopoietin-2, in Kenyan women initiating antiretroviral therapy. BMC Infect Dis 13, 263, doi:10.1186/1471-2334-13-263 (2013).
23 Legat, A., Speiser, D. E., Pircher, H., Zehn, D. & Fuertes Marraco, S. A. Inhibitory Receptor Expression Depends More Dominantly on Differentiation and Activation than "Exhaustion" of Human CD8 T Cells. Front Immunol 4, 455, doi:10.3389/fimmu.2013.00455 (2013).
24 Netea, M. G. et al. Interleukin-32 induces the differentiation of monocytes into macrophage-like cells. Proc Natl Acad Sci U S A 105, 3515-3520, doi:10.1073/pnas.0712381105 (2008).
25 Kagina, B. M. et al. Specific T cell frequency and cytokine expression profile do not correlate with protection against tuberculosis after bacillus Calmette-Guerin vaccination of newborns. Am J Respir Crit Care Med 182, 1073-1079, doi:10.1164/rccm.201003-0334OC (2010).
26 Miles, D. J. et al. CD4(+) T cell responses to cytomegalovirus in early life: a prospective birth cohort study. The Journal of infectious diseases 197, 658-662, doi:10.1086/527418 (2008).
27 Miles, D. J. et al. Cytomegalovirus infection in Gambian infants leads to profound CD8 T-cell differentiation. J Virol 81, 5766-5776, doi:10.1128/JVI.00052-07 (2007).
28 Bai, X. et al. IL-32 is a host protective cytokine against Mycobacterium tuberculosis in differentiated THP-1 human macrophages. J Immunol 184, 3830-3840, doi:10.4049/jimmunol.0901913 (2010).
29 Bai, X. et al. Human IL-32 expression protects mice against a hypervirulent strain of Mycobacterium tuberculosis. Proc Natl Acad Sci U S A 112, 5111-5116, doi:10.1073/pnas.1424302112 (2015).
30 Bozzano, F. et al. Functionally relevant decreases in activatory receptor expression on NK cells are associated with pulmonary tuberculosis in vivo and persist after successful treatment. Int Immunol 21, 779-791, doi:10.1093/intimm/dxp046 (2009).
.CC-BY-NC-ND 4.0 International licensenot peer-reviewed) is the author/funder. It is made available under aThe copyright holder for this preprint (which was. http://dx.doi.org/10.1101/222646doi: bioRxiv preprint first posted online Nov. 30, 2017;

47
31 Esin, S. & Batoni, G. Natural killer cells: a coherent model for their functional role in Mycobacterium tuberculosis infection. J Innate Immun 7, 11-24, doi:10.1159/000363321 (2015).
32 Lu, C. C. et al. NK cells kill mycobacteria directly by releasing perforin and granulysin. J Leukoc Biol 96, 1119-1129, doi:10.1189/jlb.4A0713-363RR (2014).
33 Montoya, D. et al. IL-32 is a molecular marker of a host defense network in human tuberculosis. Sci Transl Med 6, 250ra114, doi:10.1126/scitranslmed.3009546 (2014).
34 Portevin, D., Via, L. E., Eum, S. & Young, D. Natural killer cells are recruited during pulmonary tuberculosis and their ex vivo responses to mycobacteria vary between healthy human donors in association with KIR haplotype. Cell Microbiol 14, 1734-1744, doi:10.1111/j.1462-5822.2012.01834.x (2012).
35 Phillips, B. L. et al. LAG3 expression in active Mycobacterium tuberculosis infections. Am J Pathol 185, 820-833, doi:10.1016/j.ajpath.2014.11.003 (2015).
36 Anigilaje, E. A., Dabit, J. O., Nweke, N. O. & Agbedeh, A. A. Prevalence and risk factors of cytomegalovirus infection among HIV-infected and HIV-exposed uninfected infants in Nigeria. J Infect Dev Ctries 9, 977-987, doi:10.3855/jidc.6131 (2015).
37 Hsiao, N. Y., Zampoli, M., Morrow, B., Zar, H. J. & Hardie, D. Cytomegalovirus viraemia in HIV exposed and infected infants: prevalence and clinical utility for diagnosing CMV pneumonia. J Clin Virol 58, 74-78, doi:10.1016/j.jcv.2013.05.002 (2013).
38 Piriou, E. et al. Early age at time of primary Epstein-Barr virus infection results in poorly controlled viral infection in infants from Western Kenya: clues to the etiology of endemic Burkitt lymphoma. J Infect Dis 205, 906-913, doi:10.1093/infdis/jir872 (2012).
39 Jayasooriya, S. et al. Early virological and immunological events in asymptomatic Epstein-Barr virus infection in African children. PLoS Pathog 11, e1004746, doi:10.1371/journal.ppat.1004746 (2015).
40 Della Chiesa, M. et al. Human cytomegalovirus infection promotes rapid maturation of NK cells expressing activating killer Ig-like receptor in patients transplanted with NKG2C-/- umbilical cord blood. J Immunol 192, 1471-1479, doi:10.4049/jimmunol.1302053 (2014).
41 Strauss-Albee, D. M. et al. Human NK cell repertoire diversity reflects immune experience and correlates with viral susceptibility. Sci Transl Med 7, 297ra115, doi:10.1126/scitranslmed.aac5722 (2015).
42 Slyker, J. A. et al. Acute cytomegalovirus infection in Kenyan HIV-infected infants. Aids 23, 2173-2181, doi:10.1097/QAD.0b013e32833016e8 (2009).
43 Berry, M. P. et al. An interferon-inducible neutrophil-driven blood transcriptional signature in human tuberculosis. Nature 466, 973-977, doi:10.1038/nature09247 (2010).
44 Cliff, J. M. et al. Distinct phases of blood gene expression pattern through tuberculosis treatment reflect modulation of the humoral immune response. The Journal of infectious diseases 207, 18-29, doi:10.1093/infdis/jis499 (2013).
.CC-BY-NC-ND 4.0 International licensenot peer-reviewed) is the author/funder. It is made available under aThe copyright holder for this preprint (which was. http://dx.doi.org/10.1101/222646doi: bioRxiv preprint first posted online Nov. 30, 2017;

48
45 Maertzdorf, J. et al. Human gene expression profiles of susceptibility and resistance in tuberculosis. Genes and immunity 12, 15-22, doi:10.1038/gene.2010.51 (2011).
46 Anderson, S. T. et al. Diagnosis of childhood tuberculosis and host RNA expression in Africa. The New England journal of medicine 370, 1712-1723, doi:10.1056/NEJMoa1303657 (2014).
47 Kaforou, M. et al. Detection of tuberculosis in HIV-infected and -uninfected African adults using whole blood RNA expression signatures: a case-control study. PLoS medicine 10, e1001538, doi:10.1371/journal.pmed.1001538 (2013).
48 Scriba, T. J. et al. Sequential inflammatory processes define human progression from M. tuberculosis infection to tuberculosis disease. PLoS Pathog 13, e1006687, doi:10.1371/journal.ppat.1006687 (2017).
49 Soares, A. P. et al. Longitudinal changes in CD4(+) T-cell memory responses induced by BCG vaccination of newborns. The Journal of infectious diseases 207, 1084-1094, doi:10.1093/infdis/jis941 (2013).
50 Ben-Smith, A. et al. Differences between naive and memory T cell phenotype in Malawian and UK adolescents: a role for Cytomegalovirus? BMC Infect Dis 8, 139, doi:10.1186/1471-2334-8-139 (2008).
51 Miles, D. J. et al. Human immunodeficiency virus (HIV) infection during pregnancy induces CD4 T-cell differentiation and modulates responses to Bacille Calmette-Guerin (BCG) vaccine in HIV-uninfected infants. Immunology 129, 446-454, doi:10.1111/j.1365-2567.2009.03186.x (2010).
52 Matsumiya, M. et al. Inflammatory and myeloid-associated gene expression before and one day after infant vaccination with MVA85A correlates with induction of a T cell response. BMC Infect Dis 14, 314, doi:10.1186/1471-2334-14-314 (2014).
53 Tanner, R. et al. Serum indoleamine 2,3-dioxygenase activity is associated with reduced immunogenicity following vaccination with MVA85A. BMC Infect Dis 14, 660, doi:10.1186/s12879-014-0660-7 (2014).
54 Ota, M. O. et al. Immunogenicity of the tuberculosis vaccine MVA85A is reduced by coadministration with EPI vaccines in a randomized controlled trial in Gambian infants. Sci Transl Med 3, 88ra56, doi:10.1126/scitranslmed.3002461 (2011).
55 Dunning, M. J. et al. The importance of platform annotation in interpreting microarray data. Lancet Oncol 11, 717, doi:10.1016/S1470-2045(10)70115-7 (2010).
56 Shi, W., Oshlack, A. & Smyth, G. K. Optimizing the noise versus bias trade-off for Illumina whole genome expression BeadChips. Nucleic Acids Res 38, e204, doi:10.1093/nar/gkq871 (2010).
57 Ritchie, M. E. et al. limma powers differential expression analyses for RNA-sequencing and microarray studies. Nucleic Acids Res 43, e47, doi:10.1093/nar/gkv007 (2015).
58 Ritchie, M. E. et al. Empirical array quality weights in the analysis of microarray data. BMC Bioinformatics 7, 261, doi:10.1186/1471-2105-7-261 (2006).
.CC-BY-NC-ND 4.0 International licensenot peer-reviewed) is the author/funder. It is made available under aThe copyright holder for this preprint (which was. http://dx.doi.org/10.1101/222646doi: bioRxiv preprint first posted online Nov. 30, 2017;

49
59 Benjamini, Y. & Hochberg, Y. Controlling the False Discovery Rate - a Practical and Powerful Approach to Multiple Testing. Journal of the Royal Statistical Society Series B-Methodological 57, 289-300 (1995).
60 Li, S. et al. Molecular signatures of antibody responses derived from a systems biology study of five human vaccines. Nat Immunol 15, 195-204, doi:10.1038/ni.2789 (2014).
61 Kuhn, M. caret Package. J. Stat. Softw. 28, 1-26 (2008). 62 Brodersen, K. H., Ong, C. S., Stephan, K. E. & Buhmann, J. M. The balanced
accuracy and its posterior distribution. Pattern Recognition (ICPR), 2010 20th International Conference on, 3121-3124 doi:DOI 10.1109/ICPR.2010.764 (2010).
.CC-BY-NC-ND 4.0 International licensenot peer-reviewed) is the author/funder. It is made available under aThe copyright holder for this preprint (which was. http://dx.doi.org/10.1101/222646doi: bioRxiv preprint first posted online Nov. 30, 2017;