cystatin c-based renal function changes after
TRANSCRIPT

Cystatin C-Based Renal FunctionChanges After Antiretroviral Initiation:
A Substudy of a Randomized TrialThe Harvard community has made this
article openly available. Please share howthis access benefits you. Your story matters
Citation Gupta, Samir K., Douglas Kitch, Camlin Tierney, Eric S. Daar,Paul E. Sax, Kathleen Melbourne, Belinda Ha, and Grace A.McComsey. 2014. “Cystatin C-Based Renal Function Changes AfterAntiretroviral Initiation: A Substudy of a Randomized Trial.” OpenForum Infectious Diseases 1 (1): ofu003. doi:10.1093/ofid/ofu003.http://dx.doi.org/10.1093/ofid/ofu003.
Published Version doi:10.1093/ofid/ofu003
Citable link http://nrs.harvard.edu/urn-3:HUL.InstRepos:14351083
Terms of Use This article was downloaded from Harvard University’s DASHrepository, and is made available under the terms and conditionsapplicable to Other Posted Material, as set forth at http://nrs.harvard.edu/urn-3:HUL.InstRepos:dash.current.terms-of-use#LAA

M A J O R A R T I C L E
Cystatin C-Based Renal Function Changes AfterAntiretroviral Initiation: A Substudy of aRandomized Trial
Samir K. Gupta,1 Douglas Kitch,2 Camlin Tierney,2 Eric S. Daar,3 Paul E. Sax,4 Kathleen Melbourne,5 Belinda Ha,6 andGrace A. McComsey7; for the AIDS Clinical Trials Group Study A5224s Team1Department of Medicine, Indiana University School of Medicine, Indianapolis, Indiana; 2Center for Biostatistics in AIDS Research, Harvard School ofPublic Health, Boston, Massachusetts; 3Department of Medicine, Los Angeles Biomedical Research Institute at Harbor-UCLA Medical Center, Torrance,California; 4Department of Medicine, Brigham and Women’s Hospital, Harvard Medical School, Boston, Massachusetts; 5Gilead Sciences, Foster City,California; 6ViiV Healthcare, Research Triangle Park, North Carolina; and 7Department of Pediatrics, Case Western Reserve University, Cleveland, Ohio
Background. The effects of antiretrovirals on cystatin C-based renal function estimates are unknown.Methods. We analyzed changes in renal function using creatinine and cystatin C-based estimating equations in
269 patients in A5224s, a substudy of study A5202, in which treatment-naive patients were randomized to abacavir/lamivudine or tenofovir/emtricitabine with open-label atazanavir/ritonavir or efavirenz.Results. Changes in renal function significantly improved (or declined less) with abacavir/lamivudine treatment
compared with tenofovir/emtricitabine using the Cockcroft-Gault formula (P = .016) and 2009 Chronic Kidney Dis-ease Epidemiology Collaboration (CKD-EPI; P = .030) and 2012 CKD-EPI cystatin C-creatinine (P = .025). Renalfunction changes significantly improved (or declined less) with efavirenz compared with atazanavir/ritonavir(P < .001 for all equations). Mean (95% confidence interval) renal function changes specifically for tenofovir/emtri-citabine combined with atazanavir/ritonavir were −8.3 (−14.0, −2.6) mL/min with Cockcroft-Gault; −14.9 (−19.7,−10.1) mL/min per 1.732 with Modification of Diet in Renal Disease; −12.8 (−16.5, −9.0) mL/min per 1.732 with2009 CKD-EPI; +8.9 (4.2, 13.7) mL/min per 1.732 with 2012 CKD-EPI cystatin C; and −1.2 (−5.1, 2.6) mL/min per1.732 with 2012 CKD-EPI cystatin C-creatinine. Renal function changes for the other treatment arms were morefavorable but similarly varied by estimating equation.Conclusions. Antiretroviral-associated changes in renal function vary in magnitude and direction based on the
estimating equation used.
Keywords. atazanavir; creatinine; cystatin C; HIV-1; nephropathy; tenofovir.
Antiretroviral therapy (ART) may negatively affect renalfunction through drug toxicity mechanisms [1] or im-prove renal function by ameliorating the detrimental ef-fects of untreated human immunodeficiency virus (HIV)on the kidney [2, 3]. Several studies have suggested that
use of tenofovir disoproxil fumarate is associated withworse changes in estimated glomerular filtration rate(eGFR) compared with other nucleoside reverse-transcriptase inhibitors (NRTIs), and that this effect ismagnified with concomitant use of protease inhibitors(PIs) [4–8]. However, not all studies have confirmed thisrelationship [9–11]. In the AIDS Clinical Trials Group(ACTG) 5202 trial, worse changes in eGFR (estimated ascreatinine clearance using the Cockcroft-Gault equation[12]) were found with the use of tenofovir/emtricitabinecompared with abacavir/lamivudine, especially when te-nofovir/emtricitabine was used in combination with ata-zanavir/ritonavir [13]. Other observational studies havesuggested that the antiretroviral PI combination atazana-vir/ritonavir also negatively affects renal function [14, 15].There is growing interest in the use of serum cystatin C
as a new marker of renal function. Compared with serum
Received 4 February 2014; accepted 25 February 2014.Presented in part: 2013 Conference on Retroviruses and Opportunistic Infections,
Atlanta, GA.Correspondence: Samir K. Gupta, MD, MS, Division of Infectious Diseases, Em-
erson Hall, Suite 421, 545 Barnhill Drive, Indianapolis, IN 46202 ([email protected]).
Open Forum Infectious Diseases© The Author 2014. Published by Oxford University Press on behalf of the InfectiousDiseasesSocietyofAmerica. This is anOpenAccessarticle distributedunder the termsof the Creative Commons Attribution-NonCommercial-NoDerivs licence (http://creativecommons.org/licenses/by-nc-nd/3.0/), which permits non-commercialreproduction and distribution of the work, in any medium, provided the original workis not altered or transformed in any way, and that the work is properly cited. Forcommercial re-use, please contact [email protected]: 10.1093/ofid/ofu003
Renal Function Changes With ART • OFID • 1

creatinine, cystatin C is not affected by muscle mass and iscompletely eliminated by the kidney through glomerular filtration.Perhaps because of this improved ability to measure glomerularfiltration, cystatin C seems to have greater utility over creatininein predicting adverse outcomes in both the general population[16–18] and in the HIV-infected population [19, 20]. As such,newer GFR-estimating equations have been developed using cys-tatin C, including the 2012 Chronic Kidney Disease EpidemiologyCollaboration (CKD-EPI) cystatin C equation, which uses cystatinC only without creatinine, and the 2012 CKD-EPI cystatinC-creatinine equation, which incorporates both markers [21]. Inthe general US population [18], identifying renal dysfunction withthe 2012 CKD-EPI cystatin C-creatinine combined equation ap-pears to be more predictive of cardiovascular disease, end stagerenal disease, and overall mortality compared with the 2012CKD-EPI cystatin C equation and the older 2009 CKD-EPI equa-tion [22], the latter of which includes only serum creatinine. A re-cent study in women infected with HIV suggested that both of thenewer 2012 cystatin C-based equations were more accurate thanthe 2009 CKD-EPI equation in identifying those patients withrenal dysfunction with greater risk of mortality [20].A recent American study using iohexol clearance as the refer-
ence measurement of GFR assessed the accuracy of these newercystatin C-based equations in patients infected with HIV, most ofwhom were receiving antiretroviral medications, and found thatthat the 2012 CKD-EPI cystatin C-creatinine combined equationmost accurately estimated GFR compared with the 2012 CKD-EPI cystatin C equation and the original 2009 CKD-EPI equation[23]. Another American study corroborated these findings byagain finding that the 2012 CKD-EPI cystatin C-creatinine com-bined equation was more accurate than the other 2 CKD-EPIequations when compared with direct GFR measurement usingiohexol clearance [24]. However, in a similar study conductedin Europe, no appreciable differences were found between thecombined 2012 CKD-EPI equation and the 2009 CKD-EPI equa-tion [25]. Of note, both of these HIV studies suggest that all 3CKD-EPI equations were significantly more accurate than theModification of Diet in Renal Disease (MDRD) equation [22],which is important given that much of our understanding ofthe effects of antiretrovirals on renal function from observationalcohort studies used this latter equation [7, 26].Therefore, we assessed changes in renal function using 5 dif-
ferent estimating equations in ACTG 5224s, a substudy ofACTG 5202, in which cystatin C was systematically measured,and assessed the nephrotoxicity profiles with commonly usedonce-daily regimens.
METHODS
Study Design and ProceduresThe ACTG A5224s was a metabolic substudy of A5202 (ClinicalTrials.gov NCT00118898) in which ART-naive study parti-
cipants from ACTG sites in the United States and PuertoRico aged ≥16 years and with an HIV-1 RNA level >1000copies/mL were randomized to a blinded NRTI component,abacavir/lamivudine or tenofovir/emtricitabine, with eitherthe open-label PI atazanavir/ritonavir or the non-NRTI(NNRTI) efavirenz. A secondary objective of A5224s was tocompare the effects of initiating abacavir/lamivudine withthose of tenofovir/emtricitabine on renal function after 96weeks. A secondary renal objective was to compare the effectsof atazanavir/ritonavir with efavirenz on these endpoints after96 weeks. As previously described [27], the NRTI assignmentwas prematurely unblinded for patients with A5202 screeningHIV-1 RNA at least 100 000 copies/mL because of higherrates of virologic failure with abacavir/lamivudine regimens.Renal function was assessed using the following 5 estimating
equations: Cockcroft-Gault, 4-variable MDRD, 2009 CKD-EPI,2012 CKD-EPI cystatin C, and 2012 CKD-EPI cystatin C-creatinine. Serum creatinine measurements and urine analysesfor dipstick protein were performed locally at the laboratory ofthe participating ACTG site. Serum cystatin C (Siemens N Latexkit, lower limit of detection 0.05 mg/L, run on the SiemensNephelometer II) was measured centrally at Quest Diagnostics.Neither the serum creatinine nor the serum cystatin C levelswere calibrated against an international standard. These renalparameters were measured under fasting conditions for atleast 8 hours at study entry (baseline), at week 24, at week 48,and every 48 weeks afterwards through 96 weeks past the lastA5202 participant enrollment.Abbott Pharmaceuticals, Bristol-Myers Squibb, Gilead Scienc-
es, and GlaxoSmithKline provided the study medications. Thedecision to publish the manuscript was solely that of the academ-ic authors. All the authors participated in the trial design, dataanalysis, and preparation of the manuscript, and all the authorsvouch for the completeness and accuracy of the reported data.
Study ParticipantsTo be included in the parent A5202 trial [27], participants wererequired to have a screening creatinine clearance by Cockcroft-Gault >60 mL/min. The protocol initially did not exclude partic-ipants with active hepatitis B but was later amended to excludeparticipants with a positive hepatitis B surface antigen resultwithin 6 months of study entry. To be included in A5224s, par-ticipants also could not have uncontrolled thyroid disease orAmerican Diabetes Association-defined diabetes mellitus. Thehuman subjects’ ethics committee at each participating center ap-proved the study protocol, and written informed consent was ob-tained from all participants in compliance with the humanexperimentation guidelines of the US Department of Healthand Human Services and the Declaration of Helsinki.
Statistical AnalysisThe prespecified secondary study objectives of A5224s were tocompare renal function changes from baseline to week 96
2 • OFID • Gupta et al

between pooled and randomized NRTI components (abacavir/lamivudine vs tenofovir/emtricitabine with third drug com-bined) and between NNRTI and PI components (atazanavir/ritonavir vs efavirenz with NRTI combined). All analyseswere performed using intent-to-treat principles based on ran-domized treatment assignment. All available data and modifica-tions to randomized treatment were included in these analyses.For all comparisons, a factorial analysis approach was used, and,after assessing for treatment effect modification by the othercomponent, theNRTI effectwas assessed by combining efavirenzand atazanavir/ritonavir arms and vice versa. The P valuesbelow .05 (<.10 for assessing treatment effect modification)were considered statistically significant, and nominal valuesare reported without adjustment for multiple comparisons.Analyses were performed using SAS, version 9.2 (SAS InstituteInc., Cary, NC).Comparisons of mean changes between regimen components
used 2-sample t tests in the absence of regimen interactions andadjusted linear regression if interactions existed. Linear regres-sion, adjusted for NRTI and NNRTI/PI components, was alsoused to assess the association of both baseline renal functionstratum (<90 vs ≥90 mL/min for estimated creatinine clearanceor <90 vs ≥90 mL/min per 1.732 for each of the 4 eGFR mea-sures) and screening HIV-1 RNA level stratum (<100 000 vs≥100 000 copies/mL) with change in renal function at week96. To assess baseline factors independently associated withrenal function change, multivariable linear regression modelswere constructed initially consisting of factors with univariateP values <.20 and then, using backwards selection, retained fac-tors with a P value <.05. The prespecified baseline factors wereage, sex, race/ethnicity, HIV-1 RNA, CD4 cell count, urine dip-stick protein (negative vs nonnegative), systolic blood pressure,diastolic blood pressure, viral hepatitis B or C coinfection, ho-meostasis model assessment-insulin resistance (using fasting in-sulin and glucose measures) [28], weight, body mass index, andtotal body lean mass from dual-energy x-ray absorptiometrymeasurements.The sample size estimate was based on the primary A5224s
objective of changes in fat distribution [29]. Complete details ofthe randomization procedures are described elsewhere [13].
RESULTS
Participant CharacteristicsA total of 271 participants from 37 ACTG sites enrolled inA5224s. Two participants were subsequently found to be ineli-gible; thus, 269 were included in the analysis population. Enroll-ment spanned from October 5, 2005 to November 7, 2007. Thedisposition of these participants during the trial has been de-scribed previously. The baseline characteristics of the random-ized participants are summarized in Table 1. The baseline levelsof renal function using all 5 estimating equations were well
balanced by randomization amongst the 4 arms. However, the5 renal estimating equations varied for baseline levels of renalfunction, with MDRD and 2012 CKD-EPI cystatin C equationsresulting in the lowest renal function estimates and with Cock-croft-Gault resulting in the highest.
Changes in Renal Function Over TimeThe mean (95% confidence interval [CI]) renal function esti-mates over time using the 5 different estimating equations areshown in Figure 1. The magnitudes and directions of the changein eGFR depended on the estimating equation used. For exam-ple, with the MDRD and the 2009 CKD-EPI equations, renalfunction either did not appreciably change or declined withall treatments. On the other hand, both 2012 cystatin C-basedequations resulted in changes in eGFR that increased or did notappreciably change with treatment. In general, tenofovir/emtri-citabine with atazanavir/ritonavir resulted in the worst (leastpositive or most negative) changes in eGFR of the 4 treatmentarms at 96 weeks with all 5 equations.The changes in eGFR using all 5 equations were greater (or
less negative) with abacavir/lamivudine compared with tenofo-vir/emtricitabine and were also greater (or less negative) withefavirenz than with atazanavir/ritonavir (see SupplementaryTable 1). Of note, 2 participants developed a creatinine clear-ance <60 mL/min using Cockcroft-Gault, and 3, 2, 1, and 0 par-ticipants, respectively, developed eGFR <60 mL/min per 1.732
at week 96 with MDRD, 2009 CKD-EPI, 2012 CKD-EPI cysta-tin C, and 2012 CKD-EPI cystatin C-creatinine.
Effects of Interactions Between Treatment Components, InitialHIV-1 RNA, and Initial Renal FunctionSignificant interactions were found for change in eGFR frombaseline to week 96 between NRTI treatment groups and theNNRTI/PI treatment groups with Cockcroft-Gault, MDRD,and the 2009 CKD-EPI equations, but not with the two 2012CKD-EPI equations (see Supplementary Table 1 and Figures 2and 3). In particular, tenofovir/emtricitabine with atazanavir/ritonavir had significantly worse eGFR changes compared withtenofovir/emtricitabine with efavirenz. Significant treatment in-teractions between treatment group and initial HIV-1 RNAstrata were only found for efavirenz vs atazanavir/ritonavirusing 2009 CKD-EPI and 2012 CKD-EPI cystatin C-creatinine;in particular, atazanavir/ritonavir was associated with worsechanges in eGFR compared with efavirenz within the<100 000 copies/mL stratum but not the ≥100 000 copies/mLstratum. There were no significant 3-way interactions betweenthe NRTI treatment components, the NNRTI/PI component,and initial HIV-1 RNA strata (data not shown).There were no significant interactions between either the
NRTI components or the NNRTI/PI components and initialrenal function strata using any of the 5 renal function equations.In general, combined across arms, those within the lower initial
Renal Function Changes With ART • OFID • 3

renal function stratum of <90 mL/min (for creatinine clearance)or <90 mL/min per 1.732 (for eGFR) had significantly greaterimprovements (or less declines) in renal function (mean [95%CI]) compared with those in the higher initial renal functionstratum using MDRD (3.0 [−0.7, 6.8] vs −8.4 [−11.0, −5.7]),2009 CKD-EPI (2.3 [−1.4, 6.0] vs −6.3 [−8.2, −4.3]), 2012CKD-EPI cystatin C (26.1 [22.7, 29.5] vs 6.5 [4.2, 8.8]), and2012 CKD-EPI cystatin C-creatinine (14.1 [10.5, 17.7] vs 3.3[1.3, 5.2]) (all P < .001); the improvements in the lower renalfunction stratum were nonsignificantly greater than those inthe higher stratum using Cockcroft-Gault (6.3 [−0.5, 13.0] vs1.0 [−1.9, 3.9]; P = .16).
Associations Between Baseline Factors and Changes in RenalFunction At Week 96We performed multivariable regression models adjusted fortreatment components to evaluate the associations of baselinefactors with renal function change at week 96 using the 3CKD-EPI equations (Table 2). Assignment to abacavir/lamivudine vs tenofovir/emtricitabine was variably associatedwith 96-week changes in renal function, whereas assignmentto atazanavir/ritonavir remained independently associatedwith worse renal function change compared with efavirenz inthese multivariable models. However, other baseline factors (in-cluding race/ethnicity, initial HIV-1 RNA level, initial presence
Table 1. Baseline Characteristics of the 269 A5224s Study Participantsa,b
Efavirenz Atazanavir/Ritonavir
Total (n = 269)Baseline Characteristic
Tenofovir/emtricitabine
(n = 69)
Abacavir/lamivudine(n = 70)
Tenofovir/emtricitabine
(n = 65)
Abacavir/lamivudine(n = 65)
Age, y 39 (10) 39 (10) 38 (10) 37 (10) 38 (10)
Men, n (%) 58 (84) 56 (80) 56 (86) 59 (91) 229 (85)
Race or ethnicity, n (%)Black, non-Hispanic 22 (32) 20 (29) 21 (32) 27 (42) 90 (33)
White, non-Hispanic 37 (54) 34 (49) 26 (40) 29 (45) 126 (47)
Hispanic 8 (12) 14 (20) 14 (22) 8 (12) 44 (16)Other 2 (2) 2 (2) 4 (6) 1 (1) 9 (4)
Body mass index, kg/m2 24.7 (4.0) 25.5 (4.6) 26.2 (5.4) 25.7 (4.5) 25.5 (4.7)
CD4 cell count/µL 248 (160) 231 (167) 226 (142) 238 (189) 236 (165)HIV-1 RNA level,b log10 copies/mL 4.6 (0.7) 4.6 (0.6) 4.6 (0.7) 4.7 (0.7) 4.6 (0.7)
<100 000 copies/mL, n (%) 56 (81) 59 (84) 52 (80) 48 (74) 215 (80)
≥100 000 copies/mL, n (%) 13 (19) 11 (16) 13 (20) 17 (26) 54 (20)Hepatitis B surface antigen positive, n (%) 5 (7) 3 (4) 0 (0) 1 (2) 9 (3)
Hepatitis C antibody positive, n (%) 5 (7) 8 (11) 3 (5) 7 (11) 23 (9)
Systolic blood pressure, mm Hg 119 (15) 122 (14) 121 (10) 120 (13) 121 (13)Diastolic blood pressure, mm Hg 75 (9) 77 (10) 75 (7) 75 (11) 76 (9)
HOMA-IR 1.2 (1.7) 1.6 (1.5) 1.5 (2.1) 1.4 (1.4) 1.4 (1.7)
Creatinine clearance using Cockcroft-Gault, mL/min 118.3(24.5) 122.2 (35.3) 124.0 (35.4) 124.0 (33.0) 122.1 (32.2)<90 mL/min, n (%) 8 (12) 15 (22) 12 (19) 8 (13) 43 (16)
eGFR using MDRD, mL/min per 1.732 100.6 (18.4) 100.0 (23.6) 100.0 (25.8) 103.0 (20.3) 100.9 (22.0)
<90 mL/min per 1.732, n (%) 21 (31) 25 (37) 24 (39) 16 (25) 86 (33)eGFR using 2009 CKD-EPI, mL/min per 1.732 107.1 (15.1) 105.7 (19.4) 106.3 (20.5) 109.3 (16.6) 107.1 (17.9)
<90 mL/min per 1.732, n (%) 10 (15) 17 (25) 16 (26) 9 (14) 53 (20)
eGFR using 2012 CKD-EPI CysC, mL/min per 1.732 101.8 (19.2) 95.0 (19.7) 99.5 (21.1) 101.4 (20.6) 99.4 (20.2)<90 mL/min per 1.732, n (%) 18 (26) 27 (40) 20 (32) 17 (27) 82 (31)
eGFR using 2012 CKD-EPI CysC-Cr, mL/min per 1.732 104.8 (15.6) 99.7 (17.0) 102.9 (19.2) 105.3 (17.0) 103.2 (17.2)
<90 mL/min per 1.732, n (%) 11 (16) 17 (25) 15 (24) 13 (20) 56 (21)Urine dipstick proteinuria,c n (%) 16 (24) 22 (31) 20 (33) 17 (27) 75 (29)
Abbreviations: CKD-EPI, Chronic Kidney Diseases Epidemiology Collaboration; Cr, creatinine; CysC, cystatin C; eGFR, estimated glomerular filtration rate; HIV,human immunodeficiency virus; HOMA-IR, homeostasis model assessment-insulin resistance; MDRD, Modification of Diet in Renal Diseases.a All data presented as mean (standard deviation) or as number (percent). Numbers of missing data for the renal function estimates and for urine dipstick proteinuriawere <10 each for the entire study population.b HIV-1 RNA strata defined as either <100 000 vs ≥ 100 000 copies/mL at screening.c Urine dipstick proteinuria defined as any result that was nonnegative.
4 • OFID • Gupta et al
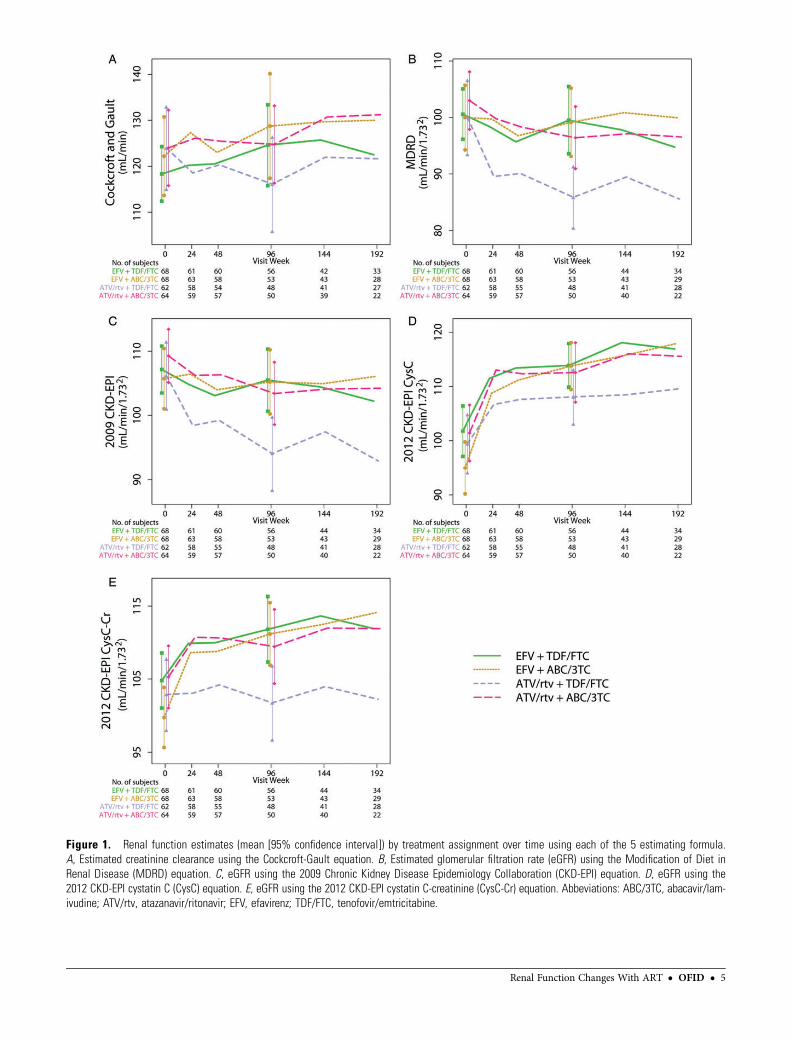
Figure 1. Renal function estimates (mean [95% confidence interval]) by treatment assignment over time using each of the 5 estimating formula.A, Estimated creatinine clearance using the Cockcroft-Gault equation. B, Estimated glomerular filtration rate (eGFR) using the Modification of Diet inRenal Disease (MDRD) equation. C, eGFR using the 2009 Chronic Kidney Disease Epidemiology Collaboration (CKD-EPI) equation. D, eGFR using the2012 CKD-EPI cystatin C (CysC) equation. E, eGFR using the 2012 CKD-EPI cystatin C-creatinine (CysC-Cr) equation. Abbeviations: ABC/3TC, abacavir/lam-ivudine; ATV/rtv, atazanavir/ritonavir; EFV, efavirenz; TDF/FTC, tenofovir/emtricitabine.
Renal Function Changes With ART • OFID • 5

Figure 2. Changes in renal function estimates (mean [95% confidence interval]) by nucleoside reverse-transcriptase treatment component. No significantinteractions were noted between nucleoside reverse-transcriptase inhibitor (NRTI) and non-NRTI (NNRTI)/protease inhibitor (PI) treatment components usingthe 2012 Chronic Kidney Disease Epidemiology Collaboration (CKD-EPI) cystatin C equation (A) or the 2012 CKD-EPI cystatin C-creatinine equation (B). Thus,we pooled the NRTI groups in the figure panels for these 2 equations. However, because treatment interactions were noted using the Cockcroft-Gaultequation (C), Modification of Diet in Renal Disease (MDRD) equation (D), and the 2009 CKD-EPI equation (E), the changes in renal function when theNRTI components are combined with either an NNRTI or PI are shown separately to highlight these differences. *P value for 2-sample t test;**P value for linear regression model adjusting for the other treatment component and the component interaction. Abbreviations: ABC/3TC, abacavir/lamivudine; ATV/rtv, atazanavir/ritonavir; Cr, creatinine; CysC, cystatin C; EFV, efavirenz; TDF/FTC, tenofovir/emtricitabine.
6 • OFID • Gupta et al

Figure 3. Changes in renal function estimates [mean (95% confidence interval)] by nonnucleoside reverse-transcriptase inhibitor (NNRTI) vs proteaseinhibitor (PI) component. No significant interactions were noted between NRTI and NNRTI/PI treatment components using the 2012 Chronic Kidney DiseaseEpidemiology Collaboration (CKD-EPI) cystatin C equation (A) or the 2012 CKD-EPI cystatin C-creatinine equation (B). Thus, we pooled the NNRTI/PI groups inthe figure panels for these 2 equations. However, because treatment interactions were noted using the Cockcroft-Gault equation (C), Modification of Diet inRenal Disease (MDRD) equation (D), and the 2009 CKD-EPI equation (E), the changes in renal function when the NNRTI/PI components are combined witheach of the 2 NRTI components are shown separately to highlight these differences. *P value for 2-sample t test; **P value for linear regression modeladjusting for the other treatment component and the component interaction. ABC/3TC, abacavir/lamivudine; ATV/rtv, atazanavir/ritonavir; Cr, creatinine;CysC, cystatin C; EFV, efavirenz; TDF/FTC, tenofovir/emtricitabine.
Renal Function Changes With ART • OFID • 7

of urine dipstick proteinuria, and initial systolic blood pressure)were variably associated with week 96 renal function change de-pending on which CKD-EPI renal function estimating equationwas used.
DISCUSSION
Because currently recommended antiretroviral regimens for ini-tial treatment have become similarly and consistently efficaciousin controlling viral replication, treatment-associated complica-tions, including nephrotoxicities, have become increasingly im-portant in choosing therapy. To our knowledge, this is the firststudy utilizing the 2012 cystatin C-based GFR estimating for-mulae in determining the changes in renal function with initi-ation of ART in patients infected with HIV. As such, we haveshown that the changes in eGFR associated with initiation ofthese regimens, and, in turn, the interpretations of their neph-rotoxicity profiles depend greatly on which renal function esti-mating equation is used.Our results confirm those from other studies that have found
worse changes in eGFR with the initiation of tenofovir com-pared with other NRTIs, especially in those receiving concom-itant PIs [4, 6–8], although not all studies have found poorerrenal function changes with tenofovir compared with abacavirin randomized trials [9, 11, 30]. The parent trial of this renal
substudy, ACTG 5202, found a significant relative decline in es-timated creatinine clearance as estimated by Cockcroft-Gaultwith tenofovir/emtricitabine in combination with atazanavir/ri-tonavir compared with its combination with efavirenz [13]. Wefound similar differences in the A5224s substudy when usingthe 2009 CKD-EPI and 2012 CKD-EPI cystatin C-creatinineequations, although we did not find significant differenceswhen using the 2012 CKD-EPI cystatin C equation. We alsonoted significant interactions between the nucleoside compo-nents and the third treatment component (efavirenz vsatazanavir/ritonavir) with Cockcroft-Gault, MDRD, and 2009CKD-EPI, but not with either of the two 2012 equations incor-porating cystatin C. In particular, the 96-week mean (95% CI)renal function changes for tenofovir/emtricitabine combinedwith atazanavir/ritonavir widely ranged from −14.9 (−19.7,−10.1) mL/min per 1.732 with MDRD to +8.9 (+4.2, +13.7)mL/min per 1.732 with 2012 CKD-EPI cystatin C. The rangesof renal function changes within the other treatment armswere similarly varied. Thus, the choice of renal function equa-tion may indeed influence our understanding of the relativerenal safety profiles of these antiretroviral regimens.The mechanism by which tenofovir with PIs may lead to
renal toxicity has been presumed to be due to accumulationof tenofovir in renal proximal tubule cells secondary to inhibi-tion of efflux transporters by PIs, especially in genetically
Table 2. Multivariable Models of the Effects of Baseline Factors on Change in Renal Function at 96 Weeks With the 3 CKD-EPI EstimatingEquationsa
2009 CKD-EPI 2012 CKD-EPI CysC 2012 CKD-EPI CysC-Cr
Baseline FactorEstimated meanchange (95% CI) P value
Estimated meanchange (95% CI) P value
Estimated meanchange (95% CI) P value
ATV/rtv (vs EFV) −11.7 (−16.7, −6.6) <.001 −6.3 (−10.7, −1.8) .006 −8.0 (−11.6, −4.4) <.001
ABC/3TC (vs TDF/FTC) 0.9 (−4.0, 5.8) .70 4.3 (−0.1, 8.7) .058 4.9 (1.3, 8.5) .008ABC/3TC*ATV/rtv interaction(vs not ABC/3TC and ATV/rtv)
7.5 (0.4, 14.6) .039
Race/ethnicityNon-Hispanic Black vs
non-Hispanic White−3.4 (−8.5, 1.6) .047
Hispanic (any race) vsnon-Hispanic White
−7.8 (−14.2, −1.4)
HIV-1 RNA (per 1 log10copies/mL higher)
5.8 (2.5, 9.2) .001 3.3 (0.6, 6.0) .017
Negative urine dipstick protein(vs nonnegative urinedipstick protein)
−6.9 (−12.0, −1.8) .008
Systolic blood pressure (per10 mmHg higher)
−2.0 (−3.7, −0.3) .025
Abbreviations: ABC, abacavir; ATV/rtv, atazanavir/ritonavir; CKD-EPI, Chronic Kidney Disease Epidemiology Collaboration; Cr, creatinine; CysC, cystatin C; EFV,efavirenz; HIV, human immunodeficiency virus; HOMA-IR, homeostasis model assessment-insulin resistance; 3TC, lamivudine; TDF, tenofovir.a Results are presented after adjustment for treatment components, and only variables with significant associations using at least 1 CKD estimating equation areshown in the table. Other variables assessed in the models but not found to be statistically significantly associatedwith week 96 renal function changewith any CKDestimating equation include the following: age, male vs female, body mass index, HIV-1 RNA stratum (<100 000 vs ≥100 000 copies/mL), CD4 cell count, diastolicblood pressure, hepatitis B or C coinfections, HOMA-IR, and weight.b All renal function data in units of mL/min per 1.732.
8 • OFID • Gupta et al

predisposed individuals [31, 32], although this has not beenconfirmed in all studies [33].Atazanavir/ritonavir has also been recently linked with
chronic kidney disease [14, 15], which has been speculated tobe due to intrarenal crystallization of atazanavir with associatedinterstitial nephritis [34, 35].The current study does indeed sug-gest that use of atazanavir/ritonavir is associated with worserenal function changes compared with efavirenz using any ofthe 5 estimating equations. As demonstrated in vitro, ritonavirmay potentially increase serum creatinine concentrations via in-hibition of creatinine efflux through the multidrug and toxinextrusion 1 (MATE1) transporter in the proximal tubule cell[36]. However, our data do not appear to be solely due to anypotentially isolated effect of MATE1 inhibition by ritonavir.Using the 2012 CKD-EPI cystatin C equation (which does notinclude creatinine), eGFR increased in all groups, but there werestill lower improvements in those assigned to abacavir/lamivu-dine with atazanavir/ritonavir compared with those assigned toabacavir/lamivudine with efavirenz (10.7 vs 18.0 mL/min per1.732) and in those assigned to tenofovir/emtricitabine with ata-zanavir/ritonavir compared with those assigned to tenofovir/emtricitabine with efavirenz (8.9 vs 12.7 mL/min per 1.732)(see Supplementary Table 1). As shown in Figure 3A, we seethat there remains a significant difference between eGFR chang-es using the 2012 CKD-EPI cystatin C equation when poolingthe NRTI components. The differences in eGFR between ataza-navir/ritonavir and efavirenz using an equation not incorporat-ing serum creatinine are of similar magnitude to those whenusing creatinine-based equations. As such, atazanavir/ritonavirlikely has an effect on eGFR independent of any possible serumcreatinine increase due simply to MATE1 inhibition.Interactions between the atazanavir/ritonavir or efavirenz
components with the nucleoside treatment component werefound, however, with the 3 equations incorporating only creat-inine and not with those including cystatin C. In addition, sig-nificantly less beneficial changes in eGFR with atazanavir/ritonavir were found in those whose screening HIV-1 RNA lev-els were <100 000 copies/mL. It is possible that the potential ad-verse renal toxicity of atazanavir/ritonavir is unmasked in thelower viral load stratum because this group is less likely to ben-efit from improvements in renal function due to reduction ininitial viremia, as might be expected in the higher stratum [37].The key new finding in this study is that the apparent differ-
ences in renal function within treatment groups are highly de-pendent on the eGFR estimating equation used. No previousstudies have used cystatin C-based estimating equations to as-sess the effects of antiretroviral initiation on renal function. Arecent evaluation by Inker et al [23] in HIV-infected patients re-ceiving virologically suppressive antiretroviral treatment sug-gested that the 2012 CKD-EPI equation incorporating bothcystatin C and creatinine was marginally more accurate for es-timating GFR than the 2012 CKD-EPI equation using only
cystatin C and the 2009 CKD-EPI equation using only creati-nine compared with iohexol clearance as the reference standard.Inker et al [21] has previously suggested that the greater accura-cy of the 2012 CKD-EPI cystatin C-creatinine equation may bedue to reduced variances of postulated non-GFR determinantsof these 2 renal markers, such as inflammation, when used to-gether as opposed to using each alone. Gagneux-Brunon et al[25]performed a similar study in an HIV-infected European co-hort, which had appreciably different demographic characteris-tics than the one studied by Inker et al [21], and did not findsignificant differences amongst the 3 CKD-EPI equations. How-ever, both studies demonstrated that the MDRD equation wassignificantly less accurate than any of the CKD-EPI equations.It should be noted that these newer equations have not been val-idated against direct GFR measurement methods in HIV-infected, treatment-naive patients. As such, the improvementsin renal function, especially those found in the first 24 weeks(as shown in Figures 2 and 3), with the cystatin C-based equa-tions may not only reflect true improvements in GFR but mightalso be influenced by reductions in inflammation and viremiaor by improvements in CD4 cell counts, all of which havebeen variably associated with cystatin C levels [38]. In fact,the recent study by Bhasin et al [24] suggests that the 2012CKD-EPI cystatin C equation, but not the other 2 CKD-EPIequations, was biased against true GFR measurement by greaterT cell activation, higher HIV-1 RNA levels, and use of ART.Using the 2012 CKD-EPI cystatin C-creatinine equation, we
consider that treatment with tenofovir/emtricitabine with ataza-navir/ritonavir has no noticeable effect on renal function at 96weeks (mean change −1.2 [95% CI, −5.1, 2.6] mL/min per1.732) and that treatment with the other once-daily regimensin this study would lead to improved renal function. On theother hand, using either the MDRD equation or the 2009CKD-EPI equation, we conclude that there are significant de-clines from baseline in eGFR with tenofovir/emtricitabine com-bined with atazanavir/ritonavir with essentially neutral effectswith the other 3 treatment arms. It is plausible to find thatrenal function generally improves with any ART given theknown detrimental effects of untreated HIV on renal function,even in those without classic risk factors for HIV-associated ne-phropathy such as patients of black race [37]. Indeed, we foundthat the improvements in renal function were better in thosewith initial eGFR lower than 90 mL/min per 1.732, which sup-ports the concept that untreated HIV does indeed have negativeeffects on renal function. Thus, the neutral changes found withtenofovir/emtricitabine using the 2012 CKD-EPI cystatin C-creatinine equation may be due to opposing effects of toxicityfrom this particular regimen and the benefits of virologicsuppression.Recent evidence suggests that the 2012 CKD-EPI cystatin
C-creatinine equation is the most accurately available methodto identify patients, including those with HIV infection, with
Renal Function Changes With ART • OFID • 9

reduced renal function who have the highest risk of long-termadverse outcomes [18, 20]. Since our data suggest that eGFRusing the 2012 CKD-EPI combined equation improves at 96weeks with use of tenofovir/emtricitabine with efavirenz, abaca-vir/lamivudine with efavirenz, or abacavir/lamivudine with ata-zanavir/ritonavir, then long-term outcomes may improve inthose receiving any of these three regimens. However, eGFRusing the 2012 CKD-EPI combined equation did not changeat 96 weeks with use of tenofovir/emtricitabine with atazana-vir/ritonavir; this may suggest that the contribution of renalfunction to long-term outcomes may not be impacted (eitherpositively or negatively) with the use of this particular regimen.However, additional research is needed to determine whetherusing the 2012 CKD-EPI cystatin C-creatinine equation for rou-tine clinical monitoring of renal function in those receivingART actually leads to changes in management that would pre-vent future complications in those with reduced renal function.It should be noted that, regardless of the estimating equationused, the development of eGFR <60 mL/min per 1.732 at 96weeks was infrequent in this trial.We also developed 3 different multivariable models to identify
baseline factors associated with 96-week renal function changesusing the 3 CKD-EPI equations. We found that the baseline fac-tors assessed were variably associated with changes in eGFR de-pending on the equation used. These results again suggest thatthe choice of eGFR estimating equation directly impacts our un-derstanding of which factors are responsible for changes in renalfunction in HIV-infected patients initiating treatment.The limitations of this study should be acknowledged. We did
not directly measure renal function to validate and identify themost accurate estimating equation for these patients initiatingantiretrovirals. Although our study is one of the longest to as-sess changes in renal function with initiation of ART, we cannotmake any conclusions regarding differences between regimensbeyond 96 weeks. Our results may not be generalizable to pa-tients with pretreatment creatinine clearance <60 mL/min orto those with diabetes, groups that were excluded from this sub-study. Although we measured cystatin C centrally, we did not doso for creatinine. We also acknowledge that neither creatininenor cystatin C were calibrated against international standards,which may lead to analytical drift of the measurements [39].However, because we assessed changes in renal function, the po-tential variability of these results due to the lack of either cen-tralized or standardized measurement is somewhat minimized.Another limitation was the lack of blinding for the efavirenz andatazanavir/ritonavir treatment components, although thenucleoside treatment components were blinded. Finally, theseanalyses were performed without adjustment for multiple com-parisons, thereby increasing the possibility of type I errors forfalsely detecting differences.In summary, we found that initiation of ART with tenofovir/
emtricitabine and atazanavir/ritonavir led to less beneficial
changes in eGFR at 96 weeks compared with abacavir/lamivu-dine and efavirenz, respectively. However, the magnitudes, di-rections, and statistical significances of these changes in renalfunction varied with the estimating equation used. If thenewer cystatin C-based equations are indeed confirmed to bemore clinically useful, then the renal profiles of antiretroviralregimens should be reinterpreted and, as such, would have im-portant implications for HIV clinical care.
Supplementary Data
Supplementary materials are available at The Journal of Infectious Diseasesonline (http://ofid.oxfordjournals.org/). Supplementary materials consist ofdata provided by the author that are published to benefit the reader. Theposted materials are not copyedited. The contents of all supplementarydata are the sole responsibility of the authors. Questions or messages regard-ing errors should be addressed to the author.
Notes
Acknowledgments. We thank the study participants for their generousdonation of time and effort in the successful completion of this trial. We alsothank Drs Pablo Tebas and Lynda Szczech for their contributions in the de-sign and conduct of ACTG A5224s. We also thank the following participat-ing sites and site investigators: Sadia Shaik, MD and Ruben Lopez, MD weresupported by Harbor-UCLA Medical Center (Site 603) CTU Grant no.AI0694241 and UL1-RR033176; Susan L. Koletar, MD and Diane Gochn-our, RN were supported by The Ohio State University Medical Center (Site2301) CTU Grant no. AI069474; Geyoul Kim RN and Mark Rodriguez, RNwere supported by Washington University (Site 2101) CTU Grant no.U01AI069495 and GCRC Grant no. UL1 RR024992; Elizabeth Lindsey,RN and Tamara James, BS were supported by Alabama Therapeutics CRS(Site 5801) CTU Grant no. U01 AI069452; Ann C. Collier, MD and JeffreySchouten, MD, JD were supported by University of Washington (Site 1401)CTU Grant no. AI069434 and UL1 RR025014; Jorge L. Santana Bagur, MDand Santiago Marrero, MD were supported by Puerto Rico-AIDS ClinicalTrials Unit (Site 5401) CTU Grant no. 5 U0I AI069415-03; Jenifer Baer,RN, BSN and Carl Fichtenbaum, MD were supported by University of Cin-cinnati (Site 2401) CTU Grant no. AI069513; Patricia Walton, BSN, RN andBarbara Philpotts, BSN, RN were supported by Case Western Reserve (Site2501) CTU Grant no. AI69501; Princy Kumar, MD and Joseph Timpone,MD were supported by Georgetown University (Site 1008) CTU ACTGGrant no. 5U01AI069494; Donna Pittard, RN, BSN and David Currin,RN were supported by University of North Carolina (Site 3201) CTUGrant no. 5-U01 AI069423-03, UNC CFAR no. P30 AI050410 (-11), andUNC CTRC no. UL 1RR 025747; Julie Hoffman, RN and Edward Seefried,RN were supported by San Diego Medical Center UC (Site 701) CTU Grantno. AI69432; Susan Swindells, MBBS and Frances Van Meter, APRN weresupported by University of Nebraska (Site 1505) CTU Grant no. AI 27661;Deborah McMahon, MD and Barbara Rutecki, MSN, MPH, CRNP weresupported by University of Pittsburgh (Site 1001) CTU Grant no. 1 U01AI069494-01; Michael P. Dube, MD and Martha Greenwald, RN, MSNwere supported by Indiana University (Site 2601) CTU Grant no.5U01AI025859 and GCRC no. M01 RR00750; Ilene Wiggins, RN, andEric Zimmerman, RN were supported by Johns Hopkins University (Site201) CTU Grant no. AI27668 and CTSA Grant no. UL1 RR025005; JudithAberg, MD and Margarita Vasquez, RN were supported by New York Uni-versity/NYCHHC at Bellevue Hospital Center (Site 401) CTU Grant no.AI27665 and New Grant no. AI069532; Martin McCarter and M. GrahamRay, RN, MSN were supported by Colorado AIDS Clinical Trials Unit (Site6101) CTU Grant no. AI69450 and RR025780; Mamta Jain, MD, PrincipleInvestigator and Tianna Petersen, MS were supported by University of TexasSouthwestern Medical Center (Site 3751) CTU Grant no. 3U01AI046376-05S4; Emily Stumm, BS and Pablo Tebas, MD were supported by University
10 • OFID • Gupta et al

of Pennsylvania, Philadelphia (Site 6201) CTU Grant no. P30-AI0450008-11 and CFAR Grant no. UO1-AI069467-04; Mary Albrecht, MD and NeahKim, NP were supported by Beth Israel Deaconess (Partners/Harvard) CRS(Site 103) CTU Grant no. U01 AI069472-04; Paul Edward Sax, MD andJoanne Delaney, RN were supported by Brigham and Women’s Hospital(Site 107) CTU Grant no. UOI AI 069472; Christine Hurley, RN and Rob-erto Corales, DO were supported by AIDS Care (Site 1108) CTU Grant no.U01AI069511-02 (as of 2/12/08) and GCRC Grant no. UL1 RR 024160;Keith Henry, MD and Bette Bordenave, RN were supported by HennepinCounty Medical Center (Site 1502) CTU Grant no. N01 AI72626; WendyArmstrong, MD and Ericka R. Patrick, RN, MSN, CCRC were supportedby Emory University HIV/AIDS Clinical Trails Unit (Site 5802) CTUGrant no. UO1Al69418-01 and CFAR Grant no. P30Al050409; Jane Reid,RNC, MS and Mary Adams, RN, MPh were supported by University ofRochester (Site 1101) CTU Grant no. U01AI069511-02 (as of 2/12/08)and GCRC Grant no. UL1 RR 024160; Gene D. Morse, PharmD, FCCP,BCPS was supported by SUNY at Buffalo, Erie County Medical Center(Site 1102) CTU Grant no. AI27658; Michael P. Dube, MD and MarthaGreenwald, RN, MSN were supported by Wishard Memorial Hospital Indi-ana University (Site 2603) CTU Grant no. 5U01AI025859 and GCRC no.M01 RR00750; Kimberly Y. Smith, MD, MPH and Joan A. Swiatek, APNwere supported by Rush University Medical Center (Site 2702) CTUGrant no. U01 AI069471; Nancy Hanks, RN and Debra Ogata-Arakaki,RN were supported by University of Hawaii at Manoa, Leahi Hospital(Site 5201) CTU Grant no. AI34853; Ardis Moe, MD and Maria Palmer,PA-C were supported by UCLA Medical Center (Site 601) CTU Grantno. U01AI069424-01; Jeffery Meier, MD and Jack T. Stapleton, MD weresupported by University of Iowa Hospitals and Clinics (Site 1504) CTUGrant no. UL1RR024979; Gary Matthew Cox, MD and Martha Silberman,RN were supported by Duke University Medical Center Adult CRS (Site1601) CTUGrant no. 5U01 AI069 484-02; Gerianne Casey, RN andWilliamO’Brien MD were supported by University of Texas, Galveston (Site 6301)CTU Grant no. AI32782; Valery Hughes, FNP and Todd Stroberg, RN weresupported by Cornell CRS (Sites 7803 and 7804) CTU Grant no. U01AI069419 and CTSC Grant no. UL1 RR024996; Nyef El-Daher, MD wassupported by McCree McCuller Wellness Center at the Connection (Site1107) CTU Grant no. U01AI069511-02 (as of 2/12/08) and GCRC Grantno. UL1 RR 024160; Rebecca J. Basham, BS and Husamettin Erdem, MDwere supported by Vanderbilt Therapeutics CRS (Site 3652) CTU Grantno. AI46339-01 and MO1 RR 00095.Author contributions. S. K. G., G. A. M., and D. K. had access to all the
data in the study and take responsibility for the integrity of the data and theaccuracy of the data analysis. D. K., C. T., E. S. D., P. E. S., K. M., B. H., andG. A. M. were responsible for study conception and design. S. K. G., D. K.,C. T., E. S. D., and G. A. M. were responsible for data analysis andinterpretation. E. S. D., P. E. S., and G. A. M. were responsible for acquisitionof data. S. K. G. and D. K. were responsible for drafting of the article. C. T.,E. S. D., P. E. S., K. M., B. H., and G. A. M. were responsible for critical re-vision of the manuscript. S. K. G., D. K., C. T., E. S. D., P. E. S., K. M., B. H.,and G. A. M. were responsible for final approval of the submission of themanuscript.Disclaimer. The content is solely the responsibility of the authors and
does not necessarily represent the official views of the National Instituteof Allergy and Infectious Diseases or the National Institutes of Health.Study medications were provided by Abbott Pharmaceuticals, Bristol-Myers Squibb, Gilead Sciences, and GlaxoSmithKline. Abbott Pharmaceu-ticals, Bristol-Myers Squibb, Gilead Sciences, and GlaxoSmithKline did notparticipate in the design and conduct of the study or the collection, manage-ment, analysis, interpretation of the data, or the preparation, review, or ap-proval of the article.Financial support. This work was supported by Award Numbers
U01AI068636, AI068634, AI38855 from the National Institute of Allergyand Infectious Diseases; UL1 RR 025005 from the National Center for Re-search Resources and the National Center for Advancing Translational Sci-ences; the National Institutes of Health supported by National Institute ofMental Health; and the National Institute of Dental and CraniofacialResearch.
Potential conflicts of interest. S. K. G. has received research grants fromMerck & Co., Inc., Janssen Pharmaceutics, Inc., and Gilead Sciences, Inc.;travel support from Gilead Sciences, Inc.; and advisory/consultancy/lecturefees from Bristol-Myers Squibb and Merck & Co., Inc. C. T. has receivedpayment for participation on a data monitoring committee for JanssenTherapeutics. E. S. D. has received research grants from Bristol-MyersSquibb, Gilead Sciences, Inc., Merck & Co., Inc., and ViiV Healthcare andhas received consultancy/advisory fees from Bristol-Myers Squibb, GileadSciences, Inc., Janssen Pharmaceuticals., Inc., Merck & Co., Inc., Abbvie,Inc., Teva, and ViiV Healthcare. P. E. S. has received research grants fromBristol-Myers Squibb, Gilead Sciences, Inc., and GlaxoSmithKline, and is aconsultant or scientific advisory board member for Bristol-Myers Squibb,Gilead Sciences, Inc., Merck & Co., Inc., GlaxoSmithKline, and JanssenPharmaceuticals, Inc. K. M. is an employee and stockholder in Gilead Sci-ences, Inc. B. H. is an employee and stockholder of ViiV Healthcare.G. A. M. has served as a scientific advisor for Bristol-Myers Squibb, Glaxo-SmithKline, Abbott, and Gilead Sciences, Inc.; has received payment for lec-tures from Bristol-Myers Squibb, GlaxoSmithKline, and Tibotec Therapeutics;has received research grants from Bristol-Myers Squibb, GlaxoSmithKline,Abbott, Merck & Co., Inc., and Gilead Sciences; and has served as the DataSafety Monitoring Board (DSMB) Chair for a Pfizer-sponsored study.All authors have submitted the ICMJE Form for Disclosure of Potential
Conflicts of Interest. Conflicts that the editors consider relevant to the con-tent of the manuscript have been disclosed.
References
1. Gupta SK. Tenofovir-associated Fanconi syndrome: review of the FDAadverse event reporting system. AIDS Patient Care STDS 2008;22:99–103.
2. Winston JA, Bruggeman LA, Ross MD, et al. Nephropathy and estab-lishment of a renal reservoir of HIV type 1 during primary infection. NEngl J Med 2001; 344:1979–84.
3. Reid A, Stohr W, Walker AS, et al. Severe renal dysfunction andrisk factors associated with renal impairment in HIV-infected adultsin Africa initiating antiretroviral therapy. Clin Infect Dis 2008;46:1271–81.
4. Young J, Schafer J, Fux CA, et al. Renal function in patients with HIVstarting therapy with tenofovir and either efavirenz, lopinavir or ataza-navir. AIDS 2012; 26:567–75.
5. Nishijima T, Gatanaga H, Komatsu H, et al. Renal function declinesmore in tenofovir- than abacavir-based antiretroviral therapy in low-body weight treatment-naive patients with HIV infection. PLoS One2012; 7:e29977.
6. Kalayjian RC, Lau B, Mechekano RN, et al. Risk factors for chronic kid-ney disease in a large cohort of HIV-1 infected individuals initiating an-tiretroviral therapy in routine care. AIDS 2012; 26:1907–15.
7. Goicoechea M, Liu S, Best B, et al. Greater tenofovir-associated renalfunction decline with protease inhibitor-based versus nonnucleoside re-verse-transcriptase inhibitor-based therapy. J Infect Dis 2008;197:102–8.
8. Albini L, Cesana BM, Motta D, et al. A randomized, pilot trial to eval-uate glomerular filtration rate by creatinine or cystatin C in naive HIV-infected patients after tenofovir/emtricitabine in combination with ata-zanavir/ritonavir or efavirenz. J Acquir Immune Defic Syndr 2012;59:18–30.
9. Post FA, Moyle GJ, Stellbrink HJ, et al. Randomized comparison ofrenal effects, efficacy, and safety with once-daily abacavir/lamivudineversus tenofovir/emtricitabine, administered with efavirenz, inantiretroviral-naive, HIV-1-infected adults: 48-week results from theASSERT study. J Acquir Immune Defic Syndr 2010; 55:49–57.
10. Cohen CJ, Andrade-Villanueva J, Clotet B, et al. Rilpivirine versus efa-virenz with two background nucleoside or nucleotide reverse transcrip-tase inhibitors in treatment-naive adults infected with HIV-1(THRIVE): a phase 3, randomised, non-inferiority trial. Lancet 2011;378:229–37.
Renal Function Changes With ART • OFID • 11

11. Smith KY, Patel P, Fine D, et al. Randomized, double-blind, placebo-matched, multicenter trial of abacavir/lamivudine or tenofovir/emtrici-tabine with lopinavir/ritonavir for initial HIV treatment. AIDS 2009;23:1547–56.
12. Cockcroft DW, Gault MH. Prediction of creatinine clearance fromserum creatinine. Nephron 1976; 16:31–41.
13. Daar ES, Tierney C, Fischl MA, et al. Atazanavir plus ritonavir or efa-virenz as part of a 3-drug regimen for initial treatment of HIV-1. AnnIntern Med 2011; 154:445–56.
14. Mocroft A, Kirk O, Reiss P, et al. Estimated glomerular filtration rate,chronic kidney disease and antiretroviral drug use in HIV-positive pa-tients. AIDS 2010; 24:1667–78.
15. Ryom L, Mocroft A, Kirk O, et al. Association between antiretroviralexposure and renal impairment among HIV-positive persons with nor-mal baseline renal function: the D:A:D study. J Infect Dis 2013;207:1359–69.
16. Shlipak MG, Sarnak MJ, Katz R, et al. Cystatin C and the risk of deathand cardiovascular events among elderly persons. N Engl J Med 2005;352:2049–60.
17. Peralta CA, Katz R, Sarnak MJ, et al. Cystatin C identifies chronic kid-ney disease patients at higher risk for complications. J Am Soc Nephrol2011; 22:147–55.
18. Shlipak MG, Matsushita K, Arnlov J, et al. Cystatin C versus creatininein determining risk based on kidney function. N Engl J Med 2013;369:932–43.
19. Choi A, Scherzer R, Bacchetti P, et al. Cystatin C, albuminuria, and 5-year all-cause mortality in HIV-infected persons. Am J Kidney Dis2010; 56:872–82.
20. Driver TH, Scherzer R, Peralta CA, et al. Comparisons of creatinine andcystatin C for detection of kidney disease and prediction of all-causemortality in HIV-infected women. AIDS 2013; 27:2291–9.
21. Inker LA, Schmid CH, Tighiouart H, et al. Estimating glomerular filtra-tion rate from serum creatinine and cystatin C. N Engl J Med 2012;367:20–9.
22. Levey AS, Bosch JP, Lewis JB, et al. A more accurate method to estimateglomerular filtration rate from serum creatinine: a new prediction equa-tion. Modification of Diet in Renal Disease Study Group. Ann InternMed 1999; 130:461–70.
23. Inker LA, Wyatt C, Creamer R, et al. Performance of creatinine and cys-tatin C GFR estimating equations in an HIV-positive population on an-tiretrovirals. J Acquir Immune Defic Syndr 2012; 61:302–9.
24. Bhasin B, Lau B, Atta MG, et al. HIV viremia and t-cell activation differ-entially affect the performance of glomerular filtration rate equationsbased on creatinine and cystatin C. PLoS One 2013; 8:e82028.
25. Gagneux-Brunon A, Delanaye P, Maillard N, et al. Performanceof creatinine and cystatin C-based glomerular filtration rate esti-mating equations in a European HIV-positive cohort. AIDS 2013;27:1573–81.
26. Choi AI, Rodriguez RA, Bacchetti P, et al. Low rates of antiretroviraltherapy among HIV-infected patients with chronic kidney disease.Clin Infect Dis 2007; 45:1633–9.
27. Sax PE, Tierney C, Collier AC, et al. Abacavir-lamivudine versustenofovir-emtricitabine for initial HIV-1 therapy. N Engl J Med 2009;361:2230–40.
28. Matthews DR, Hosker JP, Rudenski AS, Naylor BA, Treacher DF,Turner RC. Homeostasis model assessment: insulin resistance andbeta-cell function from fasting plasma glucose and insulin concentra-tions in man. Diabetologia 1985; 28:412–9.
29. McComsey GA, Kitch D, Sax PE, et al. Peripheral and central fat chang-es in subjects randomized to abacavir-lamivudine or tenofovir-emtrici-tabine with atazanavir-ritonavir or efavirenz: ACTG Study A5224s. ClinInfect Dis 2011; 53:185–96.
30. Rasmussen TA, Jensen D, Tolstrup M, et al. Comparison of bone andrenal effects in HIV-infected adults switching to abacavir or tenofovirbased therapy in a randomized trial. PLoS ONE 2012; 7:e32445.
31. Kiser JJ, Aquilante CL, Anderson PL, King TM, Carten ML, FletcherCV. Clinical and genetic determinants of intracellular tenofovir diphos-phate concentrations in HIV-infected patients. J Acquir Immune DeficSyndr 2008; 47:298–303.
32. Kiser JJ, Carten ML, Aquilante CL, et al. The effect of lopinavir/ritonavir on the renal clearance of tenofovir in HIV-infected patients.Clin Pharmacol Ther 2008; 83:265–72.
33. Ray AS, Cihlar T, Robinson KL, et al. Mechanism of active renaltubular efflux of tenofovir. Antimicrob Agents Chemother 2006;50:3297–304.
34. Brewster UC, Perazella MA. Acute interstitial nephritis associatedwith atazanavir, a new protease inhibitor. Am J Kidney Dis 2004; 44:e81–4.
35. Schmid S, Opravil M, Moddel M, et al. Acute interstitial nephritis ofHIV-positive patients under atazanavir and tenofovir therapy in a retro-spective analysis of kidney biopsies. Virchows Arch 2007; 450:665–70.
36. Lepist EI, Murray BP, Tong L, Roy A, Bannister R, Ray AS. Effect of co-bicistat and ritonavir on proximal renal tubular cell uptake and effluxtransporters. Interscience Conference on Antimicrobial Agents andChemotherapy. Chicago, IL, 2011.
37. Kalayjian RC, Franceschini N, Gupta SK, et al. Suppression of HIV-1replication by antiretroviral therapy improves renal function in personswith low CD4 cell counts and chronic kidney disease. AIDS 2008;22:481–7.
38. Gagneux-Brunon A, Mariat C, Delanaye P. Cystatin C in HIV-infectedpatients: promising but not yet ready for prime time. Nephrol DialTransplant 2012; 27:1305–13.
39. Inker LA, Eckfeldt J, Levey AS, et al. Expressing the CKD-EPI (ChronicKidney Disease Epidemiology Collaboration) cystatin C equations forestimating GFR with standardized serum cystatin C values. Am J Kid-ney Dis 2011; 58:682–4.
12 • OFID • Gupta et al