cylab 11- a whirlwind tour of statistics
TRANSCRIPT
1
CyLa
b Us
ab
le Privacy & Security Laboratory
HTTP://CUPS.CS.CMU.EDU
Engineering & Public Policy
CyLab
05-436 / 05-836 / 08-534 / 08-734 / 19-534 / 19-734 !Usable Privacy and Security
Lorrie Cranor, Hana Habib, and Jessica Colnago, February 22, 2017
11- A whirlwind tour of statistics
2
Today! Statistics!
• The main idea and building blocks • Hypothesis testing • Major tests you’ll see • Non-independent data • Practice!
3
Important Note
• In some cases in today’s lecture, we will intentionally be imprecise (and sometimes not technically accurate) about certain concepts. We are trying to give you some intuition for these concepts without extensive formal background.

4
BUILDING BLOCKS
5
Statistics
• In general: analyzing and interpreting data • Statistical hypothesis testing: is it unlikely
the data would look like this unless there is actually a difference in real life?
• Statistical correlations: are these things related?
6
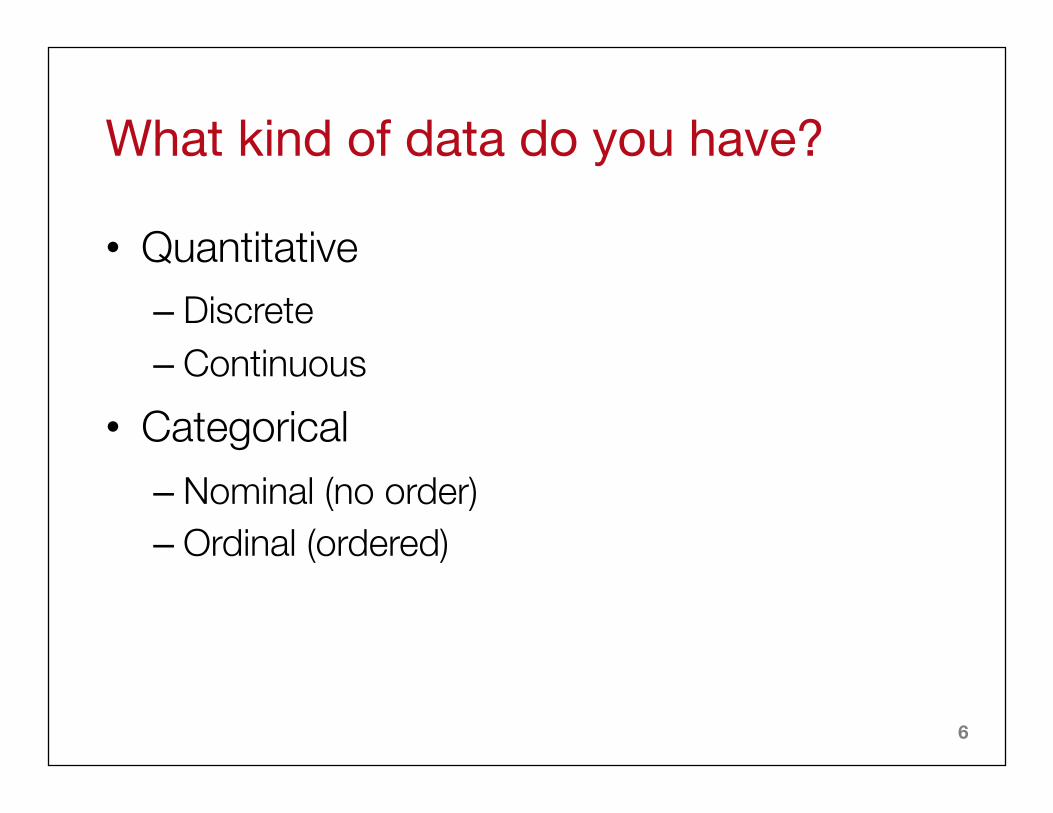
What kind of data do you have?
• Quantitative – Discrete – Continuous
• Categorical – Nominal (no order) – Ordinal (ordered)
7
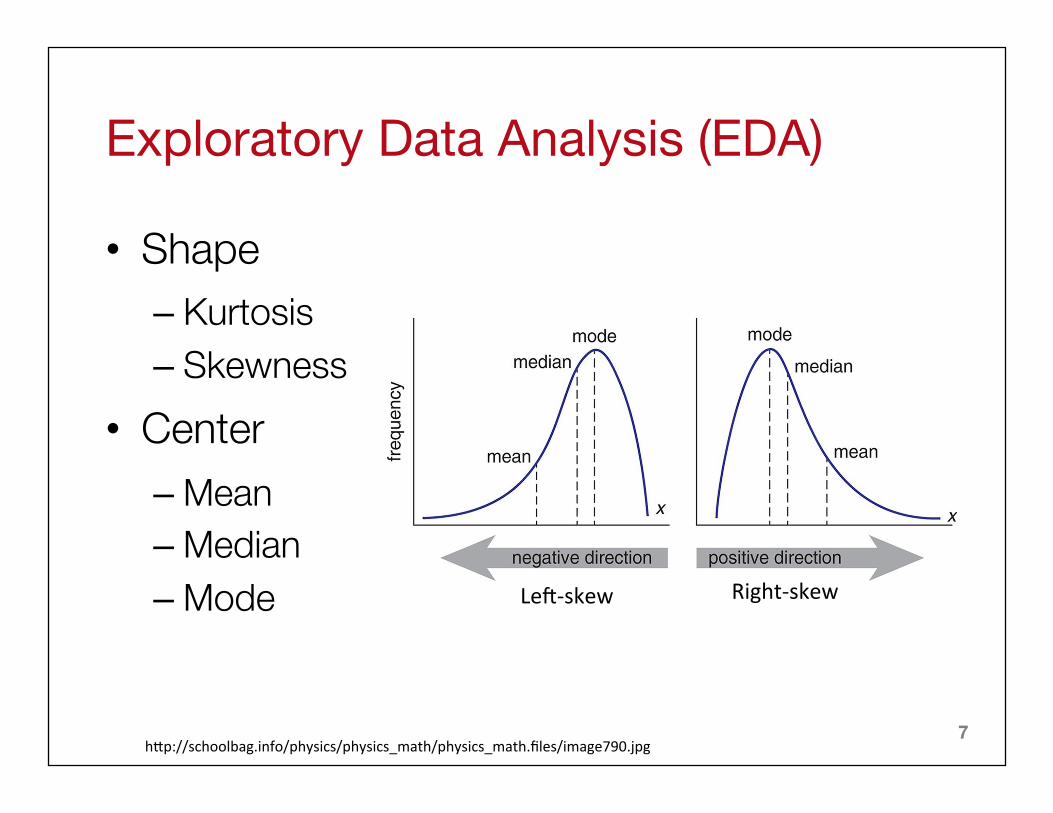
Exploratory Data Analysis (EDA)
• Shape – Kurtosis – Skewness
• Center – Mean – Median – Mode Le#-skew Right-skew
h.p://schoolbag.info/physics/physics_math/physics_math.files/image790.jpg
8
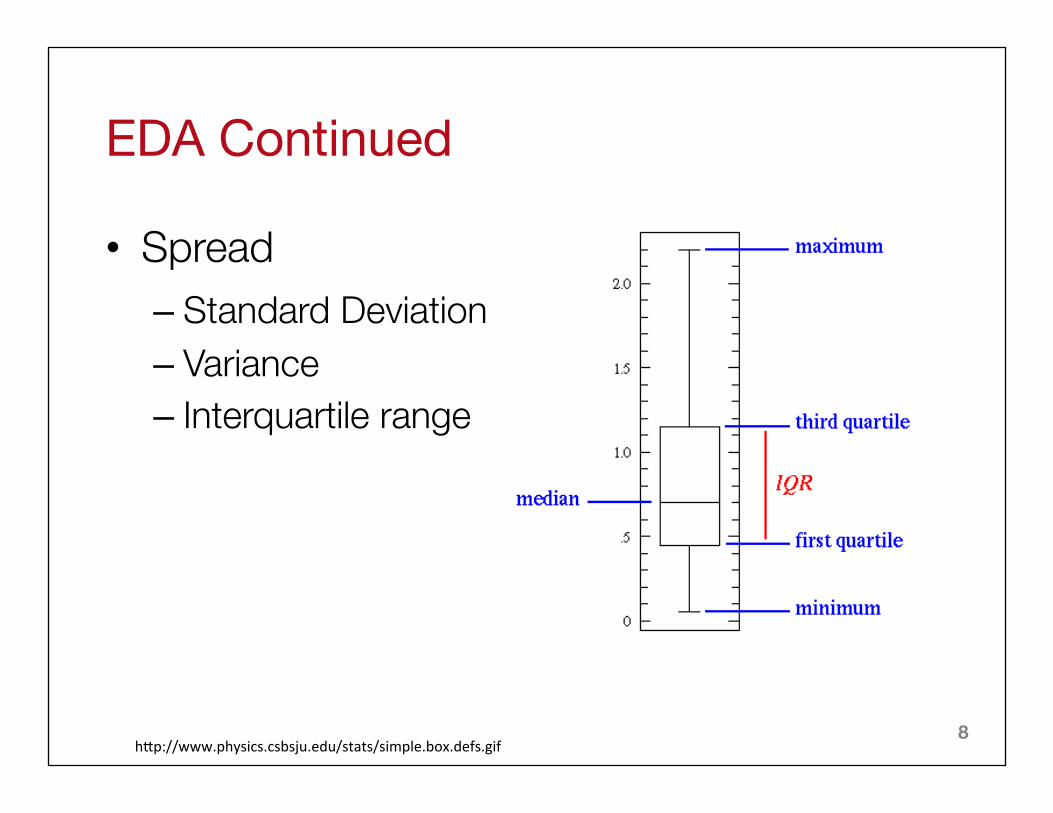
EDA Continued
• Spread – Standard Deviation – Variance – Interquartile range
h.p://www.physics.csbsju.edu/stats/simple.box.defs.gif
9
Variables
• Independent: Variables changed in an experiment that may impact the outcome
• Dependent: Variables that are being tested in an experiment
• Moderator: Variables that are not part of the experiment but might still impact the outcome
10
Hypotheses
• Null hypothesis: There is no difference • Alternative hypothesis: There is a difference • You generally either “reject the null
hypothesis” (find evidence in support of the alternative hypothesis) or “fail to reject the null hypothesis” (do not find evidence in support of the alternative hypothesis)
11
P values
• What is the probability that the data would look like this if there’s no actual difference?
• Most often, α = 0.05 – If p < 0.05 , reject null hypothesis; there is a
“significant” difference – You don’t say that something is “more
significant” because the p value is lower

12
Type I Errors
• Type I error (false positive) – You would expect this to happen 5% of the time
if α = 0.05 • What happens if you conduct a lot of
statistical tests in one experiment?
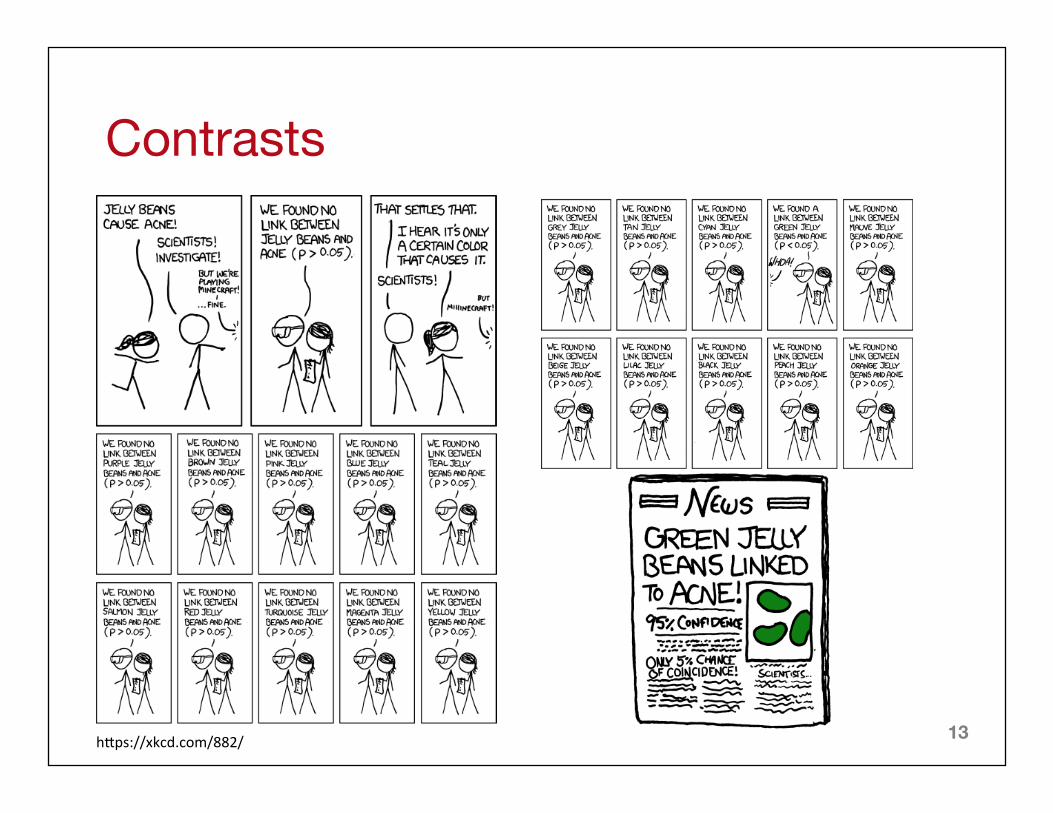
13
Contrasts
h.ps://xkcd.com/882/
14
Contrasts
• If we determine that the variables are dependent, we may compare conditions
• Planned vs. unplanned contrasts – You have a limited number of planned contrasts
(depending on the DF) for which you don’t need to correct p values.
• Bonferroni correction (multiply p values by the number of tests) is the easiest to calculate but most conservative
15
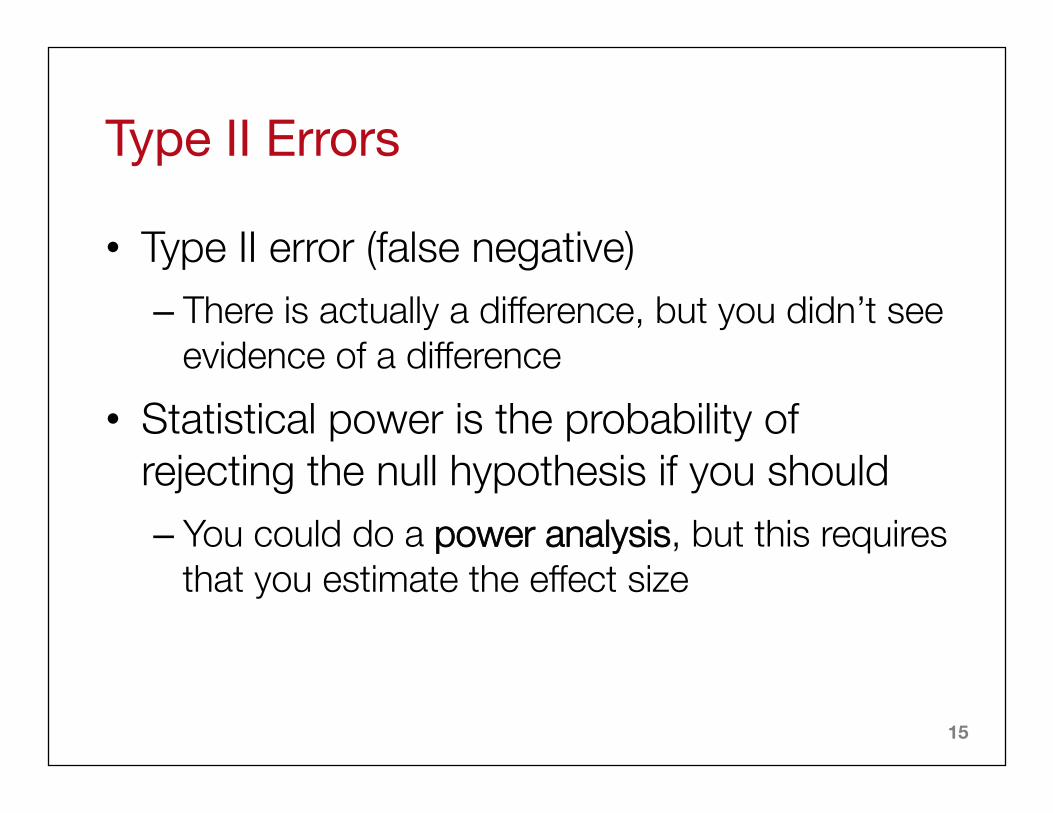
Type II Errors
• Type II error (false negative) – There is actually a difference, but you didn’t see
evidence of a difference • Statistical power is the probability of
rejecting the null hypothesis if you should – You could do a power analysis, but this requires
that you estimate the effect size
16
Threats to Your Experiment
• External validity (generalizability) • Internal validity (confounding variables) • Construct validity • Incorrect Type I errors • Power

17
Sources of Variation
• Measurement • Environmental • Treatment application • Subject-to-subject

18
PICKING THE RIGHT TEST So much information!
19
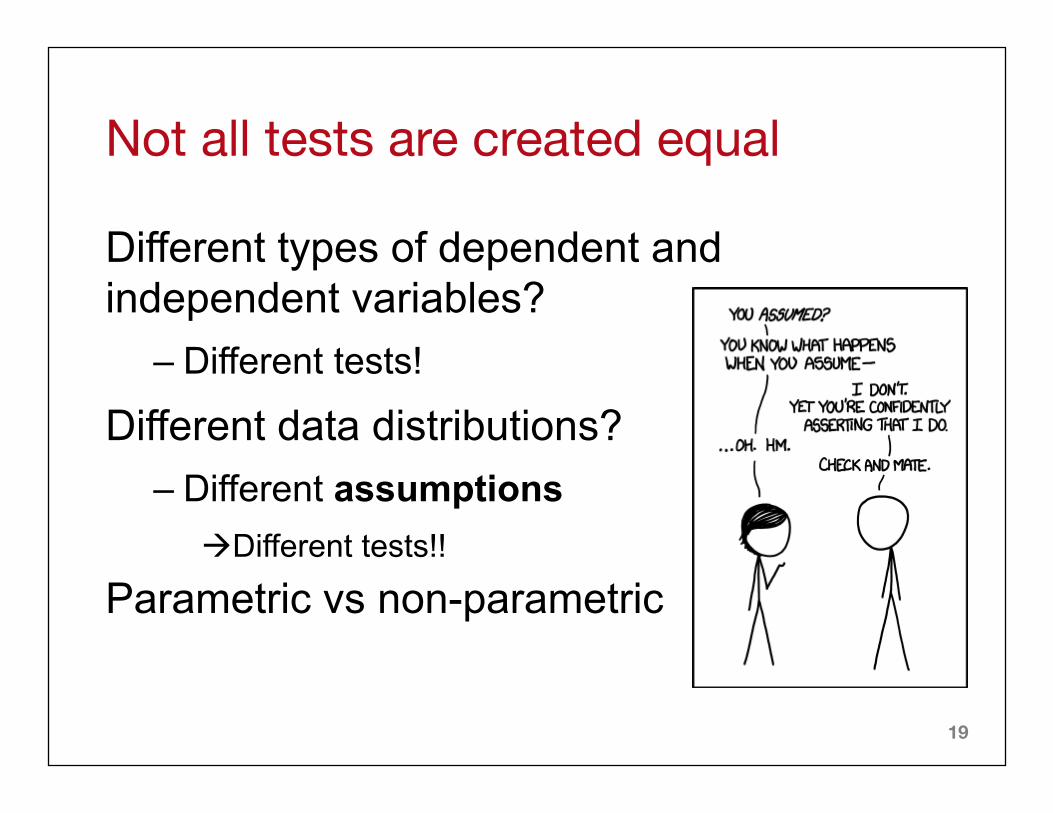
Not all tests are created equal
Different types of dependent and independent variables?
– Different tests! Different data distributions?
– Different assumptions à Different tests!!
Parametric vs non-parametric
20
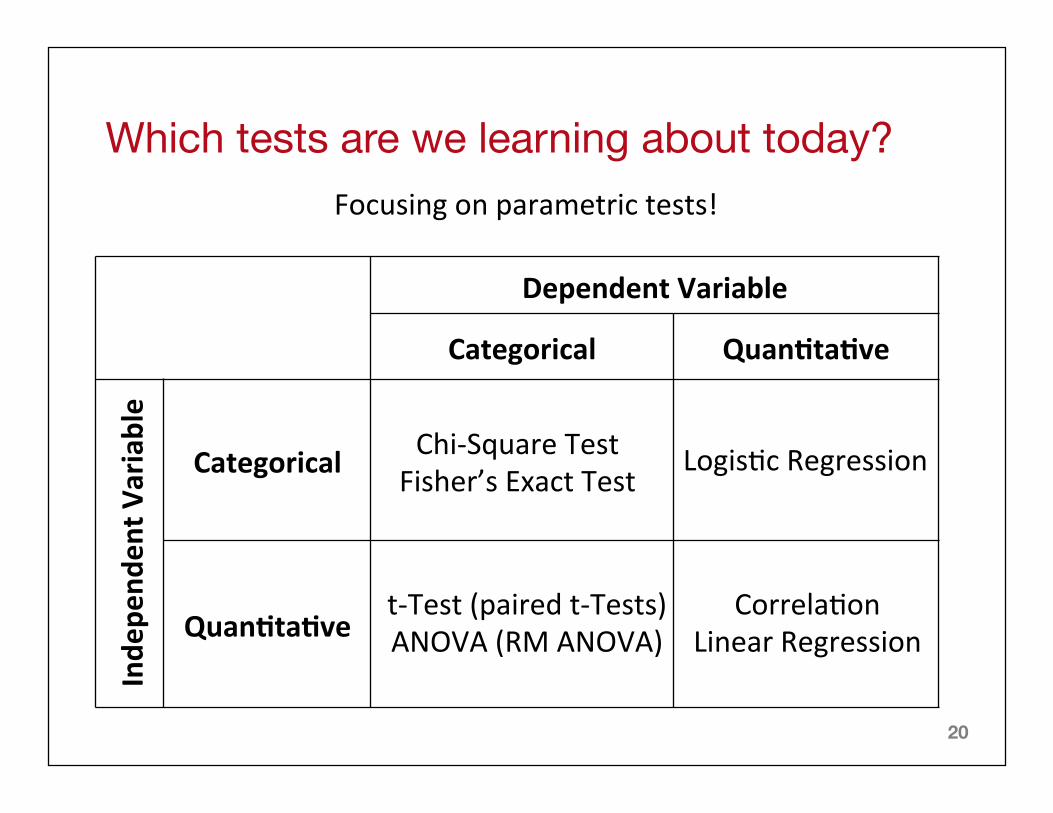
Which tests are we learning about today?
DependentVariable
Categorical Quan4ta4ve
Inde
pend
entV
ariable
Categorical
Quan4ta4ve
Focusingonparametrictests!
Chi-SquareTestFisher’sExactTest
t-Test(pairedt-Tests)ANOVA(RMANOVA)
CorrelaWonLinearRegression
LogisWcRegression

21
DV: CATEGORICALIV: CATEGORICAL

22
(Pearson’s) Chi-squared (χ2) Test
• Examples: – Does the gender (male, female) of the unicorn correlate
with a unicorn’s favorite color? – Does the type of food it eats correlate to its privacy
concerns? • H0: Variable X factors are equally distributed across
variable Y factors (independence)
• (Not covered today) Goodness of fit: Does the distribution we observed differ from a theoretical distribution?

23
Contingency tables
• Rows are one variable, columns the other
• χ2 = 97.013, df = 14, p = 1.767e-14
24
Chi-squared (χ2) Notes
• Use χ2 if you are testing if one categorical variable (usually the assigned condition or a demographic factor) impacts another categorical variable – If you have fewer than 5 data points in a single
cell, use Fisher’s Exact Test • Do not use χ2 if you are testing quantitative
outcomes!
25
What are Likert-scale data?
• Respond to the following statement: Unicorns are magical. – 7: Strongly agree – 6: Agree – 5: Mildly agree – 4: Neutral – 3: Mildly disagree – 2: Disagree – 1: Strongly disagree
26
What are Likert-scale data?
• Some people treat it as continuous (meh!) • Other people treat it as ordinal (ok!)
– You can use Mann-Whitney U / Kruskal-Wallis (non-parametric)
• A simple way to compare the data is to “bin” (group) the data into binary “agree” and “not agree” categories (ok!) – You can use χ2 (parametric)

27
DV: CATEGORICALIV: QUANTITATIVE
28
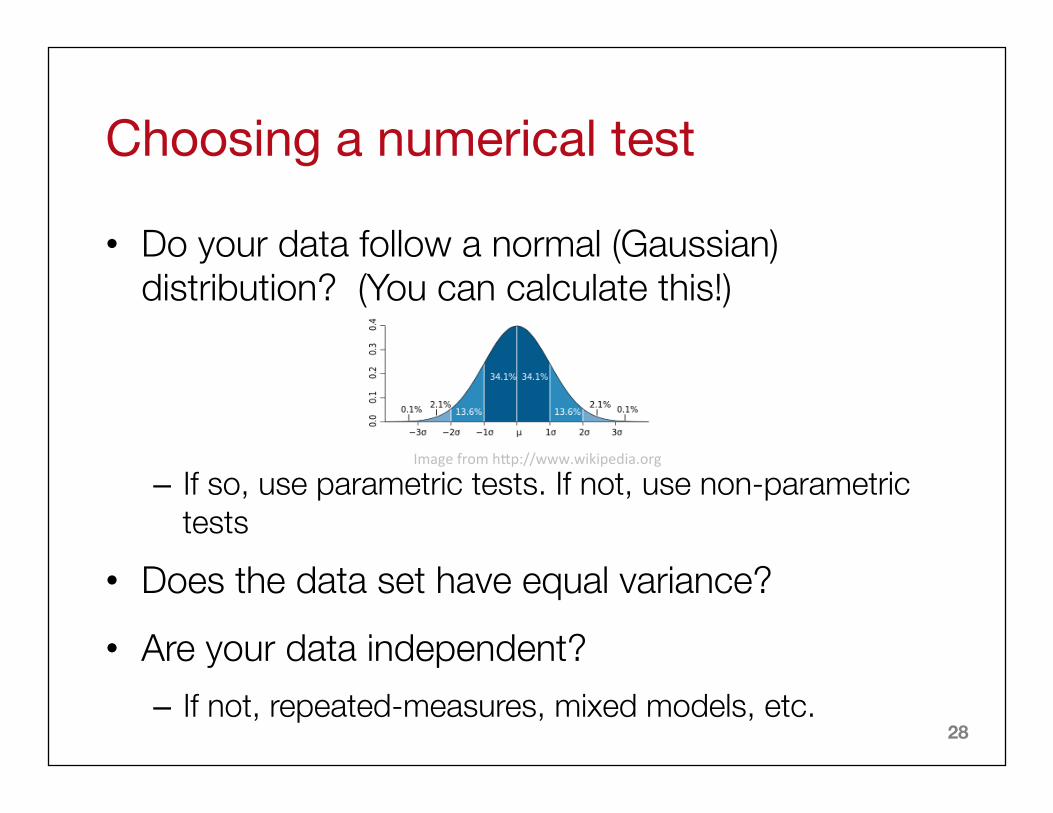
Choosing a numerical test
• Do your data follow a normal (Gaussian) distribution? (You can calculate this!)
– If so, use parametric tests. If not, use non-parametric
tests
• Does the data set have equal variance?
• Are your data independent? – If not, repeated-measures, mixed models, etc.
Imagefromh.p://www.wikipedia.org
29
Independence
• Why might your data in UPS experiments not be independent? – Non-independent sample (bad!) – The inherent design of the experiment (ok!)
• If you have two data points of unicorns’ race completion times (before and after some treatment), can you actually do a single test that assumes independence to compare conditions?
30
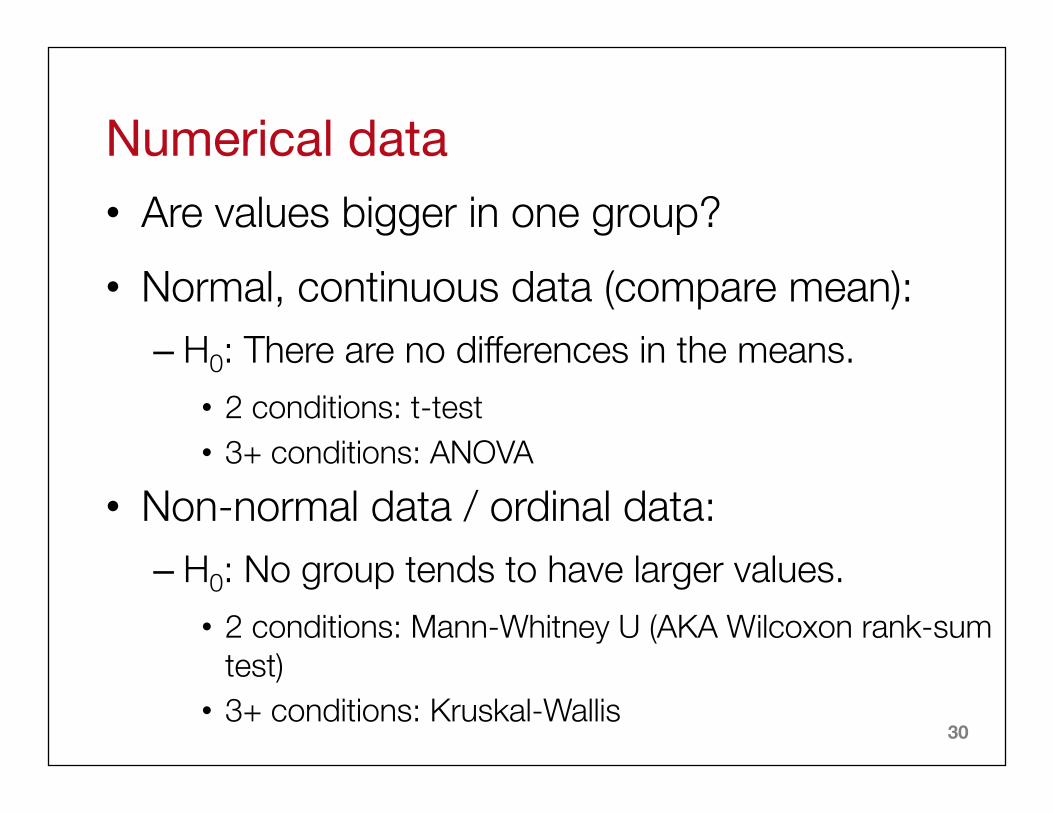
Numerical data • Are values bigger in one group? • Normal, continuous data (compare mean):
– H0: There are no differences in the means. • 2 conditions: t-test • 3+ conditions: ANOVA
• Non-normal data / ordinal data: – H0: No group tends to have larger values.
• 2 conditions: Mann-Whitney U (AKA Wilcoxon rank-sum test)
• 3+ conditions: Kruskal-Wallis

31
DV: QUANTITATIVE
32
Correlation
• Usually less good: Pearson correlation – Requires that both variables be normally
distributed – Only looks for a linear relationship
• Often preferred: Spearman’s rank correlation coefficient (Spearman’s ρ) – Evaluates a relationship’s monotonicity
• always going in the same direction or staying the same
33
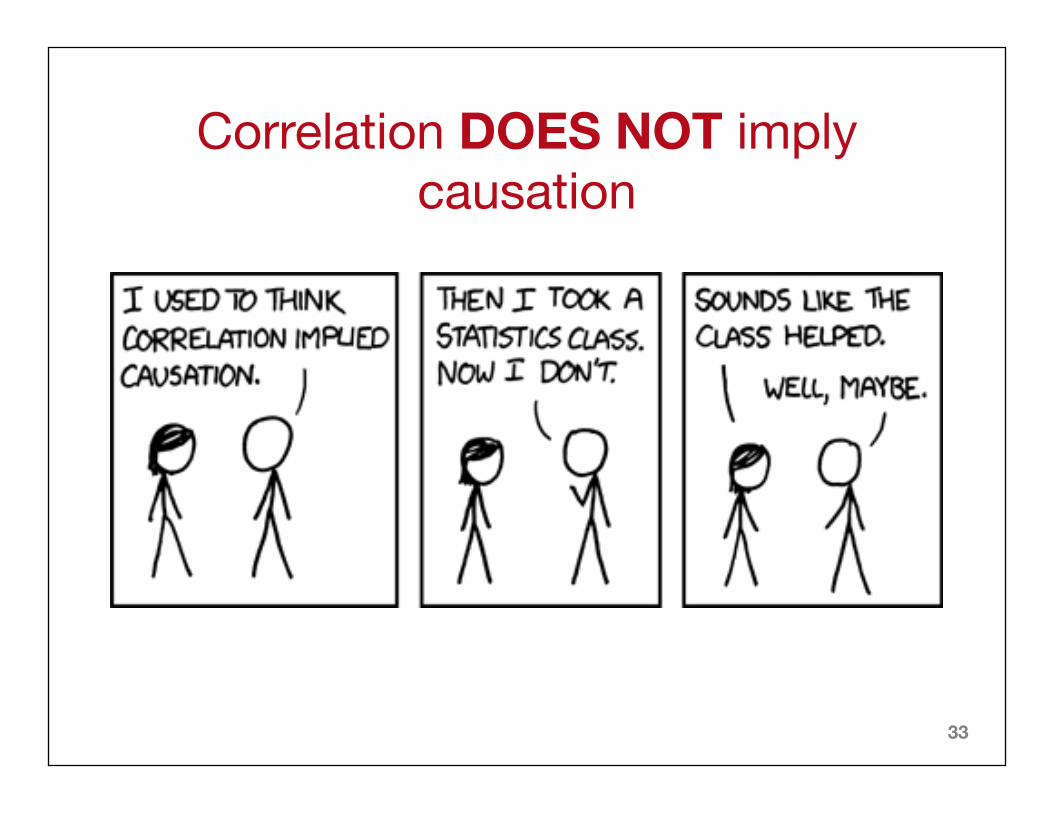
Correlation DOES NOT imply causation
34
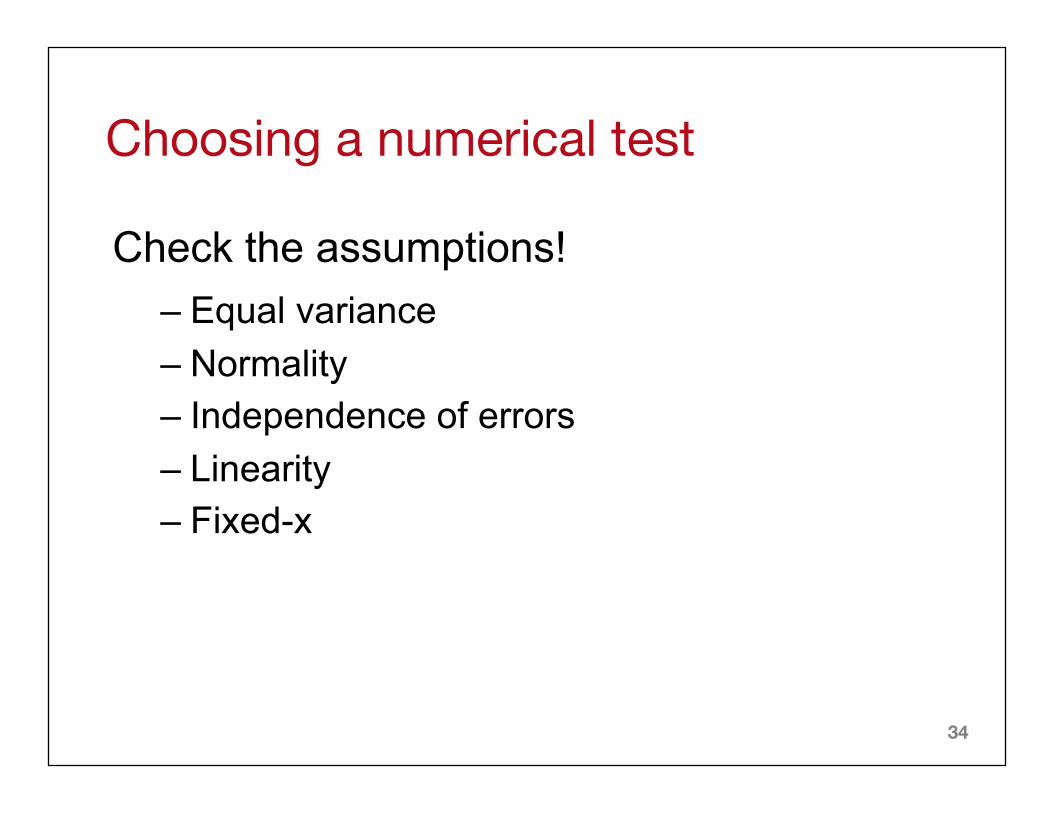
Choosing a numerical test
Check the assumptions! – Equal variance – Normality – Independence of errors – Linearity – Fixed-x
35
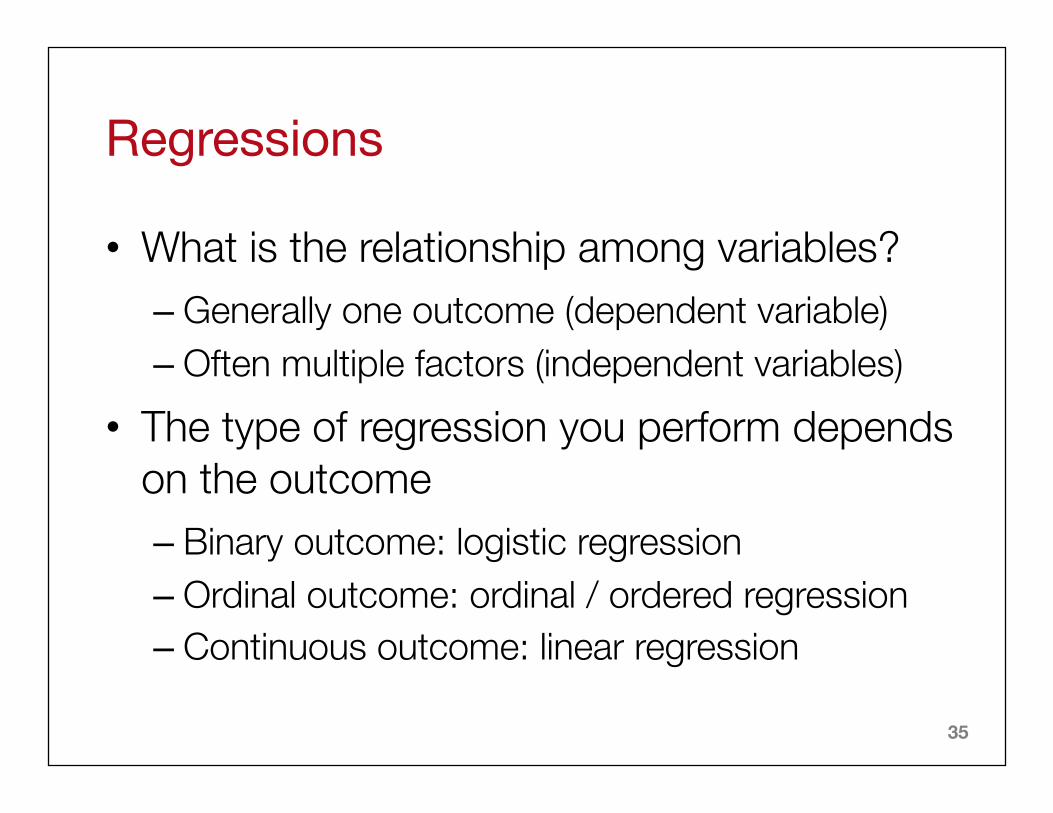
Regressions
• What is the relationship among variables? – Generally one outcome (dependent variable) – Often multiple factors (independent variables)
• The type of regression you perform depends on the outcome – Binary outcome: logistic regression – Ordinal outcome: ordinal / ordered regression – Continuous outcome: linear regression
36
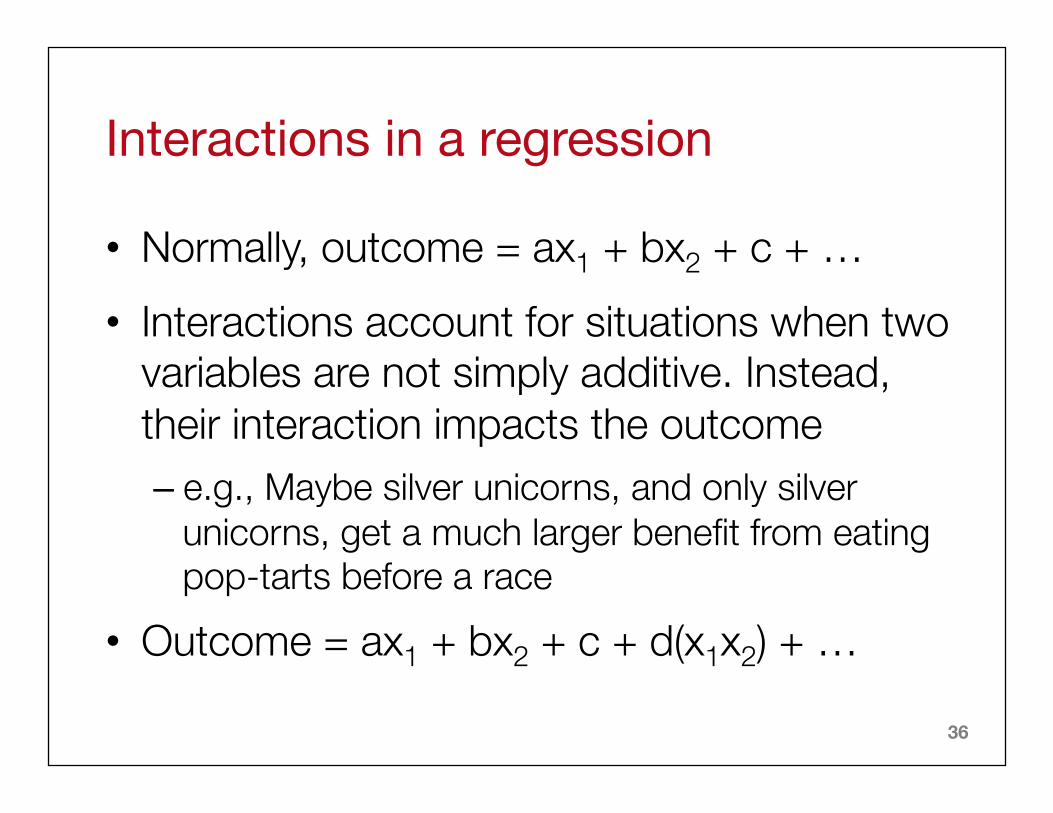
Interactions in a regression
• Normally, outcome = ax1 + bx2 + c + … • Interactions account for situations when two
variables are not simply additive. Instead, their interaction impacts the outcome – e.g., Maybe silver unicorns, and only silver
unicorns, get a much larger benefit from eating pop-tarts before a race
• Outcome = ax1 + bx2 + c + d(x1x2) + …
37
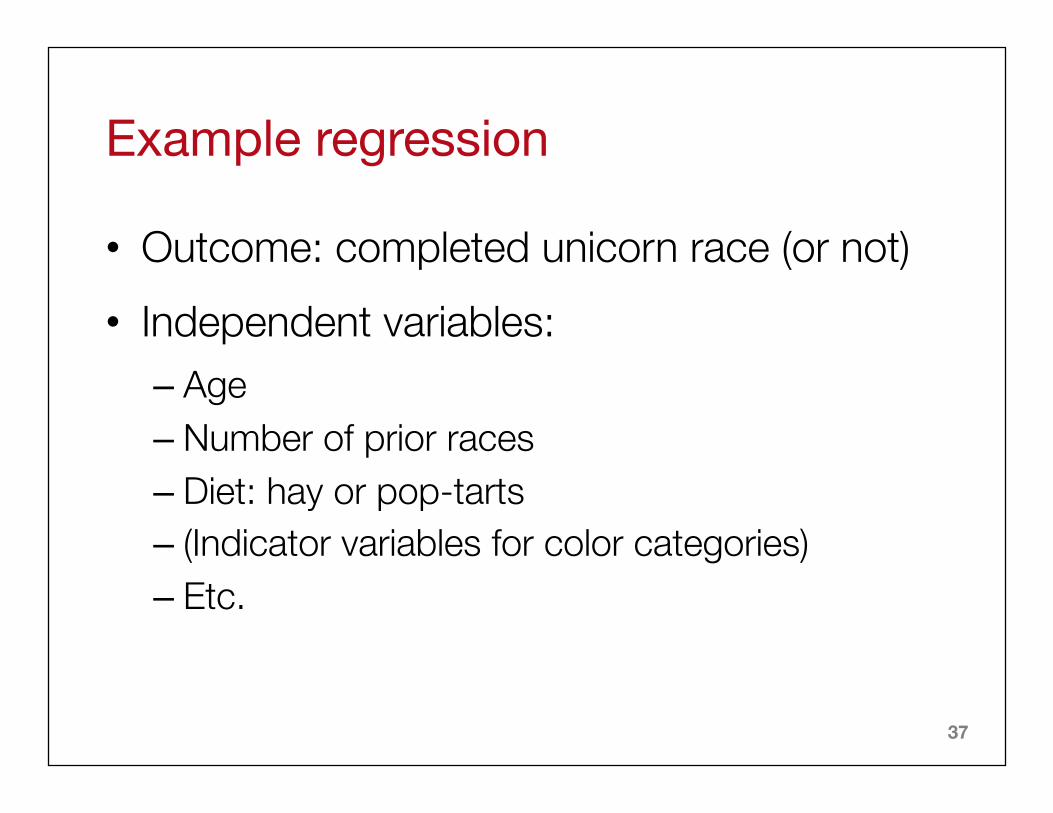
Example regression
• Outcome: completed unicorn race (or not) • Independent variables:
– Age – Number of prior races – Diet: hay or pop-tarts – (Indicator variables for color categories) – Etc.

38
WHAT IF THERE IS NO INDEPENDENCE?
39
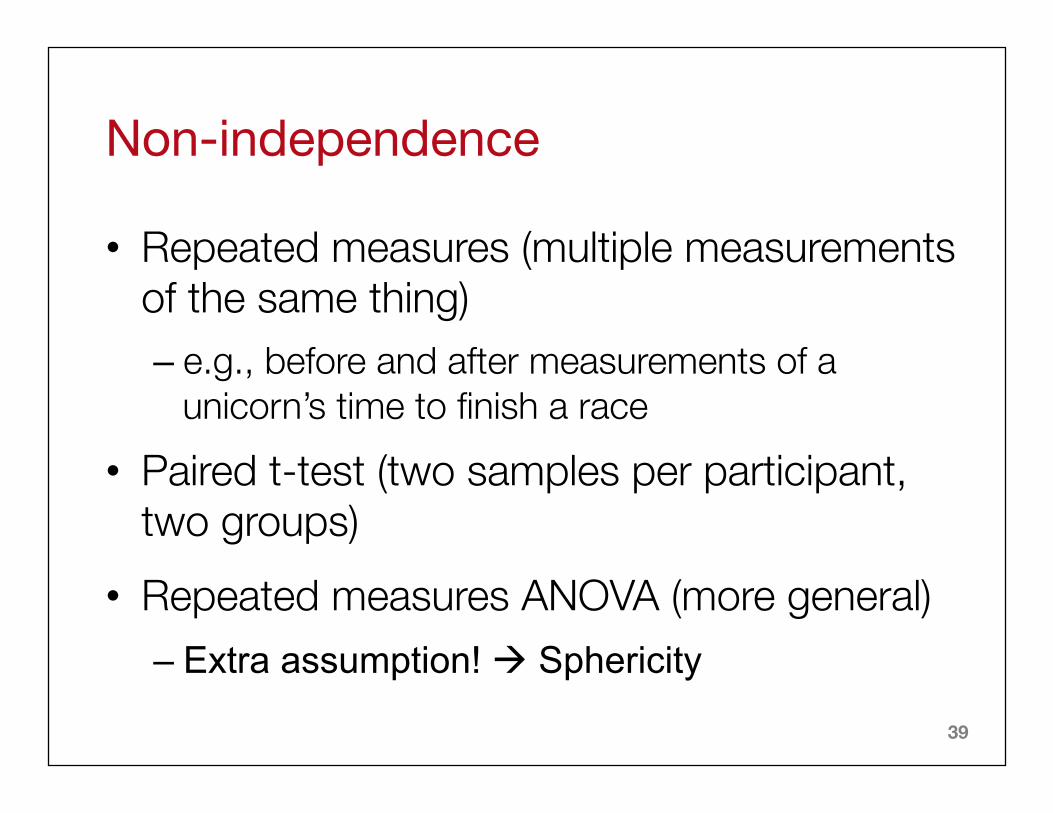
Non-independence
• Repeated measures (multiple measurements of the same thing) – e.g., before and after measurements of a
unicorn’s time to finish a race • Paired t-test (two samples per participant,
two groups) • Repeated measures ANOVA (more general)
– Extra assumption! à Sphericity
40
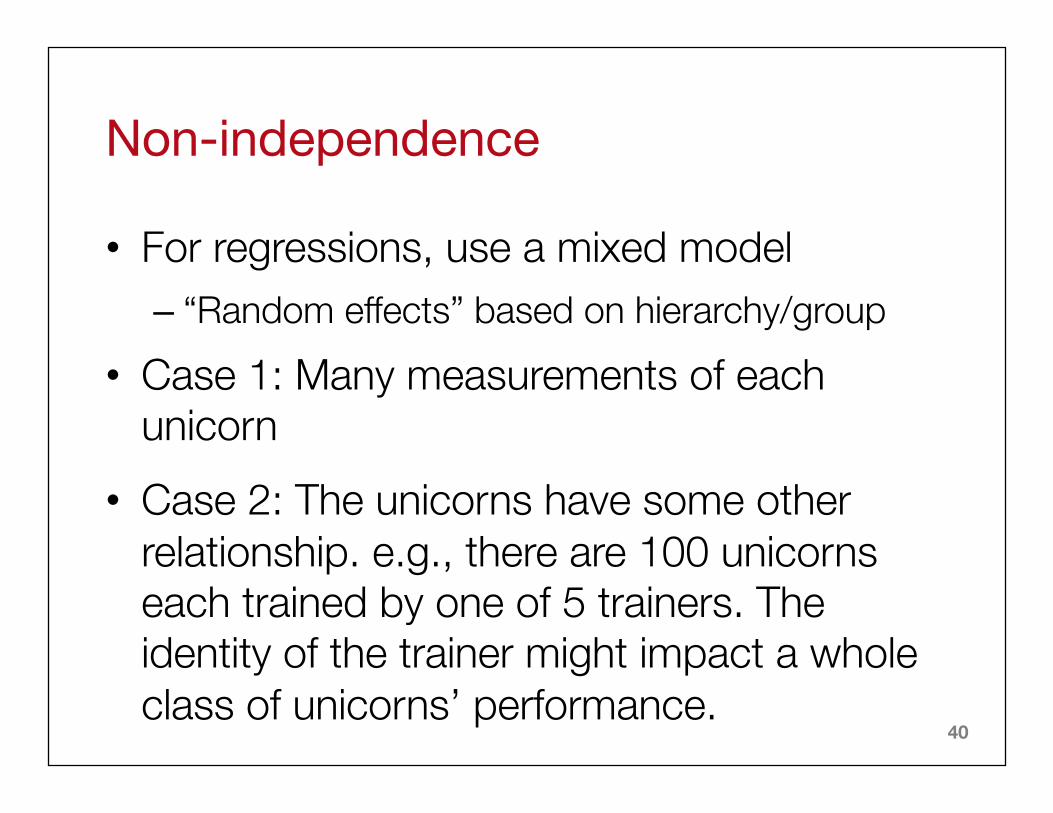
Non-independence
• For regressions, use a mixed model – “Random effects” based on hierarchy/group
• Case 1: Many measurements of each unicorn
• Case 2: The unicorns have some other relationship. e.g., there are 100 unicorns each trained by one of 5 trainers. The identity of the trainer might impact a whole class of unicorns’ performance.

41

42
KAHOOT! Time to review!
43
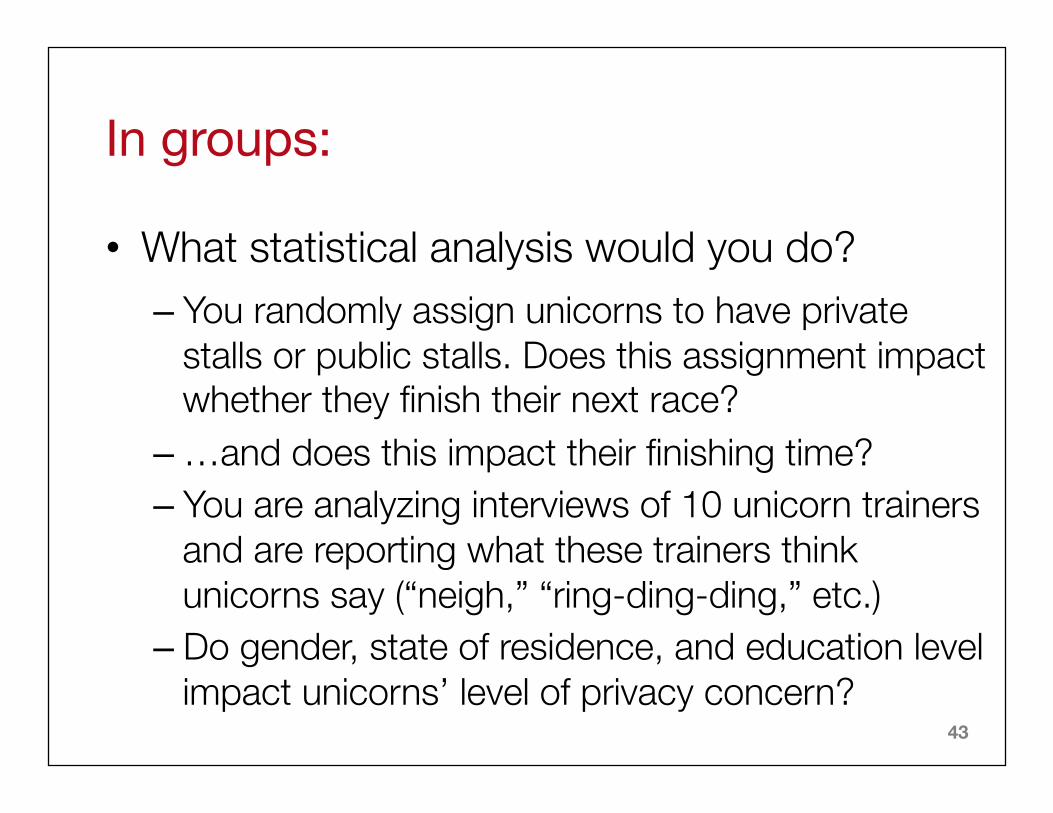
In groups:
• What statistical analysis would you do? – You randomly assign unicorns to have private
stalls or public stalls. Does this assignment impact whether they finish their next race?
– …and does this impact their finishing time? – You are analyzing interviews of 10 unicorn trainers
and are reporting what these trainers think unicorns say (“neigh,” “ring-ding-ding,” etc.)
– Do gender, state of residence, and education level impact unicorns’ level of privacy concern?
44
Picking a test
• http://webspace.ship.edu/pgmarr/Geo441/Statistical%20Test%20Flow%20Chart.pdf
• http://abacus.bates.edu/~ganderso/biology/resources/statistics.html
• http://med.cmb.ac.lk/SMJ/VOLUME%203%20DOWNLOADS/Page%2033-37%20-%20Choosing%20the%20correct%20statistical%20test%20made%20easy.pdf
45
Picking a test/good (basic) reference h.ps://www.amazon.com/Nonparametric-StaWsWcs-Step--Step-Approach/dp/1118840313/ref=asap_bc?ie=UTF8FirstediWonavailableinelectronicformatfromourownlibrary!
46
(Pearson’s) Chi-squared (χ2) Test
• Examples: – Does the gender (male, female) of the pony correlate
with a pony’s favorite color? – Does the type of food it eats correlate to its privacy
concerns? • H0: Variable X factors are equally distributed across
variable Y factors (independence)
• (Not covered today) Goodness of fit: Does the distribution we observed differ from a theoretical distribution?
47
What if you have lots of questions?
• If we ask 40 privacy questions on a Likert scale, how do we analyze this survey?
• One technique is to compute a “privacy score” by adding their responses – Make sure the scales are the same (e.g., don’t
add agreement with “privacy is dumb” and “privacy is smart”… reverse the scale)
– You should verify that responses to the questions are correlated!
48
What if you have lots of questions?
• Another option: factor analysis, which evaluates the latent (underlying) factors – You specify N, a number of factors – Puts the questions into N groups based on their
relationships – You should examine factor loadings (how well
each latent factor correlates with a question) – Generally, you want questions to load primarily
onto a single factor to be confident
49
Practical questions/associated tests
I split unicorns into living in the forest or living in the clouds, and they each indicated whether or not they liked their new living environment. Does the assigned system impact whether or
not they liked it?
50
Practical questions/associated tests
I measured how long unicorns stay in their assigned living space from each unicorn.
Do unicorns that live in the cloud stay more time at home than those that live in the forest?
51
Practical questions/associated tests
I measured how long unicorns stay home and their magicalness score (1 to 100).
Are these values related to each other?
52
Practical questions/associated tests
I measured how long unicorns stay home and their magicalness score, age and weight.
I’m curious what input factors (if any) impact the output.