cyclical behavior of wages - national bureau of … · sc/iaftsgeschichte deutschlands im 19. und...
TRANSCRIPT

This PDF is a selection from an out-of-print volume from the NationalBureau of Economic Research
Volume Title: Wages in Germany, 1871-1945
Volume Author/Editor: Gerhard Bry assisted by Charlotte Boschan
Volume Publisher: Princeton University Press
Volume ISBN: 0-87014-067-1
Volume URL: http://www.nber.org/books/bry_60-1
Publication Date: 1960
Chapter Title: Cyclical Behavior of Wages
Chapter Author: Gerhard Bry
Chapter URL: http://www.nber.org/chapters/c2508
Chapter pages in book: (p. 119 - 190)
CHAPTER 4
Cyclical Behavior of Wages
Cycles in Money Wages
GENERALTO now we have paid little systematic attention to the short-term
movements which modified secular changes in wage levels at all times.Drastic fluctuations of that sort frequently occurred in connection withextraordinary episodes, such as the two world wars or the Great Inflation.Discussion of wage behavior under these abnormal circumstances willbe reserved for Chapter 5. Here we shall be concerned with short-termchanges in wage levels during the comparatively "normal" phases ofGerman history.
During the period 1870-1945 the German economy passed throughtwelve business cycles1—including those during periods of inflation, war,and the years of National Socialism. If these unusual periods are omitted,we have eight and one-half business cycles occurring under comparativelyordinary circumstances. During these "normal" periods there were onlytwo really dramatic cycles—the Grunderjahre boom and bust, and thecycle ending with the Great Depression. The GrQnderjahre boom2 wasstimulated by the results of the victory in the Franco-Prussian War:annexation of Alsace and Lorraine, reparations payments from France,retirement of war bonds by the government, and—most important—general expectations of a great political and economic future for theReich. The foundation of the Reich had also brought practically un-restricted freedom to found enterprises (only the incorporation of banksand railroads required a license), a federal commercial law, a uniformnational currency, and an improved banking system. These conditionswere conducive to the emergence of a large number of business ventures,industrial and financial. Railroad companies, mining and industrialenterprises, real estate and building concerns sprang up—frequently setup for wildly speculative and even fraudulent aims. Production, com-modity prices, and stock quotations rose rapidly until 1873, when one ofthe sharpest and longest contractions in Germany's business history
1 The reference chronology of the National Bureau includes turning points foreleven of these cycles, up to 1932. But the rise and fall of the German economy underNational Socialism no doubt constitutes an additional cycle. The number of cyclesremains the same, whether they are based on monthly or on annual data.
The National Bureau chronology is presented and compared with chronologies bySpiethoff, Clausing, and Wagemann in Appendix B. In this and later chapters, Germanbusiness cycles (and their expansion and contraction phases) are identified in accordancewith the reference chronology of the National Bureau.
For a brief vivid description of the Gründer/ahre cycle see Heinrich Bechtel, Win-sc/iaftsgeschichte Deutschlands im 19. und 20. Jahrhundert (Munchen, 1956), pp. 183-88.
1
120 WAGES IN GERMANY
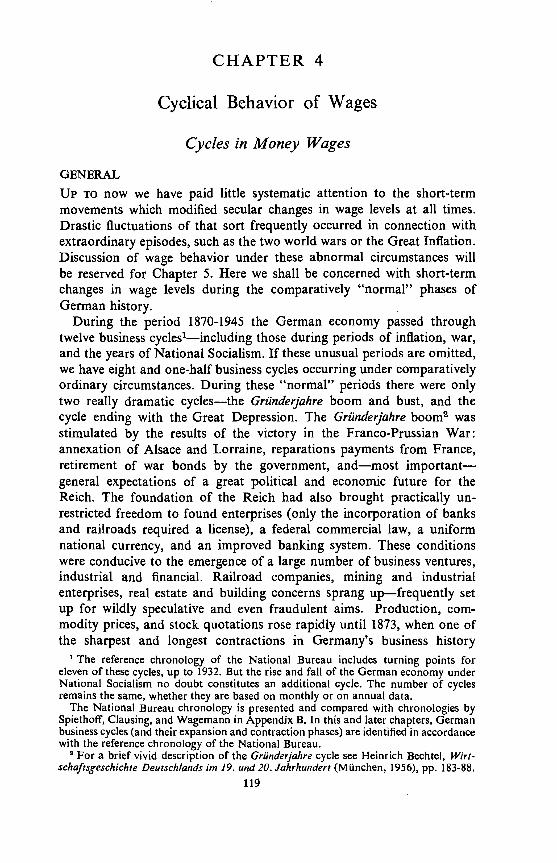
CHART IIBusiness and Labor Market Conditions, 1870—1944
Shaded areas represent business contractions.Appendix Table A-I.
o 'n 0a' a' a'

CYCLICAL BEHAVIOR OF WAGES 121
occurred. There was an extraordinary wave of bankruptcies. The pricedecline was very steep—about a third for raw material and intermediateproduct prices. The production index of the IKF registered only a milddecline, although iron consumption is reported to have been cut by morethan half, and contemporary and later historical studies describe "veryconsiderable" and "widespread" unemployment.3 The other huge businesscycle, lasting from 1926 to 1932, developed in a radically different climate,following as it did in the wake of a lost war. The expansion was character-ized by relatively high levels of unemployment—which might, at leastpartly, reflect the short-term effects of a large-scale program of moderniz-ation and "rationalization," furthered by long-term loans from abroad.The Great Depression was international in scope and complicated by massunemployment and severe political repercussions. Compared with theseupheavals, the other "normal" cycles were relatively mild and did notaffect the economy to a similar extent (see Appendix Table A-i andChart 11).
For the purposes of a wage study the cyclical behavior of labor-marketactivities is of particular interest. A number of pertinent series—coveringemployment, unemployment, and labor strife—are included in the tableand chart mentioned. To summarize their behavior in broadest terms:The selected indicators show that short-term changes in the labor marketare closely associated with volume of production and business cycles atlarge. In the series bearing on physical output—labor input and degreeof employment or unemployment—we find substantial differences incyclical behavior before and after World War I. The interwar periodbrought higher unemployment levels and more violent cyclical swings.The difference in labor-market behavior before and after World War Icorresponds to the break in industrial growth trends which is so decisivean aspect of German economic development.
This chapter will be concerned in detail with the effect of varying businessconditions on the course of wages, but only incidentally with the effectof wage changes on the fortunes of the economy at large. However, sincethe broad economic implications of wage behavior will be touched uponoccasionally, it is desirable to indicate the quantitative importance ofwage payments in personal income fluctuations. Table 30 shows changes
Der Arbeilerfreund (Berlin, 1879), pp. 18 if.; Willard L. Thorp, Business Annals(National Bureau of Economic Research, 1926), and Arthur A. Spiethoff, Die Win-schaJ'tlichen Wechsellagen (TQbingen, 1955), Vol. 1, p. 124.
A mild decline in industrial production, in spite of a generally severe contraction,occurred also in the United States during these years. This might be related to the markedfall in prices and its effect on purchases. Rendigs Fels, explaining the mildness ofvolume reductions in the United States, argues that the high price flexibility at that timemitigated the decline of output (though prolonging the contraction phase of the cycle)and that the price depression stimulated exports and created a favorable balance ofpayment. See his "American Business Cycles, 1865-1879," American Economic Review,June 1951, especially pp. 346 and 347. The circumstances cited—mild decline in pro-duction, sharp price breaks, and prolonged depression—are also characteristic of theGerman contraction.

122 WAGES IN GERMANY
TABLE 30Total Personal Income, by Source, 1913 and 1925-1940
(billions of marks)
Proprietors' Proprietors'Total Dividends Income, Income, Unemployment
Personal and Forestry and Trade and Insurance and Wages andYear Income Interest Rents Agriculture Industry Pensions Salaries
1913 43.6 5.7 0.9 5.7 9.2 1.4 20.7
1925 57.6 1.2 0.5 5.7 10.9 5.6 33.71926 60.8 1.6 0.6 5.8 10.8 7.1 34.81927 67.1 2.1 0.8 5.9 12.0 7.4 38.91928 72.7 2.8 0.8 5.8 12.2 8.4 42.61929 73.6 3.3 0.9 5.5 11.8 9.2 43.0
1930 69.0 3.3 0.9 5.0 10.0 10.0 39.91931 59.4 3.2 0.9 4.4 7.5 10.1 33.41932 47.8 2.3 0.8 3.7 6.0 9.4 25.71933 47.9 2.4 0.7 3.9 6.4 8.5 26.01934 52.6 2.6 0.8 5.0 7.2 7.9 29.2
1935 57.9 2.6 0.8 5.8 8.5 7.9 32.31936 63.2 2.7 1.0 5.8 10.6 7.8 35.31937 69.7 2.8 1.1 6.1 13.3 7.6 38.91938 77.4 3.0 1.2 6.4 15.9 7.9 43.01939 85.8 3.0 1.3 6.9 17.9 10.2 46.41940 91.2 3.2 1.4 6.9 18.5 14.1 47.1
SOURCE: "Das deutsche Volkseinkommen vor und nach dem Kriege,"zur Statistik des Deutschen Reichs, No. 24 (1932), p. 83; Jahrbuch 1939-40, p. 579, and1941-42, p. 605.
in total personal income and its major components for 1913 and for 1925-40. Wage-salary income during the interwar period is here seen to haveaccounted for more than half of total personal income in each of theseyears. The cyclical swings of labor income were roughly similar to thoseof total national income—wider than those in pension income andagricultural income, but shallower than those of profits in trade andindustry. Table 31 contains a further breakdown of wage-salary income.It shows that wage income proper is only about half of total wage-salaryincome. This relation varies strongly with the business cycle, since salaryincome shows appreciably greater cyclical stability. While in 1929, forinstance, 54 percent of the wage and salary total consisted of wages, thisportion fell to 46 percent in 1932. Between 1929 and 1932 wage incomewas almost cut in half, while salary income decreased by only 30 percent.Fluctuations in the industrial payroll (manufacturing and mining) tendedto be wider than those in the payroll covering all wage earners. During thereference contraction of 1929-32, for instance, the industrial payrolldecreased by 59 percent—about ten percentage points more than the totalwage bill.
These fluctuations in aggregate wage payments are caused to a large

CYCLICAL BEHAVIOR OF WAGES 123
TABLE 31
Total Wages and Salaries, 1929-1940(billions of marks)
YearWages and
Salaries(1)
Salaries(2)
Wages(3)
Payroll inManufacturing
and Mining(4)
1929 43.0 19.7 23.3 13.31930 39.9 18.7 21.2 n.a.1931 33.4 16.7 16.7 n.a.1932 25.7 13.8 11.9 5.41933 26.0 13.6 12.4 5.91934 29.2 14.3 14.9 8.0
1935 32.3 15.4 16.9 9.31936 35.3 16.5 18.8 10.61937 38.9 17.7 21.2 12.11938 43.0 19.3 23.7 13.61939 46.4 20.9 25.5 16.21940 47.1 22.1 25.0 15.7
SOUgCE, by column:(1 to 3) Wirtschaft und Statistik, 1939, p. 301 ; Jahrbuch 1939-40, p. 579, and 1941-42,
pp. 605 if.(4) For 1929 and 1932, Wirtschaft and Statisrik, 1939, p. 301; for 1933 to 1940,
Handbuch 1928-44, p. 473.
extent by variations in total man-hours worked, which in turn reflectchanges in employment and in average hours worked per week. Duringthe 1929-32 contraction the decline in total man-hours was as large as46 percent. Only a minor part of the variation in the wage bill is explainedby fluctuations in earnings and in rates, which is one of the earningscomponents. It is with the cyclical behavior of rates and earnings ofemployed workers, particularly those attached to manufacturing andmining, that the following analysis is concerned.
Before we embark on the analysis itself, let us review the conceptualdifferences between rates and earnings.4 Wage rates, quoted on an hourlyor weekly basis, are, in principle, the prices for work of defined characterand skill during the given time period. Rates are typically quoted for"straight-time" work and are thus not affected by premium arrangementsfor overtime, night, and holiday work, or for high productivity. Nominaland effective wage rates must always be clearly distinguished. The formermay be minimum rates, "prevailing" rates, union rates, or other wagequotations which serve as a limit or norm. Effective rates are alwaysactually paid rates—as reflected in payroll or similar records. Piece ratesare paid for defined operations or for entire parts and products. They
'See also Daniel Creamer, Behavior of Wage Rates During Business Cycles,(Occasional Paper 34, National Bureau of Economic Research, 1950), pp. 2-4; andPaul H. Douglas, Real Wages in the United States 1890-1926, (Houghton Muffin,1930), pp. 6 if.

124 WAGES iN GERMANY
are quoted per unit of operation or accepted product. Minimum standardpiece rates assure the piece-rate worker of a floor under his efficiencywage.5
The collectively agreed-upon rates had different significance duringdifferent time periods. At the beginning of our period they were usuallythe highest paid in each trade—covering only a relatively small numberof organized, and generally highly paid, workers. During the WeimarRepublic they covered practically all workers, and being regarded asminimum rates, they were generally exceeded by actually paid rates.Direct comparison of nominal rates in the nineteenth and twentiethcenturies might thus somewhat understate the changes in effective rates.The quoted rates, in any case, can be regarded as "list prices" only, notas "effective prices." Furthermore, to derive effective labor costs per hourto the employer, modifying factors such as incidence and rate of premiumpayments must be considered.
Both time and piece rates are, of course, basic elements in the deter-mination of earnings. Among the additional elements affecting earningsare the rates for, and the relative importance of, premium work, theactual output of piece workers, production and other bonuses, and thenumber of hours worked. The latter affects daily earnings, shift earnings6and weekly earnings directly and indirectly (via premium payments),hourly earnings only indirectly.
Earnings, as commonly ascertained, are often affected by additionalvariables. Typically, average earnings are derived as quotients of aggregatepayroll and total hours, shifts, or weeks worked during the payroll period.In these cases, changes. in the composition of the work force and of thehours worked will affect the resultant earnings whenever no statisticalstandardization of the composition is provided. Without standardizationaverage hourly and weekly earnings maybe affected by changes in skill, age,and sex composition of the work force, changes in the quantitative impor-tance of inexperienced labor as compared with experienced, and by changesin the proportion of single and married workers and of workers in differenttypes of industries, cities, and regions. Weekly earnings, furthermore, maybe influenced by a changing importance of part-time work, particularlyif no clear distinction is made between fully and partially employed
Piece rates will not be analyzed per se in subsequent discussions, but they enter intothe derivation of some union rates and of average hourly and weekly earnings. For theunion rates available during the period of the Weimar Republic and later, so-calledAkkordrichtsätze (standard rates for piece work) are included in the rate averages.These were minimum standards for expected average earnings resulting from piecerates and were usually set at 15 percent above comparable time rates. On the nature ofthe minimum time and standard piece rates agreed to in the collective contracts of theWeimar Republic, see notes to Appendix Table A-2, Part iii.
6 Shift earnings play a large part in German wage analysis, since one of the mostimportant collections of German earnings statistics, miners' earnings, is published inthis form. In German coal mines, shift earnings for surface workers were mostly basedon time rates. In underground operations the so-called Gedingelohn prevailed, a systemin which remuneration of the miner was, to a large extent, based on group performance.

CYLJCAL BEHAVIOR OF WAGES 125persons. Some of the effects of changing composition of the work forceand of changes in number of hours worked may, of course, be excluded ifaverage earnings are computed separately for men and women, skilledand unskilled, and similar categories. Such standardized earnings data forbroad groups (skill, sex, and industry) are available for the last few yearsof the Reich. For earlier periods the best way to exclude the effects ofchanging composition is to select sufficiently small, occupationally well-defined groups.
Many of the wage series depicted in Charts 2 to 5 and Chart 12 showrecurrent ups and downs which correspond roughly to business cycleexpansion and contraction periods—an indication that wages respond tocyclical changes in general business activity. However, even casual in-spection of these charts reveals that the actual relation of short-term wagefluctuations and business cycles was far from regular or simple. Frequentlyannual changes in wages appeared to be rather independent of cycles ingeneral business conditions. This was true not only for contractions inperiods of rapid monetary depreciation, such as 1917-19 or 1922-23,but also for some of the briefer "normal" contractions, for example1903-4, to which our wage series showed little or no perceptible response.In particular, wage rates failed to show—over extended periods of time—genuine cycles (with rises and actual declines) despite fluctuations ingeneral business conditions. Thus it is necessary first to establish whetherwage rates and earnings did in fact respond to changes in general businessconditions, and if so, with what degree of regularity and under whatcircumstances. Only then may we ask how promptly they responded, howstrongly, and in what cyclical patterns.
WAGES AND TURNING POINTS IN BUSINESS CONDITIONSConformity of Wage CyclesWAGE RATES AND BUSINESS CYCLES. There is no doubt that German wage
rates showed true cyclical behavior during the Grunderjahre cycle of1870-78, and during the major business cycle of 1926-32. This appearsfrom the hourly and weekly printing and building rates depicted inCharts 3 and 6 as well as from the average rates for all industry (1924-32)in the latter chart. In the cycles cited, even these rough annual data showsubstantial increases and declines which can easily be related to cyclicalchanges in business conditions. We can go no further, however, in findingexamples of full cycles, with actual ups and downs, of wage rates in theannual record of the long-term series mentioned. It is true that in someinstances wage rates undergo changes in their rate of growth, or a leveling-out into plateaus, which may be related to cycles in general businessconditions. In building rates prior to World War I, for example, a com-bination of leveling-off and brief decline matches the 1890-94 contractionin general business conditions; and the retardation of growth during 1900-2corresponds to the business contraction of the same years. Again, the

126 WAGES IN GERMANY
CHART 12
Wage Rates and Earnings in Selected Industries, 1871—1913
Shaded areas represent business contractions.Source: Tables 33 and 36, and Appendix Tables A-3 to A-8.
Hourly Wage Rates
Printers, 3 cities
Four industries (building,machinery, printing, andwoodworking)
Daily Earnings
Railway workers,WUrttemberg system
Metal workers,Krupp, Essen
Railway workers,Prussian system
Shift Earnings, Miners
Surface workers,10 centers
Hewers and haulers,10 centers
Hewers and haulers,Dortmund
Buflding workers, 3 cities
chonge+200
+150 -
+100
+80
+ 60+50+ 40+ 30+ 20+ 10
0
—10
—20
—30
—40
—50
—60

CYCLICAL BEHAVIOR OF WAGES 127comprehensive interwar series of union rates shows during the mid-1920's a slight retardation in its rise which might be regarded as a responseto the business contraction of 1925-26. But in other instances wage ratesdo not indicate any observable responses to changing business conditions.Thus, in following the course of rates in building, we can find no reflectionof the contractions of 1882-86, and 1907-8. Instead, we note thatthroughout these contractions building rates increased at an undiminishedpace, and that between 1878 and 1882 they declined during a businessexpansion. Nor can we observe a correspondence in the case of printingrates before World War I: here it is virtually impossible to match theleveling-out stages of the rates to contractions in business cycles.8
The sporadic nature of the conformity of wage rates to business cycles isobservable in the summary measures presented in Appendix Table A-20,based on hourly and weekly wage rates in selected industries as well as oncomprehensive hourly rates from 1924 to 1932. Average annual changesof cycle relatives are shown for each reference expansion and contractionduring the years 1871-1913 and In all rate series the onlysubstantial declines occurred during the Great Depression. The actualdeclines following the Grunderjahre expansion do not show up in thesereference measures because of the difference in timing between wagecycles and reference cycles. The conformity of wage rates is summarizedby the measures'° given in Table 32. These indexes show high averageconformity during expansions and negative conformity during contractions.Over the cycle as a whole, a low positive conformity appears in all excepthourly union rates for printers."
The 1903-4 contraction, although included in the chronology of the National Bureau,is somewhat dubious (see Arthur F. Burns and Wesley C. Mitchell, Measuring BusinessCycles, National Bureau of Economic Research, 1946, p. 133). The contraction is notrecognized by Spiethoff (see Appendix Table B-I).
The response of wage rates to business cycles is here examined Jargely in terms ofbehavior during reference contractions, since in periods of long-term growth, trend andcycle elements can hardly be distinguished in expansion phases. In such growth periods,wage decreases during business contractions, on the other hand, constitute primafacie evidence of cyclical response.
Cycle relatives describe the standing of a series expressed in percent of the averageof that series during each cycle. Average annual changes during contractions andexpansions are computed as differences between cycle relatives at turning points,divided by number of years between turning points.
10 Conformity indexes range between + 100 (perfect positive conformity) and —100(perfect inverse conformity). For a short description of the meaning of these indexessee note to Appendix Table A-20. A detailed explanation will be found in Burns andMitchell, op. cit., pp. 176 if. The indexes used here do not take account of systematicdifferences between the timing of the series and business cycles; that is, they are allcomputed from changes between peak and trough years of business cycles. Because ofthe tendency of wage rates to lag, this may result in an understatement of the degree ofrelationship between wage rates and business cycles.
11 Nationwide rate agreements for printers were valid over long periods, sometimesas long as eight years. Although the substance of the agreements may have been affectedby the state of business at the time they were concluded, the printing rates before WorldWar I were not sufficiently flexible to reflect short-term fluctuations in general businessactivity with any regularity.
128 WAGES IN GERMANY
TABLE 32Indexes of Conformity, Wage Rates, Annual Series, 1871-1932
Series
CYCLES COVERED INDEXES OF CONFORMITY
Number Years Expansions ContractionsFull
Cycles
Union RatesHourly rates
Comprehensiveseries
PrintingBuilding
2 1923—321871—1913, 1923—321871—1913, 1923—32
+100+78+78
0—50—50
+33—13+33
Weekly ratesPrintingBuilding 8
1871—1913, 1923—32
1871—1913, 1923—32
+78+78
—38—86
+27+14
Effective Hourly RatesPrintingBuilding
MachineryWoodworking
224
2
1890—19031886—19031886—1903
1890—1903
+100+100+100+100
—100—100+100—100
+33+100+100+67
SOURCE: Appendix Table A-20.
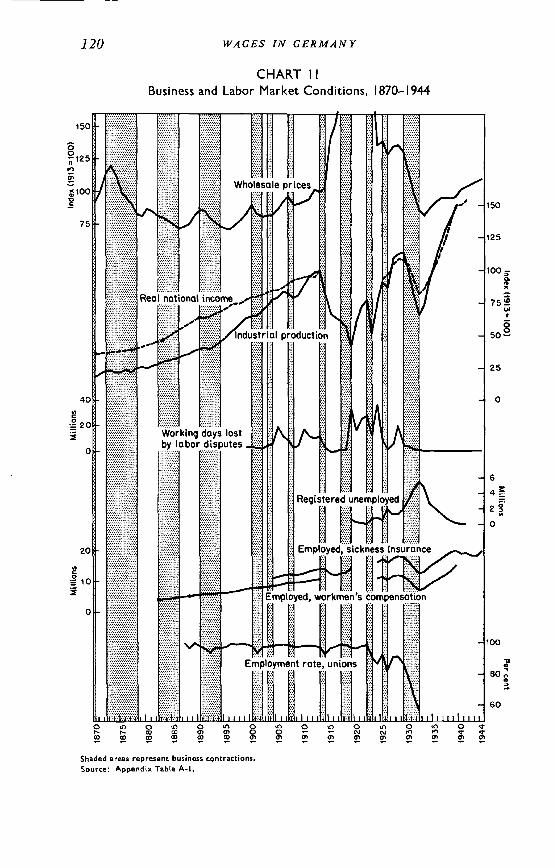
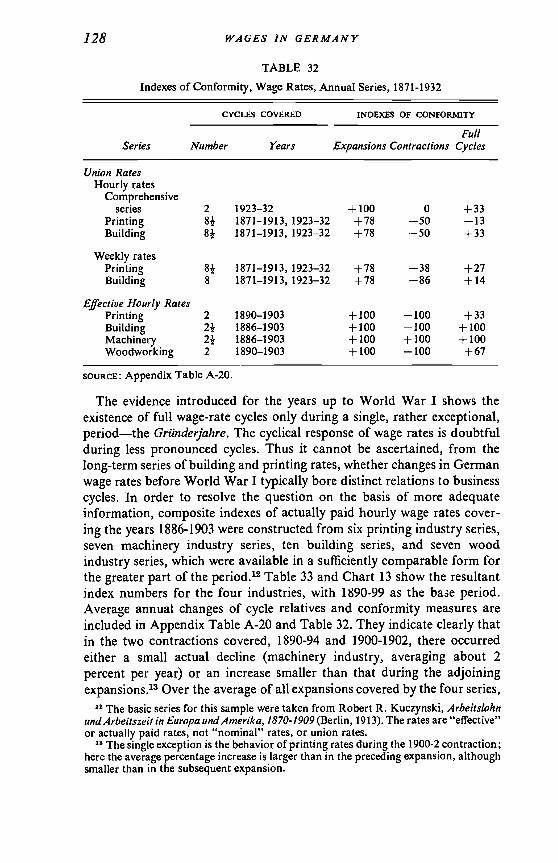
The evidence introduced for the years up to World War I shows theexistence of full wage-rate cycles only during a single, rather exceptional,period—the Gründerjahre. The cyclical response of wage rates is doubtfulduring less pronounced cycles. Thus it cannot be ascertained, from thelong-term series of building and printing rates, whether changes in Germanwage rates before World War I typically bore distinct relations to businesscycles. In order to resolve the question on the basis of more adequateinformation, composite indexes of actually paid hourly wage rates cover-ing the years 1886-1903 were constructed from six printing industry series,seven machinery industry series, ten building series, and seven woodindustry series, which were available in a sufficiently comparable form forthe greater part of the period.12 Table 33 and Chart 13 show the resultantindex numbers for the four industries, with 1890-99 as the base period.Average annual changes of cycle relatives and conformity measures areincluded in Appendix Table A-20 and Table 32. They indicate clearly thatin the two contractions covered, 1890-94 and 1900-1902, there occurredeither a small actual decline (machinery industry, averaging about 2percent per year) or an increase smaller than that during the adjoiningexpansions.'3 Over the average of all expansions covered by the four series,
12 The basic series for this sample were taken from Robert R. Kuczynski, ArbeitslohnundArbeitszeit in Europa undAmerika, 1870-1909 (Berlin, 1913). The rates are "effective"or actually paid rates, not "nominal" rates, or union rates.
13 The single exception is the behavior of printing rates during the 1900-2 contraction;here the average percentage increase is larger than in the preceding expansion, althoughsmaller than in the subsequent expansion.
CYCLICAL BEHAVIOR OF WAGES 129
TABLE 33Effective Hourly Wage Rates, Four Industries, 1886-1903
(1890-99 = 100)
Year Building Machinery Printing Woodworking
Averageof Four
Industries
188618871888
1889
84.884.585.5
91.3
78.079.982.3
88.7
...
...84.886.0
.........
91.4
82.la
89.4
18901891189218931894
95.796.697.097.396.2
100.399.496.995.494.1
90.591.595.797.597.2
94.391.993.694.397.9
95.294.895.896.196.4
18951896189718981899
97.6101.3103.1106.7108.9
98.7103.9100.1104.0106.9
100.8102.8107.5107.0109.5
97.0104.3105.9109.1111.6
98.5103.1104.2106.7
109.2
1900
1901
1902
1903
112.8
115.1
114.8
118.9
112.1
110.0
108.6
113.3
111.0
112.2
117.2
122.7
120.7
123.7
123.9
125.6
114.2
115.2
116.1
120.1
o For 1886-88, computed by linking percentage changes in available industries.Based on data from Robert R. Kuczynski, Arbeitslohn und Arbeitszeit in Europa und
Amerika, 1870-1 909 (Berlin, 1913).
the annual increase of cycle relatives was 3.5 percentage points; thecorresponding increase for contractions was 0.5 points. The conformityshown by these effective rates is somewhat more pronounced than thatof the union rates for printers and building workers. We find, moreover,high positive conformity of actually paid rates in the machinery andwoodworking industries, for which no comparable union rates are avail-able.
To sum up what can be said about conformity of wage rates prior toWorld War I: Only during the Gründerjahre does cyclical conformityappear in the form of clear changes of direction, corresponding to theups and downs of business. In some pre-1913 contractions, wage ratesresponded to changes in general business by retardations in the rate ofincrease. Even such retardations cannot be regularly observed duringsome shorter contractions. Actually paid or effective rates tended to showclearer conformity than nominal rates.
For cycles following World War I, the degree of conformity of wagerates can be established on the basis of monthly evidence (see Table 34

130 WAGES IN GERMANY
and Chart 14). The response of union wage rates to the 1926-32 cycleis, of course, the most striking feature of the chart. However, the monthlydata reveal also a general leveling-out of wage rates toward the end of1925, and even small actual declines in rates during the summer of 1926.There are good reasons for relating this leveling-out or decline to thegeneral business contraction of March 1925 to March 1926. First, actual
CHART 13Effective Hourly Wage Rates, Four Industries, I 886—1903
Index (1890-99—100)
'88 '90
Shaded areas represent business contractions.Source: Table 33.
declines, in excess of those shown in the average, occur in several in-dustries (building, woodworking, and others; see Chart 15 and AppendixTable A-21). Second, during this period wage contracts in some industriesexpired without being renewed, and it is known that collectors of wagestatistics tended to assume that wage rates continued to be paid at thelevel of the expired contracts, although lower rates may actually have beenpaid. Finally, the fact that the leveling-out of wage rates started onlyeight months after the peak in business conditions is compatible with thecharacteristic lag in these rates, which will be discussed later in detail.
Appendix Table A-22 shows the behavior of ten wage series on a
Index

CYCLICAL BEHAVIOR OF WAGES 131
reference cycle basis. The specific rate declines in response to the March1925—March 1926 recession occurred only after that reference cyclephase. As a consequence, wage rates during the reference contractionincreased more than during the subsequent expansion. This situation,in spite of perfect conformity in all other reference cycle phases, limitedthe over-all conformity for the interwar period to +33. The conformitywould be perfect if allowance were made for differences in timing.14
TABLE 34Hourly Union Rates, by Months, 1924-1933
(1928 = 100)
Month 1924 1925 1926 1927 1928 1929 1930 1931 1932 1933
Jan. 56.7 72.5 86.7 87.4 95.7 103.1 107.1 106.7 88.8 84.2Feb. 56.0 73.3 86.8 87.5 95.8 103.2 107.1 105.3 88.8 84.1Mar. 55.4 75.2 86.8 88.2 '96.3 103.4 107.1 104.2 88.6 83.6Apr. 59.2 77.0 86.7 89.9 98.5 104.0 107.3 102.1 88.6 83.6May 63.4 78.8 86.7 92.9 100.5 105.7 107.4 101.3 86.5 83.6June 66.2 80.7 86.4 93.5 100.6 106.1 107.4 101.1 85.3 83.5
July 66.4 81.8 86.5 93.5 100.9 106.3 107.4 101.0 85.2 83.5Aug. 66.7 83.5 86.5 93.6 101.6 106.6 107.4 100.9 85.1 83.5Sept. 66.8 84.4 87.3 93.7 101.6 106.6 107.4 100.8 84.6 83.5Oct. 67.9 85.1 87.2 94.6 102.6 106.7 107.4 100.1 84.3 83.5Nov. 69.7 86.3 87.3 95.1 102.7 106.8 107.4 99.5 84.3 83.5Dec. 71.6 86.4 87.4 95.2 103.0 107.1 107.3 98.8 84.2 83.5
This index combines the revised union rate statistics (available from 1928 on) with earlier, unrevised,figures. The linking of the segment 1925-27 to the later segment was carried through by the Statis-tische Reichsamt (see .Reichsarbeitsblatt 1931, Part ii, p. 109). In the present study the index waspushed back one more year (1924), on the basis of the average of skilled and unskilled male workers,with the weights 1.0 and 2.2, respectively. These weights, based on employment (Vierte!jahrshef:ezur Statistik des Deutschen Reichs, 1931, p. 97), are those used by the Statistische Reichsamt in therevised index. For a description of the nature of these rates see notes to Appendix Table A-2, Part m.SOURCE: Reichsarbeitsblatt, 1931, Part ii, p. 109; 1933, Part u, p. 44; 1934, Part ii, p. 91. Monthlydata for 1924 estimated, in the present study, on the basis of wage rates for male workers (skilledand unskilled) as published in Jahrbuch 1926, p. 291.
EARNINGS AND BUSINESS CYCLES. A closer relation is observable forearnings and business cycles than for rates. The comprehensive hourlyand weekly earnings series depicted in Chart 2 show that during the years1924-44 all major business cycles are clearly reflected. The short 1925-26contraction leads only to a deceleration in the rate of growth, but in theother phases earnings actually rise and fall with general expansions and
The above observations refer to the aggregate rate measure. Appendix Table A-22gives also industrial detail. The individual series show strikingly similar behavior.Conformity indexes during the interwar period are the same for each of the includedseries: + 100 for 0 for contractions, and 4-33 for full cycles. If differencesin timing were taken into account, each of the ten presented series would show perfectconformity.

132 WAGES IN GERMANY
contractions in business.'5 Thus, conformity for the postwar period isperfect (+100).
Tolerably good positive correspondence between earnings cycles andbusiness cycles can be found also during the period before World War I(See Chart 12, Appendix Table A-23, and Table 35). Average daily earn-ings of workers in Krupp's iron works,'° for instance, show distinct
CHART 14
Average Hourly Money and Real Wage Rates, 17 Industries, 1924—1933
::::..t: 1'
1924 1925 1926 1927 1928 1929 1930 1931 1932 1933
Shaded areas represent business contractions.Source: Tables 34 and 44.
cyclical movements, which in most instances can be quite clearly relatedto corresponding phases in business activity. In all contractions exceptthe somewhat dubious one of 1903-4, earnings of Krupp workers declinedor rose less than in the adjacent expansions. Conformity for the prewarperiod is measured as +67. In the case of daily earnings in railway repairyards, a fair degree of conformity can also be demonstrated.
The position of 1926 had to be read from a graph, and 1927 was then interpolatedon the basis of the movement of hourly rates.
iG The Krupp data are annuai, based on payroll divided by number of workers.The firm grew rapidly, and the average earnings data reflect major changes in com-position.
Index

50 -
40 -
30 -
20 -
10 -
0
CYCLICAL BEHA VIOR OF WAGES
CHART IS
Union Wage Rates of Skilled Men, IS Industries, 1924—1932
44.7
58.0
51.0
1924 1925 1926
Shaded areas represent business contractions.Source: Appendix Tab'e A-21.
133
Scole inpfennigs60 -
40.0/Pfennigs
63.9
78.0
47.
46.0
87.1
55.0
80.3
71.0
95.5
85.6
51.0
87.9
1927 1928 1929 1930 1931 193270.9

134 WAGES IN GERMANY
TABLE 35
Indexes of Conformity, Earnings, Annual Series, 187 1-1932
CYCLES COVERED INDEXES OF CONFORMITY
FullSeries Number Years Expansions Contractions Cycles
Hourly Earnings
Comprehensive series 2 1923-32 + 100 0 + 100
Daily Earnings
Krupp,Essen 1871-1913 +100 ..—17 +67
Weekly Earnings
Comprehensive series 1871-1913, 1923-32 +89 +12 +73
Miners' Shift EarningsBelow ground:
Hard coal, Upper Silesia 6 1890-1913, 1923-32 +100 —33 +90Hard coal, Lower Silesia 6 1890-1913, 1923-32 + 100 0 +60Hardcoal,Dortmund 1871-1913,1923-32 +100 +50 +73Hard coal, Saar District 4 1890-1913 +100 0 +71Hard coal, Aachen 6 1890-1913,1923-32 +100 +33 +60Lignite, Halle 6 1890-1913, 1923-32 +100 +33 +80Salt, HalIe 6 1890-1913, 1923-32 +100 0 +80Ore, HaIte 6 1890-1913, 1923-32 +100 +33 +60Ore, Upper Harz 1890-1913, 1923-32 +100 —67 —33Ore, Siegen-Nassau 6 1890-1913, 1923-32 +100 +33 +100Ten centers 6 1890-1913, 1923-32 +100 +33 +80
Above ground:Hard coal, Dortmund 1878-1913, 1923-32 +100 —14 +62Ten centers 6 1890-1913, 1923-32 +100 +17 +80
SOURCE: Appendix Table A-23.
Still closer is the correspondence of miners' earnings to changes ingeneral business conditions. In fact, specific cycles in miners' earnings cangenerally be matched with reference cycles. There are, however, threemajor exceptions. One is the mild reference contraction of 1903-4 whichis skipped by underground miners' earnings in every district. The secondis the contraction of 1925-26 in which miners' earnings showed no actualdeclines, but rather experienced in every district a marked decelerationof growth as compared to the preceding expansion year.17 The thirdexception refers to the state-controlled ore mines in the Upper Harz.The generally high degree of association between cycles in miners' earningsand those in general business conditions does not imply that miners'
The cyclical significance of this deceleration is not certain. Earnings increasesbetween 1924 and 1925 still showed some effects of the poststabilization adjustment.Furthermore, the rates of increase during the 1925-26 depression are not set off fromthose in the subsequent expansion years.

CYCLICAL BEHAVIOR OF WAGES 135earnings always declined during reference contractions. Because of lagsin timing, the earnings sometimes underwent cyclical responses only alterthe reference contraction had run its course. Such a situation prevailedin the hard coal mines of Silesia and the Saar during and after the refer-ence contraction of 1907-08. In other cases the actual declines occurredonly in certain years during the reference contractions without resultingin a net decline between turning points or in an average annual declineduring the reference contractions as a whole (i.e., hard coal mining inUpper Silesia and salt mining in Halle during the reference contractionof 1890-94). The conformity indexes for these earnings series typicallyrange between +60 and + 100, with only government-owned ore mines inthe Upper Harz showing negative conformity.'8
All in all, earnings conform more closely than wage rates to businesscycles, both by showing less tendency to skip cycles and by clearer andmore frequent actual declines during business contractions. The basicreason is that the factors which differentiate earnings from rates, parti-cularly those having to do directly or indirectly with hours worked,are positively related to business activity. If business conditions improve,employment rises, the workweek lengthens, and overtime, night, andholiday premium pay is more frequent. Conversely, in times of decliningbusiness activity, these elements tend to shrink. It is true that some factorsin the earnings picture may be countercyclical in character. The attemptto preserve a skeleton staff of experienced workers in times of unemploy-ment might, for instance, affect the skill composition of the remainingwork force in the direction of a greater percentage of higher skills. Butthese cyclically dampening influences are doubtless the less effective ones.In the German experience they are not only obscured by the effects ofhours and premium payments, but also, during prosperous times, by theexcess of rates actually paid over the established minimum rates.
The Lag of Wages behind Cyclical TurnsWAGE RATES. To establish the relation of cyclical turns in wage rates to
those in general business, monthly and quarterly data would of course bedesirable. Unfortunately, for the period prior to 1913 the best availabledata are annual. Even they, rough as they are, suggest one of the mostoutstanding features of the behavior of wage rates: their distinct lag
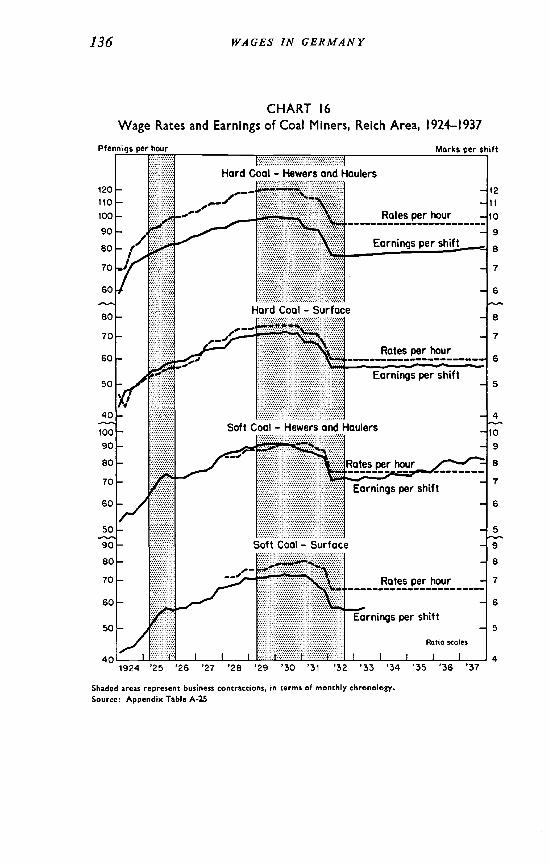
18 The above measures are based on annual series. From 1889 and throughout thelater years, miners' earnings for ten districts are available, or can be derived, in quarterlyform. Effects of the 1903-4 reference contraction, which were not reflected in the annualaverages, can be detected in the more detailed quarterly earnings record which wascompiled for five districts (see Appendix Table A-24). Similarly a flattening out inresponse to the 1925-26 contraction can be observed in quarterly earnings of coal minersfor the Reich as a whole (see Appendix Table A-25 and Chart 16), while no suchresponse is apparent in the annual records. Conformity indexes were constructed forsix quarterly series during the years 1890-1913 and 1924-32 (see Appendix Table A-26).These measures indicate a degree of conformity similar to that observed on the basis ofthe annual information.
136 WAGES IN GERMANY
CHART 16
Wage Rates and Earnings of Coal Miners, Reich Area, 1924-1937
hour
120
110
100
90
80
—
70
60
80
70
60
Earnings per
Rates per hour
50
40
U
100
90
80
Hard Coal — Hewers and Haulers
Hard Coal — Surface
Earnings per shift
Soft Coal — Hewers and Haulers
per sPiLft —
Soft Coat — Surface
Earnings per shift
Ratio scales
:.;::.:::::.:j::.::.:.:::::.:::.:.:I::::::.:::::::::::.:f:::::::::::::: i ——
________________________
70
Marks per shift
12
I'10
9
8
7
6
8
7
6
5
4
10
9
B
7
6
59
$
7
6
5
4
60
50
90
80
70
60
50
401924 '25 '26 '27 '28 '29 '30 '31 '32 '33 '34 '35 '36 '37
Shaded areas represent business contractions, in terms of monthly chronologySource: Appendix Table A-25

CYCLICAL BEHAVIOR OF WAGES 137
behind turning points in general business conditions. As indicated inCharts 3 and 12, during the Gründerjahre printing rates began to declineonly after 1875, and the peak of building wages was reached in 1876.19Measured against the turning point established by the National Bureau,1872, the lag amounts to at least three years. Although this dating of theturn in business conditions seems early to the present writer,20 even ashift of the reference turn to 1873 would still leave the wage rates laggingmaterially. Examination of the wage rates for building during the firstdecade of the Reich's history also creates the impression of lags. Whileit is difficult to match cycle phases of wage rates and general businessactivity during the 1880's, in subsequent decades further evidence of lagsin rates is found. The upper turn of rates in building, for instance, occurstwo years after the reference peak of 1890, and the slight subsequenttrough one year after the reference turn of 1894.21 Even the mild trendmodification around 1900-1902 shows a one-year lag at the 1900 peak andcoincidence at the trough.22 Proper matching of cycle phases becomespossible again only for the interwar period, particularly in relation to the1929 and 1932 reference turns. On an annual basis, hourly wage rates inprinting and building, as well as every other series included in the com-prehensive wage-rates index, reach their peaks one year after the 1929turn in general business conditions. And, after the Great Depression hadrun its course, wage rates for all industry continued to decline materiallyfor a year after the lower turn in general business conditions was passed.
The general impression of a substantial lag of wage rates behind refer-ence turns can be verified and the extent of the lag more adequatelydetermined on the basis of the monthly union rates published for theperiod 1924-44. Before proceeding to such measurement, however, wemust note a peculiarity in the behavior of union wage rates. Inspection ofChart 15 shows that the cyclical responses of wage rates deviate from theknown behavior of the majority of economic activities. The deviationconsists in the step-function character of the rate series, with their longmaintenance of horizontal movements—whether in the form of high
19 Contemporary observers mention the latter year as marking the decline of "wages."Victor Böhmert describes wage developments during the Grllnderjahre in relation togeneral business activity. He recounts how, after the Frankfurt peace, a rush intocapital investments started. The extraordinary demand for labor boosted wages in somecnterprises by 50 to 100 percent. Only from 1876 on—according to Böhmert—couldone note decreases in wages, leading to a wage trough in 1879. From that point a slowimprovement set in. See "Statistik des Arbeitslohns," Handwörterbuch der Staais-wissenschaften, 1890 ed. Vol. 1, p. 707.
20 Also Spiethoff, Thorp, and Jerome regard 1873 as the peak year. See AppendixTable B-i for Spiethoff's chronology. See also Thorp, op. cit., p. 207, and HarryJerome, Migration and Business Cycles, pp. 174—75 (National Bureau of EconomicResearch, 1926).
21 No adequate data are available for the prewar period to compare the timing ofbuilding wage rates with that of building activity.
22 The composite indexes of actually paid wage rates for four industries presented inTable 33 and Chart 13 are inconclusive with regard to timing. The machinery series,however, is coincident at all four turns.

138 WAGES IN GERMANY
plateaus close to business cycle peaks, of flat bottoms close to businesscycle troughs, or of intermediate planes representing interruption ofgrowth in response to declines in business activity. Such behavior leadsto difficulties in the identification of cyclical responses, and requiresspecial descriptive measures which will permit us to relate both edgesof the plateaus to turning points in general business or in employment.23For this purpose a distinction is made henceforth between the initial(P1) and terminal (P2) edges of the high ridges, the corresponding points(T1 and T2) of the flat valleys, and the edges (P1 and T2) of intermediateplateaus in a rising trend. The above terms and symbols will be helpfulin subsequent description of the cyclical behavior of
rates of all industry are found in Table 34 andChart 14. The reaction of average wage rate levels to the 1925-26 con-traction occurred in the form of a leveling-out, starting close to the end of1925 and ending at the beginning of 1927. If the edges of the plateau aretaken to represent the beginning (P1) and end (T2) of the reaction to thereference contraction, the delay in such reaction should be stated as eightmonths behind the peak of general business activity, and eleven monthsbehind the trough. After the latter upturn, wage rates proceeded to riseduring the prosperous years of the late 1920's. Business conditions beganto worsen in April 1929. Wage rates, however, continued to advancemoderately for one more year, reaching a plateau in May 193025 (P1),and maintaining peak levels to the end of that year. They did not startto decline until December 1930 (P2), that is, twenty months after thedownturn in general business conditions.26 A rather pronounced lag inthe reaction of wage rates to changes in general business conditions canbe observed after the business cycle trough of August 1932. Average unionrates continued to decline after that date for about seven more months.No single lower turning point can be established because wage rates
23 The National Bureau's standard rules on timing are not especially suited to describethe cyclical behavior of step functions in general or that of German wage rates inparticular. The Bureau's rules designate the highest monthly values or the center of thehighest three-month average as the turning point. In the case of a high ridge or flattrough, the last observation on the plateau level is regarded as the turning point. Thisprocedure fails to delineate the initial edges of the plateau, which indicate the cyclicallyimportant cessation of growth or decline. Moreover, if the essential character of aseries is that of a step function, the cyclical description should be based on the locationof steps and plateaus rather than on small temporary elevations or turning pointscreated by minor changes in the level of the plateau.
24 For minor cycles in business activity, Creamer also determined turning points ofwage rates at the beginning or at the end of plateaus (Creamer, op. cit. pp. 6 if.). How-ever, Creamer chose a technique differing from that employed in this study.
25 Although the average of all wage rates showed only a mild rise after December1929, rates in four of the seventeen industries included in the average increased sub-stantially after that date, and no series declined. In May 1930, however, rates for skilledworkers had reached their high in all industries except soft coal (see Chart 15). Inview of these considerations, May 1930 rather than December 1929 is here regardedas the initial edge of the wage plateau.
26 The peak of wage rates occurred also with a pronounced lag behind the peaks ofemployment, of man-hours, and of industrial production.

CYCLICAL BEHAViOR OF WAGES 139after the spring of 1933 (T1) were kept virtually stable until about thebeginning of World War 11(T2).
The response of wage rates came with appreciable delay after eachreference turn. The extent of the lags depends on the type of measure used.If the first signs of cyclical response, even in the form of reaching orleaving plateaus, are used as benchmarks, the observed lags were betweenseven and thirteen months. If only actual reversals in direction and endsof plateaus are regarded as specific turning points, the evidence wouldshow only one clear lag, of nineteen or twenty months after the April1929 peak, and a long lag of unspecified duration after the August 1932trough. However defined, the wage-rate lags during the Weimar Republicranged between seven and twenty months; these are not incompatiblewith the lag of about one year suggested by the annual information forthe years prior to 1913, as discussed above.
The lag of the monthly wage-rate index for all industry can be observedin every single component industry, see Appendix Table A-21 and Chart15. Furthermore, the concentration of turning points in industry rates isfairly strong. After the 1929 peak, for instance, ten out of eighteen in-dustries maintained their peak levels through the first three months of1931. Wage rates of metal workers and clothing workers had their turningpoints (P2) as early as November 1930, and soft coal miners as late asMay 1931. Thus, after the 1929 reference peak, the quoted lag in thedecline of average rates (P2) was a minimum lag, reflecting the early wage-rate decline in two industries, metals and clothing. In other industriesthe lag was longer—sometimes as much as two years.
EARNINGS. Average earnings exhibit less tendency to lag than wage rates,as has already been suggested by information for the Grunderjahre cycle. Thepeak in wage rates occurred about 1875—three years after the referenceturning point of 1872 as determined by the National Bureau. The availableearnings information is sporadic and not directly comparable to the ratedata. However, of the ten earnings series assembled in Table 36, only threeshow peaks in 1875, three in 1874, and the rest in 1873 or even earlier.
For miners' shift earnings, it is possible to measure the timing of turningpoints against those in general business conditions on a quarterly basisover the periods 1890-1914 and 1924-33. Five series are included (seeTable 37 and Appendix Table A-24). We find clear lags at eachaveraging nine months for the five series and over the five reported upperturning points. At reference troughs the evidence is less uniform. Lagsprevail, but seven leads and five coincidences occur in the twenty-eightmeasured instances. Over the average of five troughs, shift earnings showsmaller lags (0.7 to 3.7 months) than at peaks, or even a lead (1.3 monthsin the case of Dortmund). No significant differences were found in thetiming of underground miners' and surface workers' shift earnings (seecolumns 1 and 2 of Appendix Table A-24).

TAB
LE 3
6A
vera
ge E
arni
ngs p
er D
ay o
r Shi
ft, 1
87 1
-188
2(m
arks
)
AV
ERA
GE
DA
ILY
EA
RN
ING
SA
VER
AG
E SH
IFT
EAR
NIN
GS
OF
MIN
E W
OR
KER
S
Rai
lroad
Rep
air Y
ards
Met
al W
orks
Mac
hine
ryH
ard-
Coa
l Min
ers
Iron
Ore
Min
ers
Hew
ers a
ndH
aule
rs:
All
Wor
kers
Vul
kan,
Rig
ht o
fLe
ft of
Yea
rB
resl
auSt
arga
rdB
SF S
yste
ma
Kru
pp, E
ssen
Stet
tinD
orim
und
Dor
tmun
dA
ache
nR
hine
Rhi
ne(1
)(2
)(3
)(4
)(5
)(6
)(7
)(7
)(9
)(1
0)
1871
2.60
2.11
2.21
3.03
2.36
3.00
2.70
3.24
3.65
1872
2.80
2.10
2.34
3.39
2.67
4.50
3.18
3.18
3.72
3.18
1873
3.07
2.11
2.77
3.74
3.00
5.00
3.25
3.52
3.77
3.10
1874
3.52
2.36
2.85
3.86
3.12
4.00
3.32
3.48
3.43
3.00
1875
2.88
2.59
3.03
3.89
2.94
3.80
3.05
3.16
3.07
2.96
1876
2.73
2.54
2.75
3.64
2.56
3.00
2.83
2.86
2.54
2.90
1877
2.65
2.50
2.62
3.36
2.69
2.56
2.83
2.50
.2.1
02.
4418
782.
652.
482.
683.
212.
612.
662.
932.
352.
152.
2518
792.
632.
272.
753.
022.
532.
552.
962.
302.
311.
90
1880
2.61
2.16
2.79
3.19
2.53
2.70
3.03
2.55
2.29
2.25
1881
2.80
3.50
2.53
2.79
3.07
2.52
2.28
2.26
1882
2.87
3.57
2.57
b3.
013.
162.
482.
302.
29a
Bre
slau
-Sch
wei
dnitz
-Fre
ibur
gSy
stem
.(4
,5,7
to 1
0) Ju
rgen
Kuc
zyns
ki, G
erm
any
1800
to th
e Pr
esen
t Day
,b
Est
imat
edon
bas
is o
f ann
ual e
arni
ngs.
pp. 1
83, 1
97.
SOU
RC
E, b
y co
lum
n:(6
) Rob
ert R
. Kuc
zyns
ki, E
ntw
ick!
ung
der g
ewer
blic
hen
Löhn
e(1
to 3
) Vic
tor B
öhin
ert,
"Arb
eits
lohn
," H
andw
örte
rbuc
h de
rse
it de
r Beg
rund
ung
des D
euzs
chen
Rei
ches
, p. 9
.St
aars
wis
sens
chaf
:en
(189
0 ed
.), p
. 715
.

(lead
s, —
, and
lags
,
a D
ata
star
t in
first
qua
rter o
f 192
4.b
Bas
ed o
n in
com
plet
e ev
iden
ce.
souR
cE: F
or b
asic
dat
a, se
e A
ppen
dix
Tabl
e A
-24.
For
refe
renc
etu
rnin
g po
ints
, Bur
ns a
nd M
itche
ll, M
easu
ring
Bus
ines
s Cyc
les,
p. 7
9.In
acc
orda
nce
with
stan
dard
pro
cedu
re o
f the
Nat
iona
lB
urea
u, th
e m
id-p
oint
s of t
he q
uarte
rly sp
ecifi
c tu
rns w
ere
mea
sure
d ag
ains
t the
mon
thly
refe
renc
e ch
rono
logy
.
Lead
s and
Lag
s of M
iner
s'TA
BLE
37
Shift
Ear
ning
s, Se
lect
ed C
ente
rs, Q
uarte
rly, 1
890-
1914
and
192
4-19
33+,
in m
onth
s)
AT
PEA
KS
AT
TRO
UG
HS
Ref
eren
ceTu
rnin
g
Har
d C
oal
Lign
iteO
reR
efer
ence
Turn
ing
Har
d C
oal
Liçn
iteO
re —U
pper
Saar
-U
pper
Saar
-Po
ints
Dor
imun
dSi
lesi
abr
ücke
nH
alle
Hal
lePo
ints
Dor
imun
dSi
lesi
abr
ücke
nH
alle
Hal
le
Jan.
1890
+22
+19
+16
+19
+25
Feb. 1895
—18
—15
—3
—6
+3
Mar. 1900
+8
+8
+8
+8
+8
Mar. 1902
+2
+8
+2
+5+11
Aug. 1903
......
......
...Feb. 1905
......
......
...July
1907
Apr. 1913
+4+4
+4+4
+7
+10
+4
+4
—5
+7Dec. 1908
Aug. 1914
+50
+17
+3
+8 0
+11 0
—7 0
Prew
arPr
ewar
aver
age
+9.5
+8.8
+10.
2+8
.8+8
.8av
erag
e—
2.8
+3.2
+1.8
+2.5
+1.8
Mar. 1925
......
......
...N
ov. 1
9238
Mar
.1926
+3 ...+3 ...
... ...+3 ...
+3 ...
Apr. 1929
+7
+7
...+10
+10
Aug. 1932
0+6b
...—
3—
6
Ave
rage
,A
vera
ge,
all p
eaks
+9.0
+8.4
...+9
.0+9
.0al
l tro
ughs
—1.
3+3
.7...
+1.7
+.7

142 WAGES IN GERMANY
The earlier turn of earnings, as compared to rates, can be demonstratedon the basis of more comparable and more comprehensive data for theinterwar period. The annual evidence presented in Appendix Table A-2and Chart 2 shows that turning points of average weekly earnings co-incide with those of general business activity both in 1929 and 1932.Hourly earnings also turned with general business in 1929, but they wereone year behind the reference recovery in 1932. Thus, compared withwage rates, which lagged one year at the peak and at least one year atthe trough, earnings clearly tended to respond more promptly to changesin business activity. Furthermore, in the one case of delay, hourly earningsin 1933 showed a well-defined trough, while wage rates did not. There isno way of ascertaining when and bow rapidly the latter might haverecovered in the absence of stabilization by government order.27 Theconclusion from all the evidence on turning points of wage rates andearnings is that both tended to lag behind turns in general businessconditions. The lag in almost all instances was longer in rates than inearnings, often a year or more in rates, but only months in earnings.The data suggest that weekly earnings lagged less than hourly. In someinstances wage rates not only maintained their levels but actually continuedtheir cyclical movements for many months after earnings had experiencedtheir cyclical turns. The evidence is too scanty to permit any broadgeneralization about the differences in the timing of turning points inhourly earnings and hourly rates.
Why do Wages Lag? We have found that wages are tardy in theirreactions to cyclical changes in general business conditions. Sometimesthey skip cycles altogether. This behavior requires some interpretation.
One obvious reason for the delay in rate adjustments to cyclical turnsis the difficulty of identifying such turns at the time of their occurrence.Even if statistical information were immediately available—and of courseit is not—it is always difficult to decide whether a current reversal inbusiness conditions is cyclical in character or merely one of the minorripples which develop at all times. And even if turning points could be
27 On a quarterly basis, shift earnings of soft-coal miners, both above and belowground, for the Reich as a whole, show pronounced lags at the peaks in 1925 and 1929.Hard-coal miners' earnings did not respond to the 1925-26 contraction. At the 1929peak they reached a high plateau (P1) about four months after the reference peak andmaintained it for more than a year. At the end of the Great Depression, however, rockbottom levels were closely approximated by all miners' earnings during the first quarterof 1932, that is, about a half-year before general business activity reached its low.After the first quarter, earnings moved differently in the reported categories, but it isclear that at the bottom of the Great Depression, miners' earnings did not show themarked lag which could be observed at earlier turning points (see Appendix Table A-25and Chart 16).
The availability of quarterly data on both wage rates and earnings of coal minersduring the interwar period offers an opportunity for study of the differences in theirbehavior. During the 1929-32 contraction, the rates and earnings records in hard-coalmining show little difference. In soft-coal mining, wage rates rose for more than a yearafter earnings had reached their top levels.

CYCLICAL BEHAVIOR OF WAGES 143properly identified at once, there would still remain important forcesmaking for a delay of rate adjustments. Typically, rate increases occur onthe insistence of labor, and rate cuts on the insistence of management.What has to be explained, therefore, is the delay in these two parties'initiative and effectiveness.28 The need to maintain friendly labor relationsmay deter management from insisting on wage adjustments during thefirst stages of contractions—as long as conditions are not demonstrablybad. After cyclical peaks come decreases in orders, mounting inventories,slowing receipts, and tighter credits, all bringing enterprises into actualor prospective financial straits. Adjustments of costs become imperative—among them adjustments of labor costs. The latter can be partiallyreduced by layoffs and by avoidance of premium payments, a policy thatcontributes to the relatively early cyclical response of earnings as comparedto rates. In the long run, cuts in basic rates become increasingly importantfor the individual firms in their struggle to maintain profits. But such cutsbecome possible only when rising unemployment and retail price declinesmake employees willing and able to accept them. Conversely, labor'sdemands become pressing only when new prosperity is clearly secure.After cycle troughs, rising retail prices reduce the purchasing power of thewage rate. For a while, compensation for this loss will occur in terms oflonger hours, premium payments, and possibly increased family incomethrough reemployment of family members formerly laid off. Continuedprice rises will create strong desires for rate increases. These desires,however, will be translated into successful demands only when increasingorders and rising sales make employers able to yield, and when tighteninglabor market conditions make them willing. The time required for suchdevelopments explains much of the delay in the reaction of wage ratesto turns in business and employment.
Thus cyclical shifts in relative bargaining power of employers and wageearners lead—at two periods in the cycle—to a situation in which upwardand downward adjustments can be fought for successfully. These periodsoccur only after changes in employment, sales volume, and profits haveaffected relative bargaining strength. They do not occur close to referencecycle turns but lie well within the expansion or contraction phases. Thetiming of labor conflicts bears out these observations: the number ofworking days lost through strikes and lockouts reaches peak heightswell within periods of business upswing (Chart 11 and Appendix TableA-l). This is true for the strike peaks of 1905, 1910, 1924, and 1928.In fact the only reference expansions in this series which do not showdistinct strike peaks are the short expansion of 1902-3, the Burgfriedenperiod during World War I, and the postwar inflation period. Strikesseem to have been far less important during contractions. Chart 11indicates that over the years 1899-1932 contraction periods show relatively
28 For a discussion of such delays see Wesley C. Mitchell, Business Cycles (Universityof California Press, 1913), Part III, pp. 464-66; and Creamer, op. cii., pp.20-22.

144 WAGES iN GERMANY
low levels of working days lost. Even 1931 and 1932, when the majordepression adjustment in wage rates took place, were years when laborstrife was at a comparatively low level. The reasons are not far to seek.In periods of business contraction the reduced demand for goods, theswollen inventories, and the availability of unemployed labor render moststrikes ineffective.
There are other factors that prevent prompt response of wage rates tochanging business conditions. The high degree of organization of bothemployers and workers tends to enhance the defensive strength of theparticular group, which in a given phase of the cycle seeks to maintainthe status quo. But probably a more potent factor in the timing of wagerates is the prevalence of collective agreements. Such agreements oftencover long periods and may serve to stabilize wage levels for a considerabletime after a recognized turn in business conditions. On occasion they mayeven provide for increases that go into effect after the cycle reaches apeak, or for decreases that become effective after the reference trough haspassed. For example, the long delay in rate adjustments after the 1929peak reflects the fact that many wage contracts expired only in the courseof the year 1930.29 Also, published rate adjustments deal with minimumrates. Reduction of voluntary payments in excess of minimum rates couldlead to a decrease of actually paid rates before recorded minimum ratesdeclined. There is a reasonable presumption3° that the peak of piece ratesat the beginning of the Great Depression may have been reached as earlyas May 1930. Even this, however, would be a full year after the referenceturn.
Earnings shared the tendency of wage rates to lag behind turns ingeneral business conditions. Hourly earnings tended to show a longerdelay than weekly earnings, but both lagged less than rates. Any lag inearnings can be traced mainly to the fact that wage rates form an importantconstituent of earnings. That earnings lag less than wage rates, on theother hand, is due to the prompter response of hours and of premiumpayments to changes in business activity.3' Finally, the lesser lag of weeklyas compared with hourly earnings is explained by the fact that changes inhours affect weekly earnings both directly and indirectly (by varying therelative importance of hours at premium rates), whereas they influencehourly earnings only indirectly.
29 This is true for building, metals, textiles, and hard coal. See Horst Wagenfuhr,"Karteipreise und Tariflöhne im Konj unkturverlauf," Jahrbucher fur NationalökonomieundStatistik, 1933, Vol. 1, Pp. 508-9 (Jena, 1933).
The arbitration award of Oynhausen, made in May 1930, permitted decreases ofvoluntary overpayments of piece rates and precipitated a wave of downward adjust-ments. See Reichsarbeirsb!att 1930, Part II, p. 111.
31 On an annual basis, cyclical turns of average hours coincided with the turns ingeneral business conditions in 1929 and 1932. Even on a monthly basis, average hoursseem to turn within one or two months of the reference turning points (see Chart 27,below). There is not enough information to generalize about the timing of hours duringbusiness cycles in Germany.
L
CYCLICAL BEHAVIOR OF WAGES 145
AMPLITUDE AND PATTERNS OF WAGE CYCLESCycle AmplitudesRATE MEASURES. Only for the first decade of the Reich's prewar history
can true cycles in wage rates be identified and some measures of theamplitudes of their fluctuations be computed.32 Appendix Tables A-3and A-4 offer some of the evidence. Hourly building rates increased byabout 45 percent from 1871 to 1876, and declined by about 19 percent33between the latter year and 1882. Printing rates show milder fluctuations—a33 percent increase and a 7 percent decrease during their Grunderjahrecycle. Hourly rates of railway repair yard workers in Upper Silesia de-clined 12 to 22 percent between 1873 and In general, there musthave been great variety in the cyclical behavior of rates during thisperiod. We learn that daily wage rates of building workers in Dresdenwere about 25 percent lower during 1877 and 1878 than during theGründerjahre, and certain examples indicate declines as large as 30 percent.35On the other hand, some wage rates seem to have survived the depres-sion of the late 1870's without declines. The daily rate for common laborat the chinaware factories at Meissen, for instance, is reported to have in-creased from 1.20 marks in 1871 to 2.20 marks in 1876, and to havemaintained this level through 1883. Victor Böhmert, one of the fore-most labor statisticians of that period, contends that the very low wagerates of common laborers did not go down after 1876 because their plane ofliving could not be further reduced.36 This does not appear to be a satis-factory explanation. The wage rates of the chinaware workers were not ofa lower order than, say, those of railroad repair yard workers, whose rateswere in fact reduced. The reasons for the extraordinary resistance of wagerates in the Meissen china works against downward adjustment must besought elsewhere. The Meissner Porzellan Manufaktur was a state-ownedenterprise, and it is probable that the maintenance of wage levels was sup-ported by the state, for political reasons, against the downward drag by
32 In principle, amplitudes during these years can be derived for both specific andreference cycles. In periods during which cyclical responses consist mainly in varyingrates of growth, or in leveling off during contractions, only reference cycle measurescan be used.
In order to derive comparable measures of relative change during expansions andcontractions one must attempt to reduce the bias created by the fact that percentageincreases are computed from a relatively low, and percentage decreases from a relativelyhigh, level. To minimize this bias, wage (and other) changes during reference cycles areexpressed in terms of differences between cycle relatives, the common base being cycleaverages. In the case of specific cycles, percentage changes are computed with the averagesof the values at specific turning points used as bases. To minimize the effect of randomfluctuations on amplitude measures, the peak and trough standings are represented bythree-month averages centered at the turn.
The periodical Der Arbeiterfreund (1878, p. 25) reports a decrease from 18-20pfennigs to 16 pfennigs.
Der Arbeiterfreund, 1879, p. 19, and 1880, p. 23.36 "Statistik des Arbeitslohns," Handwörterbuclz der Staatswissenschaften, 1890
ed., Vol. 1, Pp. 707-8.

146 WAGES IN GERMANY
competitive forces in the labor market. All in all, the early changes in wagerates, covering the Gründerjahre boom and the subsequent contraction,showed increases of about 30 to 70 percent37 and decreases of about 10to 30 percent. These measures approximate specific amplitudes, exceptfor the fact that the year of the Reich's foundation, 1871, is used as asubstitute for an initial trough. It is known that wage rates tended to risefor many years prior to 1871.38 Since these rises have trend character,it would not seem wise to include them in any specific expansion measure—quite apart from the fact that the present inquiry is limited to wage historybeginning with the foundation of the Reich.
Another opportunity of measuring the amplitudes of a major specificcycle in wage rates arises for the interwar period. Annual averages ofhourly wage rates rose from 1924 to 1930 and declined from the latteryear to 1933. The increase amounts to 50 percent, the decrease to about25 percent of the average of peak and trough. The approximate ampli-tudes of wage rate changes during the interwar cycle were thus similar—during both rise and fall—to those experienced during the Gründerjahrecycle (see Appendix Table A-2 for basic data). If based on monthlyaverages, the amplitude measures for the interwar cycle are somewhatmodified. On that basis hourly union rates, from their low in March1924 to their peak plateau in May-December 1930, increased by 64percent. From this plateau down to the trough, reached in April 1933and stabilized by the National Socialists for many years, wage ratesdecreased by 25 percent. Thus, monthly data showed a considerablylarger increase than annual data during the rise of wage rates, but therewas little difference in the extent of the decline. The explanation is simpleenough. During the rapid poststabilization adjustment of 1924, themonthly trough in March is considerably below the average for thewhole year; by contrast, the subsequent peak and trough positions lie onprosperity and depression plateaus respectively, so that there is little orno difference between the monthly and average annual extremes.
The increase in wage rates between 1924 and 1930 should not, of course,be regarded entirely as a response to the reference expansion of 1926-29.As pointed out before and evident in Chart 14, the 1925-26 referencecontraction led to a leveling-out of wage rates between November 1925and February 1927. Consequently, the specific response of wage rates tothe 1926-29 expansion in general business activity might be measuredbetween the terminal edge of this intermediate plateau (T2, in February1927) and the May-December 1930 level. The rise of hourly rates duringthis shorter span of time was only 20 percent, compared with the 64percent increase between the poststabitization low and the high prosperitylevels.
Böhmert, bc. cit., reports for some enterprises increases of 50 to 100 percent, butit is not entirely clear that he refers to wage rates proper.
Jurgen Kuczynski. Germany, 1800 to the Present Day, pp. 102-7 and 178-99.
CYCLICAL BEHA VIOR OF WAGES 147The behavior of wage rates during reference cycles can be followed in
Appendix Table A-20. Because of the systematic lag of wage rates, theirreference cycle amplitudes tend to be considerably smaller than the ampli-tudes of their specific cycles. For instance, only a minor portion of theGriinderjahre rise in wage rates took place during the expansion of 1870-72;the decisive rises occurred between 1872 and 1876, a period of contractionin general business. It has already been pointed out that for almost halfa century no major cyclical declines occurred. However, both flattening-out and minor cyclical declines are clearly apparent, in the long-termbuilding series and in the samples of effectively paid rates, during thereference contractions of 1890-94 and 1900-1902. For the 1926-32 cycle,the measurement of wage rate amplitudes during reference cycle phasesleads to results differing only little from the measures of their amplitudesduring the specific cycle of 1927-33. The reason lies again in the stepfunction character of rate changes. Despite the substantial lags in theturning points, or plateau edges, of rates, only small changes in wagelevels took place during these lags (see Chart 15).
EARNINGS MEASURES, ALL INDUSTRY. Up to the mid-l920's our informa-tion on the amplitudes of earnings is severely restricted by the limita-tions of the available wage data. Table 36 presents some evidence relatingto the Grunderjahre. Again, as in the case of wage rates, specific earningsrises are determined from the year 1871 on. Measured in this fashion,specific cycle increases vary between 3 and 50 percent of the averagebetween peak and trough, decreases between 15 and 57 percent. Theseamplitudes are roughly similar to those found in wage rates. However,the variation of amplitudes within the group of earnings is so wide, andthe rates data and earnings data are so different in coverage, that nodefinite conclusions can be drawn as to the comparative behavior of thetwo during these early years. Somewhat more enlightening is the com-parison of rates and earnings series for the period 1871-1913 in Chart12 and Appendix Tables A-20 and A-23. In comparison to the three long-term wage-rate series, the earnings series show a more frequent occurrenceof genuine cycles. It appears that wage rates fluctuate least, hourlyearnings somewhat more, and daily and shift earnings most.
Comparisons between amplitudes of rates and earnings become feasibleat last for the interwar period. Amplitudes of hourly rates, hourly earnings,and weekly earnings, all in annual form, are given in the following tabu-lation: We note that in all cases, hourly rates showed the smallest ampli-tudes, hourly earnings intermediate, and weekly earnings the largest.The reasons for this order are similar to those determining the timingrelationship between these series. The behavior of earnings is affected notonly by wage rates, but also by other elements, particularly the numberof hours worked.
Inspection of Charts 12 and 2 shows that, also during reference cycles,earnings amplitudes were larger than those of wage rates (see also the

148 WAGES IN GERMANY
From 1925 to specific peakFrom 1924 to specific peakaFrom specific peak to specific trough
a According to our estimates of 1924 levels.
CHANGES IN PERCENT OF THE AVERAGE OFTERMINAL POINTS
+28+51
+31+56
+32+60
—25 —31 —40
amplitude measures in Appendix Tables A-20 and A-23). For the period1886-1902, for which information on effective wage rates is available, thefollowing tabulation shows reference cycle amplitudes of six rate andthree earnings series: In the two prewar cycles the amplitudes of wages
AVERAGE ANNUAL CHANGE OF CYCLE RELATIVES
AVERAGE M4NUAL CHANGE OF CYCLE RELATIVES,ALL INDUSTRY
Average hourly ratesAverage hourly earningsAverage weekly earnings
a Based on incomplete reference expansion.
-1-6 —7 +14 +1+8 —9 +16 —1+9 —13 +19 —4
Expansion is measured from 1924 on.
Average hourly Average hourlyrates earnings
Average weeklyearnings
Expan-sion
Contrac-lion
Expan-sion
1894-
Contrac-non
1900-
Average of 2Cycles
Expan- Contrac-1886-90 1890-94 1900 1902 sions lions
Union RatesHourly printing rates + I + 1 +0 +4 +0.5 +2.5Hourly building rates +4 —0 +2 +1 +3.0 +0.5Weekly printing rates +1 0 +1 +4 +1.0 +2.0Weekly building rates +3 0 +2 0 +2.5 0
Effective RatesHourly building rates +3 +0 +3 +1 +3.0 +0.5Hourly machinery rates +6 —2 +3 —2 +4.5 —2.0
EarningsDaily earnings, Krupp +2 +1 +3 —3 +2.5 1.0Shift earnings,
Dortmund, miners +9 —2 +5 —7 +7.0 —4.5Weekly earnings
(Comprehensive series) +3 0 +2 —1 +2.5 —0.5SOURCE: Appendix Tables A-20 and
were small and so were the differences between them. The evidence suggestsa somewhat stronger cyclical response of effective rates as compared tounion rates, and a somewhat stronger response of earnings as compared torates. For corroborative evidence we must ttirn to the interwar measures.These show clearly larger amplitudes of earnings as compared with rates,and larger amplitudes of weekly as compared with hourly earnings. Thisobservation is valid both for the expansion and the contraction phases.
A-23.
sion lion sion lion Expan- Contrac-1925-26 1926-29 1929-32 sions lions
Average of 2 cycles
+22+25+29
+9+7+4

C YCLICAL BEHA VIOR OF WAGES 149
MINING. The information on shift earnings of miners is markedlysuperior, both in time coverage and quality, to available earnings recordsfor other industries. From 1886, the mining data are reported separatelyfor underground miners and workers above ground for a variety of coal,ore, and salt mines on an annual basis, and from 1889, on a quarterly basis.
CHART 17
Average Shift Earnings of Coal Miners, Dortmund, Annual and QuarterlyData, 1889—1913 and 1924—1932
and 29 percent on the basis of annual, data. The corresponding specific
Here amplitudes—both for reference and for specific cycles—are expressed in termsof differences between cycle relatives. For an explanation of these measures see footnote33 above.
IA nnua I
Quarterly
MarksMarks11
10
9
8
7
6
5
4
Comparable1924-32
•1
- Tn. -
Hewers and haulers
Comparable
Surface
I I I
/1
'I3
111112_i1889 '91 '93 '95 '97 '99 1901 '03 '05 '07 '09 '11 '13 1924 '26 '28 '30 '32
Shaded areas represent business contractions, in terms or annual chronology.Source: Appendix Tables A.6, A-7, and A-24.
Comparison of quarterly and annual data shows only moderate differencesin cyclical amplitudes39 (see Chart 17). For the Dortmund undergroundcoal miners, for instance, the average rise in the specific expansions duringthe cycles 1891-1913 and 1924-32, was 34 percent on the basis of quarterly,

150 WAGES IN GERMANY
declines amounted to 18 percent and 15 percent respectively.40 Chart 4permits a comparison of amplitudes in the earnings of undergroundminers and surface workers. During the period prior to 1913 the earningsof underground workers fluctuated considerably more than those ofsurface workers. In the poststabilization period this difference was lesspronounced. The reason for the differing behavior of the two series is thatearnings of underground miners were based largely on output, whilesurface workers were generally paid on a time basis. For the period 1924-32the importance of this difference is reduced, however, by rapid changes inwage rates which affected underground miners and surface workers toalmost the same extent.
There were marked variations in the cyclical fluctuations of earningsin different districts and different types of mines (see Chart 18 andAppendix Tables A-26 and A-27). The type of product mined seems tohave had important effects on the amplitudes of shift earnings. Thusthe largest amplitudes occur in the copper ore mines of Halle. Apparentlythe marked fluctuations in the effective demand for this basic industrialmaterial led to wide swings in the number of shifts worked, in the averagelength of shifts, and in the incidence and extent of premium payments.4'By contrast, note the smaller earnings fluctuations of those mines in Hallewhich produce potash for fertilizers and salt for human consumption. Thesteady growth and the low income-elasticity of the demand for these pro-ducts seem to have protected not only production and prices, but alsoworkers' earnings, from violent cyclical swings. Even among differentcoal-mining centers, some variation in earnings amplitudes can be tracedto differences in the product. Lignite from Halle, for instance, was usedlargely for home fuel, while the hard coal output of Dortmund went mainlyinto industrial consumption. Corresponding to the larger cyclical ampli-tude in industrial as compared with domestic use, shift earnings in Halle'slignite mines show smaller swings, at least during specific cycles.
For every one of the ten series, increases during expansions were clearlylarger than decreases during contractions. The aggregate measure ofearnings in all ten mining districts shows that the average increase duringreference expansions was + 15 points, the average decline during con-tractions —5; the corresponding figures for specific cycles were +26
40 See Table 38 and Appendix Table A-26. The brief cycle 1890-91, which appearedin the quarterly but not in the annua' data, is excluded from the average to insurecomparison of cyclical movements between corresponding peaks and troughs. Thedifference between the quarterly and annual amplitude measures stems from the factthat the annual data neglect the contribution to the total amplitude of intra-annualfluctuations during peak and trough years. The average difference during expansions isenhanced by the large poststabilization adjustment during the calendar year 1924,which is reflected only in part in the annual record.
41 hon ore miners in the Upper Han experienced remarkably small earnings cyclesdespite the fact that the product is an industrial raw material. The mines were stateowned, and subject to a policy striving for cyclically stable production, employment,and shift earnings.

+ 100
+80
+ 60+50+40+30+ 20+ 10
0
—10
—20
—30
—40 -
Shaded areas represent business contractions.Source: Appendix Table A-6 and its sources.
Ore, Upper Horz
Lignite, Halle
Sa(t, Hatle
and —12 (see Table 38). This situation reflects the strong long-term upwardtrends. Expansions tended to last longer than contractions, and the rate ofchange during expansions tended to be greater than that during con-tractions. The measures of total amplitudes during expansions andcontractions do not permit conclusions as to the comparative rates ofchange per year. These rates, averaged by cycle, are shown in Table38. During reference cycles the average annual rate of increase in ex-pansions is larger than the average annual rate of decrease during con-tractions for each of the ten series. During specific cycles, however, coalminers' earnings in Dortmund and ore miners' earnings in Halle andSiegen-Nassau show larger average annual changes in contractions than
CYCLICAL BEHAViOR OF WAGES 151
CHART 18Shift Earnings of Hewers and Haulers, Selected Centers,
L884—1913 and 1924—1932
Ore, Haflechange
+250 -
+200
Hard coal,Dortmund
0 10 0 10 0 10 0 1001 0) 0 0 — - c'J

152 WAGES IN GERMANY
TABLE 38Amplitudes in Shift Earnings of Hewers and Haulers,
1889-1913 and 1924-1932
AVERAGE AMPLITUDES
Reference Cycles
OF CYCLE RELATIVESa
CyclesExpansions Contractions Expansions Contractions
Hard coal, Upper Silesia +15 —4 +25 —10Hard coal, Lower Silesia +14 —4 +25 —11Hard coal, Dortmundb +16 —6 +29 —15Hard coal, SaarDistrictc +8 —2 +13 —6Hard coal, Aachen +16 —5 +27 —12Soft coal, Halle + 14 —4 +24 —10Salt, HaIle +14 —2 +23 —8Ore, Halle +23 —10 +37 —22Ore, Upper Harz + 13 +2 +48 —9Ore, Siegen-Nassau +22 —12 +34 —20
Ten Centers +15 —5 +26 —12
AVERAGE ANNUAL CHANGE OF CYCLE RELATIVESa
Reference Cycles Specific CyclesExpansions Contractions Expansions Contractions
Hard coal, Upper Silesia +6 —1 +5 —4Hard coal, Lower Silesia +6 0 +5 —5Hard coal, Dortmundb +6 —1 +5 —8Hard coal, Saar Districtc +2 0 +3 —3Hard coal, Aachen +6 —1 +6 —4Soft coal, Halle +6 —1 +4 —4Salt, Halle +6 0 +4 —4Ore, Halle +10 —2 +7 —9Ore, Upper Harz +3 +3 +4 —4Ore, Siegen-Nassau +8 —6 +7 —9
Ten Centers +6 —1 +5 —4a changes of cycle relatives are based on annual series. The averages presented
are derived from measures for individual cycle phases, that is each cycle phase carriesthe same weight irrespective of years covered.
b For Dortmund the given measures were compared with others derived from quarterlydata; the two sets were very similar, as could be surmised from Chart 17.
C Data end 1913.SOURCE: Appendix Tables A-6, A-7, A-23, A-24, A-26, and A-27.
in expansions. For the ten districts as a whole, the average annual changein expansions is +5, that in contractions —4 percentage points.
Information pertaining to coal mines in the years 1924-38 provides uswith an opportunity of comparing the behavior of rates and earnings, on aquarterly basis, for a well-defined segment of industry. Wage rates andearnings are presented separately for soft and hard coal, and for under-ground and surface workers, in Appendix Table A-25 and Chart 16.Graphic comparison shows that the amplitudes of rates and of shift

CYCLICAL BEHAVIOR OF WAGES 153
earnings are surprisingly close, differing in this respect from the broadannual wage indexes, wherein earnings amplitudes exceeded those ofwage rates by a considerable margin.
EXCESS OF EARNINGS OVER RATES. The quantitative differences in cyclicalbehavior as between rates and earnings depend largely on the extent towhich various earnings components are permitted to influence the wagemeasures used. The differences in amplitudes can be traced to the groupof factors which "modify" wage rates into earnings. For the years 1924to 1933 the excess of hourly earnings over rates changed as follows :42
Hourly Hourly Excess of EarningsYear Rates Earnings over Rates
(pfennigs) (percent of rates)
1924 51.5 53.3 +3.51925 65.0 69.3 +6.61926 70.3 73.3 +4.31927 74.4 80.2 +7.81928 80.8 90.1 +11.5
1929 85.3 94.9 +11.31930 86.8 92.2 +6.21931 82.3 85.2 +3.51932 69.7 71.5 +2.61933 67.6 69.3 +2.5
souRcE: Hourly rates for 1929-33: Wirtschaft und Statistik, passim; for 1924-28: ourestimates, based on index of hourly rates (Appendix Table A-2).
Hourly earnings: our estimates, based on absolute level for 1936 (Handbuch 1928-44,p. 469), and index of hourly earnings (Appendix Table A-2).
The cyclical character and the positive conformity of the modifying factorsare brought out by these computations. The excesses reach three turningpoints in advance of, or at the same time as, reference cycle turns; theycontinue to show a small decline even after the 1932 reference trough.
From September 1927 on, special wage investigations in single industriesprovide some additional information. They were made every three yearsbut unfortunately not simultaneously for all industries, so that the resultsdo not refer to comparable stages of the cycle.43 Despite this shortcoming,
42 The comparison is based on the comprehensive rates and earnings series as givenin Appendix Table A-2. For rates the series is based on sixteen industries from 1928to 1933, the earlier period (1924.27) being extrapolated on the basis of fewer industries.For earnings the whole series is estimated by the Statistische Reichsamt. Although theindustry coverages are not comparable, the series are so comprehensive that the move-ments of both may be regarded as representative. The relation of the absolute levelsmust be considered with more caution. Yet the relation between the levels must beapproximately right, for in 1932, when the excess of earnings over rates is known tohave been small, the computed difference amounts to only 2.6 percent. It must beunderstood further that the comparison is between actual hourly earnings and nominalrates; there is practically no information on the excess of actually paid rates overnominal rates.
The results are published in Wirtschafe und Statistik, and summary tables arereproduced in various issues of the Jahrbuch.

154 WAGES IN GERMANY
the investigations provide some detailed illustrations of the excess ofearnings over rates, at known stages of the business cycle. The excessesare sometimes surprisingly large—occasionally larger than the rate itself.M
average excess of earnings over rates for whole industries is, of course,more moderate. There are at least two major reasons for the relativelywide industrial variation among the excesses: industries with a largeproportion of piece work tended to show higher excesses; and someindustries followed a rate policy whereby excesses were built up andthen reduced without changes in the agreed rate.
W. Woytinsky observes that the industrial differentials among unionrates are larger than those among effective hourly earnings, so that theexcesses of earnings over rates tend to reduce extreme differentials in basicrates. In support of this thesis he offers the tabulation below.45 The tabu-lation refers to piece work only and gives no information on the relationof hourly earnings to the corresponding time rates. Other students havefound that the relation of earnings to rates is not the same for both time
Average Hourly Average AverageYear Union Rates Excess Hourly Earnings
(p fe nn i g s)
Rolling mills 1928 79.8 56.5 136.3Smelting 1928 81.9 39.3 121.2Shoes 1929 97.9 26.5 124.4Metal products 1928 99.0 21.1 120.1Chemicals 1928 109.8 22.4 132.2Woodworking 1928 117.5 10.3 127.8
work and piece work. In general, according to Straube,46 within anindustry the excess of earnings over time rates is greatest for the higher-paid skilled workers. By contrast, the excess over piece rates is greatestwhen these rates are relatively low. Among different industries, excess ofearnings over rates is largest for the industries with low time rates. How-ever, these rules are subject to exceptions, since the excess of earnings overrates is affected by the timing of the investigations and the renewal datesof union contracts.
Cycle PatternsRATE CYCLES. Wage rate cycles have distinct over-all patterns. We have
seen that the movements of printing rates before 1913 approximated a stepfunction because such rate agreements were drawn on a nationwide basis
"For first rollers in Siegerland rolling mills the excess amounted to 125 percent ofthe rate in October 1928 (Jahrbuch 1930, p. 291).
"Handworterbuch des Gewerkschaftswesens, pp. 1575 if. The author compares wagerates with earnings, excluding premium payments for overtime, etc. However, the useof earnings including premium payments would not materially affect the picture.
"Dora Straube, Die Veranderungen von Lohn und Preis nach der Stabilisierung inDeutschland (Kallmünz, 1935).

CYCLICAL BEHAVIOR OF WAGES 155and for relatively long periods. The long terms of the agreements explainboth the progress of the rates by sudden steps, and their poor correspond-ence with changes in general business conditions. Building rates followeda different course before World War I; they moved more gradually (seeChart 3). Rates in the three selected cities were based on local arrangementswhich were subject to frequent revision; hence they conformed somewhatmore closely to cyclical changes in the economy at large.
The step-by-step movements as well as the smooth progression ofaverage wage levels can be observed in the behavior of monthly unionrates during the interwar period. Comparison of Charts 14 and 15 showsthat the movements of average union rates for all industry are considerablysmoother than those of the component industries. The step-by-stepprogress, with its many intermediate plateaus and instantaneous ratechanges, appears for both individual industries and for their average:(1) during 1925-26 when, under the weight of the business recession,current rate arrangements were commonly continued or changed onlyslightly; (2) at the prosperity plateau of 1929-30, when long-term agree-ments in effect in most industries insured stability of wage rate levels;(3) at the end of 1931, when the government's emergency decree broughtabout compulsory rate adjustments in all industries; and (4) from 1933on, when the stabilization policy of the National Socialist regime pre-vented a cyclical recovery of wage rates.
In periods when changes in wage rates were neither controlled norsuppressed by external forces, appreciable differences may be observed intheir behavior patterns from industry to industry. Investigation of ratesfor skilled male workers in various industries shows that relatively smoothchanges of industry averages prevailed in brewing, textiles, and metals—allof which had wage agreements of relatively short duration and predomin-antly local or regional character. In other industries, changes of averagerates occurred by steps whenever the agreements were Reich-wide, as inprinting, or when wage agreements were concluded at a particular season.Pottery, chemicals, and book printing tended to experience wage-ratechanges in the spring, soft coal in the winter.47
In monthly union rates the expansion phase is markedly longer than thecontraction (see Chart 14). If the whole period of March 1924 to April1933 is regarded as one huge cycle, the asymmetrical character of thewave is most pronounced—an expansion of 80 months compared to acontraction of3l months. If, on the other hand, the plateau from November1925 to February 1927 is regarded as a contraction, then two specificcycles are to be recognized, with troughs at January 1924, February 1927(T2), and April 1933 (T1). Even here the asymmetry is apparent: the firstcycle embraces an expansion of twenty-two months and a contraction offifteen, and the second an expansion of forty-six months and a contraction
Ibid., p. 27.

156 WAGES IN GERMANY
of twenty-eight.48 In the same chart the duration of these cycle phases canbe compared graphically with that of the corresponding reference cyclephases, in which, also, the length of expansions exceeds that of contrac-tions. But this excess is far less pronounced than for wage rates.
EARNINGS CYCLES. The contours of the cyclical movements of earningstend on the whole to be smoother than those of rates (see Chart 12).That we find smoother lines for earnings is not surprising, since the elementswhich modify rates into earnings change, by and large, gradually.
The asymmetry of wage cycles is apparent also in earnings; shiftearnings of miners, for instance, form cycles with considerably longerexpansion than contraction phases. For the quarterly earnings series ofDortmund coal miners, the standard analysis of the National Bureauestablished an averge duration of specific expansions of 57.0 months,while specific contractions lasted only 20.4 months.49 Reference cyclesshow a less extreme difference between the duration of expansions andcontractions.
The cyclical patterns of shift earnings in Dortmund were not exceptional.Although, as pointed out above, the behavior of miners' earnings isdiversified (see Chart 18), annual averages of shift earnings of hewersand haulers in ten mining districts show the same general pattern as theearnings of Dortmund miners (see Chart 4). The asymmetry and thesmoothness of earnings cycles are notable also in the comprehensiveearnings index available for the interwar period (see Chart 2).
WAGE CYCLES AND EMPLOYMENTTiming Relations. We shall now proceed to relate wage cycles to changes
in employment conditions, to fluctuations in the occurrence and intensityof labor strife, and various types of governmental activity—in short, tochanging conditions in the labor market. First to be investigated is therelation of fluctuations in wages to changes in employment.
On the whole, changes in employment are rather closely correlated withmovements in general business activity. Even the scant statistical dataavailable for the years prior to World War I indicate clearly that employ-ment fluctuations conform closely to the ups and downs of businessconditions. For the interwar period the relation of reference turns,employment cycles, and wage behavior can be discussed on the basis ofconsiderably better data. Monthly indicators of employment conditions,in deseasonalized form, are compared in the accompanying tabulationwith the peaks and troughs in general business activity. It shows, that
Here the end of the prosperity plateau in December 1930 is regarded as the upperturning point (P2) of the second cycle. Even if the prosperity plateau itself is not in-cluded in either specific expansion or contraction, the duration of the actual rise exceedsconsiderably that of the actual decline. Only if the beginning of the plateau (P1) inMay 1930 is regarded as dividing expansion and contraction, does the duration of thetwo phases become almost the same.
"In five cycles during 1890-1914 and 1924-32.

CYCLICAL BEHAVIOR OF WAGES 157
CYCLICAL TURNING POINTS IN EMPLOYMENT INDICATORSAND IN GENERAL BUSINESS CONDITIONS
EmploymentEmployed Members in Percent of
a ofSickness Insurance CapacityTurning Reference At Employment In Percent ofPoints Cycles Exchanges Union Series I Series II JKF
Dates of Turning PointsPeak Mar. '25 May '25 May '25Trough Mar. '26 Aug. '26 July '26 June '26Peak Apr. '29 Oct. '27 Apr. '28 Feb. '28 Aug. '29 Aug. '28Trough Aug. '32 July '32 July '32 July '32 Aug. '32
Leads, —, and Lags, +, of Employment Indicators(in months)
Peak Mar.'25 +2 +2Trough Mar.'26 +5 +4 +3Peak Apr. '29 —18 —12 —14 +4 —8Trough Aug.'32 —1 —1 . —1 0
a The peaks and troughs of the unemployment series were inverted to make them comparable withthe other measures in this tabulation.
Appendix Table A-28. For graphic presentation of registered unemployed and employedmembers of sickness insurance funds, see also Chart 27.
during the relatively mild contraction of 1925-26, the available employ-ment indicators reacted with a tardiness of about 2 to 5 months at peakand trough. During the Great Depression of 1929-32, turns in the employ-ment indicators tended to precede those in general business activity—atthe 1929 peak by eight to eighteen months,5° but by only one month atthe subsequent trough.
Wage lags behind employment turns would obviously differ from thosebehind reference turns. Their timing in relation to reference turns and to
LAG OF WAGE RATES,TURNING POINTS IN MONTHS:
Reference Behind Behind Un-Cycles Unemployment Wage Rates Reference Turns employment
Peak Mar. '25 May '25 Nov. '25 (P1) 8 6Trough Mar. '26 Aug. '26 Feb. '27 (T2) 11 6Peak Apr. '29 Oct. '27 May '30(P1) 13 31
Dec. '30(P2) 20 38Trough Aug. '32 July '32 Mar. '33 (T1) 7 8
SOURCE Table 34 and Appendix Table A-28.
Also employed members of sickness insurance associations show a marked lead,according to the unrevised series (i). The revised series (Ii) shows a lag of 4 months, or,if May is regarded as an alternative peak, a lag of I month. The latter segment n differsfrom the earlier segment I mainly in that it is based on a constant number of reportinginsurance societies. Reichsarbeitsblatt 1932, Supplement 10, pp. 6 if.
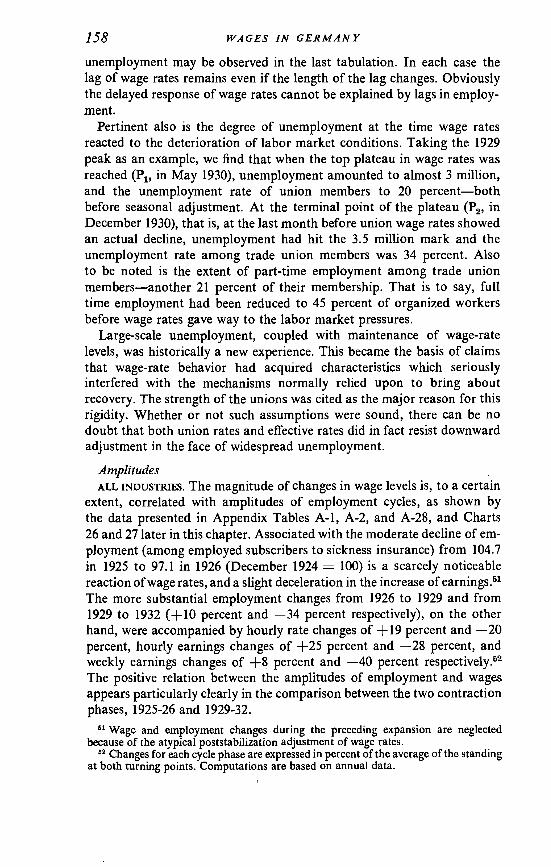
158 WAGES IN GERMANY
unemployment may be observed in the last tabulation. In each case thelag of wage rates remains even if the length of the lag changes. Obviouslythe delayed response of wage rates cannot be explained by lags in employ-ment.
Pertinent also is the degree of unemployment at the time wage ratesreacted to the deterioration of labor market conditions. Taking the 1929peak as an example, we find that when the top plateau in wage rates wasreached (P1, in May 1930), unemployment amounted to almost 3 million,and the unemployment rate of union members to 20 percent—bothbefore seasonal adjustment. At the terminal point of the plateau (P2, inDecember 1930), that is, at the last month before union wage rates showedan actual decline, unemployment had hit the 3.5 million mark and theunemployment rate among trade union members was 34 percent. Alsoto be noted is the extent of part-time employment among trade unionmembers—another 21 percent of their membership. That is to say, fulltime employment had been reduced to 45 percent of organized workersbefore wage rates gave way to the labor market pressures.
Large-scale unemployment, coupled with maintenance of wage-ratelevels, was historically a new experience. This became the basis of claimsthat wage-rate behavior had acquired characteristics which seriouslyinterfered with the mechanisms normally relied upon to bring aboutrecovery. The strength of the unions was cited as the major reason for thisrigidity. Whether or not such assumptions were sound, there can be nodoubt that both union rates and effective rates did in fact resist downwardadjustment in the face of widespread unemployment.
AmplitudesALL INDUSTRIES. The magnitude of changes in wage levels is, to a certain
extent, correlated with amplitudes of employment cycles, as shown bythe data presented in Appendix Tables A-i, A-2, and A-28, and Charts26 and 27 later in this chapter. Associated with the moderate decline of em-ployment (among employed subscribers to sickness insurance) from 104.7in 1925 to 97.1 in 1926 (December 1924 = 100) is a scarcely noticeablereaction of wage rates, and a slight deceleration in the increase of earnings.5'The more substantial employment changes from 1926 to 1929 and from1929 to 1932 (+10 percent and —34 percent respectively), on the otherhand, were accompanied by hourly rate changes of + 19 percent and —20percent, hourly earnings changes of +25 percent and —28 percent, andweekly earnings changes of +8 percent and —40 percent respectively.52The positive relation between the amplitudes of employment and wagesappears particularly clearly in the comparison between the two contractionphases, 1925-26 and 1929-32.
51 Wage and employment changes during the preceding expansion are neglectedbecause of the atypical poststabilization adjustment of wage rates.
52 Changes for each cycle phase are expressed in percent of the average of the standingat both turning points. Computations are based on annual data.
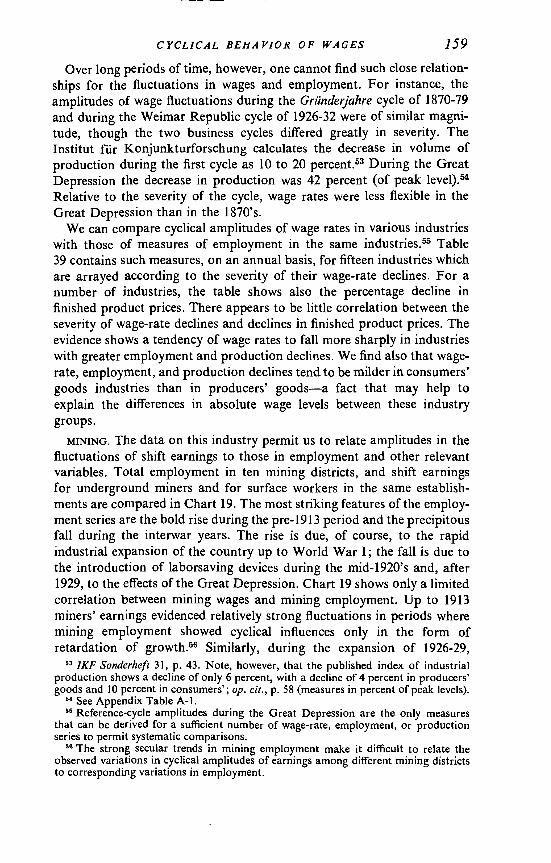
—
CYCLICAL BEHAVIOR OF WAGES 159Over long periods of time, however, one cannot find such close relation-
ships for the fluctuations in wages and employment. For instance, theamplitudes of wage fluctuations during the Grunderjahre cycle of 1870-79and during the Weimar Republic cycle of 1926-32 were of similar magni-tude, though the two business cycles differed greatly in severity. TheInstitut für Konjunkturforschung calculates the decrease in volume ofproduction during the first cycle as 10 to 20 percent.53 During the GreatDepression the decrease in production was 42 percent (of peak level).MRelative to the severity of the cycle, wage rates were less flexible in theGreat Depression than in the 1870's.
We can compare cyclical amplitudes of wage rates in various industrieswith those of measures of employment in the same industries.55 Table39 contains such measures, on an annual basis, for fifteen industries whichare arrayed according to the severity of their wage-rate declines. For anumber of industries, the table shows also the percentage decline infinished product prices. There appears to be little correlation between theseverity of wage-rate declines and declines in finished product prices. Theevidence shows a tendency of wage rates to fall more sharply in industrieswith greater employment and production declines. We find also that wage-rate, employment, and production declines tend to be milder in consumers'goods industries than in producers' goods—a fact that may help toexplain the differences in absolute wage levels between these industrygroups.
MINING. The data on this industry permit us to relate amplitudes in thefluctuations of shift earnings to those in employment and other relevantvariables. Total employment in ten mining districts, and shift earningsfor underground miners and for surface workers in the same establish-ments are compared in Chart 19. The most striking features of the employ-ment series are the bold rise during the pre-1913 period and the precipitousfall during the interwar years. The rise is due, of course, to the rapidindustrial expansion of the country up to World War I; the fall is due tothe introduction of laborsaving devices during the mid-1920's and, after1929, to the effects of the Great Depression. Chart 19 shows only a limitedcorrelation between mining wages and mining employment. Up to 1913miners' earnings evidenced relatively strong fluctuations in periods wheremining employment showed cyclical influences only in the form ofretardation of growth.56 Similarly, during the expansion of 1926-29,
IKF Sonderheft 31, p. 43. Note, however, that the published index of industrialproduction shows a decline of only 6 percent, with a decline of 4 percent in producers'goods and 10 percent in consumers'; op. cit., p. 58 (measures in percent of peak levels).
See Appendix Table A-I.Reference-cycle amplitudes during the Great Depression are the only measures
that can be derived for a sufficient number of wage-rate, employment, or productionseries to permit systematic comparisons.
The strong secular trends in mining employment make it difficult to relate theobserved variations in cyclical amplitudes of earnings among different mining districtsto corresponding variations in employment.

160 WAGES IN GERMANY
TABLE 39Cyclical Declines in Wage Rates, Prices, and Employment, from 1929 to 1932
(percent)a
Decline in Decline in
IndustryDecline in
Union Rates(1)
Decline inEmployment b
(2)
Percentageof Employed
Union Members(3)
Decline inProduction
Indexes(4)
FinishedProductPrices
(5)
BuildingHard coal
25.320.4
75.1••.
74.9••.
66.535.9
26.515.4
WoodworkingPaper productsChemicals
19.818.417.3
44.335.0...
57.635.727.1
54.1•..
44.6
...37.617.0
PrintingMetals
17.216.9
...
...29.539.1
18.940.5
...10.8
PapermakingPotteryClothingFood
16.116.015.915.8c
22.3...
33.214.2d
21.434.829.618.6e
20.843.216.8
37.6...
31.3...
Soft coal 14.4 ... ... 29.8 ...Textiles 13.6 22.8 24.1 16.5 55.7Shoes 12.5 ... 21.3 17.8 32.6Brewing 12.1 ... ... 41.2 ...
a Percentage changes are stated in conventional form, i.e., they are based on levelsfor the year 1929.
b Data give employment as percent of "employment capacity." However, this tech-nologically determined capacity does not change greatly in the short run, particularlyduring contractions.
Baking and confectionery.Average decline in foods (10.7%) and in coffee, tea, beer, tobacco, etc. (17.6%).
e Foods and beverages, but excluding tobacco.Foods, beverages, and tobacco.
SOURCE, by column:(I) Computed from Appendix Table A-21.(2) From lKFHandbuch 1936, pp. 19-24.(3) From IKFHandbuch 1933, p. 25 if.(4) From IKFHandbuch 1936, pp. 49-50.(5) From Appendix Table A-32.
earnings increased substantially, although employment barely maintainedits level. Finally, during the contraction of 1929-32, earnings decreasedonly moderately despite a precipitous decline in employment. Apparentlyminers' earnings fluctuated more with general business conditions and withwages in other industries than with employment in the mining industryitself.
For the hard coal mining district of Dortmund, an attempt was made toassemble more detailed evidence on employment, shifts worked, pro-duction, productivity, and other factors that might help to explain thecyclical behavior of miners' earnings (see Appendix Tables A-6, A-7,and A-29, and Chart 20). The data suggest that extra shifts and overtime

CYCLICAL BEHAVIOR OF WAGES 161
shifts played an important role in this respect. Frequently such shifts werenot counted separately, so that the overtime pay appears as increased"shift" earnings.earnings. In periods
Market conditions and the coal price also influencedof high prices and brisk demand, employers were
liberal in their standards of what constituted a full cart and what kind ofcoal warranted premium pay because it was extra hard, came from thinseams, or was not easily accessible. All these elements entered into the
CHART 19
Earnings and Total Employment in Ten1889—1913 and 1924—1932
Mining Centers,
Earnings in marks9
$
7
6
5
4
3
2
Thousands employed900
800
700
600
500
400
300
200
Shaded areas represent business contractionsSource: Appendix Tables A-6 and A-7. For employment, see Zeitschrift fLrwesen, possim.
dos Berg—, und Salinen-
wage arrangement and could be shaded in what was essentially an adjust-ment of piece rates for underground miners. Surface workers servedon a time arrangement. But changes in their basic rates and the incidenceof overtime imparted cyclicity—though of smaller amplitudes—also to theshift earnings of these workers.
Wages, Employment, and Payroll. The roles played by rates, earnings,and employment in labor-market cycles can be analyzed through theircontributions to payroll changes. The available data do not permit abreakdown of payroll fluctuations into their determinants, for a full cycle;but such an analysis can be carried through for the business contractionof 1929-32. The basic data are to be found in Table 40, where we note thatduring this reference contraction the total payroll in manufacturing andmining industries decreased by 60 percent,57 while employment went downabout 40 percent. Average annual (or weekly) earnings, for wage earners
kept their jobs, were reduced by about one-third; part of this lossThe percentage changes are measured from the peak.
U, 0 it) 0 U) 0 it) ONU, 0 0 N N

162 WAGES IN GERMANY
change+400
+350
+300
+250 -
+200
+150 -
+ 100
+80
+60+50÷ 40+30+20+ 10
0
— 10
—20
—30
—40
—50
—60
—70
Average EarningsCHART 20
of Dortmund Miners, and Other Variables,1871—1913 and 1924—1934
- 0 0 tflt- N- W W m
a
Shaded areas represent business contractions.Source: Appendix Tables A-8 and A-29 and their sources.

CYCLICAL BEHAVIOR OF WAGES 163
TABLE 40Cyclical Changes in the Industrial Payroll and Its Major Components,
1929-1932
Unit 1929 1930 1931 1932
(1) Hourly union rates pfennigs 85.3 86.8 82.3 69.7
(2) Ratio of earnings to rates ratio 1.113 1.062 1.035 1.026
(3) Average hourly earnings pfennigs 94.9 92.2 85.2 71.5(line 1 x line 2)
(4) Number of hours worked per week hours 46.02 44.22 42.48 41.46(5) Number of weeks per year weeks 48.7 49.0 49.0 49.0(6) Number of hours worked per year hours 2240 2167 2082 2032
(line 4 x line 5)(7) Average annual earnings marks 2126 1998 1774 1453
(line 5 x line 6)
(8) Employed workers millionworkers 6.241 5.428 4.492 3.711
(9) Total wage payroll billion(line 6 x line 7) marks 13.27 10.85 7.97 5.39
SOURCE, by line:
(1) Wirtschaft und Statist/k, passini.(2) Computed: (3) ± (1).(3) Our estimate based on absolute levels (Handbuch 1924-44, p. 469) and index
(Appendix Table A-2).(4) Our estimate. Hours worked per day (lKFHandbuch 1936, p. 32), multiplied by 6.(5) 1929 and 1932 computed: (6) ± (4); 1930 and 1931 assumed to be equal to 1932.(6) Computed: for 1929 and 1932 (7) ± (3) x 100; for 1930 and 1931 (4) x (5).(7) Computed: for 1929 and 1932 (9) ± (8); for 1930 and 1931 (3) x (6).(8) Handbuch 1928-44, p. 480.(9) 1929 and 1932, Wirtschaft und Stat/silk, 1939, p. 301. For 1930 and 1931, com-
puted: (7) x (8).Hourly rates and earnings are averages based on constant weights. Any resultant
inaccuracies are of minor importance, for the limited purposes of this table.
must have been due to the shortening of the average workweek by about10 percent. Average hourly earnings dropped by only 25 percent, and thedecline of minimum rates set by collective agreement was still milder,amounting to about 18 percent. That the drop was larger in averagehourly earnings than in rates may be explained on several counts. Amongthem are the decline of work at premium rates; reduction of output paidfor by piece rates; changes in the industrial, sex, and age composition ofthe work force and of hours worked; and the decrease of voluntary ratepayments in excess of agreed minima. No data are available for anevaluation of the changes in these factors. It can be estimated, however,that the average excess of hourly earnings over minimum union ratesamounted to about 11 percent in 1929, but to only 3 percent in 1932.58
Having presented the percentage changes of various payroll components,let us measure the contribution made by each of these components to the
This statement is based on the possibly incautious assumption that the rates and
earnings samples are roughly comparable.

164 WAGES IN GERMANY
total decline in industrial payroll.59 According to this tabulation the
Contribution of Major Factors to Payroll Decline, 1929 to 1932
Billions of PercentageDecline in— Marks Contribution
Employment 4.70 59.7Hours .94 11.9Excess of hourly earnings
over rates .85 10.8Wage rates 1.39 17;6
Total industrial payroll 7.88 100.0
decrease in employment accounts for more than half of the total payrollreduction, and the decrease in employment and hours together for morethan 70 percent. The drop in hourly earnings accounts for close to 30percent of the total decline, and that in wage rates proper for less than20 percent. It must be stressed that these figures describe the numericalcontribution of the various factors, but do not reflect the causal importanceamong the variables.60
The approach to the measurement of these contributions was originally suggestedby Paul Boschan. It is described in a joint paper to be separately published. Roughly,the total contribution of each factor is built up from its contributions to changes in theproduct of the several factors during small subperiods—in this case the year-to-yearchanges. Within the subintervals, the contribution of each factor can be regarded as acompromise between its maximum and minimum possible contribution. Computation-ally, the contribution of each factor is derived from the weighted change of the particularfactor during the subinterval, the weights being determined by the average levels of theother factors. The weighted changes of the various factors add up, in each subintervaland interval, to the change in their product.
60 The German government's wage-rate decree of 1931 was accompanied by anextended controversy on the cyclical consequences of alternative wage policies. Theproblem was whether a deflationary wage policy should be pursued in order to increaseprofitability, or whether maintenance or perhaps even an increase of wage rates wouldaugment purchasing power, and thus serve to restore prosperity. The following findingsof the present study may bear upon this controversy: (1) wage rates showed materialcyclical declines only twice in the seventy-five-year period; (2) these decreases laggedbehind turns in general business; (3) the numerical contribution of the decline of unionrates to the total payroll contraction was limited to about one-fifth.
We can now perceive that the argument for high wage policies was subject to certainlimitations: The decline in wage rates contributed little to the decline in the payroll,and still less to the contraction of total purchasing power. The depression continued todeepen despite the fact that high wage levels were maintained for a long time—about oneand one-half years—after the turn in general business conditions. Under the enormouspressures of unemployment, actual upward adjustments of wage rates would have beenextremely unlikely. The statistical evidence also throws some light on the alternativeproposition, that is, the policy of stimulating employment and supporting profitabilityby decreasing wages. Relevant in this connection is the rare occurrence of actual ratedeclines, their relatively mild character, and the long delays involved. Also, both partiesto the wage controversy would have done well to give adequate weight to the inter-national aspect of the economic catastrophe, of which German events formed only apart. In focusing their attention on wage rates, both sides tended perhaps to over-estimate the strategic importance of an economic variable which is relatively inflexibleand constitutes only one of many factors in the complex cyclical process.

CYCLICAL BEHAVIOR OF WAGES 165
Cycles in Wage Rates and Prices
GENERALComparisons of the cyclical behavior of wage rates and prices can becarried through only in rather rough form, for several reasons. Neitherthe prices nor the wage rates reported were necessarily those paid (effectiveprices or rates). The wholesale prices at our disposal are for the most partlist prices and do not show concessions that might have been frequent inslack periods. And the wage rates we quote are generally minimum rateswhich cannot reflect the higher payments made in lively periods of business.During the years of the Weimar Republic, prices tended to have a maximumand wages a minimum character.6' While list prices tended to be closerto effective prices during prosperity, and union rates closer to effectiverates during depression, the published quotations in both instances failedto describe the full amplitudes of actual fluctuations. Moreover, theindustrial coverage is reasonably similar for only a few price-wage com-parisons; in general, our indexes do not cover the same segment of theeconomy. These shortcomings do not vitiate all comparisons of prices andwages, but they do indicate the limits within which such comparisonscan be taken as valid.
CYCLES IN WAGE RATES AND WHOLESALE PRICESCyclical Behavior, Annual Series, 1871-1944. Wholesale prices and wage
rates for 1871 through 1944 are depicted, on an annual basis, in Charts6 and 21. Most of the components of the wholesale price index are rawmaterials prices. A number. of differences in cyclical behavior as betweenthese prices and wage rates are to be noted in the rough annual data.First of all, wholesale prices show distinct cycles which in almost all casescan be clearly associated with changes in general business conditions.In wholesale prices there is little skipping of cycles.62 Compared with thewage rates traced in the same charts, the conformity of wholesale pricecycles to those of general business is definitely superior, and their turningpoints are closer to business peaks and troughs. Nor do wholesale pricesshow the strong lags, which are so consistent a feature of wage-rate cycles.It is true that-wholesale prices lagged behind the 1872 peak63 and behindthe 1878, 1904, and 1932 troughs. On the other hand, wholesale pricesshowed an early peak before the 1882 break in business prosperity,
61 Even during this period there may have occurred premium payments above quotedprices and occasional wage payments below union rates. But these must have beenexceptional.
02 The one exception, for the years charted, is the short and particularly mild 1902-4reference cycle (see footnote 7 of this chapter). Even in this case, however, traces ofcyclicity can be found.
63 This is a rather uncertain peak (see note 20, this chapter). An alternative deter-mination of the upper turning point, in 1873, would make the wholesale price turncoincide, but would not disturb the substantial lag in wage rates.
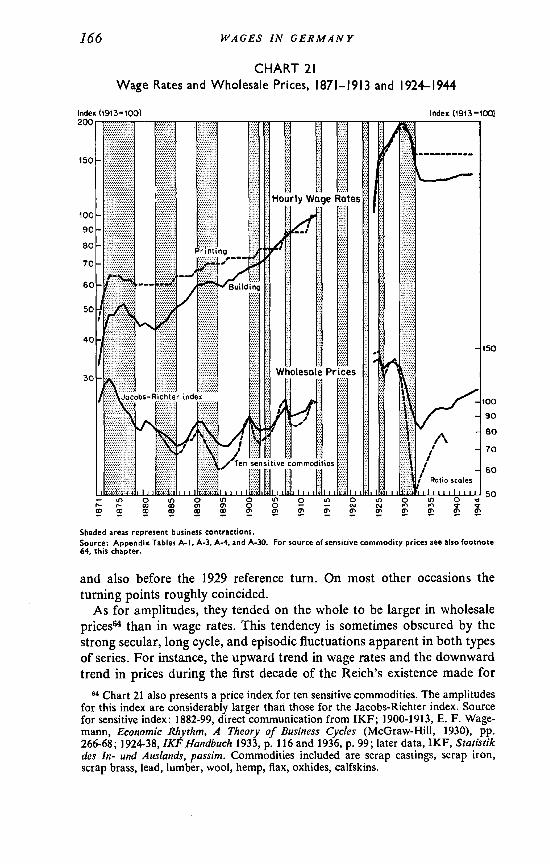
166 WAGES IN GERMANY
CHART 21
Wage Rates and Wholesale Prices,
Index (1913= 100)
1871—1913 and 1924—1944
Index.
Shaded areas represent business contractions.Source: Appendix Tables A-I, A-3, A-4, and A-30. For source of sensitive commodity prices see also footnote64. this chapter.
and also before the 1929 reference turn. On most other occasions theturning points roughly coincided.
As for amplitudes, they tended on the whole to be larger in wholesalethan in wage rates. This tendency is sometimes obscured by the
strong secular, long cycle, and episodic fluctuations apparent in both typesof series. For instance, the upward trend in wage rates and the downwardtrend in prices during the first decade of the Reich's existence made for
"Chart 21 also presents a price index for ten sensitive commodities. The amplitudesfor this index are considerably larger than those for the Jacobs-Richter index. Sourcefor sensitive index: 1882-99, direct communication from IKF; 1900-1913, E. F. Wage-mann, Economic Rhythm, A Theory of Business Cycles (McGraw-Hill, 1930), pp.266-68; 1924-38, IKF Handbuch 1933, p. 116 and 1936, p. 99; later data, IKF, Statistikdes In- und ,4uslands, passim. Commodities included are scrap castings, scrap iron,scrap brass, lead, lumber, wool, hemp, flax, oxhides, calfskins.
200
.- U)r- o in 0 'fl 0 U) Q in 0 tfl 0 U) 00 0 — c'.' c'.J r)2? 2? 2? 2? 2? 2? 2? 2?

CYCLICAL BEHAVIOR OF WAGES 167equally large total fluctuations in both cases. Similarly, after 1923, thepoststabilization adjustment in wage rates and their failure to declineduring the 1925-26 contraction led to a huge wage-rate rise from 1924 to1929, compared to mild changes in prices. After 1929 the cyclical down-ward adjustment of prices must have been accentuated by the depressingtrends of largely noncyclical character that prevailed throughout thepoststabilization years. Perhaps the most convincing evidence of the largeramplitude of wholesale prices is found during the years 1880 to 1913,when prices showed clear cyclical behavior and wage rates did not. Inthis as in other periods, the lesser amplitude of wage rates is not so apparentin expansions; it is most conspicuous in the failure of rates to respond,or respond promptly and significantly, to deteriorations in businessconditions. The explanation for the weaker cyclical response of wagerates cannot be found in the long-term upward trend of these rates alone.At least during the last two or three decades before World War I therewas a similar upward trend in the general price level. The cause must besought rather in the determination of the price of labor and in the socialforces which precluded purely "economic" adjustments in the labormarket.65
Turning Points, 1924-1939. Comparison of wage rates and prices canbe carried through in greater detail on the basis of the monthly datapresented in Appendix Table A-30 and Chart 22. Not only are the whole-sale prices in these exhibits available at more frequent time intervals(monthly), but also their total coverage is substantially increased (fourhundred commodities). The index is broken down into economicallysignificant groups, such as prices for raw materials and semimanufacturedgoods versus prices of finished goods; controlled prices versus free pricesor versus sensitive commodity prices; prices for producers' goods versusprices for consumers' goods. The cyclical behavior of wage rates willforthwith be compared with that of these price categories.
Chart 22 confirms the preliminary findings on conformity which wereset forth in the previous section. All represented price series show clearcycles with a one-to-one correspondence to changes in general businessconditions. They all experience actual declines during or close to businesscontractions. Wage rates are the only broad price group in which the react-ion to the 1925-26 contraction consists of an interruption of growth only.
Table 41 relates the turning points of wage rates and prices to those ingeneral business conditions.66 The most impressive features of the table
See Mitchell, Business Cycles, 1913, pp. 465-66.66 The comparisons are restricted to the four reference turning points in 1925, 1926,
1929, and 1932. The 1923-26 reference cycle is covered only in part, since wage seriesstart in 1924 and some price series in 1925. Furthermore, the vehement short-termfluctuations of prices, in response to the problems of the year 1924, makeit difficult to determine cyclical turning points during that year.
Neither wage rates nor the included prices showed enough seasonality to warrantadjustment.

168
change
+100
+80=
+60 -+50 -+40 -+30 -+20 -+10 -
0——to -
—20 -
—30 -
—40 -
—50 -
WAGES IN GERMANY
CHART 22
Wages and Prices, 1924—1939
Shaded areas represent business contractions.Source: Appendix Table A-30
Manufactures, rawand semi—finished
1924 '25 '26 '27 '28 '29 '30 '3 1'32'33'34'35'36 37'38' 39

CYCLICAL BEHAVIOR OF WAGES 169
TABLE 41
Timing of Cyclical Turning Points in Wagc Rates and Prices, 1924-1932(leads, —, and lags, +, in months)
PeakMarch 1925
TroughMarch 1926
PeakApril 1929
TroughAugust 1932
Hourly Wage Ratesa + 8 +11 + 1.3 + 20 + 8 + 67Cost of Living +6 0 +8Wholesale Prices
All commodities including farmproducts + 6 + 3 —9 + 8
Manufactures, raw and semi-finished —1 + 3 —11 —1
Manufactures, finished + 6 + 11 —6 + 8
Producers' goods +6 + 12 +5 +9cConsumers' goods +7 +10 5 +8
Sensitive prices —2 + 2 —15 —2Free prices +9 —15 —1Administered prices 0 + 3 + 7 + 8
o The timing relations in this line are based on a number of special decisions. In1925 and 1926, formation of a plateau was regarded as equivalent to a cyclical decline,and its initial and terminal edges as "turning points." The two entries for 1929 andagain for 1932 represent the beginning and end of a peak ridge and a flat-bottomedtrough. The extremely late upturn after the Great Depression is due to the wagestabilization under National Socialism. The 67-month lag stated above implies the endof the depression plateau to have been reached in March 1938. However, even this lateturn marks but a slight change in the direction of wage trends. During the subsequenttwo years the rise in rates amounts to about 1 percent only.
b This lead implies a peak of living costs in March 1929. This peak is brought aboutby a minor ripple. Alternatively, living costs might be held to form a peak plateau. Atthe initial and the terminal edge of this plateau the timing of living costs would bemeasured as —8 for P1. and +8 for P2.
C Measured to beginning of trough plateau (T1). End of plateau (T2) occurs yearslater.
SOURCE: Appendix Table A-30.
are the consistent substantial lags of turning points in wage rates behindthose of prices. In relation to reference turning points, this consistencyreflects the long lag of wage rates behind changes in general businessconditions, as compared to a much shorter lag of prices. The lags in wagerates vary from eight to twenty months, occur at each of the four majorturns in business conditions, and are generally larger than those of anyof the price series.67 Although averages for observations derived fromtwo cycles can hardly be taken to represent a "central tendency," they
67 For the determination of turning points at the plateaus of 1925-26 and from 1929-30, see footnote to Table 41. Note that at the prosperity plateau around 1930 the lagof wage rates behind, price turns exists whether the beginning (F1) or the end (P2) ofthe peak plateau is used as a basis of measurement. An extreme lag of 67 months isobserved after the Great Depression and is due to wage stabilization under the Nazis.If this lag is omitted the range of lags is eight to twenty months.

170 WAGES IN GERMANY
serve to show that sensitive commodity prices lead, while administeredprices (largely cartel prices) lag behind changes in business conditions.Similarly, wholesale prices of raw materials and semifinished goods tendto lead, while those of finished goods tend to lag. Somewhat unexpectedis the situation in producers' and consumers' goods, particularly duringthe Great Depression. Both at their peak and at their trough consumers'goods prices show a considerably earlier reversal of direction than pricesof producers' goods. At the peak this difference amounts to 10 months;at the trough it must be measured in years. The lead of consumers' goodsprices requires explanation in view of the central role usually occupied bythe markets for producers' goods in the turn of business fortunes. Atthe 1929 peak this lead was frequently regarded as a consequence of thelimited capacity of the German consumers' goods market, which was easilyglutted in periods of sustained prosperity. It reflected also the greater roleof cartel agreements in the sphere of producers' goods, which might haveled both to a better defense of effective prices and to a perpetuation of listprices long after price shading became the rule. The lag at the subsequenttrough must be understood in terms of National Socialist price policies,to be discussed in the next chapter.
The difference in timing between wage rates and the price indexespresented here merits some comment. The signs of slackening or quicken-ing pace of business conditions may be expected to appear in the demand-supply conditions of the product markets before production schedulesand employment policies are actually adjusted.°8 That is, broadly speaking,labor market changes tend to lag behind product market changes. Further-more, the frictions discussed in earlier sections of this chapter preventprompt response of wage rates to changes in labor market conditions,while less effective frictions exist in price responses to changes in productmarket conditions. A case may be made out for the existence of ananalogous set of frictions bearing on cartel-controlled prices. In thisinstance, agreements within the cartel and the establishment of industry-wide price lists correspond roughly to the collective agreements betweenunions and The need to reach internal and external agreementon price revisions has delaying effects, corresponding in some ways todelays caused by the need for new collective agreements in the case ofwage revisions.69 The similarity between wages and cartel prices did notfind expression in the timing of the specific turns in cartel prices at the1925 and 1926 changes in business conditions. It did, however, lead to adelay in the downward revision of cartel prices at the 1929 peak, second
68 In fact, such adjustments would characteristically be postponed until changes inthe product markets are clear enough to warrant changes in managerial policy.
69 It should perhaps be emphasized that cartel-controlled prices are here used aspars pro 1010. Administered prices and tendencies toward nonprice competition existedalso outside the sphere of formal cartel arrangements. For a systematic comparison ofunion wage rates and cartel prices see Wagenfuhr, "Kartelipreise und Tariflöhne imKonjunkturverlauf," pp. 501-17.
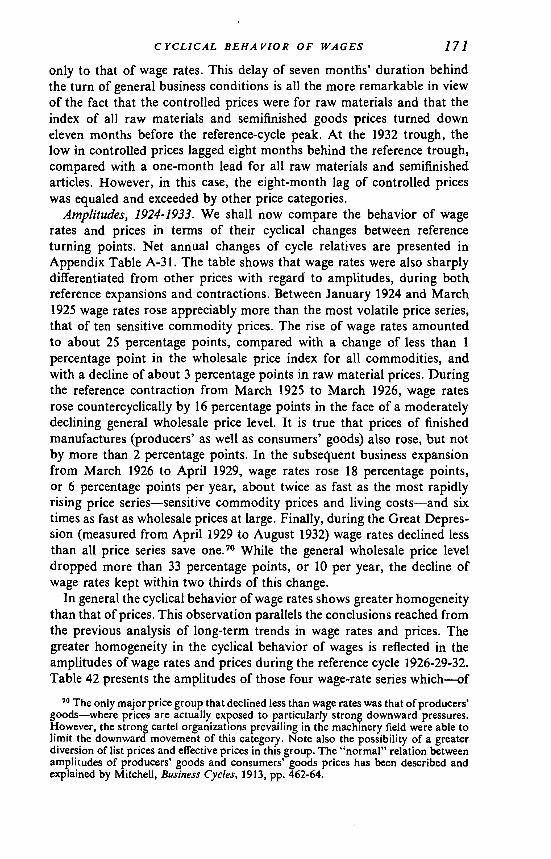
CYCLiCAL BEHAVIOR OF WAGES 171only to that of wage rates. This delay of seven months' duration behindthe turn of general business conditions is all the more remarkable in viewof the fact that the controlled prices were for raw materials and that theindex of all raw materials and semifinished goods prices turned downeleven months before the reference-cycle peak. At the 1932 trough, thelow in controlled prices lagged eight months behind the reference trough,compared with a one-month lead for all raw materials and semifinishedarticles. However, in this case, the eight-month lag of controlled priceswas equaled and exceeded by other price categories.
Amplitudes, 1924-1933. We shall now compare the behavior of wagerates and prices in terms of their cyclical changes between referenceturning points. Net annual changes of cycle relatives are presented inAppendix Table A-3 1. The table shows that wage rates were also sharplydifferentiated from other prices with regard to amplitudes, during bothreference expansions and contractions. Between January 1924 and March1925 wage rates rose appreciably more than the most volatile price series,that of ten sensitive commodity prices. The rise of wage rates amountedto about 25 percentage points, compared with a change of less than Ipercentage point in the wholesale price index for all commodities, andwith a decline of about 3 percentage points in raw material prices. Duringthe reference contraction from March 1925 to March 1926, wage ratesrose countercyclically by 16 percentage points in the face of a moderatelydeclining general wholesale price level. It is true that prices of finishedmanufactures (producers' as well as consumers' goods) also rose, but notby more than 2 percentage points. In the subsequent business expansionfrom March 1926 to April 1929, wage rates rose 18 percentage points,or 6 percentage points per year, about twice as fast as the most rapidlyrising price series—sensitive commodity prices and living costs—and sixtimes as fast as wholesale prices at large. Finally, during the Great Depres-sion (measured from April 1929 to August 1932) wage rates declined lessthan all price series save one.70 While the general wholesale price leveldropped more than 33 percentage points, or 10 per year, the decline ofwage rates kept within two thirds of this change.
In general the cyclical behavior of wage rates shows greater homogeneitythan that of prices. This observation parallels the conclusions reached fromthe previous analysis of long-term trends in wage rates and prices. Thegreater homogeneity in the cyclical behavior of wages is reflected in theamplitudes of wage rates and prices during the reference cycle 1926-29-32.Table 42 presents the amplitudes of those four wage-rate series which—of
The only major price group that declined less than wage rates was that of producers'goods—where prices are actually exposed to particularly strong downward pressures.However, the strong cartel organizations prevailing in the machinery field were able tolimit the downward movement of this category. Note also the possibility of a greaterdiversion of list prices and effective prices in this group. The "normal" relation betweenamplitudes of producers' goods and consumers' goods prices has been described andexplained by Mitchell, Business Cycles, 1913, pp. 462-64.

172 WAGES IN GERMANY
the seventeen reported industries—show the largest and the smallestincreases and decreases during the two reference phases. The table alsogives the amplitudes of several price series, selected to indicate the varia-tion in price behavior. It is readily apparent that variations in amplitudesas large as those observed in the selected price series did not occur in wagerates.7' This is not to say that in all segments of the price system andamong broad commodity groups price behavior is necessarily less homo-geneous than wage behavior. It can be shown, however, that, as in the caseof trends, the variations between different wage-rate series are of limitedrange. The extreme variations in cyclical behavior, which are frequently tobe found in prices, are never present in wage rates.72
TABLE 42Amplitudes of Selected Wage Rates and Prices, 1926-1932
CHANGE OF CYCLE
Expansion1926-29
RELATIVES DURING:
Contraction1 929-32
Wage RatesPapermakingBuildingBakingBrewing
+20+15+16+21
—17—31—15—12
Wholesale PricesRaw materials
SugarHides and skins
—11+12
+21—77
Agricultural productsVegetablesCattle
3+5
—11—58
Industrial materials and semi-manufactures
Lubricants —9 —4Rubber —124 —81Building materials
Industrial finished productsMachineryFurniture
+10
+6+11
—35
—10—40
souRcE: Wage rates, amplitudes computed from Appendix Table A-22.Prices, amplitudes computed from IKF Sonderheft 37, passim. For each commodity
group, those goods whose prices showed extreme variation during the indicated cyclephase were selected.
71 The above comparisons are based on wages for skilled workers only, but thesituation is not basically different for unskilled workers.
72 The differences between cyclical amplitudes in prices are due partly to trend factors,so that the great variability in cyclical behavior merely reflects that already found intrend behavior. But trend behavior cannot explain completely the differences in ampli-tudes, as we learn from a comparison of, say, sugar prices and hide prices, or offurniture prices and prices for industrial machinery. Here, amplitudes vary widelydespite similarity in trends. No attempt has been made to distinguish between trendelements and other elements in the apparent cyclical behavior of prices and wages.

CYCLICAL BEHAVIOR OF WAGES 173Wage Rates and Cost-Price Relationships. The deviation in the cyclical
behavior of wage rates from that of other prices must have had importantconsequences for the relationship of cost and finished-product prices,and ultimately for the profitability of manufacturing enterprises. Chart22 indicates the direction and extent of the resulting pressures. Prices forfinished manufactures started to decline in October 1928, while wage ratescontinued to rise or to maintain their level until December 1930. True,industrial raw material prices declined during the same interval. On theother hand, prices paid by manufacturers for producers' goods remainedvirtually stable, and volume of production declined considerably.Between the peak of finished product prices (October 1928) and the lastmonth of peak wage rates (P2, in December 1930) the percentage changesin the price, cost, and volume elements are shown below.73
Percentage Change betweenOctober 1928 and December
1930
Hourly wage rates +5Producers' goods prices —3Finished manufactured product prices —11Volume of industrial production —15Raw material and semifinished
productprices —18
The reported percentage changes can indicate the direction of certaincost-price pressures, but they cannot gauge their intensity or their effectson profitability. It should be remembered that the wage data themselvesare minimum rates, and that the prices and wages here discussed formonly a small portion of the elements that affect profitability. The mainten-ance of fixed and quasi-fixed costs may have had more impact on businessfortunes than the disparity between sales prices and such variable costelements as wage rates had.74 Furthermore, the volume of producers'goods purchased by manufacturers decreased sharply during the con-traction, so that the relatively high price level of these goods played aminor role in the total picture. Finally, the juxtaposition of finished goodsprices as "sales prices," and raw materials plus semifinished productprices as "costs," is a gross simplification. For manufacturing and mining,as a whole, semifinished goods and raw materials are the end products ofmany enterprises, and conversely, finished products enter many establish-ments in the form of equipment or components, that is, as a cost element.
This last reservation can be overcome, however. In a number ofThe total specific decline of prices for finished manufactures was 30 percent; for
raw materials 36 percent; for producers' goods only 19 percent; and the decline of wagerates was 22 percent.
Note that the percentage changes are here stated in the conventional way, i.e., theyare measured from the initial date. This suffices for the present discussion, since themeasures concern behavior during one contraction only. No direct comparisons areintended between amplitudes in expansion and contraction phases.
Profits, because of their residual character and small size relative to revenues, are,of course, highly sensitive to even slight changes in major cost items.

174
change
+250
+200
+150
+100
+ 80
+60+ 50+ 40+30+20+ 10
0
—10
—20
—30
—40
WAGES IN GERMANY
CHART 23
Wages, Prices, and Production, Seven Industries, 1924—1934
Clothing
1924 '26 '28 '30 '32 '34
Building
Papermaking
Wage roles
.....,
Metal Products
—50
'IWholesale prtces,
paper and products
c.:
Production
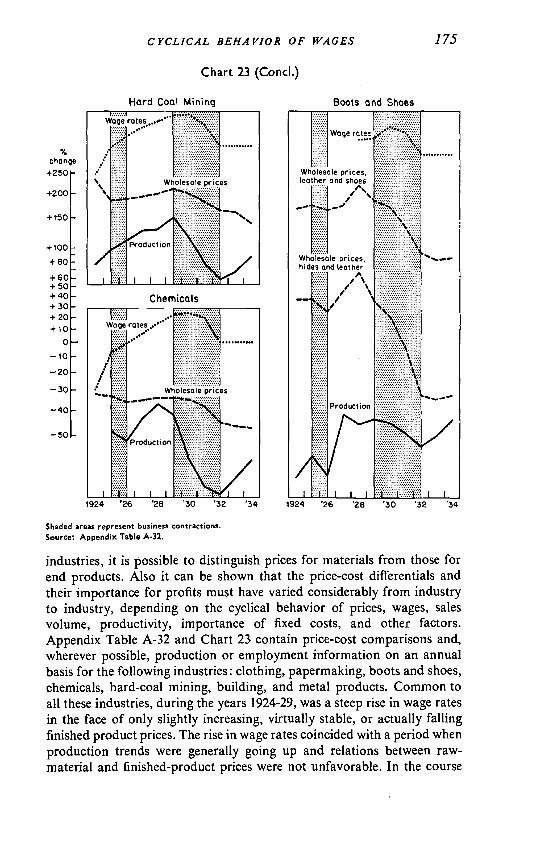
CYCLICAL BEHAVIOR OF WAGES
Chart 23 (Concl.)
175
change
+250 -
+200 -
+ 150 -
+ 100+80+60+50+40+30+20+ 10
0— to
—20
30
—40
—50
Hord Coal Mirt(nq Boots and Shoes
Shaded areas represent business contractions.Source: Appendix Table A-32.
industries, it is possible to distinguish prices for materials from those forend products. Also it can be shown that the price-cost differentials andtheir importance for profits must have varied considerably from industryto industry, depending on the cyclical behavior of prices, wages, salesvolume, productivity, importance of fixed costs, and other factors.Appendix Table A-32 and Chart 23 contain price-cost comparisons and,wherever possible, production or employment information on an annualbasis for the following industries: clothing, papermaking, boots and shoes,chemicals, hard-coal mining, building, and metal products. Common toall these industries, during the years 1924-29, was a steep rise in wage ratesin the face of only slightly increasing, virtually stable, or actually fallingfinished product prices. The rise in wage rates coincided with a period whenproduction trends were generally going up and relations between raw-material and finished-product prices were not unfavorable. In the course
1924 '26 '28 '30 '32 '34 1924 '26 '28 '30 '32 '34

176 WAGES IN GERMANY
of the Great Depression, prices of most finished products declinedpromptly, whereas in each industry wage rates reached their annualpeaks only in 1930.
From industry to industry we find considerable variation in price-cost-production patterns. In clothing, for instance, the production peak wasreached as early as 1927, in the hard-coal mining industry as late as 1929.Furthermore, while the basically competitive textile industry sufferedprice declines from 1928 on, the largely cartel-controlled metal productsindustry was able to maintain its controlled price levels until 1930. Ascompared with the great variety in the timing, amplitude, and pattern ofprices and production in each of the industries covered, the patterns ofwage rates were fairly similar. In the period 1924-29, wage rates wentup—whether finished-product prices were rising (metal products),falling (chemicals), or stable (paper). And wage rates continued their risethrough the year 1930, even where product prices had started to declineone, two, or three years earlier. All in all, during the postinflation periodo.f the Weimar Republic, wage rates exhibited rather autonomous patternswith a considerable degree of family resemblance among themselves butat best mild modifications (see Chart 23) in response to the varied pro-duction and price movements in different industries. The greater homo-geneity in behavior of wages as compared to prices may be traced to theexchangeability of skills, the thorough organization of the labor market,and last but not least, the effects of changes in living costs, which influencewage rates uniformly in all industries. By contrast, manufactured goodsare exchangeable only to a limited extent, are highly differentiated withregard to cyclical fluctuations, and their prices are commonly not affectedby considerations of the seller's welfare.
WAGE RATES AND LIVING COSTSPrior to World War I. As pointed out in Chapter 2, trends of consumers-
goods retail prices or cost-of-living indexes occupied an intermediateposition between wage rates and wholesale prices.75 This relation betweenthe three measures characterizes also their cyclical behavior, as can beseen from Chart 6. The chart shows, however, that cost-of-living, wage-rate,and wholesale-price cycles are not always in correspondence. The periodfrom 1871 to 1913, for instance, includes four specific cycles (increasesand decreases) in living costs compared with one specific cycle in wagerates. There is closer correspondence between cycles in living costs andwholesale prices and, in fact, between these two measures and general
The retail prices covered only food and rent, weighted approximately accordingto their importance for a typical worker's family. They are sometimes referred to as costof living, although they do not cover all such expenditures. Comparison of the Kuczynskiindex with other food-cost or living-cost indexes (Chart 7) shows that the similarity ofthe various measures is greater in their trend than in their cyclical behavior. Thus thecyclical movements of the Kuczynski index are less "confirmed" and may be regardedas only a rough approximation of living-cost behavior.
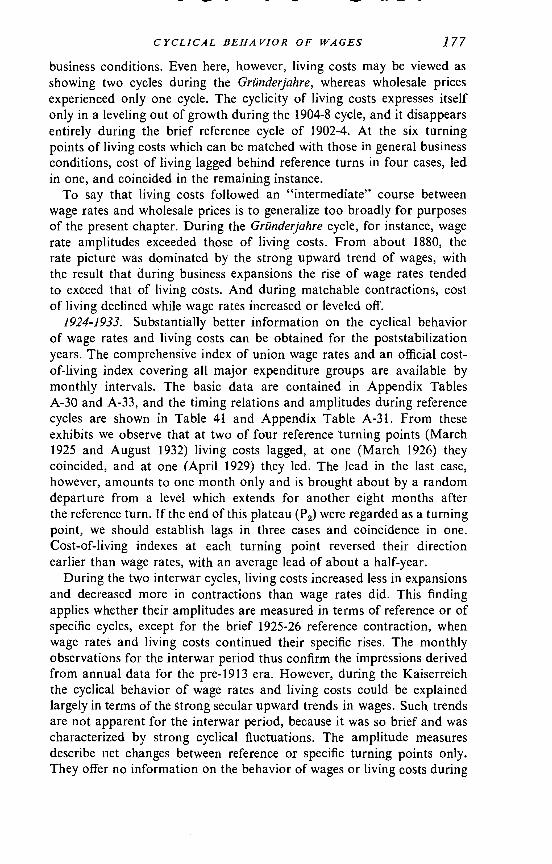
CYCLICAL BEHAVIOR OF WAGES 177business conditions. Even here, however, living costs may be viewed asshowing two cycles during the GrQnderjahre, whereas wholesale pricesexperienced only one cycle. The cyclicity of living costs expresses itselfonly in a leveling out of growth during the 1904-8 cycle, and it disappearsentirely during the brief reference cycle of 1902-4. At the six turningpoints of living costs which can be matched with those in general businessconditions, cost of living lagged behind reference turns in four cases, ledin one, and coincided in the remaining instance.
To say that living costs followed an "intermediate" course betweenwage rates and wholesale prices is to generalize too broadly for purposesof the present chapter. During the Grunder/ahre cycle, for instance, wagerate amplitudes exceeded those of living costs. From about 1880, therate picture was dominated by the strong upward trend of wages, withthe result that during business expansions the rise of wage rates tendedto exceed that of living costs. And during matchable contractions, costof living declined while wage rates increased or leveled off.
1924-1933. Substantially better information on the cyclical behaviorof wage rates and living costs can be obtained for the poststabilizationyears. The comprehensive index of union wage rates and an official cost-of-living index covering all major expenditure groups are available bymonthly intervals. The basic data are contained in Appendix TablesA-30 and A-33, and the timing relations and amplitudes during referencecycles are shown in Table 41 and Appendix Table A-3l. From theseexhibits we observe that at two of four reference turning points (March1925 and August 1932) living costs lagged, at one (March 1926) theycoincided, and at one (April 1929) they led. The lead in the last case,however, amounts to one month only and is brought about by a randomdeparture from a level which extends for another eight months afterthe reference turn, if the end of this plateau (P2) were regarded as a turningpoint, we should establish lags in three cases and coincidence in one.Cost-of-living indexes at each turning point reversed their directionearlier than wage rates, with an average lead of about a half-year.
During the two interwar cycles, living costs increased less in expansionsand decreased more in contractions than wage rates did. This findingapplies whether their amplitudes are measured in terms of reference or ofspecific cycles, except for the brief 1925-26 reference contraction, whenwage rates and living costs continued their specific rises. The monthlyobservations for the interwar period thus confirm the impressions derivedfrom annual data for the pre-1913 era. However, during the Ka.iserreichthe cyclical behavior of wage rates and living costs could be explainedlargely in terms of the strong secular upward trends in wages. Such trendsare not apparent for the interwar period, because it was so brief and wascharacterized by strong cyclical fluctuations. The amplitude measuresdescribe net changes between reference or specific turning points only.They offer no information on the behavior of wages or living costs during

178 WAGES IN GERMANY
intermediate cyclical stages. As Chart 22 shows, during the phase ofdrastic wage rate reduction, from the end of 1930 to the beginning of1932, wage rates actually declined more than cost of living.
Up to this point the investigation of cycles in wages and in living costshas been carried through in terms of comparative price behavior. Hencethe presentation has been restricted to living costs and wage rates proper.Still to be examined are the effects of the disparate cyclical movementsof wage rates and prices upon the purchasing power of wages—in otherwords, the cyclical behavior of "real wages."
Cycles in Real WagesREAL WAGES AND TURNING POINTS IN BUSINESS CYCLES
Real Wage CyclesBEFORE WORLD WAR I. The wage-price quotient, which gives us real
wages, cannot be expected to record changes in the total economic well-being of workers, since neither all working conditions nor all living-costelements find reflection in this measure. However, even the purchasingpower of the income at the worker's disposal is not adequately describedby real earnings. Income from other sources, changes in size of family,the employment and earning status of other family members all codeter-mine the volume of goods and services available to the individual wageearner. Although the changing purchasing power of average family incomeis probably the most adequate gauge of economic well-being, it is difficult,from the data at hand, to make a close measurement.7° The present aim,therefore, is to follow the course of money and real wages of employedworkers, and only incidentally to consider other determinants of theireconomic welfare. Thus, the following real-wage analysis will deal primarilywith cyclical fluctuations in the purchasing power of rates and earningsof employed workers.
Hourly real rates of building and printing workers are presented inAppendix Tables A-12 and Chart 8. The outstanding feature here is therelatively high inverse conformity to business cycles. Particularly duringthe long cycles in the nineteenth century, specific cycles in real rates forbuilding and printing can be matched fairly easily with business cyclesat large. But the real-rate declines (or pauses in growth) occur for themost part during expansions in general business activity, and the real-rateincreases during business cycle contractions. For printing rates, thecyclical character of real wages is more pronounced than that of moneywages. The apparent inverse conformity as well as the more pronouncedcyclical swings of these real-wage series must be explained by the com-bination of two sets of facts. First, money wage rates during the years
Jurgen Kuczynski's "real net wages" represent an attempt to estimate per capitaworking-class income of both employed and unemployed. This estimate is, of course,only indirectly related to the concept of average family income. See, for instance, hisGermany, 1800 to the Present Day, pp. 133-38.

CYCLICAL BEHAVIOR OF WAGES 1791872-82 showed long lags and thus moved counter to general businessfluctuations. 1n subsequent years they increased in expansions but showedlittle or no decline in contractions. Second, during business contractions,living costs tended actually to decline in the face of slightly rising or stablerates. The result is the inverse conformity we have observed.
TABLE 43Effective Hourly Real Wage Rates, Four Industries, 1886-1903
(1890-1899 = 100)
Year Building Machinery Printing Wood
Average,Four
Industries
1886188718881889
93939193
86888891
...
...9088
...
...
...93
90919091
18901891189218931894
9594959797
9997959595
9089949798
9389929499
9492949697
18951896189718981899
100104104105107
101107101102105
103106109.105107
99108107107109
101106105105107
1900190119021903
110111109113
109106103108
108108112117
117119118120
111111111114
SOURCE: Based on wage rates (actually paid rates, taken from payroll records) fromTable 33, and on cost of living from Appendix Table A-il.
In view of the striking character of the finding that contractions inbusiness activity tended to bring about improved real rates (and thatprosperity brought declines in these rates), further evidence should beadduced. Accordingly, real wage rates for building, machinery, printing,and woodworking were computed (see Table 43 and Chart 24). The bas.icmoney rates, unlike the long-term series at our disposal, were ascertaineddirectly from factory payrolls. From them we learn that the real rates inthe machinery industry rose during business expansions and declinedduring contractions. In the other industries real wage rates tended to riseduring both expansions and contractions of business. The rise duringexpansions, however, was considerably larger than during contractions.Thus, the evidence examined for this particular period does not confirmthe inverse relation shown by the longer series on nominal rates in building

180
- -
WAGES IN GERMANY
CHART 24
Effective Hourly Real Wage Rates, Four Industries, 1886—1903
and printing. Nevertheless, insofar as our evidence goes, a decline inreal wage rates during business contractions does not appear to be typicalof the cycles before World War I.
Positive conformity of wages to business cycles before World War Iis more clearly apparent in the case of earnings. Appendix Table A-12and Chart 8 record real shift earnings of underground and surface minersin Dortmund's hard coal mines, and earning averages for ten coal, ore, andsalt mining districts. A high degree of positive conformity emerges fromthese data. The only elements preventing technically "perfect" conformityôonsist in the occasional skipping of brief mild cycles, such as that from1902 to 1904. Conformity of this high order is not, however, to be foundin other real earnings series. Appendix Table A-12 shows that the specificcycles in average daily real earnings of Krupp metals' workers and ofrailroad workers did not correspond in any regular fashion to the fluctua-tions in general business conditions. .I.n some cases where the money-wage decline was sharp, it appears also in real wages (see, for instance,
Index (1890-99 100) Index
Shaded areas represent business contractions.Suurce: Table 43.

- w - — -
CYCLICAL BEHAVIOR OF WAGES 181
the 1875-80 and 1900-1902 declines in Krupp earnings). But in most casesthe pre-1913 fluctuations in money earnings were mild, and often com-pensated or even overcompensated by changes in living costs.
INTERWAR CYCLES. Broad annual indexes of hourly real rates, andhourly and weekly real earnings, are computed in Appendix Table A-13and presented graphically in Chart 9. On these indexes we may make thefollowing observations: The 1925-26 contraction is skipped by all theannual real wage measures. The subsequent cycle, embracing the Weimarperiod of prosperity and depression, is clearly reflected in all series. Duringthe Great Depression, hourly and weekly real earnings showed actualdeclines. There was a net increase between 1929 and 1932 in hourly realrates, but the gain was considerably smaller than that experienced in thepreceding reference expansion, and it occurred despite a specific declineafter 1931. To the extent that cycle phases can be matched, we find positiveconformity of real wage cycles and business cycles, and no evidence atall of an inverse relationship.
Hourly real union rates, by months, are derived in Table 44 anddepicted in Chart 14. During the reference contraction of March 1925 to
TABLE 44Hourly Real Union Rates, by Months, 1924-1933
(1928 = 100)
1924 1925 1926 1927 1928 1929 1930 1931 1932 1933
MonthJan. 65.9 79.8 92.9 91.3 96.1 101.9 106.6 114.7 107.6 108.9Feb. 68.5 80.5 93.7 91.0 96.5 101.3 107.4 114.6 109.9 109.5Mar. 66.8 82.4 94.1 92.1 97.2 100.4 108.7 114.5 110.0 109.3Apr. 69.6 84.1 93.4 93.1 99.6 102.9 109.8 112.7 110.9 109.4May 73.7 86.8 93.3 96.1 101.6 104.8 110.4 112.2 108.8 107.9June 79.1 87.1 92.6 95.9 101.1 105.2 110.0 111.6 107.4 107.3
July 78.0 85.4 91.7 94.5 100.6 104.6 108.8 111.7 107.0 107.3Aug. 78.3 86.3 91.7 96.7 100.5 104.9 109.0 113.4 1.08.0 107.5Sept. 76.9 87.2 92.9 96.4 101.0 105.0 110.3 113.8 107.9 106.9Oct. 75.0 88.8 92.7 95.6 101.9 105.0 111.4 113.8 107.8 106.1Nov. 76.8 91.3 91.8 95.8 101.9 105.1 112.7 114.0 107.9 105.4Dec. 78.8 91.6 91.5 95.4 101.9 105.7 114.1 114.6 108.1 105.0
Average 73.9 85.9 92.7 94.5 100.0 103.9 109.9 113.5 108.4 107.5
SOURCE: Based on wage rates from Table 34 and cost of living as given in AppendixTable A-33, (shifted to 1928 = 100).
March 1926, and during most of the Great Depression, real wage ratesdid not decline. Nevertheless real wage rates may be regarded as conform-ing positively to the general business cycle. This statement assumesmatching of the wage declines beginning March 1926 and April 1931(or January 1932) with the proximate business contraction, despite the
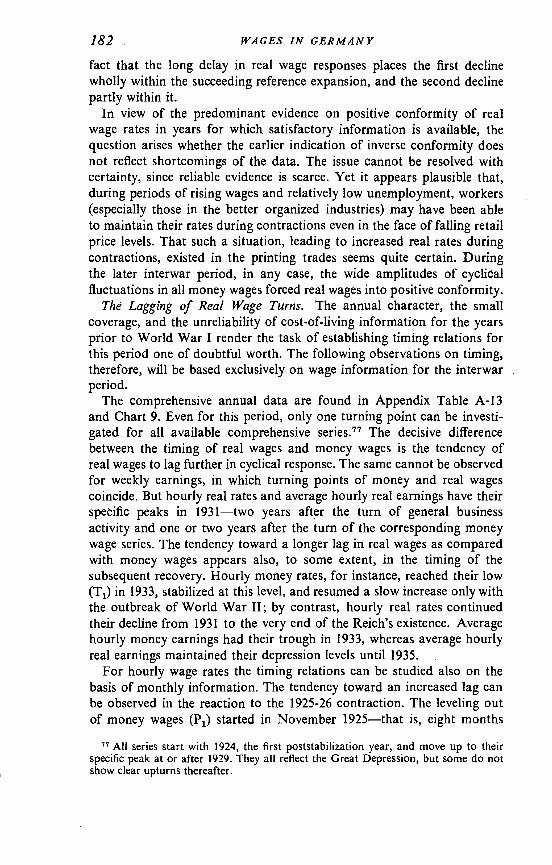
182 WAGES IN GERMANY
fact that the long delay in real wage responses places the first declinewholly within the succeeding reference expansion, and the second declinepartly within it.
In view of the predominant evidence on positive conformity of realwage rates in years for which satisfactory information is available, thequestion arises whether the earlier indication of inverse conformity doesnot reflect shortcomings of the data. The issue cannot be resolved withcertainty, since reliable evidence is scarce. Yet it appears plausible that,during periods of rising wages and relatively low unemployment, workers(especially those in the better organized industries) may have been ableto maintain their rates during contractions even in the face of falling retailprice levels. That such a situation, leading to increased real rates duringcontractions, existed in the printing trades seems quite certain. Duringthe later interwar period, in any case, the wide amplitudes of cyclicalfluctuations in all money wages forced real wages into positive conformity.
The Lagging of Real Wage Turns. The annual character, the smallcoverage, and the unreliability of cost-of-living information for the yearsprior to World War I render the task of establishing timing relations forthis period one of doubtful worth. The following observations on timing,therefore, will be based exclusively on wage information for the interwarperiod.
The comprehensive annual data are found in Appendix Table A-13and Chart 9. Even for this period, only one turning point can be investi-gated for all available comprehensive series.77 The decisive differencebetween the timing of real wages and money wages is the tendency ofreal wages to lag further in cyclical response. The same cannot be observedfor weekly earnings, in which turning points of money and real wagescoincide. But hourly real rates and average hourly real earnings have theirspecific peaks in 1931—two years after the turn of general businessactivity and one or two years after the turn of the corresponding moneywage series. The tendency toward a longer lag in real wages as comparedwith money wages appears also, to some extent, in the timing of thesubsequent recovery. Hourly money rates, for instance, reached their low(T1) in 1933, stabilized at this level, and resumed a slow increase only withthe outbreak of World War II; by contrast, hourly real rates continuedtheir decline from 1931 to the very end of the Reich's existence. Averagehourly money earnings had their trough in 1933, whereas average hourlyreal earnings maintained their depression levels until 1935.
For hourly wage rates the timing relations can be studied also on thebasis of monthly information. The tendency toward an increased lag canbe observed in the reaction to the 1925-26 contraction. The leveling outof money wages (P1) started in November 1925—that is, eight months
" All series start with 1924, the first poststabilization year, and move up to theirspecific peak at or after 1929. They all reflect the Great Depression, but some do notshow clear upturns thereafter.

- _ S — — —
CYCLICAL BEHAVIOR OF WAGES 183
after the reference peak. The upper turning point of real rates, on the otherhand, occurred in March 1926—that is, twelve months after the referencepeak and in fact coincided with the reference trough. The subsequentspecific recovery came in February 1927, both for money78 and for realrates. The coincidence is brought about by the sharp steplike upswing inmoney rates. The long lag in real rates appears most clearly in the responseof wage rates to the onset of the Great Depression. While at that pointthe lag in money rates extended to thirteen or twenty months, the lag inreal rates lasted twenty-one, twenty-three, or even thirty-two months—depending upon the determination of the peak.79 Chart 14 shows how,during the year 1931, money rates experienced significant declines whilereal rates continued, with minor fluctuations, to hover close to their peakposition until the very end of the year.
Shift earnings of coal miners provide us with material for a quarterlycomparison of money and real wages, as presented in Appendix TablesA-25 and A-34, and Charts 16 and 25. In the Great Depression, realearnings of hard-coal miners turned upward three to six quarters laterthan the corresponding money wages. At various dates in 1931, strongcuts in miners' money wages caused temporary declines of real wages.However, the stabilization or slow recovery of money wages by thefirst quarter of 1932—in the face of further declines in cost of living—brought about renewed increases in real earnings in all four series up tothe first quarter of 1933. At that.time cost of living began to rise and—inconnection with the government's policy of wage stabilization—led toa leveling-out or slow decline in miners' real earnings.80
AMPLITUDES OF REAL WAGESGenerally amplitudes of real wages are smaller than those of money wages.This is true of rates as well as earnings, and of reference as well as specificcycles. The extent of the difference is described in this section, which againwill be based mainly on data covering the interwar years 1924-33, andonly occasionally on some earlier or later evidence.
For the broad annual indexes of hourly wage rates and of hourly andweekly earnings, amplitudes of money wages and real wages duringreference expansions and contractions are shown in Table 45. During allreference cycle phases and for each wage type, real wages fluctuated lessthan money wages. This is owing, of course, to the positive conformity andgood timing correspondence of cost-of-living changes with fluctuations
78 The end of the plateau in money wages was considered as a lower turn (T2).The peak could be chosen at the beginning of the plateau (P1, January 1930)
or at the end (P2, March 1931), or even at the alternate peak in December 1931.80 There are basically similar relationships between quarterly money-wage rates and
real-wage rates in German coal mines. The resemblance of rates and earnings cycles incoal mining was demonstrated in Chart 16. Hard coal miners' rates forma plateau rather than a clear peak. The lags of real wages behind the initial edges (P1)of the money-wage plateaus were eight quarters, those behind the terminal edges(P2) three quarters.
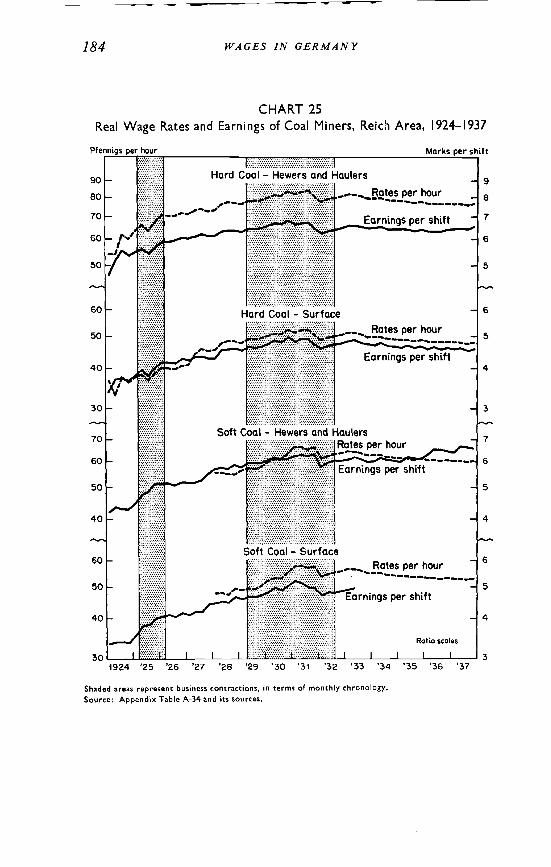
184 WAGES IN GERMANY
CHART 25
Real Wage Rates and Earnings of Coal Miners, Reich Area, 1924—1937
1924 '25 '26 '27 '28 '29 '30 '31 '32 '33 '34 '35 '36 '37
Shaded areas represent business contractions, in terms of monthly chronology.Appendix Table A-34 and its sources.
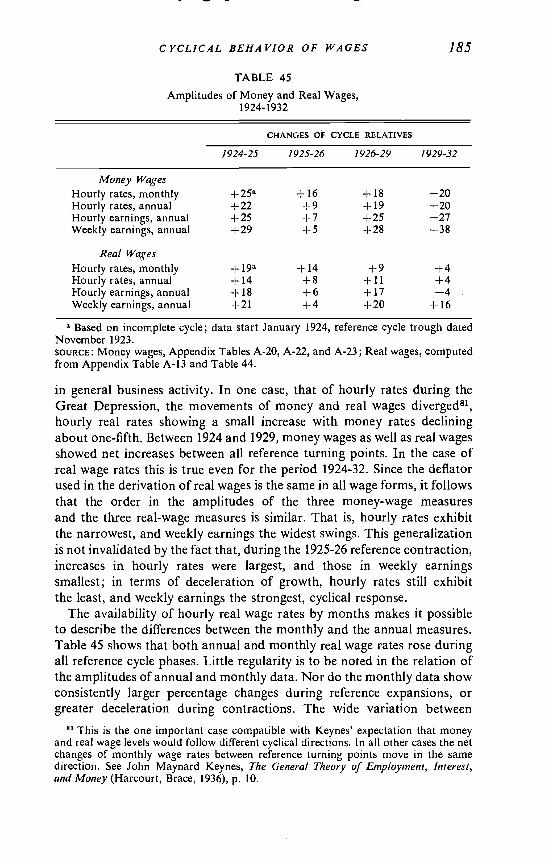
CYCLICAL BEHAVIOR OF WAGES 185
TABLE 45
Amplitudes of Money and Real Wages,1924-1932
CHANGES OF CYCLE RELATIVES
1924-25 1925-26 1926-29 1929-32
Money WagesHourly rates, monthly +25a + 16 + 18 —20Hourly rates, annual +22 ±9 +19 —20Hourly earnings, annual +25 +7 +25 —27Weekly earnings, annual +29 +5 +28 —38
Real WagesHourly rates, monthly +14 +9 +4Hourly rates, annual +14 +8 +11 +4Hourly earnings, annual +18 +6 +17 —4 .
Weekly earnings, annual +21 +4 +20 +16a Based on incomplete cycle; data start January 1924, reference cycle trough dated
November 1923.SOURCE: Money wages, Appendix Tables A-20, A-22, and A-23; Real wages, computedfrom Appendix Table A-13 and Table 44.
in general business activity. In one case, that of hourly rates during theGreat Depression, the movements of money and real wages diverged81,hourly real rates showing a small increase with money rates decliningabout one-fifth. Between 1924 and 1929, money wages as well as real wagesshowed net increases between all reference turning points. In the case ofreal wage rates this is true even for the period 1924-32. Since the deflatorused in the derivation of real wages is the same in all wage forms, it followsthat the order in the amplitudes of the three money-wage measuresand the three real-wage measures is similar. That is, hourly rates exhibitthe narrowest, and weekly earnings the widest swings. This generalizationis not invalidated by the fact that, during the 1925-26 reference contraction,increases in hourly rates were largest, and those in weekly earningssmallest; in terms of deceleration of growth, hourly rates still exhibitthe least, and weekly earnings the strongest, cyclical response.
The availability of hourly real wage rates by months makes it possibleto describe the differences between the monthly and the annual measures.Table 45 shows that both annual and monthly real wage rates rose duringall reference cycle phases. Little regularity is to be noted in the relation ofthe amplitudes of annual and monthly data. Nor do the monthly data showconsistently larger percentage changes during reference expansions, orgreater deceleration during contractions. The wide variation between
81 This is the one important case compatible with Keynes' expectation that moneyand real wage levels would follow different cyclical directions. In all other cases the netchanges of monthly wage rates between reference turning points move in the samedirection. See John Maynard Keynes, The General Theory of Employment, Interest,and Money (Harcourt, Brace, 1936), p. 10.
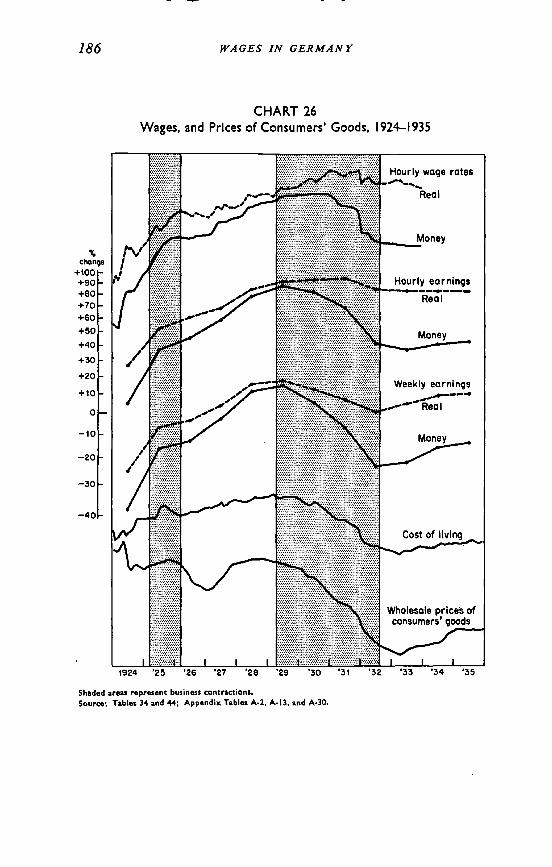
change+100+90+80+70+60+50+40
+30
+20
+10
0
—10
—20
—30
CHART 26Wages, and Prices of Consumers' Goods, 1924—1935
186 WAGES IN GERMANY
—40
Shaded areas represent business contractions.Source: Tables 34 and 4-4, Appendix Tables A-2, A-13, and A.30.
'31

CYCLICAL BEHAVIOR OF WAGES 187monthly and annual reference turns and the substantial lags of real ratesare responsible for this irregularity. The table serves to emphasize thepossibility of large and unpredictable differences among cyclical amplitudesderived from annual and monthly data.
Money Wages and Real Wages duringthe Great Depression
The cyclical behavior of money wages, the fluctuations of prices and livingcosts, and the resultant changes in real wages have been treated in somedetail. It is desirable now to review the interplay of these trends as itunfolds in the course of the business cycle. To this end we shall analyzelabor market conditions and wage behavior during the Great Depression,a period for which the salient cyclical changes can be examined on thebasis of fairly abundant data. Charts 26 and 27 provide a synopsis of themajor labor-market and wage developments throughout the years 1924-35.It will be observed that average earnings must be appraised on the basisof annual information.
According to the chronology established by the National Bureau, theturning point marking the onset of the Great Depression for the Germaneconomy occurred in April, 1929. But long before that date, changes inlabor market conditions and price levels occurred that had a decisivebearing on wage developments. The number of unemployed workersregistered at employment exchanges, for instance, started to increasefrom the autumn of 1927. This early increase cannot be regarded as entirely"cyclical"; it is to be traced at least in part to the widespread introductionof laborsaving devices in the course of the "rationalization" of Germanindustry.82 On the other hand, the unemployment resulting from therationalization had consequences for the labor market as well as forconsumers' goods markets, and constitutes an important aspect of thedepression, In October 1928, consumers' goods prices at wholesale beganto fall. This drop was related to the widespread—indeed international—decline in agricultural and other raw-material prices, but it also reflectedthe limited capacity of the German consumers' goods market, whichshrank still more with the spread of unemployment. Whatever the causesof the cyclical turn in these prices, the effects of their decline on livingcosts appeared soon: consumers' prices at retail, as measured by the cost-of-living index, stopped their rise in March 1929, and up to the end of thatyear moved on a plateau slightly lower than their peak levels. A peak ridgeof brief duration was reached also by employment during that year.Aggregate employment, seasonally adjusted, attained peak levels aboutApril or May 1929, and almost maintained them until August—that is,
82 National Industrial Conference Board, of German Industry (NewYork, 1931). See particularly the tables on pp. 172-75, for data on increasing outputper worker.
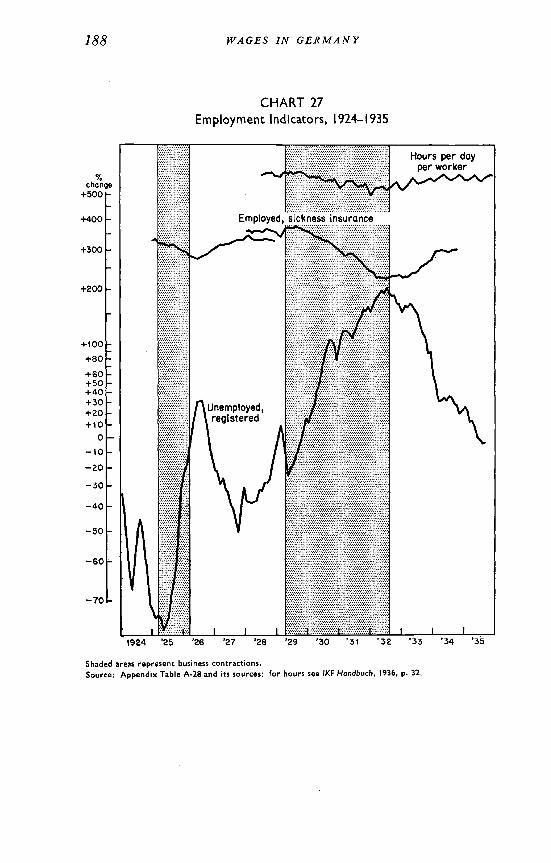
188
0/
change+500 -
+400 -
+300
+200
+ 100
+80
+ 60+50+40+30+ 20+10
0
—10
—20
—30
—40
—50
—60
—70
WAGES iN GERMANY
CHART 27
Employment Indicators, 1924—1935
Shaded areas represent business contractions.Source: Appendix Table A-28 and its sources: for hours see IKF Handbuch, 1936, p. 32.
1 '32 '33 '34

C YCLICAL BEHA VIOR OF WAGES 189for about four months after the date selected as the reference turningpoint. Average hours worked per worker per day reached their peak levelat the month of the reference turn (April) and maintained it for a consider-able time, in fact, until November of that year. Thus it was possible that,up to the fall of 1929, total labor input, in hours, held up relatively well,although registered unemployment (excluding its seasonal component)came close to two million workers.
The cyclical reaction of wages to deteriorating labor market conditionsoccurred first in earnings. The date of this reaction cannot be determinedprecisely. We know that, on an annual basis, average weekly and hourlymoney earnings as well as weekly real earnings reached their peak in1929, but we have to guess at their intra-annual movements. Quarterlyshift earnings in coal mines reached their peak in the fourth quarter of theyear, together with a peak in coal output and employment. This makes itappear plausible that earnings for industry as a whole also reached theirpeak together with employment and average hours—that is, decidedlyafter the reference turn and probably during the latter part of the year.Throughout 1929 wage rates kept rising, with the most conspicuous thoughsmall upward step occurring after the reference contraction had set in.
After 1929, average weekly earnings decreased drastically and con-tinuously. Between the years 1929 and 1932, the decline was 33 percentof the peak level, or 11 percentage points sharper than that of living costs.Consequently, average weekly real earnings declined also throughoutthe reference contraction, although, of course, at a lesser rate than moneyearnings. The situation was somewhat different in the case of averagehourly earnings. The decline of the latter was milder between 1929 and1931 than the drop in living costs, so that hourly real earnings continuedto rise throughout these years. The mild decline in wage rates contributed,of course, to the situation, Between 1931 and 1932 the revisions in ratesand the reductions in average hours worked per employed worker alsoforced average weekly real earnings into a cyclical decline.
Wage rates, as set down in collective agreements, were the last to giveway to labor-market pressures. On an annual basis, money wage ratescontinued to climb up to 1930; on a monthly basis, they maintained peakplateau levels to the end of that year. It is known that during 1930 therewas a systematic reduction of voluntary payments in excess of union rates,and that this reduction is not reflected in the published minima. But thelabor-cost savings derived in that manner were rather limited, and by theend of the year there were already strong pressures toward the reduction ofthe wage minima themselves. The force of these pressures may be deducedfrom the following facts: by December of 1930 unemployment had mountedto 34 percent of all union members, and part-time unemployment to 21percent. Employment had dropped 10 percent from peak levels, averagehours worked per day 8 percent, and industrial production 11 percent.On the other hand, the reduction of living costs, coupled with the mild

190 WAGES IN GERMANY
rises or stability of money wage rates, had brought about an increase inreal wage rates of 11 percent since the reference turn of April 1929.Thus, by the end of 1930, the need for cost cutting had become acute;there was little possibility of cutting labor costs further by reducingpayments above minimum rates; growing unemployment had seriouslyweakened the competitive position of the workers; and the decline inliving costs had mitigated the effect of rate cuts upon real income.
Only as a joint effect of these circumstances, aided by the pressure ofcompulsory arbitration awards, were minimum wage rates finally forceddown. In this connection, let it be restated that their total decline duringthe year 1931 amounted to 8 percent. The fourth emergency decree ofDecember 1931 brought a sizable downward adjustment in rates (10percent). The decline of money wage rates continued throughout 1932,and in fact into the spring of 1933. During that phase, living costs werereduced also. The respective net declines of wage rates and living costs inthe course of 1931 were about equal, with the consequence that hourly realwage rates in December 1931 returned (after a temporary drop) to thepeak level they had reached during the first quarter of that year. Thecut by emergency decree in the money wage rate and the subsequentadjustments finally forced real rates down too, but their total decline,until the advent of National Socialism, amounted only to 10 percent.
In the course of the year 1932 there were some signs of revival in theeconomy at large, and in the labor market in particular. Average hoursworked picked up first, near the beginning of the year. About the middleof the year, employment (after allowance for seasonal factors) began torise, registered unemployment passed its peak, and industrial outputstarted to recover. Within the labor market the turn in cyclical fortuneswas clearly observable. Reference revival is dated by the National Bureauat August 1932. On an annual basis, the recovery immediately pulled upweekly money and real earnings, and because of the continuing declinein living costs, the recovery of real earnings was even greater than that ofmoney earnings. Hourly money earnings reached their low in 1933, androse slowly thereafter. Hourly real earnings, which also declined to a lowin 1933, maintained their trough levels through 1936. The reason for thelate turn of hourly wages is found in the continued decline of rates, whilethe flat-bottomed trough of hourly real earnings is to be explained by therise of consumers' goods prices and living costs from April 1933 on. Asat the onset of the Great Depression, wage rates were the last to respondto changing business conditions. Trough levels were reached in March1933, and maintained for many years. The concomitant increase in livingcosts led to twelve years of real rate decline. After March 1933, however,wage changes were controlled by National Socialist economic policies.Since they do not illustrate normal cyclical conditions, they will beconsidered separately in the following chapter, which is devoted to wagebehavior during unusual episodes in the Reich's history.