cuyahoga falls retail market study falls, ohio market study 3. gibbs planning group, inc. 12 january...
TRANSCRIPT

Cuyahoga Falls
Retail Market Analysis Cuyahoga Falls, Ohio
Prepared for: City of Cuyahoga Falls
Prepared by:
Gibbs Planning Group
12 January 2016

TABLE OF CONTENTS
INTRODUCTION .................................................................................................................. 1
Executive Summary ............................................................................................................. 1
Background .......................................................................................................................... 5
Methodology ......................................................................................................................... 6
Trade Area ........................................................................................................................... 7
Demographic Characteristics ............................................................................................... 10
Tapestry Lifestyles ............................................................................................................... 11
Employment Base ................................................................................................................ 15
TRADE AREA CHARACTERISTICS ................................................................................... 17
Location ................................................................................................................................ 17
Access .................................................................................................................................. 18
Other Shopping Areas .......................................................................................................... 19
Regional Shopping Centers .................................................................................................. 21
Lifestyle Shopping Centers ................................................................................................... 22
Community & Neighborhood Centers ................................................................................... 23
SUMMARY OF FINDINGS .................................................................................................... 26
2016 & 2021 Supportable Retail Table ................................................................................. 27
Retail Category Definitions ................................................................................................... 28
Shopping Center Definitions ................................................................................................. 30
Rationale ............................................................................................................................... 31
Limits of Study ....................................................................................................................... 32
APPENDIX ............................................................................................................................ 33
Exhibit A: Primary Trade Area Business Summary .............................................................. 33
Exhibit B: Primary Trade Area Community Profile ................................................................ 35
Exhibit C: Primary Trade Area Housing Profile .................................................................... 41
Exhibit D: Primary Trade Area Dominant Tapestry Map and Descriptions ........................... 43
Exhibit E: 2016-2021 Annual Growth Rate Map ................................................................... 46
Exhibit F: 2016 Median Household Income Map .................................................................. 47
Exhibit G: 2016 Average Household Income Map ................................................................ 48
Exhibit H: 2021 Median Household Income Map .................................................................. 49
Exhibit I: 2021 Average Household Income Map .................................................................. 50
Exhibit J: 2016 Median Home Value Map ............................................................................. 51
Exhibit K: 2021 Median Home Value Map ............................................................................ 52
Exhibit L: 2016 Percent of Family Households Map ............................................................. 53
Exhibit M: 2016 Total Employees Map ................................................................................. 54
Exhibit N: Population Density Map ....................................................................................... 55


Cuyahoga Falls, Ohio Market Study 3. Gibbs Planning Group, Inc. 12 January 2016
INTRODUCTION
Figure 1: Aerial photo of the Cuyahoga Falls study area and surrounding neighborhoods.
Executive Summary
This study finds that re-opening downtown Cuyahoga Falls to automobile traffic would likely enable
the study area (outlined in Figure 1) to support an additional 215,350 square feet (sf) of retail and
restaurant development, generating over $60.4 million in new sales. By 2021, continued
development in the study area and household income growth could increase potential sales to
$65.9 million. The demand could partially be absorbed by existing businesses and/or with the
opening of 95 to 115 new restaurants and stores.
Filling existing vacancies and new development in the study area can provide needed goods and
services for the existing surrounding consumer base of nearby residents, employees and visitors.
Furthermore, attracting a critical mass of retailers and restaurants downtown can reestablish the
historic commercial, social and civic functions to the core of Cuyahoga Falls.

4. Cuyahoga Falls, Ohio Market Study Gibbs Planning Group, Inc.
12 January 2016
Apart from the limited appeal of downtown Akron, Cuyahoga Falls residents must drive seven to
eight miles to neighboring communities for an urban shopping experience, creating a captive
audience of consumers to support existing and future retailers. The leading categories of
supportable retail growth are restaurants, department store merchandise, apparel and gifts.
At present, the City of Cuyahoga Falls is exploring options for returning car traffic to downtown.
The pedestrian mall was opened in the early 1980s and has experienced limited success over the
past 35 years; very few retailers exist in the mall and rents are less than 50 percent of the area
median. For optimal success, the pedestrian mall should be opened to two-way traffic, with
metered on-street parallel parking, wider sidewalks on the east side of the street for increased
daylighting, and attractive landscaping, site furnishings, lighting and wayfinding. High standards
for façades, window displays and signage are imperative. Tenants should be a well-balanced
collection of restaurants and retailers represented by local, regional and national operators.
Table 1: 2016 Supportable Retail*
Retail Category Est. 2016
Supportable SF Est. 2016
Retail Sales Number of Stores
Retail
Apparel & Shoe Stores 24,320 sf $5,778,200 17 - 19
Book & Music Stores 3,560 sf $729,800 1 - 2
Department Store Merchandise 30,110 sf $9,635,200 9 - 10
Electronics & Appliance Stores 7,420 sf $2,337,300 5 - 6
Furniture & Home Furnishings Stores 11,740 sf $2,936,500 4 - 6
General Merchandise Stores 11,060 sf $3,262,700 5 - 6
Hardware & Garden Supply Stores 13,290 sf $2,995,650 3 - 5
Jewelry Stores 2,530 sf $822,250 2 - 3
Miscellaneous Store Retailers 7,900 sf $1,745,700 5 - 7
Office Supplies & Gift Stores 16,290 sf $4,316,850 11 - 12
Pharmacy 4,690 sf $1,852,550 1
Specialty Food & Drink Stores 8,370 sf $2,417,000 4 - 5
Sporting Goods & Hobby Stores 8,870 sf $2,040,100 3 - 4
Retail Totals 150,150 sf $40,869,800 70 - 86
Restaurants
Bars, Breweries & Pubs 9,040 sf $2,938,000 3 - 4
Full-Service Restaurants 17,070 sf $5,889,150 4 - 5
Limited-Service Restaurants 30,090 sf $8,575,650 13 - 14
Specialty Food Stores 9,000 sf $2,205,000 5 - 6
Restaurant Totals 65,200 sf $19,607,800 25 - 29
Retail & Restaurant Totals 215,350 sf $60,477,600 95 - 115
* Above demand could be supported in 2016 if the pedestrian mall were opened to traffic.
This study further finds that the downtown Cuyahoga Falls primary trade area has a population of
102,200 persons, increasing under current trends to 102,300 persons by 2021. The projected
annual growth rate is 0.02 percent. Median household income in the primary trade area is
$49,100, which is similar to state and national averages and expected to grow by 2.64 percent
annually, to $55,900 by 2021. Housing favors owner-occupied units, which comprise 53.7 percent
of all housing, compared to 37.9 percent renter-occupied households; the vacancy rate is 8.4
percent. The primary trade area has a labor base of 46,500 employees.

Cuyahoga Falls, Ohio Market Study 5. Gibbs Planning Group, Inc. 12 January 2016
Figure 2: Cuyahoga Falls borders Akron and is within 10 miles of I-80 to the north and five miles of I-76 to the south.
Background
Gibbs Planning Group, Inc. (GPG) has been retained by the city of Cuyahoga Falls to conduct a
retail feasibility analysis for downtown Cuyahoga Falls, South Front Street and a redevelopment
site in Summit County, Ohio. The 100-acre study area is anchored by a two-and-a-half block
pedestrian mall (downtown) which was closed to vehicle traffic in 1978, and at present is
practically devoid of any retail businesses. The majority of new development has occurred on five
blocks of Front Street south of the pedestrian mall. Furthermore, this study considers the adjacent
Schwebel’s property, which currently houses the bread-making operations of Schwebel’s Baking
Company but may accommodate mixed-use development in the future. The study area borders
the Cuyahoga River and Route 8.
The city of Cuyahoga Falls is presently engaged in a master planning process to evaluate
reopening the pedestrian mall to vehicular traffic and adding on-street parking. Four alternatives
have been created and public input is being solicited. Following the acceptance of a preferred
alternative, the city will have to fund the project and most existing buildings will require renovation
and façade improvements before the downtown is re-established as a vibrant mixed-use
environment.

6. Cuyahoga Falls, Ohio Market Study Gibbs Planning Group, Inc.
12 January 2016
Figure 3: Downtown Cuyahoga Falls contains little retail and shoppers are scarce. Some customers (illegally) drive
through the pedestrian mall to more conveniently reach their destination.
GPG addressed the following issues in this study:
What is the existing and planned retail market in the study and trade area?
What is the primary trade area for downtown Cuyahoga Falls?
What are the population, demographic and lifestyle characteristics in the primary trade
area, currently and projected for 2021?
What is the current and projected growth for retail expenditures in the primary trade area,
now and for the next five years?
How much additional retail square footage is supportable in the Cuyahoga Falls study
area and what retail uses should be encouraged? What sales volumes can development
achieve in or near the study area?
Methodology
To address the above issues, GPG defined a trade area that would serve the retail in the study
area based on geographic and topographic considerations, traffic access/flow in the area, relative
retail strengths and weaknesses of the competition, concentrations of daytime employment and
the retail gravitation in the market, as well as our experience defining trade areas for similar
markets. Population, consumer expenditure and demographic characteristics of trade area
residents were collected by census tracts from the U.S. Bureau of the Census, U.S. Bureau of
Labor Statistics and Esri (Environmental Systems Research Institute).
Finally, based on the projected consumer expenditure capture (demand) in the primary trade area
of the gross consumer expenditure by retail category, less the current existing retail sales (supply)
by retail category, GPG projects the potential net consumer expenditure (gap) available to support
existing and new development. The projected net consumer expenditure capture is based on
household expenditure and demographic characteristics of the primary trade area, existing and
planned retail competition, traffic and retail gravitational patterns and GPG’s qualitative
assessment of the Cuyahoga Falls study area. Net potential captured consumer expenditure
(gap) is equated to potential retail development square footage, with the help of retail sales per
square foot data provided by Dollars and Cents of Shopping Centers (Urban Land Institute and
International Council of Shopping Centers), qualitatively adjusted to fit the urbanism and
demographics of the study area.

Cuyahoga Falls, Ohio Market Study 7. Gibbs Planning Group, Inc. 12 January 2016
For the purposes of this study, GPG has assumed the following:
Other major community retail centers may be planned or proposed, but only the existing
retail is considered for this study. The quality of the existing retail trade in the study area
is projected to remain constant. Gains in future average retail sales per sf reflect higher
sales per sf in newly developed retail and selected increases in sales per sf by individual
retail categories.
No major regional retail centers will be developed within the trade area of this analysis
through 2021 for the purposes of this study.
The region’s economy will continue at normal or above normal ranges of employment,
inflation, retail demand and growth.
The subject site is properly zoned to support infill and redevelopment projects with current
and innovative standards, and the existing infrastructure (water, sewer, arterial roadways,
etc.) can support additional commercial development.
Annual population growth for the primary trade area is estimated to be 0.02 percent
throughout the five-year period of this study.
Employment distribution is projected to remain constant, without a spike or decline in
employment by NAICS categories.
The projected lease and vacancy rate model is based on our proprietary econometric
model of the relationship between changes in employment and changes in vacancy and
lease rates. Data was gathered from the U.S. Census Bureau, Esri, CBRE and local
brokerage services.
Any new construction in the study area will be planned, designed, built and managed to
the best practices of the American Institute of Architects, American Planning Association,
American Society of Landscape Architects, Congress for New Urbanism, International
Council of Shopping Centers and The Urban Land Institute.
Parking for new development projects or businesses will meet or exceed the industry
standards.
Visibility of any new retail is also assumed very good, with signage as required to assure
easy visibility of the retailers.
Infill or redevelopment projects in the study area will open with sustainable amounts of
retail and anchor tenants, at planned intervals and per industry standards.
The pedestrian mall will be reopened to vehicular traffic with industry standards for travel
lanes, on-street parking, signage and signalization.
Trade Area
Based on GPG’s site evaluation, the existing retail hubs, population clusters, highway access,
and the retail gravitation in the market, as well as our experience defining trade areas for similar
communities throughout the United States, it was determined that consumers in the primary trade
area generate demand to support a variety of retailers. This potential will continue to increase

8. Cuyahoga Falls, Ohio Market Study Gibbs Planning Group, Inc.
12 January 2016
over the next five years, sustained by an annual population growth rate of 0.02 percent and
household income growth of 2.64 percent.
The primary trade area is the consumer market where the study area has a significant competitive
advantage because of access, design, lack of quality competition and traffic and commute
patterns. This competitive advantage equates to a potential windfall in the capture of consumer
expenditure by the retailers in the study area.
Figure 4: The downtown Cuyahoga Falls primary trade area is shown above outlined in blue. The trade area includes
most of Cuyahoga Falls as well as parts of Akron, Tallmadge and Stow.
GPG defined a primary trade area by topography, vehicular access, strength of retail competition
and residential growth patterns instead of standardized “drive-times.” Consumers inside the
primary trade area will account for up to 60 to 70 percent of the total sales captured by retailers in
downtown Cuyahoga Falls. Due to the strong retail gravitational pull of Summit Mall, First and
Main Hudson, Stow Community Center and downtown Akron, GPG finds that the primary trade
area accounts for an area roughly defined by a two to four-mile radius and inclusive of many
Cuyahoga Falls neighborhoods and portions of Akron, Tallmadge, Munroe Falls and Stow.
Residents of the primary trade area do not have access to a convenient urban shopping
experience, creating a captive audience of nearby consumers.

Cuyahoga Falls, Ohio Market Study 9. Gibbs Planning Group, Inc. 12 January 2016
Figure 5: The downtown total trade area is shown above outlined in red. Total trade area residents can conveniently
reach the downtown, but it is not their preferred shopping destination.
The following borders approximately delineate the primary trade area:
North – Seasons Road
South – Little Cuyahoga River
East – Kent State University Airport
West – Northampton Road.
The total of community-oriented trade area extends to I-80 to the north, Kent to the east, south
into South Akron and west to Sand Run Road where access via major arterials or Route 8 will
make downtown shopping convenient. Residents who live in the total, but not within the primary,
trade area will shop the re-opened downtown frequently, but the area will not be their primary
shopping destination. Residents in the total trade area will likely account for 10 to 20 percent of
the total sales captured by retailers in the study area.

10. Cuyahoga Falls, Ohio Market Study Gibbs Planning Group, Inc.
12 January 2016
Demographic Characteristics
Using data from Esri (Environmental Systems Research Institute) and the U.S. Census Bureau,
GPG obtained the most recent population and demographic characteristics (2016), and those
projected for 2021 for the defined trade area, as well as regional and statewide statistics.
Table 2: Demographic Comparisons
Characteristics Primary
Trade Area Total
Trade Area Ohio USA
2016 Population 102,200 307,400 11,610,200 316,296,900
2021 Population 102,300 308,200 11,732,400 327,981,300
2016-21 Projected Annual Growth Rate 0.02% 0.05% 0.21% 0.73%
2016 Households 45,100 129,500 4,665,900 119,862,900
2021 Households 45,300 130,200 4,724,600 124,446,500
2016-21 Projected Annual HH Growth Rate 0.09% 0.12% 0.25% 0.75%
Persons Per Household 2016 2.24 2.3 2.42 2.57
Median Age 39.8 38.0 39.6 37.7
2016 Median Household Income $49,100 $43,200 $49,000 $52,000
2016 Average Household Income $62,100 $60,400 $66,300 $72,800
2021 Median Household Income $55,900 $50,800 $56,400 $59,600
2021 Average Household Income $70,500 $68,800 $76,000 $83,900
% Households w. incomes $75,000+ 29.9% 27.0% 30.9% 34.0%
% Bachelor’s Degree or higher 31.3% 31.1% 26.6% 28.7%
Table 2: This side-by-side table compares and contrasts the primary trade area demographic statistics with those of the
total trade area, Ohio and the USA.
The primary trade area has an estimated 2016 population of 102,200 persons, which will increase
at an annual rate of 0.02 percent to 102,300 by 2021. This annual growth rate is similar to the
total trade area, but contrasts the more optimistic growth trend in the state level of 0.21 percent.
The number of households in the primary trade area is 45,100, holding 2.24 persons per
household, and is projected to increase to 45,300 by 2021, a 0.54 percent total increase over the
five years. Median household income is $49,100 and is expected to increase to $55,900 in 2021
at an annual rate of 2.64 percent. Average income in the trade area is $62,100, while 29.9 percent
of households earn over $75,000 per year – slightly lower than state and national figures.
Displaying higher levels of education than the region and state, 31.3 percent of residents over the
age of 25 have earned a bachelor’s degree or higher. The median age is comparable at 39.8.
Cuyahoga Falls, Ohio Market Study 11. Gibbs Planning Group, Inc. 12 January 2016
The total trade area demonstrates similar demographics. There are 307,400 residents increasing
by 0.05 percent annually to 308,200 by 2021. This growth rate is slightly higher than the primary
trade area but is still noticeably lower than the state level. The number of households is 129,500
increasing to 130,200 by 2021. Median household income in the area is $43,200 and the average
household income is $60,400, both of which are somewhat lower than the primary trade area.
Median incomes are expected to increase to $50,800 by 2021, when the average income will
have grown by 13.9 percent to $68,800. Educational attainment is also similar to the primary trade
area at 31.1 percent and 27.0 percent of households earn more than $75,000 annually. The
median age is 38.0.
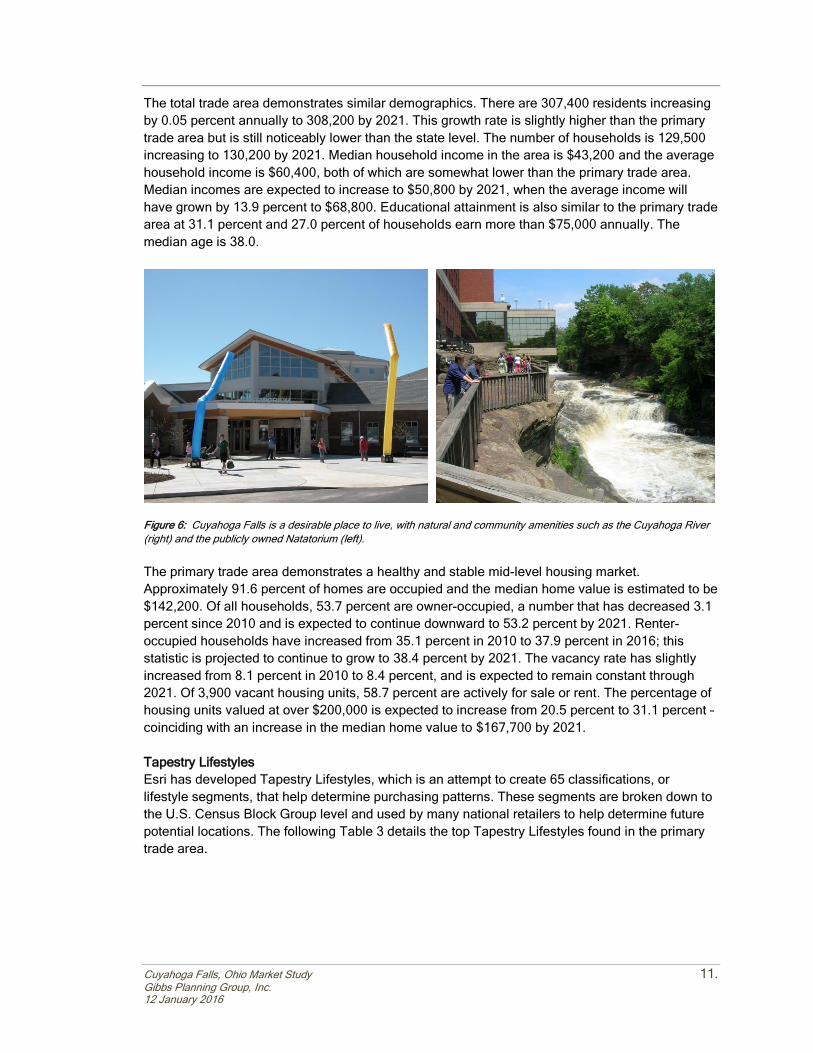
Figure 6: Cuyahoga Falls is a desirable place to live, with natural and community amenities such as the Cuyahoga River
(right) and the publicly owned Natatorium (left).
The primary trade area demonstrates a healthy and stable mid-level housing market.
Approximately 91.6 percent of homes are occupied and the median home value is estimated to be
$142,200. Of all households, 53.7 percent are owner-occupied, a number that has decreased 3.1
percent since 2010 and is expected to continue downward to 53.2 percent by 2021. Renter-
occupied households have increased from 35.1 percent in 2010 to 37.9 percent in 2016; this
statistic is projected to continue to grow to 38.4 percent by 2021. The vacancy rate has slightly
increased from 8.1 percent in 2010 to 8.4 percent, and is expected to remain constant through
2021. Of 3,900 vacant housing units, 58.7 percent are actively for sale or rent. The percentage of
housing units valued at over $200,000 is expected to increase from 20.5 percent to 31.1 percent –
coinciding with an increase in the median home value to $167,700 by 2021.
Tapestry Lifestyles
Esri has developed Tapestry Lifestyles, which is an attempt to create 65 classifications, or
lifestyle segments, that help determine purchasing patterns. These segments are broken down to
the U.S. Census Block Group level and used by many national retailers to help determine future
potential locations. The following Table 3 details the top Tapestry Lifestyles found in the primary
trade area.

12. Cuyahoga Falls, Ohio Market Study Gibbs Planning Group, Inc.
12 January 2016
Table 3: Tapestry Lifestyles
Lifestyle Trade Area Statistics
Short Description
Rustbelt Traditions
Population
26,700
Households
11,400
Median HH Income
$49,000
25.2% Primary Trade
Area Households
Market Share
2.2% National
Market Share
The backbone of older industrial cities in states surrounding
the Great Lakes, Rustbelt Traditions residents are a mix of
married-couple families and singles living in older
developments of single-family homes. While varied, the
work force is primarily white collar, with a higher
concentration of skilled workers in manufacturing, retail
trade, and health care. Rustbelt Traditions represents a
large market of stable, hard-working consumers with
modest incomes but above average net worth. Family
oriented, they value time spent at home. Most have lived,
worked, and played in the same area for years.
Residents take advantage of convenience stores for fueling
up and picking up incidentals. Watching television is a
common pastime; many households have more than four
TVs. Rustbelt Traditions are connected to electronics.
Favorite family restaurants include Applebee’s, Outback
Steakhouse, and Texas Roadhouse.
Old and Newcomers
Population
10,000
Population
4,800
Median HH Income
$39,000
10.6% Primary Trade
Area Household
Market Share
2.3% National
Market Share
This market features singles’ lifestyles, on a budget. The
focus is more on convenience than consumerism,
economy over acquisition. Old and Newcomers is
composed of neighborhoods in transition, populated by
renters who are just beginning their careers or retiring.
Some are still in college; some are taking adult education
classes. They support environmental causes and
Starbucks. Age is not always obvious from their choices.
These metropolitan city dwellers are predominantly single
households, with a mix of married couples (no children);
average household size is lower at 2.11. Forty-five percent
of housing units are single-family dwellings; 44 percent are
multiunit buildings in older neighborhoods, built before
1980. Old and Newcomers retail priorities include cell
phones, online shopping and entertainment, convenience
food, environmentally responsible products.
Traditional Living
Population
11,000
Population
4,600
Median HH Income
$37,000
10.2% Primary Trade
Area Households
Market Share
2.0% National
Households
Market Share
Residents of the Traditional Living segment live primarily in
low-density, settled neighborhoods in the Midwest. The
households are a mix of married-couple families and
singles. Many families encompass two generations who
have lived and worked in the community; their children are
likely to follow suit. The manufacturing, retail trade, and
health care sectors are the primary sources of employment
for these residents. This is a younger market — beginning
householders who are juggling the responsibilities of living
on their own or a new marriage, while retaining their
youthful interests in style and fun.
Traditional Living households shop for groceries at discount
stores such as Walmart supercenters; Kmart is also a
favorite for apparel and sundry household and personal
care products.

Cuyahoga Falls, Ohio Market Study 13. Gibbs Planning Group, Inc. 12 January 2016
Lifestyle Trade Area Statistics
Short Description
Parks and Rec
Population
9,200
Households
3,800
Median HH Income
$55,000
8.5% Primary Trade
Area Households
Market Share
2.0% National
Households
Market Share
These practical suburbanites have achieved the dream of
home ownership, and have purchased homes that are
within their means. Their homes are older, and town homes
and duplexes are not uncommon.
Many of these families are two-income married couples
approaching retirement age; they are comfortable in their
jobs and their homes and budget wisely, but do not plan on
retiring anytime soon or moving.
Neighborhoods are well established, as are the amenities
and programs that supported their now independent
children through school and college. The appeal of these
kid-friendly neighborhoods is now attracting a new
generation of young couples.
Midlife Constants
Population
6,100
Households
2.800
Median HH Income
$48,000
6.2% Primary Trade
Area Households
Market Share
2.5% National
Households
Market Share
Midlife Constants consists of soon-to-be retiring individuals
who have below average participation in the labor force but
higher average net worth. Their lifestyle tends to be more
country than urban. These are primarily married couples
with a growing number of singles.
Traditional and not trendy describes the spending habits of
this group. They are more interested in convenience than
cutting-edge. Technology is accepted as long as it is simple
and does not come with a lot of gadgets. American-made
quality items are preferred, but price is also a large factor.
Domestic SUVs and trucks are the vehicles of choice.
These vehicles allow for the DIY mentality amongst this
group. Midlife Constants like to spend free time
scrapbooking, watching movies at home, reading, fishing
and playing golf.
Table 3: The top five Tapestry Lifestyle groups profiled above portray a mix of urban household typologies with varying
ages and a range of income levels.
The trade area’s most prominent lifestyle group is “”Rustbelt Traditions,” which represents 25.2
percent of households. This group is comprised of white collar and skilled workers living in older
single-family homes in an area where they have lived, worked and played for many years. Hard
working and family oriented, these households represent a stable population of married couples,
most without children, and singles. Correspondingly, the average household size is 2.46 persons
and the median age is 38.4.
Most Rustbelt Traditions residents live in single-family homes in older neighborhoods built in the
1950s. Home ownership (72.2 percent) is nearly ten percent higher than the national average;
however, the median home value ($118,000) is nearly $50,000 lower than the national average.
Households are slightly more mobile than the U.S. population, although 46 percent of
householders moved into their current homes before 2000. Three quarters of residents own their
homes and over half of households have mortgages. Most households have two or more vehicles.

14. Cuyahoga Falls, Ohio Market Study Gibbs Planning Group, Inc.
12 January 2016
Tapestry Lifestyles Segmentation
Figure 7: The relative proportions of the top twenty Tapestry Lifestyle segments found in the primary trade area.
The majority of Rustbelt Traditions adults have graduated high school and attended some
college, with the highest concentration of workers in office and administrative support or sales.
Unemployment is below the U.S. statistic and labor force participation is high at 67 percent. While
most household income is derived from wages and salaries, nearly 30 percent of households
collect Social Security and nearly 20 percent are drawing income from retirement accounts. The
median household income is slightly lower than the national average at $49,000 but the median
net worth is slightly higher at $79,000.
Rustbelt Traditions are budget-conscious and family-oriented shoppers that favor American-made
products and value their time spent at home. Newspapers are popular, especially the Sunday
edition. A considerable amount of time is also spent watching television; favorite channels range
from ESPN, Animal Planet and AMC to Nickelodeon and Cartoon Network. Compared to national
averages, this segment spends less on the majority of household budget items, but most notably
less on apparel and services. As such, downtown Cuyahoga Falls should put a premium on the
cleanliness and appearance of the shopping district to reinforce a sense of quality and value in
the goods and services offered.

Cuyahoga Falls, Ohio Market Study 15. Gibbs Planning Group, Inc. 12 January 2016
Employment Base
The employment picture found in the primary trade area reflects a concentrated services, retail
and manufacturing sector foundation, with the latter two comprising a higher percentage of overall
employment than found at the state or national level. Other categories representing higher than
average employment include construction, wholesale trade and government. Overall, the primary
trade area economy is 62.1 percent white-collar, 20.6 percent blue-blue collar and 17.2 percent
services.
Table 4: Employment Comparison by Sector (SIC)
Sector Primary Trade
Area Total Trade
Area Ohio USA
Agriculture and Mining 0.9% 0.6% 1.2% 2.2%
Construction 4.5% 2.6% 3.8% 5.3%
Manufacturing 12.0% 9.2% 11.2% 9.6%
Transportation 1.7% 2.4% 2.8% 3.4%
Communication 0.5% 0.7% 0.8% 1.1%
Utility 0.2% 1.2% 0.7% 0.7%
Wholesale Trade 5.0% 3.0% 4.3% 4.2%
Retail Trade 27.5% 14.6% 19.4% 16.7%
Finance, Insurance & Real Estate 4.6% 4.1% 5.9% 6.4%
Services 35.9% 56.5% 43.4% 41.8%
Government 6.8% 5.0% 6.0% 8.7%
Unclassified 0.4% 0.3% 0.5% 0.0%
Table 4: Services and Retail Trade comprise the bulk of primary trade area employment.
As shown in Table 4 above, the Services sector accounts for the majority of employment (35.9
percent) in the primary trade area. This proportion is notably lower than the total trade area and
the state and may be influenced by a dominance of retail and manufacturing. Within the service
sector, Other Services is the leading subcategory comprising 14.2 percent of total employment,
followed by Health Services (10.9 percent) and Educational Institutions and Libraries (7.0
percent). Health Services and Education employees are likely candidates to leave the workplace
for lunch and support downtown restaurants, as well as shop in the evening on the way home
from work.
As the second leading category of employment, Retail Trade workers account for 27.5 percent of
employment within the primary trade area, with over eight percent higher participation than the
state average. Within this category, Eating and Drinking Places is the leading subcategory of
employment comprising 10.0 percent of total employment, followed by Food Stores (4.2 percent)
and Miscellaneous Retail (3.4 percent). This is attributed to Chapel Hill Mall, heavy
concentrations of suburban-scale retailers along Howe Avenue and the recent opening of Portage
Crossing. However, dominance of this category should not be confused with an oversupply of
retail in the area; the size and scale of retailers may require a significant number of workers but
this is not indicative of how well these retailers are supplying goods and services to the
surrounding community.
One area of employment that could be improved to better support downtown retail is Finance,
Insurance and Real Estate (FIRE). Workers in this sector prefer downtown locations and generate

16. Cuyahoga Falls, Ohio Market Study Gibbs Planning Group, Inc.
12 January 2016
daytime demand for restaurants and other retail. Furthermore, this sector expands the consumer
base by drawing clients to their office throughout the day.
Table 5: Drive Time and Trade Area Employment by Industry Sector
Table 5: Downtown Cuyahoga Falls can capture daytime expenditure from workers within a five-minute drive time by
offering a convenient collection of restaurants and shops.
Daytime employment plays a large role in supporting retail. The primary trade area is estimated to
have over 46,500 employees; an estimated 6,900 of them are office employees who are known to
expend at much higher rates, often eating out for lunch and shopping on the way to and from
work. The mix of employees throughout the ten-minute drive time varies from the primary trade
area due to the inclusion of downtown Akron, with Services, Retail and Government being the
leaders at 38,790, 12,070 and 5,770 jobs, respectively. Furthermore, there are approximately
13,940 workers within a five-minute drive time, providing a considerable supply of captive
consumers nearest the study site. GPG estimates downtown merchants could regularly capture
expenditure from workers within five minutes of the study site should the downtown reopen to
traffic, with the potential to increase sales to a 10-minute drive time, should a critical mass of
convenient and desirable restaurant and shops deploy in the study area.
Employment Sector 5-Minute
Drive Time
Primary Trade Area
10-Minute
Drive Time
Agriculture & Mining 70 420 210
Construction 420 2,190 1,570
Manufacturing 440 5,810 2,990
Transportation 160 830 900
Communication 50 270 360
Utility 50 120 1,360
Wholesale Trade 350 2,410 1,900
Retail Trade 4,430 13,340 12,070
Home Improvement 370 840 740
General Merchandise Stores 370 1,320 1,210
Food Stores 650 2,020 1,740
Auto Dealers, Gas Stations, Auto Aftermarket
390 1,280 1,010
Apparel & Accessory Stores 60 540 470
Furniture & Home Furnishings 330 840 750
Eating & Drinking Places 1,750 4,840 4,580
Miscellaneous Retail 510 1,660 1,570
Finance, Insurance & Real Estate 740 2,260 3,420
Banks, Savings, & Lending Institutions 220 540 770
Securities Brokers 90 130 170
Insurance Carriers & Agents 240 440 450
Real Estate, Holding, Other Investment 190 1,150 2,030
Services 5,350 15,440 38,790
Hotels & Lodging 220 300 270
Automotive Services 160 650 560
Motion Pictures & Amusements 120 650 830
Health Services 1,520 5,300 17,370
Legal Services 100 210 730
Education Institutions & Libraries 1,450 3,420 11,520
Other Services 1,780 4,910 7,510
Government 1,840 3,300 5,770
Unclassified Establishments 40 180 170
Total Employment 13,940 46,570 69,510

Cuyahoga Falls, Ohio Market Study 17. Gibbs Planning Group, Inc. 12 January 2016
Table 6: Five-Minute Drive-Time Worker Expenditure
Category Weekly
Expenditure Annual
Expenditure Office Worker Expenditure
Non-Office Worker Expenditure
Total Expenditure
4,610 9,330
Prepared Food &
Beverage
Limited & Full Service Restaurants
$44 $2,288 $10,547,680 $7,898,405 $18,446,085
Drinking Places $17 $884 $4,075,240 $3,051,656 $7,126,896 Retail Goods
General Merchandise, Apparel, Home
Furnishings, Electronics $70 $3,640 $16,780,400 $12,565,644 $29,346,044
Grocery $30 $1,560 $7,191,600 $5,385,276 $12,576,876 Convenience Items $20 $1,040 $4,794,400 $3,590,184 $8,384,584
Total $181 $9,412 $43,389,320 $32,491,165 $75,880,485
Table 6: Employees within five minutes of the study site expend over $75.8 million dollars annually.
Consumer expenditure from daytime employment compliments that captured in the evenings and
on weekends by households in the trade area. “Office Worker Retail Spending in a Digital Age”,
published by the International Council of Shopping Centers in 2012, provides insight into the
impact of office worker employment. Weekly office worker expenditure, adjusted for 2016 dollars,
is estimated at $181. Weekly non-office worker expenditure is estimated at 37 percent of office
workers. Non-office workers are estimated to have slightly less disposable income, to have
multiple work locations including at home, and typically are on the road more during their
workweek. Retail purchases (general merchandise, apparel, home furnishings, electronics,
grocery and convenience items) make up the majority of the office worker dollars, at $120 per
week. Restaurant expenditures (full service, limited service and drinking places) account for the
balance at $61 per week. Annualized, each office worker expends $9,412 before, during and after
work.
The annual impact of nearly 14,000 workers within five minutes of downtown is $75.8 million. This
expenditure breaks down to include $25.5 million in prepared food and beverage establishments,
$12.5 million in grocery purchases, $29.3 million in retail sales and $8.3 million in convenience
items. Catering to the daytime worker crowd with fast-casual restaurants, convenient on-street
parking and extended evening hours may increase the worker expenditure captured by study area
retailers.
TRADE AREA CHARACTERISTICS
Location
The primary trade area is located in northeast Ohio approximately 25 miles south of Cleveland.
Surrounded by the natural beauty and regionally uncharacteristic topography of the Cuyahoga
Valley, Cuyahoga Falls is a compelling place to live when combined with the modern convenience
of highway connectivity. To the northwest, the Cuyahoga Valley National Park and Blossom Music
Center are major regional draws; the national park boasted approximately 2.4 million annual
visitors in 2014. Bisecting the city, the Cuyahoga River is another natural amenity and much of
the city’s early growth can be attributed to the energy supplied by a series of dams along its
length. Today, two of the three dams have been removed and should the third be
decommissioned, Cuyahoga Falls could become a sought-after whitewater destination with class-
4 and -5 rapids.

18. Cuyahoga Falls, Ohio Market Study Gibbs Planning Group, Inc.
12 January 2016
Figure 8: Cuyahoga Valley National Park and Blossom Music Center are two major draws to the study area; the national
park hosts 2.4 million annual visitors.
Another advantage of Cuyahoga Falls is its proximity to Akron. While it has a suburban
relationship to the Rubber City, it also has its own urban feel with a downtown and traditional
street grid. This gives residents desired suburban amenities like good schools, utilities,
infrastructure and public safety with the urban conveniences of compact living, charming
neighborhoods and a historic core.
Table 8: Traffic Counts
Location Traffic Count
Route 8 & Broad Boulevard 84,300
Front Street & Bailey Road 25,300
Howe Avenue & Main Street 22,200
Portage Trail & Front Street 21,200
Broad Boulevard & 2nd
Street 17,900
2nd
Street & Portage Trail 14,000
Newberry Street & Portage Trail 8,300
Chestnut Boulevard & 4th
Street 4,900
2nd
Street & Broad Boulevard 4,900
South Front Street & Falls Avenue 4,000
Table 8: The traffic chart shows heavy traffic along Route 8, which translates to excellent visibility for the study area.
(Source: TMS Engineers, OH DOT, AMATS and Kalibrate Technologies)
Access
Regional linkage is strong in the primary trade area; Route 8, which connects I-80 to the north and
I-76 to the south, runs through much of the trade area including the study site and downtown
Akron. This makes living in Cuyahoga Falls and commuting to a job in Akron or Cleveland very
reasonable. Furthermore, Front Street eventually turns into Kent Road, which links Kent and
Cuyahoga Falls, and Portage Trail connects to many east-west arterials that reach to west Akron
and Summit Mall.
Traffic volumes seen in Table 8 confirm the routes with the best regional and local access: Route
8 traveling along the study site, and 2nd
Street and North Front Street, the primary means of
getting into and out of Cuyahoga Falls. Running perpendicular to the pedestrian mall, Broad
Boulevard and Portage Trail carry a considerable amount of motorists through the study area,
represented by 17,900 and 21,200 cars, respectively. The most recent figures for South Front

Cuyahoga Falls, Ohio Market Study 19. Gibbs Planning Group, Inc. 12 January 2016
Street only demonstrate 4,000 cars per day; however, a more recent count would likely yield a
higher number, and even more should the downtown be reopened to traffic.
Parking in the study area appears to be adequate. Three parking garages are connected to the
downtown, holding approximately 1,000 spaces in total, and configurations for reopening Front
Street could bring between 68 and 92 additional on-street parking spaces. On South Front Street,
on-street parking and surface lots are utilized, but a comprehensive parking strategy may be
required should additional development occur in the area. If Front Street is opened to traffic,
parking meters should be deployed along Front Street to encourage stall turnover, while free
parking should remain available in the municipal parking garage. Fees collected from parking
meters could be used for downtown maintenance, beautification, forming a downtown
development authority or even as funding for an additional parking garage, should one become
necessary. Parking meters are the only guaranteed way to prevent shop owners and workers
from parking in the downtown’s most desirable locations. In today’s busy world, a perceived lack
of convenient parking is often reason enough for consumers to find alternative shopping
destinations.
Figure 9: The majority of competing shopping areas lie to the east and west of downtown Cuyahoga Falls.
Other Shopping Areas
As part of GPG’s evaluation, neighborhood, community and regional shopping centers near
Cuyahoga Falls were identified, visited and studied to assess their retail appeal, strength of
tenant mix, general maintenance and accessibility. In addition to on-site assessment, GPG used
information from the International Council of Shopping Centers’ Global Shopping Center
Directory.

20. Cuyahoga Falls, Ohio Market Study Gibbs Planning Group, Inc.
12 January 2016
Table 9: Existing Shopping Centers
Table 9: The study area’s competing shopping centers organized by center type and distance from the site.
Outside of Cuyahoga Falls, there are three competing downtown areas that residents currently
visit for urban shopping, dining and entertainment. Downtown Akron is less than a ten-minute
drive from the study site and offers a number of dining and entertainment options, although major
national retailers have little presence with the exception of Lululemon Athletica. Nevertheless,
cultural amenities, major employers and expanding residential options show signs of a resurging
downtown. To the east, downtown Kent is a popular urban area supported by the school-year
supply of consumers from Kent State University. In recent years, a number of high profile mixed-
use developments and major employers have elevated the profile of this college town, which has
many appealing offerings for students and professionals alike. Downtown Kent is the closest city
with both strong daytime and nighttime activity. To the north, downtown Hudson is a small town
downtown with several desirable shops along its main street and many civic buildings on the
adjacent side of the street. Complemented by the 200,000 sf First and Main Hudson lifestyle
center, this area contains many high-end labels that are not available elsewhere in the immediate
Akron-Cuyahoga Falls market.
In addition to these three areas, the majority of competing retail is conventionally suburban and
convenient for many trade area residents due to access, visibility, familiarity and ample free
parking.
Map Designation
Retail Center Name Shopping Center Type
Size Distance to Downtown
A Chapel Hill Mall Regional Mall 860,000 sf 2.0 miles
B Summit Mall Regional Mall 770,000 sf 1.9 miles
1 Portage Crossing Lifestyle Center 240,000 sf 2.0 miles
2 First and Main Hudson Lifestyle Center 200,000 sf 8.5 miles
3 Howe Avenue Power/Community Center 1,000,000+ sf 3.5 miles
4 Stow Community Center Power/Community Center 503,000 sf 3.5 miles
5 Stow Kent Plaza Power/Community Center 342,000 sf 3.5 miles
6 Graham Square Center Community Center 550,000 sf 2.5 miles
7 Cascades of Brimfield Community Center 440,000 sf 8.5 miles
8 Fairlawn Plaza Community Center 440,000 sf 8.5 miles
9 Rosemont Commons Community Center 500,000 sf 9.0 miles
10 West Market Plaza Community Center 301,300 sf 9.5 miles
11 Smith Centre Neighborhood Center 55,000 sf 1.5 miles
12 Marc’s Plaza Neighborhood Center 107,000 sf 2.0 miles
13 Graham & Darrow Centers Neighborhood Center 115,000 sf 3.5 miles
14 Fishcreek Plaza Neighborhood Center 123,000 sf 3.5 miles
15 Portage Path & Merriman Entertainment Area N/A 4.0 miles
16 Eastwood Square Neighborhood Center 115,000 sf 4.5 miles
17 Tallmadge Plaza Neighborhood Center 136,000 sf 4.5 miles
18 Stow Hudson Town Center Neighborhood Center 150,000 sf 6.5 miles
19 Hudson Plaza Neighborhood Center 145,000 sf 9.0 miles

Cuyahoga Falls, Ohio Market Study 21. Gibbs Planning Group, Inc. 12 January 2016
Regional Shopping Centers
Figure 10: The closest mall to downtown, Chapel Hill Mall, is facing significant store closures after being received by the
bank when the previous owner foreclosed on an unfavorable mortgage.
A. Chapel Hill Mall
The closest regional shopping center to downtown Cuyahoga Falls, Chapel Hill Mall is located
just two miles to the southeast. Opened in 1967 as a joint venture between R.B. Buchholzer
and Forest City Enterprises, it was the second enclosed shopping center in Akron. The mall is
now owned by US Bank following a foreclosure by previous owner CBL Associates, who
defaulted on the $77 million loan. Since entering receivership, several updates and improved
management are working to improve the reputation of the mall, although the area immediately
surrounding Chapel Hill remains blighted with several vacancies. The 860,000 sf mall
contains over 100 stores including current anchors JC Penny, Macy’s and Sears. However,
Macy’s recently announced that it will be closing its 169,000 sf location within the next two to
three months, which will almost assuredly result in the closing of many stores in the north
wing of the mall and may eventually signal the demise for the nearly 50 year-old shopping
center.
Figure 11: Nine miles west of downtown, Summit Mall is the preferred shopping destination for many trade area residents.
B. Summit Mall
Akron’s Summit Mall was the first enclosed mall in the region, opened in 1965 by the
DeBartolo Corporation. The preferred regional shopping destination of many trade area
consumers, the mall currently boasts over 120 stores and three anchors: a Macy’s and two
Dillard’s. The 770,000 sf mall is currently operated by Simon Property Group, the largest mall
operator in the U.S. Summit Mall is eight miles west of the study site.

22. Cuyahoga Falls, Ohio Market Study Gibbs Planning Group, Inc.
12 January 2016
Lifestyle Centers
Figure 12: Portage Crossing is the welcomed redevelopment of the State Road Shopping center. Market District by Giant
Eagle anchors the center; a unique concept, the grocery store includes a large made to order food section, a café and a
bar in addition to traditional grocery offerings.
1. Portage Crossing
Recently redeveloped on the site of State Road Shopping Center, Portage Crossings is a new
240,000 sf community center centered along a walkable urban street. Celebrating its grand
opening in the summer of 2015, the center is anchored by Giant Eagle’s Market District
concept and a 12-screen Cinemark movie theater. Developed by Stark Enterprises, Portage
Crossing is the suburban shopping center counterpart to downtown, lying less than two miles
to the northwest. Other notable retailers include BurgerFi, Chipotle, #FROYO, Pet Supplies
plus, Pizza Fire, Starbucks and a 41,000 sf LA Fitness.
Figure 13: First and Main Hudson is a thoughtful blending of a traditional main street with a shopping center of high
standards. Many desirable retailers make this one of the area’s premier destinations.
2. First and Main Hudson
Built in 2004, First & Main Hudson is a 200,000 sf mixed-use retail, residential and office
development in the heart of downtown Hudson, adjacent to historic Main Street. Anchored by
a 20,000 sf gourmet market, several desired apparel chains take residence within the
development including Ann Taylor Loft, Chico’s, Gymboree, J. McLaughlin, Jos. A. Banks,
Talbots and White House Black Market. Also anchored by the Hudson Library, the
development has a town square, creating a strong civic-minded center popular among many
area residents. With access from I-80, First and Main Hudson is 8.5 miles from downtown.

Cuyahoga Falls, Ohio Market Study 23. Gibbs Planning Group, Inc. 12 January 2016
3. Howe Avenue
Within the southern limits of Cuyahoga Falls, Howe Avenue is a one-mile agglomeration of
several shopping centers and large-format retailers located between Route 8 and Chapel Hill
Mall. This stretch is conventionally suburban in layout, contains many national brands and is
a major source of goods and services to Cuyahoga Falls residents. Containing over 1 million
sf of retail, major brands include Best Buy, BJs Wholesale, Burlington Coat Factory, Dick’s,
Giant Eagle, Home Depot, Marc’s, Michael’s Sam’s Club, Target, TJ Maxx, Toys R Us and
Value City Furniture. There are also a number of restaurant options such as Bob Evans,
Boston Market, Brick House Tavern, Chipotle, Five Guys, Longhorn Steakhouse, O’Charley’s,
Olive Garden and Panera Bread. Located just 1.5 miles from the study area, the area appears
successful in spite of Chapel Hill’s challenges; however, some centers and stores are
overdue for reinvestment and a similar fate may precipitate should the mall close.
Community and Neighborhood Shopping Centers
Figure 14: A large collection of national retailers and abundant parking make Stow Community Center a convenient option
for many trade area residents.
4. Stow Community Center
Located 3.5 miles northeast of downtown, Stow Community Center is a 503,000 sf retail
property featuring many large format national chain stores. Owned by DDR, the list of tenants
includes Target (102,000 sf), Giant Eagle (90,000 sf), Kohl’s (86,000 sf), Hobby Lobby
(55,000 sf), Bed Bath & Beyond (29,000 sf) and OfficeMax (23,000 sf) and a number of other
lifestyle tenants. Restaurant offerings include Applebee’s, Chipotle, McDonald’s, Old Carolina
Barbeque Company, Panera and Starbucks. Just outside of downtown’s trade area, Stow
Community Center likely intercepts many students and shoppers from Stow and Kent.
5. Stow-Kent Plaza
Built in 1959, the long beleaguered Stow-Kent Plaza is now in the midst of redevelopment
that will bring a 193,000 sf Meijer superstore 3.5 miles to the northeast of downtown. The
redevelopment plans are to demolish140,000 sf of inline space, leaving 50,000 sf of GLA, a
15,000 sf Aldi and an 84,000 sf Macy’s Department store in this reinvented community center.
Plans to redevelop the site as a mixed-use town center with apartments and townhomes have
been dropped in favor of the $20 million investment from Meijer that will bring 250 – 300 jobs
to the area. Stow-Kent Plaza is located across the street from Stow Community Center.

24. Cuyahoga Falls, Ohio Market Study Gibbs Planning Group, Inc.
12 January 2016
Figure 15: Already a long-standing shopping destination, redevelopment will bring a new Meijer to Stow-Kent Plaza.
6. Smith Centre
Located 1.5 miles due east of downtown, Smith Centre is a repurposed inn that now functions
as a 55,000 sf strip commercial center. Tenants include Dollar General, Funny Stop Comedy
Club, Goodwill Industries, the Red Fox Sports Pub and Grill, and Underhill’s Games.
7. Marc’s Plaza
A 107,000 sf neighborhood center, Marc's Plaza is located across the street from the new
Portage Crossings (two miles from downtown). Anchored by a 46,000 sf Marc's store, there is
a vacant 42,000 sf co-anchor space. Other tenants include First Merit Bank, Handel's Ice
Cream, Subway and UPS.
8. Graham Square Shopping Center
Graham Square Shopping Center is a large, mostly pad development shopping area with
direct views from Highway 8, sited 2.5 miles from downtown. The area is anchored by a
150,000sf Walmart and a 150,000 sf Lowe’s. Surrounding these retailers is approximately
250,000 sf of additional space, including a vacant grocery anchor. Other retailers in the
Graham Square area include AutoZone, Bob Evans, Game Stop, Panera Bread, Planet
Fitness, RadioShack, Red Lobster, Save-A-Lot, Starbucks, Sunrise Kitchen and Wendy’s.
9. Graham Road & Darrow Road Retail Centers
At the corner of Graham Road and Darrow Road, two small centers cater to the surrounding
community. Marc’s anchors the intersection complemented by Beef O’Brady’s, Eddy’s Bike
Shop, Mocha Joe’s Coffee House, Walgreen’s, two pizza shops and two jewelers. In total, this
intersection contains approximately 115,000 sf of retail 3.5 miles from downtown.
10. Fishcreek Plaza
Fishcreek Plaza, located at the intersection of Fishcreek Road and Kent Road, is 3.5 miles
northeast of the study area. A 123,000 sf neighborhood center, Fishcreek is anchored by
Acme Fresh Market. Other tenants include Curves, Fantastic Sam's, Goodyear Tire, Once
Upon A Child, R.S.V.P. Food & Party Outlet, and Title Boxing.
11. Portage Path & Merriman Road
While there is no single shopping center of significance, the confluence of Portage Path and
Merriman Road has evolved into a noted dining and entertainment hub within the trade area.
The small enclave of Liberty Commons contains several nightlife destinations, and a number
of surrounding restaurants, breweries, cafés and small retailers make this a popular
destination. The majority of locations look dated or neglected and this may be an area from
which to recruit future retailers and restaurants for downtown Cuyahoga Falls. This area is
approximately four miles from the study area.

Cuyahoga Falls, Ohio Market Study 25. Gibbs Planning Group, Inc. 12 January 2016
12. Eastwood Square
One mile south of historic Tallmadge Town Square, (4.5 miles southeast of the study area) at
the intersection of South and Eastwood Avenues, stands Eastwood Plaza. This 115,000 sf
neighborhood center is anchored by Acme Fresh Market. Built in 1996, other retailers include
CVS, Dollar Tree, Hallmark, RadioShack and Sally Beauty.
13. Tallmadge Plaza Shopping Center
Adjacent to Eastwood Square, an 88,000 sf Kmart and 48,000 sf of GLA make up the
Tallmadge Plaza Shopping Center. Additionally, the neighborhood center 4.5 miles southeast
of the study site contains American Finance, Dollar General, Pizza Hut, Planet Fitness and a
hair salon. There are six vacancies and a 0.34-acre out parcel is available.
14. Stow Hudson Town Center
Located 6.5 miles to the north of downtown, Stow Hudson Town Center is an approximately
150,000 sf neighborhood center anchored by an 80,000 sf Giant Eagle. The remaining center
is comprised of Arby’s, Burger King, Consigner’s Collection, Sew Deja Vu and Wendy’s. The
center is poised for additional pad development, while as much as 40,000 sf of the center is
currently vacant.
15. Fairlawn Plaza Shopping Center
Southwest of Summit Mall, Fairlawn Plaza is a collection of two shopping centers anchored
by Target and Giant Eagle. Combining for 440,000 sf of total retail other notable tenants are
Ashley Furniture, GNC, Home Goods, Marc’s Pet Supplies Plus, Stride Rite and Tuesday
Morning. Dining options include Chuckie Cheese’s, House of Hunan and Panera Bread. The
site is 8.5 miles west of downtown.
16. Hudson Plaza Shopping Center
Immediately outside of downtown Hudson, this 145,000 sf neighborhood shopping center is
the other significant shopping destination in the area. Anchored by Acme Fresh Market, inline
retailers include All Star Sports, Panera, Papa John’s, RadioShack, Subway and Timothy
Michael Jewelers. Hudson Plaza is nine miles from the study area.
17. Rosemont Commons
Located at the intersection of Route 18 and Cleveland-Massillon Road, approximately nine
miles from the study site, Rosemont Commons is a large community center anchored by
Giant Eagle, Sam’s Club and Walmart. Other notable retailers include Bed Bath & Beyond,
Famous Footwear, Guitar Center, Max & Erma’s, Michael’s and PetSmart. Developed by
Stark Enterprises, the center contains over 500,000 sf of retail.
18. West Market Plaza
Adding to the mass of retail surrounding Summit Mall, West Market Plaza is a 301,300 sf
community center with several national tenants. Lowe’s anchors the center and is
complemented by Dress Barn, DSW, Five Below, Mustard Seed Café, Old Navy, Panera
Bread, TJ Maxx and Ulta. Developed by Stark Enterprises, the center is 9.5 miles from the
study site.
26. Cuyahoga Falls, Ohio Market Study Gibbs Planning Group, Inc.
12 January 2016
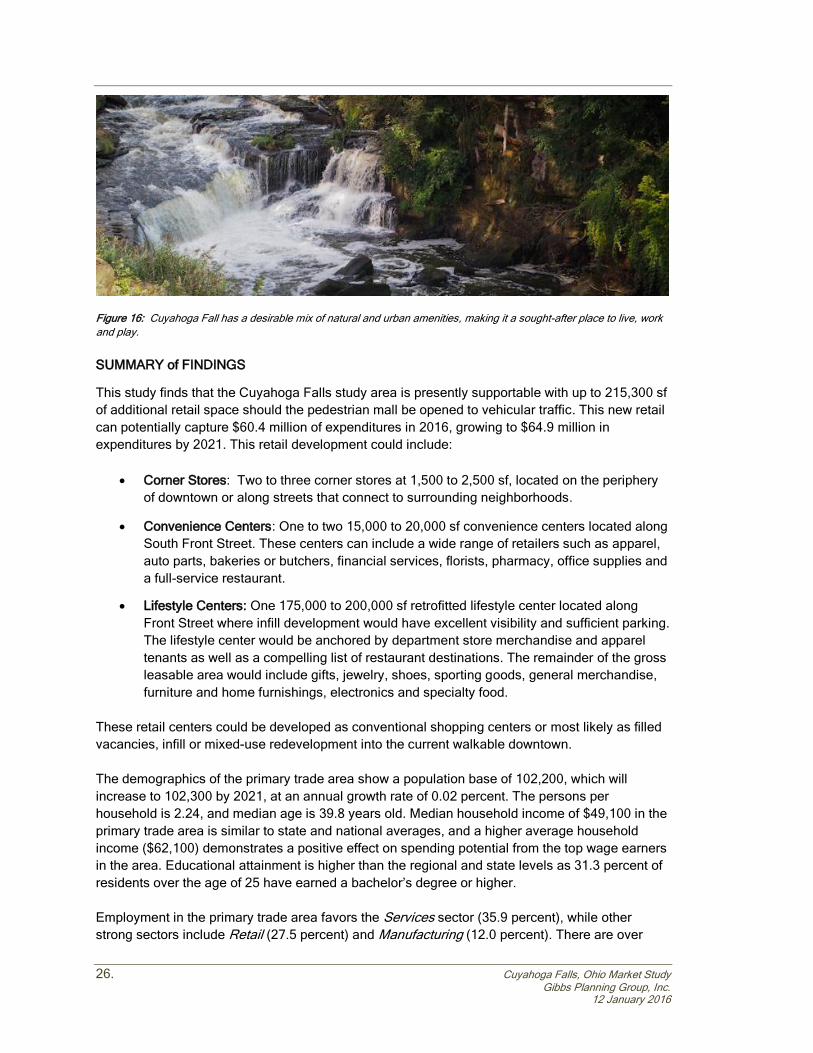
Figure 16: Cuyahoga Fall has a desirable mix of natural and urban amenities, making it a sought-after place to live, work
and play.
SUMMARY of FINDINGS
This study finds that the Cuyahoga Falls study area is presently supportable with up to 215,300 sf
of additional retail space should the pedestrian mall be opened to vehicular traffic. This new retail
can potentially capture $60.4 million of expenditures in 2016, growing to $64.9 million in
expenditures by 2021. This retail development could include:
Corner Stores: Two to three corner stores at 1,500 to 2,500 sf, located on the periphery
of downtown or along streets that connect to surrounding neighborhoods.
Convenience Centers: One to two 15,000 to 20,000 sf convenience centers located along
South Front Street. These centers can include a wide range of retailers such as apparel,
auto parts, bakeries or butchers, financial services, florists, pharmacy, office supplies and
a full-service restaurant.
Lifestyle Centers: One 175,000 to 200,000 sf retrofitted lifestyle center located along
Front Street where infill development would have excellent visibility and sufficient parking.
The lifestyle center would be anchored by department store merchandise and apparel
tenants as well as a compelling list of restaurant destinations. The remainder of the gross
leasable area would include gifts, jewelry, shoes, sporting goods, general merchandise,
furniture and home furnishings, electronics and specialty food.
These retail centers could be developed as conventional shopping centers or most likely as filled
vacancies, infill or mixed-use redevelopment into the current walkable downtown.
The demographics of the primary trade area show a population base of 102,200, which will
increase to 102,300 by 2021, at an annual growth rate of 0.02 percent. The persons per
household is 2.24, and median age is 39.8 years old. Median household income of $49,100 in the
primary trade area is similar to state and national averages, and a higher average household
income ($62,100) demonstrates a positive effect on spending potential from the top wage earners
in the area. Educational attainment is higher than the regional and state levels as 31.3 percent of
residents over the age of 25 have earned a bachelor’s degree or higher.
Employment in the primary trade area favors the Services sector (35.9 percent), while other
strong sectors include Retail (27.5 percent) and Manufacturing (12.0 percent). There are over

Cuyahoga Falls, Ohio Market Study 27. Gibbs Planning Group, Inc. 12 January 2016
69,500 employees within a 10-minute drive of the study site and 13,900 employees within a five-
minute drive. These daytime consumers expend over $75.8 million annually before, after or
during the workday, a portion of which is currently being captured by existing retailers. Markedly
more expenditure from the five-minute drive time employees may be captured by new and
existing retailers with the opening of Front Street and the expansion of lunch-time restaurants,
extended and consistent evening hours, and appropriately managed parking optimized for quick
turnover.
Tapestry lifestyles in the market reflect a majority base of Rustbelt Traditions households,
representing 25.2 percent of all households. The backbone of older industrial cities in states
surrounding the Great Lakes, these residents are a mix of married-couple families and singles
living in older developments of single-family homes. Rustbelt Traditions represents a large market
of stable, hard-working consumers with modest incomes but above average net worth. Family
oriented, they value time spent at home. Most have lived, worked and played in the same area for
years.
A detailed examination of the supportable sf of retail uses is found in the following Table 11:
Table 11: 2016 & 2021 Supportable Retail Table Downtown Cuyahoga Falls Primary Trade Area
Table 10: Sales stated in constant 2016 dollars.

28. Cuyahoga Falls, Ohio Market Study Gibbs Planning Group, Inc.
12 January 2016
Retail Category Definitions
Retail categories in the Supportable Retail Table correspond to the North American Industry
Classification System (NAICS), the standard used by Federal statistical agencies in classifying
business establishments for the purpose of collecting, analyzing, and publishing statistical data
related to the U.S. business economy. The following NAICS codes and definitions are provided by
the U.S. Census Bureau:
Retail
Auto Supply Stores (4411): establishments known as automotive supply stores primarily
engaged in retailing new, used, and/or rebuilt automotive parts and accessories,
automotive supply stores that are primarily engaged in both retailing automotive parts and
accessories and repairing automobiles; establishments primarily engaged in retailing and
installing automotive accessories; and establishments primarily engaged in retailing new
and/or used tires and tubes or retailing new tires in combination with automotive repair
services.
Furniture Stores (4421): establishments primarily engaged in retailing new furniture, such
as household furniture (e.g., baby furniture box springs and mattresses) and outdoor
furniture; office furniture (except those sold in combination with office supplies and
equipment); and/or furniture sold in combination with major appliances, home electronics,
home furnishings and/or floor coverings.
Home Furnishings Stores (4422): establishments primarily engaged in retailing new home
furnishings (except furniture).
Electronics and Appliance Stores (4431): establishments primarily engaged in retailing
the following new products: household-type appliances (refrigerator, dishwasher, oven),
cameras, computers/software, televisions and other electronic goods.
Hardware Stores (4441): establishments primarily engaged in retailing new building
materials and supplies (lumber, plumbing, electrical, tools, housewares, hardware, paint,
and wallpaper).
Lawn and Garden Supply Stores (4442): establishments primarily engaged in retailing
new lawn and garden equipment and supplies. (Nursery, farm and garden products,
outdoor power equipment).
Grocery Stores (4451): establishments primarily engaged in retailing a general line of
food products (canned/frozen food, fruits and vegetables, meat, fish, poultry, milk, bread,
eggs, soda).
Specialty Food Stores (4452): establishments primarily engaged in retailing specialized
lines of food (meat, fish/seafood, fruits/vegetables, baked goods, candy, nuts,
confections, popcorn, ice cream, items not made on the premises).
Beer, Wine, and Liquor Stores (4453): establishments primarily engaged in retailing
packaged alcoholic beverages, such as ale, beer, wine and liquor.

Cuyahoga Falls, Ohio Market Study 29. Gibbs Planning Group, Inc. 12 January 2016
Health & Personal Care Stores (4461): establishments primarily engaged in retailing
health and personal care products (pharmacies/drug stores, first aid, beauty products,
household supplies, candy, prepackaged snacks, optical goods, vitamins/supplements).
Clothing stores (4481): men’s and boys’ clothing stores; women’s and girls’ clothing
stores; children’s and infants’ clothing stores; family clothing stores; clothing accessories
stores.
Shoe Stores (4482): Shoes (men’s, women’s, child/infant, athletic).
Jewelry Stores (4483): Jewelry, luggage, and leather goods (silverware, watches, clocks,
handbags, briefcases, belts, gloves).
Sporting Goods Stores (4511): establishments primarily engaged in retailing new sporting
goods (fitness equipment, bikes, camping, uniforms and footwear).
Book & Music Stores (4512): establishments primarily engaged in retailing new books,
newspapers, magazines, and prerecorded audio and video media.
Department Stores (4521): establishments known as department stores primarily
engaged in retailing a wide range of the following new products with no one merchandise
line predominating: apparel; furniture; appliances and home furnishings; and selected
additional items, such as paint, hardware, toiletries, cosmetics, photographic equipment,
jewelry, toys and sporting goods. Merchandise lines are normally arranged in separate
departments.
General Merchandise Stores (4529): establishments primarily engaged in retailing new
goods in general merchandise stores (except department stores) (warehouse clubs,
supercenters, apparel, auto parts, dry goods, hardware, groceries, housewares, no line
predominating).
Florists (4531): establishments known as florists primarily engaged in retailing cut
flowers, floral arrangements, and potted plants purchased from others. These
establishments usually prepare the arrangements they sell.
Office Supplies & Gift Stores (4532): establishments primarily engaged in one or more of
the following: (1) retailing new stationery, school supplies, and office supplies; (2) retailing
a combination of new office equipment, furniture, and supplies; (3) retailing new office
equipment, furniture, and supplies in combination with retailing new computers; and (4)
retailing new gifts, novelty merchandise, souvenirs, greeting cards, seasonal and holiday
decorations and curios.
Miscellaneous Retailers (4539): establishments primarily engaged in retailing new
miscellaneous specialty store merchandise (except motor vehicle and parts dealers;
furniture and home furnishings stores; consumer-type electronics and appliance stores;
building material and garden equipment and supplies dealers; food and beverage stores;
health and personal care stores; gasoline stations; clothing and clothing accessories
stores; sporting goods, hobby, book, and music stores; general merchandise stores;

30. Cuyahoga Falls, Ohio Market Study Gibbs Planning Group, Inc.
12 January 2016
florists; office supplies, stationery, and gift stores; and used merchandise stores). Pet
supplies, art dealers, manufactured home dealers, tobacco/cigar stores,
Restaurants
Full-Service Restaurants (7221): establishments primarily engaged in providing food
services to patrons who order and are served while seated (i.e., waiter/waitress service)
and pay after eating. Establishments that provide these types of food services to patrons
with any combination of other services, such as carryout services are classified in this
industry.
Limited-Service Restaurants (7222): establishments primarily engaged in providing food
services where patrons generally order or select items and pay before eating. Most
establishments do not have waiter/waitress service, but some provide limited service,
such as cooking to order (i.e., per special request), bringing food to seated customers, or
providing off-site delivery (cafeterias, snack/ juice bar, ice cream/soft serve shops, cookie
shops, popcorn shops, donut shops, coffee shops, bagel shops).
Special Food Services (7223): establishments primarily engaged in providing one
of the following food services (2) a location designated by the customer; or (3)
from motorized vehicles or non-motorized carts.
Food Service Contractors: Establishments may be engaged in providing food
services at institutional, governmental, commercial, or industrial locations of
others based (cafeteria, restaurant, and fast food eating-place) on contractual
arrangements with these types of organizations for a specified period of time.
Management staff is always provided by the food services contractor.
Caterers: providing single event-based food services. These establishments
generally have equipment and vehicles to transport meals and snacks to
events and/or prepare food at an off-premise site. Banquet halls with catering
staff are included in this industry. Examples of events catered by
establishments in this industry are graduation parties, wedding receptions,
business or retirement luncheons and trade shows.
Mobile Food Services: establishments primarily engaged in preparing and
serving meals and snacks for immediate consumption from motorized vehicles
or non-motorized carts. The establishment is the central location from which the
caterer route is serviced, not each vehicle, or cart. Included in this industry are
establishments primarily engaged in providing food services from vehicles,
such as hot dog carts and ice cream trucks.
Drinking Places (Alcoholic Beverages) (7224): establishments primarily engaged in
preparing and serving alcoholic beverages for immediate consumption (bars, taverns,
nightclubs).
Shopping Center Definitions This study utilizes the shopping centers typologies defined by the International Council of
Shopping Centers (ICSC) as follows:
Convenience Centers: Convenience centers are 30,000 sf or less, unanchored, and
generally will service a trade area of up to one mile. These centers include banking,
carryout foods, florists, mail centers, small restaurants, small food markets, and

Cuyahoga Falls, Ohio Market Study 31. Gibbs Planning Group, Inc. 12 January 2016
professional services such as real estate and financial consulting. The centers typically
include six to eight businesses.
Neighborhood Centers: Neighborhood centers are anchored with a full-sized
supermarket and typically range from 60,000 to 100,000 sf. They service a trade area
of two to three miles and can include apparel, banks, carryout food, hardware, mail
centers, restaurants, sporting goods and professional services such as financial
consulting and real estate.
Community Centers: Community centers typically range from 150,000 to 300,000 sf
and are almost always anchored with a full-sized department store. They also include
junior anchor retailers selling books, crafts, shoes, and sporting goods. Community
centers often include large home improvement stores and medium-sized discount
apparel stores. Their service area is typically five to seven miles in suburban
locations.
Lifestyle Centers: Lifestyle centers average 150,000 to 200,000 sf and feature
popular apparel, book, and home furnishing stores, as well as cinemas and a wide
selection of themed restaurants. The centers are frequently planned as walkable
areas with main streets. Recently, lifestyle centers have included large anchors such
as department stores, public libraries, and supermarkets. These centers typically
have a trade area of four to six miles when developed in suburban settings. Lifestyle
centers that include civic, employment, and residential buildings along with the retail
land use are defined as ‘town centers.’
Regional Centers: Regional centers average trade areas of eight to 12 miles
and are anchored with multiple department stores. The centers can range from
800,000 to 1,500,000 sf, and often include cinemas along with 200,000 sf of
national brand fashion.
Rationale
The rationale for the findings in this study follows:
Captive consumer market: Primary trade area residents likely pass by the study site
daily due to the proximity to Route 8. The demands of daily life suggest many consumer
purchases are made at some point during the daily commute. Should downtown be
reopened to traffic and a desirable selection of retailers carrying a variety of goods at
competitive prices deploy in the study site, a significant percentage of trade area
residents may find downtown to be the most convenient destination for shopping and
dining. Furthermore, competing downtowns are a notable distance from the study area
and present a burdensome drive for frequent visits.
Favorable trade area density and demographics: Due to the mature nature of Cuyahoga
Falls, most surrounding neighborhoods are organized in a conventional grid with higher
density than more contemporary neighborhoods. This translates to more rooftops per
square mile and consequentially more retail demand per square mile – highly desirable for
many retailers. This is further reinforced by the area demographics, which compare to
state and national averages.

32. Cuyahoga Falls, Ohio Market Study Gibbs Planning Group, Inc.
12 January 2016
Underserving retail: Despite a regional mall and a number of conventional shopping
centers along Howe Avenue, the existing retail within the trade area is underserving the
current population, represented by $60.4 million in sales that could be captured by new or
existing retailers. Especially with an uncertain future for Chapel Hill Mall, trade area
residents will find shopping downtown proximate and convenient.
Regional destinations: Cuyahoga Falls is located near the Cuyahoga Valley National Park
and Blossom Music Center. With over 2 million annual visitors, and several large
concerts, these destinations act as a catalyst and traffic generator for the region and will
certainly help future retailers downtown.
Limits of Study
The findings of this study represent GPG’s best estimates for the amounts and types of retail
projects that should be supportable in the study area. Every reasonable effort has been made to
ensure that the data contained in this study reflect the most accurate and timely information
possible and are believed to be reliable. This study is based on estimates, assumptions, and
other information developed by GPG independent research effort, general knowledge of the
industry, and consultations with the client and its representatives. This study is designed as
objective third party research and GPG does not recommend that any or all of the supportable
retail be developed in the study area.
No responsibility is assumed for inaccuracies in reporting by the client, its agent and
representatives or in any other data source used in preparing or presenting this study. This report
is based on information that was current as of January 12, 2016 and GPG has not undertaken any
update of its research effort since such date.
This report may contain prospective financial information, estimates, or opinions that represent
GPG’s view of reasonable expectations at a particular time, but such information, estimates, or
opinions are not offered as predictions or assurances that a particular level of income or profit will
be achieved, that particular events will occur, or that a particular price will be offered or accepted.
The actual amounts of supportable retail could be significantly higher or lower depending on
multiple market and not market variables including the type, design and quality of the new
development. It is plausible that a walkable town center, with well-designed buildings and public
realm, could draw visitors from beyond this study’s estimated trade area boundaries and
considerably outperform the site’s location and limited market potential. This would require an
extraordinary development team and retailer mix unique to the market, including anchor
retailers. On the other hand, a poorly implemented commercial center or badly managed
businesses could underperform the location.
Actual results achieved during the period covered by our prospective financial analysis may vary
from those described in our report, and the variations may be material. Therefore, no warranty or
representation is made by GPG that any of the projected values or results contained in this study
will be achieved.
This study should not be the sole basis for programming, planning, designing, financing, or
development of any commercial center. This study is for the use of The City of Cuyahoga Falls for
general planning purposes only, and is void for other site locations or developers.
-- END OF ANALYSIS –

Cuyahoga Falls, Ohio Market Study 33. Gibbs Planning Group, Inc. 12 January 2016
Appendix A1: Primary Trade Area Business Summary
Gib
bs P
lan
nin
g G
rou
p

34. Cuyahoga Falls, Ohio Market Study Gibbs Planning Group, Inc.
12 January 2016
Appendix A2: Primary Trade Area Business Summary
Gib
bs P
lan
nin
g G
rou
p

Cuyahoga Falls, Ohio Market Study 35. Gibbs Planning Group, Inc. 12 January 2016
Appendix B1: Primary Trade Area Community Profile
.
Gibbs Planning Group
Gibbs Planning Group

36. Cuyahoga Falls, Ohio Market Study Gibbs Planning Group, Inc.
12 January 2016
Appendix B2: Primary Trade Area Community Profile
Gibbs Planning Group

Cuyahoga Falls, Ohio Market Study 37. Gibbs Planning Group, Inc. 12 January 2016
Appendix B3: Primary Trade Area Community Profile
Gibbs Planning Group

38. Cuyahoga Falls, Ohio Market Study Gibbs Planning Group, Inc.
12 January 2016
Appendix B4: Primary Trade Area Community Profile
Gibbs Planning Group

Cuyahoga Falls, Ohio Market Study 39. Gibbs Planning Group, Inc. 12 January 2016
Appendix B5: Primary Trade Area Community Profile
Gibbs Planning Group

40. Cuyahoga Falls, Ohio Market Study Gibbs Planning Group, Inc.
12 January 2016
Appendix B6: Primary Trade Area Community Profile
Gibbs Planning Group

Cuyahoga Falls, Ohio Market Study 41. Gibbs Planning Group, Inc. 12 January 2016
Appendix C1: Primary Trade Area Housing Profile
Gibbs Planning Group
Gibbs Planning Group

42. Cuyahoga Falls, Ohio Market Study Gibbs Planning Group, Inc.
12 January 2016
Appendix C2: Primary Trade Area Housing Profile
Gibbs Planning Group
Gibbs Planning Group

Cuyahoga Falls, Ohio Market Study 43. Gibbs Planning Group, Inc. 12 January 2016
Appendix D1: Primary Trade Area Tapestry Segmentation
Gibbs Planning Group

44. Cuyahoga Falls, Ohio Market Study Gibbs Planning Group, Inc.
12 January 2016
Appendix D: Primary Trade Area Tapestry Segmentation
Gibbs Planning Group
Gibbs Planning Group

Cuyahoga Falls, Ohio Market Study 45. Gibbs Planning Group, Inc. 12 January 2016
Appendix D3: Primary Trade Area Tapestry Segmentation
Gibbs Planning Group
Gibbs Planning Group

46. Cuyahoga Falls, Ohio Market Study Gibbs Planning Group, Inc.
12 January 2016
Gib
bs P
lan
nin
g G
rou
p

Cuyahoga Falls, Ohio Market Study 47. Gibbs Planning Group, Inc. 12 January 2016
Gib
bs P
lan
nin
g G
rou
p

48. Cuyahoga Falls, Ohio Market Study Gibbs Planning Group, Inc.
12 January 2016
Gib
bs P
lan
nin
g G
rou
p
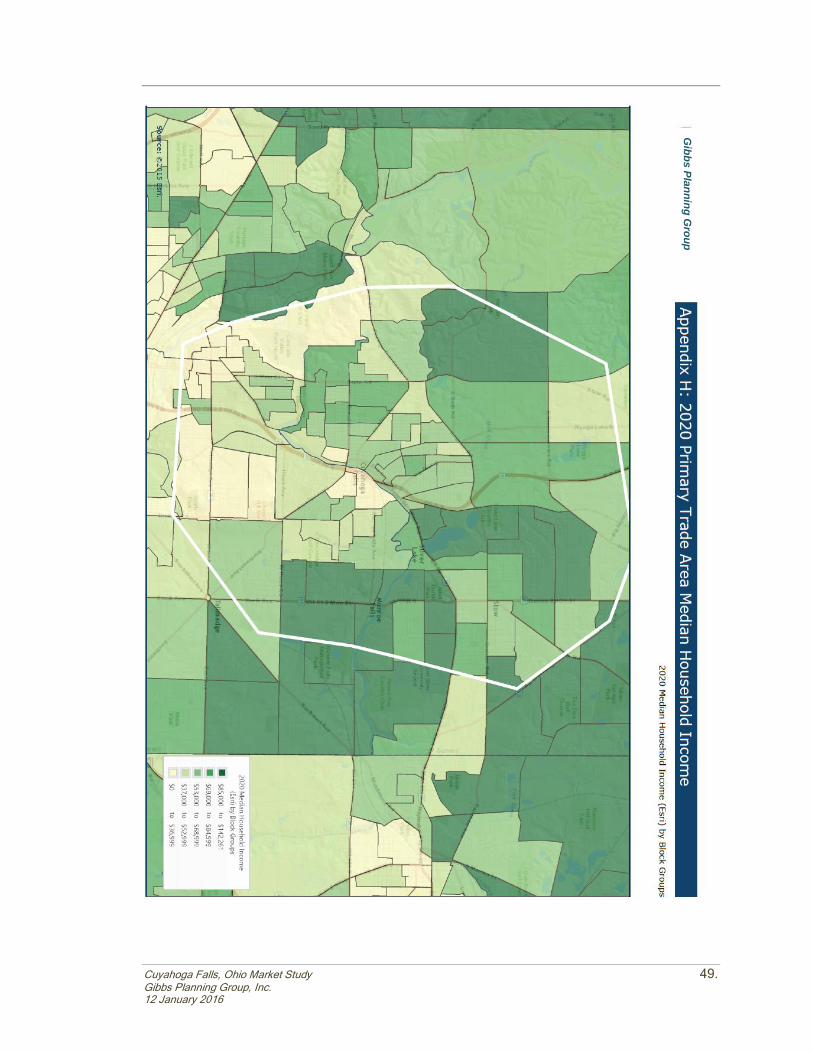
Cuyahoga Falls, Ohio Market Study 49. Gibbs Planning Group, Inc. 12 January 2016
Gib
bs P
lan
nin
g G
rou
p

50. Cuyahoga Falls, Ohio Market Study Gibbs Planning Group, Inc.
12 January 2016
Gib
bs P
lan
nin
g G
rou
p

Cuyahoga Falls, Ohio Market Study 51. Gibbs Planning Group, Inc. 12 January 2016
Gib
bs P
lan
nin
g G
rou
p

52. Cuyahoga Falls, Ohio Market Study Gibbs Planning Group, Inc.
12 January 2016
Gib
bs P
lan
nin
g G
rou
p

Cuyahoga Falls, Ohio Market Study 53. Gibbs Planning Group, Inc. 12 January 2016
Gib
bs P
lan
nin
g G
rou
p

54. Cuyahoga Falls, Ohio Market Study Gibbs Planning Group, Inc.
12 January 2016
Gib
bs P
lan
nin
g G
rou
p

Cuyahoga Falls, Ohio Market Study 55. Gibbs Planning Group, Inc. 12 January 2016
Gib
bs P
lan
nin
g G
rou
p