customers’ perception on their satisfaction about the ... · questionnaire was administered to...
TRANSCRIPT

LinköpingUniversity|DepartmentofManagementandEngineeringMaster’sthesis,30credits|MScBusinessAdministration-StrategyandManagementinInternationalOrganizations
Spring2016|ISRN-number:LIU-IEI-FIL-A--16/02290--SE
Customers’ Perception on theirSatisfactionaboutthePrivateBanksinaDevelopingCountry
AperspectiveofPrivateBanksinBangladesh
MdMahmudulAlamAkandaJasminDzekoSupervisor:PerÅman
LinköpingUniversity
SE-58183Linköping,Sweden+46013281000,www.liu.se
Englishtitle:Customers’PerceptionontheirSatisfactionaboutthePrivateBanksinaDeveloping
Country:AperspectiveofPrivateBanksinBangladesh
Authors:MdMahmudulAlamAkandaandJasminDzeko
Advisor:PerÅman
Publicationtype:
Master’sthesisinBusinessAdministrationStrategyandManagementinInternationalOrganizations
Advancedlevel,30creditsSpringsemester2016
ISRNNumber:LIU-IEI-FIL-A--16/02290--SE
LinköpingUniversityDepartmentofManagementandEngineering(IEI)
www.liu.se

iii
Abstract Customers’ satisfaction is a decisive factor in the development process of business which has also an effective impact on contributing a country's GDP. Private banks have been emerged over the time in developing countries where customers’ satisfaction is the driven force of banking industry investigated in Bangladesh. In this study a conventional American Customer Satisfaction Index model has been used over Bangladesh to compare overall performance of banking industry. Customers’ satisfaction in Bangladesh has been measured from the different angle of customers’ perception based on their portfolio. This research has been designed on a quantitative approach followed by survey research method. Questionnaire was administered to collect data through objective list as well as physical interaction with the respondents from different locations in the capital city of Bangladesh named Dhaka. Collected data had been analyzed applying Partial Latent Square (PLS) software program. The study outcomes showed that the perceived quality is the main determinant factor on customer satisfaction towards banks in Bangladesh. It also revealed that significant relationship exists between customers’ satisfaction and customers’ loyalty. The revised model in 2016 represents the benchmark scores of customers’ satisfaction in Bangladesh lagged behind consecutively 18 and 13 scores than that of USA and Taiwan. Considering the study results, we summed the quality of service leads to satisfied customers in turns towards customers loyalty. Banks also can get competitive advantage by evaluating all classes of customers equally through providing superior services to them.
Keywords Customers’ perception, Customers’ satisfaction, Private banks, Developing country, American Customer Satisfaction Index (ACSI).

iv

v
ACKNOWLEDGEMENT First of all, we would like to thank Almighty (Allah) for giving us strength, patience and aptitude to complete this gigantic task within stipulated time. We would be failing without the diving help from Almighty. We gratefully acknowledge the guidance and assistance received from different people while carrying out the study. From its inception to completion, we have received the contribution of many people who inspired, cooperated, influenced and guided our work and supported us cordially and constructively. This magnitude of the thesis bears the imprint of some of those respectable persons. We are highly honored to take the opportunity to thank our respected advisor Mr. Per Åman, PhD, Senior lecturer, Department of Management and Engineering, Linköping university of Sweden for providing the valuable support and guidance during the entire research period. With deep gratitude, we would like to acknowledge the precious support from Marie Bengtsson, PhD, Department of Management and Engineering, Linköping university of Sweden. We are grateful to her for the utmost supervision during entire study program in Linköping University. We received suggestions from her time to time which used to add additional value to our thesis. We also thank to our friends and relatives who helped us by acting as enumerators at the time of collecting data and by giving different suggestions and inspiration to complete this thesis. In addition, thanks to all of our classmates of SMIO 2014 batch for sharing their own experiences and ideas during thesis period that enriched our understanding. Special thanks to Mr. Md Kabir Hossain, Executive Vice President and Head of Zone Islami Bank Limited. Dilkusha, Dhaka, Bangladesh. We are also very grateful to Mr. Syed Maruf Ali, Vice President in charge of Card Division of One Bank Limited. Dhaka, Bangladesh and Mr. Mohammad Sanawar Hossain, First Assistant Vice President in charge of Capital Market Operation Division of Jamuna Bank Limited, for their reliable information and cooperation. Their kind cooperation, guidance, suggestions helped us a lot in gathering knowledge and experience to complete the thesis. Finally, we would like to acknowledge our parents from the bottom of our hearts for their inspiration and endless support during the whole study period and hence, desire to dedicate the same to them. Linköping in May 31st, 2016 Md Mahmudul Alam Akanda Jasmin Dzeko

vi

vii
Table of Content1. Introduction ............................................................................................................................................ 13
1.1. Background ......................................................................................................................... 131.1.1. Banking Factors in Developed and Developing Countries .................................................. 131.1.2. Customer Satisfaction Model .......................................................................................... 141.1.3. American Customer Satisfaction Index ............................................................................ 141.1.4. Overview of Banking Sector in Bangladesh ...................................................................... 15
1.2. Problematization ................................................................................................................... 15 1.2.1. Issues ............................................................................................................................ 161.3. Research purpose and Research Questions .............................................................................. 171.4. Significance of the Study ...................................................................................................... 171.5. Methodology ....................................................................................................................... 181.6. Empirical Study ................................................................................................................... 191.7. Outline of the Study ............................................................................................................. 19
2. Literature Review .................................................................................................................................. 212.1. Banking .............................................................................................................................. 21
2.1.1. Differences in Banking in Developing and Developed Countries ........................................ 212.1.2 Online Banking and Differences between Customers ......................................................... 22
2.2. Consumer Behavior Concepts ............................................................................................... 222.3. The Concept of Customer Satisfaction ................................................................................... 24
2.3.1. Expectation ................................................................................................................... 252.3.2. Quality of Service .......................................................................................................... 252.3.3. Satisfaction ................................................................................................................... 262.3.4. Loyalty ......................................................................................................................... 26
2.4. Customer Satisfaction Index .................................................................................................. 272.5. American Customer Satisfaction Index ................................................................................... 28
2.5.1. The Science of American Customer Satisfaction Model ..................................................... 292.6. Customer Classification ........................................................................................................ 30
2.6.1. From Acquaintances to Friends ....................................................................................... 312.6.2. From Friends to Partners ................................................................................................ 31
3. Methodology ........................................................................................................................................... 353.1. Quantitative Research ........................................................................................................... 353.2. Categories of the Customers .................................................................................................. 36
3.2.1. Most Important Customers .............................................................................................. 36

viii
3.2.2. Moderate Level Customers ............................................................................................. 373.2.3. Ordinary Customers ....................................................................................................... 37
3.3. Data Collection .................................................................................................................... 373.4. Customer Satisfaction Survey ................................................................................................ 38
3.4.1. Survey for the Most Important and Moderate Level Customers .......................................... 383.4.2. Survey for the Ordinary Customers .................................................................................. 39
3.5. Data Analysis Method .......................................................................................................... 403.5.1. SmartPLS ...................................................................................................................... 403.5.2. Model Specification ....................................................................................................... 413.5.3. Sample Size .................................................................................................................. 413.5.4. Explanation and Prediction Modeling .............................................................................. 42
4. Empirical Results ................................................................................................................................... 454.1. Pilot Study........................................................................................................................... 45
4.1.1. Pilot Run Results and Comparison ................................................................................... 454.1.2. R-squared ...................................................................................................................... 48
4.2. Customers’ Demographic Results ..................................................................................................... 48 4.2.1. Gender, Marital Status and Age of the Respondents .......................................................... 50 4.2.2. Level of Education ........................................................................................................ 50 4.2.3. Profession and Monthly Income ...................................................................................... 50 4.2.4. Work Experience and Family Type ................................................................................. 51 4.2.5. Length of Transaction and Frequency of Using Bank ........................................................ 514.3. Customers’ Satisfaction Survey Results .................................................................................. 52
5. Analysis and Findings ............................................................................................................................ 555.1. Discussion ........................................................................................................................... 555.2. Factors Influence to Retain Customers ................................................................................... 565.3. Benchmark Score and Overall Customer Satisfaction .............................................................. 575.4. Revised Customer Satisfaction Model .................................................................................... 585.5. Study Implications and Limitations ........................................................................................ 59
6. Conclusion .............................................................................................................................................. 636.1. Further Research .................................................................................................................. 63References ................................................................................................................................ 65
APPENDIX 1: American Customer Satisfaction Index (ACSI)…………………………………………..69APPENDIX 2: Customers’ satisfaction survey (English Version)………………………………………...70APPENDIX 3: Customers’ satisfaction survey (Bengali Version)………………………………………...76APPENDIX 4: Connections between questions and literature ……………………………………………82

ix
APPENDIX 5: Customer lens …………………………………………………………………………...85APPENDIX 6: Types of accounts ……………………………………………………………………….85APPENDIX 7: Gender …………………………………………………………………………………..86APPENDIX 8: Marital status ……………………………………………………………………………86APPENDIX 9: Age ……………………………………………………………………………………...86APPENDIX 10: Education level ………………………………………………………………………...87APPENDIX 11: Profession ……………………………………………………………………………...87APPENDIX 12: Monthly income ……………………………………………………………………….87APPENDIX 13: Work experience ………………………………………………………………………88APPENDIX 14: Family type ……………………………………………………………………………88APPENDIX 15: Length of transaction ………………………………………………………………….88APPENDIX 16: Frequency of bank use ………………………………………………………………...89APPENDIX 17: CS detailed and IPMA model applied on ACSI of three customers’ groups ………....90APPENDIX 18: Customers’ comments or additional information ……………………………………..93APPENDIX 19: Perceived value and customer satisfaction model …………………………………….96APPENDIX 20: Overall Importance Performance Map Analysis (IPMA) revised model ……………..96
List of Figures Figure 1 - Factors determining customer satisfaction (Sabir, R. et. al. 2014) ......................................... 25
Figure 2 - ASCI model with relationships (Feng Cheng, 2013) ............................................................ 28
Figure 3 - ACSI model with left and right parts (Theacsi.org, 2016) .................................................... 29
Figure 4 - CSI model from Taiwan (Hsu, Chen and Hsueh, 2006) ........................................................ 46
Figure 5 - ACSI model pilot run numbers .......................................................................................... 46
Figure 6 - Comparison between ACSI model pilot and CSI model Taiwan ........................................... 47
Figure 7 - ACSI model Pilot with regression weights of the effect ....................................................... 47
Figure 8 - CSI model Taiwan with regression weights of the effect ...................................................... 48
Figure 9 - Revised customer satisfaction model .................................................................................. 58
Figure 10 - Performance Improvement Graph .................................................................................... 59
List of Tables Table 1 - Demographic results comparison of customers’ ................................................................... 49
Table 2 - PLS results on ACSI model ................................................................................................ 52
Table 3 - Customers’ influential factors to stay in the bank(s) .............................................................. 56
Table 4 - Score of banking industry in USA ....................................................................................... 57

x
List of Acronyms
ACSI : American Customer Satisfaction Index ATM : Automated Teller Machine AVG : Average BDT : Bangladeshi Taka CRM : Customer Relationship Management CS : Customer Satisfaction CSI : Customer Satisfaction Index ECSI : European Customer Satisfaction Index EU : European Union EUR : Euro GDP : Gross Domestic Product HSC : Higher Secondary Certificate IPMA : Importance Performance Map Analysis PhD : Doctor of Philosophy PLS : Partial Least Squares R2 : R-squared SCSB : Swedish Customer Satisfaction Barometer SEM : Structural Equation Modeling US : United States USA : United States of America USD : United States Dollar


13
1. Introduction In introduction a brief background has been given to the motivation of the research and research question. It is followed by parts from the whole thesis in order to prepare the readers what is to come. Some topics in introduction are for example banking, customer satisfaction model, context of the problem, issues, research objectives, methodology and other minor parts connected to the thesis.
1.1. Background Banks are on the rise in developing countries and have a significant impact on a country's GDP. It is crucial for banks to maintain an efficient customer satisfaction in order to retain the customers and to make profit. This is one of the most important strategies for banks and customers are one of the factors for their revenue generation. There exist also differences in customers’ perception of customer satisfaction and banking in developed countries and developing countries. In this study the focus has been on Bangladesh in order to measure the customer satisfaction of banks there. As mentioned prior banks have also an increasing rise in Bangladesh and stand for high shares in the country's GDP (Siddiqi, K. 2011). The rise of banks in Bangladesh and their impact on the country's GDP makes it interesting to research about customers’ satisfaction on their banking experience and check how it stands against customer satisfaction indexes in developed countries context. This is because customer satisfaction has a direct impact on the performance of banks and in turn the country's GDP. Following the motivations, the main research problem of this study is the ‘’Customers’ perception on their satisfaction about the private banks in a developing country’’ with the perspective of private banks in Bangladesh. The study is measured by a customer satisfaction model and by determining factors that lead to customer satisfaction. The factors have in turn lead to a customer satisfaction model by identifying customers’ perception of their satisfaction. The customer satisfaction model has been used to check how the customer satisfactions statistics from Bangladesh stand with the customer satisfaction index from a developed country. A slightly smaller comparison with two developed countries has been made. The existence of literature about the customer satisfaction of banks and customer satisfaction models in Bangladesh is not enough which made it logical to examine that country. The customer satisfaction factors have been used to examine what differences there are between customer satisfaction in developed and developing country (Bangladesh). This leads to the questions: Is banking going to be different and how is it different? and will customers’ satisfaction be different based on the different factors? These questions are interesting because they could be used in practical life in order to refer marketers and researchers to get better insight into customers’ satisfaction and the differences in customer satisfaction between developed and developing countries.
1.1.1. Banking Factors in Developed and Developing Countries Banks in developed countries commercialize their banking activities in order to achieve their basic aim which is to offer banking products and services to their customers. Customers have an important position in the banks because they are the buyers of the banks products and thus contributing to the profitability of a bank. It is also supporting the bank's competitive advantage in this way (Chochoľáková, A. et. al. 2015).

14
In banking management, the loyalty and customer satisfaction are an important aspect and it is recommended to keep them on a high degree. It is also stated that quality of interaction is the most vital determinant of customer satisfaction followed by service environment, reliability, and empathy (Chochoľáková, A. et. al. 2015). On the other hand, in developing countries, there exist a connection between service quality attributes and customer satisfaction and it has been revealed that the relationship between customer satisfaction and customer loyalty is positive. Service quality is a factor that leads to customer satisfaction and that in turn leads to customer loyalty. It is important for banks in developing countries to understand the concept of providing services that are excellent to their customers in order to achieve a competitive advantage (Sabir, R. et. al. 2014). The expectations of customers are the foundation of customer satisfaction and it is also an indicator of purchase intentions and brand loyalty of customers. Brand loyalty and product repurchase are things that are generated primarily by customer satisfaction. In addition, service quality is the quality of service attributes and also takes into consideration how the customer behaves towards the service. Service quality has been viewed as a critical factor when it comes to the success of a business and especially in the banking sector (Sabir, R. et. al. 2014).
1.1.2. Customer Satisfaction Model Some factors that determine customer satisfaction are perceived quality, customer expectations, and perceived value. These three factors lead to the overall customer satisfaction index and later to customer complaints and customer loyalty. Customer complaints can be negative while on the other hand customer loyalty is perceived as positive. These customer satisfaction determinants are from the American Customer Satisfaction Index (ACSI) model which gives a forward and backward overview of the factors. The ACSI model is explaining customer satisfaction in the banking sector in developed countries context (Fornell, C. et. al. 1996). Through this study this model has been used in order to see whether it works in a developing country context, especially focused on Bangladesh.
1.1.3. American Customer Satisfaction Index The American Customer Satisfaction Index (ACSI) is developed by Dr. Fornell, the National Quality Research Center, the University of Michigan Business School, and some American experts and was used first time in the year 1994. It was developed on the foundations of the Swedish Customer Satisfaction Barometer Index model and is the basis model in EU. It is also widely used in New Zealand, China, and Taiwan (Tao, 2014). The ACSI is new and measures market-based performance of firms, industries, economic sectors, and economies. It measures more specifically the goods and services that are used by customers and the quality of it. The main concept of ACSI is to get a measure of the overall customer satisfaction. ACSI gives an overview of customer satisfaction that is both forward- and backward-looking. It also gives means to assess of consumer and produced quality in the economy such as products and services (Fornell, C. et. al. 1996). This tool is useful for managers and investors as it can provide important measure of past and current performance and also the financial status. The reason for this is because it measures customers which are one of the most revenues-generating assets of a firm. Customer satisfaction

15
that is high usually means that it should increase loyalty and protect market shares from competing firms. The ACSI can be shown in appendix 1 and it consists of perceived quality, customer expectations, perceived value, overall customer satisfaction, customer complaints, and customer loyalty (Fornell, C. et. al. 1996).
1.1.4. Overview of Banking Sector in Bangladesh The banking industry in Bangladesh is highly competitive and centralized, which is controlled by the central bank (Bangladesh Bank). After independence (16th December, 1971), the banking industry started its journey along with 6 nationalized commercial banks that acts by offering safe and efficient payment system for the general public (Freixas, X. & Rochet, J. 2006), 2 state owned and 3 foreign banks. The expansion of banking industries achieves significance since 1980s with the entrance of private banks. At present, banks in Bangladesh are two types; scheduled banks (operate under bank company act, 1991) who operate under full control and supervision of Bangladesh bank and non-scheduled banks that are established for special and definite objective and operate under the acts that are enacted for meeting up those objectives. The biggest banks in Bangladesh are made of private commercial banks with the greatest market share in terms of industry assets and deposits. It has been estimated that around 69 % of Bangladesh GDP was made up of the financial sector and banking consisted of 58 % in 2006. This shows that the banking sector in Bangladesh is one of the most important economic players in the country (Siddiqi, K. 2011). The banking customers in Bangladesh have a strong bargaining power because of the strong influence of banks in the country. The banks need to provide efficient service because the competition for customers is high and they have to improve their service level continuously. New strategies that are focused on their customers are necessary in order to survive the competition from other banks (Siddiqi, K. 2011).
1.2. Problematization We live in a world where stress is a common theme in our lives and many people feel that they do not know how to pass their weekdays while they are engaged in running business or seeking sources of fund to start with fresh ideas. This stress can lead that customers are strict in their service by requiring faster and better service and that it puts a lot of demand to fulfill their satisfaction.
Nowadays people become more and more service oriented such as banking services and this puts a lot of pressure on companies. Many companies as banks are therefore focusing on trying to simplify people's lives. To solve financial problem and improve social status people are interested for raising fund as their own. Apart from other financial institutions such as trust companies, insurance companies and investment dealers, bank is the one that plays a vital role for people who have shortage of capital or wants to invest more capital in their existing business. Especially for the new entrepreneur funding is the key to start up with new ideas.
The concept of bank service is to attract new potential banking customers however it is also more economical to keep old customers than to acquire new ones (Sooloo, 2016). This is because long term customers buy more and are satisfied. Moreover, significant increase in some developing countries as population increases. Hence, the demand for banking services, quality of service and customer satisfaction going to be key indicator for economic growth. Banks are placing a high priority on marketing various innovative products and services which is critical to improved performance in market place in developing countries.

16
Except from the fact banking service is also interesting due to the time aspect. People feel more and more stressed and the demands for these kinds of services. It has also been stated before that the banking sector is increasing in developing countries. Therefore, it could be useful and interesting to obtain a better understanding of banking services within a particular developing country. The study will probably also get knowledge about if, how and why this is a service that works, and what customers expect and think could be improved.
1.2.1. Issues
In the current wave of economic globalization developing countries are characterized by increasing trade, foreign direct investments, short-term and long-term capital flow and have created various opportunities through establishing business network with the developed countries. Through the trend of business financial institutions in developing countries are emerging gradually especially banks while in developed countries banks as financial institutions are well-established and integrated. Ayadi, R. et. al. (2010) posit that the western banking system is often viewed as commonality with diversity as there is diversity in business models, structures, and governance.
On the other hand, in (BIS papers, 2001), state that the banking system in developing countries is fragmented in terms of the number and size of institutions, ownership trends, profitability and the competitive ability of banks, use of modern technology, and other features that are connected to the structure. According to Titko and Lace (2010), the competitive power and existence of a bank lies in the degree of its customer satisfaction. Banks therefore pay particular attention to customer satisfaction (Kattack and Rehman 2010). Due to this fact banks sell undifferentiated products (Stafford, 1996), which further acts as effective tool to sustain in the competitive market. The first issue is to find out what contributes to a better understanding of customers’ perception on their satisfaction. It has been shown that customer satisfaction is a crucial factor for the success of a business and it is important to understand it in order to achieve its fullest potential.
Oliver (1980) contends that when the customers compare their perceptions of actual products/services performance with the expectations, then the feelings of satisfaction have arisen. Any discrepancies between the expectations and the performance create the disconfirmation. Hence, customers’ perceptions are determined by myriad of factors. Kotler., et al (1999) posit that individual’s consumption behavior is influenced by personal characteristics like age and life-cycle, occupation, economic situation, lifestyle and personality and self-concept. Therefore, it is assumed that private banks in developing countries are quite able to provide one stop services, which exactly deserves the customer. Moreover, private banking services are smart enough in using modern information technologies, which make the people faster to effective utilization of time. The second issue is how consumer behavior affect on their satisfaction.
The customer satisfaction model is a useful tool in order to measure the customer satisfaction and to analyze results from it. There exist many different customer satisfaction models for example American Customer Satisfaction Index (ACSI) model, European Customer Satisfaction Index (ECSI) model, Customer Satisfaction Index (CSI) model, etc., and there exist also many other customized models. The ACSI model has many factors that show and that affect the overall customer satisfaction and they have been stated in the subchapter 1.1.3. ACSI. The ACSI model shows current and past performance of customer satisfaction and takes into consideration of the customer which is important in the revenue aspect of a company as mentioned before (Fornell, C. et. al. 1996). The third issue is how a customer satisfaction model can be used in order to measure the customer satisfaction in the banking sector.

17
There is previous research about banking in developed and developing countries and they highlight the structures of banking in each specific area. The existence of information about banking, customer satisfaction in banking, relationship between customer satisfaction and loyalty, and service quality is also a lot and is available on the internet. There exists no direct comparison between banking and its customers’ base in developed and developing countries. Also there is no specific concern about customer satisfaction in relation to customers’ perception in developed and developing countries. We found this missing in the prior research on customer satisfaction in banking in developing countries. This is why our focus of the study is of customers’ perception on their satisfaction about the private banks in Bangladesh to fill that missing gap in literature.
1.3. Research purpose and Research Questions Our purpose is to examine the customer satisfaction attributes through a customer satisfaction model by which we can find out how the perceptions of different classes of customers’ differ on their satisfaction regarding private banks in Bangladesh. The customer satisfaction model that is based in developed countries has been used in a developing country context which is Bangladesh. We have examined the differences of customer satisfaction model in developed countries and a developing country in order to understand their performances regarding banking industry. This all has been done through the concept of "Customers’ perception on their satisfaction about private banks in a developing country". Also this study has investigated the consumer behavior to see if some of the “influence principles” had an impact on the customers’ satisfaction when they started receiving banking services. The aim of the study is also to get a better understanding of why people take banking service, what are the banks benefit, how it contributes to increase the economy of the country. Hence, to attain deeper understanding of customers’ perception on their satisfaction towards private banks in a developing country, this study aims to answer the following questions and sub-research questions: Ø What is the key factor(s) that determines customers’ satisfaction on banks in Bangladesh? Ø What are the differences of overall customer satisfaction between developed (USA and
Taiwan) and in a developing country (Bangladesh) regarding performance of banking industry?
Sub research questions:
• Who are the targeted customer group to the bank? • What makes the customers satisfy? • How does consumer behavior affect their consumption decisions?
1.4. Significance of the Study The aim of this study is to find out the customers’ perception on their satisfaction about the private banks in developing countries. This study is mainly focused on customer satisfaction factors that affect customer satisfaction and the behavior of the customer in relation to customer satisfaction. There is no work that has been conducted regarding the examination of customers’

18
perception on customer satisfaction in Bangladesh regarding banking. Banking and marketing such as customer satisfaction, consumer behavior, etc. are some areas that were of high interest when developing this study. These factors are the foundation and motivation factors that lead to the buildup of this study. This study has contributed to increased knowledge of customer satisfaction in the banking sector in Bangladesh. It has also contributed to increased knowledge of customer satisfaction and consumer behavior which have a significant role in marketing.
1.5. Methodology
The study contains customer satisfaction survey in order to receive the needed information about the private banks in Bangladesh and to know customers’ perception towards banks. Though survey designed with a customer satisfaction model in mind, but the main focus of the study is the customer satisfaction survey. The survey questionnaire split into three different sections and in first section questions are related to personal information (Demographic) i.e. account type, gender, marital status, age, education, profession, monthly income, work experience, family type, transaction period and frequency in using bank.
The second part consists of questions related to quality of service, customer satisfaction, customer loyalty, perceived value and customer complains. This produce control data, which gave us an understanding of the customers and contributed to the analysis of the results. By adding these variables, it presented some pattern that explains the research questions; "customers’ perception on their satisfaction about private banks in a developing country"? What makes the customers satisfied? etc.
Our survey disunites respondents into three customer groups (Most important, moderate level, and ordinary customer) to acquire knowledge about all groups of customers and information about the decision that they make to obtain banking product/service. We mainly focused on gathering the information that affects the customer satisfaction level. The reason for this survey was to gain a better understanding of customers’ feelings towards banks and if they are more interested to it and if the banks could improve something.
Before we start collecting the data we did some pre-tests to ensure that the questions are workable and that they will give us useful answers for the analysis. In order to choose and gather convenient information, we included the words "how" & "satisfaction" in research questions. Why do the participants obtain the service, and what is it about the concept that makes the customers continue having this service, or not? In order to answer these questions, we handed out survey including questions regarding their thoughts, needs and feelings about receiving banking services. We found respondents through our objective list (Email) and mostly independent questionnaire (Face to face) interviews. And then, people who want to answer, answers and therefore this been a self-selection sampling. Because of that the results from this research might not be representative for all the customers, but it will provide information and a better understanding of the customer satisfaction.
Secondly, the data that we collected and received through the questionnaires has been executed by the customer satisfaction model using the partial least squares (SmartPLS) Software application. First we made different benefits that we thought have an impact on customer satisfaction and then analyzed the different impact that have on customer satisfaction. Due to that, we became able to do a performance improvement graph where it clearly stated what kinds of products/services banks offer should focus on in general, both to make the customers more

19
satisfied but also to make them stay. Finally, we analyzed and linked collected data with the theoretical background to get a better view of the issue.
1.6. Empirical Study
Through the implementation of methodology, we found our empirical results, where customers’ demography and individual perception towards private banks in Bangladesh was different among three categories of customers’ group. We illustrate those customers’ demographic information separately throughout chapter 4 (Empirical results) based on their perception due to having variation in three groups of customer responses. Also our pilot study results from the most important and moderate level of customers has been presented within empirical results chapter. Finally, the overall results are further described by the customer satisfaction model and compared with the conventional one through analysis in chapter 5 (Analysis).
1.7. Outline of the Study This study is organized into six chapters and the first one being the introduction. The introduction chapter begins with the background that describes the general ideas about banking industry. It later on moves on to context of the problem, issues, research objectives, significance of the study, methodology, empirical study, and outline of the study. This chapter is designed to give a brief introduction of the subject and research problem followed by presenting small parts from the thesis to prepare the reader for later chapters. Chapter two consists of the literature review which aims at explaining banking, concept of consumer behavior, customer satisfaction, expectation, quality of service, loyalty, relationship between customer satisfaction and loyalty, categories for the customer satisfaction model, ACSI, and customer classification. Chapter three consists of methodology, chapter four is empirical results, and chapter five consists of analysis where customer satisfaction results will be explained and analyzed. Chapter five will be based on the findings and chapter six is where the conclusions will be made and further research will be suggested.
20

21
2. Literature Review In this part banking has been explained and the differences in developing and developed countries. It is followed up by consumer behavior and customer satisfaction factors which are important parts in marketing. The American Customer Satisfaction Index (ACSI) model has been explained in this part and also the Customer Satisfaction Index (CSI) which is a fundamental part to all these customer satisfaction models. Customer classification has also been explained and it has a crucial part in the study’s methodology and is a reason why the customers were divided in different groups.
2.1. Banking Banks as financial institutions play a vital role in the economic development of any country. According to Heffernan, (1996) banks accept deposits of customers, both from individuals and organizations and lend them to other customers. Also, banks offer investment advice to their most valuable and potential customers engage in foreign exchange trading and processing payments. The role of banks is to grant loans and receive deposits from the public and this is also a simple definition of what a bank is. It is the combination of lending and borrowing that is typical to commercial banks. Banks give loans based on how much deposits they get from the public and this is how this combination functions. The term public is also used for banks and it refers to the unique services offered from the bank to the general public. Commercial banks offer a safe and efficient payment system for the general public (Freixas, X. & Rochet, J. 2006). Banks play a vital role in the allocation of resources and especially the capital allocation. A financial system that is well developed is used in order to improve the household consumption and to allocate capital that is physical to business areas that are in need of production. Bank systems have been used for economic functions from the renaissance in Italy to the modern world that we live in now (Freixas, X. & Rochet, J. 2006). In the complementary theory about banks a categorization of banks is done and their function is divided into four main aspects. The first aspect is that banks offer a payment system and access to it, the second aspect is that banks are used in transforming assets, and the third aspect is that banks are managing risk. The fourth aspect is that banks are used to process information and to monitor borrowers (Freixas, X. & Rochet, J. 2006).
2.1.1. Differences in Banking in Developing and Developed Countries There is a difference in banking between developing and developed countries. One example is that the development of banking systems in developing countries is still in progress and requires a lot of time before they can be developed and considered western (Jaffe, D. 2001). It is also affected by the forces of change like for example e-banking (BIS papers, 2001). The banking system in developing countries is fragmented in terms of the number and size of institutions, ownership trends, profitability and the competitive ability of banks, use of modern technology, and other features that are connected to the structure. It is very common that in developing countries there exist three or four large commercial banks that work in the same area together with a number of rural and urban banks that are smaller. Many of the banks are family owned especially in the Asian continent while the banks are more public in Latin America and

22
central Europe. It is also stated that few commercial banks are listed in the stock exchange which is an interesting aspect (BIS papers, 2001). The banks in the western world, referred to as the developed countries have characteristics that they are well-established and integrated. They are an important part in the diversity of Europe and they have their own business models, ownership and governance structures. The interesting aspect of European banks is that there doesn’t exist a set of homogeneous factor and that there are diversities within and between countries as mentioned prior. The European banking system which is western is often viewed as commonality (A sharing of features or characteristics in common) with diversity because there is variation in business models, structures and governance (Ayadi, R. et. al. 2010).
2.1.2 Online Banking and Differences between Customers Retail banking industry has aimed to cut its cost by introducing online banking and it has been used within the last twenty years with the aim to connect customers to the online banking system. The banks can profit by examining their customers and having knowledge about costs and profitability of sales channels and transaction is not enough. Customer-centric strategies can be developed by taking customers in account and by understanding them (Berger, S. 2007). Difference exists between customers using online services and customers not using any online banking tools at all. It has been shown that customers that use online services tend to be younger and around 40 years of age. The offline banking customers tend to be around 51 years old and the study has shown that online banking customers tend to be more educated than customers that are offline. Secondary education is more common for the offline banking customers and is around 82 %. The same education is 60 % for online banking customers and they also have an education at A-levels around 37 %. A-level education consists of 13 % for offline banking customers compared to online banking customers. It has been shown that online banking customers have a higher monthly income and it is above EUR 3.000 (BDT 2,65,976) for 10 %. It has also been shown that credit cards is the most common methods of payment over the net and it consists of 68 % of the online banking customers that have a credit card. For offline customers the possession of a credit card is around 29 % (Berger, S. 2007). From bank's perspective the online banking customers are of high importance and their income is high. Higher income customers have a higher interest and demand for banking products and are interested in more sophisticated and riskier products. They usually use online banking regularly and have no need for meeting up personally with the bank employees. Banks are required to identify these kinds of customers and pay attention to them in order to maximize the opportunities for sale (Berger, S. 2007).
2.2. Consumer Behavior Concepts
Bray, J. states that consumer decision making has been studied for a long time by varied economists 300 years ago. Consumers are viewed as decision makers when they are rational and have a high self-interest in the field. Consumer behavior has been developed in 1950 when it first was mentioned in the marketing field and it has also been a proponent of modern marketing. Two definitions of the concept of consumer behavior are following:

23
“Consumer behavior…… is the study of the processes involved when individuals or groups select, purchase, use or dispose of products, services, ideas or experiences to satisfy needs and desires.” (Bray, J.) “The behavior that consumers display in searching for, purchasing, using, evaluating, and disposing of products and services that they expect will satisfy their needs” (Bray, J.)
Consumer behavior is influenced by two factors: motivation and personality. These factors are essential in order to understand consumptions patterns and preferences (Montgomery, J. July). Hence, Kotler., et al (1999) posit that individual’s consumption behavior is influenced by personal characteristics; age and life-cycle, occupation, economic situation, lifestyle and personality, and self-concept.
Every day people are influenced by things around their environment that changes behavior, attitudes, intentions, thinking, and actions. According to Cialdini (2009) there are six different ways of persuasion or influence and in this study the focus has been on three of them which are scarcity, social proof and liking principle. These three ways of persuasions have been chosen because they are connected to CS better than the other ones. One is scarcity and it relates to consumer behavior because it could for example affect the consumers’ wants, interests, decisions, purchases and satisfaction, and willingness to pay. All of these are factors of desire, acquisition and consumption that Pham (2013) argue are different stages of consumer behavior. It is because people are not always rational in their decision making (Cialdini, 2009). The scarcity principle is interesting in that people actually follow other people's preferences, even though they are aware of that every individual have different tastes, interests and needs. The value of an item increases if it is scarce and others want it to.
The way scarcity relates to consumer behavior is because if a product or service is scarce it might tell that it is popular among other customers, which therefore could change consumer behavior because of the increased value and the opinion of others. Cialdini (2009) also mentions that competition plays a big role in the scarcity principle because of its powerfully motivating properties. This means that people do not want miss out on the freedom of choosing the products or services they want, especially when others want it as well. People want to be able to buy what they want, so this motivates consumers even more to buy the item so they do not lose it. So obviously “the rule of few” can change the behavior, consumer suddenly wants an item because it is limited and it seems popular and they want it even more when they are not sure if they can have it because of competition.
In addition, this principle has some similarities with the social proof principle (ibid.). If products are scarce it could mean that the product is popular/liked among other consumers, and therefore the value increases. This means that consumer choose what they think others have chosen, just like social proof has shown, so we do not miss out on anything good.
Similarly, liking principle can directly relate to consumer behavior since people are persuaded by other people that they like and firms can improve marketing strategy by understanding how consumer feel, think, behave while choosing between alternatives (banks) and how the philosophy influenced by his or her environment (culture, friends and family, media). Also by using liking principle firms can trigger new motivational technique based on consumer desire. Cialdini (2006) describes that people are more likely to buy if they like the person selling to them, which means biases toward people who are more attractive. He states 5 factors that supremacies the liking principle: Physical attractiveness - According to "halo effect," physical

24
attractiveness is a positive characteristic that dominates other by favorable traits. i.e. kindness, honesty, and intelligence. Similarity - People like others similar to them in terms of interests, opinions, personality, and even in same dress code. Compliments - People love to receive praises, and tend to like those who give it. Contact and Cooperation - People feel harmony once working with others to fulfill a common goal. Conditioning and Association - People like looking at product representative, and thus become more favorable towards the product they are representing. Consumer behavior is connected to customer satisfaction because it shows how customer satisfaction makes customers more loyal and that in turn leads to increased profitability for banks. By being able to influence the customer then it is more likely to make the customer more satisfied and in turn be more loyal (Alnsour, M. 2013).
2.3. The Concept of Customer Satisfaction The concept of customer satisfaction has a central position in marketing, as it is a major outcome of marketing activity and it links the processes of purchase and consumption or use of the product or service says Sabir, et al. (2014). According to Oliver (1980), the customer satisfaction model explains that when the customers compare their perceptions of actual products/services performance with the expectations, then the feelings of satisfaction have arisen. Any discrepancies between the expectations and the performance create the disconfirmation. It is obvious that customers have different preferences and perceptions regarding their consumption experience. In customer satisfaction this is labelled as customer benefits. These benefits contain different attributes that describe which aspects and characteristics that is preferable for a customer and hence, evaluate the comprehensive consumption experience. This content will increase the possibility for the product or the service to be bought once again, in other words, loyalty can be established (Gustafsson & Johnson 2004).
Another way to measure satisfaction is through transaction-specific satisfaction measures that relates to a customer’s evaluation of his or her experience with and reactions to a particular product transaction, episode, or service encounter. Through this, specific and complex information about a customer’s psychological reaction to the performance of a certain product or service provider can be captured (Fornell, Johnson, Anderson, Cha, & Bryant, 1996; Lervik-Olsen & Johnson, 2003). The other way that mentioned in the recent paragraph is more overall customer satisfaction, which in comparison is a more fundamental indicator of the firm’s performance, both now, before and in the future (Fornell et al., 1996).
This overall customer satisfaction could also be associated with collective evaluation, which in turn could be associated with loyalty (Lervik-Olsen & Johnson, 2003). Satisfaction is a fundamental concern for customers’ and firms including banks. According to Titko and Lace (2010), the competitive power and existence of a bank lies in the degree of its customer satisfaction. Banks therefore pay particular attention to customer satisfaction, (Kattack and Rehman 2010). Due to this fact banks sell undifferentiated products (Stafford, 1996), which acts as effective tool to sustain the competition in the market on the quality and service of a bank. Again, Bowen and Hedges (1993) claim that banks that offer very high quality services have a competitive advantage because the benefits of improved quality of service are large market shares, increased profits and increase in customer retention.

25
2.3.1. Expectation Expectation is an important factor in customer satisfaction and it is recommended for companies to understand what influences expectations and how to properly manage them. Expectations made up of customers are pre-experience beliefs of an experience that hasn’t yet come. It has also been stated that the dynamics of expectations is important to understand in order to better control the expectations and to faster achieve customer satisfaction (Andersson, M. & Liedman, G. 2013). The expectations are difficult to identify if the customer has little prior experience of the service and knowing if the customer has a need for change. The customer can also be unclear in what problem he/she has and what solution he/she needs. The customer can also have problems in knowing what he/she wants and also at the same time expect to receive it. An efficient management of customer’s expectation is knowing what the customer wants and to make it clear. This is because the customer can sometimes not know himself what he wants as mentioned prior. It is stated that in order to successfully solve the problem it is necessary to have a successful problem formulation stage (Andersson, M. & Liedman, G. 2013). When the expectations become clearer for the customer then is it easier to explain what the customer wants from the supplier. The expectations can then either be realistic or unrealistic to achieve. Expectations that are unrealistic cannot be matched by the level of service quality and it should take into consideration to lower them. If expectations are too high and unrealistic for the industry then measures should be taken in order to increase the performance of the process (Andersson, M. & Liedman, G. 2013).
2.3.2. Quality of Service Service quality attributes are connected to customer satisfaction and the relationship between them is positive. Service quality as a factor leads to customer satisfaction and to loyalty from the customer. Banks can achieve a competitive advantage if they understand the concept of providing high quality services to their customers. The factors that determine customer satisfaction can be seen in figure 1. Service quality is the quality of service attributes and also takes into consideration how the customer behavior is towards the service. Service quality has been viewed as a critical factor when it comes to the success of a business and especially in the banking sector (Sabir, R. et. al. 2014). In order to increase the quality of the service it is important to define what a service is. It is defined as following “A service is a process consisting of a series of more or less intangible activities that normally take place in interactions between the customer and service employees or physical resources or goods and/or systems of service provider, which are provided as solutions to customer problems’’ (Sabir, R. et. al. 2014).
Figure 1 - Factors determining customer satisfaction (Sabir, R. et. al. 2014)

26
2.3.3. Satisfaction Satisfaction is a subjective concept and therefore difficult to determine, (European Institute of Public Administration, 2008). It depends on different factors and varies from person to person. The aim of businesses is to attract and sustain a customer market and the sustain part is done by satisfaction and is also vital for performance of the business. It is recommended for a company to have satisfaction that is high in order to meet the aim. Competition is forcing companies to have a higher focus on satisfying customers. Higher customer satisfaction and loyalty are factors that are generating outcomes that are positive for a company. Customer satisfaction is also an indicator on how services and products that are supplied by a company engage customer expectations and if they exceed the expectations (Collins, K. & Sarpong, A. 2014).
High competitiveness in the modern day and markets is achieved by having a proper customer population that is sustained well. Industries understand why customers are important and it is because they are buying their services and products. This increases the profitability for industries and strengthens their position on the market. Satisfaction is a tool that is used for building relationships and is about meeting one’s expectations to the fullest. It is also an emotion or attitude of a customer towards a service or product after it has been used (Collins, K. & Sarpong, A. 2014). It is important for industries to support the customer in varied ways and some examples are by having a complex infrastructure and mechanism to efficiently support the customer. The infrastructure should design, produce, and distribute the products and services in a perfect order in order to be used by the customer. It has also been shown that companies that have higher satisfactions levels also have higher returns. Customer satisfaction can produce 11.4 % in higher return on investment if the annual customer satisfaction is increased by 1% (Collins, K. & Sarpong, A. 2014).
2.3.4. Loyalty Loyalty is often defined as a measurement for a customer’s intent to repurchase from a product or service provider, which is directly related to the profit (Fornell et al., 1996). According to Gustafsson, A. et. al. (2005) there exist two different types dimensions of relationship commitment that drive loyalty. The first one is affective commitment that is shaped through personal interaction which are reciprocity and trust. The second one is calculative commitment and is shaped by switching costs. Loyalty is in a way similar to retention and is a foundation of customer relationship management (CRM).
Customer loyalty in banking industry is achieved by having a superior quality on the banking services directed to the customers. It is also a result of a company that has created a benefit for customers so that they will remain and increase purchases with the company. It is a commitment shared by the customer to the company and its services and products. The customer may in the future choose the company over others and despite different marketing efforts to switch behavior. Customer loyalty is in its true form when the customers without any incentive advocate for the respective company (Mohsan, F. 2011). In order for loyalty to function, satisfaction is a factor that is crucial for the company’s relationship with the customer and is also a prerequisite for increased loyalty. Satisfaction is also a factor that influences if the customer recommends the bank to others and also if he repurchases. It generates loyalty in a way that the customer has a favorable attitude for the company (Bank). When customers recommend the company to others, then it produces repurchase and loyalty

27
towards the company. The fundamental principle of loyalty is to get customers to recommend a service or product to others (Mohsan, F. 2011). Emotions are an effective tool and are about creating right relationships with the customers. The emotions are created when the bank is communicating with the customers and is not based on rational considerations. It also shows that the more positive and stronger the emotions of the customer are to the bank the more lasting are the relationships with the customers. Customer satisfaction is a predictor of customer loyalty and the more the customers are loyal to the bank the better the reputation it gets because of the customer’s recommendations to others (Chochoľáková, A. et. al. 2015). Loyalty is an object formed in the mind of customers and is the result of the customer attitude towards the banks products and services. It is also a rational process that takes into consideration previous experiences with the business relationship. The author states that satisfaction, market position, service reliability and efficiency contribute to the customer loyalty and his ability to purchase more for services and to accept errors in these services. The business performance of the banks depends on satisfied customers. It is an indicator of revenue and customer base growth for banks. It also increases the cross-selling activities that a bank possesses (Chochoľáková, A. et. al. 2015).
2.4. Customer Satisfaction Index Satisfaction is crucial element for service firms in modern times with high business competition and customer satisfaction is the aim of total quality management. In relationship-marketing outcomes customer satisfaction is observed as a strong determinant. All service firm are in need of customer satisfaction because of the reason that it is promoting loyalty. Some benefits of customer satisfaction are that it increases competitive ability by is isolating market shares from competitors, attracts new customers, and increases the chance for price premium. Customer satisfaction also improves a firm’s reputation in a positive way. By recognizing the importance of customer satisfaction to business have made researchers and practitioners interested in how to measure customer satisfaction. Varied approaches and methodologies have also been developed due to this interest (Kim, D. et. al. 2009). Corporations in today's world are facing high competition and must in that way determine the importance of qualitative and quantitative performance factors to survive. Customer satisfaction is a qualitative success factor for businesses and a customer satisfaction measurement is needed for them. This is the reason why indexes have been developed, launched, and put to use in a lot of countries. National indices have been established in the last 20 years. The first one was developed in 1989 and is the Swedish Customer Satisfaction Barometer (SCSB) and next one to it is the German customer barometer - quality and satisfaction and was developed in 1992. Customer Satisfaction Indices (CSIs) build economic policy decisions, contribute to better living standard, and gives a measure of goods and services by their overall quality. A transaction-specific satisfaction measure is a lower indicator compared to national CSIs which is viewed as a significant indicator of performance of firms (Kim, D. et. al. 2009). Suggestions about using CSIs have been made by many countries as a measurement of overall customers’ satisfaction in a standardized way. CSI is used for firms, industries, and consumption of products and services that is nationwide. CSI can be used on national level and is then a useful tool because of its application in industry and company is widely accepted. It describes in industry the overall purchase and consumptions experience and companies can use industry CSI

28
for comparison that are in the same industry. CSI that is connected to a single firm can explain its customers’ overall evaluation of its market offering (Kim, D. et. al. 2009).
2.5. American Customer Satisfaction Index The American Customer Satisfaction Index (ACSI) is a standard model and is used in order to generate information related to customer satisfaction. It can be used as an indicator for economic performance for firms, industries, and national economies. It is used as a tool to measure goods and services that are experienced by the consumers and it also measures the quality of them. The ACSI model can be seen in figure 2 and it has multiple indicators in order to measure the overall customer satisfaction. It consists exactly of six variables and the figure 2 presents ACSI model with their variables and their relationships (Feng Cheng, 2013).
Figure 2 - ASCI model with relationships (Feng Cheng, 2013)
Perceived quality is the evaluation from the market about the service usage experience that is recent. It is based on the experience that is customized and the reliability of the service. The customer expectation is about previous service experience and beliefs that are future looking regarding the ability of the provider to offer desired quality. Perceived value is about the price aspect and adds it to perceived quality and it is about quality for money perception (Kim, J. & Lee, H. 2013). ACSI as shown on the figure 2 is made up of a system of cause and effect relationships and it runs from expectations, perceived quality, and perceived value to the overall customer satisfaction, complaints and loyalty. Perceived value adds the price information into the model and can be used for comparing and interpreting results across firms and industries. Prior consumptions experience with the firm’s offering is added to perceived expectations and it includes non-experiential information available. Non experiential information is for example like advertising and word-of-mouth and is about the supplier's ability to deliver quality in the future and it is used as a forecast. Expectations capture all previous quality, experiences and information and are both forward- and backward-looking. It has also a direct and positive association with the performance of a company and overall customer satisfaction (Feng Cheng, 2013). The ACSI model shows that there is a relationship that is positive between perceived quality, perceived expectations, perceived value, overall customer satisfaction, and customer loyalty. Customer complaints and customer loyalty are the final relationships in the model. ASCI model has been used before in various industries and in especially the banking industry for measuring services. Customer satisfaction leads to positive effects regarding customer loyalty and had negative effect in terms of customer complaints. Products and services are also explained by

29
overall customer satisfaction, loyalty and customer complaints in a direct way (Feng Cheng, 2013). It is also important to note that customer satisfaction is more quality driven than value- or price-driven and increased customer satisfaction leads to decreased customer complaints and increased customer loyalty. ACSI is important for managers and investors because it provides a measure of the firms’ performance in the past and current, it also provides as an indicator of future financial health for the firm. Customer satisfaction is about customers and it is one of the most important revenue generating factors for a firm. ACSI is a good tool when making purchase decisions and will also to lead to that the quality of goods and services increases and also that the overall standard of living increases (Fornell, C. 1996).
2.5.1. The Science of American Customer Satisfaction Model The ACSI was developed at the University of Michigan’s Ross School of Business and uses input such as customer interviews to a multi-equation econometric model. ACSI model is a cause-and-effect model with the drivers of satisfaction on left side which are customer expectations, perceived quality, and perceived value. ACSI is in the center and is named overall customer satisfaction and this part is the ACSI compared to the ACSI model which consists of all the parts. The outcomes of overall customer satisfaction are on the right side are customer complaints and customer loyalty. ACSI model can be seen on figure 3 and ACSI is highlighted in it (Theacsi.org, 2016).
Figure 3 - ACSI model with left and right parts (Theacsi.org, 2016)
All the parts in the ACSI model are multivariable components that are weighted within the model and are made of several questions. The questions that are determinants of each index try to get the customers perception on some aspects connected to each index. The arrows in ACSI model have the function as impacts and also show the relationship between each index. Users can by observing the indexes and impacts come to a conclusion which parts are the drivers of satisfaction. It would also show an improvement would have effect on customer loyalty and to what degree and the scale that is used on ACSI model is usually from 0 to 100 (Theacsi.org, 2016).
2.5.1.1. Customer Satisfaction (ACSI) Weighted average of questions is used in the calculation of the customer satisfaction ACSI and it shows customer satisfaction perceptions with a product or service. Software technology is used by ACSI researcher for weighting estimation for each question (Theacsi.org, 2016).

30
2.5.1.2. Customer Expectations Customer expectations involve the anticipation of products and services quality that is done by the customer. They involve prior consumption experience and marketing aspects like for example advertising, word-of-mouth, and forecasting into the future how good a company can deliver quality (Theacsi.org, 2016).
2.5.1.3. Perceived Quality Perceived quality is connected to recent consumption experience by the customer of a product or service. It is measured with customization and reliability, the first one is how well the product and service meets the individual's needs of the customer. The second one is the measurement on how frequent products or services go wrong (Theacsi.org, 2016).
2.4.1.4. Perceived Value Perceived value is connected to the price paid and the quality offered from it. Value for money for the first purchase of customer is important and it has been stated that it has a smaller impact on satisfaction regarding repeating purchases (Theacsi.org, 2016).
2.5.1.5. Customer Complaints Customer complaints consist of negative respondents from customers who have had a bad experience with the service or product and have complained about it. They have complained directly to a company and within a specific time. The relationship between satisfaction and customer complaints is negative and the higher the satisfaction is the likelihood that the customers will complain is smaller (Theacsi.org, 2016).
2.5.1.6. Customer Loyalty Customer loyalty stands for profitability and works like a proxy for it and is a critical part of the model because of it. Customer loyalty is about the customer’s likelihood to repurchase from a same supplier in the future. It is also about the likelihood to purchase at various price points which is the price tolerance of a company’s products or services (Theacsi.org, 2016).
2.6. Customer Classification Dynamic theory of exchange relationships is needed for management of an entire portfolio of customers who are at different relationship stages. This is needed in order to capture the trade-offs between scale economies and lifetime customer value. The differences in types of relationships leads to different profit mechanisms and that the marketing strategies of sellers should consider different relationship levels in their entire portfolio of customers. This process is named customer portfolio management. In marketing it is stated that the phenomenon that is taking place in the dynamics of a marketplace is the relationship exchange that needs to be explained, predicted, and controlled (Johnson and Selnes, 2004). When the customer has paid and received the product then it is when the exchange relationship is doing its purpose and this is all done at a basic level. The customer and the supplier collaborate in some relationships like for example they share information, socialize, integrate or link activities. To the relationship they even commit future resources and an exchange relationship is used for creating value as a mechanism. Value is created through coordination of production, consumption, and related activities that are going on for supplier and customer. There are also various factors that are originating externally and that have an influence in exchange relationships
31
on how value is created. It is important that in detail explore how firm, customer, and industry factors affect activity in economy and that is relationships organized (Johnson and Selnes, 2004). The customer and supplier is needed for the development of an exchange relationship and it also depends on their ability and motivation to participate. In order to understand the value creation across an entire customer portfolio then it is necessary to understand individual relationships which are the building blocks. Individual exchange relationships are mainly economic relationships. Relationships evolve and can change from acquaintances, to friends, to partners. Social mechanisms for creating economic value changes because trust and commitment exist in these relationships (Johnson and Selnes, 2004). Customers and suppliers are strangers in a pre-awareness state or before pre transaction period. Strangers may become customers that have not yet entered a market at an industry level. Customers from a competing supplier may be included as customers at a firm level. When there has been a transaction then awareness and trial has been achieved. A familiarity that is minimum has been established and the customer and supplier become acquaintances. An exchange relationship has been established at this point (Johnson and Selnes, 2004).
2.6.1. From Acquaintances to Friends Competitors are in a constant process trying to adapt to changes that come from customer needs. As a result of this suppliers are involved in diversification of their product portfolios in order to attract old and new customer segments. This is done by offering differentiated products and value propositions that are first-rate. Value and profit creation is not only about parity, standardization, and repetitive operations. It is also about the customers and convincing them to search for first-rate performance and to pay a premium for it. Suppliers move from parity value that is supplying to differentiated value. This exchange in relationships converts from acquaintanceship to friendship. Development of trust is necessary in the relationship for this transformation and it can be in the brand, an individual (service provider), or an entire organization (Johnson and Selnes, 2004).
2.6.2. From Friends to Partners Research has been done on buyer behavior from industrial sector and it gives a psychological base to understand the development from friends to partners. In exchange relationship longevity, level of cooperation, and acquiescence are predicted on relationships commitment and trust. Profitability occurs when a supplier has the ability to organize and use information more effectively than competing firms about individual customers. Suppliers that have information and knowledge about customers lead that customer benefit from it. These knowledge and information systems makes the supplier's offerings be highly personal and custom-made (Johnson and Selnes, 2004). Customer relationships constantly progress and are getting closer to value creation and there are also different relationships that are rare and progress differently. Customer and supplier relationship that is direct can be established as a relationship that is friendly and does not need to go through the acquaintance stage. Customers can also switch from acquaintances for one supplier and to friends with a different supplier. This is because the other firm which is a competitor has a first-rate offering. Friendship in this case can be established through brand building, personal selling, and doesn’t need to be through direct experience. A relationship progression that is moving from strangers, to acquaintances, to friends, and finally to partners

32
varies for firm, customer, and industry when it's happening. If the lifetime is long for customers the more motivation does the suppliers have in seeking closer relationships (Johnson and Selnes, 2004). Depending on how deep the relationship is between the customers and supplier the more difficult it is to make the customers change from one competing firm to another. The probability of gaining and losing customers decreases from acquaintances, to friends, to partners in each scenario. Probability level varies with the supplier’s capabilities in marketing (Johnson and Selnes, 2004).

33

34

35
3. Methodology In this part quantitative research approach has been presented followed by categories of the customers. Also data collection procedure which is based on survey has been explained meticulously. After that data analysis method for instance, what statistical program been used is described.
3.1. Quantitative Research Research can be classified into 3 main groups based on the application of the research study, its objectives in undertaking the research and how the information is sought (Sukamolson, 2010). But there are two known methods, qualitative and quantitative research which has been used mostly by the researchers. Kumer (1996), figured out the types of research, where these method poses under the subclass “Types of the information sought”. Research also can be classified depending time when the data are collected for investigation. Hence, it can be divided into 3 main groups: historical, present and futuristic research, where each group can be subdivided into many types and at the same time he cited that there are several types of quantitative research which are classified as; 1) survey research, 2) correlational research, 3) experimental research and 4) causal-comparative research. Each type has its own typical characteristics (Sukamolson, 2010). This paper focuses on quantitative research mainly followed the survey type research. A qualitative research is a method that usually attaches importance to words, and is not a preferable method to measure and analyze collected data (Bryman & Bell, 2005). The collection of number and statistics was crucial since the goal was to construct a new customer satisfaction model which could not have been done if a qualitative approach would have been chosen, since that focus on words and deeper perceptions of a phenomenon. The choice of a quantitative approach was therefore an obvious choice for this study to be able to answer the purpose and the research questions. For example, quantitative research method helps in narrow down or focuses on a specific question that can be address in the study and this often requires a careful review of the research literatures and developing hypotheses that frequently come from social theory (Neuman, 2006). In addition, quantitative methods characterize standardized surveys that are administered to individuals and are identified through various forms of sampling (Dudwick, Kuehnast, Jones & Woolcock, 2006). In data collection step, quantitative method will very carefully record and verify information, almost always in one form of numbers and usually transfer the data into computer-readable format (Neuman, 2006). Even though, quantitative data can help establish correlations between given variables and outcomes (Dudwick et al., 2006).
Survey research uses scientific sampling and questionnaire design to measure characteristics of the population with statistical precision, which enables management to make comparisons between groups (Sukamolson, 2010). Survey reveals the views of the respondents based on sample. In survey, each individual in the population has a probability of being sampled. Through which a statistical outcome could be shown. A quantitative study with surveys was as mentioned earlier required to obtain measurable knowledge about the customers’ perception towards banks and to gain a better understanding about the attributes behind their satisfaction and also collect information about which considerable factors that determinates customer satisfaction in developing countries. Because of these separate issues, the study converted into survey within three different customers’ groups.

36
The problematic issue in this study was to investigate which factors determine their satisfaction and what is the perception of customers towards banks in developing countries. This problem was analyzed through statistics, which also characterize the quantitative approach (Bryman, 2011). This study has moreover a deductive approach within the quantitative, and that means that the data collection will be based on the theories that have been found (Ibid.). Through these we constructed different questions in the surveys and in that way can be tested and analyzed. Despite the downsides of choosing quantitative research methodology in the sense of human perception, beliefs, and lack of resources to research on large scale; considering the reliability by critical analysis in a very short time frame (Within a month) the survey became the methodological approach in this paper to fill the intended research question answers.
3.2. Categories of the Customers Customer classification is used in this part in order to divide the customers in the specific groups that exist and it is explained in literature review. Acquaintances are considered as ordinary customers and friends are considered as moderate level customers. The final one partners are considered as high important customers in this study. A homogenous group of people who are holding same social status based on mentioned indicators such as age, level of education, profession, social stratification, income, number of transactions, involvement with bank products is defined as categories of customer. These three customers group probably demands customer satisfaction something unique. Hence, we deemed them as respondents of the study. In the study area there is class differentiation among people. So, three categories of people have been selected for comparing their perception towards banks. Usually in Bangladesh, banks categorize the customers into three different groups in order to manage customers’ profiles. In the bank’s perspective three categories of customers group has been used in this study specially to find out specific information from them (Source: objective list had been collected from bank official through personal contact).
3.2.1. Most Important Customers Most important customers are habituated to make transaction with a handsome amount frequently. Most of them are well educated and some have mid-level (Higher secondary/college) education as well and bearing age at least 30 or above. They might be business personnel’s such as garments or factory owners, multinational company owners, infrastructure developers, merchants etc. Most important customers are socially treated as rich and can donate for the society and nation. They might have very comfortable living standard of life. This group of customers’ monthly income mostly over 1BDT. 100,000 (One hundred thousand) equivalent to USD 1277. They are using banks products and services a lot and also feel typically comfortable talking to the banks and have an intensive interaction, transparent relationship between them (Bank and customers). Most of this group of customers might carry multiple bank accounts. They deposit huge amount of money in the bank and can have access to have big amount of loans from the bank. They are familiar with internet banking. Hence, we treated them as most valuable customers, as they are involved with the bank through major transactions.
1 Currency is converted based on the exchange rate on 11-05-2016

37
3.2.2. Moderate Level Customers Moderate level customers are people who belongs to middle class family and live in nuclear or traditional joint family, their age can be minimum 20 or above. This group of people is mostly educated. Some of them holding at least college/higher secondary certificate (1-12) years of education. This group of customers are professionally service holder either government or private, sole proprietor such as owner of small grocery store. They have certain standard of living with small pieces of land or a small house and capable of affording only one car which might be financed by the bank. Albeit they are moderate level customers, but due to their profession some of the customers are designated as respectable persons to the society. This group of customers is known as financially sound and solvent. Their minimum monthly income BDT. 30,000 (Thirty thousand) up to BDT. 100,000 (One hundred thousand) equivalent to USD 382 -1277. This customer group mainly has one type of bank account saving/fixed deposit and they might use deposit locker for their family. Also, banks allow them to use one credit card with the limited amount withdrawal capacity based on their monthly income. In addition, depending on customers’ ability to pay back the debt, bank grants them few consumer loans, for example, to renovate house or business store. Overall scenario of this group of customers addresses their less interaction with the bank and has moderate number of bank transactions. Hence, we defined them as moderate level of bank customer.
3.2.3. Ordinary Customers Ordinary customers are totally different and identical from the other two groups. This group of customers’ age is as same as moderate level of customer. Mostly their literacy level is too poor, even can be illiterate, few customers may have education up to higher secondary, but they are rare to find. We identified them basically from their occupation. This group of customers work in garments industry, factory, as office guard, clerk, rickshaw puller, driver, day laborer, plumber, cleaner, personal secretary of renowned person and so on. They mostly live in traditional joint family and leads a very simple life in certain circumstances. Due to limited income, their food consumption ability is very restricted. Their monthly earning depends on how much they can work. it varies from different types of work. Approximately it’s up to BDT. 20000 (Twenty thousand) equivalent to USD 255, which is not enough to lead a standard life. Mainly the oldest person or guardian of the family has the responsibility to run the family (Father) and holds the bank account. They might have only one saving bank account for the entire family, where their monthly salary is deposited by the organization they work for. Although this group of customer are keener on cash transaction, their interaction with the bank is very shallow and they are not familiar with the online banking system, but it has access to ATM booth as they are given visa debit card at the time of opening bank account. They do very few dealings with the bank and are not allowed to have any loan from the bank.
3.3. Data Collection Two known ways of collecting data are primary data, which is when the author collects the data himself and through secondary data where the materials collected by others are used (Holme & Solvang, 1997). In this study primary data has been collected because there are not found many existing studies within the subject especially in developing countries such as Bangladesh and it is necessary for the study to create more knowledge from the customers’ opinion and feelings by examining the satisfaction attributes and by analyzing determining the factors. To answer the

38
purpose of research questions and to be able to do a customer satisfaction model, this study contains surveys from three groups of customers (100 respondents from each group), which is a good option when you want to collect a lot of raw data that will be analyzed statistically (Bryman, 2011), which has been implemented throughout this study. It is also considered as easier, faster and cheaper to administer than for example interviews (Ibid.). The study was performed among three different customers group in Bangladesh and presented to most important and moderate level customers through email and ordinary customers through street sampling (In person interviews). The survey was constructed on google forms and was served as a link where the participants were given information about the purpose of the study and they got the information about their anonymity in the accompanying information. Before preparing final version of survey questionnaire, several draft versions were made and presented in a regular interval to the thesis advisor for reviewing. When the results contained as many respondents as needed, the result was analyzed and compared among three different groups.
Because of the purpose, the survey has been conducted into three different customers’ group to gather the demanded information about the banks. Both the English and Bengali version of the survey questionnaire is available in the appendix 2 and 3.
3.4. Customer Satisfaction Survey
This survey for the customer satisfaction model has been chosen to gather convenient information for the study. It was also necessary for the research questions to include the words “how” and “satisfaction’’. Therefore, this survey contained questions regarding different satisfaction attribute. In this survey, the questions were divided into the different benefits which were described in the literature review. These benefits contain different questions that are linked to the different benefits. These questions later show how much impact they have on the benefit, which in turn implies how much impact that benefit has on the satisfaction level.
The questions have been constructed by the authors and are based on our perceptions of the research concept and on the literature part. This is to have a better understanding of what is important for the customers and relevant for their satisfaction. When developing the survey questionnaire, it was necessary to find questions that were linked to the benefit about “perceived quality” for example, inspirations for those questions were found in the literature. Under the benefit about “Perceived expectation” theories that for example argued that expectations made up of customers are pre-experience beliefs of an experience that hasn’t yet come (Andersson, M. & Liedman, G. 2013) was used as inspiration when developing the question perceived value.
All connections between the questions and the literature are available in appendix 4 Moreover, the survey also contains respondents’ demographic information such as; account type, gender, marital status, age, education, profession, monthly income, work experience, family type, transaction period and frequency in using bank as the control data which give us an understanding of the customers and contributes to the analysis of our results. By adding these variables, it presents some pattern that can explain our research questions.
3.4.1. Survey for the Most Important and Moderate Level Customers
First two customers’ groups survey modalities were same, like as survey was conducted through our objective list (Customers’ email). First and second category survey were developed for the groups of people that have been defined separately earlier in this paper, although the same

39
questionnaire has been used for all of the three groups of customers. This is a self-selection study, which means that people who wants to be responsive and a part of the study, will be accepted (Laerd Dissertation, 2012). The disadvantage with this type of selection is that it might not be representative and that people with a certain opinion answers (For example those that are dissatisfied) (Ibid.). The questionnaire contains thirty-eight questions in three sections along with the additional suggestion and comments.
To enable a large range of potential respondents, survey for these two groups was sent out through using customers’ email. To do that, 500 most important customers and 1000 moderate level customers’ detailed list, which includes their name, the bank they are clients to, the organization with designation they work for, contact number and email address has been collected from the internal source of bank. For having quick responses, we sent out 400 sample questionnaire to the most important customers and 500 to moderate level of customers. We accepted customers’ response up to 30 days and during this time period we achieved 103 useful responses from most important customers and 107 were received from moderate level of customers. From the beginning above 100 responses were expected from each group, so the study could contain at least 100 useful responses from each group separately for the customer satisfaction model. A sample survey (Pretest) was taken before the real investigation was launched to make sure that the survey worked properly. So that questions were workable and they will give useful answers for the analysis.
3.4.2. Survey for the Ordinary Customers
The survey for the ordinary group of customers is different from other two groups mentioned above. It took around 17 days to collect intended 110 responses from this group of people. For collecting data out of this group we formed a 6-members team including one of the author. Three of them were female and three of them were male. All of them were well educated and holding master degree from reputed university in Bangladesh. Before to work directly on field, we provided proper training to the rest of 5 enumerators. We provided them our thesis proposal and thesis draft so that they could have an idea about the entire study. We spent first two days to train them to plan about detail process of in person interviews. Such as; locations from where respondents would be selected for interviews choose same professional, split up time slot to conduct interviews in week days, treat respondents with appropriate approach before and after interview. Before final interviews, we organized a field test with whole team whether enumerators are in right track or not. We restricted our time for each respondent around 45 minutes for interviewing and finally printed the copy of questionnaire in Bengali version. Apart from this, we gave them some additional instructions how to gather information from this group of respondents. Although all the six members were experienced in conducting same types of survey at the time of their university study or for professional purposes in Bangladesh.
We conducted “in person interviews” to the targeted group of the capital city of Bangladesh known as Dhaka. Our targeted locations were in Mirpur, Gulshan, Dhanmondi, Banani, Rampura, Mohakhali in Dhaka city. To choose the areas we considered about respondents’ availability who were mostly reachable in the industrial areas garments, factories, motor repair workshop, corporate office, bus terminal and residential area as well. We also split up 110 respondents into same profession categories accordingly garments industry/factory worker 20 respondents, office guard/clerk 20 respondents, rickshaw puller 10 respondents, driver 20 respondents, day laborer 10 respondents, plumber 10 respondents, cleaner 10 respondents, house care taker 10 respondents, who falls into ordinary group. We segmented them due to have variation on their perception. We divided six members team into small team of 2 members in each team and every

40
pair took responsibility for 2 locations, 3 same types of professional groups and moved away to the selected location we had been chosen.
As per our previous plan different customers under this group had been visited randomly. First of all, we made an introduction and created a friendly environment with the respondents so that they feel comfort to talk with us. We discussed with the interviewees just like a storytelling, but focused on the questionnaire topics. During our interviews we had to knock 255 people as respondents to have desired 110 responses. Because rest 145 people were not intended to face interview due to their scarcity of time or less interest on the discussion or any other personal reasons.
3.5. Data Analysis Method The survey is performed in the study to investigate if there are any patterns that control the behavior of the customers’. To analyze the survey, customer satisfaction model is used. In the model there are different benefits that explain the impact of the customer satisfaction. If the customer is satisfied it may lead to customer loyalty and it would influence the predisposition the customer to repurchase the bank product or service (Gustafsson, Johnson, 2004). The collected data from the customer satisfaction survey are used in a customer satisfaction model and for this the statistical program SmartPLS has been used.
A customer satisfaction model is an acceptable way to see if the customers are satisfied or not (Gustafsson & Johnson, 2004). To measure this there have to be some factors connected to the satisfaction level, and these are labelled customer benefits (Ibid.). These benefits contain different attributes that describe which aspects and characteristics that is preferable for a customer and hence, evaluate the comprehensive consumption experience (Ibid). So to be able to do a customer satisfaction model it was necessary to construct different benefits that might have an impact on the customer satisfaction. This provided a model of the customer satisfaction for the banks in developing countries and gave us varied impact on different benefits on satisfaction level (Gustafsson & Johnson, 2004). In this study it is a more overall customer satisfaction model constructed, which is a more fundamental indicator of the bank’s performance, both now, before and in the future, compared to a transaction-specific satisfaction which focus on a certain product or service encounter (Fornell, Johnson, Anderson, Cha, & Bryant, 1996).
In this study the reflective PLS method has been used because of its good performance when evaluating what is important for consumers, but also because of its suitability when analyzing and identifying improvement efforts (Gustafsson & Johnson, 2004). The benefits in this study is based on the theories and are included in the model that were mentioned under the literature part and for a better overview of the connected questions and benefits, see the customer lens in appendix 5. After adding all the attributes to the benefits in the customer satisfaction model the satisfaction and loyalty attributes were added to those benefits so that the calculation could be done.
3.5.1. SmartPLS SmartPLS is a statistical program that has been used in this study. SmartPLS (Partial Least Squares) is a modeling tool that is based on variance and is structural equation modeling (SEM). This tool is widely applied in business and social science. The statistical technique that is used in SmartPLS is structural equation modeling (SEM) and has the ability to model latent variables. It also has the ability to take into account measurement error and its various forms and to test

41
theories. This will make it useful for an excess amount of research questions (Henseler, J. et al. 2015). There exist two types of SEM and they are covariance- and variance-based SEM. Covariance-based SEM uses the empirical variance covariance matrix to estimate model parameters. This type of SEM is best to use when the one or more common factors exist in the hypothesized model. Variance-based SEM constructs proxies as linear combinations of observed variables and then is using these proxies to estimate the model parameters. This type of SEM is best to use when the hypothesized model is containing composites (Henseler, J. et al. 2015). Partial Least Squares (PLS) path modeling is viewed as the most fully developed and general system among the variance-based SEM methods. PLS is used a lot in information systems research, strategic management, marketing, and beyond. PLS is special and valued by researchers from different sectors because it has the ability to model both factors and composites. It is an efficient method to use for research in new technology and research in information systems (Henseler, J. et al. 2015). PLS modeling has been shown to be a preferred statistical tool for managing successful studies. It has been under reviews and has gone through examinations that are seriously done, it has also been involved in debates that are scientific. In the debates the topics that have been discussed are conceptual foundations and the strengths and weaknesses of PLS. These debates have had positive outcomes on PLS and have improved the overall model fit. PLS core functions are least squares algorithms that do principal component and canonical correlation analysis. It was first invented by Herman Wold from 1974 to 1982 and has gone through various improvement processes like for example extensions and modifications (Henseler, J. et al. 2015).
3.5.2. Model Specification Model specification is important and the analysts must make sure that the conceptual model that is going to be tested complies with the specified statistical model. It is also important that the model identifies with the data and its required format and statistical features. The structural model is based on theory and has focus on the research question and research hypotheses. The structural model has specifications and manages two questions which are what constructs should be in the model and how are they interrelated from a hypothesized perspective. This means what are the strengths and directions between the latent constructs and the causal influence. It is recommended for analysts to remember that there will always be validity gap because the constructs in the model that are only proxies and the theoretical concepts which are used for modeling target. In PLS the paths are the arrows and represent directional linear relationships between proxies. The structural model and the relationships between latent constructs are separate from the measurement model (Henseler, J. et al. 2015). In PLS path modeling software like for example SmartPLS and PLS-Graph the direction of arrows represent the correlation weights or regression weights depends on what directions the arrows have. PLS will estimate a composite model in both circumstances (Henseler, J. et al. 2015).
3.5.3. Sample Size Sample size is important in PLS and has two roles, one role is technical and the other one is inference statistics. PLS in technical sense must have a certain number of observations which is
42
typically high enough so that the returns from PLS that form during the PLS algorithm do not show singularities. It can for example be that the numbers of parameters or the variables in the model surpass the number of observations. Inference statistics is related to if the analyst what to show the population from a sample i.e. to do generalization. This is done by achieving smaller confidence intervals through a larger sample size and these are connected to the estimations of the model parameters. Sampling variation is also important when dealing with larger sample size because there is a smaller chance that a parameter estimates deviation from zero (Henseler, J. et al. 2015).
3.5.4. Explanation and Prediction Modeling Explanatory and predictive research can both have usage of PLS path modeling. It all depends on what the analyst’s aim is i.e. what does he/she want from the PLS and it can either be explanation or prediction based. Depending on which one model it is, the assessments will be different. It has also been shown that prediction model focus is rare in business research and the explanation modeling requires model assessment if the aim of the researcher or analyst is to explain (Henseler, J. et al. 2015). The definition of average/mean is following ‘’A number that is calculated by adding quantities together and then dividing the total by the number of quantities’’. It is a level that is related to a group, class, or series and is defined as a middle point between extremes (Merriam-webster.com, 2016).

43
44

45
4. Empirical Results In this chapter the results of entire study have been presented. In the first section, our pilot study has been described to show the formulation of our survey questionnaire based on correction and has been compared with the results of a developed country. Consecutively in later sections, customers’ demographic results and satisfaction survey results gave an explanation in order to understand the analytical process and the findings.
4.1. Pilot Study We conducted a pilot study to check whether the questionnaire is easily understandable to the respondents or not and to see how the figures and graphs look like. We also did it in order to check if our prediction of customer satisfaction in developing countries suits in the conventional American Customer Satisfaction Index (ACSI) model or not and to see what sorts of results we can generate from the pilot study. We sent out sample questionnaire two weeks before to send out the actual questionnaire on a test basis. We randomly sent out the survey questionnaire between the most important and moderate level of customer group based on personal contact with them. The respondents were known to us and some of them were close relative to one of us (author). On a test basis we sent questionnaire to 30 selected people. The selection criterion was chosen by us in order to have quick response from them. As a result, we were able to gather 22 responses within two days of sending our questionnaire. Through the respondents we found some written comments and oral advice over phone both for questionnaire and for banks. Interestingly one of the respondent directly called to us, as he was not sure about two questions and another respondent emailed that he also could not understand the same two questions that had been included in the pilot survey we sent out. They advised to clarify two of our demographic questions. Based on the feedback we rephrase the question 5 and 7 that belongs to section one customer’s general information (See appendix 2). For modifying question 5, we used a previous publication on education-system Bangladesh (Epnufficnl, 2012). In order to rephrase question 7 which is about customers’ monthly income. Though we developed this question considering the earning that Bangladeshi people could earn in past. But according to the suggestion from the respondents, earning of the people has been changed recently. Therefore, we had to change the range of the amount of income. Apart from this, through pilot study we also figured out lack of adding some instruction about private bank in the first page of the questionnaire.
4.1.1. Pilot Run Results and Comparison In order to compare the results from the pilot run we need a customer satisfaction model based that is based in a developed country. One such model is from Taiwan and they surveyed 532 customers served by a commercial bank. They also used PLS software to get their results and the customer satisfaction model that was used was customer satisfaction index (CSI). This model is a little bit different from the ACSI and ECSI. One part that is missing in the CSI model is the customer expectations variable and it also has the relationships a little bit fixed differently. The test run of the model included estimation of the path coefficients and values connected to R-squared (R2). Strengths of the relationships are made of path coefficients that are between the dependent and independent variables. The amount of variance explained by the independent

46
variables is represented by R2 values. The average score of the CSI was 68.9 and fell behind banking industry average in the USA that was 72 in year 2001 (Hsu, Chen and Hsueh, 2006). The results of the customer satisfaction index (CSI) model in Taiwan can be seen in figure 5.
Figure 4 - CSI model from Taiwan (Hsu, Chen and Hsueh, 2006)
The regression weights of patch coefficients and R2 values can also be viewed in the figure. The overall customer satisfaction is 0.72 and loyalty lands at 0.54. The numbers (Results) from the pilot study can be seen in figure 5.
Figure 5 - ACSI model pilot run numbers
On this figure we can see that the customer satisfaction is 0.765 and that loyalty lands on 0.756. We can draw conclusion that the numbers on the pilot run regarding customer satisfaction and loyalty are slightly better than the ones from CSI model. The score (Average) of the customer satisfaction landed at 80 which is higher than 68.9 that was on the CSI from Taiwan. This means that according from the pilot study the customer satisfaction is higher in Bangladesh compared to a developed country which is Taiwan. The pilot run result has also higher score than the average American banking industry which was at 72 in year 2001. In year 2015 it had 76 benchmark score (Average) of the banking industry in USA and this means that the pilot run has higher customer satisfaction by 4 scores in year 2015.

47
On figure 6 can we see the comparison between the pilot run (Blue) conducted in this study and the numbers from Taiwan (Red) and these are R2 values. This means that the customer satisfaction index has a higher impact on loyalty for ACSI pilot run than for the CSI Taiwan model. The impacts on customer satisfaction are similar for both ACSI pilot model and CSI Taiwan model.
Figure 6 - Comparison between ACSI model pilot and CSI model Taiwan
In figure 7 and 8 can we see the effects of the regression weights on path coefficients and the numbers can be used for analysis. The results of regressions weights show that perceived expectation and customer satisfaction have significant effect on other variables in the pilot run. If the customer expectations are high, then it can have a positive effect on perceived quality. If customer satisfaction is high, then it has positive effects on complaints (Customers are more satisfied with the complaints). In the CSI Taiwan model the customer satisfaction index has the highest effect on loyalty i.e. if it is high then it results in increased loyalty.
Figure 7 - ACSI model Pilot with regression weights of the effect
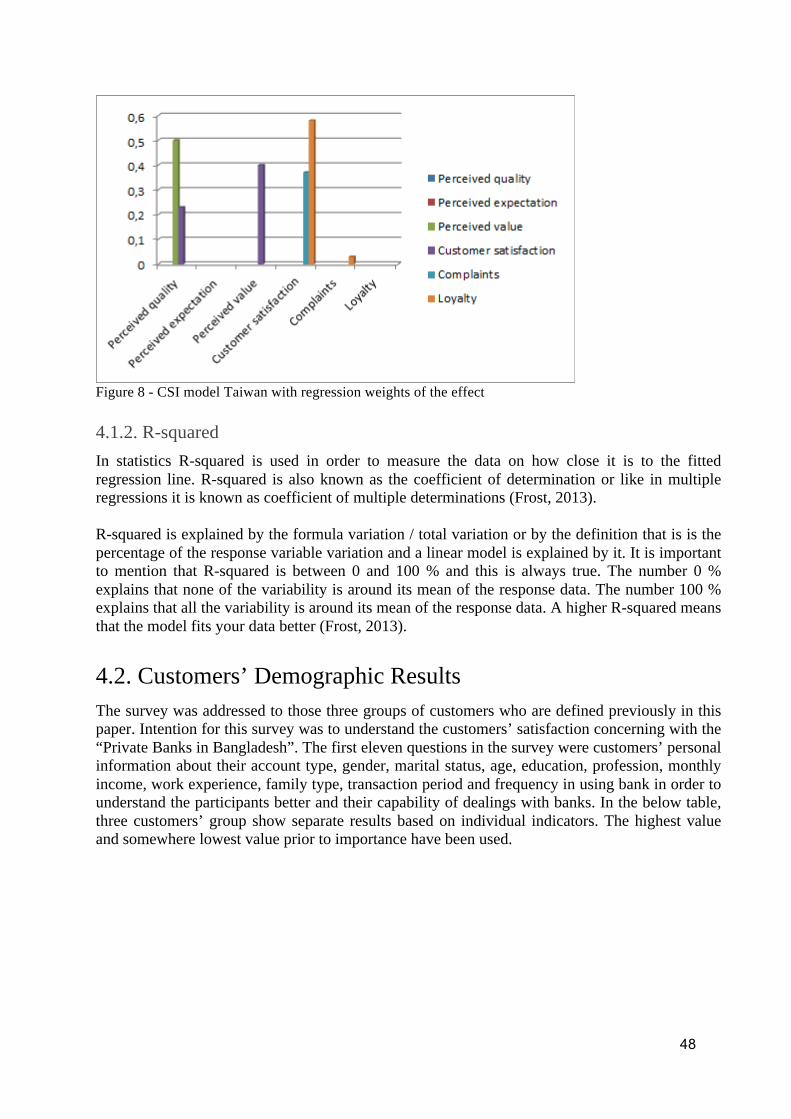
48
Figure 8 - CSI model Taiwan with regression weights of the effect
4.1.2. R-squared In statistics R-squared is used in order to measure the data on how close it is to the fitted regression line. R-squared is also known as the coefficient of determination or like in multiple regressions it is known as coefficient of multiple determinations (Frost, 2013). R-squared is explained by the formula variation / total variation or by the definition that is is the percentage of the response variable variation and a linear model is explained by it. It is important to mention that R-squared is between 0 and 100 % and this is always true. The number 0 % explains that none of the variability is around its mean of the response data. The number 100 % explains that all the variability is around its mean of the response data. A higher R-squared means that the model fits your data better (Frost, 2013).
4.2. Customers’ Demographic Results The survey was addressed to those three groups of customers who are defined previously in this paper. Intention for this survey was to understand the customers’ satisfaction concerning with the “Private Banks in Bangladesh”. The first eleven questions in the survey were customers’ personal information about their account type, gender, marital status, age, education, profession, monthly income, work experience, family type, transaction period and frequency in using bank in order to understand the participants better and their capability of dealings with banks. In the below table, three customers’ group show separate results based on individual indicators. The highest value and somewhere lowest value prior to importance have been used.

49
Table 1 - Demographic results comparison of customers’
Indicators Most important customers
(%)
Moderate level
customers (%)
Ordinary customers
(%)
Remarks
Account type 69.9 (M) 28.2 (C)
43.9 (S) 23.4 (F)
100 (S) Multiple (M) Current (C) Savings (S) Fixed deposit (F) (focused highest and lowest value)
Gender 100 (M) 72.9 (M) 81.8 (M) Male (M) (F)Female (focused highest value)
Marital status 96.1(M) 74.5 (M) 80.9 (M) Married (M) (focused highest value)
Age 54.4 (41-50 years)
45.8 (31-40 years)
46.4 (31-40 years)
focused highest value
Education level
100 (U) 91.6 (U) 37 (J) University/PhD/Tertiary (U) Junior secondary school (1-8 years) =J (focused highest value)
Profession 79.6 (B) 71(S) 72.7 (S) Business (B) Service (S) (focused highest value
Monthly Income
98.1(Above1,00,000 BDT)
54.3 (20000-50000 BDT.)
100 (below 20000 BDT)
Focused highest value
Work experience
51.5 83.8 60 1-10 years (focused Highest value)
Family type 78.6 (N) 73.8 (J) 92.7 (J) Nuclear (N) Joint (J) (focused highest value)
Length of Transaction
43.7 (5-10 years)
35.5 (1-3 years)
42.7 (1-3 years)
focused highest value
Frequency of bank use
35 (Daily) 8.7 (once in 2 weeks)
24.3 (once in a month) 15.9(once in 2 weeks)
43.6 (once in a month) 8.2 (Others)
Others (sporadically) (focused highest and lowest value)

50
Results revealed in the above table 1 are that, most important customers are used to deal with multiple accounts mostly. The highest score almost 70 percent customers have multiple account in the private bank whereas lowest value 28 percent have current account. The highest around 44 percent moderate level customers are using savings account and 23.4 percent have fixed deposit account in their bank. Result clearly showed that 100 percent ordinary customers are used to deal with saving account with their bank. So, we found those three customers’ groups have different bank accounts at their convenient position. Other proportions of account type are shown in appendix 6.
4.2.1. Gender, Marital Status and Age of the Respondents From the result it shows that 100 percent respondents of the most important customer groups were male and 96.1 % of them are married belongs to highest age group 41-50 over one half of total number (Table 1). Age between 31-40 around 42.7 % respondents and rest are above 50 years of age 2.9 %. But the proportion of the male respondents were accordingly 72.9 % and 81.8 % for the moderate and ordinary group of customer between the highest age of 31-40 of 45.8 % and 46.4 % respectively. Age of 21-30 of 39.3 %, 41-50 age of 14 % for the moderate level and accordingly 41.8 %, 2.7 % (Around 3 %) for the same age of ordinary customers. Only exception was that 9.1 % respondents were under 20 years of age in the ordinary customer groups that were not in other two groups (Appendix 7, 8, and 9).
4.2.2. Level of Education Results in table 1 describe information about the participants’ education which might be reflected on their profession and consequently towards income. From the first two groups, we found that 100 percent and around 92 percent participants are highly educated up to university/PhD/Tertiary degree. Comparing with these two groups none of the respondent from the ordinary customer group have that level of education. On the contrary, we can see ordinary customer group participants holding close proportion of college/higher secondary (HSC) degree as moderate level of customers, correspondingly 9.3 % and 8.4 %. Although the ordinary customers’ education level has variation, 33.3 % have primary education, 20.4 % of them have studied up to secondary school and major portion 37 % customers completed Junior Secondary School Certificate (Appendix 10).
4.2.3. Profession and Monthly Income Profession and monthly income have correlation with each other which reflects the respondent's capability of bank transaction as well. Regarding the questions about profession, the result in table 1 shows that over two third of the participants under the moderate and ordinary group was involved in service (71 % and 72.7 %). A small portion of 20.4 % of the most important participants is engaged in the same profession (service). Reciprocally, maximum 79.6 % of most important group of respondents is involved in the business area, this percentage dropped dramatically to 15.9 % by the moderate level of customers, whereas no one involved in this profession among ordinary groups. Interestingly we can observe from the result, 2.8% respondents are professionally students and 10.3 % are house wives. Those professionals do not exist in other two groups that are in the appendix 11. It was also a proportional distribution among the answers regarding participant's monthly income which is shown in table 1. It is found that 98 percent respondents under most important

51
customers’ monthly income above BDT 100,000, whereas maximum potion of moderate level respondents’ income between BDT 20,000 to 50,000. It is remarkable that 100 percent ordinary customers’ monthly income found below BDT 20,000 which is entirely opposite for most important and moderate group, that is, no one falls into the income level of below BDT 20,000. Here we found a clear picture of financial status of different level customers. The moderate and ordinary groups’ monthly income 54.3 % (20000-50000 BDT.), 44.6 % (50000-100000 BDT.), and 1 % (above 100000 BDT.) responses. Detail proportion of income of three separate customers’ groups are shown in appendix 12.
4.2.4. Work Experience and Family Type Work experience and family type represents customers’ financial solvency which may reflect their savings capability related to deal with the bank. How long the respondents have been working and which types of family they belong to, is shown in table 1 and appendix 13 & 14. The results revealed that 51.5 % of the respondents of the most important groups working between 1-10 years long, 44.7 % of them 10-25 years and 3.9 % are 25 or more years. Their majority portion (78.6 %) belongs to nuclear family, which is totally opposite of moderate and ordinary groups. These two groups (moderate and ordinary) of respondents mostly belong to joint family and the proportion is exactly 73.8 % and 92.7 % showed maximum value respectively. Work experiences of the moderate level of respondents are distributed as 83.8 % (1-10 years), 7.6 % (10-15 years), 3.8 % (25 and more), 2.9 % (not working) and 1.9 % (less than 1 year). Ordinary customers group that consists of 60 % are working (1-10 years), 26.4 % (10-25 years) and 13.6 % (less than 1 year). The similarities of three groups are, the major respondents belong to 1 to 10 years of job experience.
4.2.5. Length of Transaction and Frequency of Using Bank This indicator is focused on to find out relationship with customers and bankers which may reflect a clear perception of customers about bank. In contrast with the other point, participants of these three groups also answered the questions how long have you been using the bank in appendix 15 and how frequent do you use the bank in appendix 16. The results in table 1 showed that the most important customers length of bank transactions are respectively 43.7 % (5-10 years), 37.9 % (10-15 years), 15.5 % (3-5 years) and 2.9 % (more than 20 years). Their frequency in using bank that is shown in appendix 16 represent 35 % (daily), 34 % (twice in a week), 22.3 % (once in a week) and 8.7 % (once in two weeks), which increased for around 7 % for the moderate level customers (15,9 % that is around 16 %) to an impressive 30 %, for the ordinary customers. On the other hand, the transactions of the respondents of the moderate level in the bank, is the highest (35.5 % of 1-3 years) shown in the table 1 and the remaining portion accordingly 34.6 % (3-5 years), 16.8 % (5-10 years), 7.5 % (10-15 years), 4.7 % (more than 20 years), and 0.9 % (less than 1 year). Their frequency in using bank is almost equally distributed among all segments, while this proportion is totally different for ordinary customer group that is 43.6 % (once in a month), 17.3 % (once in a week), 8.2 % (others) and only 0.9 % (twice in a week). Lastly, results of ordinary group of participants presented that, they are client for the bank accordingly 42.7 % (1-3 years), 35.5 % (3-5 years), 15.5 % (less than 1 year), and 6.4 % (5-10 years).
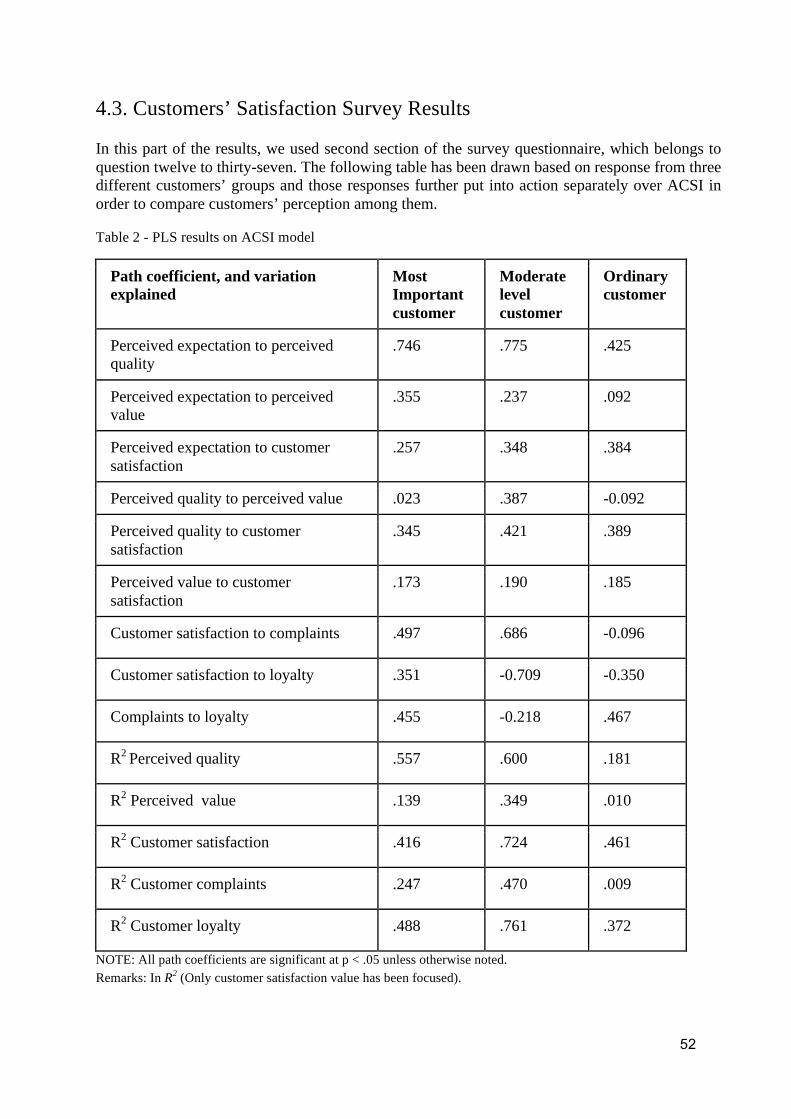
52
4.3. Customers’ Satisfaction Survey Results
In this part of the results, we used second section of the survey questionnaire, which belongs to question twelve to thirty-seven. The following table has been drawn based on response from three different customers’ groups and those responses further put into action separately over ACSI in order to compare customers’ perception among them.
Table 2 - PLS results on ACSI model
Path coefficient, and variation explained
Most Important customer
Moderate level customer
Ordinary customer
Perceived expectation to perceived quality
.746 .775 .425
Perceived expectation to perceived value
.355 .237 .092
Perceived expectation to customer satisfaction
.257 .348 .384
Perceived quality to perceived value .023 .387 -0.092
Perceived quality to customer satisfaction
.345 .421 .389
Perceived value to customer satisfaction
.173 .190 .185
Customer satisfaction to complaints .497 .686 -0.096
Customer satisfaction to loyalty .351 -0.709 -0.350
Complaints to loyalty .455 -0.218 .467
R2 Perceived quality .557 .600 .181
R2 Perceived value .139 .349 .010
R2 Customer satisfaction .416 .724 .461
R2 Customer complaints .247 .470 .009
R2 Customer loyalty .488 .761 .372
NOTE: All path coefficients are significant at p < .05 unless otherwise noted. Remarks: In R2 (Only customer satisfaction value has been focused).

53
The path coefficients illustrate just how perceived quality drive customers’ satisfaction followed by expectation and the impact of one benefit to other. The impact value from (Table 2) perceived expectation to perceived quality among these three customer groups are (.746), (.775) and (.425) respectively, where the impact value between most important and moderate level customers are very close and relatively high. But the impact value of the ordinary customer group dropped to almost half of other two groups.
The table 2 shows that the impact of expectation to perceived value is significant among three groups, though impact value for the ordinary group is a bit lower (.092). But coefficient of perceived quality towards perceived value declined to insignificant level for the most important customer (.023) and ordinary customer (-0.092). Meaning expectation is rather high from these two customer groups. In overall level, perceived value that drive to customers’ satisfaction does increase relative (.173), (.190) and (.185) to the impact of expectation and perceived value has a significant influence on satisfaction. In addition, expectation and quality variable that impact directly to the customer satisfaction has also significant influence on satisfaction.
On the other hand, customer complaints have no effect in these models since it has no impact on customers’ satisfaction. The path coefficient for the effect of customer satisfaction on complaints equals (.497), (.686) and (-0.096) for most important, moderate level and ordinary group of customers respectively, only ordinary group is exceptionally insignificant. The path coefficients for the direct effect of complaints on loyalty are (.455), (-0.218) and (.467) for most important, moderate and ordinary group respectively. Here moderate level is insignificant. Again, the path efficient for the effect of customers’ satisfaction on loyalty shows the impact numbers of (.351), (-0.709) and (-0.350) respectively for the above mentioned three groups, where the only significant direct effect of customers’ satisfaction on loyalty is the positive effect for the most important customer group. Impact value of satisfaction to loyalty is negative always does not mean that correlation between variables have to be negative. It means attributes of loyalty variable plays a vital role when it shows negative number between satisfaction to loyalty variables. For instance, we found two of the attributes of loyalty variable have negative number for the moderate level of customers, which means double negative sign turn into positive sing and same applied for the ordinary customers’ groups. So in this circumstances, moderate level of customers has the highest influence from satisfaction to loyalty, whereas satisfaction to loyalty for the most important and ordinary customers’ groups are different and it is in banks perspective is really good, because it would be possible to transform loyalty from most important and ordinary groups of customers to moderate level of customers. Considering these results we can say that moderate level customers are the ones that banks could transforming to most important customer by providing them more services and they could be more satisfied, perhaps extending their business and turn into the most important customer. From table 2, we found that R2 (R-squared) at the customers’ satisfaction variable is better in the moderate level (.724) than that of other two customer groups, where expectation might have a large role than it has for most important and ordinary group. Models for three customers’ groups shown in appendix 17.

54

55
5. Analysis and Findings In this analysis chapter the results made in the previous chapter are organized into a cogent pattern both theoretical and empirical arguments. The key findings are explained in some cases directly and in some cases through the sub-research questions created in this paper and the answers to these sub-research questions enable the paper to answer the research question.
5.1. Discussion
In this paper the concept of “Customer’s perception on their satisfaction about private banks in a developing country” had been investigated, and some similarities and distinctions have been found between existing literature and the results. One interesting finding from the results were that around 50 percent of the respondents answered “quality of the service (Perceived quality)” is not satisfactory. This was rather unexpected because the perception of banking service is that it is a service that helps a bank to sustain in the competitive market. Service is major component in achieving competitive advantage for banks and other service industries (Siddiqi, K. 2011). Banks in developing countries like Bangladesh need to understand that providing efficient services is a good indicator on how to achieve competitive advantage (Sabir, R. et. al. 2014).
In order to gain a competitive advantage for the banks in Bangladesh it is necessary that the interrelationship among the quality of service, customer satisfaction and customer loyalty function efficiently. Service has a major influence in achieving competitiveness in an organization and it is viewed as a critical success factor. Banks that provide high service can differentiate itself competing banks and service is one of the most researched subjects by researchers in the banking sector this last decade (Siddiqi, K. 2011).
Majority of respondents comments and suggested additionally in the survey (See appendix 18) about the A.T.M service facility, online banking facility and security system to improve, especially respondents (43 %) from the ordinary groups are more dissatisfied with the quality of A.T.M services, which might be the reason they are client to the bank only for obtaining this service. Therefore, we can say that quality of service is one of the key determinant factor behind customers’ satisfaction.
Customer satisfaction is important in marketing and is considered as a major outcome of marketing activity. It also connects the processes of purchase and consumption or use of the service (Sabir, et. al. 2014). Reviewing the results of customer satisfaction, their demography showed different from one group to another such as; customers’ level of education (Institutions) which might be reflected low paid profession and consequently less transaction with the bank. Almost all of the most important and moderate groups of respondents are highly educated that is totally reverse from ordinary group of people. This could be a reason for not evaluating them as a potential customer by the bank since 93 % of this group of people belongs to joint family and might support their family with the minimum monthly earning that is not enough for maintaining entire family including themselves while they intend to engage in higher education. As a consequence, they become deprive to educate themselves due to scarcity of fund and remain socially backward. Another simple solution for this group of people not treated properly by the banks due to very limited transactions with the banks and that might be the explanation.
We also found from the results chapter, opposite scenario while its turn to most important customers’ group. One of our findings about the people who belongs to this group are socially established either due to higher education that further drive them to establish professionally, results in higher income. Berger, S. (2007) noted that higher income customers have a higher

56
interest and demand for banking products and are interested in more sophisticated and riskier products. Meaning they have the maximum consumption capability of the bank's products or services through the dealing with large transaction with the banks. Hence their expectation might also reflect on satisfaction. Sabir, R. et. al. 2014 cited that expectations are the cornerstones of customer satisfaction and can be seen as indicators of purchase intention and brand loyalty of the customers. Therefore, overall customer satisfaction of the group is bit lower. Ultimately, based on the results it is obvious that banks generate more profit out of this group of people rather than moderate level and ordinary groups as they have more financial dealings with them. Hence, this could be one of the answer of our sub-research question “who are the targeted customer group to the bank?”.
5.2. Factors Influence to Retain Customers
From results we also found the logic behind customers’ satisfaction towards private banks in Bangladesh. The following table 3 describes the factors that influence to retain customers’.
Table 3 - Customers’ influential factors to stay in the bank(s)
Indicators Most Important customers (%)
Moderate level customers (%)
Ordinary customers
(%)
Reputation 99 91 100
Service 59 58 95
Variety of service selection 10 15 -
Quality of service 49 43 -
Exotic quality of banks environment 42 22 -
Convenient location 39 55 77
Hours of operation 1 17 28
Other 1 - -
Note: Fraction had been considered as full number.
From the above table 3 we can see that three indicators have largely reflects on these three groups of customer that helps banks to retain their customer. Firstly, reputation of the bank where 99 %, 91 % and 100 % people answered respectively, bank’s reputation is the main influential factor for them. Secondly, service equals 59 %, 58 % and 95 % supported that it is second large influential factor for them. Finally, convenient location of the bank accordingly 39 %, 55 % and 77 % people answered this factor also influence them to stay in the bank.
In contrast with the above results it can be said that reputation, service and convenient location of the bank are the most three important factors that people consider at the time of opening their account in the bank, which is a common phenomenon for all sorts of bank clients in Bangladesh. Nevertheless, we observed that people have bad experience about services of the banks. Despite this, people may become motivated by friends or relatives by knowing about some good sides of

57
the particular bank that does not exists in the other banks. Through this motivation, consumers’ behavior (People) might affect either followed by Cialdini (2009) “scarcity or social proof or liking principle”. He asserts that scarcity relates to those people who actually follow other people’s preferences, which is almost the same as social proof principle “consumer chooses what they think others have chosen”. In another statement about liking principle Cialdini noted that people are persuaded by other people whom they like, but in this study customers might be persuaded by their friends or relatives to be a client of the same bank. So, from the above mentioned three factors, we can claim that consumers’ behavior affects towards bank through any one of the Cialdini’s principles and this finding turns into answer of our another sub research question. Consumer behavior is connected to the psychology of the customer and his behavior. It is also connected to customer satisfaction because by being able to influence the customer then the banks can have a high probability to make the customer be more loyal by being more satisfied (Alnsour, M. 2013).
5.3. Benchmark Score and Overall Customer Satisfaction
Benchmark score (Average) for US in the banking industry was at 76 for year 2015. The overall customer satisfaction score (Average) in Bangladesh that we got from the PLS software is 58 (57.7). This means that the overall customer satisfaction is smaller in Bangladesh compared to US which is a first-rate developed country. This can be a reason that the banks in USA perform better than what they do in Bangladesh. The score for banks in Taiwan landed at 69 (68.9) and this means that the overall customer satisfaction is better even in Taiwan compared to Bangladesh (Hsu, Chen and Hsueh, 2006). Overall customer satisfaction in the two developed countries indicates that the customer satisfaction is better in developed countries compared to a developing country Bangladesh. This score of 58 is for year 2015 in Bangladesh and we don’t know how the development of the score has been during the past years nor do we know exactly how it will be in the future. From the results we can predict that it will be at a low point in the future. The loyalty for customers in Bangladesh landed at score 65 (Average) which means that it is quite decent. The benchmark score (Average) for US banking industry over the years can be seen in table 4. The table starts from year 95 and ends to year 15 (2015) and it can be seen on the first row. The second row consists of the benchmark score (Average) numbers. Table 4 - Score of banking industry in USA
Year 95 96 97 98 99 00 01 02 03 04 05 06 07 08 09 10 11 12 13 14 15
Benchmark score 74 72 71 70 68 70 72 74 75 75 75 77 78 75 75 76 75 77 78 76 76
Source: Theacsi.org, 2016 From the table 4 we can see that the customer satisfaction of the banking industry in US has been stable at around 75. The lowest score was in year 99 with a score of 68 and the highest score was in year 2007 and 2013 with the score of 78. From the table we can also see that the score has been over 58 over the years which is the Bangladesh score in year 2016. A lot can be improved in the banking industry in Bangladesh and recommendation is for the banks there to take action in order to improve their customer satisfaction. This because of customers’ satisfaction effects on the performance of companies or banks. One advice we can give to banks is to increase their competitive advantage by managing the interrelationship among

58
the quality of service, customer satisfaction and loyalty. Service is crucial factor for achieving competitiveness in banks and they that provide high service can use it as a differentiation strategy (Siddiqi, K. 2011). Other reason that the banks in developed countries perform better could be that the banks there have characteristics that they are well-established and integrated (Ayadi, R. et. al. 2010).
5.4. Revised Customer Satisfaction Model
In the survey questionnaire the participants were asked to scale from 1-10, how well different statements applied on them and their perception regarding private banks. It is on these answers that the customer satisfaction model is based on and therefore the questions involved for example quality, expectation, value, satisfaction, complaints, and loyalty.
Figure 9 - Revised customer satisfaction model
From the model in figure 9 it shows that quality drive satisfaction followed by expectation and it has a large role for satisfaction. In this model perceived value also has an influence on satisfaction. The results from the customer satisfaction questions and the model shows that perceived expectation (0.363), perceived quality (0.494), perceived value (0.181) is the variable that has a direct impact on customer satisfaction, where perceived quality has the biggest impact on customer satisfaction. Though, under quality variable, two of the attributes has lower impact (0.290 and 0.202) on the benefit than the other four and under expectation variable one of the attribute has lower impact (0.237) on the benefit than other three, which could imply that these should not be under these benefits, or that the questions were formulated wrong. These possible misleading numbers could in turn have an impact on the benefit and show a higher impact on satisfaction than it should.
Perceived value (Variable) has lowest impact on satisfaction and could mean that customer perhaps do not consider bank’s product and service price as an important aspect in their satisfaction level. Meaning customer do not care about price of products and services because they have alternative way to change bank. The low numbers could also depend on some

59
“problem” in the PLS software program, some correlation between attributes in the model or that it was too similar to another question. We did a test see appendix 19 with only the perceived value variable and customer satisfaction variable, and then we got perceived value of 0.515 instead of 0.181. So it might have been something wrong with the program. It could also have been an effect of the way the question was constructed and that the respondents did not thought of it as a perceived value (Price) question.
While comparing perceived value variable with perceived quality variable it shows that, though it has lowest impact on customer satisfaction, it performs decently with the performance variable (IPMA) of 62 % as shown in figure 11 below, whereas perceived quality has 51 % and perceived expectations has 56 %. Interestingly, perceived quality variable has highest impact value on customer satisfaction, which is around three (3) times higher than perceived value variable. Hence, considering the situation perceived quality variable has some potential in being improved, just as perceived expectations, but its potential is slightly better.
Figure 10 - Performance Improvement Graph
The graph above shows that the banks perform pretty well in the perceived value area, but because of its decent impact there is always room for some improvements. The performance value for that variable shows that the attributes within this variable explains 62 % of the satisfaction. In addition, perceived expectations and perceived quality are other two variables that have also decent impact on the satisfaction level. But the performance compared to the perceived value variable is bit lower, at accordingly 56 % and 51 %. So within this area the banks have a good possibility to increase the satisfaction level with different improvements. Overall Importance Performance Map Analysis (IPMA) revised model is available in appendix 20.
5.5. Study Implications and Limitations
Data collection was difficult especially from the ordinary group of respondents. There were three reasons behind that, firstly, this types of survey might not be so common among this group of people, even though all of the enumerators were native speaking and local resident. We performed “In person interview” among 255 people and finally had been able to collect 110
60
responses out of this group. Secondly, we had trouble to reach our goal, because few respondents (Rickshaw puller and day laborer) who belongs this group were above 50 age old and do not have any bank account since they mostly rely on cash transactions or they were the client of state owned bank that did not fit with the purpose of our survey.
Thirdly, due to limited time (17 weekdays) the selection was quite small from this particular group, though we collected almost the same number of responses from most important and moderate level of customers’ group respectively 103 and 107 responses. However, the results from this study will not be generalizable and representative for all banking customers exists in Bangladesh. Hence, we cannot guarantee that the respondents in this study are representable for all of the customers, but the results will give the reader a better understanding of the concept.
Overall from three groups of respondents we acquired 320 answers, but unfortunately not all the answers were reliable. Some people misunderstood our questions, even though we thought we were clear in our survey questionnaire. For instance, question seven asked the participants about their “monthly income” and question thirty was about “how satisfied were they with the bank’s ability to prevent frauds”. These questions were supposed to be answered by the participants from the most important and moderate level of customer groups as the questions has been sent to them through email. Still people misinterpreted these questions and did not answer, due to this, 20 answers had to be removed from the study so that the results would not have been affected.
This is of course something that might have an impact on the results, but due to attain purpose we choose to put no effort in that considering time limit. However, we also believe that the reasons for eliminating answers probably will be the insignificant and the end result will give a better understanding of what is important in this study.
One other implication that was considered regarding the chosen benefits. Due to the fact that they were constructed from literature followed by ACSI and it could be other important aspects that were missed due to the lack of theories. This concerns the different survey questions as well and the result might differ depending on how the question is constructed. Of course the authors of this study have an impact on the result too, because it was them who have developed some of the questions from their perceptions of the literature. We believe that we could have done a better work with the survey questions and read some more before constructing them. For example, we could have had interviews or a survey by asking customers about what aspects that are of importance about bank, and then, together with theories, constructed the survey questionnaire.

61

62

63
6. Conclusion The study has been organized subjected to find out customers’ satisfaction over the private banks in Bangladesh. During this research, we learned much about methodology and its implication how to collect reliable data. Further we experienced the difficulties with finding respondents and learned how to critically review the possessed data and to determine which data that is believable enough to be a part of the material that we were going to evaluate. We also learned how to realize a customer’s satisfaction survey which can be useful in our future career in marketing.
Reviewing the results and based on findings of our revised ACSI model, customers’ satisfaction in the banking industry in Bangladesh are in improvement process. Our comparison from the study can clearly refer the improvement in banking industry compared with the developed countries. For instance, the benchmark score of customers’ satisfaction is 76 in the year 2015 for the USA and for Taiwan around 69 in the banking industry, whereas the customer satisfaction results showed in Bangladesh banking industry is around 58 in 2016. According to the model, CS in Bangladesh is in decent position, yet there are some scopes of improvement. In a way Bangladeshi banks can improve their performance such as; through improving “service” which is the main determinant factor that can make the customers satisfy. So, we can say necessary improvements are required due to increase the performance of the banks, in return the GDP of the country could also be benefited from it. Since banks are on the rising position in Bangladesh, therefore, it is necessary to improve the customer satisfaction factor in order to survive in the market competition and also to increase its profitability. It has been also identified from the results that service sector of the bank should be emphasized. To diminish the shortfalls of service, banks should evaluate all classes of customers with the equal weight instead of only to give extra priority on those customer groups who are socially established and have higher bank transactions with them. Albeit it should be the aim of a financial institutions (bank) to maximize its profit from the surrounding business arena, but for having success in the long run, banks also should consider customers’ loyalty equally. Otherwise unmotivated customers probably would switch to alternative bank(s). In addition, People in Bangladesh live under their belonging society, hence, there is a possibility of being follower of the surrounding society in order to maintain same social status. That might have been the reason why different classes of people have different expectations. If banks would maintain clients’ friendly relationship, then people perhaps would not change their behavior towards bank and as a consequence, bank would be able to retain more loyal customers than now.
6.1. Further Research To identify customer satisfaction towards private banks in Bangladeshi context, it would be interesting to combine both quantitative and qualitative research approach by developing the same research with a study of larger scale including few bank authority’s interview or through an ethnographic field study, could be investigated closely to the reality, which would be the benefits both for the bank and customers. This study could not have been able to identify one of the issues why banks in Bangladesh are in race in increasing the number of clients, since they are not treating with all the customers equally. Hence, it would also be interesting to investigate if “customers’ satisfaction” is a sustainable service that will last over time.

64

65
References Andersson, M. and Liedman, G. (2013) Managing Customer Expectations. How Customer
Expectations are Formed and Identified During a Project Delivery. Department of Technology Management and Economics. pp. 1-69
Alnsour, M. (2013) How to Retain a Bank Customer: A Qualitative Study of Jordanian Banks
Relational Strategies. Published by Canadian Center of Science and Education. Ayadi, R., Llewellyn, T. D., Schmidt, H. R., Arbak, E. Pieter De Groen, W. (2010) Investigating
Diversity in the Banking Sector in Europe. Key Developments, Performance and Role of Cooperative Banks. Centre for European Policy Studies Brussels.
Bray, J. Consumer Behaviour Theory: Approaches and Models. pp. 1-33 Bryman, A., Bell, E. and Nilsson, B. (2005). Företagsekonomiska forskningsmetoder. Malmö:
Liber ekonomi. Bryman, A. (2011). Samhällsvetenskapliga metoder/alan bryman; översättning: Björn Nilsson.
Malmö: Liber. BIS Papers. (August 200) The banking industry in the emerging market economies: competition,
consolidation and systemic stability. Monetary and Economic Department. Bank for International Settlements
Berger, S. (2007) Online Banking Customers: Insights from Germany. Journal of Internet
Banking and Commerce. vol. 12, no.1 Bowen, J. and Hedges, R.B. (1993), Increasing Service Quality in Retail Banking, Journal of
Retail Banking 15(3 ), 21-28 Cialdini, R.B. (2006). Influence: The Psychology of Persuasion. Harper Business. Revised edition (originally published in 1984).
Cialdini, R, B. (2009). Influence: The Psychology of Persuasion. Harper Business. Collins, K. and Sarpong, A. (2014) SMS and Customer Satisfaction in the Banking Industry.
European Journal of Business and Management.Vol.6, No.31, 2014. pp. 354-362 Chochoľáková, A., Gabčová, L., Belás, J., Sipko, J. (2015), Bank Customers’ Satisfaction,
Customers’ Loyalty and Additional Purchases of Banking Products and Services. A Case Study from the Czech Republic, Economics and Sociology, Vol. 8, No 3, pp. 82-94.
Dudwick, N., Kuehnast, K., Jones, V. N., & Woolcock, M. (2006). Analyzing Social Capital in
Context: A guide to using Qualitative Methods and Data. World Bank Institute: Washington. Epnufficnl. (2012). Education system Bangladesh. Retrieved 13 April, 2016, from
https://www.epnuffic.nl/en/publications/find-a-publication/education-system-bangladesh.pdf

66
Freixas, X. & Rochet, J. (2006) Micro Economics of Banking, The MIT Press Cambridge, Massachusetts London, England
Fornell, C., Johnson, M., Anderson, E., Cha, J. and Bryant, B. (1996). The American Customer
Satisfaction Index: Nature, Purpose, and Findings. Journal of Marketing, 60(4), p.7. Feng Cheng, T. (2013). Customer satisfaction, perceived value and customer loyalty: the mobile
services industry in China. African Journal of Business Management, 7(18), pp.1730-1737. Frost, J. (2013). Regression Analysis: How Do I Interpret R-squared and Assess the Goodness-of-
Fit?. [online] Blog.minitab.com. Available at: http://blog.minitab.com/blog/adventures-in-statistics/regression-analysis-how-do-i-interpret-r-squared-and-assess-the-goodness-of-fit [Accessed 17 Apr. 2016].
Gustafsson, A., & Johnson, M. D. (2004). Determining attribute importance in a service
satisfaction model. Journal of Service Research, 7(2), 124-141. Gustafsson, A., Johnson, M. and Roos, I. (2005). The Effects of Customer Satisfaction,
Relationship Commitment Dimensions, and Triggers on Customer Retention. Journal of Marketing, 69(4), pp.210-218.
Heffernan, S. (1996), Modern Banking in Theory and Practice, West Sussex, John Willey and
Sons. Holme, L. M., & Solvang, B. K, (1997). Forskningsmetodik: Om kvalitativa och kvantitativa
metoder. Lund: Studentlitteratur Hsu, S., Chen, W. and Hsueh, J. (2006). Application of customer satisfaction study to derive
customer knowledge. Total Quality Management & Business Excellence, 17(4), pp.439-454. Johnson, M. and Selnes, F. (2004). Customer Portfolio Management: Toward a Dynamic Theory
of Exchange Relationships. Journal of Marketing, 68(2), pp.1-17. Kim, Y, J. and Lee, S, H, (December 2013) Key Factors Influencing Customer Satisfaction in
Korea’s Mobile Service Sector. Journal of Internet Banking and Commerce Kim, J., D. Kim, G., W., Way, A., K., (2009) Adapting the Customer Satisfaction Index to the
Lodging Industry: Foreign Customers' Evaluations. Issue 1 Hospitality Review Volume 27/Issue 1. Pp. 18-36
Kotler, P., Armstrong, G. Saunders, J. And Wong, V. (1999), 2nd European ed., Principles of
Marketing, Prentice Hall Inc. Kumar, R. (1996). Research Methodology, London: SAGE Publications,. Quantitative Research.
Retrieved from http://www.activelivingbydesign.org/index.pdf Laerd Dissertation. (2012). Self-selection sampling. Retrieved 2016-04-24 from
http://dissertation.laerd.com/self-selection-sampling.php

67
Mohsan, F., Nawaz, M, M., Khan, S., Shaukat, Z, and Aslam, N. (September, 2011) Impact of Customer Satisfaction on Customer Loyalty and Intentions to Switch: Evidence from Banking Sector of Pakistan. International Journal of Business and Social Science. pp. 263-270
Neuman, W. L. (2006) Social Research Methods: Qualitative and Quantitative Approaches 6th
Edition, Pearson International Edition,USA. Oliver, R. (1980). A cognitive model of the Antecedents and consequences of satisfaction
decisions. Journal of Marketing Research, 17(4), 460. Olsen, L. L., & Johnson, M. D. (2003). Service equity, satisfaction, and loyalty: from transaction-
specific to cumulative evaluations. Journal of Service Research, 5(3), 184-195. Pham, M, T. (2013). The seven sins of consumer psychology. Journal of Consumer Psychology,
Society for Consumer Psychology, Vol. 23 No. 4, pp. 411–423 Stafford, M.R. (1996), Demographic Discriminators of Service Quality in the Banking Industry,
Journal of Services Marketing, 10 (4), 6-22. Siddiqi, K. (2011) Interrelations between Service Quality Attributes, Customer Satisfaction and
Customer Loyalty in the Retail Banking Sector in Bangladesh. International Journal of Business and Management
Sabir, I, R., Ghafoor, O., Akhtar, N., Hafeez, I., and Rehman, U, A. (June 2014) Factors
Affecting Customer Satisfaction in Banking Sector of Pakistan. International Review of Management and Business Research
Sukamolson, S. (2010). Fundamentals of quantitative research. Language Institute,
Chulalongkorn University. Sooloo, K. (2016). Academiaedu. Retrieved 25 April, 2016, from
https://www.academia.edu/6694815/ Marketing Concept and Bank Services Implications on Commercial Banks Performance in Nigeria
Titko, J. and Lace, N. (2010), Customer Satisfaction and Loyalty in Latvian Retail Banking,
Economics and Management, 15, 1031-1038 Theacsi.org. (2016). The American Customer Satisfaction Index Science and Methodology.
[online] Available at: http://theacsi.org/about-acsi/the-science-of-customer-satisfaction [Accessed 23 Apr. 2016].
Tao, F. (April 2014). Customer Relationship Management based on Increasing Customer
Satisfaction. International Journal of Business and Social Science, pp. 256 - 263.

68

69
APPENDIX
APPENDIX 1 American Customer Satisfaction Index (ACSI)

70
APPENDIX 2 Customers’ satisfaction survey (English Version)

71

72

73

74

75

76
APPENDIX 3 Customers’ satisfaction survey (Bengali Version)

77

78

79

80

81

82
APPENDIX 4 Connections between questions and literature

83
84

85
APPENDIX 5 Customer lens
APPENDIX 6
Types of accounts
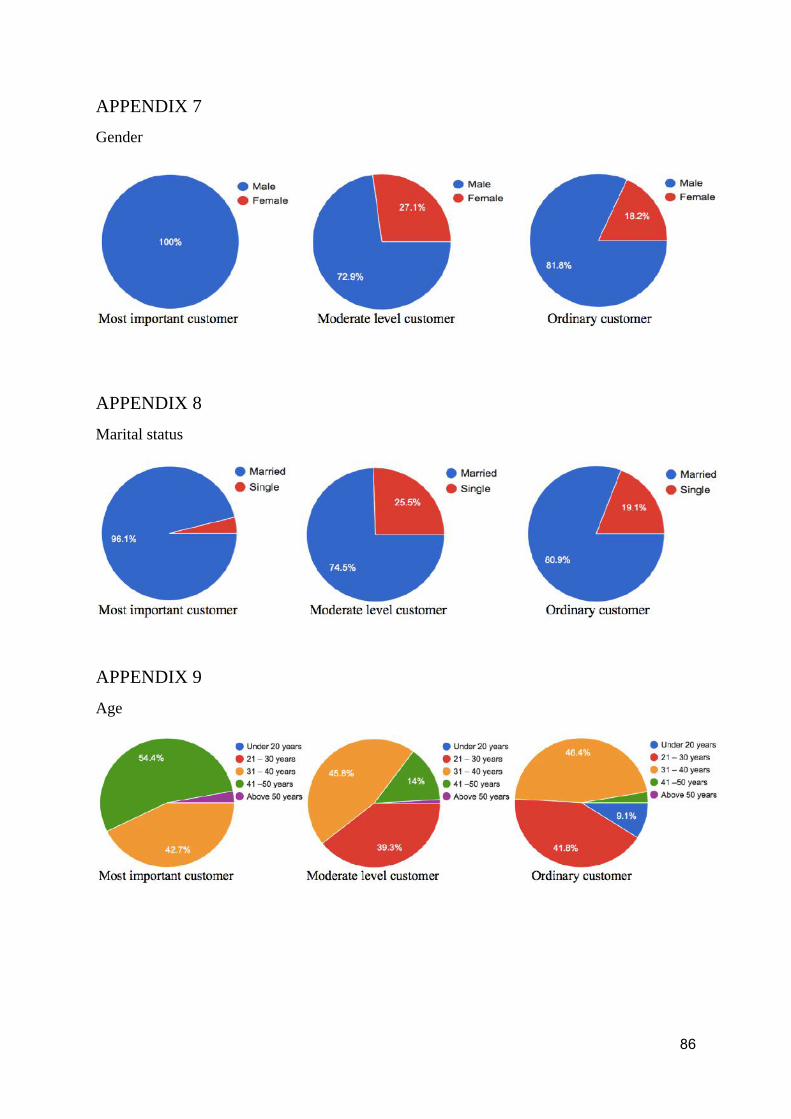
86
APPENDIX 7 Gender
APPENDIX 8 Marital status
APPENDIX 9 Age

87
APPENDIX 10 Education level
APPENDIX 11 Profession
APPENDIX 12 Monthly income

88
APPENDIX 13 Work experience
APPENDIX 14 Family type
APPENDIX 15 Length of transaction

89
APPENDIX 16 Frequency of bank use

90
APPENDIX 17 CS detailed and IPMA model applied on ACSI of three customers’ groups
Model 1: Most Important Customer.

91
Model 2: Moderate level customer.

92
Model 3: Ordinary level customer

93
APPENDIX 18 Customers’ comments or additional information

94

95

96
APPENDIX 19 Perceived value and customer satisfaction model
APPENDIX 20 Overall Importance Performance Map Analysis (IPMA) revised model