customers per entity - discovery.co.za · customers per entity life policyholders june 2018...
TRANSCRIPT

CUSTOMERS PER ENTITY
Life Policyholders
June 2018 December 2017 June 2017 December 2016 June 2016 December 2015 June 2015 December 2014 June 2014 December 2013
Individual 429,817 423,707 413,346 407,402 399,715 395,078 398,731 391,104 379,152 377,487
Invest 118,366 109,914 100,445 91,858
Invest - DRO* 115,670 111,258 105,722 101,168 98,238 94,098
Invest - Other 172,929 164,878 153,804 147,960 139,341 129,989
Group (lives) 512,715 506,141 502,258 466,172 435,168 432,930 425,991 406,678 393,800 381,019
Group schemes 2,585 2,552 2,503 2,453 2,401 2,403 2,332 2,186 2,063 1,960
*Discovery Retirement Optimiser (DRO) product has been moved from the Individual category to Invest - DRO from December 2015 onwards
This count is the full number of DRO policies (underlying Endowments and Retirement Annuities counted individually), including Paid-up policies.
Prior period comparatives have been restated to be consistent with this approach, since paid-up policies were not previously included in the counts disclosed before June 2017.
Life NB APE
12 months to 6 months to Year ended 6 months to Year ended 6 months to Year ended 6 months to Year ended 6 months to
R million June 2018 December 2017 June 2017 December 2016 June 2016 December 2015 June 2015 December 2014 June 2014 December 2013
Individual 2,042 1,038 1,970 1,001 1,762 909 2,124 1,097 1,899 986
Group 146 79 205 52 105 61 108 54 114 70
Invest - Recurring 1,205 632 1,219 658 1,194 589 597 295 492 243
Invest - Single APE** 1,248 588 1,277 620 1,218 579 1,049 502 904 409
Total Life APE** 4,641 2,337 4,671 2,331 4,279 2,138 3,878 1,948 3,409 1,708
** APE shown at 10% of Single premium
Health Members
June 2018 December 2017 June 2017 December 2016 June 2016 December 2015 June 2015 December 2014 June 2014 December 2013
DHMS - Keycare 247,357 254,165 248,430 256,591 247,825 249,605 240,324 235,559 227,298 232,865
DHMS - Non-Keycare 1,093,745 1,069,492 1,062,964 1,041,166 1,034,833 1,018,612 1,013,864 995,572 985,228 959,138
In-House Schemes 310,773 311,879 299,353 275,293 265,205 153,935 153,486 144,227 142,750 132,160
Total 1,651,875 1,635,536 1,610,747 1,573,050 1,547,863 1,422,152 1,407,674 1,375,358 1,355,276 1,324,163
Health Lives
June 2018 December 2017 June 2017 December 2016 June 2016 December 2015 June 2015 December 2014 June 2014 December 2013
DHMS - Keycare 428,103 440,722 430,363 443,485 428,817 434,487 419,364 415,093 402,047 411,525
DHMS - Non-Keycare 2,374,976 2,337,485 2,327,651 2,292,201 2,281,630 2,257,759 2,250,081 2,219,753 2,199,601 2,152,815
In-House Schemes 667,116 663,807 635,178 581,821 550,943 326,806 323,416 297,805 293,690 268,854
Total 3,470,195 3,442,014 3,393,192 3,317,507 3,261,390 3,019,052 2,992,861 2,932,651 2,895,338 2,833,194
Vitality SA
June 2018 December 2017 June 2017 December 2016 June 2016 December 2015 June 2015 December 2014 June 2014 December 2013
Members* 825,531 828,216 823,826 832,365 824,196 734,718 734,529 735,725 733,732 729,682
*Includes Balance members (Balance is Vitality for Bankmed)
VitalityHealth Members
June 2018 December 2017 June 2017 December 2016 June 2016 December 2015 June 2015 December 2014 June 2014 December 2013
Individual 90,375 85,942 84,070 82,171 80,910 75,969 74,570 75,566 76,896 73,078
SME 181,795 174,376 168,844 165,813 165,341 162,711 158,702 159,546 162,473 157,666
Corporate 59,954 56,762 53,472 56,773 58,756 56,880 54,696 53,924 50,634 47,893
Trust and Cost Plus - - - - 5,496 17,345 17,547 18,224 17,972 23,068
Total 332,124 317,080 306,486 304,757 310,503 312,905 305,515 307,260 307,975 301,705
VitalityHealth Lives
June 2018 December 2017 June 2017 December 2016 June 2016 December 2015 June 2015 December 2014 June 2014 December 2013
Individual 156,488 148,309 145,379 142,044 139,519 131,188 128,543 130,945 131,113 127,805
SME 314,773 304,280 297,186 292,506 293,037 290,593 284,937 288,287 294,575 290,505
Corporate 105,083 100,242 94,662 101,104 103,897 100,216 97,516 95,241 91,173 85,718
Trust and Cost Plus - - - - 9,245 33,830 33,879 36,437 36,053 48,660
Total 576,344 552,831 537,227 535,654 545,698 555,827 544,875 550,910 552,914 552,688
VitalityLife Policies
June 2018 December 2017 June 2017 December 2016 June 2016 December 2015 June 2015 December 2014 June 2014 December 2013
Policies 385,818 357,704 337,900 322,364 299,315 274,929 250,834 224,987 199,901 176,839
VitalityLife Lives
June 2018 December 2017 June 2017 December 2016 June 2016 December 2015 June 2015 December 2014 June 2014 December 2013
Lives 506,823 467,750 438,862 415,169 385,978 351,473 317,855 285,308 248,523 215,310
Discovery Insure Policies
June 2018 December 2017 June 2017 December 2016 June 2016 December 2015 June 2015 December 2014 June 2014 December 2013
Policies 144,072 137,412 121,785 111,605 100,034 91,945 79,847 70,622 54,067 39,409
1 Membership

NAV BY ENTITY
The NAV by legal entity (net of non-controlling interests)
R million June 2018 December 2017 June 2017 December 2016 June 2016 December 2015 June 2015 December 2014 June 2014 December 2013
Holdings and other (including consolidation effects) 8,827 5,022 4,519 4,192 4,704 4,993 2,753 510 1,138 1,388
Health 901 2,416 1,917 1,612 1,486 2,025 2,153 982 821 753
Life 24,551 22,774 20,922 19,203 17,735 16,455 15,076 13,724 13,383 12,191
Vitality 215 719 841 858 53 46 22 (13) (17) (39)
TVG 663 584 573 485 514 498 346 398 327 174
VitalityHealth 4,817 5,348 5,025 4,275 5,248 6,397 4,246 3,705 3,629 3,450
VitalityLife 4,594 3,393 3,314 2,692 2,313 1,886 (30) (194) (398) (483)
Insure 1,551 1,260 1,076 958 934 754 623 410 366 233
Connect (320) (267) (219) (163) (112)
Goodwill and intangibles from business combinations 2,247 2,416 2,496 2,511 2,972 3,589 3,060 2,955 3,058 2,976
Puttable non-controlling interest - - - - - - - (4,494) (3,909)
Loan (10,452) (9,453) (8,174) (6,332) (5,240) (5,332) (893) (1,902) (402) (402)
Total 37,594 34,212 32,290 30,291 30,607 31,311 27,356 20,575 17,411 16,332
For December 2010, VitalityHealth, VitalityLife and goodwill and intangibles are shown net of minorities.
From June 2011, VitalityHealth, VitalityLife and goodwill and intangibles are shown at 100% with minorities included in the puttable non-controlling interest liability.
In November 2014, Discovery acquired the remaining 25% share of the VitalityHealth and VitalityLife joint venture.
2 NAV per Entity

VALUE OF NEW BUSINESS AT POINT OF SALE VS VALUATION DATE
June 2018
VNB at Point of Sale
R million Health and Vitality Life and Invest VitalityHealth VitalityLife
Acquisition Costs and Initial strain (364) (2,388) (1,030) (1,387)
Value of In Force 1,349 3,764 1,293 1,794
Cost of Capital (29) (74) (44) (58)
956 1,302 219 349
New business contribution to value of in force at valuation date
R million Health and Vitality Life and Invest VitalityHealth VitalityLife
Value of In Force 1,364 3,536 1,017 1,876
Cost of Capital (29) (74) (29) (109)
1,335 3,462 988 1,767
December 2017
VNB at Point of Sale
R million Health and Vitality Life and Invest VitalityHealth VitalityLife
Acquisition Costs and Initial strain (176) (1,225) (492) (607)
Value of In Force 578 1,941 504 854
Cost of Capital (14) (37) (23) (28)
388 679 (11) 219
New business contribution to value of in force at valuation date
R million Health and Vitality Life and Invest VitalityHealth VitalityLife
Value of In Force 579 1,864 375 850
Cost of Capital (14) (37) (14) (24)
565 1,827 361 826
June 2017
VNB at Point of Sale
R million Health and Vitality Life and Invest VitalityHealth VitalityLife
Acquisition Costs and Initial strain (349) (2,394) (873) (1,438)
Value of In Force 1,169 3,698 1,030 1,870
Cost of Capital (31) (73) (46) (126)
789 1,231 111 306
New business contribution to value of in force at valuation date
R million Health and Vitality Life and Invest VitalityHealth VitalityLife
Value of In Force 1,176 3,437 824 1,842
Cost of Capital (30) (73) (30) (185)
1,146 3,364 794 1,657
December 2016
VNB at Point of Sale
R million Health and Vitality Life and Invest VitalityHealth VitalityLife
Acquisition Costs and Initial strain (170) (1,220) (423) (760)
Value of In Force 503 1,909 450 1,003
Cost of Capital (15) (37) (17) (67)
318 652 10 176
New business contribution to value of in force at valuation date
R million Health and Vitality Life and Invest VitalityHealth VitalityLife
Value of In Force 504 1,783 326 955
Cost of Capital (14) (37) (14) (135)
490 1,746 312 820
June 2016
VNB at Point of Sale
R million Health and Vitality Life and Invest VitalityHealth VitalityLife1
Acquisition Costs and Initial strain (347) (2,316) (918) (2,450)
Value of In Force 1,191 3,579 1,027 3,043
Cost of Capital (48) (67) (47) (315)
796 1,196 62 278
New business contribution to value of in force at valuation date
R million Health and Vitality Life and Invest VitalityHealth VitalityLife
Value of In Force 1,205 3,276 757 2,807
Cost of Capital (47) (67) (47) (295)
1,158 3,209 710 2,512
1) The acquisition cost and initial strain is now negative to reflect the zeroisation of the negative reserves on VitalityLife and the
Discovery funded VitalityLife business on the Prudential license, which no longer offsets acqusition costs.
3 Value of New Business
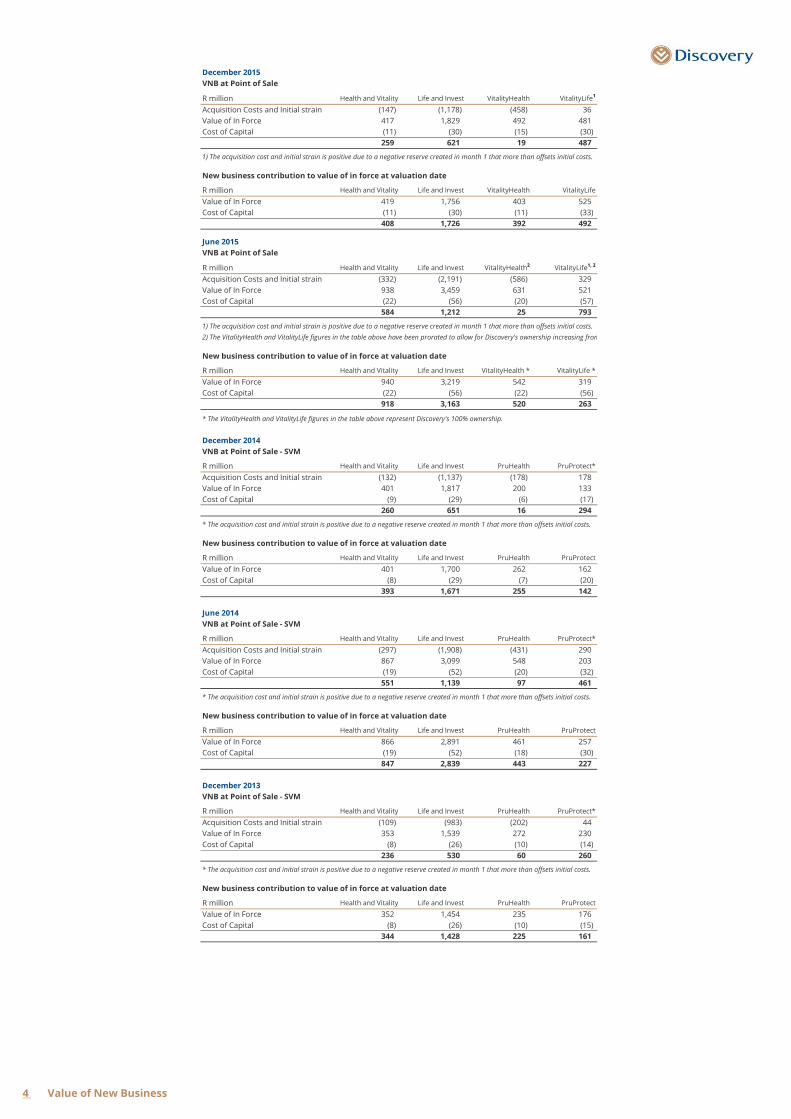
December 2015
VNB at Point of Sale
R million Health and Vitality Life and Invest VitalityHealth VitalityLife1
Acquisition Costs and Initial strain (147) (1,178) (458) 36
Value of In Force 417 1,829 492 481
Cost of Capital (11) (30) (15) (30)
259 621 19 487
New business contribution to value of in force at valuation date
R million Health and Vitality Life and Invest VitalityHealth VitalityLife
Value of In Force 419 1,756 403 525
Cost of Capital (11) (30) (11) (33)
408 1,726 392 492
June 2015
VNB at Point of Sale
R million Health and Vitality Life and Invest VitalityHealth2 VitalityLife1, 2
Acquisition Costs and Initial strain (332) (2,191) (586) 329
Value of In Force 938 3,459 631 521
Cost of Capital (22) (56) (20) (57)
584 1,212 25 793
New business contribution to value of in force at valuation date
R million Health and Vitality Life and Invest VitalityHealth * VitalityLife *
Value of In Force 940 3,219 542 319
Cost of Capital (22) (56) (22) (56)
918 3,163 520 263
* The VitalityHealth and VitalityLife figures in the table above represent Discovery's 100% ownership.
December 2014
VNB at Point of Sale - SVM
R million Health and Vitality Life and Invest PruHealth PruProtect*
Acquisition Costs and Initial strain (132) (1,137) (178) 178
Value of In Force 401 1,817 200 133
Cost of Capital (9) (29) (6) (17)
260 651 16 294
New business contribution to value of in force at valuation date
R million Health and Vitality Life and Invest PruHealth PruProtect
Value of In Force 401 1,700 262 162
Cost of Capital (8) (29) (7) (20)
393 1,671 255 142
June 2014
VNB at Point of Sale - SVM
R million Health and Vitality Life and Invest PruHealth PruProtect*
Acquisition Costs and Initial strain (297) (1,908) (431) 290
Value of In Force 867 3,099 548 203
Cost of Capital (19) (52) (20) (32)
551 1,139 97 461
New business contribution to value of in force at valuation date
R million Health and Vitality Life and Invest PruHealth PruProtect
Value of In Force 866 2,891 461 257
Cost of Capital (19) (52) (18) (30)
847 2,839 443 227
December 2013
VNB at Point of Sale - SVM
R million Health and Vitality Life and Invest PruHealth PruProtect*
Acquisition Costs and Initial strain (109) (983) (202) 44
Value of In Force 353 1,539 272 230
Cost of Capital (8) (26) (10) (14)
236 530 60 260
New business contribution to value of in force at valuation date
R million Health and Vitality Life and Invest PruHealth PruProtect
Value of In Force 352 1,454 235 176
Cost of Capital (8) (26) (10) (15)
344 1,428 225 161
* The acquisition cost and initial strain is positive due to a negative reserve created in month 1 that more than offsets initial costs.
1) The acquisition cost and initial strain is positive due to a negative reserve created in month 1 that more than offsets initial costs.
1) The acquisition cost and initial strain is positive due to a negative reserve created in month 1 that more than offsets initial costs.
2) The VitalityHealth and VitalityLife figures in the table above have been prorated to allow for Discovery's ownership increasing from 75% to 100% in November 2014.
* The acquisition cost and initial strain is positive due to a negative reserve created in month 1 that more than offsets initial costs.
* The acquisition cost and initial strain is positive due to a negative reserve created in month 1 that more than offsets initial costs.
4 Value of New Business
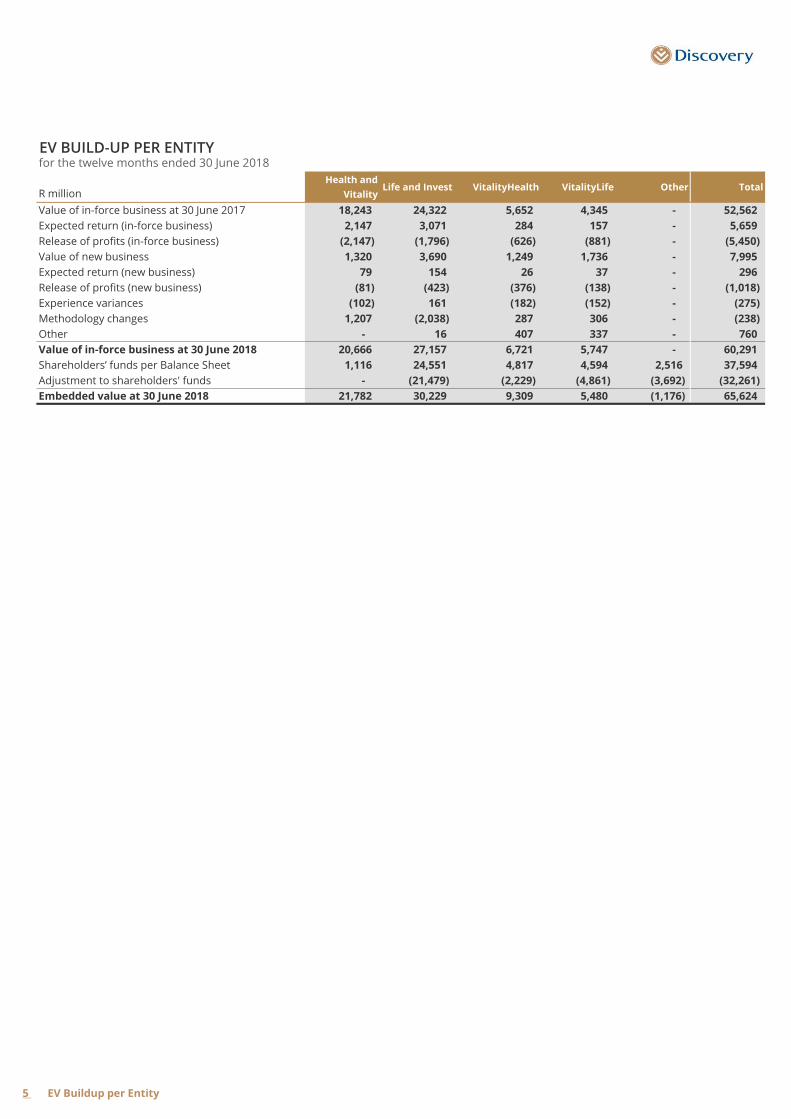
EV BUILD-UP PER ENTITYfor the twelve months ended 30 June 2018
R million
Health and
VitalityLife and Invest VitalityHealth VitalityLife Other Total
Value of in-force business at 30 June 2017 18,243 24,322 5,652 4,345 - 52,562
Expected return (in-force business) 2,147 3,071 284 157 - 5,659
Release of profits (in-force business) (2,147) (1,796) (626) (881) - (5,450)
Value of new business 1,320 3,690 1,249 1,736 - 7,995
Expected return (new business) 79 154 26 37 - 296
Release of profits (new business) (81) (423) (376) (138) - (1,018)
Experience variances (102) 161 (182) (152) - (275)
Methodology changes 1,207 (2,038) 287 306 - (238)
Other - 16 407 337 - 760
Value of in-force business at 30 June 2018 20,666 27,157 6,721 5,747 - 60,291
Shareholders’ funds per Balance Sheet 1,116 24,551 4,817 4,594 2,516 37,594
Adjustment to shareholders' funds - (21,479) (2,229) (4,861) (3,692) (32,261)
Embedded value at 30 June 2018 21,782 30,229 9,309 5,480 (1,176) 65,624
5 EV Buildup per Entity

EV RECONCILIATION TO INCOME STATEMENTfor the twelve months ended 30 June 2018
R million
Embedded
Value Earnings
Value of In-
Force
Cost of
required
Capital
Impact on
Income
Statement
Adjustment to
Shareholders
Funds
Statement of
Changes in
Equity
Total profit from new business 2,826 7,182 (205) (4,151) - -
- Health and Vitality 956 1,268 (29) (283) - -
- Life 1,302 3,341 (74) (1,965) - -
- VitalityHealth 219 917 (44) (654) - -
- VitalityLife 349 1,656 (58) (1,249) - -
Profit from existing business
* Expected return 5,955 544 (39) 5,450 - -
- Health and Vitality 2,226 71 8 2,147 - -
Expected transfer from VIF to net worth - (2,147) - 2,147 - -
Unwinding of the risk discount rate 2,226 2,218 8 - - -
- Life 3,225 1,492 (63) 1,796 - -
Expected transfer from VIF to net worth - (1,796) - 1,796 - -
Unwinding of the risk discount rate 3,225 3,288 (63) - - -
- VitalityHealth 310 (376) 60 626 - -
Expected transfer from VIF to net worth - (626) - 626 - -
Unwinding of the risk discount rate 310 250 60 - - -
- VitalityLife 194 (643) (44) 881 - -
Expected transfer from VIF to net worth - (849) (32) 881 - -
Unwinding of the risk discount rate 194 206 (12) - - -
* Change in methodology and assumptions 787 (379) 141 1,025 - -
- Health and Vitality 1,207 1,206 1 - - -
- Life (998) (2,017) (21) 1,040 - -
- VitalityHealth 269 305 (18) (18) - -
- VitalityLife 309 127 179 3 - -
* Experience variances 305 (230) (45) 580 - -
- Health and Vitality 214 (94) (8) 316 - -
- Life (290) 132 29 (451) - -
- VitalityHealth 486 (175) (7) 668 - -
- VitalityLife (105) (93) (59) 47 - -
Increase in goodwill and intangibles (246) - - - (246) -
Other initiatives (285) 23 - (308) - -
Non-recurring expenses (30) - - (30) - -
Acquisition costs (122) 2 - (124) - -
Finance costs (714) - - (714) - -
Other (15) (10) 1 - (11) 5
Foreign Exchange Rate Movements 1,016 814 (70) (400) (219) 891
Intangibles (197) - - - (197) -
DAC (22) - - - (22) -
Other 1,235 814 (70) (400) - 891
Return on shareholders' funds 262 - - 234 - 28
Unrealised gain on investments and realised gain on
investments transferred to income statement 47 - - 19 - 28
Health and Vitality investment income 69 - - 69 - -
Life investment income 118 - - 118 - -
VitalityHealth investment income 11 - - 11 - -
VitalityLife investment income 17 - - 17 - -
Amortisation of Intangibles (54) - - (489) 435 -
Amortisation of intangibles from business combinations (54) - - (109) 55 -
Amortisation of systems intangibles - - - (380) 380 -
VitalityHealth and VitalityLife DAC and unemployment reserve - - - 73 (73) -
Reversal of 1 Discovery Place IAS 17 financial lease accounting - - - (208) 208 -
Life assets under insurance contracts - - - 3,125 (3,125) -
Vitality Life Limited and Discovery funded VitalityLife business
on the Prudential license net assets under insurance contracts- - - 1,214 (1,214) -
VitalityHealth FinRe - - - 458 (458) -
Embedded value earnings 9,685 7,946 (217) 5,735 (4,703) 924
Adjustment to Shareholders' Funds:
Change in:
DAC (79)
Intangibles (35)
Life negative reserve (3,125)
VitalityLife negative reserve (1,214)
VitalityLife FinRe liability (458)
1 DP IAS 17 financial lease accounting 208
6 EV recon

R million June 2018 December 2017 June 2017 December 2016 June 2016
1. Assets under insurance contracts
Discovery Life long term reserves in respect of policies with positive liabilities: 4,636 3,983 3,642 3,231 2,816
Discovery Life long term reserves in respect of policies with negative liabilities: (31,713) (29,448) (27,650) (25,629) (23,720)
Unit reserves - - - - -
VitalityLife net long term reserve (9,124) (8,238) (8,530) (8,420) (9,685)
Total Assets under insurance contracts: (36,201) (33,703) (32,538) (30,818) (30,589)
2. Negative liabilites not included under assets under insurance contracts
Negative reserve in respect of Invest business (4,059) (3,709) (3,428) (3,170) (2,911)
DAC and DRL in respect of Invest business (503) (480) (464) (438) (419)
(4,562) (4,189) (3,892) (3,608) (3,330)
3. Components to be zeroised on the statutory balance sheet
Discovery Life long term reserves in respect of policies with negative liabilities: (31,713) (29,448) (27,650) (25,629) (23,720)
Negative reserve in respect of Invest business (4,059) (3,709) (3,428) (3,170) (2,911)
DAC and DRL in respect of Invest business (503) (480) (464) (438) (419)
Adjust for reduction on Deferred Tax Liability as a result of reduction in earnings 7,154 6,768 6,349 5,953 5,414
Liabilities off set against Negative reserve before zeroisation 7,642 7,015 6,839 6,026 5,868
(21,479) (19,854) (18,354) (17,258) (15,768)
4. Other adjustments to published Shareholders' funds
Vitality Life Limited and Discovery funded VitalityLife business on the Prudential
licence net assets under insurance contracts(4,834) (3,891) (3,620) (3,176) (3,090)
VitalityHealth FinRe Asset (1,898) (1,568) (1,440) (1,279)
VitalityHealth and VitalityHealth Insurance Limited deferred acquisition costs (net
of deferred tax)(331) (254) (252) (233) (290)
VitalityLife receivable relating to the Unemployment Cover benefit (net of deferred
tax)(27) (26) (27) (32) (41)
Goodwill and intangible assets (net of deferred tax) relating to the acquisition of
Standard Life Healthcare and the Prudential joint venture(3,121) (2,899) (3,086) (3,058) (3,615)
Net preference share capital (779) (779) (779) (779) (779)
Reversal of 1 Discovery Place IAS 17 financial lease accounting 208 75 -
Adjustment to Shareholders' funds from published basis (32,261) (29,196) (27,558) (25,815) (23,583)
COMPONENTS OF ASSETS UNDER INSURANCE CONTRACTS AND ADJUSTMENT TOSHAREHOLDERS' FUNDS ON PUBLISHED BASIS
7 EV Adjustment to SH funds
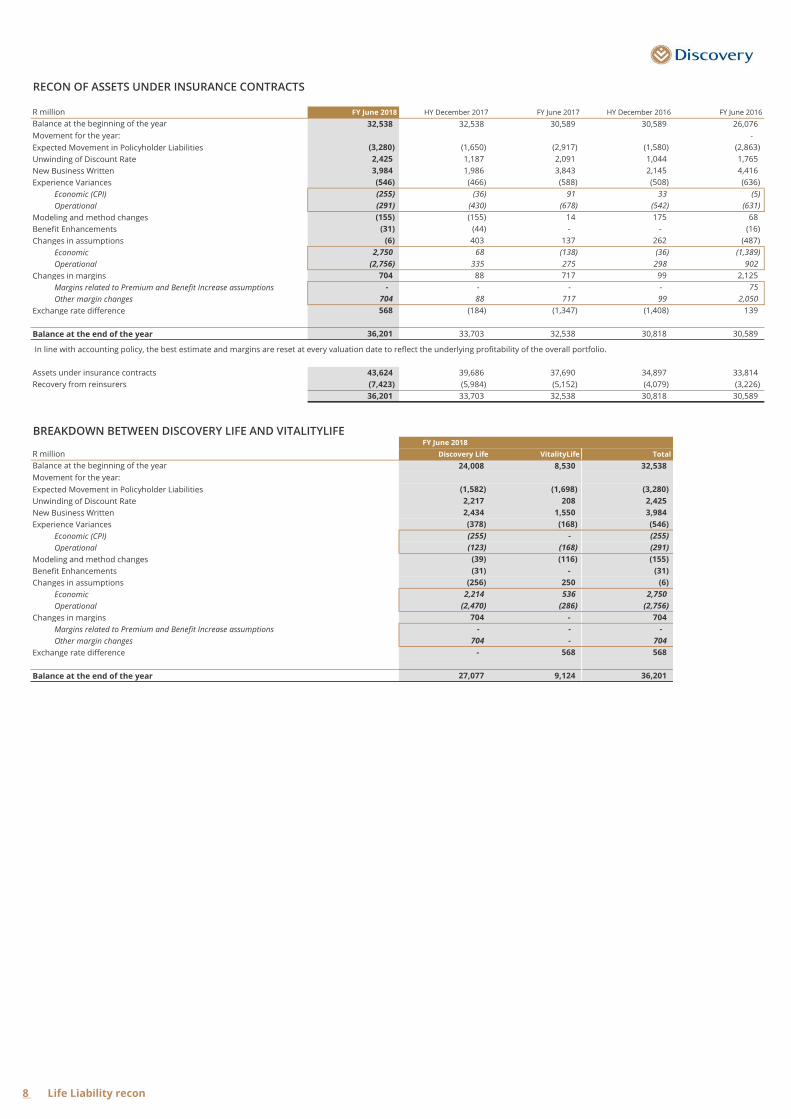
RECON OF ASSETS UNDER INSURANCE CONTRACTS
R million FY June 2018 HY December 2017 FY June 2017 HY December 2016 FY June 2016
Balance at the beginning of the year 32,538 32,538 30,589 30,589 26,076
Movement for the year: -
Expected Movement in Policyholder Liabilities (3,280) (1,650) (2,917) (1,580) (2,863)
Unwinding of Discount Rate 2,425 1,187 2,091 1,044 1,765
New Business Written 3,984 1,986 3,843 2,145 4,416
Experience Variances (546) (466) (588) (508) (636)
Economic (CPI) (255) (36) 91 33 (5)
Operational (291) (430) (678) (542) (631)
Modeling and method changes (155) (155) 14 175 68
Benefit Enhancements (31) (44) - - (16)
Changes in assumptions (6) 403 137 262 (487)
Economic 2,750 68 (138) (36) (1,389)
Operational (2,756) 335 275 298 902
Changes in margins 704 88 717 99 2,125
Margins related to Premium and Benefit Increase assumptions - - - - 75
Other margin changes 704 88 717 99 2,050
Exchange rate difference 568 (184) (1,347) (1,408) 139
Balance at the end of the year 36,201 33,703 32,538 30,818 30,589
In line with accounting policy, the best estimate and margins are reset at every valuation date to reflect the underlying profitability of the overall portfolio.
Assets under insurance contracts 43,624 39,686 37,690 34,897 33,814
Recovery from reinsurers (7,423) (5,984) (5,152) (4,079) (3,226)
36,201 33,703 32,538 30,818 30,589
BREAKDOWN BETWEEN DISCOVERY LIFE AND VITALITYLIFEFY June 2018
R million Discovery Life VitalityLife Total
Balance at the beginning of the year 24,008 8,530 32,538
Movement for the year:
Expected Movement in Policyholder Liabilities (1,582) (1,698) (3,280)
Unwinding of Discount Rate 2,217 208 2,425
New Business Written 2,434 1,550 3,984
Experience Variances (378) (168) (546)
Economic (CPI) (255) - (255)
Operational (123) (168) (291)
Modeling and method changes (39) (116) (155)
Benefit Enhancements (31) - (31)
Changes in assumptions (256) 250 (6)
Economic 2,214 536 2,750
Operational (2,470) (286) (2,756)
Changes in margins 704 - 704
Margins related to Premium and Benefit Increase assumptions - - -
Other margin changes 704 - 704
Exchange rate difference - 568 568
Balance at the end of the year 27,077 9,124 36,201
8 Life Liability recon

BREAKDOWN OF INVEST FUNDS UNDER MANAGEMENT
R million Total
December 2012 26,615
June 2013 30,153
December 2013 36,026
June 2014 41,822
December 2014 45,619
June 2015 50,473
December 2015 56,195
June 2016 60,953
December 2016 63,985
June 2017 69,547
December 2017 77,844
June 2018 81,789
9 Invest FUM
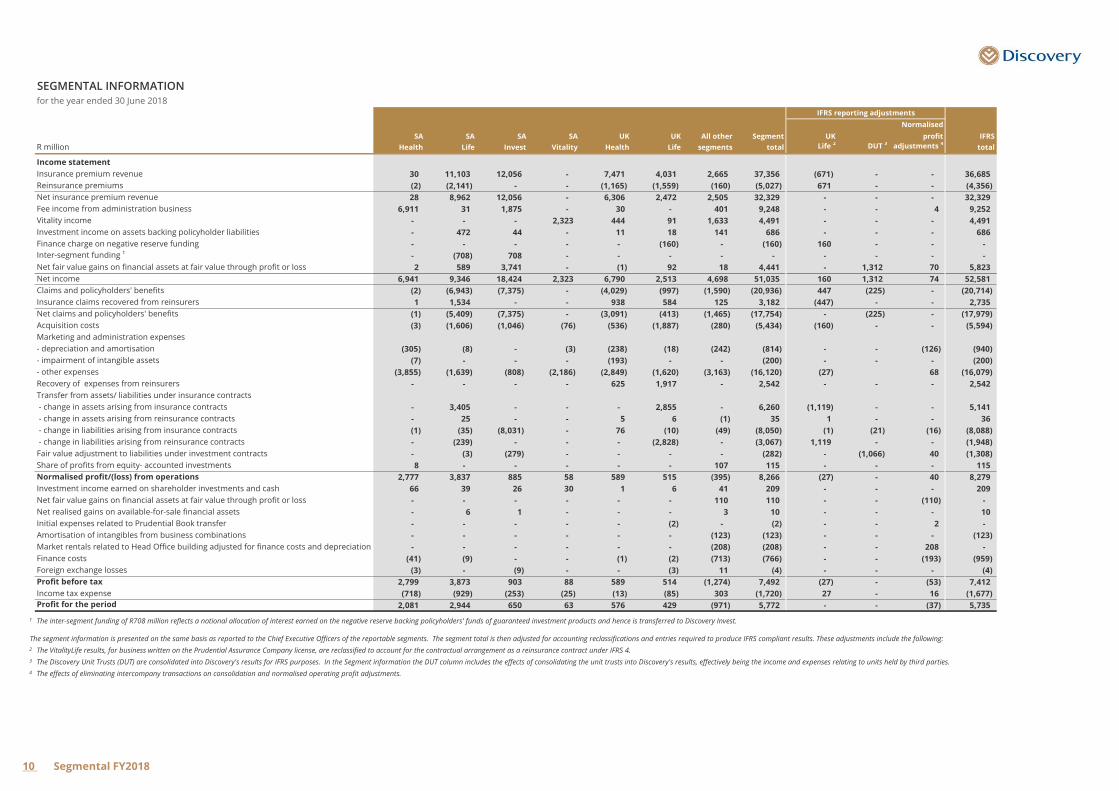
SEGMENTAL INFORMATIONfor the year ended 30 June 2018
Normalised
SA SA SA SA UK UK All other Segment UK profit IFRS
R million Health Life Invest Vitality Health Life segments total Life 2 DUT 3 adjustments 4 total
Income statement
Insurance premium revenue 30 11,103 12,056 - 7,471 4,031 2,665 37,356 (671) - - 36,685
Reinsurance premiums (2) (2,141) - - (1,165) (1,559) (160) (5,027) 671 - - (4,356)
Net insurance premium revenue 28 8,962 12,056 - 6,306 2,472 2,505 32,329 - - - 32,329
Fee income from administration business 6,911 31 1,875 - 30 - 401 9,248 - - 4 9,252
Vitality income - - - 2,323 444 91 1,633 4,491 - - - 4,491
Investment income on assets backing policyholder liabilities - 472 44 - 11 18 141 686 - - - 686
Finance charge on negative reserve funding - - - - - (160) - (160) 160 - - -
Inter-segment funding 1- (708) 708 - - - - - - - - -
Net fair value gains on financial assets at fair value through profit or loss 2 589 3,741 - (1) 92 18 4,441 - 1,312 70 5,823
Net income 6,941 9,346 18,424 2,323 6,790 2,513 4,698 51,035 160 1,312 74 52,581
Claims and policyholders' benefits (2) (6,943) (7,375) - (4,029) (997) (1,590) (20,936) 447 (225) - (20,714)
Insurance claims recovered from reinsurers 1 1,534 - - 938 584 125 3,182 (447) - - 2,735
Net claims and policyholders' benefits (1) (5,409) (7,375) - (3,091) (413) (1,465) (17,754) - (225) - (17,979)
Acquisition costs (3) (1,606) (1,046) (76) (536) (1,887) (280) (5,434) (160) - - (5,594)
Marketing and administration expenses
- depreciation and amortisation (305) (8) - (3) (238) (18) (242) (814) - - (126) (940)
- impairment of intangible assets (7) - - - (193) - - (200) - - - (200)
- other expenses (3,855) (1,639) (808) (2,186) (2,849) (1,620) (3,163) (16,120) (27) 68 (16,079)
Recovery of expenses from reinsurers - - - - 625 1,917 - 2,542 - - - 2,542
Transfer from assets/ liabilities under insurance contracts
- change in assets arising from insurance contracts - 3,405 - - - 2,855 - 6,260 (1,119) - - 5,141
- change in assets arising from reinsurance contracts - 25 - - 5 6 (1) 35 1 - - 36
- change in liabilities arising from insurance contracts (1) (35) (8,031) - 76 (10) (49) (8,050) (1) (21) (16) (8,088)
- change in liabilities arising from reinsurance contracts - (239) - - - (2,828) - (3,067) 1,119 - - (1,948)
Fair value adjustment to liabilities under investment contracts - (3) (279) - - - - (282) - (1,066) 40 (1,308)
Share of profits from equity- accounted investments 8 - - - - - 107 115 - - - 115
Normalised profit/(loss) from operations 2,777 3,837 885 58 589 515 (395) 8,266 (27) - 40 8,279
Investment income earned on shareholder investments and cash 66 39 26 30 1 6 41 209 - - - 209
Net fair value gains on financial assets at fair value through profit or loss - - - - - - 110 110 - - (110) -
Net realised gains on available-for-sale financial assets - 6 1 - - - 3 10 - - - 10
Initial expenses related to Prudential Book transfer - - - - - (2) - (2) - - 2 -
Amortisation of intangibles from business combinations - - - - - - (123) (123) - - - (123)
Market rentals related to Head Office building adjusted for finance costs and depreciation - - - - - - (208) (208) - - 208 -
Finance costs (41) (9) - - (1) (2) (713) (766) - - (193) (959)
Foreign exchange losses (3) - (9) - - (3) 11 (4) - - - (4)
Profit before tax 2,799 3,873 903 88 589 514 (1,274) 7,492 (27) - (53) 7,412
Income tax expense (718) (929) (253) (25) (13) (85) 303 (1,720) 27 - 16 (1,677)
Profit for the period 2,081 2,944 650 63 576 429 (971) 5,772 - - (37) 5,735
1
2
3
4
IFRS reporting adjustments
The inter-segment funding of R708 million reflects a notional allocation of interest earned on the negative reserve backing policyholders' funds of guaranteed investment products and hence is transferred to Discovery Invest.
The segment information is presented on the same basis as reported to the Chief Executive Officers of the reportable segments. The segment total is then adjusted for accounting reclassifications and entries required to produce IFRS compliant results. These adjustments include the following:
The VitalityLife results, for business written on the Prudential Assurance Company license, are reclassified to account for the contractual arrangement as a reinsurance contract under IFRS 4.
The Discovery Unit Trusts (DUT) are consolidated into Discovery's results for IFRS purposes. In the Segment information the DUT column includes the effects of consolidating the unit trusts into Discovery's results, effectively being the income and expenses relating to units held by third parties.
The effects of eliminating intercompany transactions on consolidation and normalised operating profit adjustments.
10 Segmental FY2018

SEGMENTAL INFORMATION - DISCOVERY INSUREfor the twelve months ended 30 June 2018
June June
R million 2018 2017
Income statement
Insurance premium revenue 2,664 2,076
Reinsurance premiums (160) (203)
Net insurance premium revenue 2,504 1,873
Fee income from administration business 30 22
Investment income on assets backing policyholder liabilities 127 106
Net fair value losses on financial assets at fair value through profit or loss (3) -
Net income 2,658 2,001
Claims and policyholders' benefits (1,590) (1,426)
Insurance claims recovered from reinsurers 125 265
Net claims and policyholders' benefits (1,465) (1,161)
Acquisition costs (346) (245)
Marketing and administration expenses
- depreciation and amortisation (61) (51)
- other expenses (680) (553)
Transfer from assets/liabilities under insurance contracts
- change in assets arising from reinsurance contracts (2) -
- change in liabilities arising from insurance contracts (49) (34)
Share of net profits from equity accounted investments 13 22
Normalised profit/(loss) from operations 68 (21)
Finance costs (2) (1)
Profit/(loss) before tax 66 (22)
Income tax expense 235 -
Profit/(loss) for the year 301 (22)
11 Insure segm June 18

VIF, APE AND VNB SPLIT BETWEEN LIFE AND INVEST
R million June 2018 December 2017 June 2017 December 2016 June 2016* December 2015*
VIF
Life 19,810 19,484 18,065 17,313 16,096 17,067
Invest 7,348 7,032 6,258 5,794 5,592 5,468
APE**
Life 933 488 985 462 862 446
Invest 1,840 894 1,856 974 1,935 920
VNB
Life 911 496 885 434 756 406
Invest 391 183 346 218 439 215
*Discovery Retirement Optimiser (DRO) product moved from Life to Invest in line with disclosures for December 2016 and later periods.
**APE is the Annual Premium Income (or Annual Premium Equivalent in the case of Single Premium Investment business) in relation to New Business only, and excludes
any addition to Existing Business premiums arising from servicing increases and ACIs.
12 Results split Life and Invest
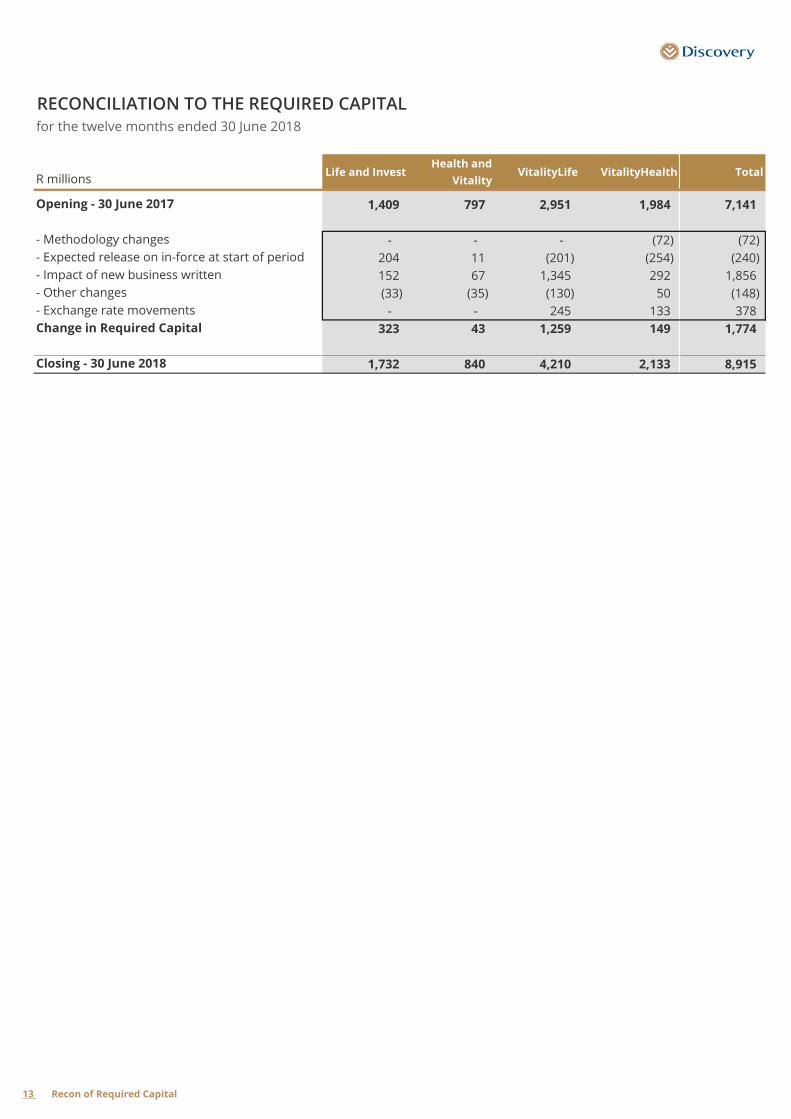
RECONCILIATION TO THE REQUIRED CAPITALfor the twelve months ended 30 June 2018
R millionsLife and Invest
Health and
VitalityVitalityLife VitalityHealth Total
Opening - 30 June 2017 1,409 797 2,951 1,984 7,141
- Methodology changes - - - (72) (72)
- Expected release on in-force at start of period 204 11 (201) (254) (240)
- Impact of new business written 152 67 1,345 292 1,856
- Other changes (33) (35) (130) 50 (148)
- Exchange rate movements - - 245 133 378
Change in Required Capital 323 43 1,259 149 1,774
Closing - 30 June 2018 1,732 840 4,210 2,133 8,915
13 Recon of Required Capital

IMPACT OF FINANCE LEASE ACCOUNTINGon normalised headline earnings for the year ended 30 June 2018
June June %
R million 2018 2017 change
Reported normalised headling earnings 5,401 4,656 16
Finance lease accounting impact 208 -
Finance costs 210 -
Market related rental (128) -
Depreciation 126 -
Normalised headline earnings adjusted for finance lease accounting impact 5,609 4,656 20%
14 Impact of finance lease acc

Group Shareholder Free Cash Movement
R millions FY2018 FY2017 Source
Cash Generated from In-Force Before Financing 10,612 7,623 New disclosure
Tax Paid (1,228) (745) Cashflow Statement
Finance Cost Paid (759) (437) Cashflow Statement
Dividends Paid (1,367) (1,235) Cashflow Statement
New Business (7,822) (7,071) New disclosure
New Initiatives (1,996) (1,471) New disclosure
Transactions with Reinsurers 1,107 420 New disclosure
Transactions with Borrowers (Excl. Finance Costs) 1,976 3,148 Cashflow Statement
Movement in Shareholder Free Cash 522 231
Group Shareholder Free Cash Movement - Reconciliation to Profit for the Period
R millions FY2018 FY2017 Source
Profit for the period 5,735 4,495 Segmental Income Statement
Reverse non-cash profit items:
Share of net profits from equity accounted investments (115) (26) Segmental Income Statement
Depreciation and amortisation 940 699 Segmental Income Statement
Impairment of intangible assets 200 - Segmental Income Statement
Deferred acquisition costs (Excl. Invest DAC and exchange rate movements) (61) (2) Notes to Annual Financial Statements
Deferred Revenue (Excl. exchange rate movements) 32 - Notes to Annual Financial Statements
Amortisation of intangibles from business combinations 123 171 Segmental Income Statement
Non cash impact of Vitality Health Financial Reinsurance (352) (383) New disclosure
Vitality Health Financial Reinsurance Recapture - (858) Segmental Income Statement
UK Life IFRS reporting adjustments - Tax Accrued (27) (103) Segmental Income Statement
Other non-cash adjustments to profit 42 (145) New disclosure
Adjustments from IFRS to EV ANW:
Increase in Negative Reserves and Invest DAC (Net of tax) (4,339) (3,116) Embedded Value Statement
Add back deferred tax on Increase in Negative Reserve (805) (935) Additional Analyst Pack
Exchange rate movements on Vitality Life Negative Reserves 286 (653) New disclosure
Other adjustments to arrive at EV ANW 113 47 New disclosure
Incurred to Cash basis:
- Rent Paid (128) - New disclosure
- Finance Costs Paid (759) (437) Cashflow Statement
- Finance Costs Accrued 959 478 Segmental Income Statement
- Taxation paid (1,228) (745) Cashflow Statement
- Taxation Accrued 1,720 1,943 Segmental Income Statement
Investing Activities:
Purchase of property and equipment (470) (239) Cashflow Statement
Proceeds from disposal of property and equipment 7 5 Cashflow Statement
Purchase of intangible assets (1,940) (1,353) Cashflow Statement
Proceeds from disposal of intangible assets - 7 Cashflow Statement
Increase in investment in associate (20) (530) Cashflow Statement
Financing Activities:
Increase in borrowings 2,654 3,514 Cashflow Statement
Repayment of borrowings (678) (366) Cashflow Statement
Dividends paid to ordinary shareholders (1,284) (1,152) Cashflow Statement
Dividends paid to preference shareholders (83) (83) Cashflow Statement
Movement in Shareholder Free Cash 522 231
Notes
(1) "Movement in Shareholder Free Cash" is an estimate of shareholder free cashflow. Life and Invest and VitalityLife are included based on the change in the
Adjusted Net Worth in the Embedded Value. Changes in working capital are not allowed for in the estimate.