customer value, overall satisfaction, end-user loyalty, and market ... · customer value, overall...
TRANSCRIPT
Industrial Marketing Management 33 (2004) 675–687
Customer value, overall satisfaction, end-user loyalty, and market
performance in detail intensive industries
Joseph M. Spiteria, Paul A. Dionb,*
a6255 RFD, Long Grove, IL 60047, USAbSigmund Weis School of Business, Susquehanna University, 514 University Avenue, Selinsgrove, PA 17870, USA
Received 21 October 2003; received in revised form 15 February 2004; accepted 28 March 2004
Available online 14 July 2004
Abstract
The objective was to test a customer value variable, as operationalized by a modification of Ulaga and Eggert’s scale, as a direct
explanatory concept in predicting satisfaction, loyalty, and market performance in a hybrid veterinary pharmaceuticals market. The market
was considered to be a hybrid because physicians purchase on behalf of their clients. The scale proved to be reliable and valid in a detail
intensive market using 220 veterinary physicians as respondents. To achieve an acceptable structural equation modeling fit, the customer
value variable had to be dropped. The final model indicated a direct influence by product, strategic, and personal benefits as well as perceived
sacrifices on the dependent variables. Management implications of the study are described.
D 2004 Published by Elsevier Inc.
Keywords: Customer value; Satisfaction; Ulaga–Eggert scale; Veterinary pharmaceuticals
1. Introduction
Marketing academics have identified customer value as
one of the top research agendas. The Marketing Science
Institute has consistently included customer value in its list
of research priorities. The Institute for the Study of Business
Markets at the Pennsylvania State University and the Center
for Business and Industrial Marketing at Georgia State
University have also integrated research on customer value
and view it as a key research program. Customer value is on
the mission statements of many large corporations (Exxon)
and has become a sought after source of competitive advan-
tage. Now that the first scale for the operationalization of this
concept has been published (Ulaga & Eggert, 2002), research
into customer value can become a more empirical area of
inquiry. The needed theoretical areas of research for custom-
er value include ‘‘. . .major antecedents, mediating variables,
and consequences’’ (Ulaga & Eggert, 2002, p.15) and ‘‘to
investigate relationship customer-value concepts closely
related to the construct such as commitment, satisfaction,
0019-8501/$ – see front matter D 2004 Published by Elsevier Inc.
doi:10.1016/j.indmarman.2004.03.005
* Corresponding author. Tel.: +1-570-372-4034.
E-mail address: [email protected] (P.A. Dion).
and trust.’’ Methodologically, there is also a need to inves-
tigate how robust this new scale is outside its original setting
of French industrial purchasing managers. The purpose of
this study was to empirically investigate the model shown
below in Fig. 1. This model was synthesized from several
available research efforts.
Additionally, as the new consumer value scale of Ulaga
and Eggert (2002) has neither been revalidated nor tested for
its predictive effectiveness in a new marketing setting, this
newly developed scale was validated and then empirically
tested in a detail intensive industry (DII) setting. In sum-
mary, the research objectives were to:
1. empirically investigate the effect of perceived product
benefits, perceived strategic benefits, perceived personal
benefits, perceived sacrifices, and perceived relationship
benefits on the construct of customer value;
2. empirically link the measurement of customer value to
outcome measures, such as overall satisfaction, end-user
loyalty, and market performance;
3. empirically investigate the role of overall satisfaction in
the model;
4. empirically investigate the effects of relationship benefits
and sacrifices on market performance;
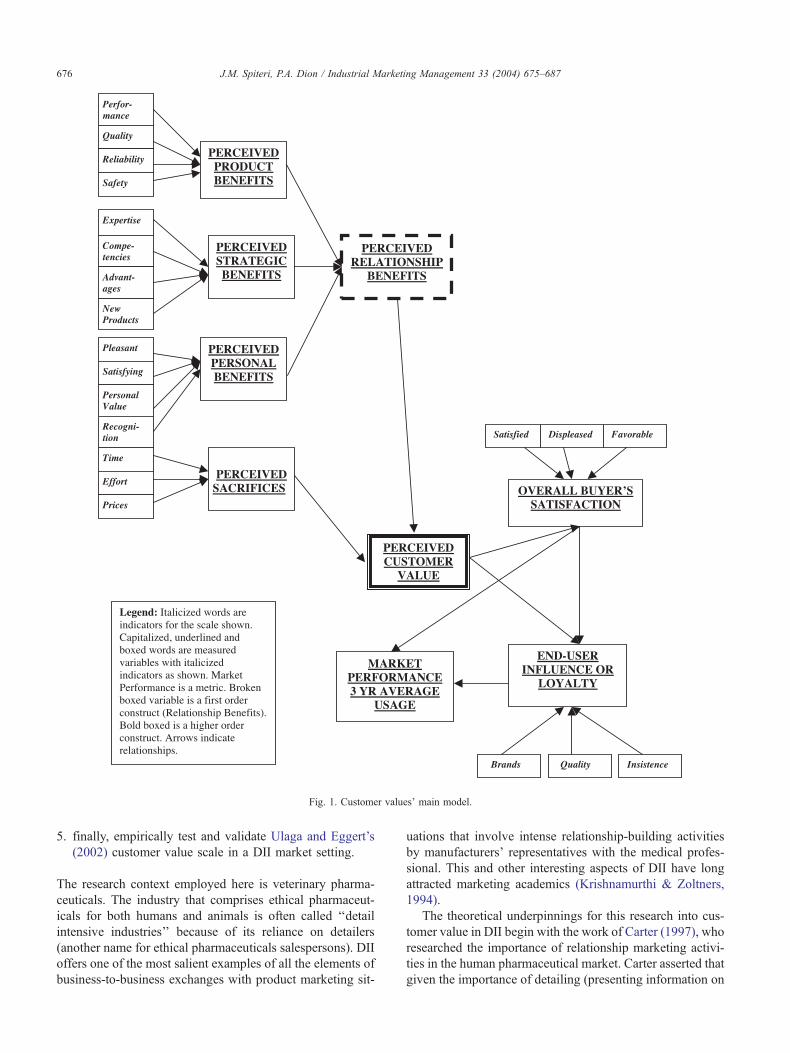
Fig. 1. Customer values’ main model.
J.M. Spiteri, P.A. Dion / Industrial Marketing Management 33 (2004) 675–687676
5. finally, empirically test and validate Ulaga and Eggert’s
(2002) customer value scale in a DII market setting.
The research context employed here is veterinary pharma-
ceuticals. The industry that comprises ethical pharmaceut-
icals for both humans and animals is often called ‘‘detail
intensive industries’’ because of its reliance on detailers
(another name for ethical pharmaceuticals salespersons). DII
offers one of the most salient examples of all the elements of
business-to-business exchanges with product marketing sit-
uations that involve intense relationship-building activities
by manufacturers’ representatives with the medical profes-
sional. This and other interesting aspects of DII have long
attracted marketing academics (Krishnamurthi & Zoltners,
1994).
The theoretical underpinnings for this research into cus-
tomer value in DII begin with the work of Carter (1997), who
researched the importance of relationship marketing activi-
ties in the human pharmaceutical market. Carter asserted that
given the importance of detailing (presenting information on
J.M. Spiteri, P.A. Dion / Industrial Marketing Management 33 (2004) 675–687 677
drugs) ‘‘if there is no personal contact, then the chances that
the customer will purchase the product is small.’’ It is
through the personal selling activity that a long-term rela-
tionship between the manufacturer and their representative is
maintained with the customer—the medical professional.
Therefore, the spectrum of personal selling activities is
viewed as central to the relationship marketing efforts of
the firm and one of the critical sets of antecedents to
customer value. Recently, drug manufacturers have invested
in direct-to-consumer advertising (DTC), which is changing
the dynamics and the relative importance of detailing and
other relationship-building activities to DTC. DII have also
become examples of business to consumer marketing. In-
deed, DII is now a good example of a hybrid of business-to-
business and business-to-consumer.
The research was conducted in three phases. Using a
Delphi methodology on 22 respondents, Phase I tested the
language or wording adaptation of the perceived strategic
benefits indicators variable in the veterinary market. Phase II
used a sample of 100 multi-informants to test the importance
of the items of benefits and sacrifices found in the scale of
customer value. Based on the findings of the two earlier
phases, Phase III consisted of fielding the final version of the
full questionnaire to a random sample of 623 respondents.
2. Literature and theory background
The literature review begins with a conceptual presenta-
tion of the antecedents to the customer value construct,
Table 1
Antecedents of customer value
Antecedents Findings
Market orientation Directs firm to focus on gathering
dissemination of customer value in
Learning Positively linked to implementation
customer value information
Competence/expertise Linked to customer value
Communication Linked to customer value
Alignment of sales compensation to value Linked to customer value
Equity/fairness in exchange Linked to success of buyer/seller
relationships
Forbearing opportunistic behavior Linked to success of buyer/seller
relationships
Ethical acts Linked to success of buyer/seller
relationships
Shared values Linked to success of buyer/seller
relationships
Promotional investments Add customer value or perceived v
Relational investments Add customer value or perceived v
Innovations Add customer value or perceived v
Total quality management Add customer value or perceived v
Seeking sustainable competitive
advantage
Lead to acceptance of customer va
as competitive advantage
Process efficiencies Lead to acceptance of customer va
as competitive advantage
Cost-cutting initiatives Lead to acceptance of customer va
as competitive advantage
followed by the processes that lead to the construct of
customer value. These processes include the assessment of
product quality and price and how they lead to the concept
of customer value followed by a look at the construction of
a recently released scale. After the antecedents and process
are presented, the literature is reviewed for possible out-
comes to customer value. They are overall buyer satisfac-
tion, end-user loyalty, and market performance. Finally,
there is an examination of marketing issues in DII.
2.1. Antecedents of customer value
There are many legitimate antecedents to the compre-
hensive and complex concept of customer value. There are
16 such influences documented in the literature. A detailed
discussion of each would be too lengthy to include in this
article but Table 1 gives a summary of the influences and
references findings.
2.2. Processes of customer value
Quality models comprise a large research stream in
marketing thought. However, recently, quality models have
been criticized for not explicitly including the effect of
perceived price or cost on the customers’ judgment of quality
(Iacobucci, Grayson, & Ostrom, 1994) and for not consi-
dering sustainable competitive advantage (Butz&Goodstein,
1996). Since the continued search for competitive advantage
has been directed toward delivering superior customer value
(Band, 1991; Day, 1990; Gale, 1994; Naumann, 1995),
Author(s)
and
formation
Slater & Narver, 2000; Woodruff & Gardial, 1996
of Day, 1994a, 1994b; Kohli & Jaworski, 1990;
Slater & Narver, 1995
Doney & Cannon, 1997; Smith & Barclay, 1997
Anderson & Weitz, 1989; Gronroos, 1990
Anderson et al., 1994
Gundlach & Murphy, 1993; Tax, Brown,
& Chandrashekaran, 1998
Morgan & Hunt, 1994
Boedecker, Morgan, & Stoltman, 1991;
Lagace et al., 1991
Morgan & Hunt, 1994
alue Woodruff & Gardial, 1996
alue Berry, 1995; De Wulf et al., 2001; Goff et al., 1997
alue Dickson, 1992; Ghemawat, 1986; Jacobson, 1992
alue Buzzell & Wiersema, 1981; Capon, Farely, & Hoenig, 1990
lue Christopher et al., 1991; Porter, 1985;
Treacy & Wiersema, 1995
lue McKenna, 1991; Porter, 1985
lue Cannon & Homburg, 2001
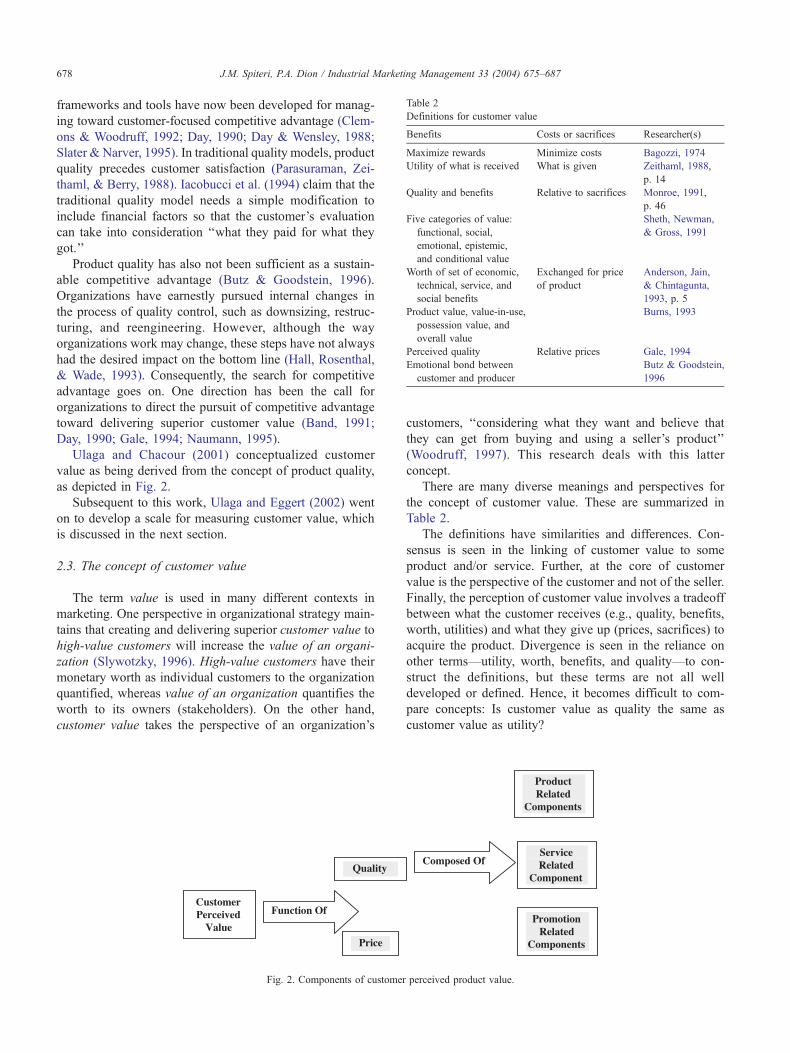
Table 2
Definitions for customer value
Benefits Costs or sacrifices Researcher(s)
Maximize rewards Minimize costs Bagozzi, 1974
Utility of what is received What is given Zeithaml, 1988,
p. 14
Quality and benefits Relative to sacrifices Monroe, 1991,
p. 46
Five categories of value:
functional, social,
emotional, epistemic,
and conditional value
Sheth, Newman,
& Gross, 1991
Worth of set of economic,
technical, service, and
social benefits
Exchanged for price
of product
Anderson, Jain,
& Chintagunta,
1993, p. 5
Product value, value-in-use,
possession value, and
overall value
Burns, 1993
Perceived quality Relative prices Gale, 1994
Emotional bond between
customer and producer
Butz & Goodstein,
1996
J.M. Spiteri, P.A. Dion / Industrial Marketing Management 33 (2004) 675–687678
frameworks and tools have now been developed for manag-
ing toward customer-focused competitive advantage (Clem-
ons & Woodruff, 1992; Day, 1990; Day & Wensley, 1988;
Slater & Narver, 1995). In traditional quality models, product
quality precedes customer satisfaction (Parasuraman, Zei-
thaml, & Berry, 1988). Iacobucci et al. (1994) claim that the
traditional quality model needs a simple modification to
include financial factors so that the customer’s evaluation
can take into consideration ‘‘what they paid for what they
got.’’
Product quality has also not been sufficient as a sustain-
able competitive advantage (Butz & Goodstein, 1996).
Organizations have earnestly pursued internal changes in
the process of quality control, such as downsizing, restruc-
turing, and reengineering. However, although the way
organizations work may change, these steps have not always
had the desired impact on the bottom line (Hall, Rosenthal,
& Wade, 1993). Consequently, the search for competitive
advantage goes on. One direction has been the call for
organizations to direct the pursuit of competitive advantage
toward delivering superior customer value (Band, 1991;
Day, 1990; Gale, 1994; Naumann, 1995).
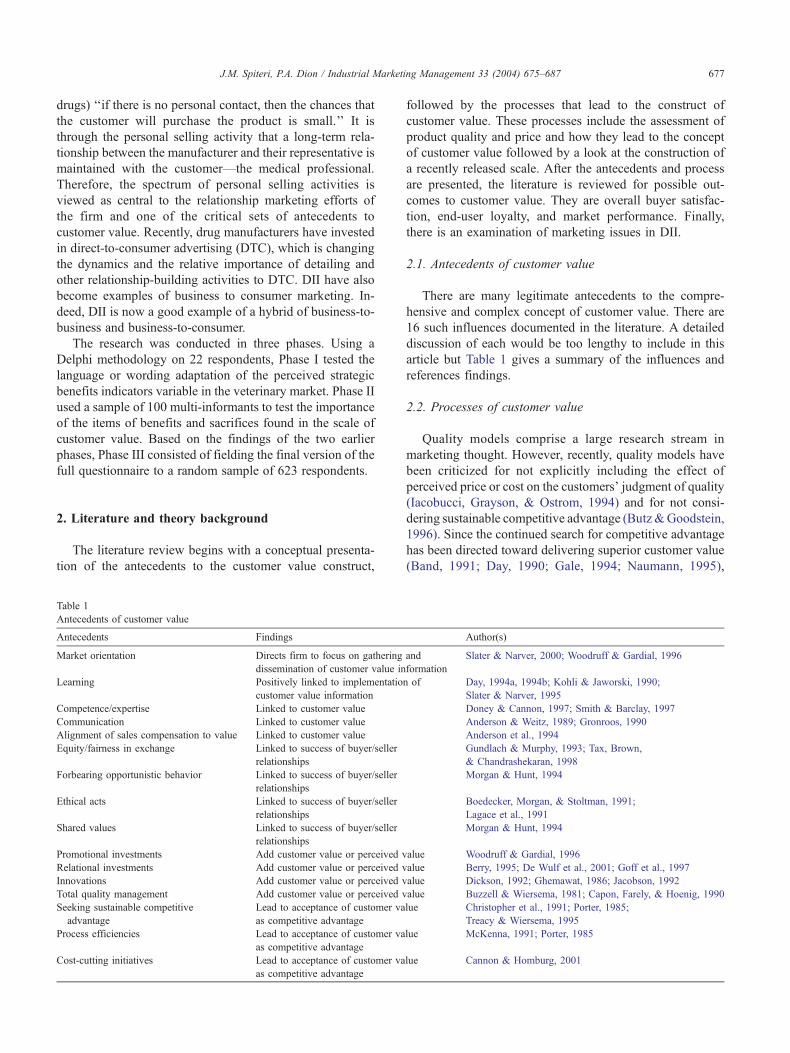
Ulaga and Chacour (2001) conceptualized customer
value as being derived from the concept of product quality,
as depicted in Fig. 2.
Subsequent to this work, Ulaga and Eggert (2002) went
on to develop a scale for measuring customer value, which
is discussed in the next section.
2.3. The concept of customer value
The term value is used in many different contexts in
marketing. One perspective in organizational strategy main-
tains that creating and delivering superior customer value to
high-value customers will increase the value of an organi-
zation (Slywotzky, 1996). High-value customers have their
monetary worth as individual customers to the organization
quantified, whereas value of an organization quantifies the
worth to its owners (stakeholders). On the other hand,
customer value takes the perspective of an organization’s
Fig. 2. Components of customer
customers, ‘‘considering what they want and believe that
they can get from buying and using a seller’s product’’
(Woodruff, 1997). This research deals with this latter
concept.
There are many diverse meanings and perspectives for
the concept of customer value. These are summarized in
Table 2.
The definitions have similarities and differences. Con-
sensus is seen in the linking of customer value to some
product and/or service. Further, at the core of customer
value is the perspective of the customer and not of the seller.
Finally, the perception of customer value involves a tradeoff
between what the customer receives (e.g., quality, benefits,
worth, utilities) and what they give up (prices, sacrifices) to
acquire the product. Divergence is seen in the reliance on
other terms—utility, worth, benefits, and quality—to con-
struct the definitions, but these terms are not all well
developed or defined. Hence, it becomes difficult to com-
pare concepts: Is customer value as quality the same as
customer value as utility?
perceived product value.
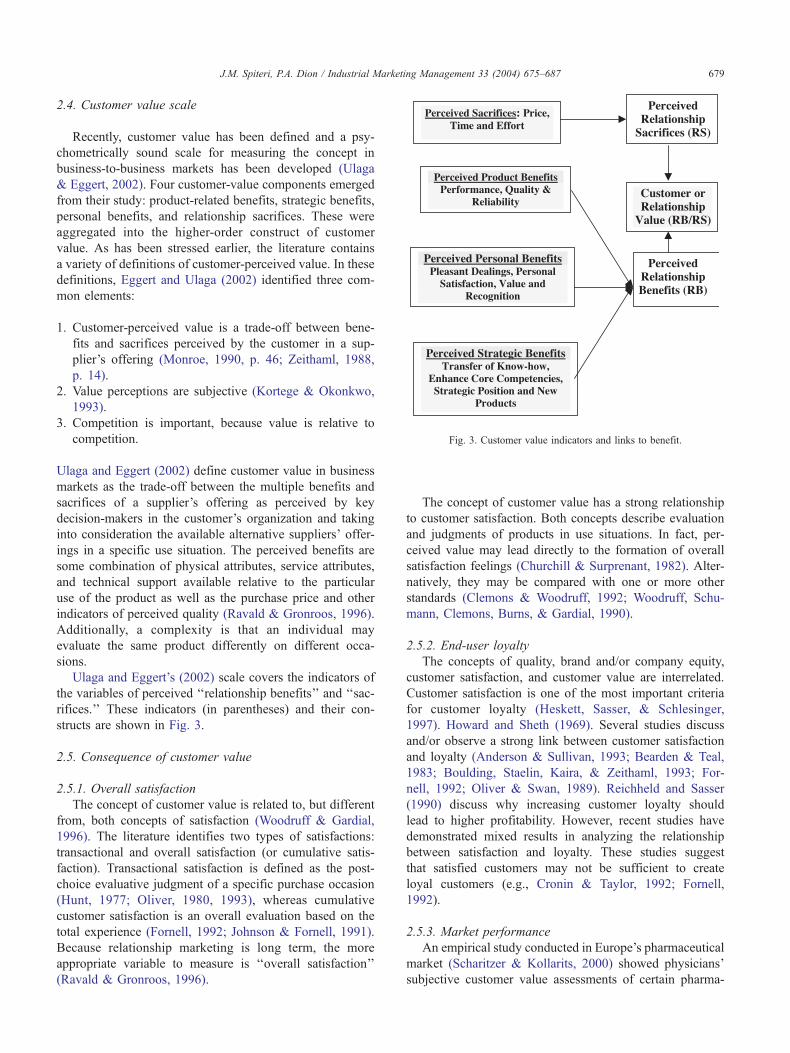
Fig. 3. Customer value indicators and links to benefit.
arketing Management 33 (2004) 675–687 679
2.4. Customer value scale
Recently, customer value has been defined and a psy-
chometrically sound scale for measuring the concept in
business-to-business markets has been developed (Ulaga
& Eggert, 2002). Four customer-value components emerged
from their study: product-related benefits, strategic benefits,
personal benefits, and relationship sacrifices. These were
aggregated into the higher-order construct of customer
value. As has been stressed earlier, the literature contains
a variety of definitions of customer-perceived value. In these
definitions, Eggert and Ulaga (2002) identified three com-
mon elements:
1. Customer-perceived value is a trade-off between bene-
fits and sacrifices perceived by the customer in a sup-
plier’s offering (Monroe, 1990, p. 46; Zeithaml, 1988,
p. 14).
2. Value perceptions are subjective (Kortege & Okonkwo,
1993).
3. Competition is important, because value is relative to
competition.
Ulaga and Eggert (2002) define customer value in business
markets as the trade-off between the multiple benefits and
sacrifices of a supplier’s offering as perceived by key
decision-makers in the customer’s organization and taking
into consideration the available alternative suppliers’ offer-
ings in a specific use situation. The perceived benefits are
some combination of physical attributes, service attributes,
and technical support available relative to the particular
use of the product as well as the purchase price and other
indicators of perceived quality (Ravald & Gronroos, 1996).
Additionally, a complexity is that an individual may
evaluate the same product differently on different occa-
sions.
Ulaga and Eggert’s (2002) scale covers the indicators of
the variables of perceived ‘‘relationship benefits’’ and ‘‘sac-
rifices.’’ These indicators (in parentheses) and their con-
structs are shown in Fig. 3.
2.5. Consequence of customer value
2.5.1. Overall satisfaction
The concept of customer value is related to, but different
from, both concepts of satisfaction (Woodruff & Gardial,
1996). The literature identifies two types of satisfactions:
transactional and overall satisfaction (or cumulative satis-
faction). Transactional satisfaction is defined as the post-
choice evaluative judgment of a specific purchase occasion
(Hunt, 1977; Oliver, 1980, 1993), whereas cumulative
customer satisfaction is an overall evaluation based on the
total experience (Fornell, 1992; Johnson & Fornell, 1991).
Because relationship marketing is long term, the more
appropriate variable to measure is ‘‘overall satisfaction’’
(Ravald & Gronroos, 1996).
J.M. Spiteri, P.A. Dion / Industrial M
The concept of customer value has a strong relationship
to customer satisfaction. Both concepts describe evaluation
and judgments of products in use situations. In fact, per-
ceived value may lead directly to the formation of overall
satisfaction feelings (Churchill & Surprenant, 1982). Alter-
natively, they may be compared with one or more other
standards (Clemons & Woodruff, 1992; Woodruff, Schu-
mann, Clemons, Burns, & Gardial, 1990).
2.5.2. End-user loyalty
The concepts of quality, brand and/or company equity,
customer satisfaction, and customer value are interrelated.
Customer satisfaction is one of the most important criteria
for customer loyalty (Heskett, Sasser, & Schlesinger,
1997). Howard and Sheth (1969). Several studies discuss
and/or observe a strong link between customer satisfaction
and loyalty (Anderson & Sullivan, 1993; Bearden & Teal,
1983; Boulding, Staelin, Kaira, & Zeithaml, 1993; For-
nell, 1992; Oliver & Swan, 1989). Reichheld and Sasser
(1990) discuss why increasing customer loyalty should
lead to higher profitability. However, recent studies have
demonstrated mixed results in analyzing the relationship
between satisfaction and loyalty. These studies suggest
that satisfied customers may not be sufficient to create
loyal customers (e.g., Cronin & Taylor, 1992; Fornell,
1992).
2.5.3. Market performance
An empirical study conducted in Europe’s pharmaceutical
market (Scharitzer & Kollarits, 2000) showed physicians’
subjective customer value assessments of certain pharma-
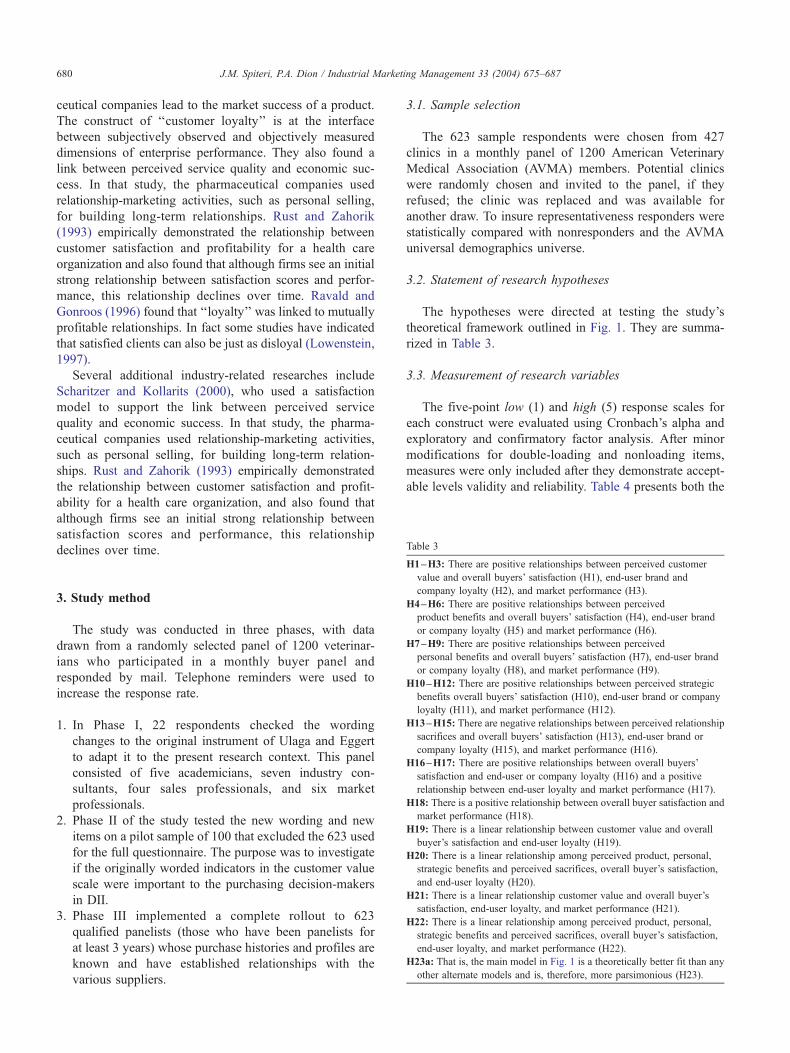
Table 3
J.M. Spiteri, P.A. Dion / Industrial Marketi680
ceutical companies lead to the market success of a product.
The construct of ‘‘customer loyalty’’ is at the interface
between subjectively observed and objectively measured
dimensions of enterprise performance. They also found a
link between perceived service quality and economic suc-
cess. In that study, the pharmaceutical companies used
relationship-marketing activities, such as personal selling,
for building long-term relationships. Rust and Zahorik
(1993) empirically demonstrated the relationship between
customer satisfaction and profitability for a health care
organization and also found that although firms see an initial
strong relationship between satisfaction scores and perfor-
mance, this relationship declines over time. Ravald and
Gonroos (1996) found that ‘‘loyalty’’ was linked to mutually
profitable relationships. In fact some studies have indicated
that satisfied clients can also be just as disloyal (Lowenstein,
1997).
Several additional industry-related researches include
Scharitzer and Kollarits (2000), who used a satisfaction
model to support the link between perceived service
quality and economic success. In that study, the pharma-
ceutical companies used relationship-marketing activities,
such as personal selling, for building long-term relation-
ships. Rust and Zahorik (1993) empirically demonstrated
the relationship between customer satisfaction and profit-
ability for a health care organization, and also found that
although firms see an initial strong relationship between
satisfaction scores and performance, this relationship
declines over time.
H1–H3: There are positive relationships between perceived customervalue and overall buyers’ satisfaction (H1), end-user brand and
company loyalty (H2), and market performance (H3).
H4–H6: There are positive relationships between perceived
product benefits and overall buyers’ satisfaction (H4), end-user brand
or company loyalty (H5) and market performance (H6).
H7–H9: There are positive relationships between perceived
personal benefits and overall buyers’ satisfaction (H7), end-user brand
or company loyalty (H8), and market performance (H9).
H10–H12: There are positive relationships between perceived strategic
benefits overall buyers’ satisfaction (H10), end-user brand or company
loyalty (H11), and market performance (H12).
H13–H15: There are negative relationships between perceived relationship
sacrifices and overall buyers’ satisfaction (H13), end-user brand or
company loyalty (H15), and market performance (H16).
H16–H17: There are positive relationships between overall buyers’
satisfaction and end-user or company loyalty (H16) and a positive
relationship between end-user loyalty and market performance (H17).
H18: There is a positive relationship between overall buyer satisfaction and
market performance (H18).
H19: There is a linear relationship between customer value and overall
buyer’s satisfaction and end-user loyalty (H19).
H20: There is a linear relationship among perceived product, personal,
strategic benefits and perceived sacrifices, overall buyer’s satisfaction,
and end-user loyalty (H20).
H21: There is a linear relationship customer value and overall buyer’s
satisfaction, end-user loyalty, and market performance (H21).
H22: There is a linear relationship among perceived product, personal,
strategic benefits and perceived sacrifices, overall buyer’s satisfaction,
end-user loyalty, and market performance (H22).
H23a: That is, the main model in Fig. 1 is a theoretically better fit than any
other alternate models and is, therefore, more parsimonious (H23).
3. Study method
The study was conducted in three phases, with data
drawn from a randomly selected panel of 1200 veterinar-
ians who participated in a monthly buyer panel and
responded by mail. Telephone reminders were used to
increase the response rate.
1. In Phase I, 22 respondents checked the wording
changes to the original instrument of Ulaga and Eggert
to adapt it to the present research context. This panel
consisted of five academicians, seven industry con-
sultants, four sales professionals, and six market
professionals.
2. Phase II of the study tested the new wording and new
items on a pilot sample of 100 that excluded the 623 used
for the full questionnaire. The purpose was to investigate
if the originally worded indicators in the customer value
scale were important to the purchasing decision-makers
in DII.
3. Phase III implemented a complete rollout to 623
qualified panelists (those who have been panelists for
at least 3 years) whose purchase histories and profiles are
known and have established relationships with the
various suppliers.
3.1. Sample selection
The 623 sample respondents were chosen from 427
clinics in a monthly panel of 1200 American Veterinary
Medical Association (AVMA) members. Potential clinics
were randomly chosen and invited to the panel, if they
refused; the clinic was replaced and was available for
another draw. To insure representativeness responders were
statistically compared with nonresponders and the AVMA
universal demographics universe.
3.2. Statement of research hypotheses
The hypotheses were directed at testing the study’s
theoretical framework outlined in Fig. 1. They are summa-
rized in Table 3.
3.3. Measurement of research variables
The five-point low (1) and high (5) response scales for
each construct were evaluated using Cronbach’s alpha and
exploratory and confirmatory factor analysis. After minor
modifications for double-loading and nonloading items,
measures were only included after they demonstrate accept-
able levels validity and reliability. Table 4 presents both the
ng Management 33 (2004) 675–687

Table 4
Cronbach’s alpha values of present and previous studies
Perceived independent,
mediator, and dependent
variables
Items Sample item Referenced/computed
Cronbach’s alpha
References
Product-related benefits 4 Please rate product quality. .82/.79 Ulaga & Eggert, 2001
Strategic-related benefits 4 Please rate product brand on
sharing their knowledge or
expertise with you.
.82/.93 Ulaga & Eggert, 2001
Personal benefits 4 Please rate product brand on
how pleasant the working
relationship is with you.
.84/.94 Ulaga & Eggert, 2001
Relationship sacrifices 3 Please rate the product brand
on how much time they cost you.
.90/.65 Ulaga & Eggert, 2001
Buyer’s customer loyalty 3 Product, brand, or company loyalty .57/.78 Butaney & Wortzel, 1988
Overall satisfaction 3 Please rate how satisfied you or
your clinic are with using the
product brand.
.87– .94/.82 Crosby & Stephens, 1987
J.M. Spiteri, P.A. Dion / Industrial Marketing Management 33 (2004) 675–687 681
referenced and computed Cronbach’s alpha values for the
scales.
The relationship benefits variable was computed using
factor weights from the product, strategic, and personal
benefits. The perceived customer value variable was com-
puted as a ratio of relationship benefits to relationship
sacrifices. Market performance was computed as the 3-year
average of the monthly doses dispensed.
Table 5
Summary of tests of hypotheses
Hypotheses Independent variable(s) Dependent va
H1 Customer value Overall satisf
H2 Customer value End-user loy
H3 Customer value Market perfo
H4 Product benefits Overall satisf
H5 Product benefits End-user loy
H6 Product benefits Market perfo
H7 Personal benefits Overall satisf
H8 Personal benefits End-user loy
H9 Personal benefits Market perfo
H10 Strategic benefits Overall satisf
H11 Strategic benefits End-user loy
H12 Strategic benefits Market perfo
H13 Relationship sacrifices Overall satisf
H14 Relationship sacrifices End-user loy
H15 Relationship sacrifices Market perfo
H16 Overall satisfaction End-user loy
H17 End-user loyalty Market perfo
H18 Overall satisfaction Market perfo
H19 Customer value and overall satisfaction End-user loy
H20 Perceived product, personal, strategic,
benefits, perceived sacrifices, and overall
satisfaction
End-user loy
H21 Customer value, overall satisfaction, and
end-user loyalty
Market perfo
H22 Perceived product, personal, strategic,
benefits, perceived sacrifices, overall
satisfaction, and end-user loyalty
Market perfo
H23a Main model
H23b Alternate model
4. Study findings
4.1. Sample characteristics
A total of 220 usable responses were received for a
35.5% response rate. The vets/clinic variable shows that the
sample is almost identical to the universe (2.12 vs. 2.13),
but there is a difference when compared with the non-
riable Pearson’s correlation Significance level ( P)
action .22 .004
alty .23 .000
rmance � .04 .690
action .62 .000
alty .50 .000
rmance .19 .016
action .42 .000
alty .37 .000
rmance � .056 .469
action .50 .000
alty .45 .000
rmance .01 .854
action .09 .242
alty � .04 .591
rmance .03 .723
alty .52 .000
rmance .22 .005
rmance � .04 .593
alty R2 = 29% F = 33.5, P= .000
alty R2 = 36.1% F = 18.2, P= .000
rmance R2 = 8.5% F = 5.05, P= .002
rmance R2 = 13.5% F = 4.16, P= .001
Model did not load on SEM.
GFI=.992 (a very good fit), v2 = 4.49 (6 df), P=.661
J.M. Spiteri, P.A. Dion / Industrial Marketing Management 33 (2004) 675–687682
responders. Larger clinics seemed to respond more, most
probably because they are better staffed and more likely
have office staff to help with the clinics purchase function;
they are thus better targets of the multi-informant method-
ology. All the other variables—practice types, geographic
spread, and dispensed/vet—all show good representation of
the sample with the universe and nonresponders.
4.2. Phase II findings on importance of scale indicators
The 100 multi-informant Phase II research tested the
importance of all the scales indicators to confirm that
these benefits and sacrifices applied to DII setting. The
results showed that they were all important and meaning-
ful, of course, to varying degrees, and that an open-ended
request for more or different benefits and sacrifices
provided no additional items. Weighting analysis showed
that the highest weights were given to product benefits
(34%), followed by relationship sacrifices or costs (27%),
strategic benefits (21%), and finally personal benefits
(18%). Ranking of the individual items ranged from
product reliability (item 1), the new/specific item product
safety (item 2), product quality (item 3), and all the way
to personal value (item 14) and personal recognition (item
15). It is noteworthy that the relationship building benefits
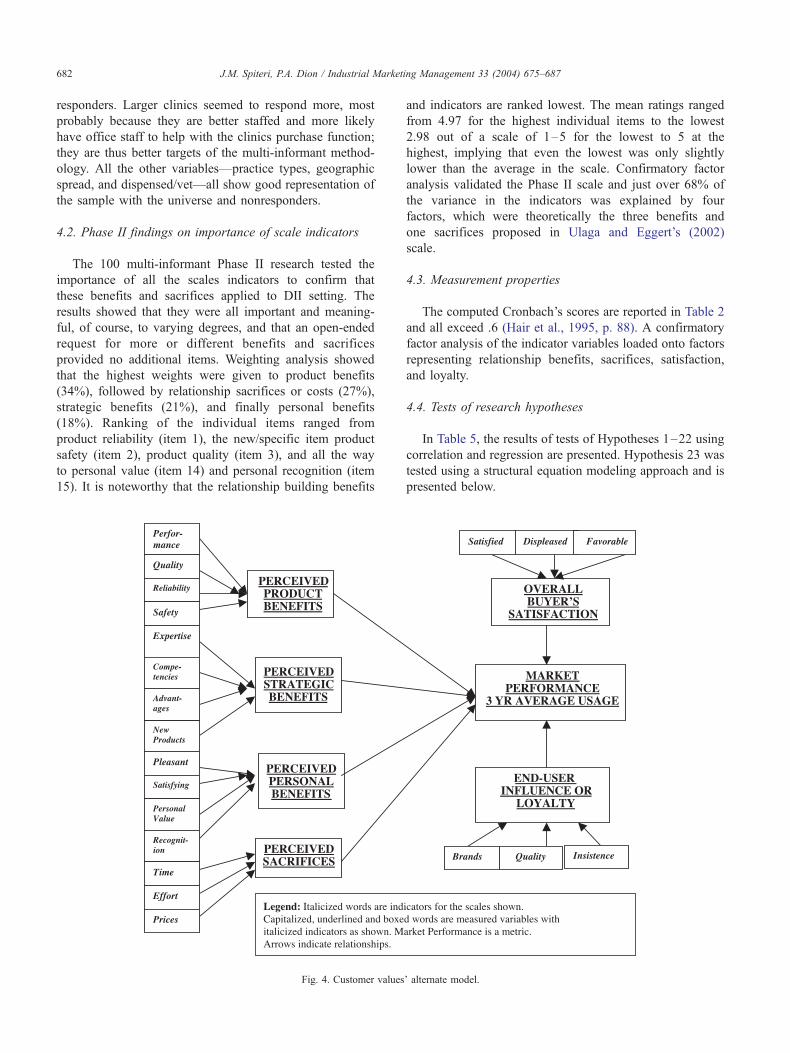
Fig. 4. Customer values
and indicators are ranked lowest. The mean ratings ranged
from 4.97 for the highest individual items to the lowest
2.98 out of a scale of 1–5 for the lowest to 5 at the
highest, implying that even the lowest was only slightly
lower than the average in the scale. Confirmatory factor
analysis validated the Phase II scale and just over 68% of
the variance in the indicators was explained by four
factors, which were theoretically the three benefits and
one sacrifices proposed in Ulaga and Eggert’s (2002)
scale.
4.3. Measurement properties
The computed Cronbach’s scores are reported in Table 2
and all exceed .6 (Hair et al., 1995, p. 88). A confirmatory
factor analysis of the indicator variables loaded onto factors
representing relationship benefits, sacrifices, satisfaction,
and loyalty.
4.4. Tests of research hypotheses
In Table 5, the results of tests of Hypotheses 1–22 using
correlation and regression are presented. Hypothesis 23 was
tested using a structural equation modeling approach and is
presented below.
’ alternate model.
J.M. Spiteri, P.A. Dion / Industrial Marketing Management 33 (2004) 675–687 683
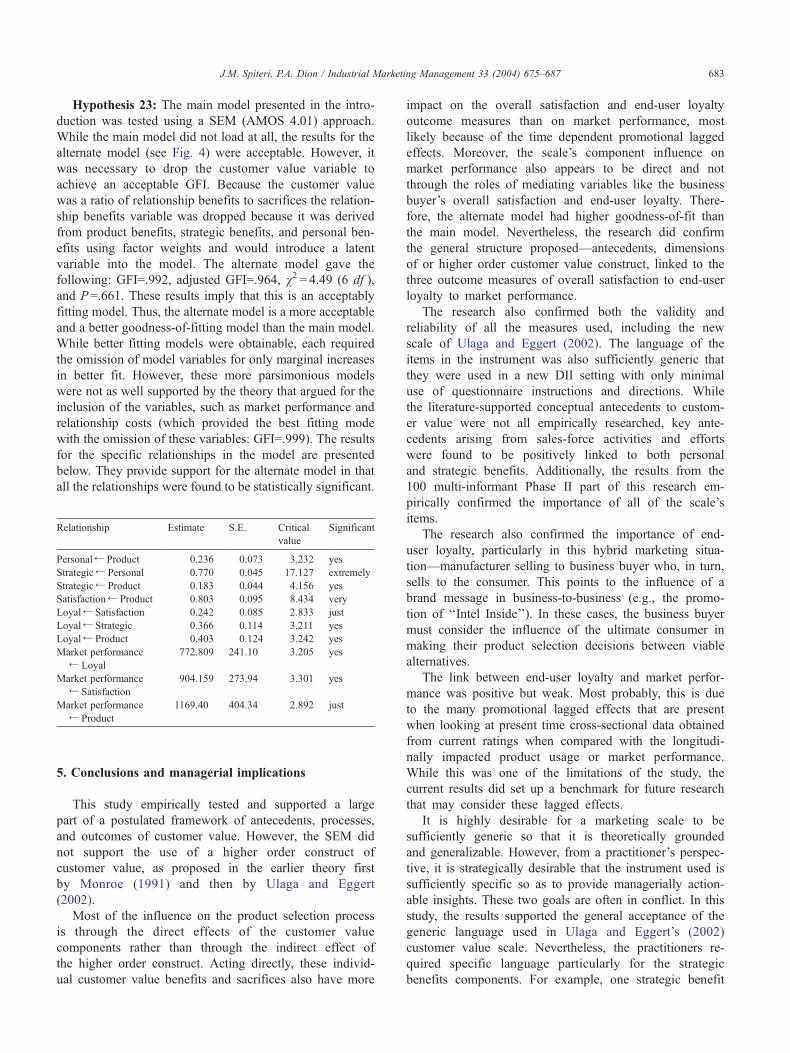
Hypothesis 23: The main model presented in the intro-
duction was tested using a SEM (AMOS 4.01) approach.
While the main model did not load at all, the results for the
alternate model (see Fig. 4) were acceptable. However, it
was necessary to drop the customer value variable to
achieve an acceptable GFI. Because the customer value
was a ratio of relationship benefits to sacrifices the relation-
ship benefits variable was dropped because it was derived
from product benefits, strategic benefits, and personal ben-
efits using factor weights and would introduce a latent
variable into the model. The alternate model gave the
following: GFI=.992, adjusted GFI=.964, v2 = 4.49 (6 df ),
and P=.661. These results imply that this is an acceptably
fitting model. Thus, the alternate model is a more acceptable
and a better goodness-of-fitting model than the main model.
While better fitting models were obtainable, each required
the omission of model variables for only marginal increases
in better fit. However, these more parsimonious models
were not as well supported by the theory that argued for the
inclusion of the variables, such as market performance and
relationship costs (which provided the best fitting mode
with the omission of these variables: GFI=.999). The results
for the specific relationships in the model are presented
below. They provide support for the alternate model in that
all the relationships were found to be statistically significant.
Relationship Estimate S.E. Critical
value
Significant
Personalp Product 0.236 0.073 3.232 yes
Strategicp Personal 0.770 0.045 17.127 extremely
Strategicp Product 0.183 0.044 4.156 yes
Satisfactionp Product 0.803 0.095 8.434 very
Loyalp Satisfaction 0.242 0.085 2.833 just
Loyalp Strategic 0.366 0.114 3.211 yes
Loyalp Product 0.403 0.124 3.242 yes
Market performance
pLoyal
772.809 241.10 3.205 yes
Market performance
p Satisfaction
� 904.159 273.94 � 3.301 yes
Market performance
p Product
1169.40 404.34 2.892 just
5. Conclusions and managerial implications
This study empirically tested and supported a large
part of a postulated framework of antecedents, processes,
and outcomes of customer value. However, the SEM did
not support the use of a higher order construct of
customer value, as proposed in the earlier theory first
by Monroe (1991) and then by Ulaga and Eggert
(2002).
Most of the influence on the product selection process
is through the direct effects of the customer value
components rather than through the indirect effect of
the higher order construct. Acting directly, these individ-
ual customer value benefits and sacrifices also have more
impact on the overall satisfaction and end-user loyalty
outcome measures than on market performance, most
likely because of the time dependent promotional lagged
effects. Moreover, the scale’s component influence on
market performance also appears to be direct and not
through the roles of mediating variables like the business
buyer’s overall satisfaction and end-user loyalty. There-
fore, the alternate model had higher goodness-of-fit than
the main model. Nevertheless, the research did confirm
the general structure proposed—antecedents, dimensions
of or higher order customer value construct, linked to the
three outcome measures of overall satisfaction to end-user
loyalty to market performance.
The research also confirmed both the validity and
reliability of all the measures used, including the new
scale of Ulaga and Eggert (2002). The language of the
items in the instrument was also sufficiently generic that
they were used in a new DII setting with only minimal
use of questionnaire instructions and directions. While
the literature-supported conceptual antecedents to custom-
er value were not all empirically researched, key ante-
cedents arising from sales-force activities and efforts
were found to be positively linked to both personal
and strategic benefits. Additionally, the results from the
100 multi-informant Phase II part of this research em-
pirically confirmed the importance of all of the scale’s
items.
The research also confirmed the importance of end-
user loyalty, particularly in this hybrid marketing situa-
tion—manufacturer selling to business buyer who, in turn,
sells to the consumer. This points to the influence of a
brand message in business-to-business (e.g., the promo-
tion of ‘‘Intel Inside’’). In these cases, the business buyer
must consider the influence of the ultimate consumer in
making their product selection decisions between viable
alternatives.
The link between end-user loyalty and market perfor-
mance was positive but weak. Most probably, this is due
to the many promotional lagged effects that are present
when looking at present time cross-sectional data obtained
from current ratings when compared with the longitudi-
nally impacted product usage or market performance.
While this was one of the limitations of the study, the
current results did set up a benchmark for future research
that may consider these lagged effects.
It is highly desirable for a marketing scale to be
sufficiently generic so that it is theoretically grounded
and generalizable. However, from a practitioner’s perspec-
tive, it is strategically desirable that the instrument used is
sufficiently specific so as to provide managerially action-
able insights. These two goals are often in conflict. In this
study, the results supported the general acceptance of the
generic language used in Ulaga and Eggert’s (2002)
customer value scale. Nevertheless, the practitioners re-
quired specific language particularly for the strategic
benefits components. For example, one strategic benefit

J.M. Spiteri, P.A. Dion / Industrial Marketing Management 33 (2004) 675–687684
indicator was ‘‘Please rate Supplier 1 and Supplier 2 on
helping you or your clinic to develop and maintain your
strategic advantages.’’ Many of the respondents proffered
suggestions on language that made it clear what ‘‘strategic
advantages’’ meant for medical practitioners. This re-
search balanced these two needs (theoretically generic
vs. practitioner specific) by providing ‘‘explanations’’ or
‘‘instructions’’ of what this general wording specifically
means to the responder. For example, to a clinic’s owner,
strategic advantages ‘‘include attracting, maintaining, and
educating pet owners about animal health products and
veterinary professional.’’
Since the original responders of the customer value
scale (Ulaga & Eggert, 2002) were French industrial
buyers, it could not be assumed, without further testing,
that the items or indicators were important and hence
meaningful to the DII setting. Accordingly, the 100 multi-
informant Phase II research tested the importance of all
the scales indicators to confirm that these benefits and
sacrifices applied to DII setting.
The studies proposed antecedents have implications for
managing toward customer-focused competitive advantages
by assisting organizations to match internal quality man-
agement capabilities with an external strategic focus. This is
accomplished by gathering customer value-oriented infor-
mation necessary to make decisions that improve the cus-
tomer value delivery process. This leads to organizational
learning to align the internal organizations with what the
customers value. Management can, therefore, improve the
customer value rating by increasing the effectiveness of the
appropriate research confirmed antecedents. While a gener-
alizable instrument serves the purpose of establishing the
importance of customer value research in a particular
setting, a specific instrument is then needed for strategic
alignment and implementation.
Support for the structure of the alternate research model
implies that increasing the overall customer value rating by
increasing specific components will improve all three-out-
come measures. Managerially, the insight is that suppliers
would do better by concentrating on measuring the effec-
tiveness of improving the individual components rather than
indexing them into the higher order construct, such as
customer value. A possible explanation for the ineffective-
ness of the higher order construct is this: When reaching a
decision on optimal value, buyers are assumed to mentally
calculate a ratio of customer benefits to customer sacrifices
(this is termed the index method). As this is rather a
sophisticated calculation, it may not be realistic in every
industrial buying setting. But since the research on the actual
mental model or decision-making mechanism is not yet
available, it is speculation at this point.
The roles of overall satisfaction and end-user loyalty
follow from the established theory and are necessary for
product selection or preference decisions. This study rein-
forced the notion that end-user loyalty is a better predictor
of market performance than either overall satisfaction or
customer value. It also found that overall satisfaction is a
better predictor of end-user loyalty than customer value.
However, in this research, there is an important difference
in the foci of these variables that was not investigated in
previous research. The customer of the buyer (the pet
owner, in this case) influences the perceptions of the buyer
on the end-user loyalty ratings. However, the buyer makes
the customer value and overall satisfaction ratings deci-
sions. The theoretical implication of this is that industrial
purchase decisions must consider the responses of the
customers of the product. There are many buying busi-
ness-buying decisions that have brand loyalty implications.
For example, the ‘‘Intel Inside’’ branding message cited
before. Clearly, generic components in computers or auto-
parts would not have applicable branding messages, but
many products in DII have been increasingly promoted as
DTC brand messages. The medical professional manager
now has to contend with a marketing manager directly
influencing the consumer. This implies that the consumer
has become more powerful in brand selection. Interestingly,
this sets up potential conflict as to what the buyer may
consider to be ‘‘value’’ (discounted price or deal) but on a
product that the consumer does not prefer. Therefore, the
measurements of customer value in business-to-business
must now consider what the consumer also ‘‘values.’’
Ulaga and Eggert’s (2002) scale does not provide for the
influence of the consumer. However, in this research the
combined scale includes the ‘‘pull power’’ of the end-user,
leading to interesting insights. This has changed the dy-
namics of marketing in DII industries, where the old theory
that stressed the importance of the sales-force efforts, is
now supplemented with the increased importance of end-
user request for products spurred on by DTC adverting
messages.
End-user loyalty was found to have a more direct link to
market performance, and would probably be a stronger link
if lagged effects are taken into account. Overall satisfaction
explains more of the variance of end-user loyalty than
customer value. So the question this raises is: ‘‘Do we
really need the customer value construct?’’ Iacobucci et al.
(1994) were the first to observe that all customer satisfaction
research needs is the inclusion of price. Certainly, the
implication of this study is that traditional customer satis-
faction could accomplish the same end as the components of
customer value. However, the focus on what the customer
values would need to guide what product attributes or uses
are included in the scale.
In the DII hybrid marketing situation, this research on
the importance of the individual components demonstrated
that the product benefits are more important than personal
or strategic benefits—the relationship-marketing dimen-
sion, which loaded onto one variable. When they are
combined, they aggregate to 39%, which is higher than
the product benefits. The implication is that the compet-
itive advantage has shifted to the strategic benefits, which
is where the impact for DTC is seen. This supports the
J.M. Spiteri, P.A. Dion / Industrial Marketing Management 33 (2004) 675–687 685
notion that ‘‘despite the growing focus on customer
service in business-to-business marketing, when it comes
to perception of customer perceived value, product quality
has a greater impact on customer’s perceived value than
service value.’’
6. Limitations and recommendation for future research
The limitations of the study were the following:
1. Many of the antecedents have not been empirically
tested or confirmed and there is no consensus yet on
their specification or conceptualization. This study has
offered one possible set and researched several of them
to provide a plausible basis for the indicators. Future
research should empirically investigate more.
2. Mediator variables, such as trust, commitment, and
satisfaction, have not been fully modeled or empiri-
cally tested and so are also fruitful areas for future
research.
3. Within the model structure, the new customer value
scale has only been shown to apply to DII. Hence,
hypotheses testing and inferences are limited to DII
and may not be generalizable to other marketing
settings. Future research could also be directed at
proving the model and scale also apply in other market
settings.
4. No attempt has been made to fully include the impact of
time as a variable, although a 3-year average of market
performance was used as a measure. The findings
indicate that the low variance explained for the market
performance outcome maybe due to the time-lagged
effects of promotions. Again, this is a fruitful area for
future research, where a longitudinal study can be
performed with the results of this study used as a
benchmark.
5. Limitations with the definitions of customer value also
concern the lack of treatment of the time dimension. As
changes in the perception of value come from successive
purchase and use of the product, time will impact
customers’ perception of value. Furthermore, time will
certainly influence the positive or negative development
of the relationship with the company and/or its
representatives. The time or circumstance dependent
information needed to deal with the above dynamic has
not been considered.
6. Finally, the last limitation is that by using panel cross-
sectional data, this may result in bias due to common
method variance and spurious cause–effect inferences.
These are known to inflate correlation measures,
resulting in overestimations of the influence of hypoth-
esized predictors. Recognizing that drawing cause–
effect inferences from cross-sectional data maybe
tenuous, a longitudinal study is recommended to confirm
any established hypothesized sequence of effects.
References
Anderson, E., & Sullivan, M. (1993, Spring). The antecedents and con-
sequences of customer satisfaction for firms. Marketing Science, 12,
125–143.
Anderson, E., & Weitz, B. A. (1989, Fall). Determinants of continuity in
conventional industrial dyad. Marketing Science, 8, 310–323.
Anderson, E., Jain, C., & Chintagunta, P. K. (1993). Customer value as-
sessment in business markets. Journal of Business-to-Business Market-
ing, 1(1), 3–29.
Anderson, E., Fornell, C., & Lehmann, D. R. (1994, July). Customer sat-
isfaction, market share, and profitability: Findings from Sweden. Jour-
nal of Marketing, 58, 53–66.
Band, W. A. (1991). Creating value for customers. New York: Wiley.
Bagozzi, R. P. (1974, October). Marketing as an organized behavioral
system of exchange. Journal of Marketing, 38(4), 77–81.
Bearden, W. O., & Teal, J. E. (1983, February). Selected determinants of
consumer satisfaction and complaint reports. Journal of Marketing Re-
search, 20, 21–28.
Berry, L. L. (1995). Relationship marketing. In L. L. Berry, L. Shostack,
& G. D. Upah (Eds.), Emerging Perspective on Services Marketing
( pp. 25–28). Chicago: American Marketing Association.
Boedecker, K. A., Morgan, F. W., & Stoltman, J. L. (1991, January). Legal
dimensions of salespersons’ statements: A review and managerial sug-
gestions. Journal of Marketing, 55, 70–80.
Boulding, W., Staelin, R., Kaira, A., & Zeithaml, V. (1993, February). A
dynamic process model of service quality: From expectations to behav-
ioral intentions. Journal of Marketing Research, 30, 7–27.
Burns, M. J. (1993). Value in exchange: The customer perspective. Knox-
ville: The University of Tennessee.
Butaney, G., & Wortzel, L. H. (1988, January). Distributor power versus
manufacturer power: The customer role. Journal of Marketing, 52,
52–63.
Butz Jr., H. E., & Goodstein, L. D. (1996, Winter). Measuring customer
value: Gaining the strategic advantage. Organizational Dynamics, 24,
63–77.
Buzzell, R. D., & Wiersema, F. (1981, January–March). Modeling changes
in market research: A cross-sectional analysis. Strategic Management
Journal, 2, 27–42.
Cannon, J. P., & Homburg, C. (2001, January). Buyer-supplier relationships
and customer firm costs. Journal of Marketing, 65, 29–43.
Capon, N., Farley, J. U., & Hoenig, S. (1990, October). Determinants of
financial performance: A meta-analysis. Management Science, 36,
1143–1159.
Carter, F. (1997). Effects of relationship marketing: The impact of
personal selling on repeat-buying. Doctoral study, Carnegie Mellon
University.
Christopher, M., Payne, A., & Ballantyne, D. (1991). Relationship market-
ing: Bringing quality, customer service and marketing together. Oxford:
Butterworth-Heinemann.
Churchill, G. A., & Surprenant, C. (1982, November). An investigation into
the determinants of customer satisfaction. Journal of Marketing Re-
search, 19, 491–504.
Clemons, D. S., & Woodruff, R. B. (1992). Broadening the view of con-
sumer (dis)satisfaction: A proposed means–end disconfirmation model
of CS/D. In C. T. Allen, T. J. Madden, T. A. Shimp, R. D. Howell, G.
M. Zinkhan, D. D. Heisley, R. J. Semenik, P. Dickson, V. Zeithaml, &
R. L. Jenk (Eds.), Marketing theory and applications ( pp. 209–216).
Chicago: American Marketing Association.
Cronin Jr., J. J., & Taylor, S. A. (1992, July). Measuring service quality: A
reexamination and extension. Journal of Marketing, 56, 55–68.
Crosby, L. A., & Stephens, N. (1987, November). Effects of relationship
marketing on satisfaction, retention, and prices in the life insurance
industry. Journal of Marketing, 24, 404–411.
Day, G. S. (1990). Market driven strategy: Processes for creating value.
New York: Free Press.

J.M. Spiteri, P.A. Dion / Industrial Marketing Management 33 (2004) 675–687686
Day, G. S. (1994a, October). The capabilities of market driven organiza-
tions. Journal of Marketing, 37–52.
Day, G. S. (1994b, Summer). Continuous learning about markets. Califor-
nia Management Review, 9–31.
Day, G. S., & Wensley, R. (1988, April). Assessing advantage: A frame-
work for diagnosing competitive superiority. Journal of Marketing, 52,
1–20.
De Wulf, K., Odekerken-Schroder, G., & Iacobucci, D. (2001, October).
Investments in consumer relationships: A cross-country and cross-
industry exploration. Journal of Marketing, 65, 33–50.
Dickson, P. R. (1992, January). Toward a general theory of competitive
rationality. Journal of Marketing, 56, 69–83.
Doney, P. M., & Cannon, J. P. (1997, April). An examination of the
nature of trust in buyer-seller relationships. Journal of Marketing,
61, 35–51.
Fornell, C. (1992, January). A national customer satisfaction barometer:
The Swedish experience. Journal of Marketing, 55, 1–21.
Gale, B. T. (1994). Managing customer value. New York: Free Press.
Ghemawat, P. (1986, September–October). Sustainable advantage. Har-
vard Business Review, 64, 53–58.
Goff, B. G., Boles, J. S., Bellenger, D. N., & Stojack, C. (1997). The
influence of salesperson selling behaviors on customer satisfaction with
products. Journal of Retailing, 73(2), 171–183.
Gronroos, C. (1990). Service management and marketing-managing the
moment of truth in service competition. Lexington, MA: Lexington
Books.
Gundlach, G. T., & Murphy, P. E. (1993, October). Ethical and legal foun-
dations of relational marketing exchange. Journal of Marketing, 57,
35–46.
Hair Jr., J., Anderson, R. E., Tatham, R. L., & Black, W. C. (1995). Mul-
tivariate data analysis (4th ed.). Englewood Cliffs, New Jersey: Prentice
Hall.
Hall, G., Rosenthal, J., & Wade, J. (1993, November). How to make reen-
gineering really work. Harvard Business Review, 71, 119–133.
Heskett, J. L., Sasser Jr., W. E., & Schlesinger, L. A. (1997). The service
profit chain. New York: The Free Press.
Howard, J. A., & Sheth, J. N. (1969). The theory of buyer behavior. New
York: Wiley.
Hunt, H. K. (1977). CS/D—overview and future research directions. In H.
K. Hunt (Ed.), Conceptualization and measurement of customer satis-
faction and dissatisfaction ( pp. 445–488). Cambridge, MA: Marketing
Science Institute.
Iacobucci, D., Grayson, K. A., & Ostrom, A. L. (1994). The calculus of
service quality and customer satisfaction: Theoretical and empirical
differentiation and integration. In T. A. Swartz, D. E. Bowen, & S. T.
Brown (Eds.), Advances in services marketing and management, vol. 3
(p. 1067). Greenwich, CT: JAI Press.
Jacobson, R. (1992). The ‘Austrian’ school of strategy. Academy of Ma-
nagement Review, 17(4), 782–807.
Johnson, M. D., & Fornell, C. (1991). Framework for comparing customer
satisfaction across individuals and product categories. Journal of Eco-
nomic Psychology, 12(2), 267–286.
Kohli, A. K., & Jaworski, B. J. (1990, April). Market orientation: The
construct, research propositions, and managerial implications. Journal
of Marketing, 54, 1–18.
Kortege, G. D., & Okonkwo, P. A. (1993). Perceived value approach to
pricing. Industrial Marketing Management, 22, 133–140.
Krishnamurthi, L., & Zoltners, A. (1994, Summer). Analysis of new
product diffusion using a four-segment trial – repeat model. Marketing
Science, 13(3), 224.
Lagace, R. R., Dahlstrom, R., & Gassenheimer, J. B. (1991, Fall). The
relevance of ethical salesperson behavior on relationship quality: The
pharmaceutical industry. Journal of Personal Selling & Sales Manage-
ment, XI(4), 39–47.
Lowenstein, M. W. (1997). The customer loyalty pyramid. Westport, Con-
necticut: Greenwood Publishing, Quorum Books.
McInnes, W. (1964). A conceptual approach to marketing. In R. Cox, W.
Alderson, & S. J. Shapiro (Eds.), Theory in marketing ( pp. 61–67).
Homewood, IL: Richard D. Irwin.
McKenna, R. (1991). Relationship marketing—successful strategies for the
age of the customer. Reading, MA: Addison-Wesley.
Monroe, K. B. (1990). Pricing: Making profitable decisions. New York:
McGraw-Hill.
Monroe, K. B. (1991). Pricing—making profitable decisions. New York:
McGraw-Hill.
Morgan, R. M., & Hunt, S. D. (1994, July). The commitment-trust
theory of relationship marketing. Journal of Marketing, 58, 20–38.
Naumann, E. (1995). Creating customer value. Cincinnati, OH: Thompson
Executive Press.
Oliver, R. L. (1980, November). A cognitive model of the antecedents and
consequences of satisfaction decisions. Journal of Marketing Research,
17, 460–469.
Oliver, R. L. (1993). A conceptual model of service quality and service
satisfaction. In T. A. Swartz, D. E. Bowen, & S. W. Brown (Eds.),
Advances in services marketing and management (pp. 65–86). Green-
wich, CT: JAI.
Oliver, R. L., & Swan, J. E. (1989, April). Consumer perceptions of inter-
personal equity and satisfaction in transactions: A field survey ap-
proach. Journal of Marketing, 53, 21–35.
Parasuraman, A., Zeithaml, V., & Berry, L. (1988). SERVQUAL: A mul-
tiple item scale for measuring consumers’ perceptions of service quality.
Journal of Retailing, 64(1), 13–40.
Porter, M. (1985). Competitive advantage-creating and sustaining superior
performance. New York, NY: Free Press.
Ravald, A., & Gonroos, C. (1996). The value concept and relationship
marketing. European Journal of Marketing, 30(4), 1–7.
Reichheld, F. F., & Sasser, W. E. (1990, September/October). Zero
defections: Quality comes to services. Harvard Business Review,
68, 105–111.
Rust, R., & Zahorik, A. (1993). Customer satisfaction, customer retention,
and market share. Journal of Retailing, 69, 145–156.
Scharitzer, D., & Kollarits, H. C. (2000). Satisfied customers: Profitable
customer relationships: Pharmaceutical marketing: How pharmaceutical
sales representatives can achieve economic success through relationship
management with settled physicians—an empirical study. Total Quality
Management, 11, 7.
Sheth, J. N., Newman, B. I., & Gross, B. L. (1991). Consumption values
and market choices: Theory and applications. Cincinnati, OH: South-
western Publishing.
Slater, S. F., & Narver, J. C. (1995, July). Market orientation and the
learning organization. Journal of Marketing, 59, 63–74.
Slater, S. F., & Narver, J. C. (2000). Intelligence generation and superior
customer value. Journal of Academy of Marketing Science, 28(1),
120–127.
Slywotzky, A. J. (1996). Value migration. Boston: Harvard Business School
Press.
Smith, M. C. (1991). Pharmaceutical marketing: Strategy and cases. Lon-
don: Academic Press (for Pharmaceutical Product Press).
Smith, J. B., & Barclay, D. W. (1997, January). The effects of organiza-
tional differences and trust on the effectiveness of selling partner rela-
tionships. Journal of Marketing, 61, 3–21.
Tax, S. S., Brown, S. W., & Chandrashekaran, M. (1998, April). Customer
evaluation of service complaint experiences: Implications for relation-
ship marketing. Journal of Marketing, 62, 60–76.
Treacy, M., & Wiersema, F. (1995). The discipline of market leaders. Read-
ing, MA: Addison-Wesley.
Ulaga, W., & Chacour, S. (2001). Measuring customer-perceived value in
business markets. Industrial Marketing Management, 30, 525–540.
Ulaga, W., & Eggert, A. (2002, March 20). Customer perceived value: A
substitute for satisfaction in business market. The Journal of Business
and Industrial Marketing, 17(2–3), 10(12).
Woodruff, R. B. (1997). Customer value: The next source of competitive
advantage. Journal of the Academy of Marketing Science, 25(2),
139–153.

J.M. Spiteri, P.A. Dion / Industrial Marketing Management 33 (2004) 675–687 687
Woodruff, R. B., & Gardial, F. S. (1996). Know your customer: New
approaches to customer value and satisfaction. Cambridge, MA:
Blackwell.
Woodruff, R. B., Schumann, D. W., Clemons, S. D., Burns, M. J., &
Gardial, S. F. (1990). The meaning of satisfaction and dissatisfaction:
A themes analysis from the consumer’s perspective.Working paper, The
University of Tennessee.
Zeithaml, V. A. (1988, July). Consumer perceptions of price, quality, and
value: A means–end model and synthesis of evidence. Journal of Mar-
keting, 52, 2.
Joseph Spiteri, the president of a company that does research on markets for
veterinary medical products, earned a DBA from the Wayne Huizenga
School of Business in Fort Lauderdale, FL.
Paul Dion, an associate professor of management at the Sigmund Weis
School of Business at Susquehanna University, researches business-to-
business marketing and purchasing performance, marketing logistics, and
research methodology and statistics.