customer segmentation and targeting by data science methods
TRANSCRIPT
Customer Segmentation and Targeting by Data
Science Methods
Inwook Moon
2020 Laurea
Laurea University of Applied Sciences
Customer Segmentation and Targeting by Data Science Methods
Inwook Moon
Business Management
Bachelor’s Thesis
July, 2020

Laurea University of Applied Sciences Abstract
Business Management
Bachelor’s Thesis
Inwook Moon
Customer Segmentation and Targeting by Data Science Methods
Year 2020 Number of pages 45
The objective of this thesis is performing a segmentation analysis as well as classifying target
segment members with a given survey data. With the performance of this customer survey
data analysis, the purpose of this research is to confirm the usefulness of data science meth-
ods in marketing and sales. By this study, it is expected to further understand data-driven ap-
proach in business. The development task was firstly grouping customers in different seg-
ments and secondly spotting the members of the target group, respectively with the use of
available data science methods.
The theoretical background used for the customer survey data analysis includes marketing
theories about segmentation and targeting. The author’s own experience in marketing and
B2B, B2C sales tasks were helpful as well. For the data science methods, different algorithms
have been studied since the time before starting this research. The research methods used in
this study are quantitative analytics methods of data science. For the task of segmentation
problem, unsupervised learning methods of clustering were utilized with tools such as K-
means algorithm. For the task of predicting target members, supervised learning algorithms
were used including an ensemble method and a neural network.
By performing of the analysis, research problems were solved. Firstly, the basic statistics and
distributions of the survey results were summarized and visually presented. Secondly, by the
use of relevant segmentation criteria, individuals were grouped into 5 distinctive segments
and the target segment was chosen according to the predefined standards. The observed
characteristics of the segment members were described. Then, the evaluation about the seg-
mentation effect was performed by the comparison of the profits between the ‘data science
use’ case and the opposite. Thirdly, the individuals that belong to a target group were identi-
fied from the survey data. The data was split into training and test data and the accuracy of
the latter was measured by metrics.
In conclusion, it was confirmed that data science methods are applicable on business prob-
lems in segmentation and targeting. By using data science methods, a company is more likely
to achieve the higher profits with the same budget given for the marketing and sales. This re-
search tried to demonstrate the findings by both the volume of impact on business and the
technical measurement. Based on this study, the author would like to recommend the small
and medium size companies to consider applying data science methods on their business prob-
lems.
Keywords: customer segmentation analysis, marketing, sales, data science, machine learning

Contents
1 Introduction ............................................................................................ 6
1.1 Background of Choosing the Thesis Topic ................................................ 6
1.2 Purpose of the Thesis ........................................................................ 7
1.3 Research Questions .......................................................................... 8
2 Research Methods, Limitations, Data and Tools .................................................. 8
2.1 Research Methods and Knowledge Base ................................................... 8
2.1.1 Quantitative Methods of Data Science ............................................. 8
2.1.2 Business Theories as a Knowledge Base ........................................... 9
2.2 Limitations of the Thesis Project .......................................................... 9
2.3 Risks of the Thesis Project .................................................................. 9
2.4 Dataset ...................................................................................... 10
2.5 Defining Problems to Solve ............................................................... 10
2.6 Reliability and Validity - Business and Technical Perspectives ...................... 11
2.7 Tools Used for Data Processing ........................................................... 12
3 Theoretical Background for Segmentation and Data Science ................................. 13
3.1 Customer Segmentation ................................................................... 13
3.1.1 What is Customer Segmentation?................................................. 13
3.1.2 The Benefits and Costs of Customer Segmentation ............................ 13
3.1.3 Customer Segmentation Methods ................................................ 14
3.1.4 Data Science Algorithms as a Customer Segmentation Method .............. 14
3.1.5 Process of Performing Customer Segmentation ................................ 14
3.2 Data Science ................................................................................ 17
3.2.1 Definition of Data Science ......................................................... 17
3.2.2 Confusion Matrix – Way to Assess the Classification Models .................. 18
3.2.3 Examples of Using Data Science Methods for Business Objectives .......... 18
4 Implementation of Segmentation Analysis with Data Science Methods ...................... 19
4.1 Specification of the Ideal Target Segment ............................................. 19
4.2 Exploring Data .............................................................................. 19
4.3 Performing Segmentation Using K-means Clustering .................................. 24
4.4 Description of Segments .................................................................. 25
4.5 Selecting and Profiling of a Target Segment ........................................... 27
4.6 Other Segmentation Methods ............................................................. 28
4.6.1 Hierarchical Clustering ............................................................ 28
4.6.2 Non-negative Matrix Factorization (NMF) ....................................... 28
4.6.3 Principle Component Analysis (PCA) ............................................. 29
4.7 Evaluation – Is This Segmentation Analysis Beneficial to the Business?............. 29

5 Implementation of Classification Algorithms -Predicting Targeted Individuals............. 31
5.1 Supervised Learning Algorithms as a Prediction Solution ............................. 32
5.2 K-nearest Neighbors Algorithm (KNN) ................................................... 32
5.3 Logistic Regression ......................................................................... 33
5.4 Decision Tree ............................................................................... 34
5.5 Voting Classifier ............................................................................ 35
5.6 Neural Network ............................................................................. 36
5.7 Choice of the Prediction Model .......................................................... 38
6 Conclusion ............................................................................................ 39
References ................................................................................................. 40
Figures ..................................................................................................... 44
Tables ...................................................................................................... 44
Appendix: Customer Survey Dataset ................................................................... 45

6
1 Introduction
Business environments in various industries have been rapidly changing to be much more reli-
ant on gathering and analyzing data. In many organizations, decisions were made based on
the revealed results from the analysis. This tendency brought a new term ‘data-driven’ in a
glossary (Cambridge Dictionary 2020).
This thesis project was initiated as a study to actively reflect and follow this megatrend of
data-driven decision making in business. The case dataset was also selected to perform a data
analysis for a business research.
According to Kotler and Armstrong (2014, 294), success of a new product in a market involves
in ‘moving great ideas on products’ and ‘finding customers’. The latter is the very point that
this thesis focuses on through the means of segmentation and targeting. A company can pre-
sent more customized products or services if it finds a target group. And this can also help the
company assign marketing resources more efficiently, earning more profits as well as higher
customer satisfaction level.
The survey dataset used in this thesis contains customers’ answers to questions on social, en-
vironmental, and ethical responsibilities. This can be a good source to use for sorting out po-
tential customers for a company that cares much of its corporate responsibility.
Through this thesis, it is premised that there are some assumptions while developing discus-
sions. This was inevitable because the problems to solve were generated to be applicable on
real situation by the author. Having those assumptions make this research focused on specific
problems.
The situation this thesis suggests the readers to keep in mind is as follows. There is one com-
pany, for example a Finnish startup with eco-friendly cosmetics and fashion items. Then the
company considers entering a new market South Korea, and a customer survey data is utilized
to propose solutions for their marketing and sales decision. This research concentrates on seg-
mentation and targeting with the use of data science methods such as diverse machine learn-
ing algorithms.
1.1 Background of Choosing the Thesis Topic
Not only in other fields but also in business, ‘data’, ‘AI’ and ‘analytics’ have been mentioned
numerous times over recent years. As a business student, the author has been influenced by

7
this new trend. While applying for job positions such as accounting and sales, the ‘data man-
agement’ skills were asked through job announcements as well as job interviews.
While doing internship at a finance team in E-commerce startup, the author felt an im-
portance of data management again. In the workplace, there were lots of parts that can be
aided by data science. For example, there were frequent fraudulent attempts in cashback
service system in the financial management work. Then, the detection of fraud seemed to be
improved by the help of machine learning algorithms in data science methods.
During another internship in a marketing research task, the author experienced it was very
tough to convince an intuitive opinion without being supported by the quantitative evidence.
And this brought an idea likewise, ‘it will be much easier if I can use data-based approach in
conversation’.
As a civilian as well as a potential customer of various organizations, the author wonders ‘how
Youtube lists new clips’, ‘how Netflix recommends new movies’, ‘how Facebook shows ban-
ners in accordance with the tastes of their users’. With this recognition of ‘data and technol-
ogy’ utility both in life and business, the author has been studying data science.
There are still lots of things to improve in study and experience. There are skills to keep up-
dated with both for business and data management. Nevertheless, ‘conducting a thesis re-
search on the topic in the area where business and data overlaps’ is expected to be helpful to
further understand application of data science in business. Also, it is considered that this the-
sis work is a very good opportunity to share findings with others.
1.2 Purpose of the Thesis
In business, it is crucial to know the right target. A company cannot serve customers properly
if it does not know who they are (Brenner 2020). For this business problem of discovering the
fitting customers, the author thinks the utilization of relevant data could be a solution be-
cause the recent rapid development in data management technology supports it greatly.
This thesis has a purpose of spotting the best customers for a business, both in group level
and individual level. This will be done by performing segmentation and classification with
data science methods. The benefits from it will be confirmed.
The dataset selected for the research consists of a customer survey result from 4000 people.
Customer survey analysis can demonstrate how solutions can be generated to business ques-
tions as well as to customers’ needs.

8
1.3 Research Questions
The analysis in this thesis was conducted by various experiments on the survey data, and it
was presented by data science methods such as machine learning algorithms. The research
questions to solve are as follows:
First, through a business data analysis, what kind of basic statistic findings are observed?
Second, is it possible to sort consumers into different segment groups with data science meth-
ods? How and by which criteria? Then, is it possible to evaluate the results, for example, by
compare the profits between the case of ‘data science use’ and the opposite case?
Third, once segmentation task is done, is this work available to classify targeted individual
customers so that sales activities are benefited? Is the classification algorithm applicable also
to future customers from unseen data, not limited to the current customer data? Which data
science methods works better than others in case of this survey data in the research? Is the
accuracy measurable with appropriate metrics?
2 Research Methods, Limitations, Data and Tools
This chapter introduces what kind of research methods and knowledge bases are used for the
analysis. Then the limitations and risks of the research are informed, dataset is introduced,
and the problems to solve are defined in accordance with the research questions in the previ-
ous chapter. Theoretical consideration about how to make this research reliable and valid is
also discussed. Lastly, the technical tools used for analysis were explained.
2.1 Research Methods and Knowledge Base
2.1.1 Quantitative Methods of Data Science
In a quantitative research, a large size of data is obtainable these days. It is supported by the
recent improvements in data storing and processing technologies (Hague et al. 2013, 226).
This research tried to utilize this benefit living in a digitalization era. Customer survey result
was analyzed by the application of quantitative methods in data science.
The first research task of segmentation problem is for an analysis of ‘describing’ a current
customer data. For this segmentation problem, unsupervised learning method of cluster anal-
ysis with tools such as k-means algorithm was used. The second research task is for ‘predict-
ing’ who are the new best customers in the future. For this ‘prediction of target’ problem,

9
supervised Learning algorithms were experimented. Artificial neural network was applied as
well.
2.1.2 Business Theories as a Knowledge Base
Applicability of data science methods is dependent upon not only what data is given but also
what is the task to do with it. Therefore, algorithms and data will be properly applied only
when they are accompanied by the background knowledges on the business tasks. Mukherjee
(2019) also wrote in his article that data analysis can be related to the problem goal when it
is supported by the domain knowledge.
Having segmentation and targeting tasks for this research, study on related marketing theo-
ries would be helpful to grasp the context while building analysis models. The theoretical
parts (chapter 3) will be covered in before discussing the case study (chapter 4 and chapter
5).
2.2 Limitations of the Thesis Project
This thesis presumes that an eco-friendly enterprise wants to launch their products to Korean
customers and the author is asked to help it. The company wants to be offered solutions for
its marketing and sales, based on the given data. This assumption was unavoidable and
needed in order to define the problems to solve more specifically. At the same time, it helps
this research to narrow down to the subset of the most relevant data among broad sources of
information in the whole data.
The author believes that companies can have similar business problems as covered in this re-
search, even in the real world. However, later it would be desirable and interesting to con-
duct a research with a real client company and the author hopes to do so.
2.3 Risks of the Thesis Project
In data management tasks in business, ethical questions are often related with legal issues
such as GDPR. For this research, a license issue of datasets also was a challenging obstacle
during the trials to acquire them. It was very hard to find a proper dataset due to these two
issues. The data chosen for this research is anonymous and it is offered with the permission
for research and study (KOBACO 2019). Therefore, this thesis and dataset is beyond those le-
gal and ethical conflicts.

10
Another risk factor is that small adjustment can cause different outcomes in data analysis be-
cause it is involved in engineering and parameter tuning. This is expressed by Riskspan (2020),
“Choosing an appropriate set of hyperparameters is crucial for model accuracy, but can be
computationally challenging”. In this research, the main focus is not the technical part itself
but the usability of it in business. Still, efforts were taken to keep the most optimizing pa-
rameters in each analysis stage.
2.4 Dataset
The dataset used for the analysis, which can be found at the appendix, is a ‘2019 annual cus-
tomer survey’ result conducted by a Korean government-funded public corporation (KOBACO
2019). This dataset includes various questions and answers related to customer behaviors and
opinions. The number of participants is 4000 Korean individuals.
While the whole dataset contains broad provisions of customer life issues, this thesis research
only focuses on a subset part of the dataset, which is ‘questions and answers about custom-
ers’ preference’. It consists of opinions regarding environment-friendly purchasing, consuming
and corporate social responsibility. As attached at the appendix of this thesis, all the ques-
tions were answered by the form of numerical evaluation indexes. The dataset was originally
in the form of CSV file. Through a preprocessing stage before the main analysis, it was trans-
formed to proper data type using Python.
2.5 Defining Problems to Solve
Given this dataset (Appendix), there are plenty of useful information that can be obtained.
For example, if one company sells organic products or does efforts to reduce environmental
impact in its business, and if it considers entering Korean market, this dataset can be helpful
to find out how the Korean customers think and behave.
More specific possible business problems with this dataset are defined as two of these. The
first one is ‘to separate customers into different segments’. Since the given data reflects the
quantitative self-evaluation from individuals, the segmentation is likely to be extracted by
the evident numbers of indexes.
The second problem is ‘how to find out which group each individual belongs to’. After having
information about which segments exist in the market, it is desirable that a company can de-
tect and forecast if the customers belong to the best target segment.

11
The main tasks to do are as follows:
1. Conducting an exploratory data analysis to see the statistic findings and distribu-tion. (Chapter 4.2)
2. Performing possible algorithms for segmentation using proper criteria. And evaluating the results by measuring the business impact. For example, by com-paring the profits between the case of ‘data science use’ and the opposite. (Chapter 4.3-4.7)
3. Performing possible algorithms for prediction of ‘targeted individuals’ so that future customers from unseen data can be classified. And comparing the outcomes between algorithms, assessing accuracies, then choos-ing the best performing one. (Chapter 5)
Table 1: Tasks to do in order to solve defined problems
2.6 Reliability and Validity - Business and Technical Perspectives
Reliability refers to ‘replication and consistency’ (Saunders et al. 2015, 202). If a research
can reproduce consistent findings later with the same research design, that research would
be seen as reliable. Then, validity means properness of the measuring, both in aspects of ac-
curacy of the analysis and generalizability about the conclusion (Saunders et al. 2015, 203). In
this research, in order to make sure the results of ‘technical part’ of analysis are reliable and
valid, two ways were implemented. First, while doing classification analysis (chapter 5), the
data was split as train data/ test data. Like this, by checking the model performance on not
only trained data but test data, the analysis can be assured to generate consistent results.
And secondly, for the accuracy calculation on the test data in classification model, a metric
called ‘confusion matrix’ was used. This is one of the most common way to measure how the
analysis is accurate and very easy to interpret. The confusion matrix will be introduced first
in theoretically in the chapter 3.2.2, then it will be applied in the chapter 5.
As another very important point for the reliability and validity confirmation, the ‘impact on
business’ from the chosen data science methods was measured. Specifically, the profits were
assessed mathematically and also compared for different cases. According to a recent re-
search on market segmentation analysis, the success of the segmentation might be able to be
evaluated by if segmenting accomplishes the anticipated benefits (Dolnicar et al. 2018, 255).
Therefore, profits comparison between the segmented case and the opposite can act as an
alternate for evaluating the model validity. It also suggests the segmentation’s functionality
on cost-effective marketing and sales.
If a researcher is lack of understanding about the research topic, and if it causes a misinter-
pretation of results, or if a researcher tries to change the outcome to make it matched to the
expectation, the research becomes unreliable (Saunders et al. 2015, 203). The author tried to
reduce the possibility that these kind of problems would occur. For example, dealing with

12
missing data in demographics, no arbitrary action was taken but the proper values such as av-
erage were inserted.
The book ‘Research Methods for Business Students’ (Saunders et al. 2015) states that reliabil-
ity and validity are very important to judge if the research is of high quality And it points out
there are more threats that can lead a research to be less reliable or invalid. For example,
participants may not answer properly because the survey questions are ambiguous. The par-
ticipants also might not represent the whole population well for a certain reason. (Saunders
et al. 2015, 202.)
For the author of this thesis, doubting thing was ‘if the participants just marked any score be-
ing bored of answering to several survey questions’. Maybe this is a common problem to the
long list of questions in general. For the issue of the participant bias, probably the fact that
survey was conducted by a government-funded public corporation (KOBACO) ensures that
there is a smaller possibility of the problem in participants’ composition.
There is a possibility that participants are reluctant to express their opinion honestly when
the questions are about ethical things. Or, during the time gap between the survey date and
analysis date, they might change their opinions due to some events. Researcher may have
misconnected the cause and effect. All of these sort of cases can cause the research to be
less valid. (Saunders et al. 2015, 204.)
Since the questions used in this analysis is related to ethics of companies and consumers, the
author thinks it is possible there are some amount of dishonest answers in the survey data alt-
hough it is not detectable. And between survey date (December 2019) and analysis data (June
2020), some customers could have changed their mind, especially because of the world-wide
pandemic situation. Therefore, the author thinks the result can reflect the learning effect
from this global situation if the same survey is conducted again.
2.7 Tools Used for Data Processing
In this thesis, different kinds of machine learning models were applied in practice in order to
implement the related business theories. Statistics and data preparation techniques were em-
ployed as well. The two data processing web environments used in analysis are Google Cola-
boratory and Jupyter Notebook. There, Python machine learning libraries were utilized, for
example Scikit-learn, Keras, Pandas, Numpy, Matplotlib and Seaborn.

13
3 Theoretical Background for Segmentation and Data Science
This thesis discusses segmentation problems regarding marketing and sales. Therefore, here
in this chapter, the theories on these business topics is discussed. And since this research sug-
gests solutions for the business through data science methods, theories on this part are also
explained as well.
3.1 Customer Segmentation
3.1.1 What is Customer Segmentation?
Customer segmentation is ‘to divide customers into groups’ with the objective to utilize the
results for marketing purposes. Here, using for marketing purpose means for instance, utiliz-
ing to make better ‘marketing strategies’ to offer a specific group with more customized
products or services. (Blanchard et al. 2019, 93.)
Customer segmentation helps companies to reflect on what they are particularly good or bad
at, compared to competitors. And it can be useful to gain insights into what consumers want.
In other words, segmentation gives an opportunity to rethink and equips critical new perspec-
tives about customers. And by picking one segment among many, and presenting a particular
product for this segment, a company is more likely to gain higher return. (Dolnicar et al.
2018, 6-7.) Also, it could build both a durable customer relationship and a robust market posi-
tion if that return is a result of higher satisfaction level.
3.1.2 The Benefits and Costs of Customer Segmentation
In general, by targeting the most suitable group, a company can accomplish higher return on
investment in a marketing activity. Then, accurately segmenting is beneficial to business. Be-
cause, by that, not only products and services but also advertisements can be designed to fo-
cus on more specific ‘targeted’ subset of people. In other words, well-conducted segmenta-
tion means that it is possible that a company can allocate marketing resources more effi-
ciently, reducing the budget to be used for ‘less matching’ customers. (Blanchard et al. 2019,
94.)
Then the work of market segmenting itself requires costs. Many employees may be involved in
investing a big amount of time for the market segmentation analysis. Other resources and
budget might be asked to promote customized marketing strategy after segmenting job has
been conducted. Then, ongoing dedication of costs needs to be covered by the benefits such
as a higher return on investment. (Dolnicar et al. 2018, 7.)

14
3.1.3 Customer Segmentation Methods
Regarding how to divide a group of people into different segments, in general there are di-
verse approaches. Common examples of customer segmentation methods may be using geo-
graphic backgrounds, socio-demographic criteria, or other factors such as psychographic, be-
havioral characteristics (Dolnicar et al. 2018, 13).
Specific examples of behavioral aspects are indicators that show ‘how frequently purchases
are made’, ‘how large amount is bought’ or ‘when is the most recent shopping is made’ and
so on.
One typical traditional segmentation method is that a manager in charge makes decision for
the criteria, sometimes by a domain expert’ intuition or experience. Although this way is sim-
ple and easy, the result can be rough and made by only arbitrary thresholds. Decisions based
on intuition can cause underestimating a certain variable or overlooking it especially because
the task of ‘choosing the right criteria’ becomes complex with more variables. (Blanchard et
al. 2019, 95.)
But for segmentation, more technological approaches are available. For instance, one way is
to use quantitative data of multiple variables that represents the nature of consumer charac-
teristics or the nature of the segmentation (Dolnicar et al. 2018, 13).
3.1.4 Data Science Algorithms as a Customer Segmentation Method
One technological new way to perform customer segmentation is using data science ‘cluster-
ing’ algorithms, which is one of unsupervised learning methods. This method can solve seg-
mentation problem by ‘finding unexpected or unknown features’. The method is available
also for a big size of data sources and it is fast to perform. However, there is a drawback of
data science clustering algorithm. Groups formed might be hard to interpret, and even not be
clear how to implement the clustering algorithm, for example with which criteria. (Blanchard
et al. 2019, 94-96.)
When conducting data-driven market segmentation, it is often assumed that market segments
exist in the data and it is revealed and described (Dolnicar et al. 2018, 16). In this research,
the analysis with the case data will also discover ‘already existing but hidden’ segments.
3.1.5 Process of Performing Customer Segmentation
10 steps of segmenting is demonstrated in the book Market Segmentation Analysis (Dolnicar et
al. 2018). Once it is decided to conduct segmentation (step 1), the ideal target segment must
be specified (step 2), and the data should be collected (step 3). Then the data is explored
(step 4), and segmentation is performed by the chosen method. (step 5) Profiling of segments

15
and describing them are followed steps (step 6 and 7), and the target segment is selected
(step 8). Customizing the marketing mix (step 9) and evaluation and monitoring are the last
stage (step 10). (Dolnicar et al. 2018, 21.)
About step 1, the answer to ‘why a company decide to do segmentation’ is clear. It is because
a company think the act of segmentation is beneficial for the business. This was already dis-
cussed previously in the chapter 3.1.1 and 3.1.2.
Related to ‘target segment specification (step 2)’, the things to be done at this stage is to
make a choice about what is the ultimate standard of the segments. With the same customer
data, focuses can differ. For example, segments by locations, segments by quantities of pur-
chases, or segments by the preferred product lines, all these can be set as the criteria for a
segmentation.
Regarding the collection of data (step 3), the sources used to get customer information can
vary, for example social media, web logs, customer databases. Data from survey studies are
one of the possible sources as referred in the study (Dolnicar et al. 2018, 18) and thus this re-
search made use of it.
The purpose of exploratory data (step 4) is ‘performing a precheck’ to see how the data is re-
ally like. A big picture can be observed by this initial analysis. Also, quick summaries are of-
ten made with a raw data. The check list can include for instance, if there are missing values,
what distributions of each column look like, what the key sources of information and how the
analysis has to be progressed. (Blanchard et al. 2019, 51.)
And the most important thing to do is to select the variables which is suitable for the segmen-
tation criteria chosen at the step 2. They could be regions, age, gender, family size, income,
occupation, education, religion, nationality, lifestyle, attitudes, user status, readiness to buy,
even decision-making role such as either a direct purchaser or an influencer and so on. (Lu-
men Learning 2020.) Likewise, by identifying the relevant attributes, exploration of data
helps analysis be kept from inaccurate modeling.
For the step 5 of ‘extracting segments’, there are some basic principles by studies. The first
principle is that each segment has to be homogeneous, meaning that individuals in a same
group need to be similar to each other. And secondly, the segment must be distinct. It implies
the members of one segment have to be dissimilar to the members of different segments.
(Dolnicar et al. 2018, 34.)
For the profiling of segments and describing (step 6 and 7), the extracted key features have
to be summarized and explained (Dolnicar et al. 2018, 21). Then the eighth step is to choose
the target segment and it has some requirements according to the research on the market

16
segment analysis. First, the target segment must have enough consumers. This is clear be-
cause ‘targeting only few customers’ will make both the segmentation work itself and follow-
ing marketing actions not worthwhile to spend budget for. The second thing to consider is
that the target segment has to match the strong point of the business. The company needs to
be capable of satisfying target groups’ needs. Thirdly, the individuals of the target segment
have to be possible to spotted and to be reached in the market. This is also connected to the
sales activities of contacting customers. (Dolnicar et al. 2018, 237-243.)
In this research, most of these steps will be done one by one although marketing mix (step 9)
and monitoring part of step 10 will be not dealt with because it is not the direct focus of this
analysis.
Related to the last step ‘evaluation’ of the segmentation analysis, the holistic thinking on the
benefit from segmentation can be useful to assess the impact on the business. Although seg-
mentation itself is one of the topics in marketing, there can be a consideration on the other
parts of business such as sales or on the whole business. Herrick (2020) writes on his blog arti-
cle, segmentation can help sales activities since it can contribute to generating qualified
leads and eventually bring more opportunities for business. And Mathur (2008, 154) also em-
phasizes needs of correlation between ‘identifying a target segment’ in marketing and a stra-
tegic sales plan.
Therefore, in order to evaluate the segmentation’s benefit for the company, the profits com-
parison may be a useful metric. If the profits from segmentation use case outnumber the
profits from the no-segmentation case, the analysis could be considered as beneficial for mar-
keting, sales as well as a whole company.
Various examples of measurements for customer segmentation are for instance, cost of mar-
keting, number of orders by market segment, number of sales, total sales, cost for winning
new customers, sales or market penetration of new product or service, number of new cus-
tomers over the past year, customer loyalty, customer feedback, number of customer con-
tacts, customer lifetime value, customer retention rates, spending rates, visits per week and
so on. (Measure and Evaluate Customer Market Segmentation Processes 2020.)
Among the examples up here, total sales, cost of marketing and cost of sales were used all
together as components to calculate ‘profits’ in this research.

17
3.2 Data Science
3.2.1 Definition of Data Science
Before applying data science methods on survey data to solve segmentation problem, here is
a brief introduction to what is data science. Data science is a multi-disciplinary field which
combines statistics, machine learning, artificial intelligence and database technology (Sayad
2020). Since it is a comprehensive field, a variety of the collective processes, theories, con-
cepts, tools and technologies are used (Techopedia 2018).
The diagram below (figure 1) shows how interdisciplinary the data science is. This field is still
evolving and expanding.
Figure 1: Data Science as an interdisciplinary field of study (Etman 2018)
And machine learning, a concept shown in the diagram, refers to an artificial intelligence tool
which processes data that people cannot easily analyze due to the size or complexity. It is a
set of computer algorithms that train through given data and learn automatically themselves.
It is different from previous ways of computation methods such as inserting commands for
each task. (Banton 2019.)
This research is performed through utilization of proper machine learning algorithms, which
include both supervised learning and unsupervised learning. ‘Supervised learning’ means that
machine learning algorithms in which labeled data is provided in order to predict the pattern
by it. Again, among supervised learning tasks, there are ‘classification’ problems and ‘regres-
sion’ problems. A simple example of applying supervised learning algorithm is detecting spam
mail with a given label. (Sunil 2017.)
On the other hand, ‘unsupervised learning’ is an area where there is no label in data and the
training process still aims to find some patterns with similarity in data. Grouping articles by
topics are an example of unsupervised learning. There are also other kinds of machine learn-
ing, for example, reinforcement learning although it is not covered in the topic of this re-
search. (Heidenreich 2018.)

18
3.2.2 Confusion Matrix – Way to Assess the Classification Models
In data science, there are different metrics to examine model performances. Here in this re-
search, ‘confusion matrix’ is used to measure how accurately the supervised learning models
classify targeted segment members. This is an easy matrix to understand and broadly used for
the communication about business data analysis. Confusion matrix is a square matrix which
counts the number of true positive, true negative, false positive and false negative
(Blanchard et al. 2019, 297). The figure 2 below shows the standard look of the matrix.
3.2.3 Examples of Using Data Science Methods for Business Objectives
Many organizations accumulate big volumes of data over years. Data science enables them to
mine useful information from raw data and eventually support them to reach better deci-
sions.
There is a plethora of cases where data science has been utilized in business. Research by Pi-
atetsky (2016) shows that almost all business functions such as human resource management,
supply chain, finance and marketing are utilizing data science for advanced analysis works.
Diverse industries are using data science. Those industries include banking, advertising, medi-
cal, health care, insurance, energy, manufacturing, retail, fundraising, e-commerce, educa-
tion, travel, entertainment, agriculture, game and self-driving cars. (Piatetsky 2016.)
Additionally, things such as navigation, digital maps, language translations are processed
through the application of data analysis. In the current pandemic situation with corona virus
in 2020, Korean medical companies developed the testing kits through data science methods
(Lee 2020). These methods are different from traditional ways in the medical equipment in-
dustry.
More purely business-focused examples are found in pricing, demand forecasting, investment
analysis, customer satisfaction assessment, employee happiness measuring and churn
Figure 2: Confusion Matrix (Blanchard et al. 2019, 297)

19
prediction. In credit scoring, stock price prediction, sentimental analysis through social net-
works or web contents, it is not hard to find the use cases of data science application.
Currently (in April 2020), there are 152 Finnish startups which provide clients with analytics
services via AI and data science methods (Tracxn 2020).
4 Implementation of Segmentation Analysis with Data Science Methods
The case study here mostly follows the customer segmentation steps demonstrated in chapter
3.1.5 except for a few differences. The order of analysis in this chapter is firstly ‘specifying
ideal target segment’, secondly ‘exploring data’, thirdly ‘performing segmentation’, fourthly
‘describing segments’, and fifthly ‘profiling the selected target segment’ and then lastly
‘evaluation’. For the third part of performing segmentation, mainly K-means clustering
method will be illustrated because it is the most proper method for the given segmentation
problem. Other methods will be shortly explained. For the last part of evaluation, sales-re-
lated impact from segmentation will be discussed together.
4.1 Specification of the Ideal Target Segment
In this customer segmentation problem, it is aimed to find the target group which takes
25~30% of the whole data. Considering the data contains records of 4000 individuals, the ideal
target segment is therefore 1000~1200 people. Next, for the purposes of this study, the tar-
geted customers are defined as ‘the customers who most strongly expressed their opinions to
be in favor of eco-friendly issues in purchasing’. Also, they should be people who are consid-
erate during a buying process, for example, checking the ingredients, comparing brands and
items. In short, the target segment is a group of people who carefully choose products from
the perspectives of both environmental issues and purchasing patterns.
4.2 Exploring Data
Here in this chapter, the focus is checking what contents the dataset includes. Then, accord-
ing to the book Data Science for Marketing Analytics (Blanchard, et al. 2019), exploratory
data analysis is an initial stage, but the exploration is helpful to identify attributes relevant in
the further stages of analysis (Blanchard, et al. 2019, 51). It improves analysis to be more ac-
curate.

20
By the use of Python functions in Pandas library, it is possible to see how the data is like.
These figures and tables below in this chapter are the output of running each of them.
Figure 3: No missing values for each variable (except the Income column)
There are total 20 columns, first 11 columns for demographic information and then 9 columns
for customers’ answers to purchasing behavior. All the questions were answered by the 4000
survey participants except for the question regarding their total income. Income amount was
answered by only 2417 people.
Abbreviations used at the figure 3 stand for each feature as shown at the table 2 and table 3.
Org: organic product Scr: socially good company
Com: comparison for purchase Eth: ethics in business
Env: environmental protection Eco: eco-friendly brand
Res: responsibility as a customer Hab: habit change for environment
Pay: payable for environmental preservation
Table 3: Customer opinion features
Gen: gender Age: age
Loc: residence location Job: Job type
Fam: family income amount Inc: Personal income amount
Exp: monthly expenditure Edu: education level
Reg: regularity of income Mar: marriage
Kid: children
Table 2: Demographic features

21
The demographics of the first five participants are introduced as an example in figure 4.
Figure 4: First 5 rows of demographics
The column at the most left side is a customer number (0~3999), and the values in each col-
umn are the answers from survey participants. For example, value 14 in ‘Age’ column means
literally 14 years old, and 8 in ‘Edu’ column means a certain level of study. 2 in ‘Mar’ is for
‘not married’. Then, ‘NaN’ in ‘Inc’ shows that there was no answer for this question about
income amount. 99 in ‘Exp’ means that people did not want to answer this question.
Likewise, there are 1583 missing values in the column ‘Inc’, which is for income amount ques-
tion. For this, either average values or the minimum value were used to fill the blanks so that
the analysis can be conducted without blanks.
Plots of distributions in the demographic information are presented in figure 5. The values are
discrete and skew.
Figure 5: Plots of distributions in the demographic

22
For the questions about the opinions of the customer, there was no missing value. Here at the
figure 6 below are the first 5 rows of these 9 features. Each value in rows represents how cus-
tomers evaluate themselves on each question.
Figure 6: First five rows of customers opinion
The shapes of distributions of all 4000 customer answer results are not very different between
the questions as the figure 7 visualizes. They are neither exactly symmetric nor too much
skew.
Figure 7: Distributions of 4000 customer answer results
The statistics of both the demographics and opinions of the participants are illustrated in fig-
ure 8. There are summarizations about average, standard deviation, minimum, maximum,
percentiles at 25%, 50% and 75%. For instance, the lowest age was 13 and the highest age was
69.

23
For binary questions such as either married or not, either having kids or not, minimum num-
ber is ‘1’ and maximum is ‘2’ because ‘1’ stands for yes and ‘2’ stands for no.
For the questions on customer opinion and behavior, the lowest and highest value are
respectively 1 and 6 because the range for answering was 1~6. As shown in figure 9, most
questions were answered with an average value of 4 for all the columns except two columns
‘Com’ and ‘Eth’, which have an average value of 3.
After exploring data, the features to use as an independent variable in analysis can be chosen
now. In other words, it can be decided if all the 20 features are used or if only some of them
are used. Demographics can turn out to be relevant with the labels of segments, but the
standards of decision can be various and different depending on what the main focus is.
There are some problems to use demographics as criteria or independent variables. First, us-
ing features such as ‘age, expense, location’ can result in influencing segmentation although
they are not really related to the more important segmentation criteria. Secondly, the values
Figure 8: Statistics from both demographics and opinions
Figure 9: Statistics of customer opinion and behavior

24
in demographic columns are skew, and diverse in ranges. So, it is not very convenient to use
them without complicated data processing though it is not impossible.
Here in this research, the segmentation needs to reflect the customers’ preferences in pur-
chasing activities. Therefore, the author potentially selected only 9 features of customer
opinions as independent variables, excluding 11 demographic information features.
The dependent variable, which is also called a label, is the object to be generated by the ex-
perimental trials in analysis. With labels not given in advance, the segmentation task is done
by an unsupervised learning algorithm. On the other hand, the predicting of targeted cus-
tomer, which is an information that would be used for sales activities, requires labels neces-
sarily. Then, finding out the individuals of the desired target group is a classification problem
that utilizes a supervised learning task.
4.3 Performing Segmentation Using K-means Clustering
The K-Means clustering algorithm is one of the popular unsupervised machine learning algo-
rithm for separating data into groups. It is easy to implement with scikit-learn library in Py-
thon.
In the K-means clustering modelling of this customer survey analysis, 9 features of customer
self-evaluation values were used. It is because only those are closely related with the aim of
finding out ‘which participants belong to the group of people that prefer eco-friendly pur-
chase’. 11 features of demographics were not used since it could bring less relevant stand-
ards in performing segmentation.
In the working principle, The K-means algorithm remembers the mean of each cluster, and
sorts groups so that the inertia value, a sum of squared errors, can be minimized. In order to
check this inertia value’s change, ‘elbow method’ is often used. It is a method to check if
there is a point of big decrease in the value in sum of squared errors from the center of each
group. In the use of clustering algorithm, it can be investigated if there is a point that seems
like an elbow by plotting. (Scikit-learn 2019.)
The plot below in figure 10 shows ‘inertia value against number of clustering’.

25
In this plot, more clusters imply a lower value of inertia. Consequently having 10 clusters will
cause the lowest inertia in the figure. However, it does not make sense to have just more
clusters only to decrease the inertia value because there will be too many segments in cus-
tomer data. It will most likely not give that analysis intended.
From figure 10, one tricky thing is that judgement about ‘where the elbow is’ is not objective
all the time, and even sometimes there is no clear elbow point. In figure 10, the elbow point
that shows rapid bending might seem to be when the number of clusters is ‘two’. However, it
can be ‘three’ from some other person’s view. These different interpretations do not mean
the analysis is wrong. The way to decide the number of segments is to compare the scenarios
of different number of clusters. (Blanchard et al. 2019,123.) Then it is good to choose the one
that suites the best with the goal of business problem.
4.4 Description of Segments
The figures below in this chapter are the output generated from experiments. Each of them is
a result with 4 segments, 3 segments and 5 segments respectively. Cluster names (0~3, 0~2,
0~4) were assigned at the leftmost side. The demographic columns also merged with cus-
tomer opinion columns.
Figure 10: inertia value against number of clustering

26
Figure 11: 4 segments model
As shown up in figure 11, first a 4 segments model was tried. Segment 0 and 3 have higher
values in most of the features when compared with segment 1 and 2. It means, those two
(segment 0 and 3) can be candidates of target segments.
Figure 12: 3 segments model
A 3 segments model was also experimented, which is shown in figure 12. This model looks fine
on the most part. However, the gap in values in the columns ‘Com’ and ‘Eth’ were smaller
between segments than in the case of a 4 segments model.
Lastly, a 5 segments model was experimented with. This is shown in figure 13 below:
Figure 13: 5 segments model
Now the values in columns including ‘Com’ and ‘Eth’ were shown more distinctively than
other two models. How many clusters are the most proper is a matter in which business con-
sideration affects a lot. In this analysis, the ‘5 segments’ model was chosen because in this
model, ‘segment number 3’ had higher values in almost all the columns than the other seg-
ments, still having 1172 people in there. It is 29.3% of 4000 people that also fulfills the re-
quirement for the target size, which is 25~30% among the whole data.

27
In the 5 segments model, ‘Segment number 0’ is higher in values with most of columns as seg-
ment 3 is, but the values in ‘Com’ and ‘Eth’ are even lower than other segments. So, this
group seems potentially not as sensitive to environmental issues as segment 3 people do.
Therefore, in the context of the research that seeks for the best target group for an eco-
friendly company, this 5 segments model is the best.
In the case of demographic values, oppositely to the author’s own guess, there were no out-
standing differences between segments. It is revealed at the figure 13. In all the columns of
gender, age, location, job, income, expense, education, marriage, kid, the average values
did not differ significant between segments.
4.5 Selecting and Profiling of a Target Segment
For deciding the target group, what has to be considered is the fact that the aim of the prob-
lem-solving. Having 5 segments and already having enough number of individuals more than
25% of the whole data, the best group that an environmentally oriented company can choose
is the ‘segment number 3’ as shown in chapter 4.4 (figure 13).
To see the average values in each feature visually, ‘Snake plot’ was executed. The results are
shown in figure 14.
This snake plot shows the differences between segments. For 9 questions, the members of the
target segment (segment 3) gave much higher score, evenly all over the value of 4.0 among
the range of 1~6. They are much more likely to buy, to be loyal to the company in question,
and to be satisfied by its product than the members of other groups. Therefore, we can
Figure 14: Snake plot with the values from each variable

28
deduce that concentrating on selling to this segment will be more profitable than trying to
sell to all of the customers of the whole market.
The key characteristics of the segment group members can be explained as ‘thinking much
about corporate social responsibility, ethical production and consuming, environmental
preservation, and wise purchasing’. The high scores in their answers prove it as the figure 13
and figure 14 show.
4.6 Other Segmentation Methods
There are other data science methods that are used for segmenting. Here it is examined if
any of them would be more plausible than the K-means clustering algorithm in finding out the
particular target group in this study.
4.6.1 Hierarchical Clustering
Hierarchical clustering is a way of grouping by hierarchical merging. Inspection through the
visualization is useful to find out how the data is structured. However, this method is more
applicable to the cases of small size data analysis. (Scikit-learn 2019.) Due to this reason, this
is not optimal for the case data of 4000 rows.
4.6.2 Non-negative Matrix Factorization (NMF)
Non-negative matrix factorization is another unsupervised learning method for clustering.
This is an easy dimension reduction technique so that it is broadly used for grouping docu-
ments by similar topics or images by similar patterns. Consequently, this data science method
is powerful for the tasks such as finding same issue articles, recommending next ones to read-
ers. Also, it is applicable for other sorts of recommendation system building.
However, in this method, there is a limitation in applying, which is that most values in fea-
ture variables should be zero except few to work well in clustering. Having non-zero values in
all features in this research dataset, it is hard to utilize NMF algorithm. (Scikit-learn 2019.)

29
4.6.3 Principle Component Analysis (PCA)
As NMF is a dimension reduction method, principle component analysis is also a way to ex-
tract key features reducing number of features in consideration from a raw data. Rather than
independent application only, PCA is usually conducted before performing rest steps in data
analysis. It is because PCA is mostly for finding the number of relatively important variables.
(Scikit-learn 2019.)
It removes less informative features by ordering variances in all the features. Since PCA can
be applied to the research dataset without any technical issues, the author made an attempt
of it to the data with all 20 features with Scikit-learn library in Python. The figure 15 below is
the result of PCA.
The problem is as seen in the figure 16, PCA does not offer what are the very top priority fea-
tures and what are not exactly. Therefore, in this research there is no way to find out if the
first 3 features of high variances are age, gender or other variables. Because of this, the au-
thor decided not to use PCA result for the further analysis.
4.7 Evaluation – Is This Segmentation Analysis Beneficial to the Business?
Evaluating a clustering algorithm performance is challenging. Because there were no given la-
bels in advance, it is impossible to measure the quality of a clustering based on standards
such as labels. In the research case here, the success of the segmentation might be able to be
evaluated by whether segmenting achieves the anticipated benefits or not. (Dolnicar et al.
2018, 255.)
Figure 15: Principle Component Analysis Result from 20 features

30
Feasible contribution index to the benefit can be for example, what portion of customers in
target group click a company homepage after they are contacted, or how long they stay on
that site, how many of them proceed to purchasing stage and so on. If these findings are com-
pared with the result from the non-target segments or from the randomly selected customers,
the difference can be assessed. ‘Accomplishing customer satisfaction’ is also what a company
can expect by focusing on the target group. However, it is not easy to evaluate it by numbers
very soon. Therefore, here only ‘reducing marketing expenses’, and ‘increasing sales’ will be
assessed by numbers.
Here is an assumption that costs of marketing and sales for one future customer are one euro,
and the sales from one customer’s purchase are three euros. Also, it is assumed a probability
that an individual in the target group proceeds to really buying is 60%. The total number of
the target group’s members is 1172, which is the result of performing segmentation analysis
(figure 13 in chapter 4.4). Other groups’ members are respectively 1033, 910, 563, 322 by
the segmentation result as shown in the same figure. And the probabilities to turn into real
customers in each of non-target group are assumed respectively as 30%, 20%, 10%, 0%. Table 4
below summarizes the discussion so far.
Segment
People Per Group (A)
Proba-bility to Buy (B)
Expected number of real customers Per Group (A) x (B)
Expected number of people who do not be-come real customers (A) x (1-(B))
Target 1172 0.6 703.2 468.8
Non target 1033 0.3 309.9 723.1
Non target 910 0.2 182 728
Non target 563 0.1 56.3 506.7
Non target 322 0 0 322
Total 4000 1251.4 2748.6
Table 4: Number of people and probability to buy (per segment and total)
Now, the total profits without a use of segmentation will be measured. First, to compute the
expected number of real customers for each group, column (A) and (B) were multiplied,
which is the fourth column in the table 4. And the fifth column shows the expected number of
people who are not likely to be real customers for each segment. At the last row, the number
1251.4 stands for the whole total sum of probable customers out of 4000 individuals, and
2748.6 means the opposite, whole total sum of individuals who are likely not to purchase any-
thing. If the fourth column values are multiplied by the sales per customer (3 euros), it can
tell us the value of sales per segment. That is shown at the second column (C) in table 5. The
expenses for the marketing and sales per segment can be calculated by ‘one euro’ times ‘col-
umn (A)’. It is located in column (D) in table 5. If a company just try to sell to anybody not
considering segmentation, the cost is spent to all the customers of the segments. Therefore,

31
in this case there is no room to insert the probability of being real customers. The profits per
segment is easily calculated by ‘sales per segment’ ( column (C) ) minus ‘expenses per seg-
ment’ ( column (D) ). It is shown in column (E) in table 5.
Segment
(C) Sales per segment ( =(A) x (B) x 3euros )
(D) Expenses per seg-ment
( = (A) x 1euro )
(E) Profits per segment ( =(C) - (D) )
Target 2109.6 1172 937.6
Non target 929.7 1033 -103.3
Non target 546 910 -364
Non target 168.9 563 -394.1
Non target 0 322 -322
Total 3754.2 4000 -245.8
Table 5: Sales, expenses and profits (per segment and total)
As shown at the bottom right corner of the table 5, the total profit in business in case there is
no use of segmentation is -245.8 euros and it is in fact a loss not a profit at all. If a company
just try selling or doing marketing and sales towards all the people, it can spend lots of
budget and still record a loss likewise. Although we think that company just pick random 1172
people and try convincing them to buy, the result is still a loss. For example,
(-245.8) times (1172/4000) is equal to (-72) euros.
This tells the fact that marketing and sales outcomes are ineffectual.
Now, here is the case where a company only focuses on the target group, doing marketing
and sales for them. Then, the sales will be 2109.6 euros, which is at the first value of column
(C) in table 5. And the costs are 1172 euros in the same row, in column (D). Therefore, the
profit is 937.6 euros, which is a difference between the two numbers. It is shown at the upper
right corner of the table 5. Importantly, this 937.6 is not only a profit from the target group
but also a profit of the whole company. In other words, the losses in column (E), which are -
103.3, -364, -394.1 and -322 are not generated at all.
This computation illustrates how the segmentation can be beneficial to the business. By the
difference between ‘the profit of 937.6 euros’ and ‘the loss of -72 euros’ . It is what can hap-
pen while same marketing and sales budgets are spent on the same number of 1172 custom-
ers. If the marketing and sales are supported by a wise segmenting job, a company is more
likely to achieve the higher profits.
5 Implementation of Classification Algorithms -Predicting Targeted Individuals
While the clustering algorithm is useful for dividing the data into different segments, this
chapter examines the supervised learning methods that are handy to classify whether each
individual is a target group member or not. The algorithms are not limited to the given data

32
of 4000 people. Even when new data from the same survey answers is obtained, it is possible
that we can see who belongs to the target group and who does not.
From a more business point of view, segmentation is naturally connected to efficient sales ac-
tivities. It is because the people in the target segment are more likely to become real and
even loyal customers for the company than the other groups’ members. It would be beneficial
to sales team if segmentation result in chapter 4 is utilized for classifying who are the individ-
uals of the target group.
5.1 Supervised Learning Algorithms as a Prediction Solution
From here on, commonly used five supervised learning algorithms were experimented in
chapter 5.2~5.6. Availability between covered algorithms was compared by accuracy and the
choice of the best algorithm was written in chapter 5.7.
Commonly to all the algorithms in chapter 5, predictor variables are 9 features of customer
survey answers, and the target variable is the segment label. Also, all through chapter 5, out
of the 4000 individuals data, 3200 individuals data was used in training. The rest of 800 indi-
viduals data was separately used for the evaluation of targeting accuracy. For the accuracy
calculation, ‘confusion matrix’ (which was introduced in chapter 3.2.2) was used.
5.2 K-nearest Neighbors Algorithm (KNN)
K-nearest neighbors is an algorithm which predicts the label by investigating the closest la-
beled data points. It classifies new cases based on a similarity degree, for example distance
measurement. (Sayad 2020.)
KNN is very useful for nonlinear models. Since the customer data in this study implies not an
exactly linear trend with features and target label, this model is appropriate for the solution.
Figure 16: Transformation to binary values

33
The best segment group has a new label of ‘1’, and other segments are labeled as ‘0’ all to-
gether. Figure 16 below is the result of transformation. This shows only the beginning 10 indi-
viduals’ new label among 4000 customers.
As figure 17 below, which is a ‘confusion matrix’, shows, 221 individuals among 234 of the
best customer group were predicted correctly as the target customers (label 1). Only 13 of
234 were wrongly forecasted. In addition, among 566 non-target individuals, 554 were pre-
dicted as not to be targeted (as label 0). Only 12 among 566 were wrongly classified.
5.3 Logistic Regression
Logistic regression is one of classification methods in machine learning. This algorithm com-
presses and transforms the output of linear regression to classes 0 and 1. It is an appropriate
method for a binary and predictive analysis (Statistics Solutions 2020).
Figure 18 is the result of applying logical regression on this data. Roughly speaking, it
achieved about 91% accuracy both for training and test data. 195 individuals among 234 of the
best customer group were predicted rightly as the target customers (label 1). 39 of 234 were
wrongly forecasted. And among 566 non target group members, 534 were predicted correctly.
32 among 566 were wrongly classified.
Figure 17: Confusion matrix from the KNN algorithm result
Figure 18: Confusion matrix from the logistic regression algorithm result

34
Though these scores are not very bad, the accuracy in KNN algorithm was much higher. Alt-
hough the reason is not all clear due to many factors in implementation, the author doubted
this as a reason, the fact that logistic regression algorithm works the best for linearly distin-
guishable data type (Blanchard et al. 2019, 210). Also, logistic regression is known as not the
best choice for the tasks that deal with a large number of features or variables (Sachan 2015).
So, this can be another reason of less accurate result than KNN algorithm.
5.4 Decision Tree
Decision tree is a model which makes predictions by looking for a target variable by the use of
tree-shaped learning process, the decision rules. Through sequential if-else questions that are
repeated with features, it infers the target class labels. It is powerful because it can be ap-
plied for all non-linear relations cases (Scikit-learn 2019).
As figure 19 below shows, the learning algorithm of decision tree model generated about 95%
of accuracy with test data from 800 individuals. 208 target labels (label 1) predicted cor-
rectly, 554 of label 0 were predicted correctly as they were. 26 labels of label 1 and 12 labels
of label 0 were incorrect in prediction.
The process inside Decision tree algorithm is visually accessible through python function.
These figure 20 and figure 21 below are how the customer data is analyzed when decision
tree model is applied. Figure 20 is the beginning part of algorithm in fitting.
Figure 19: Confusion matrix from the decision tree algorithm result
Figure 20: Process of decision tree algorithm with the survey data

35
Figure 21 shows the big picture of the whole training process.
Figure 21: Process of decision tree algorithm (as a whole)
5.5 Voting Classifier
All three models so far are useful themselves. Nevertheless, there are factors which can make
each model become inaccurate due to some limitations. To mitigate them, there are ensem-
ble methods in machine learning technique. In this research, the author tried one of them,
voting classifier.
Voting classifier is an ensemble learning method which lets all the different models learn
based on the one same data. Each model predicts, then the result is aggregated for the final
predictions making stage. The last decision is much more accurate because it is made by the
voting from different individual models’ results. (Scikit-learn 2019.)
Binary classification case with the voting classier is illustrated as figure 22 below.
Figure 22: Mechanism of Voting Classifier (Mangale 2019)

36
Figure 23 is the screenshot of implementing voting classifier in python, for this targeting task
in customer survey analysis.
Figure 23: Implementation of voting classifier
Below figure 24 shows that, the learning algorithm of decision tree model generated about
95% of accuracy with 800 test data. 226 target labels (label 1) predicted correctly, 558 of la-
bel 0 were predicted correctly as they were. Only 8 labels from label 1 and label 0 respec-
tively were incorrect in prediction. This is a big improvement from the earlier three models
when comparing the number of right predictions. Also, the overall accuracy for test data was
98%, the highest among 4 experiments so far.
5.6 Neural Network
A neural network refers to a programming paradigm that is inspired by working process of hu-
man brain. Currently solutions to many complicated problems are generated by a neural net-
work algorithm, for example, in image recognition, speech recognition and natural language
processing. (Nielsen 2015.)
Figure 24: Confusion matrix from voting classifier result

37
As human brain has neurons, a neural network has nodes. By this the group of nodes as well as
the interconnected layers of these nodes, the algorithm changes the data in input node to the
output node (Scikit-learn 2019). Figure 25 shows what happens in the neural network.
A neural network is able to learn from non-linear relations. It also works well when there is a
lot of data to process. In python programming environment, there is a library named Keras,
which has a model for neural network algorithm. After experimenting in tuning repeatedly,
the accuracy rate on test data improved up to around 98.62%. This is illustrated in figure 26-
28.
Figure 26: Neural network model performed by Keras in Python
Figure 25: Mechanism of four-layer network with two hidden layers (Nielsen 2015)

38
Figure 27: Learning process until neural network records the best accuracy score
Only 11 individual customers were classified erroneously. 229 target labels and 560 non-target
labels, all together 789 in 800 labels were correctly forecasted (figure 28). This is the best
score among all 5 classification models.
Figure 28: Accuracy rate (98.62%) and confusion matrix of neural network
5.7 Choice of the Prediction Model
All the 5 models scored more than 90% of accuracy. Especially voting classifier and neural
network outperformed the other models. Although the neural network has slightly higher ac-
curacy level than voting classifier here in this research, the gap in mispredicted cases was
very small. Therefore, selecting any of them will not make a big difference.
In real business cases, the standards of selection can vary. Not only the accuracy but the fac-
tors such as cost of model implementation and easiness of interpretation will affect the
choice.

39
6 Conclusion
In business, it is crucial to know the right target because a company can serve customers well
only when it is aware who are their customers among numerous people. Customer segmenta-
tion is a work of dividing customers into groups so that a business can focus on offering a cer-
tain group of people with customized products or services. By segmenting and targeting one
or a few of segments, a company can allocate marketing resources more efficiently. Above
all, a company is more likely to achieve higher return if it utilizes segmentation analysis. It is
also more likely to build a long-standing customer relationship.
In this research, it was studied that data science methods can be applicable on segmentation
and targeting problems with the support of relevant business theories. By the application of
diverse quantitative analytics methods in data science, customer survey analysis was con-
ducted and the research questions were solved by it.
Through the analysis, basic statistic findings were demonstrated, consumers were sorted into
distinct segment groups with selected features on the reflection of similarity in customers’
characteristics. For this segmentation problem, unsupervised learning method of cluster anal-
ysis such as k-means algorithm was used. With the outcome of 5 segments model in segmenta-
tion, a target group was chosen. It had higher values in almost all the columns than the other
segments did. The target segment had 1172 people (29.3% of 4000 individuals). The target
segment is a group of people who carefully choose products in the aspects of both environ-
mental impact as well as a wise purchasing pattern.
It was possible to evaluate the results, by comparing the profits between the case that fully
uses segmentation analysis results and the case that does not utilize the segmentation.
In addition to performing segmentation, targeted individuals were predicted by various classi-
fication methods such as voting classifier and neural network. Sales activities are able to
make use of the results for the future customers from unseen data as well. The accuracy was
measured by counting the number of true positive, true negative, false positive and false neg-
ative.
The utilization of relevant data could be a way to make operations be more beneficial to the
goal of an organization. By performing this research, the author could figure out how crucial
the quality of data is. Relevant data collection and management seems to be a hard mission
for many business entities. From now on, the author would like to further study how this issue
can be solved more easily.
40
References
Printed
Kotler, P. & Armstrong, G. 2014. Principles of marketing. Global edition. Boston: Pearson.
Electronic
Banton, C. 2019. Data Science. Investopedia. Accessed 25 April 2020.
https://www.investopedia.com/terms/d/data-science.asp
Blanchard, T., Behera, D. & Bhatnagar, P. 2019. Data Science for Marketing Analytics:
Achieve Your Marketing Goals with the Data Analytics Power of Python. Birmingham: Packt
Publishing. Book from ebrary. Accessed 29 May 2020. http://site.ebrary.com/lib/laurea
Brenner, M. 2020. How to Build a Customer-Driven Marketing Strategy for 2020. Accessed 11
May 2020. https://marketinginsidergroup.com/marketing-strategy/how-to-build-a-customer-
driven-marketing-strategy-for-2020/
Business Performance Improvement Resource. 2020. Measure and Evaluate Customer Market
Segmentation Processes. Accessed 30 May 2020. https://www.bpir.com/customer-market-
segmentation-bpir.com/menu-id-72/measure-and-evaluate.html
Cambridge Dictionary. 2020. Cambridge University Press. Accessed 2 May 2020. https://dic-
tionary.cambridge.org/us/dictionary/english/data-driven
Dolnicar, S., Grün, B. & Leisch, F. 2018. Market Segmentation Analysis, Management for Pro-
fessionals. Singapore: Springer Naure. Book from ebrary. Accessed 26 May 2020.
http://site.ebrary.com/lib/laurea
Etman. 2018. MOOC Courses for Getting Started with Machine Learning. Data Science Society.
Accessed 25 April 2020. https://www.datasciencesociety.net/mooc-courses-for-getting-
started-with-machine-learning

41
Heidenreich, H. 2018. What are the types of machine learning? Towards Data Science. Ac-
cessed 20 April 2020. https://towardsdatascience.com/what-are-the-types-of-machine-
learning-e2b9e5d1756f
Herrick, J. 2020. Are You Measuring What Matters? 3 Sales Performance Metrics You Aren’t
Thinking About. BenchmarkONE. Accessed 30 May 2020. https://www.hatch-
buck.com/blog/sales-performance-metrics
Hague, P., Hague, N. & Morgan, C. 2013. Market Research in Practice : How to Get Greater
Insight From Your Market. Second edition. London: Kogan Page. Book from ebrary. Accessed
26 May 2020. http://site.ebrary.com/lib/laurea
KOBACO. 2019. Annual customer survey. Accessed 1 April 2020. https://adstat.ko-
baco.co.kr/mcr/portal/dataSet/mdssInfoPage.do?datasetId=DS_MST_0000000422&search-
Text=
Lee, W. 2020. AI used for the disease forecasting and detection. Health Kyunghyang. Accessed
20 April 2020. http://news.khan.co.kr/kh_news/khan_art_view.html?ar-
tid=202006091454002&code=900303
Lumen Learning. 2020. Reading: Segmentation Criteria and Approaches. Accessed 29 May
2020. https://courses.lumenlearning.com/cochise-marketing/chapter/reading-segmentation-
criteria-and-approaches
Mangale, S. 2019. Voting Classifier. Medium. Accessed 25 April 2020. https://me-
dium.com/@sanchitamangale12/voting-classifier-1be10db6d7a5
Mathur, U. 2008. Sales Management. New Delhi: New Age International. Book from ebrary. Ac-
cessed 30 May 2020. http://site.ebrary.com/lib/laurea
Mukherjee, A. 2019. Minimum viable domain knowledge in data science. Accessed 28 April
2020. https://towardsdatascience.com/minimum-viable-domain-knowledge-in-data-science-
5be7bc99eca9

42
Nielsen, M. 2015. Neural network and deep learning. Determination Press. Accessed 27 April
2020. http://neuralnetworksanddeeplearning.com/chap1.html
Piatetsky, G. 2016. Where Analytics, Data Mining, Data Science were applied in 2016. KDnug-
gets. Accessed 25 April 2020. https://www.kdnuggets.com/2016/12/poll-analytics-data-min-
ing-data-science-applied-2016.html
Riskspan. 2020. Accessed 2 April 2020 https://riskspan.com/news-insight-blog/tuning-ma-
chine-learning-models/
Sachan, L. 2015. Logistic Regression vs Decision Trees vs SVM: Part II. Edvancer Eduventures.
Accessed 29 April 2020. https://www.edvancer.in/logistic-regression-vs-decision-trees-vs-
svm-part2/
Saunders, M., Lewis, P. & Thornhill, A. 2015. Research Methods for Business Students. Sev-
enth edition. London: Pearson Education UK. Book from ebrary. Accessed 29 April 2020.
http://site.ebrary.com/lib/laurea
Sayad, S. 2020. Data science. Accessed 26 April 2020.
https://www.saedsayad.com/data_mining.htm
Sayad, S. 2020. K Nearest Neighbors – Classification. Accessed 27 April 2020.
https://www.saedsayad.com/k_nearest_neighbors.htm
Scikit-learn. 2019. Clustering. Accessed 2 April 2020. https://scikit-learn.org/stable/mod-
ules/clustering.html
Scikit-learn. 2019. Decision Trees. Accessed 2 April 2020. https://scikit-learn.org/sta-
ble/modules/tree.html
Scikit-learn. 2019. Neural network models (supervised). Accessed 5 April 2020. https://scikit-
learn.org/stable/modules/neural_networks_supervised.html
Scikit-learn. 2019. Principal component analysis (PCA). Accessed 3 April 2020. https://scikit-
learn.org/stable/modules/decomposition.html#pca
43
Scikit-learn. 2019. Topic extraction with Non-negative Matrix Factorization and Latent Di-
richlet Allocation. Accessed 3 April 2020. https://scikit-learn.org/stable/auto_examples/ap-
plications/plot_topics_extraction_with_nmf_lda.html?highlight=non%20negative%20ma-
trix%20factorization
Scikit-learn. 2019. Voting Classifier. Accessed 5 April 2020. https://scikit-learn.org/sta-
ble/modules/ensemble.html#voting-classifier
Statistics Solutions. 2020. What is Logistic Regression? Accessed 29 April 2020.
https://www.statisticssolutions.com/what-is-logistic-regression
Sunil, R. 2017. Commonly used Machine Learning Algorithms (with Python and R Codes). Ana-
lytics Vidhya. Accessed 20 April 2020. https://www.analyticsvidhya.com/blog/2017/09/com-
mon-machine-learning-algorithms
Techopedia. 2018. Definition - What does Data Science mean? Accessed 25 April 2020.
https://www.techopedia.com/definition/30202/data-science
Tracxn. 2020. Artificial Intelligence Startups in Finland. Accessed 26 April 2020.
https://tracxn.com/explore/Artificial-Intelligence-Startups-in-Finland

44
Figures
Figure 1: Data Science as an interdisciplinary field of study (Etman 2018) ...................... 17
Figure 2: Confusion Matrix (Blanchard et al. 2019, 297) ............................................ 18
Figure 3: No missing values for each variable (except the Income column) ..................... 20
Figure 4: First 5 rows of demographics ................................................................ 21
Figure 5: Plots of distributions in the demographic ................................................. 21
Figure 6: First five rows of customers opinion ....................................................... 22
Figure 7: Distributions of 4000 customer answer results ............................................ 22
Figure 8: Statistics from both demographics and opinions ......................................... 23
Figure 9: Statistics of customer opinion and behavior .............................................. 23
Figure 10: inertia value against number of clustering ............................................... 25
Figure 11: 4 segments model ........................................................................... 26
Figure 12: 3 segments model ........................................................................... 26
Figure 13: 5 segments model ........................................................................... 26
Figure 14: Snake plot with the values from each variable .......................................... 27
Figure 15: Principle Component Analysis Result from 20 features ................................ 29
Figure 16: Transformation to binary values ........................................................... 32
Figure 17: Confusion matrix from the KNN algorithm result ....................................... 33
Figure 18: Confusion matrix from the logistic regression algorithm result ....................... 33
Figure 19: Confusion matrix from the decision tree algorithm result ............................. 34
Figure 20: Process of decision tree algorithm with the survey data .............................. 34
Figure 21: Process of decision tree algorithm (as a whole) ......................................... 35
Figure 22: Mechanism of Voting Classifier (Mangale 2019) ......................................... 35
Figure 23: Implementation of voting classifier ....................................................... 36
Figure 24: Confusion matrix from voting classifier result ........................................... 36
Figure 25: Mechanism of four-layer network with two hidden layers (Nielsen 2015) ........... 37
Figure 26: Neural network model performed by Keras in Python .................................. 37
Figure 27: Learning process until neural network records the best accuracy score ............ 38
Figure 28: Accuracy rate (98.62%) and confusion matrix of neural network ..................... 38
Tables
Table 1: Tasks to do in order to solve defined problems ........................................... 11
Table 2: Demographic features ......................................................................... 20
Table 3: Customer opinion features ................................................................... 20
Table 4: Number of people and probability to buy (per segment and total) ..................... 30
Table 5: Sales, expenses and profits (per segment and total) ..................................... 31
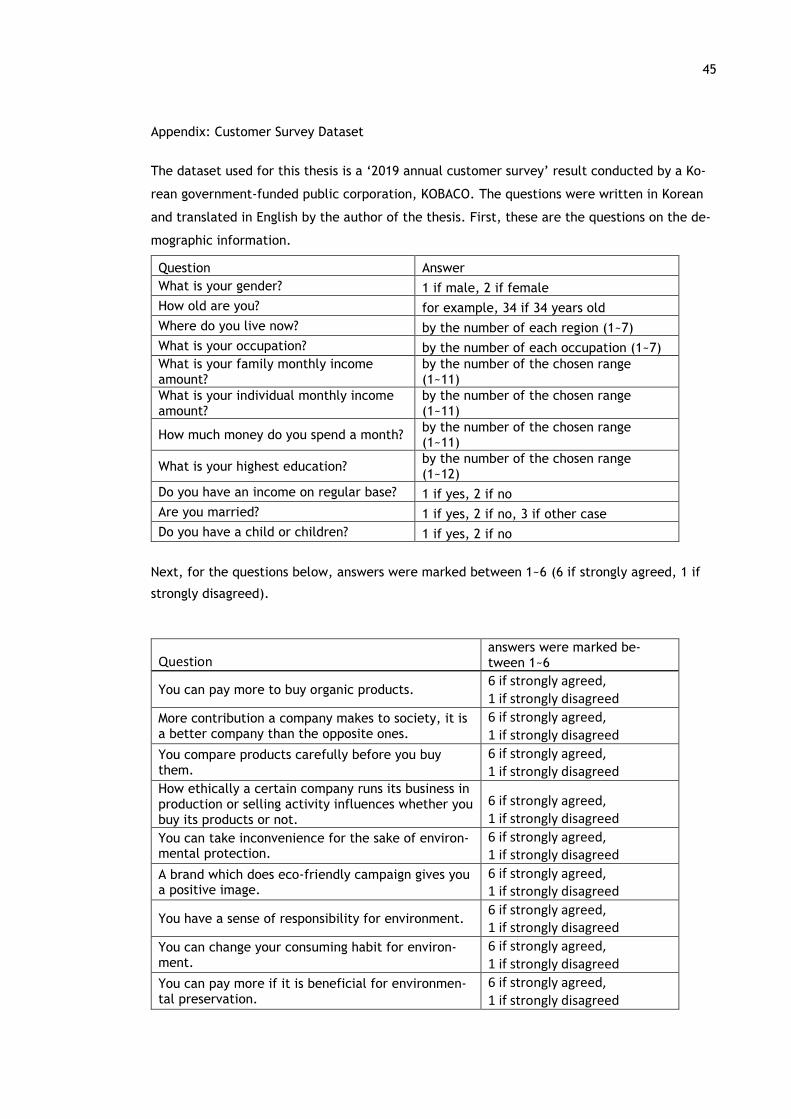
45
Appendix: Customer Survey Dataset
The dataset used for this thesis is a ‘2019 annual customer survey’ result conducted by a Ko-
rean government-funded public corporation, KOBACO. The questions were written in Korean
and translated in English by the author of the thesis. First, these are the questions on the de-
mographic information.
Question Answer
What is your gender? 1 if male, 2 if female
How old are you? for example, 34 if 34 years old
Where do you live now? by the number of each region (1~7)
What is your occupation? by the number of each occupation (1~7)
What is your family monthly income amount?
by the number of the chosen range (1~11)
What is your individual monthly income amount?
by the number of the chosen range (1~11)
How much money do you spend a month? by the number of the chosen range (1~11)
What is your highest education? by the number of the chosen range (1~12)
Do you have an income on regular base? 1 if yes, 2 if no
Are you married? 1 if yes, 2 if no, 3 if other case
Do you have a child or children? 1 if yes, 2 if no
Next, for the questions below, answers were marked between 1~6 (6 if strongly agreed, 1 if
strongly disagreed).
Question answers were marked be-tween 1~6
You can pay more to buy organic products. 6 if strongly agreed, 1 if strongly disagreed
More contribution a company makes to society, it is a better company than the opposite ones.
6 if strongly agreed, 1 if strongly disagreed
You compare products carefully before you buy them.
6 if strongly agreed, 1 if strongly disagreed
How ethically a certain company runs its business in production or selling activity influences whether you buy its products or not.
6 if strongly agreed, 1 if strongly disagreed
You can take inconvenience for the sake of environ-mental protection.
6 if strongly agreed, 1 if strongly disagreed
A brand which does eco-friendly campaign gives you a positive image.
6 if strongly agreed, 1 if strongly disagreed
You have a sense of responsibility for environment. 6 if strongly agreed, 1 if strongly disagreed
You can change your consuming habit for environ-ment.
6 if strongly agreed, 1 if strongly disagreed
You can pay more if it is beneficial for environmen-tal preservation.
6 if strongly agreed, 1 if strongly disagreed