customer satisfaction research produced for: raven housing trust – november 2012 presented by emma...
TRANSCRIPT

Customer Satisfaction Research
Produced for:
Raven Housing Trust – November 2012
Presented by Emma Hopkins

Results
Total Sample: 2962
September 2011 – September 2012

Raven Overview
• Satisfaction levels remain high with overall satisfaction with Raven exceeding its target of 79% (89% overall, 94% sheltered)
• High in the South (90%) and Cleaning (90%)• 93% among 55+ age group• Patch H – Woodhatch, Reigate, Salfords, Horley (93%)
• KPI met for Repairs and maintenance, overall satisfaction (88%, 90% Q2)• However, below target for window cleaning, communal cleaning services,
grounds maintenance and VFM with further decreases this quarter
• NPS score of 31 overall• An increase of 6% this quarter compared with Q1• Higher in the South (38%), but lower in the North (30%)• Higher among sheltered residents (46%, -4%)

Raven Overview
• Three quarters of customers have access to the internet overall. As to be expected, 16-34 year olds have greater access (73% at home, 20% elsewhere) • However, this group still appear to be more demanding – satisfaction
significantly lower across the board• this age group also feeling less valued
• Feeling valued has a significant impact on NPS (Yes 48% vs. No -60%)

Overview –Total Sample
• The profile of customers surveyed are detailed below
• Base: Repairs 1266, Housing 1097, Cleaning 599
Male Female 16-34 35-54 55+ North Central South YesGender Age Group Patch Sheltered
31%
69%
22%
36%
43%
25%
39%35%
8%
39%
61%
22%
38% 40%
28%
36% 36%
Customer Profile
Survey Sample Raven Profile

Rav
She
Tar
Mal
Fem
16-
35-
55+
Cle
Rep
Hou
Nor
Cen
Sou
GA
ge ..
.S
e
6%
5%
6%
5%
9%
7%
4%
5%
7%
6%
7%
7%
5%
5%
3%
4%
6%
7%
6%
3%
4%
6%
6%
4%
6%
5%
89%
94%
79%
91%
88%
84%
86%
93%
90%
87%
89%
89%
88%
90%
Overall Satisfaction with Raven
Dissatisfied (rated 1 or 2) Neutral (rated 3) Satisfied (rated 4 or 5)
Overall Satisfaction with Raven
94% in South. Only 86% in North, although an increase of 9%
85% in North rising to 91% in South
86% in South rising to 93% in North

Overall Satisfaction with Raven
Patch A - Tattenham Corner, Epsom, Nork
Patch B - Banstead, Hooley, Woodmansterne
Patch C - Preston, Tadworth
Patch D - Merstham, Tandridge, Caterham
Patch E - Merstham, Redhill North
Patch F - Redhill Central and South
Patch T - Rivers Estate, Tannery, Caberfeigh
Patch G - South Park, Reigate Mole Valley
Patch H - Woodhatch, Reigate, Salfords, Horley
Patch J - Horley, Crawley
No
rth
Ce
ntr
al
So
uth
4%
9%
7%
8%
4%
8%
6%
4%
6%
7%
91%
87%
88%
83%
91%
86%
91%
89%
92%
89%
Overall Satisfaction with Raven - By Patch / Area
Dissatisfied (rated 1 or 2) Neutral (rated 3) Satisfied (rated 4 or 5)
16-34’s least satisfied, 74% rising to 89% among the
55+

Tot
Q1
Q2
Tar
Tot
Q1
Q2
Tar
Tot
Q1
Q2
Tar
Cle
anin
g - C
om...
9%
12%
7%
8%
7%
10%
16%
18%
15%
3%
2%
2%
4%
5%
1%
8%
3%
11%
88%
86%
90%
88%
88%
89%
89%
95%
76%
79%
74%
90%
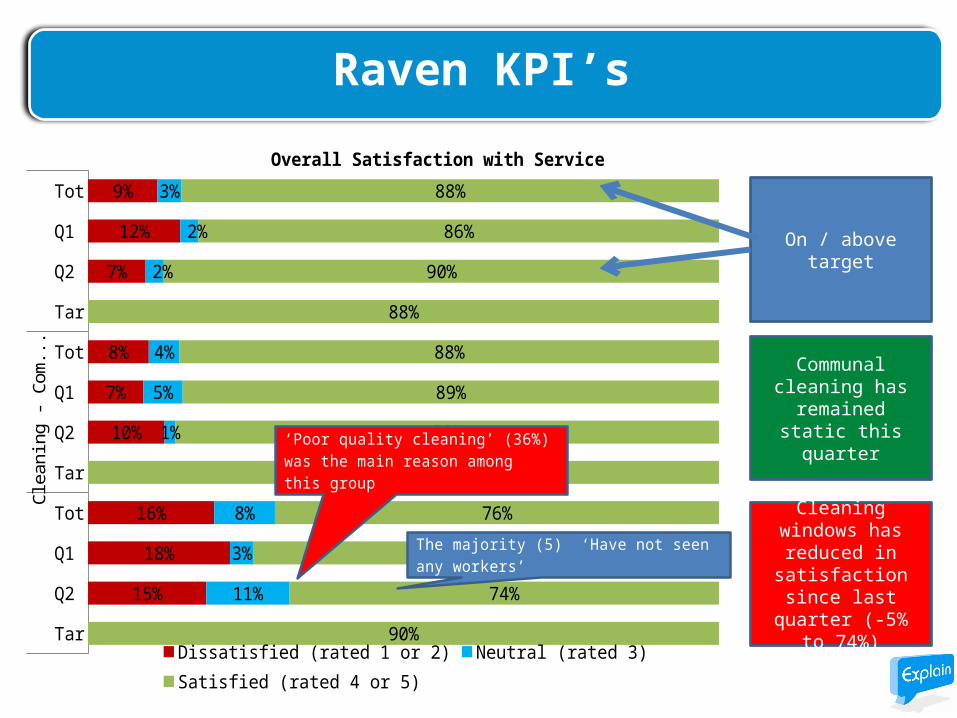
Overall Satisfaction with Service
Dissatisfied (rated 1 or 2) Neutral (rated 3)Satisfied (rated 4 or 5)
Raven KPI’s
On / above target
Cleaning windows has reduced in
satisfaction since last quarter (-5% to
74%)
Communal cleaning has
remained static this quarter
Tot
Q1
Q2
Tar
Tot
Q1
Q2
Tar
Tot
Q1
Q2
Tar
Cle
anin
g - C
om...
9%
12%
7%
8%
7%
10%
16%
18%
15%
3%
2%
2%
4%
5%
1%
8%
3%
11%
88%
86%
90%
88%
88%
89%
89%
95%
76%
79%
74%
90%
Overall Satisfaction with Service
Dissatisfied (rated 1 or 2) Neutral (rated 3)Satisfied (rated 4 or 5)
The majority (5) ‘Have not seen any workers’
‘Poor quality cleaning’ (36%) was the main reason among this group
Raven KPI’s
On / above target
Cleaning windows has reduced in
satisfaction since last quarter (-5% to
74%)
Communal cleaning has
remained static this quarter

Raven KPI’s
Tot
Q1
Q2
Tar
Tot
Q1
Q2
Tar
Tot
Q1
Q2
Tar
Gro
unds
mai
nte.
..
7%
6%
8%
15%
13%
19%
12%
12%
13%
8%
7%
11%
13%
13%
14%
7%
7%
10%
85%
87%
81%
71%
73%
66%
90%
81%
81%
77%
91%
Overall Satisfaction with Service
Dissatisfied (rated 1 or 2) Neutral (rated 3)Satisfied (rated 4 or 5)
A decrease of 6% since last quarter
A decrease of 7% since last quarter
A decrease of 4% since last quarter
30% of those who were dissatisfied stated ‘Communication issues / lack
of communication’ 23% stated ‘Poor timescales to deal
with enquiries / complaints’
35% of those who were dissatisfied stated ‘Poor quality work’
60% of those who were dissatisfied stated is was ‘Expensive’

Internet / Mobile Phone Access
• As expected, the younger customers has greater access to the internet and own a mobile phone• 86% of customers own a mobile phone and of those 45% use their phone to access the internet• Nokia’ and Apple iPhone owned more than any other (24% and 15%)
Rav
Mal
Fem
16-
35-
55+
Cle
Rep
Hou
Nor
Cen
Sou
GA
ge ..
.S
e
60%
59%
61%
73%
75%
42%
62%
59%
61%
55%
62%
62%
16%
17%
16%
20%
13%
17%
16%
15%
18%
17%
17%
15%
24%
24%
23%
7%
12%
41%
23%
26%
22%
28%
21%
23%
Internet Access
At home Elsewhere No access

Repairs and Maintenance
• 1266 interviews achieved (700 Y1, 266 Q1, 300 Q2)• Objective – explore levels of satisfaction with the repairs and
maintenance services
• High levels of satisfaction for service - 88% overall (+2% to 90% for Q2)• With lowest satisfaction among the 16-34’s (83%, 92% among 55+)
• Communication and timescales still an issue
• NPS increase of 6% this quarter compared with last year (42%)
Repairs & Maintenance

• NPS for this quarter has increased by 8% when compared with last year (+13% since last quarter)• ‘Had no problems’ (21%) and ‘Deal with queries quickly’ / ‘Good service’
(20% each) were the main reasons among promoters
Repairs & Maintenance – NPS
Detractors Passives Promoters NPS Score
18%
27%
55%
36%
22%
28%
51%
29%
17%
25%
59% 42%NPS
Year 1 Q1 Q2

Repairs & Maintenance
• Demographically, the score is lowest among the younger age groups (16-34, 35-54) and Central patch• 26%, 23%, 28% respectively
• NPS was 49% in the South patch• Reasons among promoters included ‘Had no problems’ (28%), ‘Good
service’ (26%) and ‘Deal with enquiries quickly’ (20%)
Main reasons among detractors (101 sample) was ‘Had problems in the past’ (18%), 24% among 35-54’s
The main reason among 16-34’s was ‘Timescales’ (21% - 5)Central patch highlighted ‘General dissatisfaction (29%) as being the main reason
Been waiting for a shower fixed for 7
months

YR1
Q1
Q2
YR1
Q1
Q2
YR1
Q1
Q2
Atti
tude
of w
o...
1%
2%
4%
4%
3%
3%
7%
9%
6%
97%
96%
94%
94%
95%
95%
89%
88%
90%
Now that the repair has been completed how would you rate it in terms of:
Dissatisfied (rated 1 or 2) Neutral (rated 3) Satisfied (rated 4 or 5)
Repairs Service Satisfaction

Right First Time?
• 17% stated Raven didn’t get it Right First Time, 15% Q2• The main reasons remain similar
• For October, a significant decrease for Staff helpfulness (-10% to 88%)• Mainly due to a 12% difference between those who were very satisfied last
month compared to this month (68% / 56%)• The main reason for dissatisfaction was 'Attitudes of phone staff (rude /
lack of knowledge / lack of concern)' (49%)
Communication issues (24%, 21%
Q2)
Two key areas – Lack of communication between Raven departments and the customer, and multiple calls made by
the customer to chase
28% South. 19% Central

Tot
Q1
Q2
Nor
Cen
Sou
16-
35-
55+
Mal
Fem
Qu
Pat
ch...
Age
...
G
9%
12%
7%
10%
9%
7%
12%
11%
6%
9%
9%
3%
2%
2%
4%
4%
3%
5%
4%
2%
3%
3%
88%
86%
90%
86%
88%
91%
83%
86%
92%
89%
88%
Overall Satisfaction With Repairs or Maintenance
Dissatisfied (rated 1 or 2) Neutral (rated 3)Satisfied (rated 4 or 5)
Overall Satisfaction with Repairs
• Overall satisfaction with repairs increased this quarter (+4% to 90%)• Difference among the demographic groups are visible
• North (86%), 16-34 (83%) and 35-54 (86%) least satisfied
‘Communication issues / lack of communication’ was the main reason
(35% North, 42% 16-34, 22% 35-54)
I was dissatisfied with Raven due to
their lack of communication
during the repair

Suggested Improvements
31% suggested improvements (32% Q1/Q2)
Communication (25%, 22% Q2)
Timescales to deal with repairs / enquiries (21%, 18% Q2)
40% among 16-34’s32% in the North, only 8% Central
• The areas for improvement remain the same as last year

Housing Services

Housing Services
• 1097 interviews achieved (500 Y1, 301 Q1, 296 Q2)• Objective – explore levels of satisfaction with general housing services
• There are a few changes when comparing total sample with Q2 data
• A slight increase in satisfaction for housing services provided (85% Total, 87% Q2)
• A decrease in NPS this quarter to 22% (27% Q1, 28% Total)
Greatest satisfaction among 55+ group (88%) and Central patch (91%)
Other than ‘General satisfaction’, ‘Never had any problems’ is the main
satisfaction reason (40% & 25%)
Q2 - Rising to 38% 55+ and 32% North patch
Q2 - 0% among 16-34 (64 sample)19% Central and South
Main detractor reasons were ‘Had problems in the past’ (22%) and ‘Would not recommend’ (18%) Note: small base size

Housing Services
• 83% felt Raven value them a customer (84% Y1, 79% Q2)• Of those that don’t feel valued, ‘Raven don’t care’ is the main reason (35% total
sample, 13% Q2 – 7 customers)• Suggested improvements at 32% (31% Q2)
37% among 16-34’s and 35-54 age groups
‘Improve communication’ (-5% to 28% since last quarter)
33% among 35-54 age group
29% 16-34’s, Central and South patch
To be able to speak to people in person, for them to actually get
back to you when they say they will and for
them to care
I think they should listen more to what
your saying and take it into consideration
what's going on

Homes and Neighbourhood
A decrease compared with last
quarter and year 1.
Increase of 1%
YR1
Q1
Q2
YR1
Q1
Q2
YR1
Q1
Q2
YR1
Q1
Q2
Th
e v
alu
e fo
r m
on
ey
for
you
r...
Th
e o
vera
ll q
ua
lity
of y
ou
r...
8%
7%
11%
10%
12%
13%
11%
12%
12%
14%
12%
9%
6%
7%
9%
5%
7%
10%
7%
5%
8%
6%
6%
6%
86%
86%
79%
85%
81%
77%
82%
83%
79%
80%
82%
83%
How satisfied are you with....
Dissatisfied (rated 1 or 2) Neutral (rated 3)Satisfied (rated 4 or 5)
Anti-social behaviour (21%)
Expensive (24%)
Ongoing problems with property (24%)
In October, satisfaction towards ‘Value for money’ increased by
3% to 79%, yet still below target

Grounds Maintenance
• Satisfaction ratings have decreased for grounds maintenance, (-5% to 66%) when comparing Total sample with Q2
• Although in October, this increased to 69%• ‘Overall quality of grass cutting’ increased by 8% during October (83%)
• Satisfaction towards ‘Attitude of the workers’ has increased to 72%, + 5%• Dissatisfaction only 3%
• ‘Keeping dirt and mess to a minimum’ down 5% to 80%
Lower among South patch (70%, 63% Q2)Higher among 16-34’s (79%, 75% Q2)
Higher in Central (85%) Lower in North (78%) and
South (76%)
‘Poor quality work’ is the main reason for dissatisfaction (26%). 27% still believe they don’t receive any grounds maintenance

Suggested Improvements
32% suggested improvements (31% Q2)
Communication (28%, 30% Q2)
Home improvements / maintenance (13%, 11% Q2)
Improve timescales to deal with repair / enquiries (11%, 9% Q2)
Higher in Central, South (29%) and 35-
44’s (33%)
Higher in South (16%) and 35-54’s (18%)
Higher in South (17%) and 16-34’s (21%)
Literal comments indicate customers would like Raven
to listen to them

Cleaning Services

Cleaning Services Overview
• 599 interviews achieved (300 Y1, 151 Q2, 148 Q2)• Objective – explore levels of satisfaction with the cleaning service
• NPS has increased to 28% this quarter, 23% overall (24% Y1)• 16-34’ Q2 is 39% (sample of 26), a significant increase (15% overall)• Overall, North 16%, South 33%
• A slight decrease for overall satisfaction with the window cleaning service• -2% to 76% Overall, 74% Q2
• Q2 - 86% North, 67% Central• Although a decrease, the main reason provided was ‘Good quality
cleaning’ (37%, 36% Q2)

Cleaning Services Overview
• Little change in overall satisfaction with Communal Cleaning (88%, 89% Q2)• Q2 ranging from 86% Central to 93% 35-54’s
• In October, an increase across all satisfaction ratings is visible, ranging from 2% for ‘Overall quality of communal cleaning’ to 7% for ‘Overall satisfaction with communal cleaning services’

Window Cleaning Services
• No change for have suggested improvements for window cleaning service (32%)
• ‘Attitude of workers’ remains lowest rated (68%, 53% Q2)
• ‘Overall quality of window cleaning’ receives the most dissatisfaction, although a 3% decrease, now at 15%
• North patch increased satisfaction to 85% (+4%) with the staff ‘Keeping dirt and mess to a minimum’, lowest among Central (81%)
Q2 – Central, South and 35-54’s is only 46%. Note small base size
Higher among 16-34’s and Central (17% and 16%)
Dissatisfaction levels among the 16-34’s still are much higher than the others (15%, 6% 55+)
‘Clean more often’ was the main suggestion (33%), particularly among Central (38%) and younger residents (39% 16-34’s, 36% 35-54’s).

• Little change in overall satisfaction with Communal Cleaning (88%, 89% Q2)• Q2 ranging from 86% Central to 93% 35-54’s
• 30% (-2%) have suggested improvements for communal cleaning
Communal Cleaning Overview
‘More effort / more time needed’ (25%) was the main reason,
more so among 55+ (40%) and the South (28%)
‘Clean more areas’ was another key improvement (19%), more so among South patch (25%) and 35-54’s (21%)

Communal Cleaning Overview
• A decrease this quarter, although satisfaction for ‘Attitude of the workers’ remains high (89%, 84% Q2)
• ‘Cleanliness of your communal areas’ receives the most dissatisfaction (-3% to 10%)
• Dissatisfaction levels are much higher in Central patch (14%) and 16-34’s (15%) for ‘Overall quality of communal cleaning’
• Central patch more dissatisfied than North & South for ‘Keeping dirt and mess to a minimum’ (84%, 93% and 94% respectively)
Particularly in the South (92%), North only 86% (-9%)
14% among 16-34’s compared with 7% among 35-54’s

Rav
She
Q1
Q2
YR1
YR2
Cle
Rep
Hou
Nor
Cen
Sou
Qu
Yea
Se
Pat
ch...
20%
14%
22%
20%
20%
21%
22%
19%
21%
21%
23%
16%
29%
26%
31%
29%
29%
30%
33%
27%
30%
28%
29%
30%
51%
60%
47%
51%
52%
50%
45%
55%
49%
51%
48%
54%
NPS
Detractors Passives Promoters
Net Promoter Score
-2%
31
46
25
31
32
29
23
36
28
30
25
38
NPS
An increase of 6% since last quarter
‘Would recommend / have recommended’ and ‘Had no
problems ’ each increased by 3% among promoters, this quarter
No significant change since last quarter

Rav
She
Q1
Q2
YR1
YR2
Cle
Rep
Hou
Nor
Cen
Sou
Qu
Yea
Se
Pat
ch...
20%
14%
22%
20%
20%
21%
22%
19%
21%
21%
23%
16%
29%
26%
31%
29%
29%
30%
33%
27%
30%
28%
29%
30%
51%
60%
47%
51%
52%
50%
45%
55%
49%
51%
48%
54%
NPS
Detractors Passives Promoters
Net Promoter Score
-2%
31
46
25
31
32
29
23
36
28
30
25
38
NPS
An increase of 3% since last quarter
This quarter ‘Had no problems’ (19%) and ‘Good service’ (17%) were the
main reasons among promoters
Although the main detractor reasons include ‘Communication problems’ (14%)
and ‘ Had problems in the past’ (12%)

31
48
-60
-81
-72
44
20
24
43
35
28
Net Promoter Score
NPS
Rav
Yes
No
Dis
Neu
Sat
16-
35-
55+
Mal
Fem
Sat
isfa
ctio
n w
ith ..
.G
20%
11%
69%
86%
79%
12%
24%
23%
15%
19%
21%
29%
30%
22%
9%
14%
32%
32%
30%
27%
27%
30%
51%
59%
9%
5%
7%
56%
44%
47%
58%
54%
49%
NPS
Detractors Passives Promoters
Q2, 55+ and Cleaning feel more valued (91% and 90%).Those feeling least valued were 16-34’s (77%) and Housing (79%)
‘Repairs / Maintenance still outstanding’ was the main reason (14% cleaning, 22% 16-34’s)
‘Raven don’t care’ was main reason among Housing customers
1% decrease since last quarter. ‘Had problems in the past’ (14%) was the
main reason among detractors

Patch A - Tattenham Corner, Epsom, Nork
Patch B - Banstead, Hooley, Woodmansterne
Patch C - Preston, Tadworth
Patch D - Merstham, Tandridge, Caterham
Patch E - Merstham, Redhill North
Patch F - Redhill Central and South
Patch T - Rivers Estate, Tannery, Caberfeigh
Patch G - South Park, Reigate Mole Valley
Patch H - Woodhatch, Reigate, Salfords, Horley
Patch J - Horley, Crawley
No
rth
Ce
ntr
al
So
uth
20%
20%
22%
23%
20%
26%
26%
18%
14%
21%
25%
30%
29%
30%
29%
29%
29%
30%
32%
28%
54%
50%
50%
47%
51%
47%
45%
52%
56%
52%
NPS by Area / Patch
Detractors Passives Promoters
Net Promoter Score
34
30
28
24
31
21
19
34
42
31
NPS
Although an increase of 6% since last quarter
‘Good staff / workmen’ was the main promoter reason Q2 (20% - 3)
An decrease of 4% since last quarter
‘Had problems in the past’ was the main detractor reason Q2 (18% - 3)

Conclusions

• Overall Sample• Satisfaction levels remain high with overall satisfaction with Raven
exceeding its target
• KPI’s still below target for window cleaning, communal cleaning services, grounds maintenance and VFM• However, improvements have been seen in all areas during
October• Repairs
• Communication and timescales still an issue
• NPS lowest among the 16-34’s
• High level of satisfaction with repairs service overall, although still lowest among 16-34’s
Conclusions

• Housing• High levels of satisfaction with service, although a decrease in key
scores :
• NPS, 0% among 16-34’s
• Feeling valued
• Home and neighbourhood satisfaction decrease
• Grounds maintenance
Conclusions

• Window cleaning• Attitude of workers remains lowest rated
• Central, South and 35-54’s
• Most dissatisfied with overall quality of window cleaning, although a slight improvement
• Communal cleaning• Needing more time and clean more areas has been highlighted as
an issue again this quarter
• Cleanliness of communal areas received the most dissatisfaction
Conclusions

• Differences between the areas
• Housing services
• Expectations re: cleaning
• Value for money
• Lower satisfaction for grounds maintenance
• Lower satisfaction among the younger residents
Key Areas of Focus - Introduction

• Differences between the areas• Still significant differences by area, mainly higher in the South, lower in
the North. Although vice versa for Housing services• What are the reasons for these differences?• Can we learn anything from the South?
• Decrease for housing services• Housing services has seen a decrease for most key scores;
• Communication issues such as Raven don’t listen to residents and keep in contact, expensive property and improve homes highlighted – how can these areas be addressed?
• Expectations re: cleaning• Still work to do to set expectations / keep people informed re cleaning.
What is the best way to do this?
Key Areas of Focus

• Value for money• Value for money – again can expectations be set (compared to the
private sector) or breakdown of costs explained?
• Lower satisfaction for grounds maintenance• Grounds maintenance received lower scores in the South and issues in
relation to the quality work such as removing the weeds and cut grass• Feedback to Burleys ready for March
• Lower satisfaction among the younger residents• Younger residents still feel less valued and least satisfied
• How can we understand them and deliver to their needs?
Key Areas of Focus

• From November we are including property type and tenancy length to the survey so we can begin to analyse in more depth any potential links between this and the key scores
• Are they any other aspects we need to consider which may have an impact on scores?
Next steps

48 Leazes Park RoadNewcastle Upon TyneNE1 4PGT 0191 261 [email protected]