customer satisfaction index of singapore 2018 · retail and info-communications sectors were...
TRANSCRIPT

CUSTOMER SATISFACTION INDEX OF SINGAPORE 2018
FULL YEAR RESULTS OVERVIEW
Q4 FINDINGS FOR FINANCE & INSURANCE AND HEALTHCARE
CSISG 2018 FULL YEAR AND FOURTH QUARTER OVERVIEW
The Customer Satisfaction Index of Singapore (CSISG) computes customer satisfaction scores at the national, sector, sub-sector, and company levels. The CSISG serves as a quantitative benchmark of the quality of goods and services produced by the Singapore economy over time and across countries. The fourth quarter results mark the end of measurement for CSISG 2018. Singapore’s 2018 national score was computed using the data collected during these four quarters.
FULL YEAR RESULTS HIGHLIGHTS
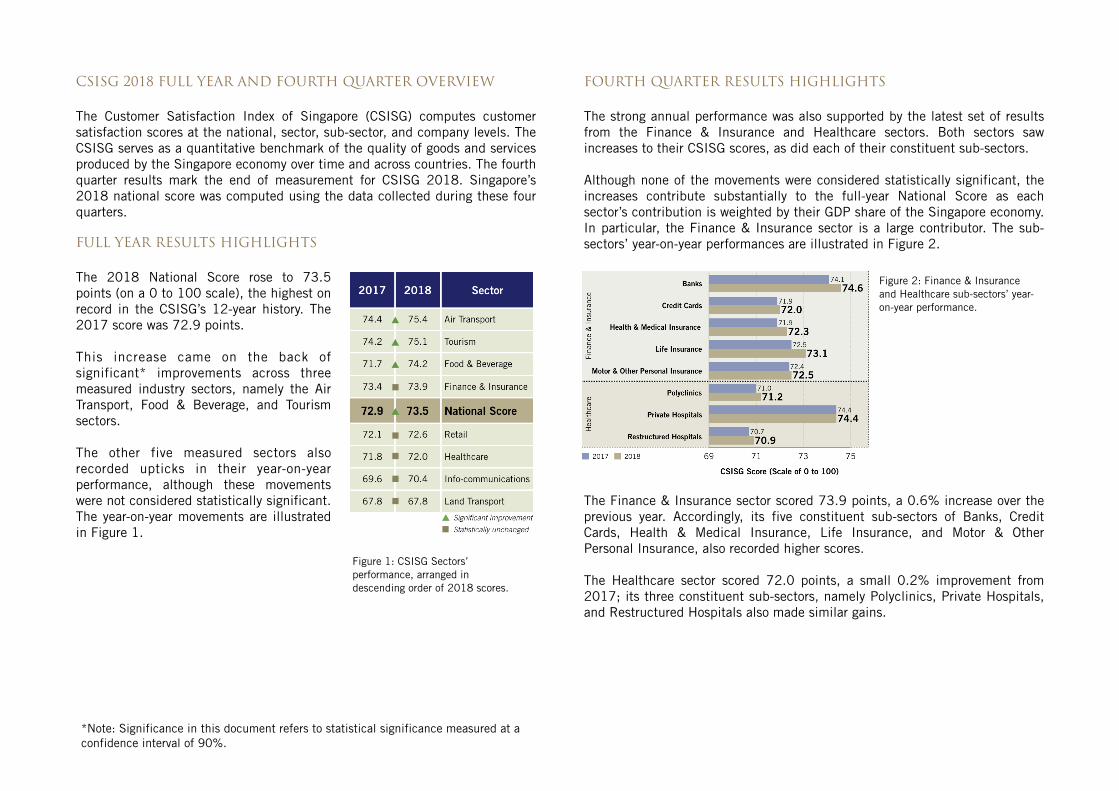
The 2018 National Score rose to 73.5 points (on a 0 to 100 scale), the highest on record in the CSISG’s 12-year history. The 2017 score was 72.9 points.
This increase came on the back of significant* improvements across three measured industry sectors, namely the Air Transport, Food & Beverage, and Tourism sectors.
The other five measured sectors also recorded upticks in their year-on-year performance, although these movements were not considered statistically significant. The year-on-year movements are illustrated in Figure 1.
FOURTH QUARTER RESULTS HIGHLIGHTS
The strong annual performance was also supported by the latest set of results from the Finance & Insurance and Healthcare sectors. Both sectors saw increases to their CSISG scores, as did each of their constituent sub-sectors.
Although none of the movements were considered statistically significant, the increases contribute substantially to the full-year National Score as each sector’s contribution is weighted by their GDP share of the Singapore economy. In particular, the Finance & Insurance sector is a large contributor. The sub-sectors’ year-on-year performances are illustrated in Figure 2.
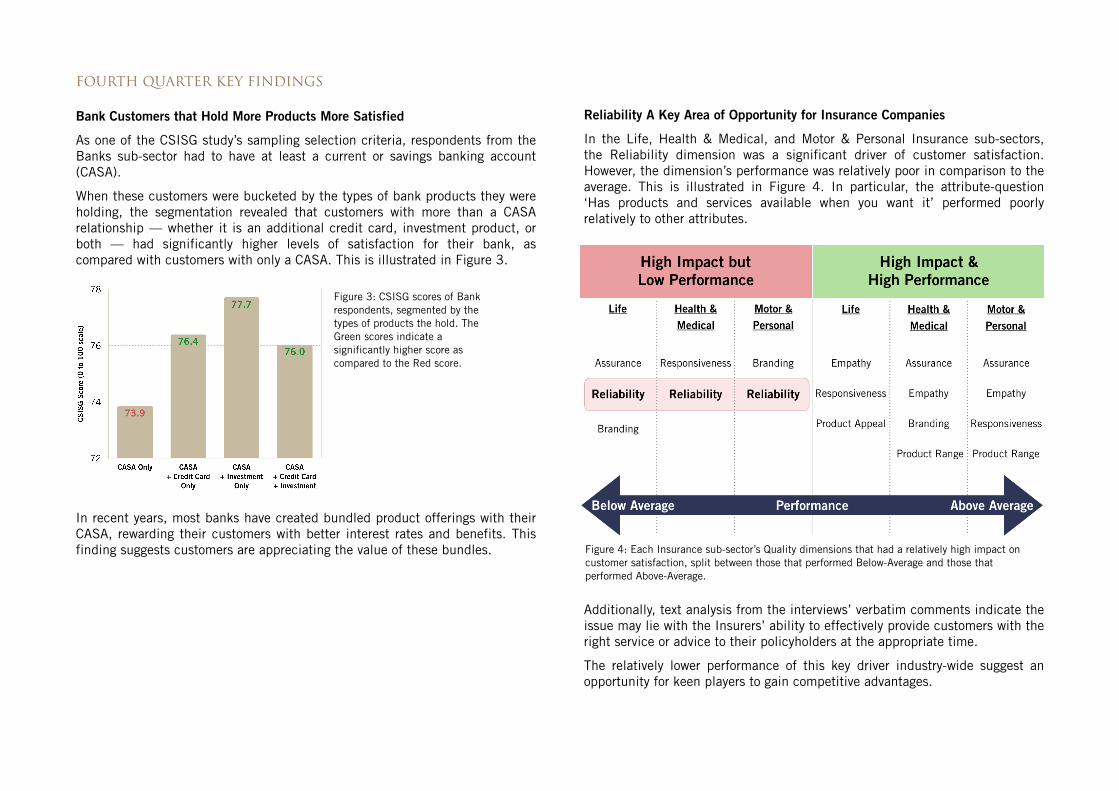
The Finance & Insurance sector scored 73.9 points, a 0.6% increase over the previous year. Accordingly, its five constituent sub-sectors of Banks, Credit Cards, Health & Medical Insurance, Life Insurance, and Motor & Other Personal Insurance, also recorded higher scores.
The Healthcare sector scored 72.0 points, a small 0.2% improvement from 2017; its three constituent sub-sectors, namely Polyclinics, Private Hospitals, and Restructured Hospitals also made similar gains.
Figure 1: CSISG Sectors’ performance, arranged in descending order of 2018 scores.
*Note: Significance in this document refers to statistical significance measured at a confidence interval of 90%.
Figure 2: Finance & Insurance and Healthcare sub-sectors’ year-on-year performance.
FOURTH QUARTER KEY FINDINGS
Bank Customers that Hold More Products More Satisfied
As one of the CSISG study’s sampling selection criteria, respondents from the Banks sub-sector had to have at least a current or savings banking account (CASA).
When these customers were bucketed by the types of bank products they were holding, the segmentation revealed that customers with more than a CASA relationship — whether it is an additional credit card, investment product, or both — had significantly higher levels of satisfaction for their bank, as compared with customers with only a CASA. This is illustrated in Figure 3.
In recent years, most banks have created bundled product offerings with their CASA, rewarding their customers with better interest rates and benefits. This finding suggests customers are appreciating the value of these bundles.
Reliability A Key Area of Opportunity for Insurance Companies
In the Life, Health & Medical, and Motor & Personal Insurance sub-sectors, the Reliability dimension was a significant driver of customer satisfaction. However, the dimension’s performance was relatively poor in comparison to the average. This is illustrated in Figure 4. In particular, the attribute-question ‘Has products and services available when you want it’ performed poorly relatively to other attributes.
Additionally, text analysis from the interviews’ verbatim comments indicate the issue may lie with the Insurers’ ability to effectively provide customers with the right service or advice to their policyholders at the appropriate time.
The relatively lower performance of this key driver industry-wide suggest an opportunity for keen players to gain competitive advantages.
Figure 3: CSISG scores of Bank respondents, segmented by the types of products the hold. The Green scores indicate a significantly higher score as compared to the Red score.
Figure 4: Each Insurance sub-sector’s Quality dimensions that had a relatively high impact on customer satisfaction, split between those that performed Below-Average and those that performed Above-Average.

Satisfaction with Doctors and Nurses at Hospitals Significantly Improved
Satisfaction with doctors and nurses saw year-on-year improvements, particularly in the Private and Restructured Hospitals sub-sectors. This is illustrated in Figure 5.
These observations was supported by marked improvements to patients’ satisfaction with how these medical staff explained their diagnosis and condition, and how treatments were administered or suggested.
While these Healthcare sub-sectors saw only a small uptick in overall CSISG performance, several measured attributes in each of the Healthcare sub-sectors saw improvements over the previous year. These developments, along with the capacity being progressively added to Singapore’s healthcare landscape, suggest the patient experience should continue to improve over time.
Waiting Remains An Issue for the Healthcare sector
Similar to previous years, patient satisfaction with Waiting Time or Experience continued to be key drivers of CSISG performance. As illustrated in Figure 6, Waiting Time or Experience was the most important driver of satisfaction for all three of the Healthcare sub-sectors.
Unfortunately, these attributes also continued to be among the most poorly rated metrics; the Waiting Time attribute was the lowest rated attribute in all the three sub-sectors.
However, year-on-year upticks in the Waiting Time and Waiting Experience ratings have been observed across the board. In fact, the improvement in Waiting Time for Restructured Hospitals was statistically significant. These movements suggest Healthcare administrators are cognisant of patients’ perennial bugbear.
Specific industry sector results and findings from the previous three quarters of CSISG 2018 can be accessed from the ISE website at ise.smu.edu.sg.
Figure 5: Satisfaction ratings for doctors and nurses, year-on-year. A Green arrow indicates a significant improvement.
Figure 6: The three most important attributes to improve patient satisfaction, for each of the Healthcare sub-sectors. Waiting Time/Experience continue to be the dominant driver.

CSISG BACKGROUND
CSISG scores are generated based on the econometric modelling of survey data collected from end-users after the consumption of products and services.
Company scores are weighted based on a separate incidence study. This incidence study helps determine each company’s sample profile and the local-tourist weights. Sub-sector scores are derived as a weighted average of company scores, in proportion to the local and tourist incidence interactions with the constituent companies. Sector scores are derived by aggregating the sub-sector scores proportionately to each sub-sector’s revenue contributions. Finally, the national score is weighted according to each sector’s contribution to GDP. CSISG scores customer satisfaction on a scale of 0 to 100 with higher scores representing better performance.
Under a quarterly measure-and-release system, distinct sectors are measured each quarter with their results released the following quarter. Companies in the Retail and Info-Communications sectors were measured in the first quarter, Air Transport and Land Transport in the second quarter, Food & Beverage and Tourism sectors in the third quarter, and finally the companies of Finance & Insurance and Healthcare sectors, in the fourth quarter.
CSISG 2018 Q4 marks the end of measurement for 2018. The CSISG 2018 national score was computed using the data collected during these four quarters.
The Finance & Insurance sector comprises of the Banks sub-sector, Credit Cards sub-sector, Health & Medical Insurance sub-sector, Motor & Other Personal Insurance sub-sector, and Life Insurance sub-sector. The Healthcare sector consists of the Private Hospitals sub-sector, Restructured Hospitals sub-sector, and Polyclinics sub-sector.
CSISG 2018 FIELDWORK
Survey data for the Finance & Insurance and Healthcare sectors was collected between October 2018 and January 2019. This was primarily conducted through face-to-face interviews with Singapore residents at their homes. The survey was also conducted with departing tourists at Changi Airport.
The Q4 fieldwork garnered 9,203 interviews with locals and 380 with departing tourists at the airport. In total, there were 9,583 unique responses covering 82 companies and entities in the Finance & Insurance and Healthcare sectors; 49 entities have published scores.
In 2018, a total of 29,632 unique responses were recorded. This comprised of 21,892 face-to-face interviews with Singapore residents and 7,740 interviews with tourists at Changi Airport. In all, the study covered 627 companies and entities, with 173 entities having published scores.

75.4 Air Transport 78.0 Airport* 78.0 Changi Airport 74.5 Full Service Airlines 78.1 Singapore Airlines*76.4 Garuda Indonesia*75.6 Emirates74.7 Cathay Pacific73.9 Qantas73.1 SilkAir71.6 Other full service airlines
73.1 Budget Airlines 75.3 Scoot72.4 Jetstar Asia72.2 AirAsia69.9 Lion Air70.5 Other budget airlines
74.2 Food & Beverage
75.3 Snack Bars & Food Kiosks74.5 Old Chang Kee71.7 Jollibean75.8 Other snack bars & food kiosks
74.4 Restaurants76.9 TungLok Signatures*75.2 Crystal Jade Kitchen74.9 Soup Restaurant74.7 Fish & Co74.6 Boon Tong Kee74.6 Thai Express74.5 Sakae Sushi74.5 Din Tai Fung74.5 Swensen’s74.2 Jack’s Place74.2 Astons74.1 Ajisen Ramen74.0 Manhattan Fish Market73.8 Sushi Tei 73.8 Seoul Garden73.6 Crystal Jade La Mian Xiao Long Bao73.0 Dian Xiao Er72.7 Nando’s72.0 Pizza Hut 71.6 Xin Wang Hong Kong Cafe 75.2 Other restaurants
73.9 Cafes & Coffee Houses75.6 Starbucks72.3 Ya Kun71.4 Toast Box74.2 Other cafes & coffee houses
73.6 Fast Food Restaurants74.9 McDonalds74.2 Burger King72.7 KFC71.9 Mos Burger71.9 Subway72.1 Other fast food restaurants
73.9 Finance & Insurance
74.6 Banks*75.3 Citibank 75.1 DBS74.5 OCBC73.8 HSBC73.5 Maybank73.2 Standard Chartered72.6 UOB71.3 Other banks
75.1 Tourism
75.3 HotelsLuxury & Upscale Hotels75.7 The Ritz-Carlton75.5 Marina Bay Sands74.9 Grand Hyatt74.7 Pan Pacific Singapore74.4 Shangri-La74.0 Hotel Michael73.2 Marina Mandarin73.1 Mandarin OrchardEconomy Hotels71.3 Fragrance Hotel70.6 Hotel 81
75.8 Other hotels
74.1 Attractions75.6 Sentosa74.7 Singapore Zoo74.4 Gardens By The Bay74.2 Jurong Bird Park73.9 Singapore Flyer73.9 River Safari73.6 S.E.A. Aquarium73.1 Universal Studios72.8 Night Safari72.8 Adventure Cove70.9 Singapore Discovery Centre72.0 Other attractions
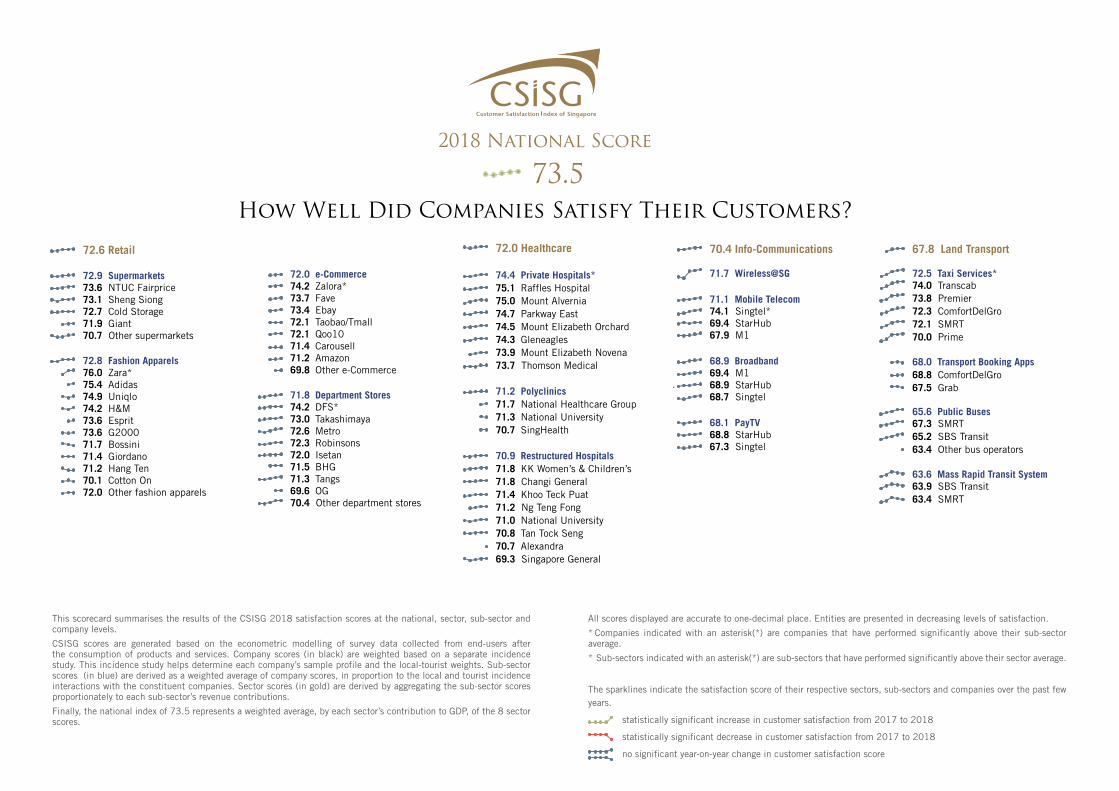
2018 National Score
73.5How Well Did Companies Satisfy Their Customers?
73.1 Life Insurance75.0 Great Eastern*73.8 AIA73.3 NTUC Income72.8 Prudential70.8 Aviva70.8 Other life insurers
72.5 Motor & Other Personal Insurance73.5 AXA73.5 AIG73.3 NTUC Income71.7 Other motor & personal insurers
72.3 Health and Medical Insurance73.0 Prudential72.7 AIA72.1 Great Eastern71.6 NTUC Income71.8 Other health & medical insurers
72.0 Credit Cards73.1 Citibank72.9 American Express72.7 DBS72.3 Maybank72.1 UOB71.6 HSBC71.4 OCBC70.1 Other credit cards
1
2018 National Score
73.5How Well Did Companies Satisfy Their Customers?
72.6 Retail
72.9 Supermarkets 73.6 NTUC Fairprice 73.1 Sheng Siong 72.7 Cold Storage 71.9 Giant 70.7 Other supermarkets
72.8 Fashion Apparels 76.0 Zara* 75.4 Adidas 74.9 Uniqlo 74.2 H&M 73.6 Esprit 73.6 G2000 71.7 Bossini 71.4 Giordano 71.2 Hang Ten 70.1 Cotton On 72.0 Other fashion apparels
72.0 Healthcare
74.4 Private Hospitals*75.1 Raffles Hospital75.0 Mount Alvernia74.7 Parkway East74.5 Mount Elizabeth Orchard74.3 Gleneagles73.9 Mount Elizabeth Novena73.7 Thomson Medical
71.2 Polyclinics71.7 National Healthcare Group71.3 National University70.7 SingHealth
70.9 Restructured Hospitals71.8 KK Women’s & Children’s71.8 Changi General71.4 Khoo Teck Puat71.2 Ng Teng Fong71.0 National University70.8 Tan Tock Seng70.7 Alexandra69.3 Singapore General
70.4 Info-Communications 71.7 Wireless@SG
71.1 Mobile Telecom 74.1 Singtel* 69.4 StarHub 67.9 M1
68.9 Broadband 69.4 M1 68.9 StarHub 68.7 Singtel
68.1 PayTV 68.8 StarHub 67.3 Singtel
72.0 e-Commerce 74.2 Zalora* 73.7 Fave 73.4 Ebay 72.1 Taobao/Tmall 72.1 Qoo10 71.4 Carousell 71.2 Amazon 69.8 Other e-Commerce
71.8 Department Stores 74.2 DFS* 73.0 Takashimaya 72.6 Metro 72.3 Robinsons 72.0 Isetan 71.5 BHG 71.3 Tangs 69.6 OG 70.4 Other department stores
All scores displayed are accurate to one-decimal place. Entities are presented in decreasing levels of satisfaction.
* Companies indicated with an asterisk(*) are companies that have performed significantly above their sub-sector average.
* Sub-sectors indicated with an asterisk(*) are sub-sectors that have performed significantly above their sector average.
The sparklines indicate the satisfaction score of their respective sectors, sub-sectors and companies over the past few years.
statistically significant increase in customer satisfaction from 2017 to 2018
statistically significant decrease in customer satisfaction from 2017 to 2018
no significant year-on-year change in customer satisfaction score
This scorecard summarises the results of the CSISG 2018 satisfaction scores at the national, sector, sub-sector and company levels.
CSISG scores are generated based on the econometric modelling of survey data collected from end-users after the consumption of products and services. Company scores (in black) are weighted based on a separate incidence study. This incidence study helps determine each company’s sample profile and the local-tourist weights. Sub-sector scores (in blue) are derived as a weighted average of company scores, in proportion to the local and tourist incidence interactions with the constituent companies. Sector scores (in gold) are derived by aggregating the sub-sector scores proportionately to each sub-sector’s revenue contributions.
Finally, the national index of 73.5 represents a weighted average, by each sector’s contribution to GDP, of the 8 sector scores.
67.8 Land Transport 72.5 Taxi Services* 74.0 Transcab73.8 Premier72.3 ComfortDelGro72.1 SMRT70.0 Prime
68.0 Transport Booking Apps 68.8 ComfortDelGro 67.5 Grab 65.6 Public Buses 67.3 SMRT65.2 SBS Transit63.4 Other bus operators 63.6 Mass Rapid Transit System 63.9 SBS Transit63.4 SMRT
2

contact us
For more details on the CSISG, the ISE Corporate Membership programme, and customised research, please reach us at
Institute of Service Excellence Singapore Management University
81 Victoria Street Tel: +65 6828 0111 Administration Building Fax: +65 6828 0690 Singapore 188065 Email: [email protected]
ise.smu.edu.sg
Supported by