customer relations management and productivity …
TRANSCRIPT

CUSTOMER RELATIONS MANAGEMENT AND PRODUCTIVITY
IN SELECTED HOTELS IN NAKAWA DIVISION,
KAMPALA DISTRICT
UGANDA
BY
NAUME KWAKUNDA
1165-05014-10287
~I ~ji_~
‘I
A RESEARCH REPORT
SUBMITTED TO THE COLLEGE OF ECONOMICS AND MANAGEMENT
KAMPALA INTERNATIONAL UNIVERSITY
KAMPALA, UGANDA
IN PARTIAL FULFILLMENT OF THE REQUIREMENTS FOR THE AWARD
OF DEGREE OF BACHELOR OF BUSINESS ADMINISTRATION

DECLARATION A
I Naume Kwakunda declare that this research report is my original work and has not
been presented for a degree or any other academic award in any University or Institution
of Learning.
Signature . ‘.
DateS

DECLARATION B
We confirm that the work reported in this Research report has be carried out by the
candidate under our supervision”.
Mr Richard Masaaba
Signature: Date~
Mr Rwabuhiihi Festus
Signature Date~
3
DEDICATION
I dedicate this research report to the God Almighty, my parents Mr. and Mrs. Mujuni
Moses Mugarura and Mable, friends, family and my lecturers who supported me in the
best ways possible during the course of my studies. May the good Lord bless you
abundantly.
4
ABSTRACT
This study established the relations between customer relations management and level of
productivity in selected hotels in selected divisions in Nakawa Kampala, central Uganda.
The study was guided by four objectives, (i) profile of respondents (ii) extent of
customer relations (iii)) level of productivity and (iv) whether there was significant
relationship in the extent of customer relations and level of productivity in selected hotels
in selected divisions in Nakawa Kampala, central Uganda. A survey design was used
specifically descriptive correlation and descriptive comparative. Data were collected from
109 respondents using self-administered questionnaires as the key data collection
instruments. The findings revealed that customer relations was very high, high level of
business productivity, no significant difference between customer relations and level of
productivity and no significant relationship between customer relations and level of
productivity was established, accepting the Null hypothesis. From the above findings
appropriate conclusions, recommendations and areas for further research were made.
Conclusions were made regarding various research objectives (i) on profile of
respondents, majority were of age group 20-39 (61%), Gender (67%) male and (33%)
female, (84%) of respondents were married, (80%) of respondents had university degrees,
and 61% of respondents had working experience of above 8 years. (ii) Very high
customer relations strategies were used according to respondents (mean 3.70) (iii) High
level of Business productivity was established (mean 3.67), (iv) no significance
difference (F 0.637, sig. = 0.811), (v) no significant relationship between customer
relations and productivity was established (r 0.280, sig. = 0.033) and regression
indicated by a high Adjusted R2 of 0.048 was established, recommendations based on the
findings were that, selected hotels should; (i) develop marketing plans, (ii) improve
branding, (iii)develop proper packaging (ix) improve marketing communications (v)
segment and target markets (vi) improve on their distribution strategy, (vii) improve
product strategy management, (viii) innovativeness and creativity be improved (ix) carry
out marketing research (x) improve on completive intelligence (xi) develop quality
products and services (xii) and establish good relationships with customers. Areas of
further research were suggested as impact of new marketing communications
5
technologies (ICTS) on communication effectiveness, further research on branding and
level of productivity was also suggested.
DECLARATION A 2
DECLARATION B 3
ABSTRACT 5
CHAPTER ONE 7
THE PROBLEM AND ITS SCOPE _____________________________________________ 7
Background of the Study ______________________________________________________________ 7Statement of the Problem _________________________________________________________ 10Purpose of the Study ________________________________________________________________ 10Research Objectives ________________________________________________________________________ 11Research Questions ________________________________________________________________________ 11Null Hypothesis 12
Scope 12Geographical Scope ____________________________________________________________________ 12Content Scope 12Theoretical Scope 12Time scope _________________ 13Significance of the Study _____________________________________________________________ 13Operational Definitions of Terms____________________________________________________ 14
CHAPTER TWO 15
REVIEW OF RELATED LITERATURE____________________________________________ 15Concepts, Ideas, Opinions from Authors/Experts ___________________________________________ 15Customer Relation Management _______________________________________________________ 15Theoretical Perspectives_________________________________________________________________ 20Related Studies ______________________________ 21Customer Relations Management and Productivity _______________________________________ 21
CHAPTER THREE 25
METHODOLOGY 25Research Design 25Research Population ________________________________________________________________________ 26Sample Size ________ 26
Sampling Procedures___________________________________________________________ 26
Validity and Reliability of the Instruments_______________________________________ 27Data Analysis _____________________________ 28Ethical Considerations __________________________________________________________________ 28Limitations of the Study _________________________________________________________________ 29
CHAPTER FOUR 30
PRESENTATION, ANALYSIS AND INTERPRETATION OF DATA _______________________ 30
6

Introduction _______________________________________ 30Profile of respondents __________________________________________________________________ 30Extent of customer relationship management _____________________________________________ 32Level of productivity ____________________________________________________________________ 34
CHAPTER FIVE 43
FINDINGS, CONCLUSIONS AND RECOMMENDATIONS__________________________ 43Introduction 43Findings 43Profile of the respondents _______________________________________________________________ 43CONCLUSIONS 45
RECOMMENDATIONS 47
SUGGESTED AREAS FOR FURTHER RESEARCH___________________________ 48
REFERENCES 49
CHAPTER ONE
THE PROBLEM AND ITS SCOPE
Background of the StudyGlobally, in the mid-twentieth century, mass production techniques and mass
marketing changed the competitive landscape by increasing product availability for
consumers. However, the purchasing process that allowed the shopkeeper and customer
to spend quality time interacting with each other was also fundamentally changed. As a
result, customers lost their uniqueness becoming an “account number”. Shopkeepers lost
track of their customers’ individual needs as the market became full of product and
service options.
Many companies today are striving to re-establish their connections to new as
well as existing customers to boost long-term customer loyalty (Chen & Popovich, 2003).
Nowadays, hospitality industry is encouraged to adopt Customer relationship
management (CRM) to maintain relationship with their targeted customers. The world
has come full circle from selling to marketing and from seller’s market to buyer’s market.
The customer today has the option to buy what he thinks he should and from whom,
7

being in his best interest. Product development, technological improvement, cost
optimization and excellent service facility are very important for any organisation but
their importance is only if the customer appreciates it. For example, both diamond and
coal are carbon but they are priced differently due to different valuations by the customer.
Therefore, any business begins and ends with the customer (Sugandhi, 2002).
Thus, service organizations are shifting their focus from “transactional exchange” to
“relational exchange” for developing mutually satisfying relationship with customers.
Extended relationships are reported to have a significant impact on transaction cost and
profitability, and customer lifetime value. Serving the customers, in true sense, is the
need of the hour as the customer was, is and will remain the central focus of all
organizational activities.
The growing realization of keeping the customers that you have is as important as
customer acquisition, has come about because of the cost involved in attracting new
customers. This realization has evolved into understanding customers lifetime values F
Buttle, 2004. The centrality of customer relations management CRM to the Hotels sector
in the contemporary environment of business competition is the dire need to attract and
retain good customers. For this to happen there must be a deliberate customer relations
system that ensures customer satisfaction swift, (Payne, 2001:12).
Inadequate customer relationship management has led some companies to fail in
retaining and attracting good clients. The purpose of CRM is to improve marketing
productivity (Sheth & Sisodia, 1995). A sound base of satisfied customers allows the
organization to move on the path of growth, enhance productivity, fight out competition
and carve a niche in the market place (Bennett, 1996).
The process of industrialization which began in Britain in the eighteenth century
brought an unprecedented period of productivity growth. In America, productivity growth
resulted from the exploitation of natural resources and was further accelerated after the
Civil War by enhancing human capital through the education system. Indeed, there was
technology progress between 1929 and 2008 but the technology progress neither speeded
up nor diminished. Since 1929, Americans have enjoyed relatively fast productivity
8
growth. From the end of the 1920s to the beginning of the 1970s, the American living
standard doubled.
It has been suggested that this is the result of the huge size of the American
economy which allowed the exploitation of scale economies, investment in human
capital, the removal of social barriers, and World War II which destroyed Europe but not
America. The productivity of Canada actually gained 15 percent of and converged to the
States’ productivity during this period. After 1973, however, the growth in productivity
slowed down in developed countries. The United States’ labor productivity growth in
1974 fell to 1.4 from 3.5 percent the previous year, marking the beginning of a long
period of stagnation that lasted two decades.
Productivity growths will no longer rely on human labor but on computational
technology for the integration of data mining, energy management, and knowledge-based
systems design (Tzu-Ching 2005). The focus on revenue in hotel businesses has been one
of the most common issues in the industry ever since it has begun. However, the
accounting professionals should be aware that the financial measures might not meet the
needs of this type of industry which is so dynamic. We cannot blame the people who
concentrate on profits and occupancy rates though. This is because this type of approach
has originated in the classification of relationships amongst the economic factors in the
hospitality industry. For several years, many of them believed that there is a relationship
between the price of the hotel property and the room rates. Today, we see that hotel
efficiency reflects more on a sophisticated understanding between the relationship of
profitability and productivity (Sam miller, 2007).
According to Bose 2002, p.1 5 CRM is defined as “an enterprise wide integration
of technologies and functions such as data warehouse, Websites, intranet/extranet,
telephone support system, accounting, sales, marketing and production”. According to
Swift 2001, p.16 CRM is defined as “an enterprise approach for understanding and
influencing customer behavior through meaningful communications in order to improve
customer acquisition, customer retention, customer loyalty and customer profitability”.
Freeman, 2008 Productivity is a measure of the efficiency of production. Productivity is a
ratio of production output to what is required to produce it inputs. The measure of
productivity is defined.as a total output per one unit of a total input. The benefits of high
9
productivity are manifold. At the national level, productivity growth raises living
standards because more real income improves people’s ability to purchase goods and
services, enjoy leisure, improve housing and education and contribute to social and
environmental programs. Productivity growth is important to the firm because it means
that the firm can meet its perhaps growing obligations to customers, suppliers, workers,
shareholders, and governments taxes and regulation, and still remain competitive or even
improve its competitiveness in the market place.
Statement of the ProblemLow productivity within service industries especially the issues relating to profitability,
labour retention and sustainability of hotel sector has been a major concern. In Nakawa,
division, this situation has not been any different for both small, medium to large hotel
facilities (Payne, 2009). Due to this situation, many hotels are experiencing high rate of
collapse, labour turn over and high operational costs including loss of vital customers
(Payne, 2009). Poor management, customer care and in adequate hotel sector experience
amongst others are likely to blame for the above situation. In the entire above scenario,
there is always a problem on the role of customer relations management in improving the
productivity of these hotels in Nakawa division. Therefore, this study intends to assess
the contribution of customer relations management to the Productivity of selected Hotels
in Nakawa Division.
Purpose of the StudyThe purposes of this study will be:
1. To identify the strength and weakness of respondents in terms of customer
relations management and productivity of selected Hotels in Nakawa Division.
2. To validate the dynamic structural model by Franses (2005).
3. To test the null hypothesis of no significant relationship between customer
relations management and productivity of selected Hotels in Nakawa
Division
4. To identify existing gaps and contribute to existing knowledge by filling
the gaps identified.
10
Research Objectives
Gener&: This study will determine the correlation between customer relations
management and productivity of selected Hotels in Nakawa Division of Kampala District
Specific: it will seek in this study the following:
i. To determine the profile of the respondent in terms of~
a. Gender
b. Age
c. Educational Qualifications
d. Years of Experiences
ii. To determine the extent of Customer Relations Management (customer feedback,
customer knowledge, customer information management and repeat
purchases) in selected hotels in Nakawa Division of Kampala District.
iii. To determine the level of productivity (market share, quality of services, customer
satisfaction, employee satisfaction, and owners satisfaction) in selected hotels
in Nakawa Division of Kampala District.
iv. To determine the significance difference between the extent of customer relations
management and productivity of selected Hotels in Nakawa Division of
Kampala District.
v. To establish whether there is significant relationship between customer relations
management and productivity of selected Hotels in Nakawa Division of
Kampala District.
Research QuestionsThis study will seek to answer the following research questions:
What is the profile of the respondent in terms of;
a) Gender?
b) Age?
c) Educational Qualifications?
d) Years of Experiences?
ii. What is the extent of Customer Relations Management (market share, quality of
services, customer satisfaction, employee satisfaction, and owner’s satisfaction) in
selected hotels in Nakawa Division of Kampala District.?
iii. What is the level of productivity (market share, quality of services, customer
satisfaction, employee satisfaction, and owner’s satisfaction) in selected hotels in
Nakawa Division of Kampala District.?
iv. What is the significant difference between customer relations management and
productivity of selected Hotels in Nakawa Division of Kampala District?
v. What is the significant relationship between customer relations management and
productivity of selected Hotels in Nakawa Division of Kampala District?
Null Hypothesisi. There is significant relationship between customer relations management and
productivity of selected Hotels in Nakawa Division of Kampala District.
Scope
Geographical ScopeThe study will be carried out in selected hotels in Nakawa division of Kampala District,
which is located about 10 kilometers from the city centre.
This is chosen because it is one of the first growing divisions of Kampala city. There are
many old and new hotels in the area ranging from retail shops, supermarkets and most
importantly mushrooming hotels and restaurants among others. Finally, this area is
accessible and convenient to the researcher.
Content ScopeThe study will intend to examine the extent of customer relations management,
level of productivity and the relationship between customer relations management
(independent variable) and productivity of selected hotels (Dependent variable).
Theoretical ScopeThis study was based on Dynamic structural model was developed by Franses, (2005)
which suggests that one needs to use multiple services and products to raise customer
12

switching costs over time suggests that this model might be useful foundation for
structural models describing customer behaviors in the context of multi-category buying,
especially when these needs are natural results of changes in the consumer life stage or
future rewards (e.g., loyalty programs). In this model, customer relation management
implementation entails the following tactical steps in order to create a realistic profile on
the spending and stay patterns of the guests, thereby allowing the hotel to formulate
guest-centric marketing for increased loyalty and spending. The idea of ‘cherry picking’
valuable clients and directing more resources to these clients has gained tremendous
significance in the hotel industry.
Time scopeThis study will cover a time scope of one year from 2012 and 2013.This one year
considered will provide enough data to assess the contribution of Customer Relation
Management and Productivity.
Significance of the StudyThis study focuses on assessing the contribution of customer relations management and
the productivity of selected Hotels in Nakawa division, Kampala. The findings of the
study will of benefit to the following;
Management and staff of Hotels: The findings of the research will be of benefit to
the management of staff of hotels so that they can improve on customer satisfactions and
productivity in general.
Government and Policy Makers: Government planners and policy makers will
benefit from the research findings so that to enhance their annual planning and focus in
terms of improving revenue and employment generation in Hotel sector.
Future researchers and Academics: The study might be used by academicians as
reference for further studies to be conducted in Hotels sectors. The study will be
beneficial to the researcher in earning a Master’s degree in Business Administration.
Community in General: The study may also benefit communities through
employment and creation market for their produce to the hotel sector in efforts aimed at
improving their livelihoods.
I.-,13

Operational Definitions of TermsProfile of the respondents is attributes looked for in this study in terms of gender, age,
educational qualifications and years of experiences.
Customer is a person or organization that buys goods or services from a store or other
business.
Relation is the way in which people are connected.
Management is the process of dealing with or controlling things or people.
Customer relations management is the core business strategy that integrates internal
processes and functions, and external networks, to create and deliver value to targeted
customers at a profit.
Productivity is the measure of the efficiency of a person, machine, factory, system, etc.,
in converting inputs into useful outputs
14

CHAPTER TWO
REVIEW OF RELA TED LITERATURE
Concepts, Ideas, Opinions from Authors/Experts
Customer Relation ManagementCustomer Relationship Management (CRM) “is the core business strategy that
integrates internal processes and functions, and external networks, to create and deliver
value to targeted customers at a profit (Buttle, 2004).
Customer relationship management is a business strategy to identify, cultivate,
and maintain long-term profitable customer relationships (Winer (2001). It requires
developing a method to select your most profitable customer relationships or those with
the most potential and working to provide those customers with service quality that
exceeds their expectations.
McDonald,(2002) argued that a comprehensive customer relationship
management is a collection of integrated components such as customer service 0800
numbers, faxback/customer comments cards, e-mail, FAQ, frequency, loyalty and reward
programmes, customization and community building e.g. virtual communities.
Customer Relationship Management is a comprehensive strategy and process of
acquiring, retaining, and partnering with selective customers to create superior value for
the company and the customer (Dyche, 2002). It involves the integration of marketing,
sales, customer service, and the supply-chain functions of the organization to achieve
greater efficiencies and effectiveness in delivering customer value.
Customer relationship management can be regarded as the art of employing
rhetorical, experimental and personal information in order to personalize customers’ stay
while creating incremental revenue opportunities (Buttle, 2004). So for example,
knowing that a customer had a less than memorable experience in the hotel provides the
hotel manager with a chance to win them back the next time they are in town. By use of
customer relationship management, the hotel can develop a comprehensive guest profiles
for reservation information. This demonstrates to guests that the hotel is in touch with
their needs. It can also drive customer-centric data down to the transaction level, thereby
15
allowing the workers and the guest-facing technology to deliver greater value to the
customers.
Customer Relation Management refers to all business activities directed towards
initiating, establishing, maintaining, and developing successful long-term relational
exchanges Reinartz & Kumar, (2000).
Kalakota & Robinson (2000) defined “Customer Relation Management” as an
integrated sales, marketing and service strategy that prevents “lone showmanship” and
relies on coordinated actions, while CoIdwell 1998 defined Customer Relation
Management as a combination of business processes and technology.
Productivity
Productivity is the quantity of output formed by one unit of production input in a unit of
time (Buttle, 2004). Inputs used in the production of the goods and services are the major
determinants of any country’s productivity they are also called factors of production.
There are four major determinants of productivity of any country’s economy.
Land: the land itself’, and raw materials such as oil and minerals beneath it. The natural
resources that is available without alteration or effort on the part of humans. Land as a
resource includes only unique fertility and mineral deposits, topography, climate, water
and vegetation. The reward for letting others use land is called rent.
Labor: In order to produce the things, a human resource must be used. Human
resources consist of the productive aid of labor made by individuals who work—for
instance, miners, artists, and professional baseball players. The contribution of labor to
the production process can be amplified. Whenever potential workers obtain schooling
and training and whenever actual workers acquire new skills, labor’s contribution to
productive output will raise. In other words it is human effort, mental or physical. The
reward to labor is label wages.
Capital: When labor is applied to land to grow wheat, for instance, something else is
used. Generally it is a plow or a tractor. That is to say, land and labor are shared with
manufactured resources in order to produce the things that we need. These manufactured
resources are called capital, which consists of machines, buildings, and tools.
Additionally, capital consists of enhancement to natural resources, such as irrigation
16

ditches. Money is used to buy factors of production — it is not a factor itself. The return
for investing in capital is called interest.
Enterprise or Entrepreneurship: The fourth factor of production, involving human
resources that carry out the functions of raising capital, organizing, managing, bringing
together other factors of production, and making fundamental business policy decisions.
The entrepreneur is a risk taker, Risk taking activity that utilizes land, labor and capital to
produce goods or services in the expectation of a future return. That reward is term profit
in economics.
For any economy the use and employment of all these factors is necessary and each of
their contribution effect productivity. Thus all of these factors determine the output and
productivity of any country.
Productivity measures the efficiency and effectiveness with which resources are
used in economic activity (Farrell, 1957). Efficiency comprises two components:
technical efficiency which reflects the ability of a firm to obtain maximal output from a
given set of inputs, and allocative efficiency which is a reflection of how a firm uses the
inputs in optimal proportion given their respective prices and the production - 1 -
technology.
Productivity is defined as the relation between output and input, in other words, a
ratio of output to input (Atkinson,et al, 1995). Some argue that productivity needs to
address both efficiency and effectiveness because an economic activity will not be
productive if it is only efficient but not effective, or vice versa. Some others, however,
use productivity, efficiency and effectiveness interchangeably (Debreu & Koopmans,
1951). Unclearly defined concept and definition of productivity give rise to the
difficulties in productivity measurement and vice versa.
Productivity is an overall measure of the ability to produce a good or service (Debreu &
Koopmans, 1951). More specifically, productivity is the measure of how specified
resources are managed to accomplish timely objectives as stated in terms of quantity and
quality. Productivity may also be defined as an index that measures output (goods and
services) relative to the input (labor, materials, energy, etc., used to produce the output).
As such, it can be expressed as: Hence, there are two major ways to increase
productivity: increase the numerator (output) or decrease the denominator (input), Of
17
course, a similar effect would be seen if both input and output increased, but output
increased faster than input; or if input and output decreased, but input decreased faster
than output (Ed Marilyn M. Helms.2006).
Organizations have many options for use of this formula, labor productivity,
machine productivity, capital productivity, energy productivity, and so on. A productivity
ratio may be computed for a single operation, a department, a facility, an organization, or
even an entire country.
Productivity is an objective concept. As an objective concept it can be measured, ideally
against a universal standard. As such, organizations can monitor productivity for strategic
reasons such as corporate planning, organization improvement, or comparison to
competitors (Buttle, 2004). It can also be used for tactical reasons such as project control
or controlling performance to budget.
Productivity is also a scientific concept, and hence can be logically defined and
empirically observed. It can also be measured in quantitative terms, which qualifies it as a
variable. Therefore, it can be defined and measured in absolute or relative terms.
However, an absolute definition of productivity is not very useful; it is much more useful
as a concept dealing with relative productivity or as a productivity factor.
Productivity is useful as a relative measure of actual output of production
compared to the actual input of resources, measured across time or against common
entities. As output increases for a level of input, or as the amount of input decreases for a
constant level of output, an increase in productivity occurs. Therefore, a “productivity
measure” describes how well the resources of an organization are being used to produce
input.
Productivity refers to an economic measure of output per unit of input. Inputs
include labor and capital, while output is typically measured in revenues and other GDP
components such as business inventories. Productivity measures may be examined
collectively (across the whole economy) or viewed industry by industry to examine
trends in labor growth, wage levels and technological improvement
Productivity is often confused with efficiency. Efficiency is generally seen as the ratio of
the time needed to perform a task to some predetermined standard time. However, doing
unnecessary work efficiently is not exactly being productive. It would be more correct to
18

interpret productivity as a measure of effectiveness (doing the right thing efficiently),
which is outcome-oriented rather than output (Ed Marilyn, 2006).
Productivity improvement can be achieved in a number of ways. If the level of
output is increased faster than that of input, productivity will increase (Stevenson, 1999).
Conversely, productivity will be increased if the level of input is decreased faster than
that of output. Also, an organization may realize a productivity increase from producing
more output with the same level of input. Finally, producing more output with a reduced
level of input will result in increased productivity. Any of these scenarios may be realized
through improved methods, investment in machinery and technology, improved quality,
and improvement techniques and philosophies such as just-in-time, total quality
management, lean production, supply chain management principles, and theory of
constraints. A firm or department may undertake a number of key steps toward
improving productivity. William J. Stevenson, (1999) lists these steps to productivity
improvement:
Develop productivity measures for all operations; measurement is the first step in
managing and controlling an organization.
Look at the system as a whole in deciding which operations are most critical, it is
over-all productivity that is important.
Develop methods for achieving productivity improvement, such as soliciting ideas
from workers (perhaps organizing teams of workers, engineers, and managers),
studying how other firms have increased productivity, and reexamining the way work
is done.
Establish reasonable goals for improvement.
Don’t confuse productivity with efficiency. Efficiency is a narrower concept that
pertains to getting the most out of a given set of resources; productivity is a broader
concept that pertains to use of overall resources. For example, an efficiency
perspective on mowing the lawn given a hand mower would focus on the best way to
use the hand mower; a productivity perspective would include the possibility of using
a power mower.
19
As a cautionary word, organizations must be careful not to focus solely on productivity as
the driver for the organization. Organizations must consider overall competitive ability.
Firm success is categorized by quality, cycle time, reasonable lead time, innovation, and
a host of other factors directed at improving customer service and satisfaction.
Theoretical PerspectivesDynamic structural model was developed by Frances, (2005) which suggests that
one needs to use multiple services and products to raise customer switching costs over
time suggests that this model might be useful foundation for structural models describing
customer behaviors in the context of multi-category buying, especially when these needs
are natural results of changes in the consumer life stage or future rewards (e.g., loyalty
programs). In this model, customer relation management implementation entails the
following tactical steps in order to create a realistic profile on the spending and stay
patterns of the guests, thereby allowing the hotel to formulate guest-centric marketing for
increased loyalty and spending. The idea of ‘cherry picking’ valuable clients and
directing more resources to these clients has gained tremendous significance in the hotel
industry.
It also ensures that management supports and encourages productivity improvement by
considering incentives to reward customers for contributions. Another area of interest
regarding dynamic structural model in customer relationship management is the optimal
allocation of services, such as the outsourcing of inbound services calls (Li, Sun & Zhou,
2004). To guarantee both long term cost efficiency and overall customer satisfaction, a
firm might sacrifice short-term efficiency by strategically assigning a few callers to the
various call centers to learn about their service quality. A better knowledge of service
centers’ efficiencies can reduce future service time and improve overall customer
satisfaction.
20

Related Studies
Customer Relations Management and ProductivityCreation and data mining of a database of customer activity; given the analysis,
decisions about which customers to target, how to target, contact and build relationships
with them; development of personalized customer experiences; channel management for
enabling efficient share of guest knowledge across the organization, so that guests can get
personalized and consistent service at anytime, anyplace, anywhere, any platform;
management of privacy issues; and metrics for measuring the success of Customer
Relation Management (Rance, 2004).
To achieve these, businesses may need to undertake major organizational changes
and transformations at a higher level, whose identification has generated wide interest
and debates. Companies growing towards a genuine 1-to-i customer orientation realize
focus shifts in their balanced score card over time; from a turnover focus towards a guest
life time value focus, from average guest satisfaction to individual loyalty and
commitment, from a task and department centric organization towards a guest need
centric organization, from dispersed learning to a shared and intelligence based learning
(Peelen, 2004).
Fredrick F. Reichheld 1996 put forward that the loyalty of customers, employees and
investors are the essence of success of any business. In order to keep track of their
loyalty, retention and defection rates must carefully be measured. The links between
loyalty and financial results were first documented by Reichheld (2001). Loyalty was
studied as a result of satisfaction see e.g., Scotland & Siguaw, (2004), generally showing
only weak links, and as a separate performance area independent from service
satisfaction, but rather fostered by Customer Relation Management efforts Johnson &
Gustafson, 2000; Mittal et al, (2005).
From a strategic perspective, Winer (2001) described the Customer Relation
Management performance areas, which typically include customer service,
frequency/loyalty programs, customization based on guest profiles, rewards programs
and community building. Shoemaker & Lewis (1999) establish that the hotel industry
currently uses six value-adding or value-recovery strategies to influence loyalty:
21

financial, saving money on future transactions; temporal, saving time e.g.by priority
check-in; functional e.g., check cashing, Web site available; experiential e.g., upgrades or
turndown services; emotional e.g., customer recognition or more pleasurable service
experience; and social e.g., interpersonal link with the hotel.
Mason (2006) validates the financial
and emotional rewards and possible experiential features, but the impact of other
strategies appears to be absent or minimal. Bernstein 1999 explains that conversations
open the door to presenting the hotel’s facilities in a context that is meaningful to the
individual guest. Traditionally, Customer Relation Management efforts are planned along
the guest life cycle Peelen, (2004): exploration profile and inform, growth surpass
expectations, commitment customization and downturn intensive recovery.
Barsky & Nash (2002) differentiate the performance focus for different guest
segments also in terms of relationship inclination and type of loyalty. From a guest
perspective Scanlan (2000) determines the critical relational attributes in the face-to face
service encounter that were most influential in the formation of a service relationship
from the business traveler’s perspective: personalization, social bonding, reliability, and
familiarization. According to Gummesson 2002, the core variables of modern marketing
from a customer perspective are relationships, networks and interactions, which cause the
design of a framework to be complex because of the difficulty to measure their
performance and value.
Peel (2002) argues that early Customer Relation Management efforts made
contacts efficient but killed involvement; new Customer Relation Management efforts
should develop processes, procedures and systems that reestablish local community
tenets in a global and virtual setting. Insider knowledge - often tacit- and reciprocity drive
communication and collaboration in such communities. A sense of togetherness needs to
be established. Forsyth 2001 and Dyche 2002 extensively document the common
roadblocks and causes of failure to achieve CRM benefits; from both a stakeholder,
program planning and change management perspective.
Matta 2003 states that managers use project plans, timelines, and budgets to
reduce “execution risk” - the risk that designated activities won’t be carried out properly -
22

but they inevitably neglect two other critical risks: the “white space risk” that some
required activities won’t be identified in advance, leaving gaps in the project plan, and the
“integration risk’ that the disparate activities won’t come together at the end. They plead
for cross-functional vertical rapid result projects. The Customer Relation
Managernent-7- 18 model of Hermans & Melissen 2008 presents a detailed agenda for
bottom-up, cross-level and cross-department Customer Relation Management strategy
formulation and change towards Customer Relation Management focus CRM service
processes and service support processes.
They identify accountability staff-to-guest allocation and matching allocating appropriate
relationship benefits and communication mix to the appropriate guest as core functions of
operational Customer Relation Management. One of the results of Customer Relation
Management is the promotion of customer loyalty Evans & Laskin, 1994, which is
considered to be a relational phenomenon, Chow & Holden, 1997; Jacoby & Kyner,
(1973); Sheth & Parvatiyar, (1995); cited by Macintosh & Lockshin, 1997.
The benefits of
customer loyalty to a provider of either services or products are numerous, and thus
organizations are eager to secure as significant a loyal customer base as possible Gefen,
(2002). Reinartz et al, (2000). Managers primarily rely on quantitative performance
metrics such as revenue, market coverage, margin, net profit, sales profitability, share of
new customers, life time value, frequency of visit etc., but they increasingly include
qualitative indicators such as customer satisfaction, customer retention or brand
familiarity Reinecken & Reibstein, (2002). Arnbler,& Puntoni, (2002), argues financial
indicators have been criticized as being unsuitable for strategic decisions Kaplan and
Norton, 1992). Loss of customer is loss of business along with the opportunity for
business growth and profitability. Feedback collection from the customer is essential for
the supplier to ascertain customer satisfaction and scope for improvisation Sugandhi,
(2002). Customer relation management is considered to be one of
the most important outcomes of all marketing activities in a market-oriented firm. The
obvious need for satisfying the firm’s customer is to expand the business, to gain a higher
market share, and to acquire repeat and referral business, all of which lead to improved
Li

profitability Barsky, (1992). Relationship’s marketing rational is to enhance long term
profitability by moving from transaction-based marketing and its prominence in attracting
new customers, to customer retention by means of effective management of customer
relationships Christopher et al. (1991).
Hospitality organizations could benefit from focusing more explicitly on the link
between customer relationship management and performance management. A study in
The Netherlands has shown that most hospitality managers support the adoption of a
customer intimacy strategy Frenken, (2004). However, customer centricity is easy to
assert, yet difficult to build Galbraith, (2005). If customer relation management is the
organization’s business strategy or philosophy e.g. Zablah, (2004); Mitussis, (2006);
Hermans & Melissen, (2008), and thus is fully integrated in guest service operations, its
implementation is approached as a process of continuous change in performance areas
critical to ongoing guest relationships and for optimized customer equity and competitive
advantage.
Stone’s findings Alford (2001) also revealed that people, customer management
and detailed measurement are the most critical elements for successful Customer Relation
Management, while ICT was found to act as an enabler only when the previous elements
were in place. Loftness 2001 highlighted the development of measurement processes and
organizational culture around of customer satisfaction. Cline & Warner (1999) also found
that the collection and use of customer information are frequently intermittent, delayed
and fragmented. Bowen (1999) advocated that service business can retain
customers and achieve profitability by building reciprocal relationships founded on
safeguarding and affirming customer security, fairness and self esteem. It requires that
companies view customers as people first and consumers second. Trust, commitment,
ethical practices, fulfillment of promises, mutual exchange, emotional bonding,
personalization and customer orientation have been reported to be the key elements in the
relationship building process (Bejou et al,1998).
Taylor (1992) in service sectors such as: banking, pest control, dry cleaning, and
fast food; found that customer satisfaction has a significant effect on purchase intentions
in all four sectors. Similarly, in the health-care sector, McAlexander et al. (1994) found
that patient satisfaction and service quality have a significant effect on future purchase
24
intentions Kandampully & Suhartanto, (2000). Dev & Olsen
(2000) reported that although hotels capture considerable amount of customer data, those
data are rarely assembled to create useful knowledge about customers. Customer Relation
Management incorporates all the things that organizations use to administer customer
relationships, which also include analysis and capture of client information and analytics
to power that information towards improved sales performance Paul Gillin (2007).
Duggal, Saltzman & Klein (2008) found that the rapid growth in productivity in
the US during the 1 990s is mainly due to intensive investment, both private and public in
R&D. Martinez, Rodriguez & Torres (2008), however, found a so called productivity
paradox, after differentiating the investment of R&D into information and
communication technology ICT and non ICT, the net effect of the non ICT on
productivity is negative in Spain.
CHAPTER THREE
METHODOLOGY
Research DesignThis study will employ the descriptive survey design specifically the descriptive
correlational strategies. It will also be cross-sectional and expost facto.it will be
descriptive in that respondents in the hotels will describe the characteristics of the various
activities. It will be corroletional because it will establish the relationship between the
independent variable and dependent variable. It will be cross sectional because data will
be collected from all respondents within the same period of time. It will be expost facto
as it will involve events that have already taken place and may be related to present
conditions.
25
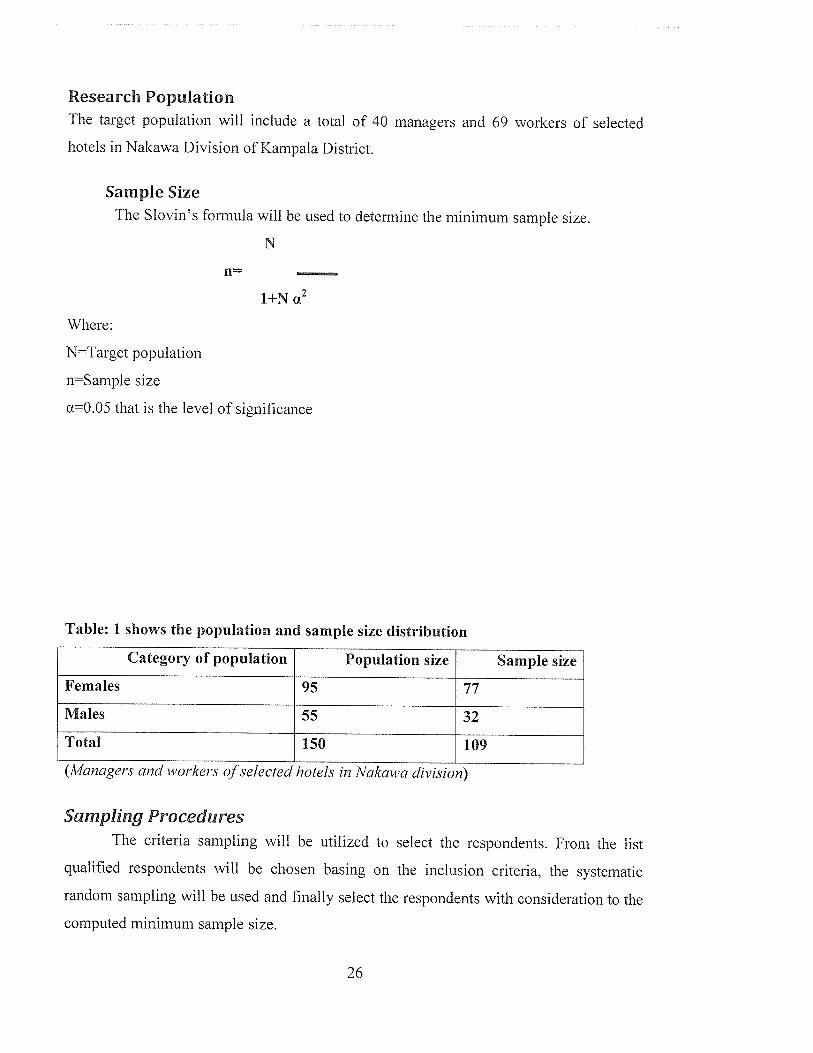
Research PopulationThe target population will include a total of 40 managers and 69 workers of selected
hotels in Nakawa Division of Kampala District.
Sample SizeThe Slovin’s formula will be used to determine the minimum sample size.
11=
N
1+N ~2
Where:
N=Target population
n=Sample size
a~=0.05 that is the level of significance
Table: 1 shows the population and sample size distribution
Category of population Population size Sample size
Females 95 77
Males 55 32
Total 150 109
(Managers and workers ofselected hotels in Nakawa division)
Sampling ProceduresThe criteria sampling will be utilized to select the respondents. From the list
qualified respondents will be chosen basing on the inclusion criteria, the systematic
random sampling will be used and finally select the respondents with consideration to the
computed minimum sample size.
26

Research Instruments
The research tools that will be used in this study include the following: (l)face
sheet to gather data on the profile of respondents (gender, age, educational qualification
and years of experience) (2) researcher devised questionnaires to determine the extent of
customer relations management and the level of productivity. The response modes and
scoring will be as follows U; strongly disagree (2); disagree (3); agree (4); strongly agree
Validity and Reliability of the InstrumentsContent validity of the instruments will be ensured through use of valid concepts and / or
words which measure the study variables, The instruments will be given to content
experts to evaluate the relevance, wording and clarity of questions or items in the
instrument, after which a content validity index will be computed. A content validity
index of 0.83 was greater than 0.7 which is the minimum CVI will be used to declare an
instrument content validity, as per Amin (2005). The Cronbach alpha coefficient will be
used to ensure reliability of the instrument, using SPSS.
Data Gathering Procedures
The Researcher will obtain an introductory letter from the College of Higher
Degrees and Research of Kampala International University to the selected hotels under
study to obtain an authorization to conduct the research on the selected respondents. The
researcher together with the research assistants will prepare the questionnaires; using the
agreed sampling techniques. The researcher together with researcher assistants will
request the respondents: (1) to sign the informed consent; (2) to answer all questions
without leaving any item on the questionnaire; and to be objective in answering the
questions. Retrieving the questionnaires will be done within 14 days from the day of
distribution. All Questionnaires will be checked to ensure they are completely filled.
Finally, data gathered will be collated, coded into the computer and statistically treated
using the Statistical Package for Social Sciences (SPSS).
27

Data AnalysisThe frequency and percentage distribution will be used to determine the profile of
the respondents.
The means and interpretations will be applied for the levels of customer relations
management and productivity of selected hotels.
The following mean range will be used to arrive at the mean of the individual
indicators and interpretation:
A. For the extent or level ofCustomer relations management and Productivity
Mean Range Response Mode Interpretation
3.26-4.00 strongly agree Very high
2.51-3.25 Agree High
1.76-2.50 Disagree Low
1.00-1.75 strongly disagree Very low
To determine whether there is a significant relationship between customer relations
management and productivity of selected hotels, Pearson linear correlation coefficient
(PLCC) will be used to compute the influence of the independent variable to dependent
variable.
Also the regression analysis R2 (coefficient of determination) will be used to
compute the influence of the independent variable on the dependent variable.
Ethical ConsiderationsTo ensure utmost confidentiality for the respondents and the data that will be provided by
them as well as reflecting on the ethics practiced in this study, the research will be guided
by the principles of respect for people, beneficence, and justice. The researcher will
ensure that participant’ rights, including the right to be informed about the study, the right
to freely decide whether to participate in the study, and the right to withdraw at any time
without penalty will be considered. The participants will be requested to sign an informed
consent assuring them that all data collected will be coded to protect their identity and
privacy.
28

Limitations of the StudyIn view of the following threats to validity, the researcher will claim for an allowable 5%
margin of error at 0.05 level of significance. Measures are also indicated in order to
minimize if not to eradicate the threats to the validity of the findings of this study. There
may be misinterpretation of the questions by the respondents therefore this can be
controlled by the researcher by refreshing and explaining for them. There is limited data
and record keeping on the issues affecting hotels among the respondents. There is a
possibility that people may hide out some valuable information from the researcher,
therefore there is need for multiple approaches in getting information. The respondents
may be shy to answer some of the questions in this case the researcher needs to build
rapport with the community in order to get the valuable information.
29

CHAPTER FOUR
PRESENTATION, ANAL YSIS AND INTERPRETATION OF DATA
Introduction
This chapter presented, analyzed and interpreted data gathered from the field on
profile of respondents, level of customer relationship management, level of productivity,
significant differences between the level of customer relationship management strategies
and productivity in selected hotels in Nakawa division, Kampala central and the
relationship between customer relationship and productivity in selected hotels in Nakawa
division,Kampala central.
Profile of respondentsRespondents in the study were described according to gender, age, education
qualification and, working experience, selected hotels in Nakawa division,Kampala
central. In each case respondents were asked through a close ended questionnaire, to
provide their perspective profile information, to enable the researcher classify and
compare them accordingly. Their responses were analyzed using frequencies and
percentage distributions as summarized in table 2 below;
30

Table 2
Profile of Respondents
n= 109
Category Frequency Percent
Gender
Male 70 67
Female 39 33
Total 109 100
Age group
20-39 85 61
40-59 24 39
60 and above 00 00
Total 109 100
Education qualification
Diploma 70 8
Degree 34 80
Masters 04 12
PhD 00 00
TOTAL 109 100
Working experience
Below 3 years 30 5
Between 3-7 years 60 34
Above 8 years 19 61
Total 109 100
Source: primary data 2013
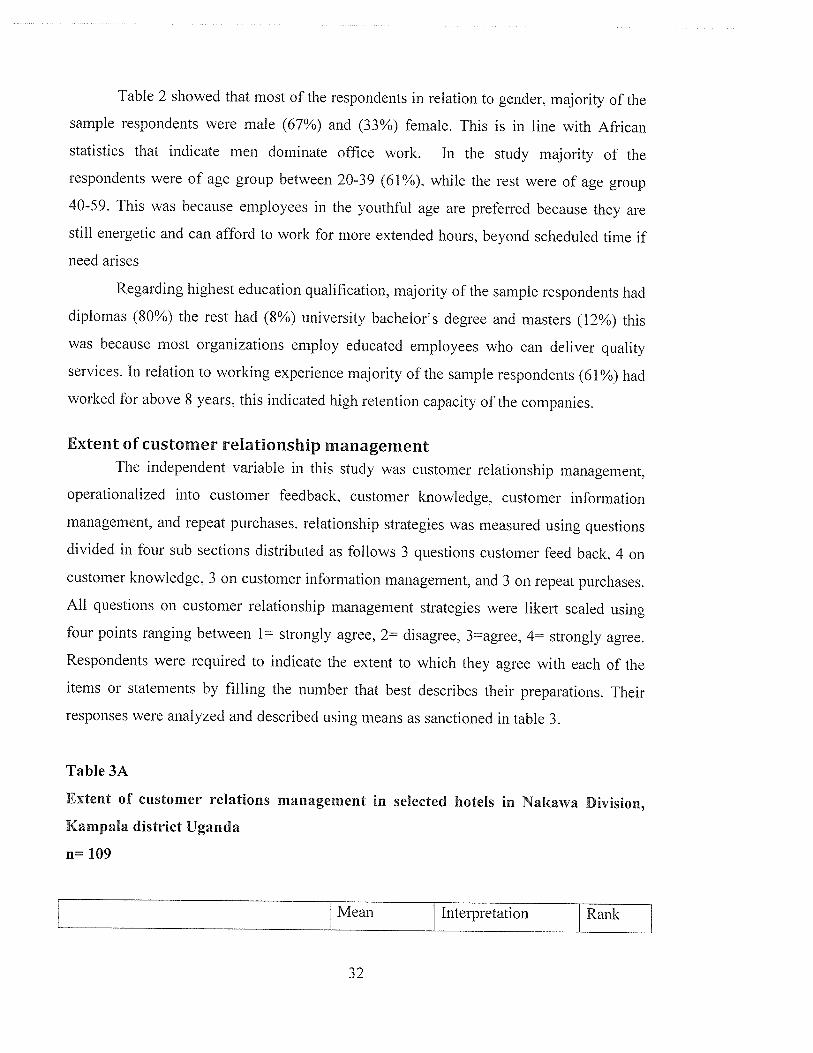
Table 2 showed that most of the respondents in relation to gender, majority of the
sample respondents were male (67%) and (33%) female. This is in line with African
statistics that indicate men dominate office work. In the study majority of the
respondents were of age group between 20-39 (6 1%), while the rest were of age group
40-59. This was because employees in the youthful age are preferred because they are
still energetic and can afford to work for more extended hours, beyond scheduled time if
need arises
Regarding highest education qualification, majority of the sample respondents had
diplomas (80%) the rest had (8%) university bachelor’s degree and masters (12%) this
was because most organizations employ educated employees who can deliver quality
services. In relation to working experience majority of the sample respondents (61%) had
worked for above 8 years, this indicated high retention capacity of the companies.
Extent of customer relationship managementThe independent variable in this study was customer relationship management,
operationalized into customer feedback, customer knowledge, customer information
management, and repeat purchases. relationship strategies was measured using questions
divided in four sub sections distributed as follows 3 questions customer feed back, 4 on
customer knowledge, 3 on customer information management, and 3 on repeat purchases.
All questions on customer relationship management strategies were likert scaled using
four points ranging between 1= strongly agree, 2= disagree, 3=agree, 4= strongly agree.
Respondents were required to indicate the extent to which they agree with each of the
items or statements by filling the number that best describes their preparations. Their
responses were analyzed and described using means as sanctioned in table 3.
Table 3A
Extent of customer relations management in selected hotels in Nakawa Division,
Kampala district Uganda
n= 109
Mean Interpretation Rank 1
32

Average mean
Repeat purchases
3.66 Very high
Customer feedback
Your hotel quickly responds to 3.86 Very high 1
customers problems,suggestions,and
complaints’
~3.83 Very high 4
mails,and personal visits to
communicate with customers
Your hotel actively responds to 3.72 Very high 7
customers enquires of your services
Average mean 3.81 Very high
Customer knowledge
Your hotel actively understands 3.85 Very high 2
customers’ service food and
expectations.
~3.84 Very high 3
customers’ requirements.
Your are able to use customers ideas to 3.83 Very high 4
develop a new market
Your hotel has different marketing 3.73 Very high 6
patterns for target customers
Average mean 3.82 Very high
Customerinformationmanagement
~3.77 Very high
for faithful customers
You are capable of using computer 3.63 Very high 8
system to categorize targeted markets
You use a computer system efficiently 3.58 Very high 9
to handle customers information~
.3
Customers come back for second time
to buy from you
Our customers often introduce other 3.79 Very high 2
customers to our hotels
Our customers can easily find our 3.68 Very high 3
hotels services related information to
help us grow.
Average mean 3.75 Very high
Overall average mean 3.76
Source: primary data 2013
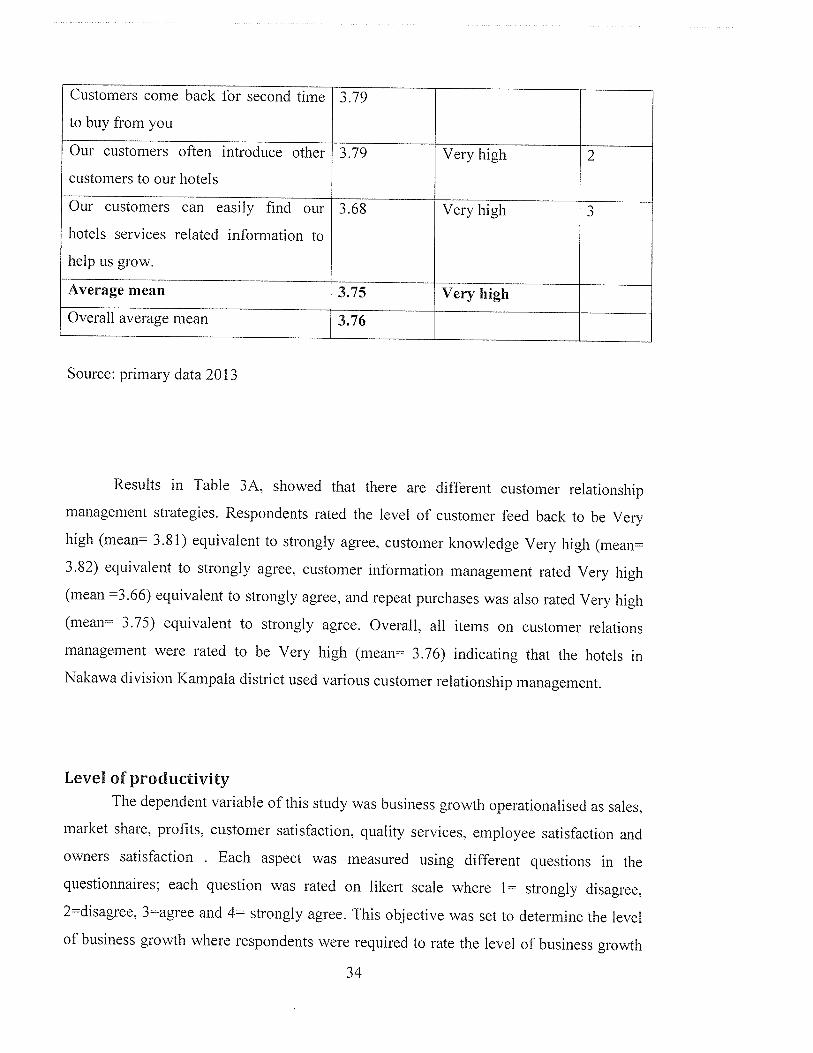
Results in Table 3A, showed that there are different customer relationship
management strategies. Respondents rated the level of customer feed back to be Very
high (rnean=~ 3.81) equivalent to strongly agree, customer knowledge Very high (mean=’
3.82) equivalent to strongly agree, customer information management rated Very high
(mean =~3.66) equivalent to strongly agree, and repeat purchases was also rated Very high
(mean= 3.75) equivalent to strongly agree. Overall, all items on customer relations
management were rated to be Very high (mean= 3.76) indicating that the hotels in
Nakawa division Kampala district used various customer relationship management.
Level of productivityThe dependent variable of this study was business growth operationalised as sales,
market share, profits, customer satisfaction, quality services, employee satisfaction and
owners satisfaction . Each aspect was measured using different questions in the
questionnaires; each question was rated on likert scale where 1 strongly disagree,
2~disagree. 3agree and 4~ strongly agree. This objective was set to determine the level
of business growth where respondents were required to rate the level of business growth
34
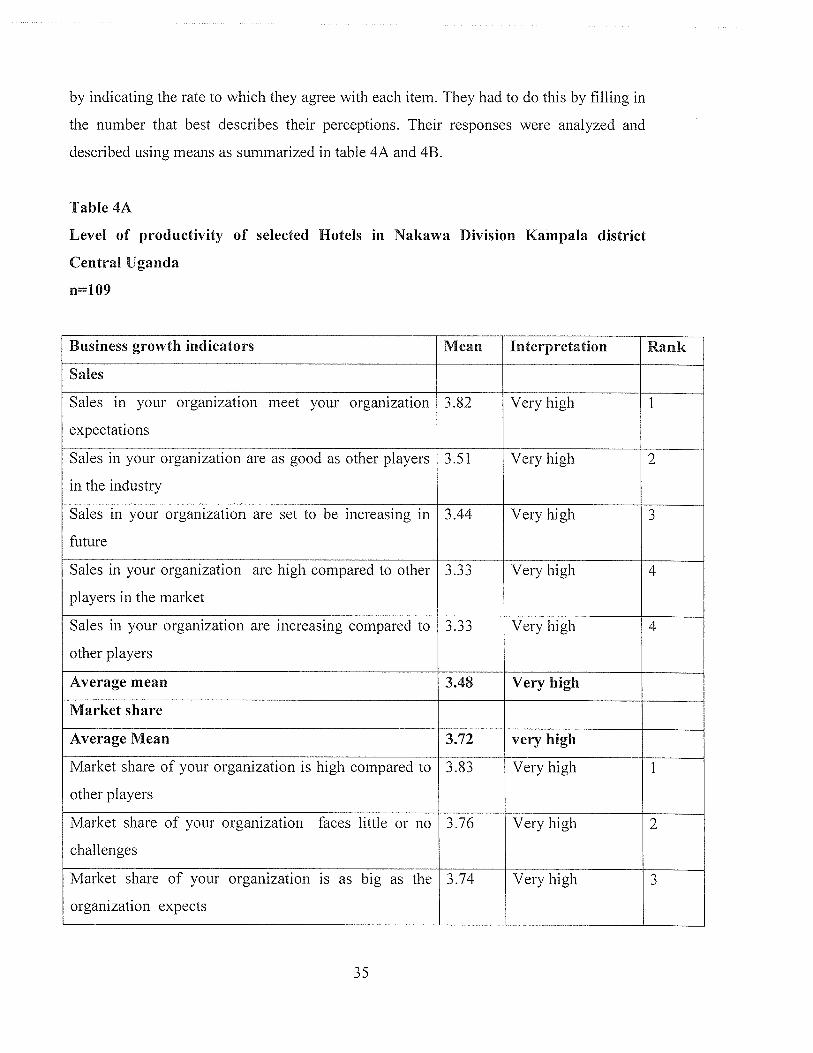
by indicating the rate to which they agree with each item. They had to do this by filling in
the number that best describes their perceptions. Their responses were analyzed and
described using means as summarized in table 4A and 4B.
Table 4A
Level of productivity of selected Hotels in Nakawa Division Kampala district
Central Uganda
n109
Business growth indicators Mean Interpretation Rank
Sales
Sales in your organization meet your organization 3.82 Very high 1
expectations
Sales in your organization are as good as other players 3.51 Very high 2
in the industry
Sales in your organization are set to be increasing in 3.44 Very high 3
future
Sales in your organization are high compared to other 3.33 Very high 4
players in the market
Sales in your organization are increasing compared to 3.33 Very high 4
other players
Average mean 3.48 Very high
Market share
Average Mean 3.72 very high
Market share of your organization is high compared to 3.83 Very high 1
other players
Market share of your organization faces little or no 3.76 Very high 2
challenges
Market share of your organization is as big as the 3.74 Very high 3
organization expects I
35
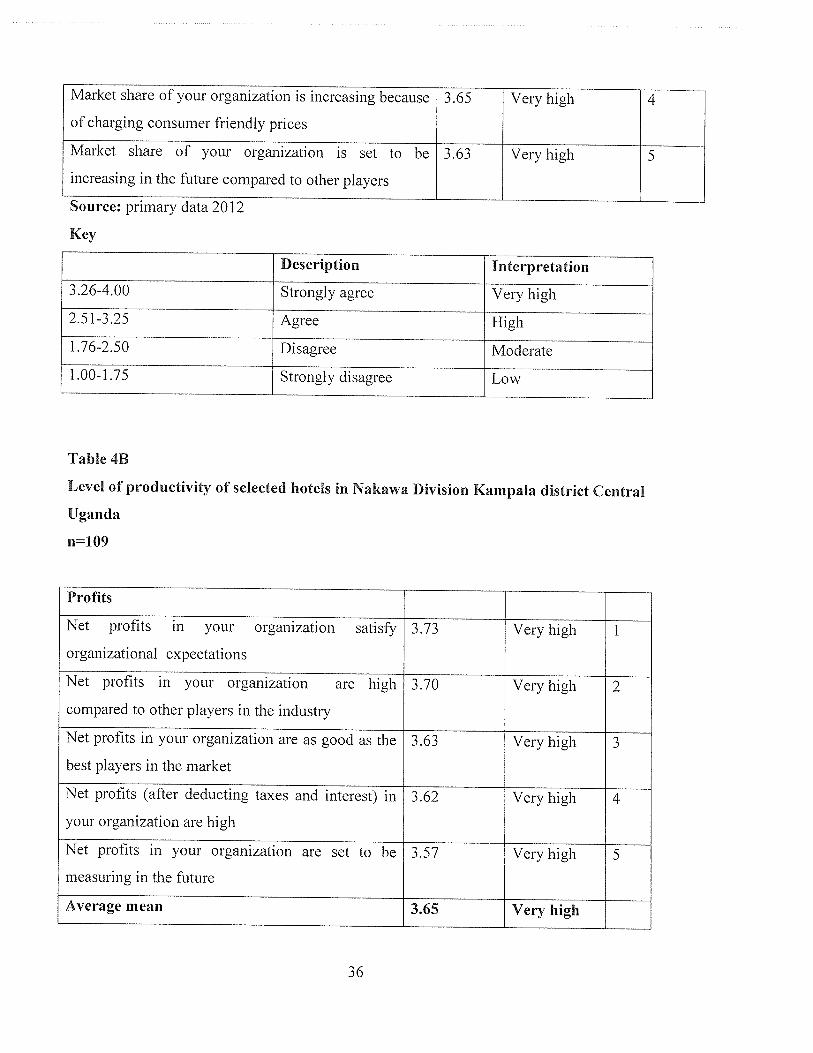
Source: primary data 2012
Key
1.00-1.75 Strongly disagree Low
Table 4B
Level of productivity of selected hotels in Nakawa Division Kampala district Central
Uganda
n109
Profits
Net profits in your organization satisfy 3.73 Very high 1
organizational expectations
Net profits in your organization are high 3.70 Very high 2
compared to other players in the industry
Net profits in your organization are as good as the 3.63 Very high 3
best players in the market
Net profits (after deducting taxes and interest) in 3.62 Very high 4
your organization are high
Net profits in your organization are set to be 3.57 Very high 5
measuring in the future
Average mean 3.65 Very high
Market share of your organization is increasing because 3.65 Very high 4
of charging consumer friendly prices
Market share of your organization is set to be 3.63 Very high 5
increasing in the future compared to other players
Description Interpretation
3.26-4.00 Strongly agree Very high
2.51-3.25 Agree High
1 .76-2.5 0 Disagree Moderate
36

Quality products
Your organization communicates to consumers in 3.82 Very high
the language they last understand and listens to
them
Your organization produces that customers want 3.67 Very high 2
Yours organization produces products and services 3.66 Very high 4
that are reliable
Your organization provides products that are safe 3.65 Very high 5
Your organization provides products services that 3.55 Very high 7
are accessible to consumers whenever needed
Average mean 3.66 Very high
Source: primary data 2013
Key
Mean range Description Interpretation
3.26-4.00 Strongly agree Very high
2.51-3.25 Agree High
1.76-2.50 Disagree Moderate
1.00-1.75 Strongly disagree Low
Table 4C
Level of productivity of selected hotels in Nakawa Division Kampala district Central
Uganda
n=109
Consumer satisfaction
Your organization gives consumers value for 3.72
Mean Interpretation
Very high
Your organization offers consultant channel of 3.70 Very high
distribution management for its services~
Rank
1
2
37
their money
Your organization offers well after sales services 3.70 Very high 3
Your organization keeps consumers informed 3.61 Very high 4
Average mean 3.69 Very high
Employee satisfaction
Your organization pays you on time 3.85 Very high 1
Your organization of employees 3.77 Very high 2
Your organization gives employees benefits that 3.75 Very high 3
are adequate
Your organization pays you’re commensurately to 3.70 Very high 4
your efforts.
Your organization offers safe working 3.70 Very high 4
environment for its employees
Average mean 3.75 Very high
Owners satisfaction 3.75 Very high
Your organization is committed to keep safe earn 3.81 Very high 1
per share for its share holders
Your organizations earnings per share are better 3.80 Very high 2
than those of other players in the market
Your organization keep share holders informed of 3.75 3
the latest development
Earnings per share in your organization are set to 3.73 Very high 4
be increasing
Your organizations gives earnings per share on 3.64 Very high 5
time
Average mean 3.74 Very high
Overall average mean 3.67 Very high
Source: primary data 2013
38

Key
Mean range Description Interpretation
3.26-4.00 Strongly agree Very high
2.51-3.25 Agree High
1 .76-2.50 Disagree Moderate
1.00-1.75 Strongly disagree Low
Table 4D
Summary Table on Level of Level of productivity of selected hotels in Nakawa
Division Kampala district Central Uganda
Business growth indicators Mean Interpretation Rank
Employee satisfaction 3.75 Very high
Owners satisfaction 3.74 Very high 2
Market share 3.72 Very high 3
Customer satisfaction 3.69 Very high 4
Quality products 3.66 Very high 5
Profits 3.65 Very high 6
Sales 3.48 Very high 7
Overall mean 3.67 Very high
Source: Primary data 2012
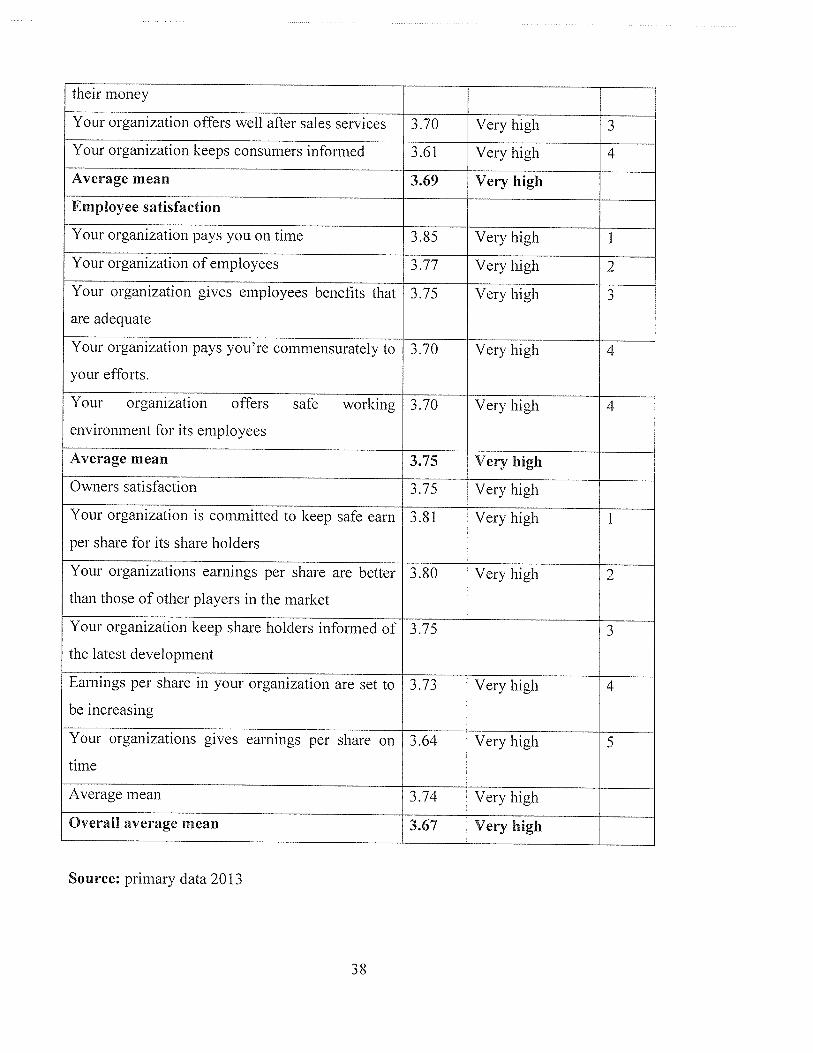
Table 4A, 4B, 4C and 4D results showed that the level of productivity was very high in
selected hotels in Nakawa division kampala district central Uganda. All business growth
indicators were measured, as perceived by the respondents. Employee satisfaction was
rated very high (mean= 3.75) rated very high on the likert scale; owner’s satisfaction was
rated high (mean=~ 3.74) rated strongly on likert scale, market share was rated very high
39
mean= 3.72) rated strongly agree on likert scale; customer satisfaction was rated very
high (mean= 3.69) rated strongly agree on the likert. Scale; quality products was rated
very high (mean= 3.66) rated strongly agree on likert scale, profit level was rated high
(mean= 3.65) rated strongly agree on likert scale and sales high (mean =3.18) rated
strongly agree on the likert scale. Overall mean on level of productivity indicators was
high (mean= 3.67) rated strongly agree on likert scale.
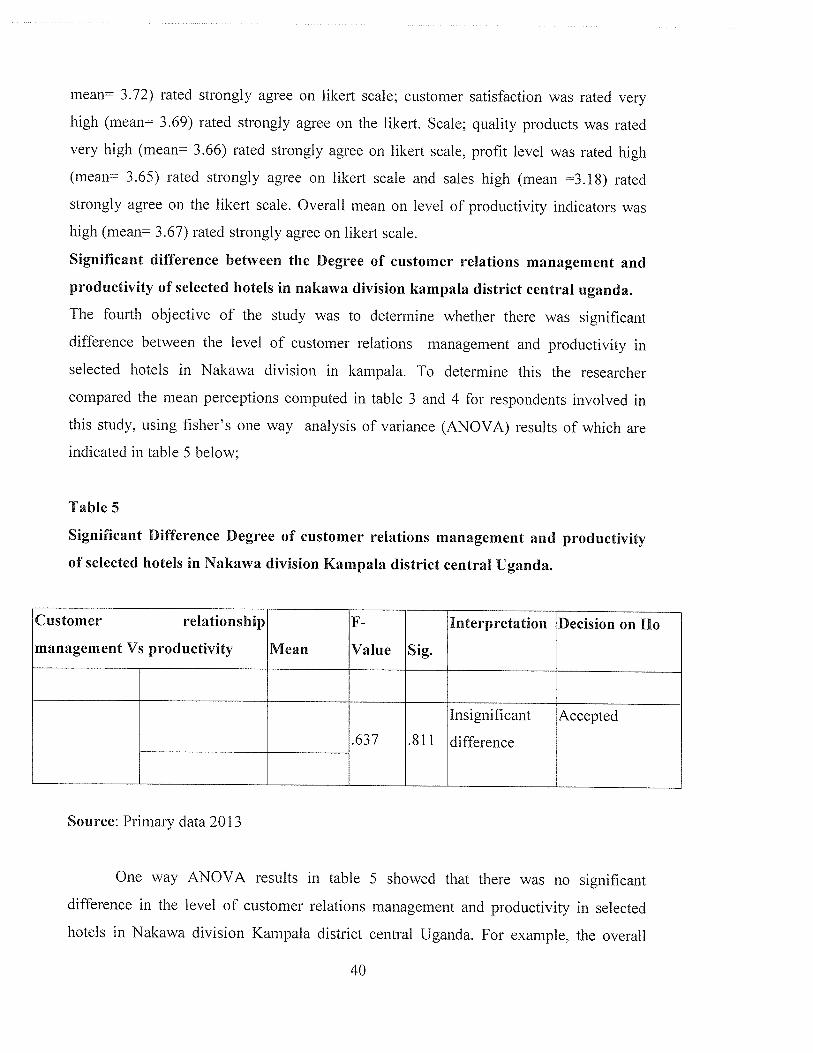
Significant difference between the Degree of customer relations management and
productivity of selected hotels in nakawa division kampala district central uganda.
The fourth objective of the study was to determine whether there was significant
difference between the level of customer relations management and productivity in
selected hotels in Nakawa division in kampala. To determine this the researcher
compared the mean perceptions computed in table 3 and 4 for respondents involved in
this study, using fisher’s one way analysis of variance (ANOVA) results of which are
indicated in table 5 below;
Table 5
Significant Difference Degree of customer relations management and productivity
of selected hotels in Nakawa division Kampala district central Uganda.
Customer relationship F- Interpretation Decision on Ho
management Vs productivity Mean Value Sig.
Insignificant Accepted
.637 .81 1 difference
Source: Primary data 2013
One way ANOVA results in table 5 showed that there was no significant
difference in the level of customer relations management and productivity in selected
hotels in Nakawa division Kampala district central Uganda. For example, the overall
40

mean perceptions obtained from all the three items analyzed did not significantly differ.
For instance, demand (F=0.210, sig. = 0.935), competition (F=1.307, sig. = 0.021) and
and overall customer relations was (F0.637, sig. 0.811) Therefore, basing on these
results, the null hypothesis was accepted, leading to a conclusion that customer relations
management strategies and productivity in selected hotels in Nakawa division Kampala
district central Uganda significantly differed.
Relationship between Degree of customer relations management and productivity of
selected hotels in Nakawa division Kampala district central Uganda.
The fifth objective of the study was to determine whether there was significant
relationship in the level of customer relations management and productivity in selected
hotels in Nakawa division Kampala district central Uganda. To determine this the
researcher compared the mean perceptions in Table 3 and 4 for respondents involved in
the study, using person’s linear correlation coefficient (PLCC, r) results of which are
indicated in table 5 below;
Table 6
Relationship between the Degree of customer relations management and
productivity of selected hotels in Nakawa division Kampala district central Uganda.
(Sig 0.05)
Variables correlated R-value Sig Interpretation Decision on Ho
Customer relationship No significant Accepted0.280 0.121
management Vs productivity relationship
Source: Primary data 2013
Table 6 results showed that customer relations management strategies and
productivity were not positively and significantly correlated in selected hotels in Nakawa
division Kampala district central Uganda (r = 0.280, sig. 0.12 1). For example,
sales(r.596, sig. =0.289); market share (r0.554, sig. =0.033); profits (r=0.531, sig.
0.033); quality products(r=0.730, sig. 0.270); employee satisfaction; (r0.540, sig.
41
0.0347); owners satisfaction(r~rO.498, sig. 0.209); except consumer satisfaction(r=0,991,
sig. 0.009) which was positively related, On the basis of the above findings with the sig.
value indicate that there is no significant correlation (sig. 0.000 <0.05), leading to a
conclusion that customer relationship management strategies do not significantly
influence productivity in selected hotels in Nakawa division Kampala central , Uganda
at a 5% level of significance.
Therefore the null hypothesis which states that “there is no significant relationship
between customer relationship management and productivity in selected hotels in
Nakawa division Kampala district central Uganda” was accepted. To get a general picture
on the overall relationship between customer relations management and productivity, two
mean indices were computed for customer relationship management strategies and
productivity, after which the indices were linearly regressed, as per results in table 7
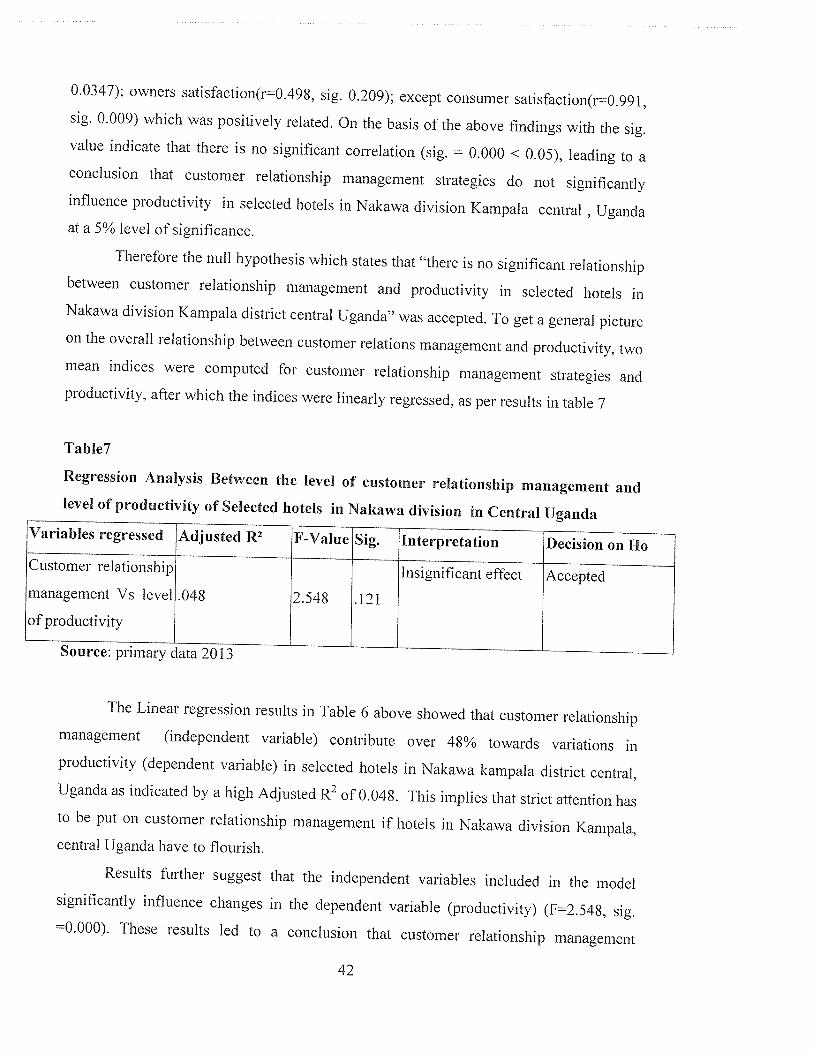
Table7
Regression Analysis Between the level of customer relationship management and
level of productivity of Selected hotels in Nakawa division in Central Uganda
Variables regressed Adjusted R2 F-Value Si2. Interpretation Decision on Ho
~
Source: primary data 2013
The Linear regression results in Table 6 above showed that customer relationship
management (independent variable) contribute over 48% towards variations in
productivity (dependent variable) in selected hotels in Nakawa kampala district central,
Uganda as indicated by a high Adjusted R2 of 0.048. This implies that strict attention has
to be put on customer relationship management if hotels in Nakawa division Kampala,
central Uganda have to flourish.
Results further suggest that the independent variables included in the model
significantly influence changes in the dependent variable (productivity) (F=2.548, sig.
=0.000). These results led to a conclusion that customer relationship management
42
significantly explains the high rates of business productivity in Nakawa division central,
Uganda.
CHAPTER FIVE
FINDINGS, CONCLUSIONS AND RECOMMENDATIONS
IntroductionThis chapter presents a summary of the findings, conclusions drawn and
recommendations with relevance to specific objectives of this study.
FindingsA summary of the major findings are indicated below in answer to specific objectives of
the study.
Profile of the respondentsRegarding age, most of the respondents were of age group 20-39 (61%) and the
rest were 40-59. This was because youthful and energetic employees were preferred. In
terms of marital status majority of the respondents were married (84%) while the rest
were single (9%) and divorced (7%) on the highest level of education majority of the
respondents were educated with university degrees (80%) Diplomas (8%), and masters
(12%) respectively. This was because most companies preferred highly trained and
competent workforce.
In relation to working experience majority of the sample respondents (6 1%) had
work experience for above 8 years, and the sample respondents were fairly distributed
among the selected soft drink companies although century bottling company (3 0%) and
crown beverages (26%) dominated as they are the leading players in the industry.
Level of customer relationship management and productivity in selected hotels in
Nakawa division Kampala district central Uganda
The findings indicate that there are different levels of customer relations
management strategies. Respondents rated the level of customer feed back to be Very
high (mean= 3.81) equivalent to strongly agree, customer knowledge Very high (mean=
3.82) equivalent to strongly agree, customer information management rated Very high
(mean =3.66) equivalent to strongly agree, and repeat purchases was also rated Very high
(mean= 3.75) equivalent to strongly agree. Overall, all items on customer relationship
management were rated to be Very high (mean= 3.76) indicating that the hotels in
Nakawa division Kampala district used various customer relationship management.
Level of productivity in selected hotels in Nakawa division Kampala district central
Uganda
The findings show that the level of Business productivity was very high in
selected districts in central Uganda. All productivity indicators were measured, as
perceived by the respondents. Employee satisfaction was rated very high (mean=3.75)
rated very high on the likert scale; owner’s satisfaction was rated high (mean=3.74) rated
strongly on likert scale, market share was rated very high mean=3.72) rated strongly
agree on likert scale; customer satisfaction was rated very high (mean=3.69) rated
strongly agree on the likert. Scale; quality products was rated very high (mean=3.66)
rated strongly agree on likert scale, profit level was rated high (mean=3 .65) rated strongly
agree on likert scale and sales high (mean 3.18) rated strongly agree on the likert scale.
Overall mean on productivity indicators was high (mean= 3.67) rated strongly agree on
likert scale.
44

Significant difference between the level of relationship management and level of
productivity of selected hotels in Nakawa division kampala district in central
Uganda
The findings indicate that there is no significant difference in the level of
customer relationship management strategies and level of productivity in selected hotels
in Nakawa division kampala, central Uganda. Overall customer relationship management
was (F=0.637, sig. = 0.8 11) Therefore, basing on these results, the null hypothesis is
accepted, leading to a conclusion that customer relationship management and level of
productivity in selected hotels in Nakawa division kampala central , Uganda significantly
differed.
Relationship between the level of relationship management and productivity of
selected hotels in Nakawa division kampala district central Uganda
Findings showed that customer relationship management and level of productivity
were not positively and significantly correlated in selected soft drink companies central
Uganda (r 0.280, sig. 0.121). On the basis of the above findings with the sig. value
(r 0.280, sig. = 0.121). indicate that there is no significant correlation (sig. = 0.000 <
0.05), leading to a conclusion that customer relationship management does not
significantly influence level of productivity in selected hotels in nakawa division
kampala, central , Uganda at a 5% level of significance.
Regression analysis between the level of relationship management and productivity
of selected hotels in Nakawa division kampala district central Uganda
The Linear regression results indicate that customer relationship management
(independent variable) on regression model contribute over 48% towards variations in
level of productivity (dependent variable) in selected hotels in Nakawa division Kampala
district central, Uganda as indicated by a high Adjusted R2 of 0.048. This implies that
strict attention has to be put on customer relationship management if selected hotels
Nakawa divisions in central Uganda have to flourish.
CONCLUSIONSBased on the study findings the study concludes that there is no significant relationship
between customer relationship management and level of productivity (r = 0.280, sig. =
0.121). The level of productivity was very high in selected hotels in Nakawa division, in
45
central Uganda. Employee satisfaction was rated very high (men 3.75), owner’s
satisfaction was rated high (mean=3.74), market share was rated very high mean=3.72),
customer satisfaction was rated very high (mean 3.69), quality products was rated very
high (mean=3.66), profit level was rated high (mean 3.65) sales was rated high
(mean=3.18) Overall mean on level of productivity was high (mean=3.67). On the level
of customer relationship management findings indicated that there are different levels of
customer relationship management. Respondents rated the level of customer feed back to
be Very high (mean= 3.81) equivalent to strongly agree, customer knowledge Very high
(mean= 3.82) equivalent to strongly agree, customer information management rated Very
high (mean 3 .66) equivalent to strongly agree, and repeat purchases was also rated Very
high (mean~ 3.75) equivalent to strongly agree. Overall, all items on customer
relationship management were rated to be Very high (mean= 3.76) indicating that the
hotels in Nakawa division Kampala district used various customer relationship
management. Therefore, basing on these results, the null hypothesis is accepted, leading
to a conclusion that customer relationship management and level of productivity in
selected hotels in Nakawa division, central Uganda significantly differed.
The Linear regression results indicate that level of customer relationship
management (independent variable) on regression model contribute over 48% towards
variations in level of productivity (dependent variable) in selected soft drink companies
central, Uganda as indicated by a high Adjusted R2 of 0.048.
The study therefore did not significantly agree Dynamic structural model developed by
Franses, (2005) which states that management supports and encourages productivity
improvement by considering incentives to reward customers for contributions. Another
area of interest regarding dynamic structural model in customer relationship management
is the optimal allocation of services, such as the outsourcing of inbound services calls (Li,
Sun & Zhou, 2004). To guarantee both long term cost efficiency and overall customer
satisfaction, a firm might sacrifice short~term efficiency by strategically assigning a few
callers to the various call centers to learn about their service quality. A better knowledge
46

of service centers’ efficiencies can reduce future service time and improve overall
customer satisfaction. However regression analysis shows that customer relation
strategies account for 48% variations in level of productivity which is not very significant
but important.
RECOMMENDATIONSBased on the findings of the study, the following are suggested.
Hotels should develop proper marketing plans as this will help all employees and
their mangers to work towards common goals. In addition it will serve as a basis upon
which actual and expected performance will be measured. Further still marketing plan
will provide a sense of direction to the organization.
Hotels should improve on their branding as this will help them to properly
distinguish themselves before their customers in this highly competitive business
environment.
Proper packing needs to be done by the Hotels need as this will help ease their
distribution and also help the members of distribution channel in easily carrying and
distributing their products.
Hotels need to improve on their marketing communications, specifically by
tailoring their messages to the specific characteristics and interests of free selected
customers. Modern ICTS can help the companies in achieving this objective.
Market segmenting and targeting needs also to be improved by the Hotels need
this will help in figuring out the rightful customers and therefore help to develop products
that appeal and satisfy the selected customers.
Hotels need to improve on their distribution strategy. This can be done
specifically by creating company owned agents in various parts of the market. Further
47
still partnership can be done with private retailers and wholesalers through giving them
incentives like discounts, sharing advertising costs and giving them storage facilities for
these products.
Hotels need to improve on their product strategy management. Care should be
taken in developing the proper product lines, product mix and other related product
strategy decisions.
Hotels need to improve eon their innovativeness and creativity. They need to keep
come up with new products and services that appeal to customers.
Continuous market research needs also to be done by the Hotels need so as to find
out the needs and complaints of customers. Marketing research will also help the sofi
drink companies’ in finding out whether their marketing strategies are meeting the
objectives of the company.
Hotels need also to improve on them competitive intelligence as this will help
them to monitor the plans and actions of their competitors and recent accordingly.
Hotels need should improve on the quality of their products and services as this
will improve on the customer satisfaction levels and improve them market share.
Hotels need to develop proper relationship management strategies as this will
result into repeat business, positive ward —of- month, increased sales and profits and
subsequence business growth.
SUGGESTED AREAS FOR FURTHER RESEARCH
There is need to do research on quality services and business growth, further research can
also be done on advertising and sales productivity of selected hotels in Nakawa division
kampala, central Uganda.
48

REFERENCES
Ahmad r., & Buttle f., (2004). Customer retention: a potentially potent Marketing
management strategy. Journal of strategic marketing, vol.9 (29-45,). Canterbury,
Manchester — UK.
Bose, R. (2002). Customer relationship management: Key components for IT success.
Industrial Management and Data Systems, 102(89—97) Albuquerque, New Mexico, USA
Chen, I. J., & Popovich, K. (2003). Understanding customer relationship management
(CRM): People processes and technology. Business Process Management Journal, 9 (5),
672—688.
CRM (2009) “CRM in hotel industry”, [internet], available at URL:
http://www.scribd.com/doc/145 87797/Customer~Relationship~Managementin..Hotelpage
52
Dyché, J. (2002). The CRM Handbook — A Business Guide to Customer Relationship
Management. Boston: Addison-Wesley.
Evans & Laskin, 1994, Frenken, S. (2004). CRM in de Hotellerie. Online available from:
http ://www.nhtv .nl/default.aspx?themaset=2ee5f427-bc8e-440f-a6c2-803 e7Oaa4O6f
Fletcher, K. and Wright, G. (1996). The strategic context for information systems use;
An empirical study of the financial services industry. International Journal of
Information
Management.
49
Gaibraith H, S., (2005). Designing the customer centric organization. 44 International
Journals qf E-Services and Mobile Applications, Vol.2 (44-56). Northern Appalachian,
Welisboro, PA, USA.
McDonald, M.H.B ci’ al., (2002). Factors for success in customer relationship
management (CRM) systems. Cranfield, Bedford,uk. Journal of Marketing Management,
vol 17(2001),
Mitussis, D., O’Malley, L. and Patterson, M. (2006). Mapping the Re-engagement of
CRM with Relationship Marketing. European Journal ofMarketing, 40 (5/6): 572-589.
Mittal, Vikas and Wagner Kamakura (2001), “Satisfaction, Repurchase Intent, and
Repurchase Behavior: Investigating the Moderating Effects of Customer Characteristics,”
American Marketing Association, USA. Journal ofMarketing Research, 38(131-42).
O’Reilly, P. and Dunne, S. (2004). Measuring CRM Performance: an exploratory
Case. Cork: University College Cork.
Reinartz, Werner J. and V. Kumar (2000), “on the Profitability of Long-Life Customers
in a Noncontractual Setting: An Empirical Investigation and Implications for Marketing,”
Journal ofMarketing, 64 (October), 17—35.
Rowley s. & Days, J (2000), “Disloyalty a closer look at non-loyalty”. Journal of
consumer marketing, vol. 17 nov-6 pp. 538-549
Sugandhi, R.K. (2002), “Customer Relationship Management”, New Delhi: New age
International Publishers
Sule, M. R. L. M. A. (2004). How to Measure the Impact of A CRM Strategy on the
Firm Performance
50
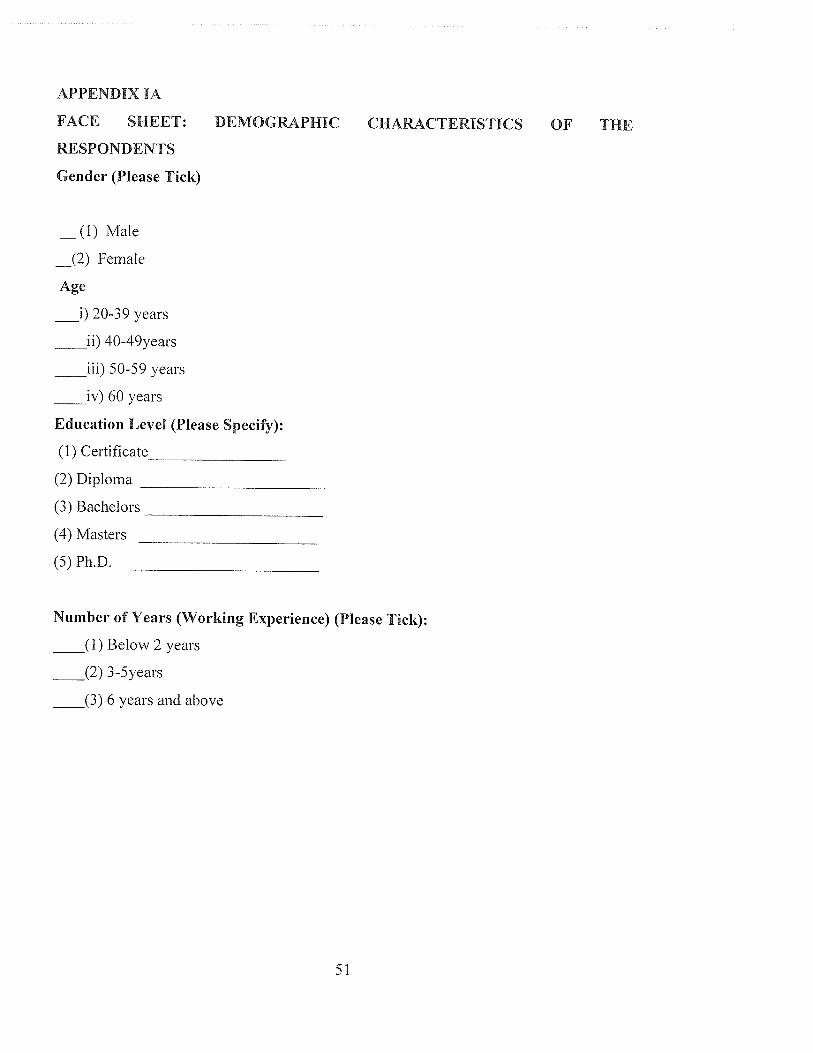
APPENDIX IA
FACE SHEET: DEMOGRAPHIC CHARACTERISTICS OF THE
RESPONDENTS
Gender (Please Tick)
(1) Male
_(2) Female
Age
i) 20-39 years
ii) 40-49years
iii) 50-59 years
iv) 60 years
Education Level (Please Specify):
(1) Certificate___________________
(2) Diploma _________________________
(3) Bachelors _________________________
(4) Masters _______________________________
(5) Ph.D. ______________________
Number of Years (Working Experience) (Please Tick):
(1) Below 2 years
(2) 3-Syears
(3) 6 years and above
51
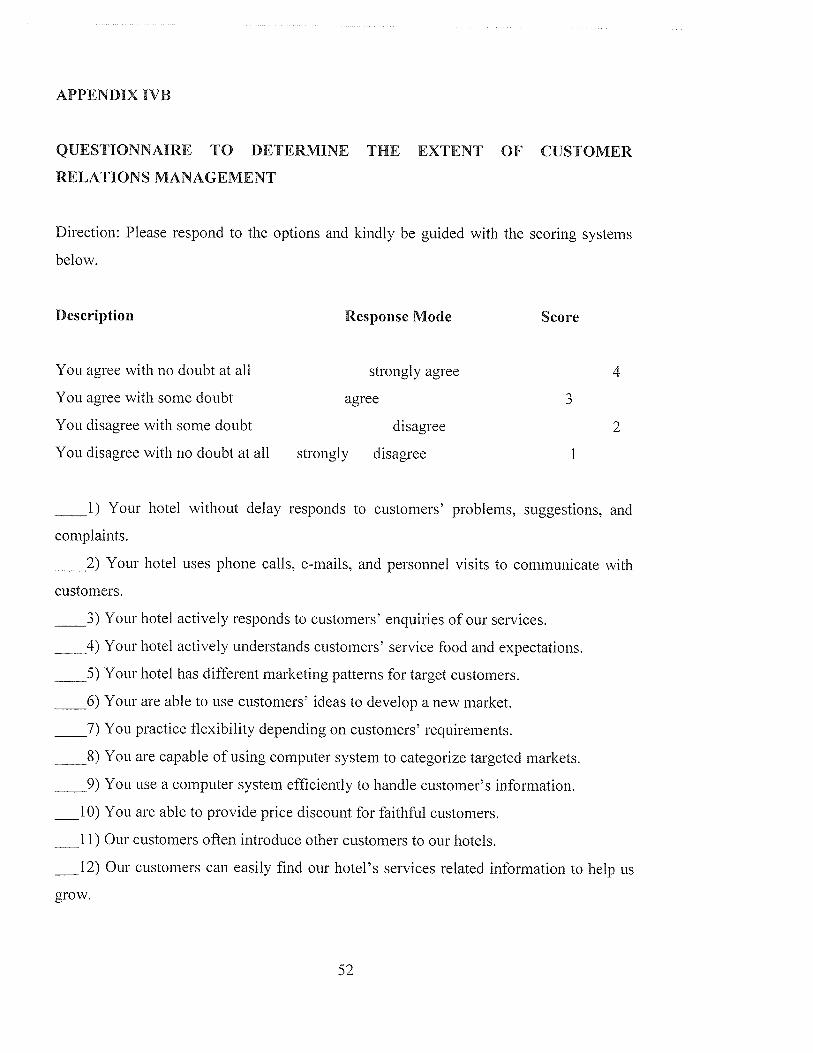
APPENDIX IVB
QUESTIONNAIRE TO DETERMINE THE EXTENT OF CUSTOMER
RELATIONS MANAGEMENT
Direction: Please respond to the options and kindly be guided with the scoring systems
below.
Description Response Mode Score
You agree with no doubt at all strongly agree 4
You agree with some doubt agree 3
You disagree with some doubt disagree 2
You disagree with no doubt at all strongly disagree
1) Your hotel without delay responds to customers’ problems, suggestions, and
complaints.
2) Your hotel uses phone calls, e-mails, and personnel visits to communicate with
customers.
3) Your hotel actively responds to customers’ enquiries of our services.
4) Your hotel actively understands customers’ service food and expectations.
5) Your hotel has different marketing patterns for target customers.
6) Your are able to use customers’ ideas to develop a new market.
7) You practice flexibility depending on customers’ requirements.
8) You are capable of using computer system to categorize targeted markets.
9) You use a computer system efficiently to handle customer’s information.
10) You are able to provide price discount for faithful customers.
11) Our customers often introduce other customers to our hotels.
12) Our customers can easily find our hotel’s services related information to help us
grow.
52
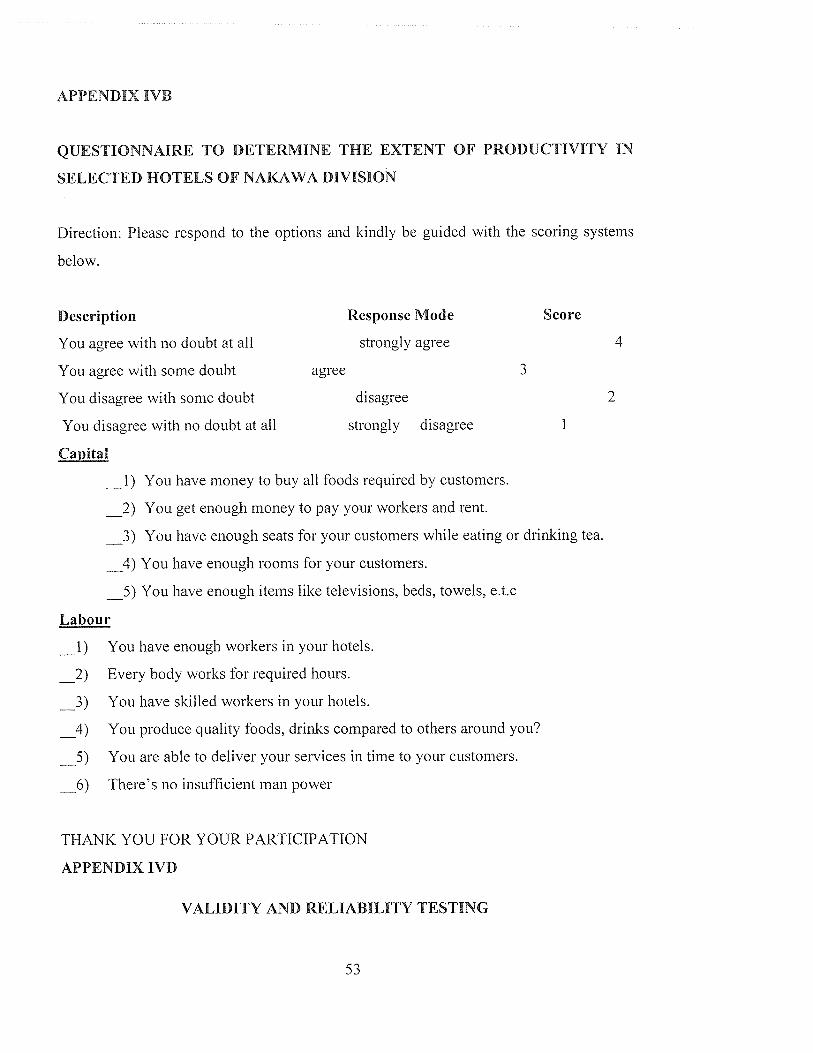
APPENDIX IVB
QUESTIONNAIRE TO DETERMINE THE EXTENT OF PRODUCTIVITY IN
SELECTED HOTELS OF NAKAWA DIVISION
Direction: Please respond to the options and kindly be guided with the scoring systems
below.
Description Response Mode Score
You agree with no doubt at all strongly agree 4
You agree with some doubt agree 3
You disagree with some doubt disagree 2
You disagree with no doubt at all strongly disagree
Capital
_l) You have money to buy all foods required by customers.
_2) You get enough money to pay your workers and rent.
_3) You have enough seats for your customers while eating or drinking tea.
4) You have enough rooms for your customers.
5) You have enough items like televisions, beds, towels, e.t.c
Labour
I) You have enough workers in your hotels.
_2) Every body works for required hours.
3) You have skilled workers in your hotels.
_4) You produce quality foods, drinks compared to others around you?
5) You are able to deliver your services in time to your customers.
_6) There’s no insufficient man power
THANK YOU FOR YOUR PARTICIPATION
APPENDIX IVD
VALIDITY AND RELIABILITY TESTING
-‘-3

Overall Reliability Statistics on level of customer relationship management
Cronbach’s Alpha N of Items
0.821 12
Overall Reliability Statistics on level of productivity
Cronbachs Alpha N of Items
0.873 11
Sample Size
The Slovin’s formula will be used to determine the minimum sample size.
N
11=
1+N ~2
Where:
N~Target population
n=Sample size
ct~0.05 that is the level of significance
54