custom reporting catalog drilldowns: page path level 1, page path level 2, page path level 3, page...
TRANSCRIPT

Custom Reporting Catalog
v1.0
August 2015

INTRODUCTION CUSTOM REPORTS
1. GovWide Content Drilldown by Website Report 2. WebsiteSpecific Content Drilldown 3. Traffic Sources 4. Visitor Acquisition 5. Landing Pages Analysis 6. Content Efficiency Analysis 7. Top Downloads 8. Top Events 9. Sessions With OnSite Search 10. Search Traffic (Excluding Not Set, Not Provided) 11. SEO: Referring Pages 12. Mobile Performance Analysis 13. SelfReferral Troubleshooting 14. 404 Diagnostics Report
DASHBOARDS 1. GovWide 10 Common Web Metrics: 2. GovWide Social Media Traffic Trends: 3. GovWide Mobile Trends Dashboard 4. GovWide RealTime Social Media Dashboard
SEGMENTS 1. Inquisitive Traffic Segment 2. Social Media Sessions 3. Sessions Containing LongTail Keywords in Search Engine Query
SAMPLING
________________________________________________________________________________________________________________________ Digital Analytics Program [email protected]
2

INTRODUCTION Digital Analytics Program (DAP) Google Analytics (GA) comes with a set of standard, preconfigured reports in the default GA interface. However, to get the most insight of the data, users can create custom reports, dashboards and advanced segments. Customizing reports, dashboards and segments allows users to view web analytics data specific to various agencies or website needs within the DAP reporting account. PURPOSE OF THE CATALOG The purpose of the DAP Reporting Solutions Catalog is to equip DAP users with many of the frequently used custom templates and reports to help facilitate the website/agency web traffic analysis. Users can edit these reports to display data for websites by setting a filter that only includes those websites. Not only does it allow for efficient access to the data of interest, but it also gives users ideas on how to bring more insight out of the data.
CUSTOM REPORTS
1. Gov-Wide Content Drilldown by Website Report This content drilldown report, shown below in Figure 1, provides granular data on user engagement for all domains across DAP. You can drilldown into each domain and into each subdirectory to view data for specific web pages. Metrics: Sessions, % New Sessions, Pageviews, Avg. Time on Page, Bounce Rate Dimension Drilldowns: Page path level 1, Page path level 2, Page path level 3, Page path level 4, Page.
________________________________________________________________________________________________________________________ Digital Analytics Program [email protected]
3

Figure 1. Content Drilldown
2. Website-Specific Content Drilldown To view this report properly, access the appropriate profile for which the website is located under. Locate the default Content Drilldown report under Behavior >> Site Content. This report may be used as the basis for this custom report. Underneath the report title, click on Customize. Click on “+ add filter,” type in and select “hostname.” Make sure that the dropdown menus are set to Include and Exact respectively. In the text input field, type in the website of interest so that it exactly matches one of the suggested websites, which will not include a “http://” or “www” prefix nor a ‘/’ suffix, as shown in Figure 2.
Figure 2. Hostname Filter
Metrics: Sessions, % New Sessions, Pageviews, Avg. Time on Page, Bounce Rate Dimension Drilldowns: Page path level 1, Page path level 2, Page path level 3, Page path level 4, Page.
3. Traffic Sources This report provides a view of the user journey, focusing on user acquisition and behavior. You can analyze how users arrive at your website and how they interact with it.
________________________________________________________________________________________________________________________ Digital Analytics Program [email protected]
4

Metrics: Users, Avg. Page Load Time, Bounce Rate, Pages/Session, Sessions with Search Dimension Drilldowns: Source/Medium >> User Type
Figure 3. Traffic Sources
4. Visitor Acquisition This report organizes key metrics on the efficiency and performance of all traffic streams, highlighting new sessions, bounce rate and events. It focuses on user characteristics and their engagement with websites. In order to view data when you drilldown into Campaigns, it would be best to use Google’s URL builder and add the utm_campaign tag to your URL for any campaigns that you run. Otherwise, campaigns will appear as (not set) because no campaign has been defined by the utm_campaign tag. Metrics: Users, Sessions, % New Sessions, Bounce Rate, Total Events Dimension Drilldowns: Source/Medium >> Campaign >> City
________________________________________________________________________________________________________________________ Digital Analytics Program [email protected]
5

Figure 4. Visitor Acquisition
5. Landing Pages Analysis The Landing Pages Analysis report covers data for pages through which users enter the website. This report provides a list of pages and highlights the percentage of pageviews that were entrances to the website as well as the bounce rate for those pages. Depending on the goals of the web page, you can see how effective those landing pages are and determine whether you need to adjust the elements on that page. If you are running campaigns, this report can give you an idea of which landing page might be the most helpful to your target audience. Metrics: Sessions, Entrances / Pageviews, Bounce Rate, Avg. Time on Page Dimension Drilldowns: Page >> Keyword
________________________________________________________________________________________________________________________ Digital Analytics Program [email protected]
6

Figure 5. Landing Pages Analysis
6. Content Efficiency Analysis The Content Efficiency Analysis report provides data in two tabsone for the performance of specific content or pages and one for technical performance of the web page. You can see which webpages are receiving repeat pageviews, the percentage of pageviews which are entrances to the website, as well as the bounce rate and average time on page. Page Performance Efficiency Metrics: Unique Pageviews, Pageviews, Entrances / Pageviews, Bounce Rate, Avg. Time on Page Dimension Drilldowns: Page Title >> User Type >> Source/Medium Page Technical Efficiency Metrics: Pageviews, Avg. Page Load Time, Page Load Sample, Bounce Rate Dimension Drilldowns: Page Title >> Country >> City
________________________________________________________________________________________________________________________ Digital Analytics Program [email protected]
7

Figure 6a. Page Performance Efficiency
Figure 6b. Page Technical Efficiency
________________________________________________________________________________________________________________________ Digital Analytics Program [email protected]
8

7. Top Downloads The Top Downloads report displays the top downloaded files. You can drilldown into each file type to see the specific files that users are downloading. This report will show whether users are downloading Word documents, Excel documents, pdfs, PowerPoint decks, mp3s or other types of files. This custom setup also includes data on users that download a file and how they engage with the website as a whole. It displays the number of sessions for the file type download, pages/session, session duration and percentage that are new sessions. Think of it as a segment for users that download at least one file from the website. This data can be found in the Site Usage section of the report. Metric Groups Event Total Events, Unique Events Site Usage Sessions, Pages/Session, Avg. Session Duration, % New Sessions Dimension Drilldowns Event Action >> Event Label Filter Include Event Category Exact “Download”
Figure 7. Top Downloads
________________________________________________________________________________________________________________________ Digital Analytics Program [email protected]
9

8. Top Events The Top Events report displays data on specific actions and tasks that users have started and/or completed. This is configured similarly to the Top Downloads report above except this report covers all events, not just downloads. There is data on outbound links, YouTube video interaction, mailto links and other events. You can drilldown into each event to view details for each. This report consists of a section for the events themselves and site usage for users that complete an event action. You can define how users are engaging with the website when they complete certain event actions. Metric Groups Event Total Events, Unique Events Site Usage Sessions, Pages/Session, Avg. Session Duration, % New Sessions Dimension Drilldowns Event Category >> Event Action >> Event Label
Figure 8. Top Events
________________________________________________________________________________________________________________________ Digital Analytics Program [email protected]
10

9. Sessions With On-Site Search The Sessions With OnSite Search report associates onsite search terms with the pages on which the search was performed. Drilling down into specific search terms shows what pages users are searching from along with the number of times users searched for specific terms. This report can help determine user intent and whether it makes sense to include links on the referral pages leading to specific pages. That way users can find the content they are looking for without performing an extra step. Metrics Sessions with Search Dimension Drilldowns Search Term >> Full Referrer
Figure 9. Sessions With OnSite Search
10. Search Traffic (Excluding Not Set, Not Provided) This Search Traffic report provides data on keywords that users input into search engines to reach your website. Drilling down into those keywords leads to the landing pages through which users enter websites. You can evaluate keywords and determine whether keywords are leading users to the desired web pages. This report provides bounce rate and pageviews related to keywords and their landing pages. You can analyze how effective your keywords are, in conjunction with your landing pages, at engaging users by analyzing bounce rate and pageviews. ________________________________________________________________________________________________________________________ Digital Analytics Program [email protected]
11

Metrics Sessions, Users, Bounce Rate, Pageviews Dimension Drilldowns Keyword >> Landing Page Filter Exclude Keyword Exact (not set), (not provided)
Figure 10. Search Traffic (Excluding Not Set, Not Provided)
11. SEO: Referring Pages The SEO: Referring Pages report gauges the effectiveness of referral links and tracks the top referring links to the website. There is a filter set exclusively for referral traffic sources. The Source and the Referral Path columns tell you exactly which website and page your links are coming from. Bounce Rate and Avg. Session Duration will indicate which links bring highquality traffic or if your users are finding what they are looking for. Add another filter for the hostname of the destination domain that you are interested in. Dimensions Source, Referral Path Metrics Sessions, Bounce Rate, % New Sessions, Avg. Session Duration Filter Include Medium Regex “referral”
________________________________________________________________________________________________________________________ Digital Analytics Program [email protected]
12

Figure 11. Referring Pages
12. Mobile Performance Analysis This mobile custom report contains three areas of analysisdevice performance, search performance, and page performancein one report so you don’t have jump from report to report. The device tab breaks down the operating system and product model used. The Search Performance tab contains keywords that mobile users input into search engines. The Page Performance tab covers the effectiveness of landing pages, the traffic source and the user type. Mobile Device Performance Users, Sessions, Bounce Rate, Avg. Session Duration Dimension Drilldowns Operating System >> Mobile Device Info >> Landing Page Filter Include Mobile (Including Tablet) Exact “Yes”
________________________________________________________________________________________________________________________ Digital Analytics Program [email protected]
13

Figure 12a. Mobile Device Performance
Search Performance Metrics Users, New Users, Bounce Rate, Pages/Session Dimension Drilldowns Keyword, Source, Mobile Device Branding Filters Include Mobile (Including Tablet) Exact “Yes”
Figure 12b. Mobile Search Performance
________________________________________________________________________________________________________________________ Digital Analytics Program [email protected]
14
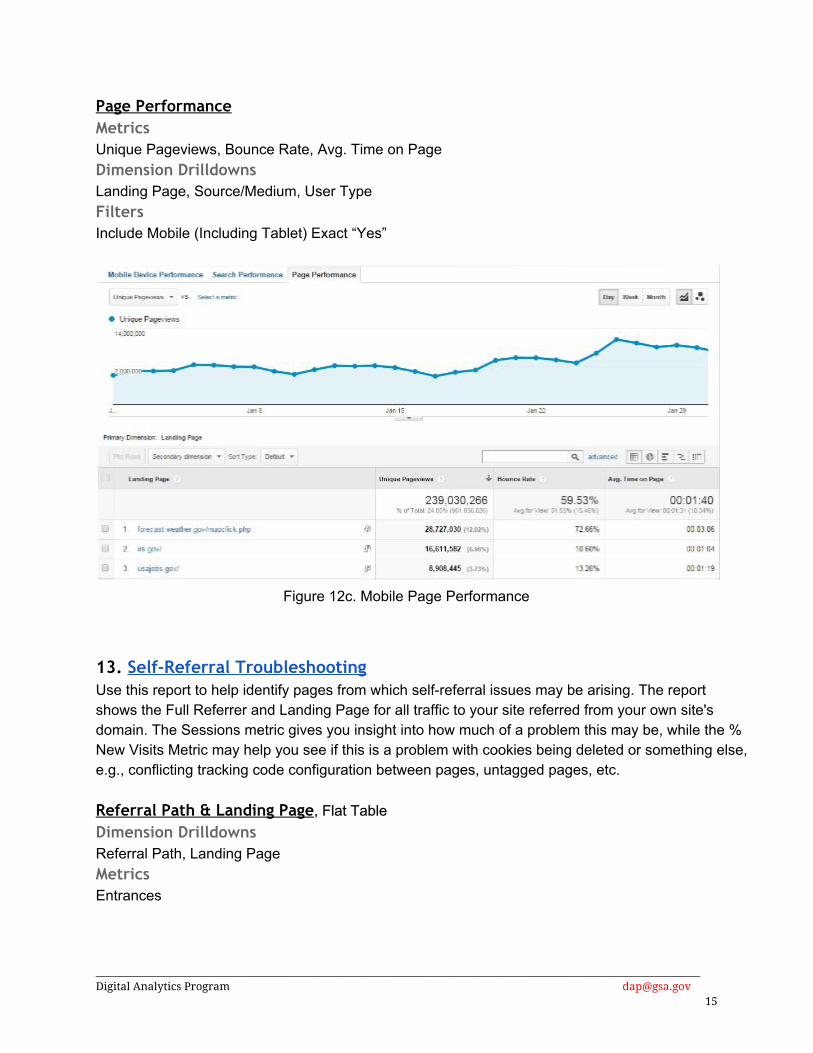
Page Performance Metrics Unique Pageviews, Bounce Rate, Avg. Time on Page Dimension Drilldowns Landing Page, Source/Medium, User Type Filters Include Mobile (Including Tablet) Exact “Yes”
Figure 12c. Mobile Page Performance
13. Self-Referral Troubleshooting Use this report to help identify pages from which selfreferral issues may be arising. The report shows the Full Referrer and Landing Page for all traffic to your site referred from your own site's domain. The Sessions metric gives you insight into how much of a problem this may be, while the % New Visits Metric may help you see if this is a problem with cookies being deleted or something else, e.g., conflicting tracking code configuration between pages, untagged pages, etc. Referral Path & Landing Page, Flat Table Dimension Drilldowns Referral Path, Landing Page Metrics Entrances
________________________________________________________________________________________________________________________ Digital Analytics Program [email protected]
15
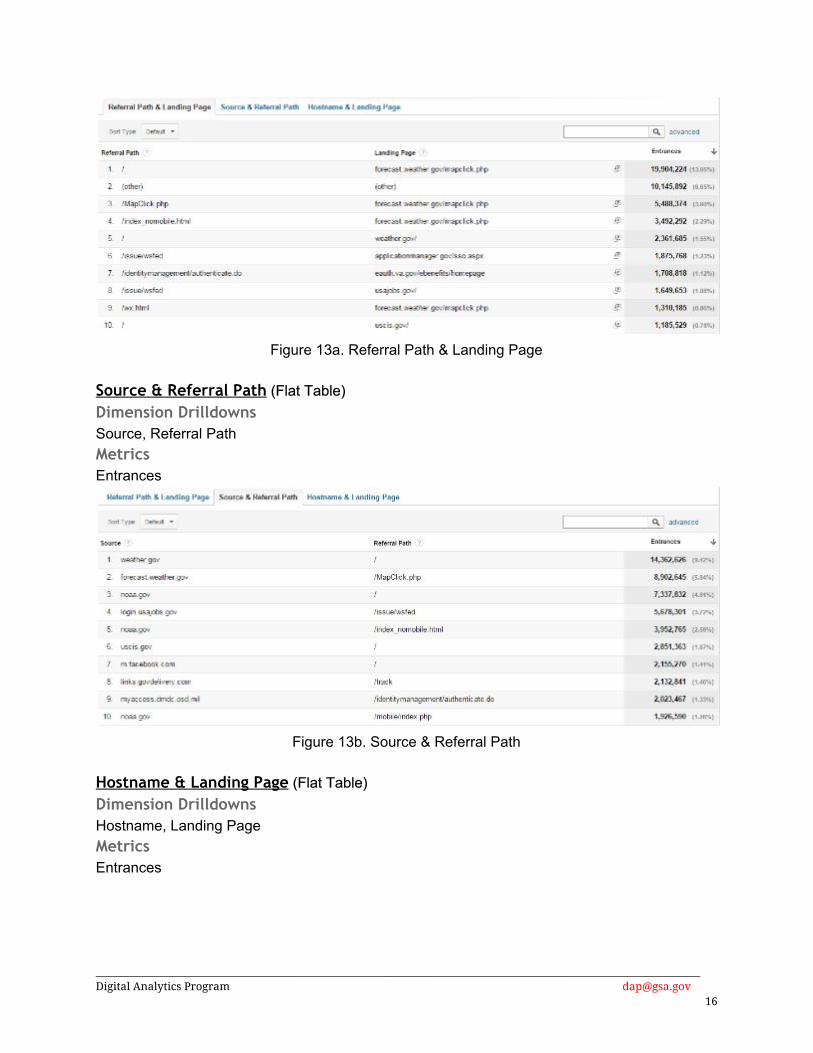
Figure 13a. Referral Path & Landing Page
Source & Referral Path (Flat Table) Dimension Drilldowns Source, Referral Path Metrics Entrances
Figure 13b. Source & Referral Path
Hostname & Landing Page (Flat Table) Dimension Drilldowns Hostname, Landing Page Metrics Entrances
________________________________________________________________________________________________________________________ Digital Analytics Program [email protected]
16

Figure 13c. Hostname & Landing Page
14. 404 Diagnostics Report The 404 Diagnostics Report from the Google Analytics blog helps you to resolve 404 errors. You can find referring links that are linking to nonexistent pages and internal links that need fixing. Be sure to change the filter for the 404 page title to the one that is used on the website of interest.
Bad Inbound Links Metrics Entrances Dimension Drilldowns Landing Page >> Full Referrer Filter Include Page Title Regex “Page not found”
________________________________________________________________________________________________________________________ Digital Analytics Program [email protected]
17

Figure 14a. Bad Inbound Links Bad Internal Links Metrics Sessions Dimensions Drilldowns Hostname >> Referral Path Filter Include Page Title Regex “Page not found”
Figure 14b. Bad Internal Links hostname drilldown
DASHBOARDS
1. Gov-Wide 10 Common Web Metrics: The GovWide 10 Common Web Metrics dashboard allows agencies to most common metrics across agencies. It gives a snapshot of users and user engagement.
________________________________________________________________________________________________________________________ Digital Analytics Program [email protected]
18

Figure 15. Ten Common Web Metrics
2. Gov-Wide Social Media Traffic Trends: The GovWide Social Media Traffic Trends dashboard allows agencies to see their agency’s traffic referred from social media*. It allows you to compare across governmentwide trends. If you use a link shortener, Google Analytics does not pick up the social network referrer and may actually categorize the data in the wrong referral source. There are alternatives to link shorteners.
Figure 16. Social Media Traffic Trends
________________________________________________________________________________________________________________________ Digital Analytics Program [email protected]
19

3. Gov-Wide Mobile Trends Dashboard The GovWide Mobile Trends Dashboard allows agencies to see their agency’s mobile sessions penetration and compare to govwide trends.
Figure 17. Mobile Trends Dashboard
4. Gov-Wide Real-Time Social Media Dashboard The GovWide RealTime Social Media Dashboard presents social media activity across agencies in realtime.
Figure 18. RealTime Social Media Dashboard
________________________________________________________________________________________________________________________ Digital Analytics Program [email protected]
20

SEGMENTS
1. Inquisitive Traffic Segment This segment from Paul Gailey Alburquerque is an inclusive filter for traffic which contains the words 'how', 'what', 'when', 'why,' etc. It’s useful to see what questions people need the answers to.
Figure 19. Report with Inquisitive Traffic Segment
2. Social Media Sessions This segment will display data for sessions that come in from various social networks including Facebook, Twitter, LinkedIn, etc. It provides you with an idea of how social channels perform as traffic drivers. If you use a link shortener, Google Analytics does not pick up the social network referrer and may actually categorize the data in the wrong referral source. There are alternatives to link shorteners.
________________________________________________________________________________________________________________________ Digital Analytics Program [email protected]
21

Figure 20. Report with Social Media Segment
3. Sessions Containing Long-Tail Keywords in Search Engine Query This segment from Google Analytics evangelist Avinash Kaushik focuses on helping you understand the balance between keywords and key phrases in the queries input by users into search engines. It counts search queries with 3, 4, 5, 10, 20 and 20+ words. It helps you to view the length of the search tail, specifically for searches that include more than one or two keywords.
Figure 21. Report with LongTail Keyword Searches
________________________________________________________________________________________________________________________ Digital Analytics Program [email protected]
22

SAMPLING When running custom reports in DAP, users should be aware that data presented in reports may be sampled, i.e., DAP GA selects a subset of the data and reports numbers based on the trends detected in that sample set. DAP GA samples data because it enables the software to process data and return results more quickly. The way to tell if data in the report is illustrated below (Figure 22). Specifically, in a report, there is a statement under the date range that reads, “This report is based on…” a certain number and percentage of sessions.” In a dashboard, the bottom of the widget will indicate the percentage of total amount of data. If those numbers are less than 100%, then the data is sampled.
Figure 22. Sampling Indicator
To access more accurate, unsampled data, click on the Export dropdown menu beneath the report title and select Unsampled Export.
Figure 23. Unsampled Export
A dialog window will appear, allowing you to configure the download options.
________________________________________________________________________________________________________________________ Digital Analytics Program [email protected]
23

Figure 24. Unsampled Export Dialog Window
Depending on how much data there is to process, the report could take a couple minutes or a couple of hours. To download the unsampled report, click on Customization from the top menu and select Unsampled Reports from the left navigation. If the report has been compiled, it will be listed.
________________________________________________________________________________________________________________________ Digital Analytics Program [email protected]
24