cushman & wakefield & ssa uk self storage survey 2015
TRANSCRIPT

2015
THE SELF STORAGE ASSOCIATION UK ANNUAL SURVEY
A Cushman & Wakefield Publication


INTRODUCTION
SUMMARY OF KEY FINDINGS
INDUSTRY OVERVIEW
THE YEAR IN HIGHLIGHTS
MACRO ECONOMIC OVERVIEW
DEMAND SURVEY
OUTLOOK & BUSINESS CONFIDENCE
RENTAL RATES
OCCUPANCY
OTHER OPERATING METRICS
EXPANSION ACTIVITY
REFERENCES
SURVEY DATA
CONTRIBUTORS
CONTACT LIST
3THE SELF STORAGE ASSOCIATION UK CUSHMAN & WAKEFIELD
CONTENTS
5
6
7
16
18
22
30
32
36
38
41
43
46
47
48

4

5CUSHMAN & WAKEFIELD
This is the ninth consecutive annual survey carried out by the Self Storage Association UK (SSA UK) among its members. This year the report has been produced in conjunction with Cushman & Wakefield, which has extensive experience valuing self storage properties both in the UK and Europe, the US and Asia. Survey responses this year were returned by 73 separate companies covering 433 self storage facilities. While there are slightly fewer companies than last year (79) there are more facilities represented (403). This sample represents over 40% of the self storage sites in the country, and over 60% of total storage space. Responses to questions in the survey related to company and facility positions at 31 December 2014.
Whilst the core questions in the survey remain static year-on-year, allowing us to identify long-term trends, some variations are made each year to improve our knowledge of the market. This year the question on staffing has been split into the number of full-time and part-time staff. We have added a category for large units and workshops. We have also added additional questions in relation to moves in and out, or ‘churn’ of customers, and expanded the average length of stay question to cover both current customers at a fixed point in time and customers that have moved out over the period. In recognition of the increasing number of container operators in the market, we have also expanded the pricing questions to include container income in isolation.
Last year, for the first time, the report included the results of a Demand Survey carried out by YouGov (on behalf of the SSA UK). This was repeated this year with identical questions. This data provides a counterbalance to the operators’ survey and enriches this report providing a more rounded view of the industry. In having two years of data we can firstly validate the data taken last year but also begin to see any trends in customer perception of the industry. In future years, these trends will become even more apparent and may be able to be correlated with changes in the industry or its operating environment. As in previous reports, we have inserted quotes from operators which have been taken from a small number of interviews carried out by Cushman & Wakefield with both large and small firms. Some of these interviews were filmed and can be seen in their entirety on the SSA UK and Cushman & Wakefield websites.
We hope that you find this year’s report interesting. We would invite feedback both from SSA UK members and other readers, in particular on the additional content included this year but all suggestions for changes would be welcome.
Finally, we would like to thank the members of the SSA UK who responded so promptly to the Survey this year and the team at Cushman & Wakefield for collating the data, providing commentary and interpretation of the data and producing the final report. Also thanks to Big Yellow and Safestore for assisting with the YouGov element of the survey.
INTRODUCTION
THE SELF STORAGE ASSOCIATION UK

DEMAND SURVEYThe second demand survey carried out in January 2015 produced results which correlate well with the same survey undertaken last year, which confirms that the sample size is appropriate and that the results are robust. The survey shows that although there has been an improvement in public awareness over the 12 months, the general level of awareness of self storage as a product remains low.
• 55% of respondents (62% in 2014) have either limited or no knowledge of the product.
• Awareness in the South of England, and in London in particular is higher.
• Only 53% of respondents agreed that self storage offers a range of unit sizes to meet people’s needs.
• Only 37% of consumers agreed that self storage contracts are flexible.
• Only 32% of consumers realised that only they could access their goods in self storage, not the store staff.
• Only 60% of the survey group could name a self storage business in their local area. Direct visibility to the road is the key driver for site recognition.
• Unprompted brand awareness is poor. 67% of respondents could not name any self storage brand. However, for those that could name a brand, Big Yellow’s name was the most recognised by a significant margin.
• Consumers have limited knowledge of the cost of renting self storage space with 31% not knowing what the monthly cost of renting a 90 sq ft might be and a further 55% believing that it would be less than the likely actual amount.
INDUSTRY SURVEYFrom the survey of members as at 31 December 2014 we highlight the following key findings:
• Operators are more optimistic about the outlook for 2015, with no respondents reporting an anticipated drop in profitability and nearly 80% expecting improved profitability.
• Over 80% of respondents expect empty room rates to grow by more than inflation (100% in London).
• Operators in London and the South East are the most optimistic.
• Average occupancy for mature stores (those stores open for more than six years) was broadly flat at 70% (of maximum lettable area) over the last 12 months.
• On all stores in the survey occupancy was circa 70% on current lettable area and circa 65% on the maximum lettable are.
• The average rental rate for all stores showed an increase over the year of 7.1% to £21.00 per sq ft per annum. This virtually matches the rental rate as at 31 December 2011, the last reported result before the addition of VAT onto all self storage fees. Although the sample group has changed over the survey years, the sample size ensures the data trends are relevant.
SUMMARY OF KEY FINDINGS
6

After a period of limited new store openings following the recession, the self storage industry is definitely beginning to grow, putting on around 1.3 million square foot of space in 2014. It is always hard to accurately measure the exact number of self storage sites, as they are not officially registered anywhere and small container based operations can open in rural areas with limited marketing or online presence. The SSA estimates that there are now around 1,022 self storage sites in the UK, of which 159 supply container storage only. This is just under a 13% increase in the number of new container sites compared to 2013.
Almost half of all new sites opened in 2014 had some container storage. In total there is approximately 35.7 million sq ft of self storage space in the UK. This equates to an average of 0.56 sq ft of storage space per person in the UK (based on a population of 64.1 million). In comparison, the latest figures from the US and Australasia are 7.3 sq ft per person and 1.6 sq ft per person respectively.We estimate that the total turnover of the industry in 2014 was £402 million among approximately 440 operators. In all, these firms employed around 2,100 staff (full time equivalents).
Of the total number of self storage facilities in the UK, 346 are held by large operators which represents circa 35% by number (see table below). Large operators are defined as those managing 10 or more sites. However, since these operators tend to have larger sites, and many are located in higher rent locations, in terms of total space available and revenue, their share of the market is likely to be greater than 50%.
INDUSTRY OVERVIEW
TABLE 1
POPULATION (MILLIONS)
SPACE (SQ FT)
SUPPLY (SQ FT PER PERSON)
London 8,600,000 8,900,000 1.03
Greater Manchester 2,700,000 2,300,000 0.85
Birmingham 1,085,000 480,000 0.44
Leeds 780,000 470,000 0.60
Glasgow 596,000 440,000 0.74
Edinburgh 495,000 480,000 0.97
Liverpool 467,000 280,000 0.60
Bristol 437,500 330,000 0.75
Cardiff 325,000 235,000 0.72
Note, the regions used for this table are slightly different to previous surveys to provide consistency with other regional analysis in this document and other government data.
SSA UK ANNUAL SURVEY
7CUSHMAN & WAKEFIELD
There is 35.7 million sq ft of self storage space in the UK
THE SELF STORAGE ASSOCIATION UK

8
Several operators manage stores for third party owners. By stores managed the largest operators are as follows:
NO. OF STORES MANAGED
Safestore 110
Big Yellow 83
Access Self Storage 58
Lok’nStore 27
Storage King 24
Shurgard 23
Ready Steady Store 19
Big Box 16
TOTAL 360
TABLE 3
The five largest operators in the UK manage 29.5% of the self storage stores, while in the US the top five own or manage only 11.5%
NO. OF STORES BY BRAND
Safestore 98
Big Yellow 69
Access Self Storage 55
Storage King 24
Lok’nStore 24
Shurgard 22
Big Box 16
Armadillo (Managed by Big Yellow) 14
Alligator (Managed by Ready Steady Store) 12
Space Maker (Managed by Safestore) 12
TOTAL 346
TABLE 2
SSA UK ANNUAL SURVEY
9CUSHMAN & WAKEFIELD
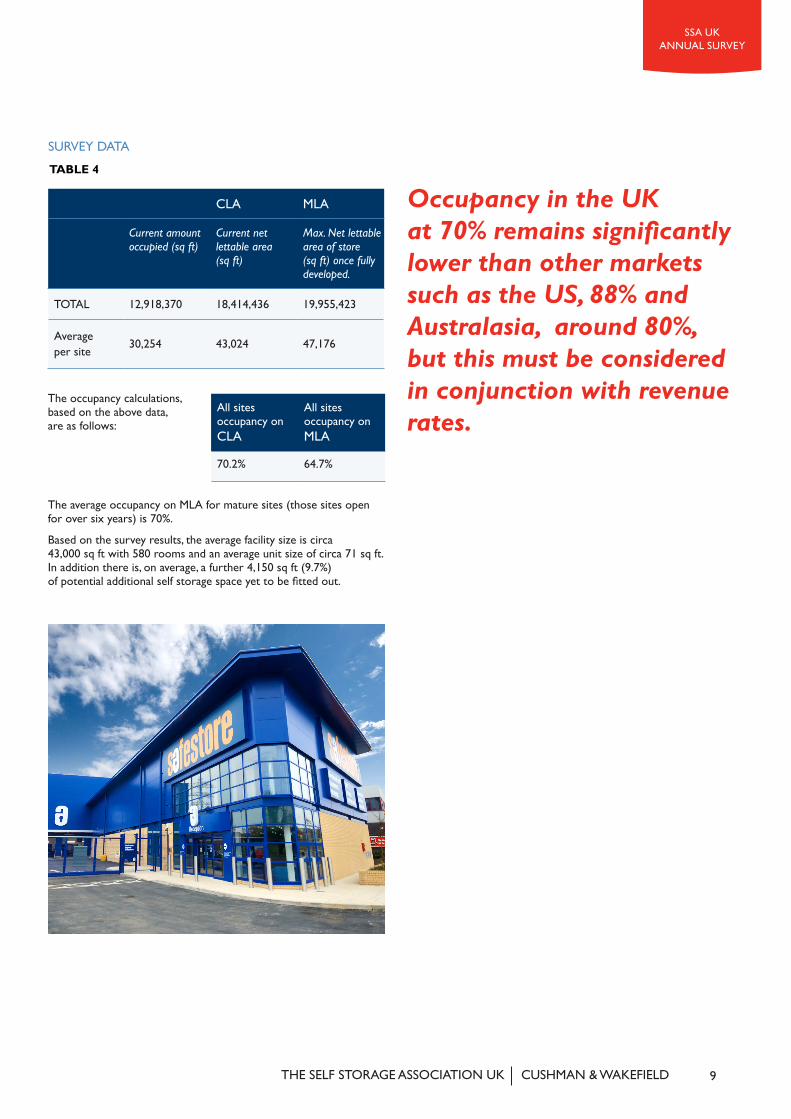
SURVEY DATA
TABLE 4
CLA MLA
Current amount occupied (sq ft)
Current net lettable area (sq ft)
Max. Net lettable area of store (sq ft) once fully developed.
TOTAL 12,918,370 18,414,436 19,955,423
Average per site 30,254 43,024 47,176
All sites occupancy on CLA
All sites occupancy on MLA
70.2% 64.7%
The occupancy calculations, based on the above data, are as follows:
The average occupancy on MLA for mature sites (those sites open for over six years) is 70%.
Based on the survey results, the average facility size is circa 43,000 sq ft with 580 rooms and an average unit size of circa 71 sq ft. In addition there is, on average, a further 4,150 sq ft (9.7%) of potential additional self storage space yet to be fitted out.
Occupancy in the UK at 70% remains significantly lower than other markets such as the US, 88% and Australasia, around 80%, but this must be considered in conjunction with revenue rates.
THE SELF STORAGE ASSOCIATION UK

0
10
20
30
40
50
90,0
00+
90,0
00
85,0
00
80,0
00
75,0
00
70,0
00
65,0
00
60,0
00
55,0
00
50,0
00
45,0
00
40,0
00
35,0
00
30,0
00
25,0
00
20,0
00
15,0
00
10,0
00
5,00
0or
less
SQ FT
FIG. 1 - Number of facilities by CLA
We analysed the 2014 data to show the spread of store sizes across the industry. The most common sized stores are in the 30,000 to 50,000 sq ft range (the UK average being 43,000 sq ft), although there are a high number of smaller stores. From its most recent published data Big Yellow’s average store size is circa 63,000 sq ft and the figure for Safestore’s UK portfolio is circa 42,300 sq ft. Lok’nStore has an average MLA of circa 51,000 sq ft across its portfolio.
10

SSA UK ANNUAL SURVEY
The survey indicates that the balance between freehold/long leasehold and short leasehold has remained relatively stable over recent years, with 78% of stores currently held freehold or long leasehold. The majority of operators prefer the freehold model but will consider leaseholds where a freehold cannot be secured, or where limited funding is a constraint.
FIG. 2 - Ownership type (%)
2014
2013
2012
2011
2010
2009
2008
2007
2006
Freehold or long leaseholdShort leasehold (less than 25 years)
0
20
40
60
80
100
TABLE 5
DO YOU HAVE CONTAINER STORAGE?
No Container Storage 78%
Part container storage 14%
All container storage 8%
0
20
40
60
80
100
2014
2013
2012
2011
2010
2009
2008
2007
2006
Converted warehousePurpose-builtContainers only
FIG. 3 - Type of facility (%)
Over time the proportion of purpose built stores has risen, with 33% purpose built as at December 2014 and 59% being conversions. The remainder are container only sites, which have also significantly grown in presence over the last two years. It should be noted that this graph represents the number of stores, not the floor space. Often container sites are much smaller than purpose built sites in particular.
11CUSHMAN & WAKEFIELD
NICK POOLE Fort Locks Self Storage
%
%
Operators are using container storage as a lower capital means to enter the industry.
“”
THE SELF STORAGE ASSOCIATION UK
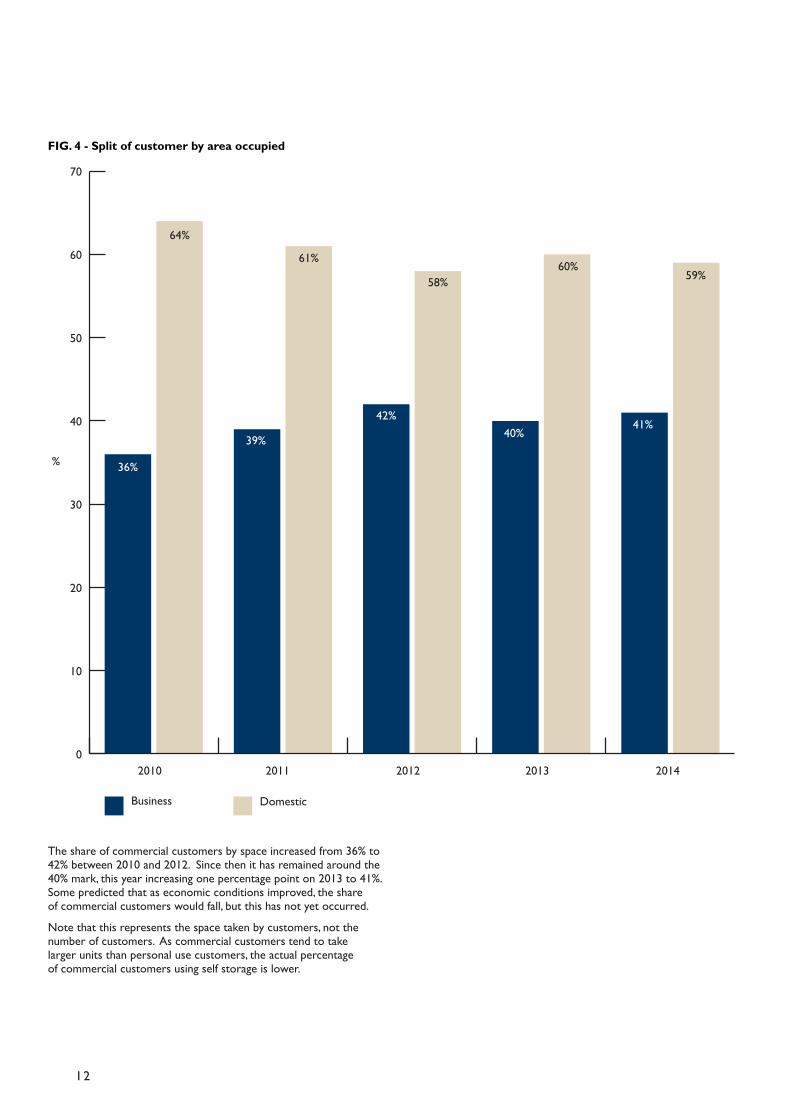
FIG. 4 - Split of customer by area occupied
The share of commercial customers by space increased from 36% to 42% between 2010 and 2012. Since then it has remained around the 40% mark, this year increasing one percentage point on 2013 to 41%. Some predicted that as economic conditions improved, the share of commercial customers would fall, but this has not yet occurred.
Note that this represents the space taken by customers, not the number of customers. As commercial customers tend to take larger units than personal use customers, the actual percentage of commercial customers using self storage is lower.
12
0
10
20
30
40
50
60
70
20142013201220112010
Business Domestic
36%
39%
42%40%
41%
64%
61%
58%60%
59%
%
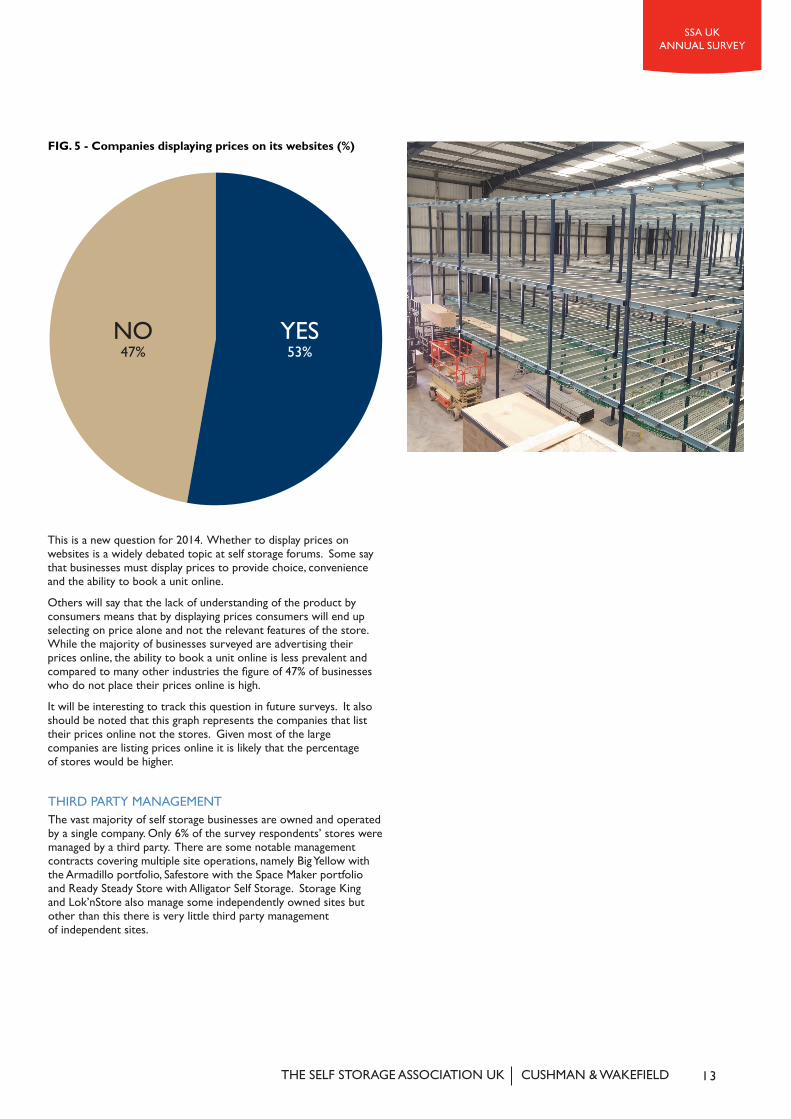
FIG. 5 - Companies displaying prices on its websites (%)
NO47%
YES53%
This is a new question for 2014. Whether to display prices on websites is a widely debated topic at self storage forums. Some say that businesses must display prices to provide choice, convenience and the ability to book a unit online.
Others will say that the lack of understanding of the product by consumers means that by displaying prices consumers will end up selecting on price alone and not the relevant features of the store. While the majority of businesses surveyed are advertising their prices online, the ability to book a unit online is less prevalent and compared to many other industries the figure of 47% of businesses who do not place their prices online is high.
It will be interesting to track this question in future surveys. It also should be noted that this graph represents the companies that list their prices online not the stores. Given most of the large companies are listing prices online it is likely that the percentage of stores would be higher.
SSA UK ANNUAL SURVEY
13CUSHMAN & WAKEFIELD
THIRD PARTY MANAGEMENTThe vast majority of self storage businesses are owned and operated by a single company. Only 6% of the survey respondents’ stores were managed by a third party. There are some notable management contracts covering multiple site operations, namely Big Yellow with the Armadillo portfolio, Safestore with the Space Maker portfolio and Ready Steady Store with Alligator Self Storage. Storage King and Lok’nStore also manage some independently owned sites but other than this there is very little third party management of independent sites.
THE SELF STORAGE ASSOCIATION UK

14
EUROPE It is always difficult to calculate the true size of the self storage industry in any region as there are, and always will be, a number of companies which are entering the market in a small way, ‘testing the water’, or suggesting that they are self storage providers when actually they are not. Associations gathering data on their industry are often not aware of these smaller operators and will traditionally have stronger data on their members, than non-member operations. Over the past year, the Federation of European Self Storage Associations (FEDESSA) and its members have, however, increased its efforts to measure the size of the self storage industry, including the non-member sites, in every European country.
We estimate therefore that there are around 2,440 facilities of any note across Europe, (including the UK which has an estimated 1,022 facilities). The total current size of the industry including the UK
TABLE 6
COUNTRY POPULATION EST NO. OF FACILITIES SIZE SQ FT SQ FT PER PERSON STORAGE FACILITIES
PER MILLION POP
Austria 8,505,000 25 807,293 0.09 2.94
Belgium 11,199,000 29 1,370,396 0.12 2.59
Czech Republic 10,517,000 3 108,952 0.01 0.29
Denmark 5,634,000 50 1,596,654 0.28 8.87
Estonia 1,316,000 2 21,528 0.02 1.52
Finland 5,458,000 54 1,136,669 0.21 9.89
France 65,931,000 330 9,706,894 0.15 5.01
Germany 80,716,000 131 4,219,453 0.05 1.62
Hungary 9,879,000 1 64,583 0.01 0.10
Iceland 326,000 5 53,820 0.16 15.32
Ireland 4,593,000 25 863,535 0.19 5.44
Italy 60,768,000 45 1,727,608 0.03 0.74
Latvia 1,997,000 2 53,820 0.03 1.00
Norway 5,124,000 60 1,170,575 0.23 11.71
Poland 38,496,000 6 163,073 0.00 0.16
Portugal 10,478,000 16 532,814 0.05 1.53
Romania 19,943,000 2 86,111 0.00 0.10
Spain 46,610,000 210 4,498,066 0.10 4.51
Sweden 9,685,000 112 4,161,242 0.43 11.56
Switzerland 8,161,000 28 641,960 0.08 3.43
The Netherlands 16,860,000 264 8,496,536 0.50 15.66
UK (incl containers) 64,106,000 1022 35,700,000 0.56 15.94
TOTALS 486,302,000 2422 77,181,581 0.16 4.98
is over 77 million sq ft. After the UK, France and the Netherlands continue to have the bulk of European self storage space, with Germany and Spain the next largest markets, followed closely by Sweden.
When considering the amount of storage per person, the UK continues to lead, although very closely followed by the Netherlands and Sweden, which have around three times as much storage space per person as the European average of 0.16 sq ft per person. Outside of the UK, we estimate that 37% of the facilities are held by large operators (large operators are defined as those managing 10 or more facilities), which hold 45% of the total available space.

15CUSHMAN & WAKEFIELD
SSA UK ANNUAL SURVEY
Denmark 2%
Belgium 2%Norway 2%
Finland 1%
UK 45%
Switzerland 1%
Ireland 1%
Italy 2%
Germany 5%
Sweden 5%
Others 5%
Spain 6%
Netherlands 11%
France 12%
FIG. 6 - European industry by space
There are around
notable facilities across Europe
2,440
THE SELF STORAGE ASSOCIATION UK

JANUARYBig Box acquired Alligator Self Storage in Brighton
JANUARY
JANUARYUK average house prices surpass £250,000 for the first time
FEBRUARY•Safestore share price exceeds 200p for the first time since 2007.
APRILW1 Self Storage opens, becoming the most centrally located store in London
APRILA joint venture between Big Yellow and an Australian consortium acquired the 10-store Armadillo portfolio
APRILBig Yellow opensGypsy Corner store (London, W3)
TRANSACTIONS
MAYEasistore opens in Maidstone
AUGUSTStorage King acquired a facility in Doncaster from a franchisee
JULYFort Box (Oxford) was acquired by Big Yellow
OCTOBERReady Steady Store purchased the 12-store Alligator Self Storage portfolio
DECEMBERUK house prices increased by 9.8% in the year to December 2014
DECEMBER• Big Yellow share price exceeds 600p for the first time since 2007• Lok’nStore share price at the highest level since 2007
DECEMBERBig Yellow purchased itsJV partner’s (Pramerica) equity interest in the Big Yellow Joint Venture
NOVEMBERLok’nStore relocates to a new purpose built facility in Reading
PLC’S
OTHER
•Doug Hampson, divests his c.15% shareholding in Lok’nStore, acquired just two years earlier.
THE YEAR IN HIGHLIGHTS
16

JANUARYBig Box acquired Alligator Self Storage in Brighton
JANUARY
JANUARYUK average house prices surpass £250,000 for the first time
FEBRUARY•Safestore share price exceeds 200p for the first time since 2007.
APRILW1 Self Storage opens, becoming the most centrally located store in London
APRILA joint venture between Big Yellow and an Australian consortium acquired the 10-store Armadillo portfolio
APRILBig Yellow opensGypsy Corner store (London, W3)
TRANSACTIONS
MAYEasistore opens in Maidstone
AUGUSTStorage King acquired a facility in Doncaster from a franchisee
JULYFort Box (Oxford) was acquired by Big Yellow
OCTOBERReady Steady Store purchased the 12-store Alligator Self Storage portfolio
DECEMBERUK house prices increased by 9.8% in the year to December 2014
DECEMBER• Big Yellow share price exceeds 600p for the first time since 2007• Lok’nStore share price at the highest level since 2007
DECEMBERBig Yellow purchased itsJV partner’s (Pramerica) equity interest in the Big Yellow Joint Venture
NOVEMBERLok’nStore relocates to a new purpose built facility in Reading
PLC’S
OTHER
•Doug Hampson, divests his c.15% shareholding in Lok’nStore, acquired just two years earlier.
SSA UK ANNUAL SURVEY
17CUSHMAN & WAKEFIELDTHE SELF STORAGE ASSOCIATION UK
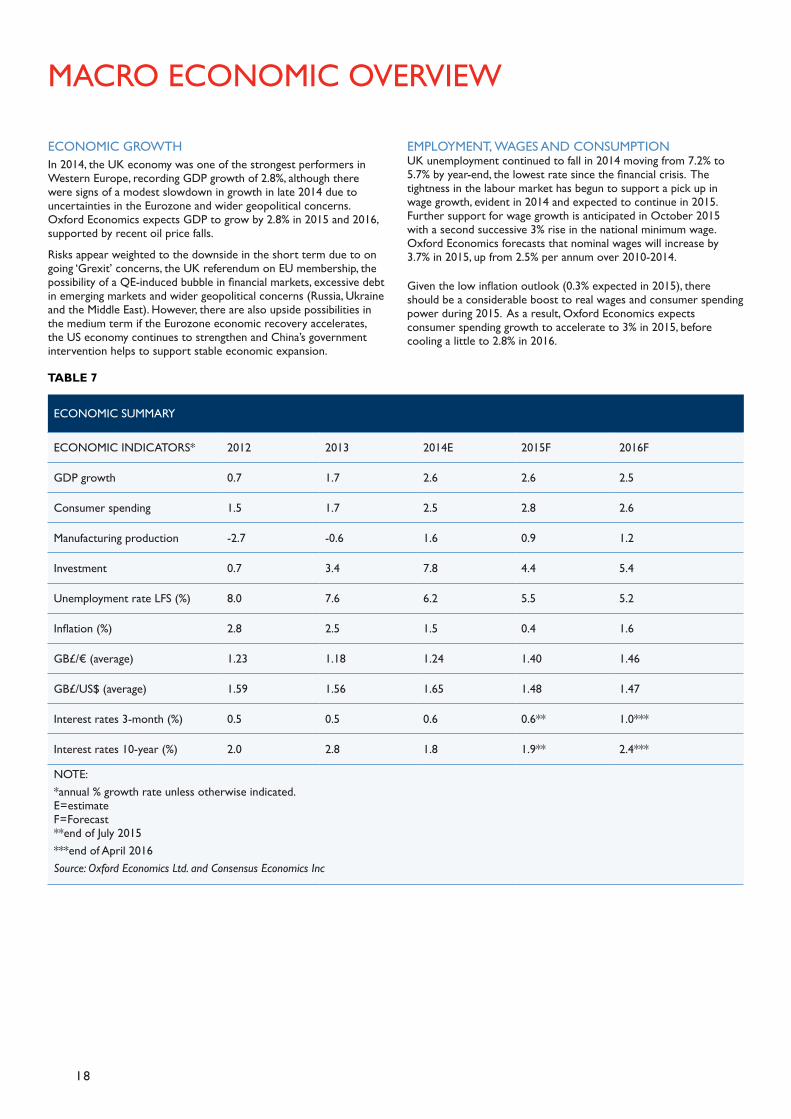
ECONOMIC GROWTHIn 2014, the UK economy was one of the strongest performers in Western Europe, recording GDP growth of 2.8%, although there were signs of a modest slowdown in growth in late 2014 due to uncertainties in the Eurozone and wider geopolitical concerns. Oxford Economics expects GDP to grow by 2.8% in 2015 and 2016, supported by recent oil price falls.
Risks appear weighted to the downside in the short term due to on going ‘Grexit’ concerns, the UK referendum on EU membership, the possibility of a QE-induced bubble in financial markets, excessive debt in emerging markets and wider geopolitical concerns (Russia, Ukraine and the Middle East). However, there are also upside possibilities in the medium term if the Eurozone economic recovery accelerates, the US economy continues to strengthen and China’s government intervention helps to support stable economic expansion.
MACRO ECONOMIC OVERVIEW
18
ECONOMIC SUMMARY
ECONOMIC INDICATORS* 2012 2013 2014E 2015F 2016F
GDP growth 0.7 1.7 2.6 2.6 2.5
Consumer spending 1.5 1.7 2.5 2.8 2.6
Manufacturing production -2.7 -0.6 1.6 0.9 1.2
Investment 0.7 3.4 7.8 4.4 5.4
Unemployment rate LFS (%) 8.0 7.6 6.2 5.5 5.2
Inflation (%) 2.8 2.5 1.5 0.4 1.6
GB£/€ (average) 1.23 1.18 1.24 1.40 1.46
GB£/US$ (average) 1.59 1.56 1.65 1.48 1.47
Interest rates 3-month (%) 0.5 0.5 0.6 0.6** 1.0***
Interest rates 10-year (%) 2.0 2.8 1.8 1.9** 2.4***
NOTE: *annual % growth rate unless otherwise indicated. E = estimate F = Forecast **end of July 2015 ***end of April 2016Source: Oxford Economics Ltd. and Consensus Economics Inc
TABLE 7
EMPLOYMENT, WAGES AND CONSUMPTION UK unemployment continued to fall in 2014 moving from 7.2% to 5.7% by year-end, the lowest rate since the financial crisis. The tightness in the labour market has begun to support a pick up in wage growth, evident in 2014 and expected to continue in 2015. Further support for wage growth is anticipated in October 2015 with a second successive 3% rise in the national minimum wage. Oxford Economics forecasts that nominal wages will increase by 3.7% in 2015, up from 2.5% per annum over 2010-2014.
Given the low inflation outlook (0.3% expected in 2015), there should be a considerable boost to real wages and consumer spending power during 2015. As a result, Oxford Economics expects consumer spending growth to accelerate to 3% in 2015, before cooling a little to 2.8% in 2016.

SSA UK ANNUAL SURVEY
19CUSHMAN & WAKEFIELD
ECONOMIC & POLITICAL BREAKDOWN
Population 64.7 million (2014)
GDP US$ 2,951.4 billion (2014)
Public sector balance -5.7% of GDP (2014)
Public sector debt 89.4% of GDP (2014)
Current account balance -5.5% of GDP (2014)
Parliament Conservative
Head of State Queen Elizabeth II
Prime Minister David Cameron
Election dates May 2020
INFLATION AND INTEREST RATESA combination of plummeting oil prices and competitive pricing by major supermarkets continued to drive down UK inflation in February to zero, which was the lowest since comparable records began in 1989. Economists believe that there is a strong chance of a negative reading over the next few months, with cuts to gas bills by four of the big six energy providers due to hit the index, the benefits of cheaper oil continuing to feed along the supply chain and the supermarket price war driving down food prices. Oxford Economics expects CPI inflation to average just 0.3% over 2015 as a whole.
Given the low inflationary environment, it is likely that the Bank of England Monetary Policy Committee will keep interest rates on hold in the short term, before increasing them gradually from 2016, reaching around 2.5% by 2019.
TABLE 8
-5
-4
-3
-2
-1
0
1
2
3
-5
-4
-3
-2
-1
0
1
2
3
2014
2013
2011
2009
2007
2005
2006
2008
2010
2012
GDP GROWTH (annual %) - left
INFLATION (annual %) - right
4
5
4
5
FF
2015
2016
FIG. 7 - Economic activity
Similar to 2010, there was a pre-election drop in domestic self storage enquiries in April but early signs indicate that has turned around in May.MIKE WILSON Smart Storage
“”
THE SELF STORAGE ASSOCIATION UK
20
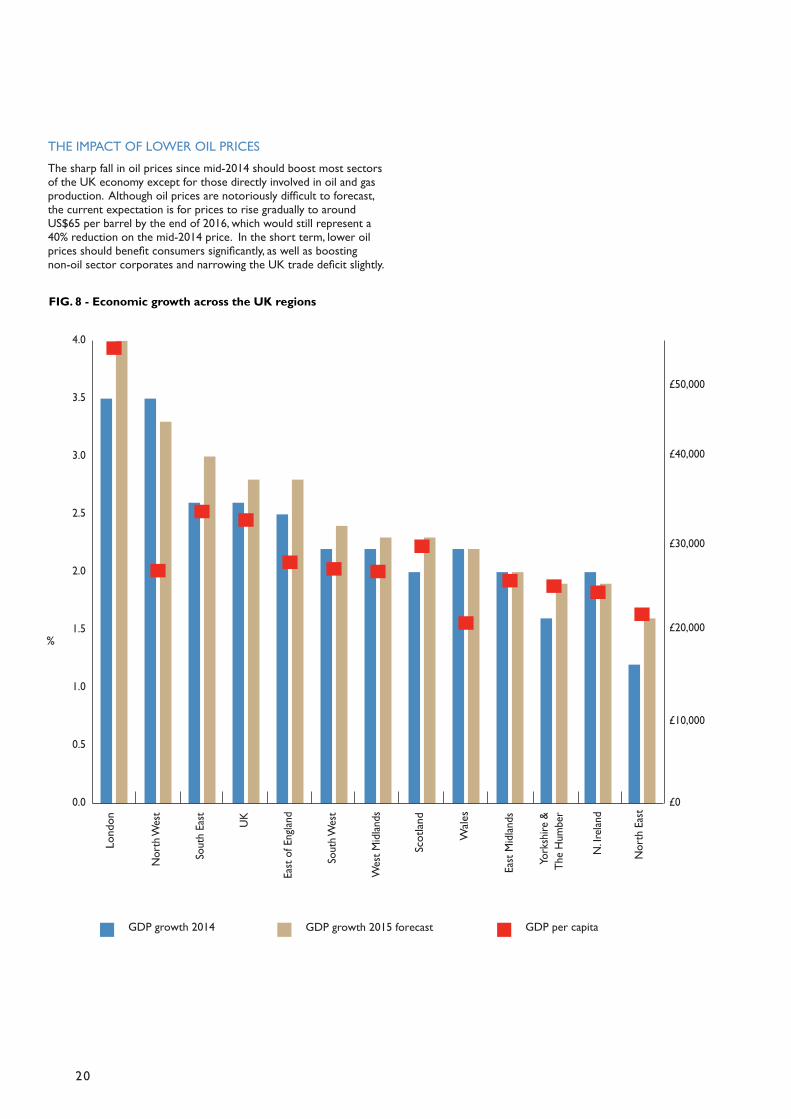
THE IMPACT OF LOWER OIL PRICESThe sharp fall in oil prices since mid-2014 should boost most sectors of the UK economy except for those directly involved in oil and gas production. Although oil prices are notoriously difficult to forecast, the current expectation is for prices to rise gradually to around US$65 per barrel by the end of 2016, which would still represent a 40% reduction on the mid-2014 price. In the short term, lower oil prices should benefit consumers significantly, as well as boosting non-oil sector corporates and narrowing the UK trade deficit slightly.
£0
£10,000
£20,000
£30,000
£40,000
£50,000
0.0
0.5
1.0
1.5
2.0
2.5
3.0
3.5
4.0
GDP growth 2014 GDP growth 2015 forecast GDP per capita
Lond
on
Nor
th W
est
Sout
h Ea
st UK
East
of E
nglan
d
Sout
h Wes
t
Wes
t Mid
lands
Scot
land
Wale
s
East
Mid
lands
York
shire
&
The
Hum
ber
N. Ir
eland
Nor
th E
ast
FIG. 8 - Economic growth across the UK regions
%

SSA UK ANNUAL SURVEY
21CUSHMAN & WAKEFIELD
POLITICAL CLIMATEAt the time of writing, the Conservative party had just won a slim majority in the UK general election and Ed Miliband, Nick Clegg and Nigel Farage had resigned as the leaders of their respective parties. The result is likely to bring a feeling of certainty and stability to the UK economy and has already been reflected in the markets, with the FTSE 100 jumping by 2% immediately after the results, adding £50 billion to the value of British companies. However, David Cameron will continue the Conservative party’s austerity plan with the aim of running an overall surplus by the end of the next parliament. Nicola Sturgeon’s success as leader of the Scottish National Party has raised questions over the future direction and management of the United Kingdom although opinion polls suggest that there has been little movement since the ‘no’ vote last year. The main concern arising from the election result is the UK’s position in Europe after David Cameron’s promise for a referendum which might be brought forward to 2016 and could worry investors.
UK REGIONAL OUTLOOKAcross the UK, all regions are currently growing, most at a healthy pace, with London and the South East continuing to beat the average. The devolved regions, Midlands and parts of the North are recovering the slowest with this pattern set to continue during 2015. The North West, has notably been one of the top performing regions driven by Manchester’s success in attracting high-value service activity which is providing the basis for better than average growth across the region. However, London is still the stand-out performer, both in a national, European and global context, and is set to continue to benefit from positive demographic trends and growth in emerging sectors and markets.
UK HOUSING MARKETThe performance of the UK housing market has been mixed recently, with uncertainty as to whether the current slowdown in activity is seasonal or part of a wider fundamental shift in the market. UK residential transactions are currently below average but likely to rise gradually during 2015. Whilst prospects for the economy and labour market look positive, tighter mortgage controls, rising price-to income ratios and the prospect of higher interest rates are all impacting on demand. The prime central London residential market is seeing a moderation in transactions and house prices. Prior to the election this could be attributed to the potential mansion tax and removal of non-dom status. The main constraint in the market is a lack of homes for sale, as reported by the RICS residential market survey (March 2015), which looks to be putting some potential buyers off from searching for a property.
100
200
300
400
500
2015
Q1
2014
Q1
2013
Q1
2012
Q1
2011
Q1
2010
Q1
2009
Q1
2008
Q1
2007
Q1
2006
Q1
2005
Q1
2004
Q1
Transactions (000s) 2004 - 2014 average
FIG. 9 - UK Residential Property Transactions
MARKET OUTLOOK
GDP: Growth to match the 2014 result in 2015.
Inflation: Likely to turn negative in the short term and pick up at the end of the year.
Interest rate: On hold until 2016 due to deflationary pressures.
Employment: Unemployment to continue to fall gradually.
TABLE 9
THE SELF STORAGE ASSOCIATION UK

In January 2015 the SSA UK commissioned a Demand Survey with YouGov. The survey was conducted online from 2,151 panelists selected at random from YouGov’s total panel of 350,000+ individuals. The responding sample was then weighted to provide a reporting sample representative of all UK adults (aged 18+).
The questions posed were the same as the previous survey carried out in January 2014. The questions were designed to measure the level of awareness and perceptions of the UK self storage industry. There is a good level of correlation between the 2015 and 2014 survey results which confirms that the sample size is adequate and the results are reliable.
I have heard of self storage and know
a reasonable amount about the service
that is offered
40%39%
23% 15%
I have never heard of self storage
31%36%
I have heard of self storage but know nothing about the
service that is offered
I have heard of self storage and know the service that
is offered very well
7% 9%
2014 2015
DEMAND SURVEY
22
What is your level of awareness of self storage?FIG. 10
60%
42%EAST
LONDON
50%SOUTH
43%WALES
39%MIDLANDS
23%N. IRELAND
40%NORTH
43%SCOTLAND
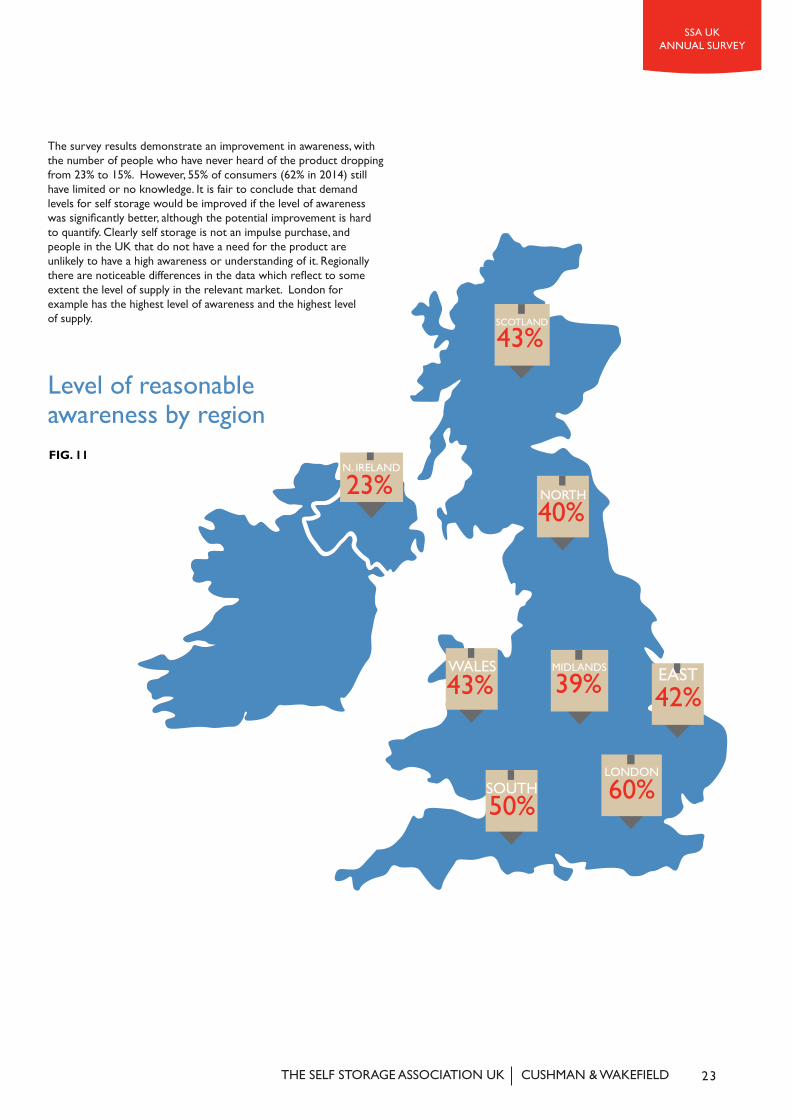
The survey results demonstrate an improvement in awareness, with the number of people who have never heard of the product dropping from 23% to 15%. However, 55% of consumers (62% in 2014) still have limited or no knowledge. It is fair to conclude that demand levels for self storage would be improved if the level of awareness was significantly better, although the potential improvement is hard to quantify. Clearly self storage is not an impulse purchase, and people in the UK that do not have a need for the product are unlikely to have a high awareness or understanding of it. Regionally there are noticeable differences in the data which reflect to some extent the level of supply in the relevant market. London for example has the highest level of awareness and the highest level of supply.
23CUSHMAN & WAKEFIELD
Level of reasonable awareness by regionFIG. 11
THE SELF STORAGE ASSOCIATION UK
SSA UK ANNUAL SURVEY
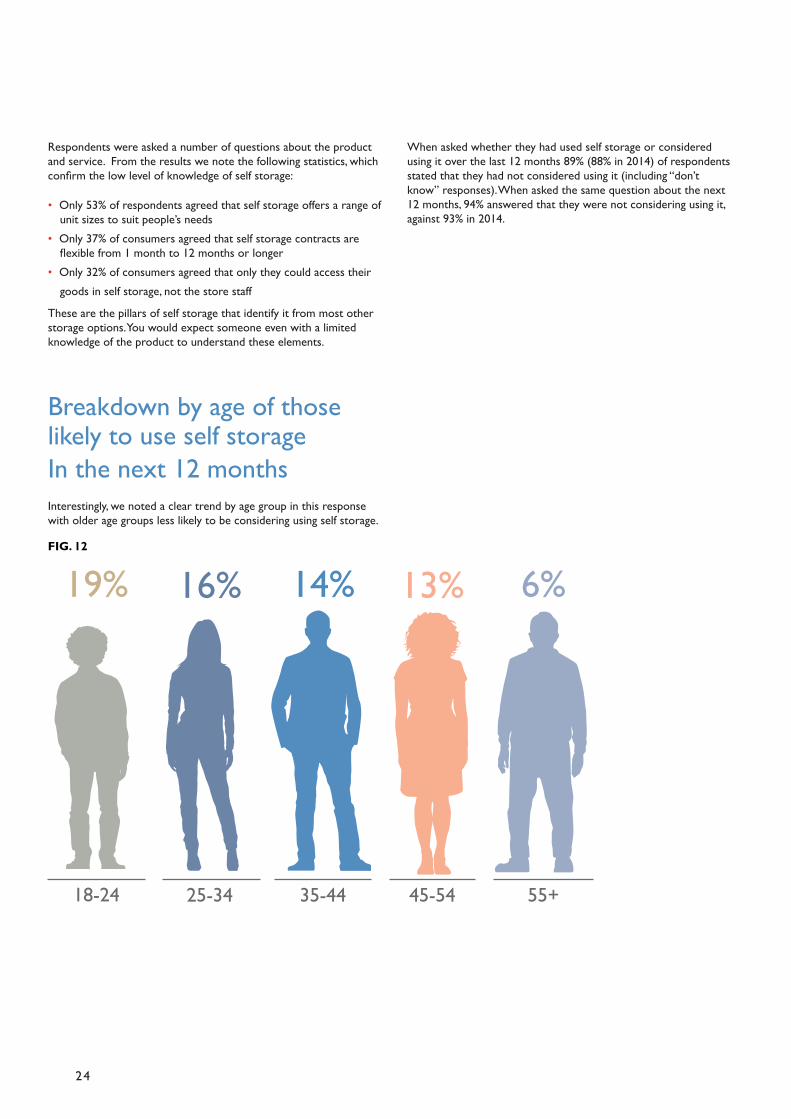
Breakdown by age of those likely to use self storage In the next 12 monthsInterestingly, we noted a clear trend by age group in this response with older age groups less likely to be considering using self storage.
24
18-24
19%
25-34
16% 14% 6%13%
45-5435-44 55+
Respondents were asked a number of questions about the product and service. From the results we note the following statistics, which confirm the low level of knowledge of self storage:
• Only 53% of respondents agreed that self storage offers a range of unit sizes to suit people’s needs
• Only 37% of consumers agreed that self storage contracts are flexible from 1 month to 12 months or longer
• Only 32% of consumers agreed that only they could access their goods in self storage, not the store staff
These are the pillars of self storage that identify it from most other storage options. You would expect someone even with a limited knowledge of the product to understand these elements.
When asked whether they had used self storage or considered using it over the last 12 months 89% (88% in 2014) of respondents stated that they had not considered using it (including “don’t know” responses). When asked the same question about the next 12 months, 94% answered that they were not considering using it, against 93% in 2014.
FIG. 12

7% 2%
None / don’t knowShurguardSelf StoreSafestoreOtherBig Yellow / Big Yellow Box
22%
3% 2% 2%
67%
25CUSHMAN & WAKEFIELD
Service satisfactionFrom the survey data, 11% of respondents had previous experience of using self storage (14% in 2014). Of those with previous experience only 11% (13% in 2014) expressed any dissatisfaction with the service received.
NOT AT ALL SATISFIED
NOT VERY SATISFIED
NEITHER SATISFIED OR DISSATISFIED
FAIRLY SATISFIEDVERY SATISFIED
2014
39% 40% 29% 38% 18% 11% 9% 8% 4% 3%
2015
While this is good indicative information and relatively consistent with last year’s results, the small sample size (only 11% of all respondents) should be noted.
Low unprompted brand awarenessWhen asked, 67% of survey respondents could not name any self storage brand (in 2014 it was 69%). This is consistent with the low level of awareness of the product. However, for those that could name a brand, Big Yellow’s name was the most recognised by a significant margin.
FIG. 14
FIG. 13
THE SELF STORAGE ASSOCIATION UK
SSA UK ANNUAL SURVEY

NONE 21%
BIG YELLOW
OTHER
ACCESS
51%SAFESTORE
10%
DON’T KNOW
18% SHURGUARD9%
5%
SELF STORE
2%
5%
In fact, Big Yellow’s brand was the most recognised in every region where it has a presence, with the brand being particularly strong in London and the South. Even in markets such as Scotland, where they only have one store, Big Yellow still is the most recognised self storage brand.
26
Brand awareness in London
More than 554321Don't know / can't recall
61% 60%
11%9%
4% 4%1% 1% 1%
2014 2015
0% 0%
1%
22%25%
Low location awarenessMirroring the above, 60% of the survey group (61% in 2014) could not think of a self storage business in their local area. In London, however, fewer people (47%) could not name a self storage business in their local area.
FIG. 15
FIG. 16 Awareness of self storage in local area
27CUSHMAN & WAKEFIELD
67% 69% Via an internet search(e.g. Google)
2014 2015
25%
19% 19%
12% 10%
Via the phone directory(i.e. Yellow Pages)
20%18%
24% Location(i.e. know a store near by)
Ask a friend or family member
Via my local newspaper
Social Media(e.g. Facebook, Twitter, LinkedIn)
Other1%
4%
1%
Don’t know/can’t recall12%? 12%?... ...
6%
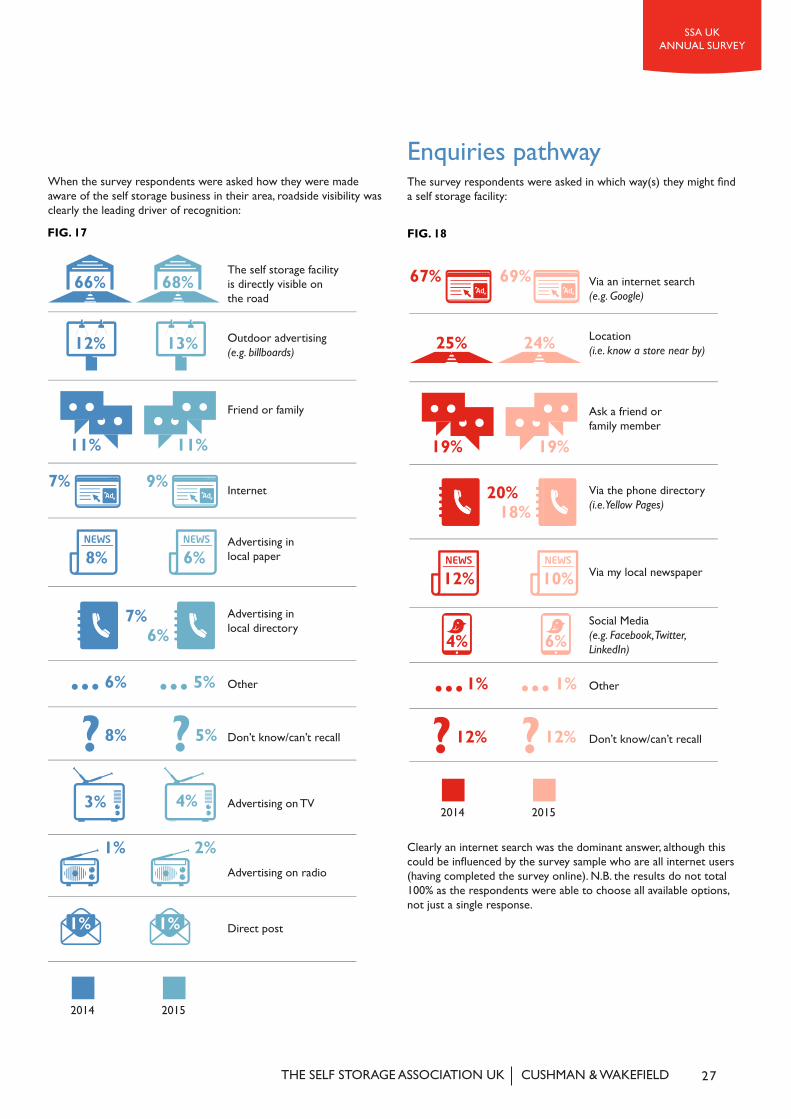
When the survey respondents were asked how they were made aware of the self storage business in their area, roadside visibility was clearly the leading driver of recognition:
Enquiries pathwayThe survey respondents were asked in which way(s) they might find a self storage facility:
Clearly an internet search was the dominant answer, although this could be influenced by the survey sample who are all internet users (having completed the survey online). N.B. the results do not total 100% as the respondents were able to choose all available options, not just a single response.
FIG. 17 FIG. 18
Advertising in local directory
2014 2015
66%
12% 13%
11% 11%
7% 9%
8% 6%
7%6%
68%The self storage facility is directly visible on the road
Outdoor advertising (e.g. billboards)
Friend or family
Internet
Advertising in local paper
Other6%... 5%...Don’t know/can’t recall8%? 5%?Advertising on TV3%
Advertising on radio
Direct post
4%
1%
1% 1%
2%
THE SELF STORAGE ASSOCIATION UK
SSA UK ANNUAL SURVEY
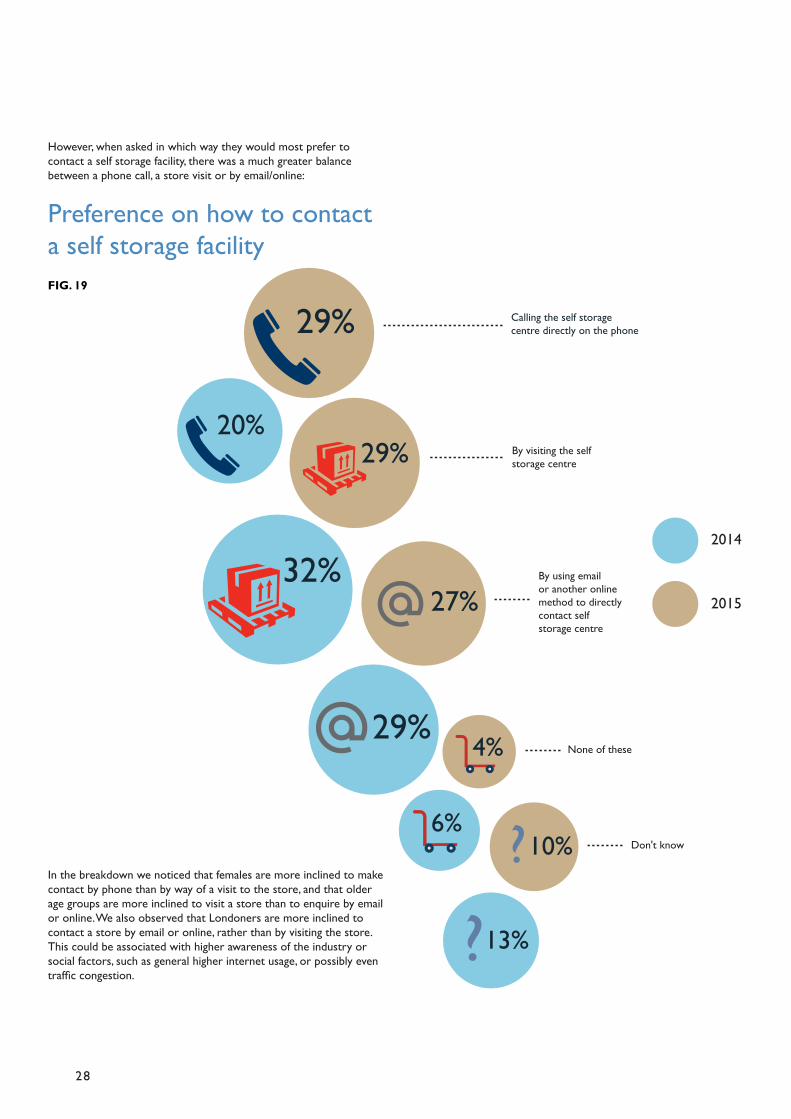
20%
Calling the self storage centre directly on the phone29%
32%
By visiting the self storage centre29%
By using email or another online method to directly contact self storage centre
27%
29%
13%?
Don't know10%?6%
None of these4%
2015
2014
However, when asked in which way they would most prefer to contact a self storage facility, there was a much greater balance between a phone call, a store visit or by email/online:
In the breakdown we noticed that females are more inclined to make contact by phone than by way of a visit to the store, and that older age groups are more inclined to visit a store than to enquire by email or online. We also observed that Londoners are more inclined to contact a store by email or online, rather than by visiting the store. This could be associated with higher awareness of the industry or social factors, such as general higher internet usage, or possibly even traffic congestion.
28
Preference on how to contact a self storage facilityFIG. 19

UK LONDON SOUTH NORTH
Indicative average net monthly rental rate for a 90 sq ft unit 158.00 182.00 126.00 88.00
Don't know 31.0% 26.3% 26.0% 35.0%
Less than £10 1.9% 2.3% 1.1% 2.5%
£10 to £50 20.3% 17.8% 22.4% 19.4%
£51 to £100 21.8% 21.0% 22.9% 21.6%
£101 to £150 10.8% 8.6% 14.1% 11.4%
£151 to £200 7.1% 12.3% 8.7% 3.1%
£201 to £250 4.0% 7.4% 2.9% 4.3%
More than £250 3.2% 4.3% 1.9% 2.8%
Actual rate range £151- £200
£201- £250
£151- £200
£101- £150
Don't know and below the actual rate 85.7% 88.3% 86.6% 78.5%
At or above the actual rate 14.4% 11.8% 13.5% 21.5%
Selected regional data
London has a low percentage of ‘don’t knows’ and the highest percentage of responses above £200 per month. Perhaps not surprising as it’s the location with highest awareness level and the highest property pricing.
From an operational perspective this has the advantage that many new customers will have no fixed view on what the service should cost. On the other hand, customers are likely to need some persuasion on pricing.
Pricing is obviously a crucial element of the business and the smarter operators will be able to maximise revenues in a low price-awareness environment.
Price expectationsRespondents were asked how much they thought it would cost per month to rent a 90 sq ft self storage unit, capable of storing the contents of a two bedroom house or flat in their local area:
Based on the operator survey results, the average monthly rent for a 90 sq ft unit would be circa £160, although this does vary significantly within regions and locations.
Interestingly, 31% of respondents didn’t know what the cost might be and a further 55% thought it would cost less than £150 (86% together).
Don't know
More than £250
£201 to £250
£151 to £200
£101 to £150
£51 to £100
£10 to £50Less than £10
31%
32%
3%
3%
4%
4%
7%
8%
11%
12%
22%
20%
20%
19%
2%
1%2014
2015
Price range
29CUSHMAN & WAKEFIELD
TABLE 10
FIG. 20
THE SELF STORAGE ASSOCIATION UK
SSA UK ANNUAL SURVEY

The 2013 survey demonstrated a marked improvement in business confidence. 2014’s survey built further on this mood, with no responses indicating any downturn in profits and 18% expecting a much better year in 2015.
With the imposition of VAT in October 2012 now absorbed, this optimism is a reflection of the UK’s improved economic position. It would seem that little business risk was being attributed to the General Election in May 2015 or other economic uncertainties, at the time of the survey responses.
OUTLOOK AND BUSINESS CONFIDENCE
FIG. 21 - Optimism regarding profits over the next year (%)
0
20
40
60
80
100
2014201320122011
Hard year
Slight downturn
Same as last year
Some improvement
Much better year
6% 7%18%
60%
79%
28%43%
31%44%
11%
7%10%6%
13% 10% 4%22%
Compared to the outlook for profits respondents were more optimistic about the outlook for rental rates over the next 12 months with over 80% expecting an inflation beating increase in 2015, although the UK inflation forecast for 2015 is low (0.3%). However, the regional picture on rental optimism is varied (see overleaf).
80%
15%
4%
<1%
Increase greater than inflationIncrease less than inflation
DecreaseNo change
FIG. 22 - Expected movement in rental rates over the next 12 months (%)
30

The industry is becoming much more pro-active with pricing. Many operators applying dynamic pricing models based on availability of individual unit sizes and seasonal factors.RENNIE SCHAFER CEO, SSA UK
“
”
OUTLOOK AND BUSINESS CONFIDENCE
0 20 40 60 80 100
WestMidlands& Wales
Scotland
EastMidlands
SouthWest
Yorkshire &The Humber
North
East ofEngland
SouthEast
London 100%
86% 5% 9%
84% 13% 3%
6%27%67%
71% 5% 24%
65% 19% 16%
64% 36%
63% 37%
47% 6% 47%
Increase greater than inflation Increase less than inflationNo change Decrease
FIG. 23 - Expectations for empty room rates over the year ahead, split by region (%)
FIG. 24 - Expectations for incentives over the year ahead (%)
0
10
20
30
40
50
60
70
80
IncreaseStay broadly the sameDecrease
2013
2014
25% 23%
74% 73%
1%4%
Operators’ expectations on the incentive levels offered to customers are very similar to last year’s survey with incentive levels not expected to increase in 2015.
There is some differentiation by region, with London having the greatest expectation of a decrease in incentives and two regions, South West and West Midlands/Wales where more than 10% of respondents anticipate an increase in incentives.
31CUSHMAN & WAKEFIELDTHE SELF STORAGE ASSOCIATION UK
SSA UK ANNUAL SURVEY

RENTAL RATES
FIG. 25 - Average net billed room rate (£ per sq ft per annum)
0
5
10
15
20
25
201420132012201120102009200820072006
£19.
63 £20.
63
£21.
08
£20.
49 £21.
97
£21.
06
£19.
96
£19.
61
£21
The net rent figure can be apportioned as follows, based on the survey data:
£ PER SQ FT PA
Containers only 11.05
Excluding Containers 21.87
Combined 21.00
32
The average net billed room rate increased by 7.1% in 2014 to £21.00 per sq ft per annum, taking it to virtually the same level as at December 2011, before the imposition of VAT in October 2012. This is also the first year the industry has had an increase in net rental rate since 2010 when the economic downturn began.
TABLE 11
FREDERIC DE RYCKMAN DE BETZ CEO, Attic Self Storage
Self storage in the UK appears to have weathered The Great Recession and the ill-judged imposition of VAT extremely well, and is beginning to attract keen investor interest as a result.
“
”

RENTAL RATES
0
5
10
15
20
25
30
UK Average
West Midlands and Wales
East Midlands
NorthYorkshire & the
Humber
SouthWest
ScotlandSouth East
East of England
London
2013
2014
£27.
95
£27.
26
£20.
51
£19.
91
£15.
59 £17.
47
£15.
64
£14.
87 £16.
56
£13.
88 £15.
27£17.
24
£13.
23
£14.
03
£14.
25
£14.
11
£21.
13
£20.
53
£19.
61 £21.
00
FIG. 26 - Average net billed room rate split by region (£ per square foot per annum)
As you would expect, there are significant regional variations to the average net rents being achieved:
Interesting to note is the apparent marginal drop in the average rental rate for London versus the increase in every other region bar one. However, this is most likely due to the change in the definition of the London region (now based on the UK defined NUTS regions) and a significant change in the number of stores included in the survey for London.
You will note on the next table that asking rents have remained relatively stable over the last 12 months, while net rental rates have improved, as shown above. This implies that there is less discounting occurring within the industry and that asking rates are becoming more reflective of the actual rates being paid by customers.
33CUSHMAN & WAKEFIELDTHE SELF STORAGE ASSOCIATION UK
SSA UK ANNUAL SURVEY
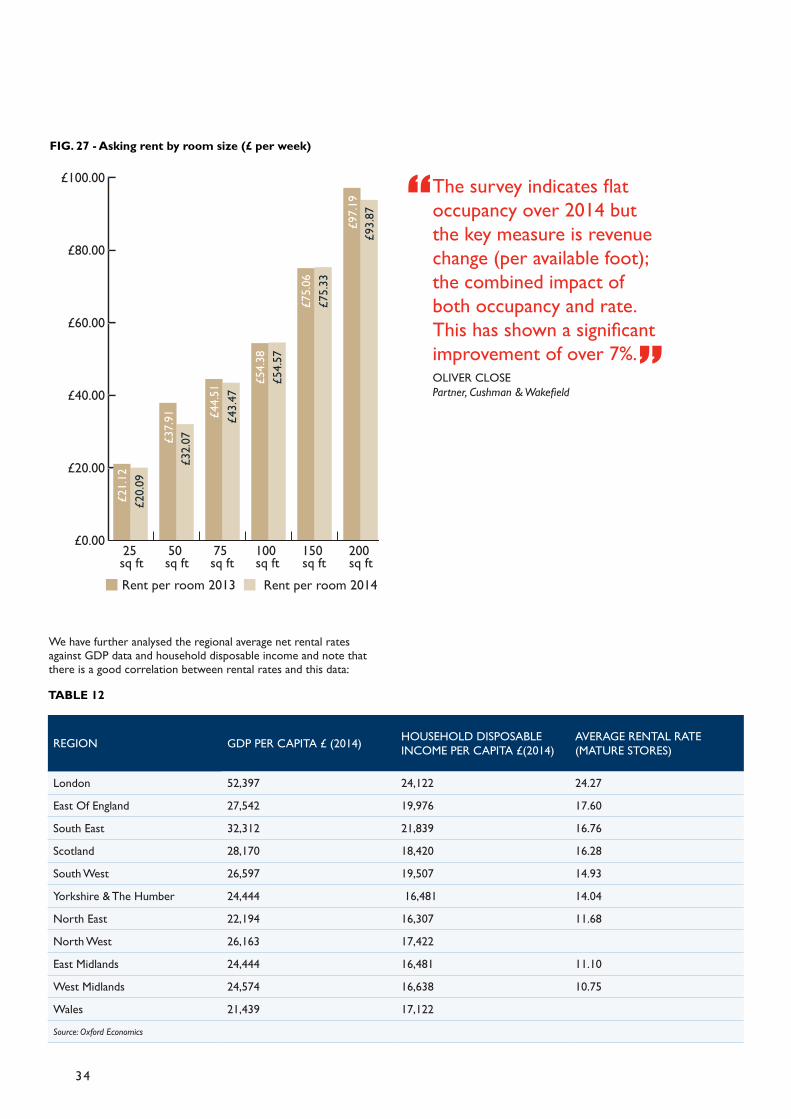
We have further analysed the regional average net rental rates against GDP data and household disposable income and note that there is a good correlation between rental rates and this data:
REGION GDP PER CAPITA £ (2014) HOUSEHOLD DISPOSABLE INCOME PER CAPITA £(2014)
AVERAGE RENTAL RATE (MATURE STORES)
London 52,397 24,122 24.27
East Of England 27,542 19,976 17.60
South East 32,312 21,839 16.76
Scotland 28,170 18,420 16.28
South West 26,597 19,507 14.93
Yorkshire & The Humber 24,444 16,481 14.04
North East 22,194 16,307 11.68
North West 26,163 17,422
East Midlands 24,444 16,481 11.10
West Midlands 24,574 16,638 10.75
Wales 21,439 17,122
Source: Oxford Economics
TABLE 12
FIG. 27 - Asking rent by room size (£ per week)
£0.00
£20.00
£40.00
£60.00
£80.00
£100.00
200 sq ft
150 sq ft
100 sq ft
75 sq ft
50 sq ft
25 sq ftRent per room 2013 Rent per room 2014
£97.
19
£75.
06
£21.
12
£37.
91 £44.
51£4
3.47
£97.
19
£75.
06£7
5.33
£20.
09
£32.
07
£93.
87
£54.
38£5
4.57
34
The survey indicates flat occupancy over 2014 but the key measure is revenue change (per available foot); the combined impact of both occupancy and rate. This has shown a significant improvement of over 7%.
“
”OLIVER CLOSE Partner, Cushman & Wakefield

FIG. 28 - Rental rates -v- Household Disposable Income Per Capita (£)
H.D
.I Pe
r C
apit
a
10 15 20 2515,000
20,000
25,000
Rental Rates
The chart below shows the average disposable income for an area against the average rental rate in £ per square foot. It demonstrates that there is a correlation between the return a self storage facility receives against the amount of disposable income in the area. Those
operators looking to gain maximum return on their self storage site should seek out areas where there is higher disposable income. However, often these areas also have higher cost of real estate and other operating costs which can offset gains made in rental rate.
Most likely linked to the change in average net rental rates over the last 12 months, 23% of survey respondents indicated a drop in incentives offered to customers. Again, there were regional differences in the responses, as illustrated below. This question is based on operators’ feedback, rather than financial data from the business, so it is open to some interpretation by operators.
0 20 40 60 80 100
North
EastMidlands
Eastof England
SouthEast
Yorkshire &The Humber
SouthWest
London
Scotland
West Midlands& Wales
IncreasedStayed broadly the sameDecreased
INCENTIVES OVER THE PAST YEAR
Decreased 23%
Stayed broadly the same 73%
Increased 4%
TABLE 13 FIG. 29 - Change in incentives over the past year, split by region
35CUSHMAN & WAKEFIELD
SSA UK ANNUAL SURVEY
THE SELF STORAGE ASSOCIATION UK

0
10
20
30
40
50
60
70
80
20132011200920082006200420022000 or
earlier
Average Mature
69%
74%
70%
67%
76%
72%
66% 67%
74%
70%
62% 63%
49%
65%
57%
47%
20142001 2003 2005 2007 2010 2012
OCCUPANCY
Average occupancy for mature stores in the survey sample (those being open for more than 6 years) is 70% (71% last year).
FIG. 30 - Occupancy by year opened (%)
This graph measures occupancy of converted space based on when the store first opened. One might expect that occupancy rates would trend up as the store aged but as this is converted space, not maximum space, the continual expansion of stores and adding of new space will “reset” the occupancy of the store. The vast majority of self storage stores are developed in a staged process, while the building may be fully developed, individual sections of units will only be developed once the original stages reach maturity.
Not only is this more cost efficient for the operator but it also allows them to alter the unit size mix based on the demand of the previous stages if required. The increasing number of container operators entering the industry, particularly over the past 3 years, impact this graph even further. Container storage sites will often add small groups of containers regularly to their site as they fill their existing units. Therefore it is possible to maintain healthy occupancy even during expansion.
36

The regional averages are given below:
0
10
20
30
40
50
60
70
80
2013 2014
London South East
South West
West Midlands and Wales
East Midlands
East of
England
North Scotland Yorkshire & The
Humber
UKAverage
74%
75%
65%
62%
55%
53%
72%
66%
66%
65%
52%
68%
58%
54%
74%
73%
69%
65%
71%
70.4
%
FIG. 31 - Occupancy by region (%)
37CUSHMAN & WAKEFIELD
SSA UK ANNUAL SURVEY
THE SELF STORAGE ASSOCIATION UK

0 5 10 15 20 25 30 35
Merchandise
OtherMarkets
Insurance
Utilities
Repairs andMaintenance
OnlineMarketing
OtherExpenses
ManagementCosts
Rates andtaxes
Staff Costs
Weighted Average Operating Costs
32.3%
16.2%
9.1%
10.0%
6.1%
3.5%
9.6%
7.2%
4.2%
1.9%
FIG. 32 - Operating expenses (weighted average %)
Staff costs, rates, management and marketing are the key costs covering over 70% of total operating expenses, based on the responses received. However, there were significant differences between companies in the proportions of the total costs allocated to staffing and marketing, which are to some extent less fixed in nature than some of the other cost lines. The quantum of these costs also vary significantly, both according to the geographic location of the business and its maturity.
OTHER OPERATING METRICS
38
AVERAGE NUMBER OF STAFF PER STOREThe survey shows us that on average self storage facilities employ 2.87 staff per store as a combination of full time and part time. The split of this figure in terms of people employed is 76% in full time employment and 24% part time.
Over the past 5 years the survey has shown a small but steady incremental annual increase in average staff numbers at site level, from 2.71 to 2.87. This is likely to be related to an increase in the average size of the self storage facilities rather than any change in staff practices.
Some new questions were asked in the 2014 survey to provide more insight on operating metrics, in particular the operating costs plus move in and out levels to provide some analysis of the typical churn levels for customers within the industry. This data is analysed in the tables below.
SSA UK ANNUAL SURVEY
OTHER OPERATING METRICS
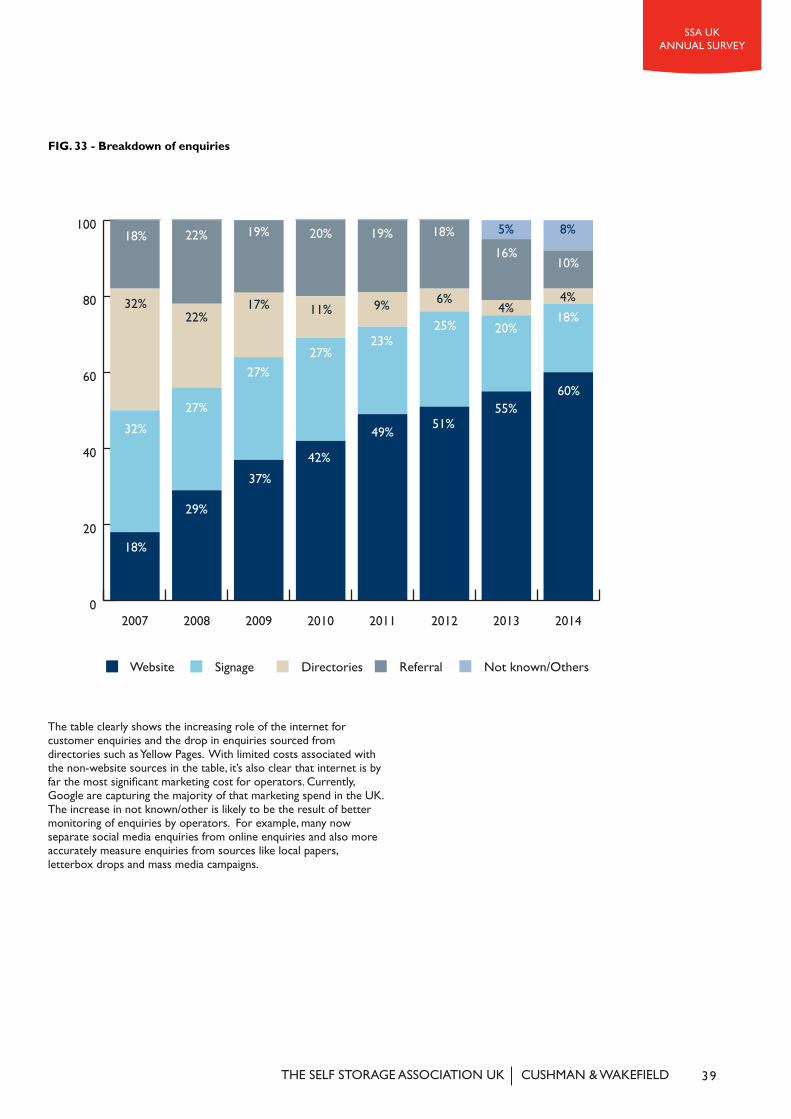
The table clearly shows the increasing role of the internet for customer enquiries and the drop in enquiries sourced from directories such as Yellow Pages. With limited costs associated with the non-website sources in the table, it’s also clear that internet is by far the most significant marketing cost for operators. Currently, Google are capturing the majority of that marketing spend in the UK. The increase in not known/other is likely to be the result of better monitoring of enquiries by operators. For example, many now separate social media enquiries from online enquiries and also more accurately measure enquiries from sources like local papers, letterbox drops and mass media campaigns.
Website Signage Directories Not known/Others
0
20
40
60
80
100
20142013201220112010200920082007
18%
29%
37%42%
49% 51%55%
Referral
60%
32%
32%
18%
27%
22%
22% 19%
17%
27%27%
11%
20% 19%
9%
23%25%
6%
18% 5%
16%
4%20%
18%4%
10%
8%
FIG. 33 - Breakdown of enquiries
39CUSHMAN & WAKEFIELDTHE SELF STORAGE ASSOCIATION UK
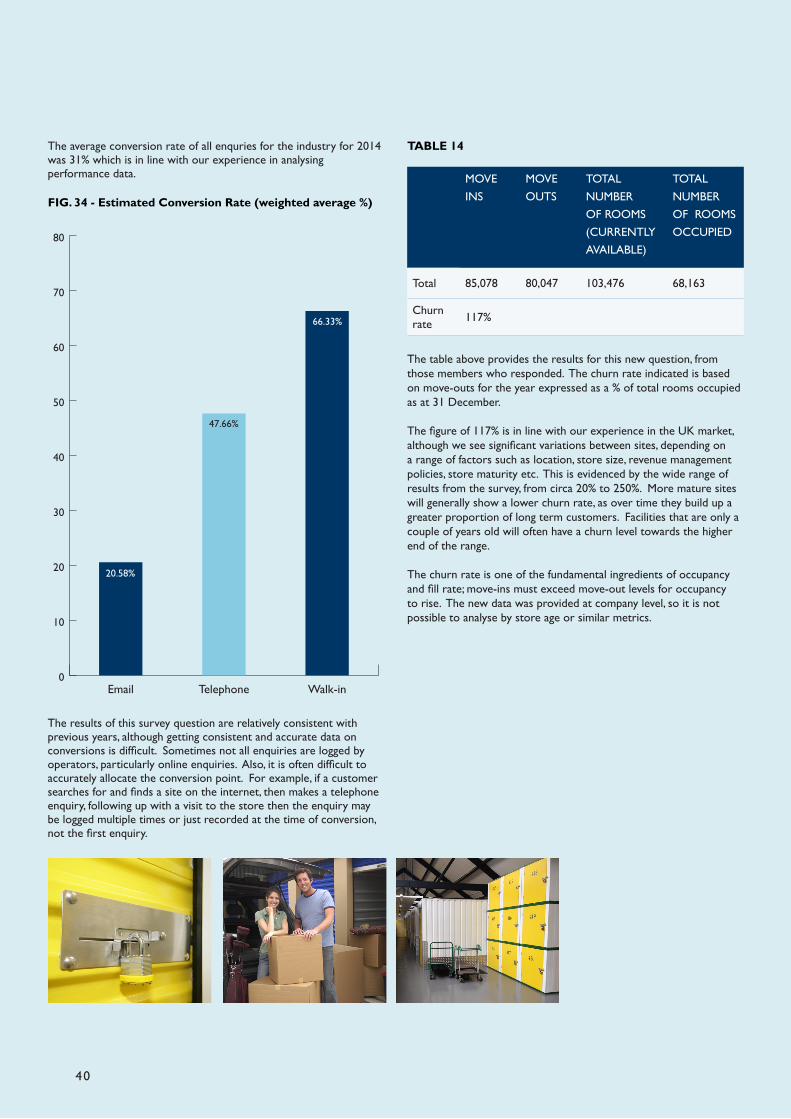
TABLE 14
The table above provides the results for this new question, from those members who responded. The churn rate indicated is based on move-outs for the year expressed as a % of total rooms occupied as at 31 December.
The figure of 117% is in line with our experience in the UK market, although we see significant variations between sites, depending on a range of factors such as location, store size, revenue management policies, store maturity etc. This is evidenced by the wide range of results from the survey, from circa 20% to 250%. More mature sites will generally show a lower churn rate, as over time they build up a greater proportion of long term customers. Facilities that are only a couple of years old will often have a churn level towards the higher end of the range.
The churn rate is one of the fundamental ingredients of occupancy and fill rate; move-ins must exceed move-out levels for occupancy to rise. The new data was provided at company level, so it is not possible to analyse by store age or similar metrics.
MOVE INS
MOVE OUTS
TOTAL NUMBER OF ROOMS (CURRENTLY AVAILABLE)
TOTAL NUMBER OF ROOMS OCCUPIED
Total 85,078 80,047 103,476 68,163
Churn rate 117%
40
FIG. 34 - Estimated Conversion Rate (weighted average %)
0
10
20
30
40
50
60
70
80
Walk-inTelephoneEmail
Estimated Conversion Rate %
66.33%
20.58%
47.66%
The results of this survey question are relatively consistent with previous years, although getting consistent and accurate data on conversions is difficult. Sometimes not all enquiries are logged by operators, particularly online enquiries. Also, it is often difficult to accurately allocate the conversion point. For example, if a customer searches for and finds a site on the internet, then makes a telephone enquiry, following up with a visit to the store then the enquiry may be logged multiple times or just recorded at the time of conversion, not the first enquiry.
The average conversion rate of all enquries for the industry for 2014 was 31% which is in line with our experience in analysing performance data.

SSA UK ANNUAL SURVEY
EXPANSION ACTIVITY
Expansion in the Industry has been muted over the last four years as a result of the global financial crisis, as demonstrated in the table below, based on the responses received from the survey group.
FIG. 35 - Site openings by date
0
10
20
30
40
50
2013201120092007200520032001
13
45
27
23
20
32
28 29
21
37
10
7
10 10
In spite of the economic recovery and the much improved availability of debt finance (at a historically low cost), expansion plans remain similar to last year’s survey results. This may be due in pvart to a robust wider real estate market and continued difficulties in securing debt finance for development projects. There is also a significant amount of existing additional capacity in the industry in terms of existing unoccupied space.
From our discussions with operators it is also apparent that sourcing new sites, particularly close to Central London, has become much more challenging in the last couple of years.
41CUSHMAN & WAKEFIELDTHE SELF STORAGE ASSOCIATION UK

FIG. 37 - Total number of stores to be developed or acquired over the next three years
In total, the respondents have aspirations to develop 30+ sites each year for the next three years with 25 or more sites to be acquired in each year. 30 sites per annum equates to an annual growth rate of circa 7% of the existing stock in the survey.
The aspirations of respondents last year did not translate into a corresponding number of new sites opened in 2014 (26 expected, with only 10 opened). In fact over the last 3 years respondents have tended to overestimate the amount of new sites that would be developed by around 50%. History would suggest that in 2015 there are more likely to be closer to 17 new sites developed.
0
5
10
15
20
25
30
35
40
Sites to acquireSites to develop2015 2016 2017
34
37
34
27
2526
0
10
20
30
40
50
60
Over three
ThreeTwoOneNone
53
2013 2014
56
23
15 14
8
4
86
13
FIG. 36 - Number of sites expected to develop and open in the next three years (% of respondents)
While this chart does indicate that operators expect the industry to grow fairly significantly, in the past measuring expectations with actual developments has shown a shortfall. The reality is that while operators may expect to add new sites within the next 12 months, often delays in sourcing new sites, financing, planning permission or construction can delay the process.
42
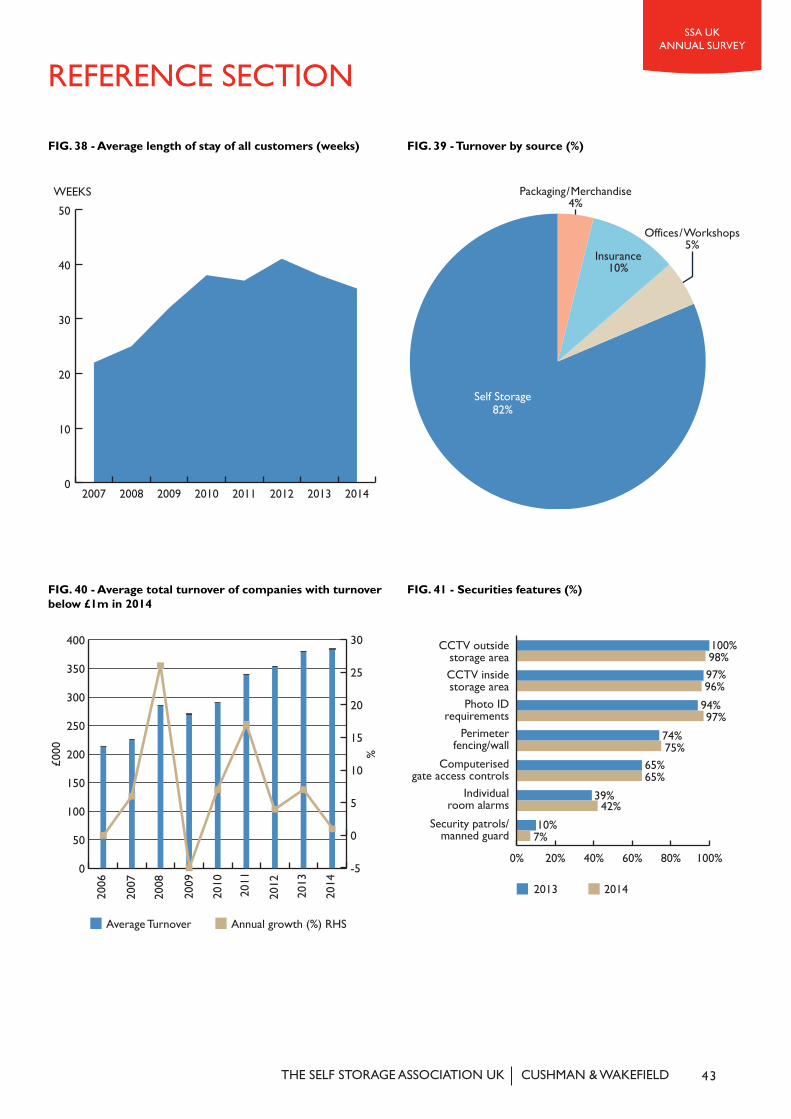
Self Storage82%
Packaging / Merchandise4%
Insurance10%
Offices / Workshops5%
REFERENCE SECTION
0
10
20
30
40
50
20142013201220112010200920082007
WEEKS
0
50
100
150
200
250
300
350
400
2014
2013
2012
2011
2010
2009
2008
2007
2006
-5
0
5
10
15
20
25
30
Average Turnover Annual growth (%) RHS
£000 %
0% 20% 40% 60% 80% 100%
2013 2014
100%98%97%96%
94%97%
74%75%
65%65%
39%42%
10%7%
CCTV outside storage areaCCTV inside storage area
Photo ID requirements
Perimeter fencing/wall
Computerised gate access controls
Individual room alarms
Security patrols/manned guard
43CUSHMAN & WAKEFIELD
FIG. 41 - Securities features (%)FIG. 40 - Average total turnover of companies with turnover below £1m in 2014
FIG. 39 - Turnover by source (%)FIG. 38 - Average length of stay of all customers (weeks)
THE SELF STORAGE ASSOCIATION UK
SSA UK ANNUAL SURVEY
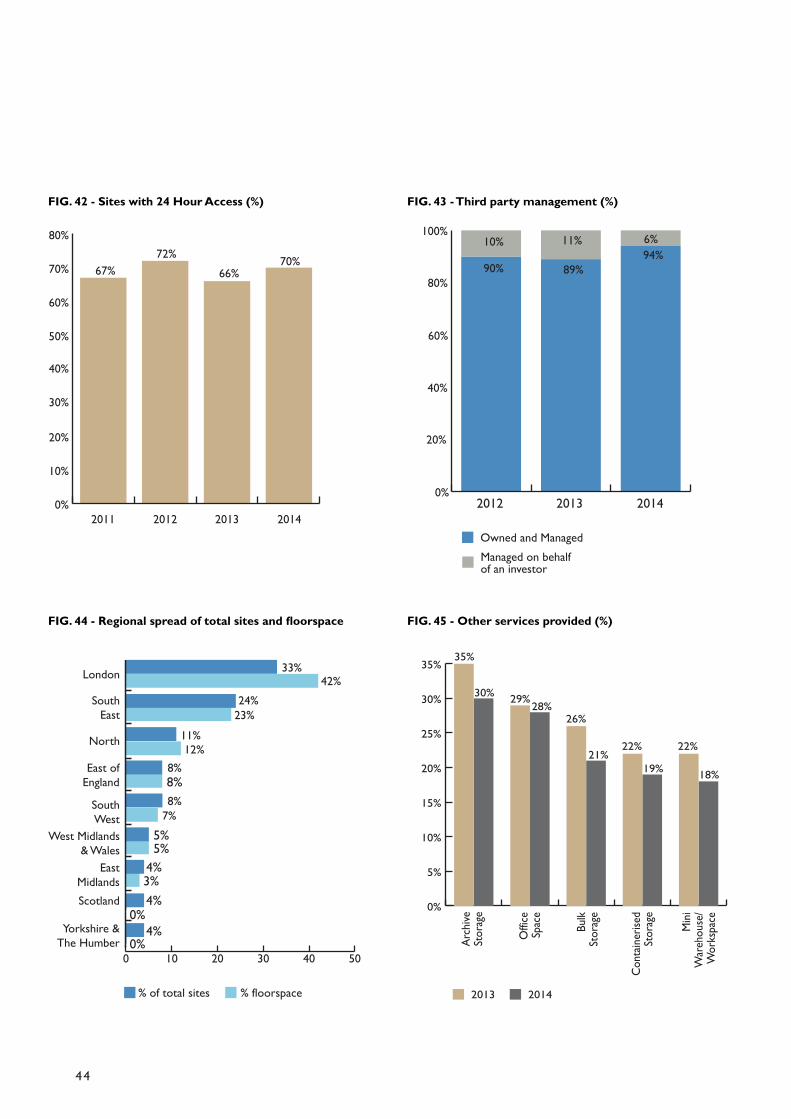
FIG. 43 - Third party management (%)
Owned and ManagedManaged on behalf of an investor
2013 201420120%
20%
40%
60%
80%
100%
90%
10%
89%
11%94%6%
FIG. 42 - Sites with 24 Hour Access (%)
20132011 201420120%
10%
20%
30%
40%
50%
60%
70%
80%
67%72%
66%70%
0 10 20 30 40 50
Yorkshire &The Humber
Scotland
EastMidlands
SouthWest
SouthEast
London
% of total sites % floorspace
West Midlands& Wales
East ofEngland
North
33%42%
24%23%
11%12%
8%8%8%
7%5%5%
4%3%4%
4%0%
0%
0%
5%
10%
15%
20%
25%
30%
35%
Mini
War
ehou
se/
Wor
kspa
ce
Cont
ainer
ised
Stor
age
Bulk
Stor
age
Offic
eSp
ace
Arch
iveSt
orag
e
2013 2014
35%
30% 29%28%26%
21%22% 22%
19% 18%
44
FIG. 45 - Other services provided (%)FIG. 44 - Regional spread of total sites and floorspace

FIG. 47 - Expectations for empty room rates over the year ahead (% of respondents)
0
20
40
60
80
100
IncreaseNo changeDecrease
2011 2012
3% 1%
39%
17%13%15%
79%87%
58%
85%
4%0%
2013 2014
FIG. 46 - Expectations for rent over the year ahead (% of respondents)
Increase greater than inflation80%
Increase less than inflation4%
No change15%
Decrease1%
0
20
40
60
80
100
Wes
t M
idlan
ds
& W
ales
Sout
h W
est
East
Mid
lands
Scot
land
Sout
h Ea
st
Lond
on
York
shire
& T
he H
umbe
r
Nor
th
East
of
Engla
nd
Increase
Stayed broadly the same
Decrease
85%
26%
74%
15%
85%
73%
57%
27%
1% 2%
42% 13% 6% 18% 19% 12%
88%
6%
73%65%
65%
9%16%
24%
45CUSHMAN & WAKEFIELD
FIG. 48 - Expectations for incentives over the year ahead, split by region (%)
THE SELF STORAGE ASSOCIATION UK
%
SSA UK ANNUAL SURVEY

SSA UK MEMBERS’ SURVEY:The survey of operators was carried out as at 31 December 2014 with the survey responses being collected during January and February 2015.
73 operators contributed to the survey this year, providing data on 433 self storage facilities and a total of circa 20 million sq ft of storage space (MLA).
The regional groups used for this year’s survey have been based on the Nomenclature of Territorial Units for Statistics (NUTS) codes of the United Kingdom. The geographical regions are as follows:
• North East• North West • Yorkshire and the Humber• East Midlands • West Midlands • Wales• East of England • London • South East • South West • Scotland
For the purposes of our analyses, we have combined the regions of the North East and North West into one ‘North’ category and the regions of the West Midlands and Wales into one ‘West Midlands & Wales’ category.
These regions are not the same as the regions adopted in the last survey report.
Further, the regions may differ from those adopted for the demand survey prepared by YouGov Plc.
Mature stores are defined as those having been opened for longer than 6 years.
Where we refer to MLA in this report, we mean “Maximum Lettable Area”.
Where we refer to CLA in this report, we mean “Current Lettable Area”.
The Members’ survey refers to the current year as 2014 and the previous year as 2013. However, the Demand Survey (carried out in January 2015) by YouGov Plc refers to the current year as 2015 and previous year as 2014.
YOUGOV PLC METHODOLOGY STATEMENT: This survey has been conducted using an online interview administered to members of the YouGov panel of 350,000+ individuals who have agreed to take part in surveys. Emails are sent to panelists selected at random from the base sample. The e-mail invites them to take part in a survey and provides a generic survey link. Once a panel member clicks on the link they are sent to the survey that they are most required for, according to the sample definition and quotas. (The sample definition could be ‘UK adult population’ or a subset such as ‘UK adult females’). Invitations to surveys don’t expire and respondents can be sent to any available survey. The responding sample is weighted to the profile of the sample definition to provide a representative reporting sample. The profile is normally derived from census data or, if not available from the census, from industry accepted data.
All figures, unless otherwise stated, are from YouGov. Total sample size was 2,151 adults. Fieldwork was undertaken between 22nd - 23rd January 2015. The survey was carried out online. The figures have been weighted and are representative of all UK adults (aged 18+).
NOTE:Cushman & Wakefield advises and represents clients on all aspects of property occupancy and investment. Founded in 1917, it has 256 offices in 60 countries, employing more than 16,000 professionals. It offers a complete range of services to its occupier and investor clients for all property types, including leasing, sales and acquisitions, equity, debt and structured finance, corporate finance and investment banking, appraisal, consulting, corporate services, and property, facilities, project and risk management.
This report has been prepared solely for information purposes. It does not purport to be a complete description of the markets or developments contained in this material. The information on which this report is based has been obtained from the sources stated above. We believe the material to be reliable, but we have not independently verified such information and we do not guarantee that the information is accurate or complete. Published by Corporate Communications.
©2015 Self Storage Association UK and Cushman & Wakefield LLP. All rights reserved.
SURVEY DATA
46
1st Storage Centres
A Space Station
ABC Selfstorage
Adams Selfstore
Admirals Yard Self Storage
Alexanders Removals And Storage
Apex Self Storage
Attic Self Storage
Barn Store
Big Box Self Storage
Big Yellow Self Storage
Black Hole Storage
Container Parks
Derbyshire Self Storage
Easistore
East Coast Storage
Extra Room Self Storage
Flexispace
Fort Locks Self Storage
Greenbox Storage
Harrogate Self Storage
Homestore
House and Lock Self Storage
House-It
Keepsafe Storage Centres
Kingston Business Centre
Lock & Leave
Lok’nStore
Newton Self Storage
Orange Box Self Storage
Pack And Stack
Quickstore Storage
Ready Steady Store
Rugeley Self Storage
Safestore
Self Storage Centre Oxford
Self Storage Tameside
Shurgard UK
Smart Storage
Space 4 U Self Storage
Space Maker
Squarefoot Self Storage
Stadium Self Storage
Stock N Lock Self Storage
Storage King
Strongroom Self Storage
The Space Place Self Storage (Telford)
The Space Place Self Storage (Leicester)
The Storage Place
Thornbury Self Storage
The following businesses agreed to have their names listed as contributors to the survey. Some businesses who completed the survey chose not to have their names included in this list.
SSA UK ANNUAL SURVEY
SURVEY DATA CONTRIBUTORS
47CUSHMAN & WAKEFIELDTHE SELF STORAGE ASSOCIATION UK

Oliver ClosePartner, Valuation & Advisory [email protected]+44 (0) 20 7152 5156
Jagruti JoshiAssociate, Valuation & [email protected]+44 (0) 20 7152 5769
Paolo CondelloSenior Surveyor, Valuation & [email protected]+44 (0) 20 7152 5265
MarketingPaula VinerEMEA Marketing Director, Valuation & [email protected]+44 (0) 20 7152 5799
CUSHMAN & WAKEFIELD LLP
CONTACT LIST
Rennie SchaferChief Executive [email protected]+44 (0) 1270 623 150
Bryony CaswellMembership Services [email protected]+44 (0) 1270 623150
Tracey Prigmore Administration [email protected]+44 (0) 1270 623150
SELF STORAGE ASSOCIATION UK
48
Oscar DoddSurveyor, Valuation & [email protected]+44 (0) 20 7152 5161

CONTACT LIST

cushmanwakefield.com
ssauk.com