current trends in biotechnology and pharmacycurrent trends in biotechnology and pharmacy volume 3...
TRANSCRIPT

Current Trends in Biotechnology and Pharmacy ISSN 0973-8916
EditorsProf. K.R.S. Sambasiva Rao, India Prof. Karnam S. Murthy, [email protected] [email protected]
Editorial BoardProf. Anil Kumar, IndiaProf. Aswani Kumar, IndiaProf. K.P.R. Chowdary, IndiaDr. S.J.S. Flora, IndiaProf. H.M. Heise, GermanyProf. Jian-Jiang Zhong, ChinaProf. Kanyaratt Supaibulwatana, ThailandDr. S.P.S. Khanuja, IndiaProf. P. Kondaiah, IndiaProf. Madhavan P.N Nair, USAProf. Mohammed Alzoghaibi, Saudi ArabiaProf. T.V. Narayana, IndiaDr. Prasada Rao S. Kodvanti, USAProf. T. Ramana, IndiaDr. C. N. Ramchand, IndiaProf. P. Reddanna, IndiaDr. Samuel JK. Abraham, JapanDr. Shaji T George, USADr. B. Srinivasulu, IndiaProf. A. Subrahmanyam, IndiaProf. B. Suresh, IndiaProf. N. Udupa, IndiaProf. Ursula Kuees, GermanyDr. Urmila Kodavanti, USAProf. P. Appa Rao, India
Assistant EditorsDr. V.R. Kondepati, Germany Dr. Sridhar Kilaru, UK
Prof. Chitta Suresh Kumar, India(Electronic Version)
www.abap.co.in
Dr. P. Ananda Kumar, IndiaProf. Chellu S. Chetty, USADr. P.V.Diwan, IndiaDr. Govinder S. Flora, USAProf. Huangxian Ju, ChinaDr. K.S. Jagannatha Rao, IndiaProf. Juergen Backhaus, GermanyProf. P.B. Kavi Kishor, IndiaProf. M. Krishnan, IndiaProf. M.Lakshmi Narasu, IndiaProf. Mahendra Rai, IndiaProf. Milan Fr·nek, Czech RepublicProf. Mulchand S. Patel, USADr. R.K. Patel, IndiaProf. G. Raja Rami Reddy, IndiaDr. Ramanjulu Sunkar, USAProf. B.J. Rao, IndiaProf. Roman R. Ganta, USAProf. Sham S. Kakar, USAProf. Sehamuddin Galadari, UAEProf. Carola Severi, ItalyDr. N. Sreenivasulu, GermanyProf. Sung Soo Kim, KoreaProf. Swami Mruthini, USADr. Vikas Dhingra, USA

Current Trends inBiotechnology and Pharmacy
Volume 3 Issue 4 October 2009
www.abap.co.in
(An International Scientific Journal)
Indexed in Chemical Abstracts, EMBASE, ProQuest, Academic Search™, Open J-Gate andIndian Science Abstracts
ISSN 0973-8916
Association of Biotechnology and Pharmacy(Regn. No. 28 OF 2007)
The Association of Biotechnology and Pharmacy (ABAP) was established for promoting the scienceof Biotechnology and Pharmacy. The objective of the Association is to advance and disseminate theknowledge and information in the areas of Biotechnology and Pharmacy by organising annual sci-entific meetings, seminars and symposia.
Members
The persons involved in research, teaching and work can become members of Association by pay-ing membership fees to Association.
The members of the Association are allowed to write the title MABAP (Member of the Associationof Biotechnology and Pharmacy) with their names.
Fellows
Every year, the Association will award Fellowships to the limited number of members of theAssociation with a distinguished academic and scientific career to be as Fellows of the Associationduring annual convention. The fellows can write the title FABAP (Fellow of the Association ofBiotechnology and Pharmacy) with their names.
Membership details
----------------------------------------------------------------------------------------------------------------------(Membership and Journal) India SAARC Others----------------------------------------------------------------------------------------------------------------------Individuals - 1 year Rs. 600 Rs. 1000 $100 LifeMember Rs. 4000 Rs. 6000 $500
Institutions - 1 year Rs. 1500 Rs. 2000 $200(Journal only) Life member Rs. 10000 Rs.12000 $1200
----------------------------------------------------------------------------------------------------------------------Individuals can pay in two instalments, however the membership certificate will be issued on pay-ment of full amount. All the members and Fellows will receive a copy of the journal free
Association of Biotechnology and Pharmacy(Regn. No. 28 OF 2007)#5-69-64; 6/19, Brodipet
Guntur - 522 002, Andhra Pradesh, India
Current Trends in Biotechnology and PharmacyVol. 3 (4) October 2009. ISSN 0973-8916
Current Trends in Biotechnology and PharmacyISSN 0973-8916
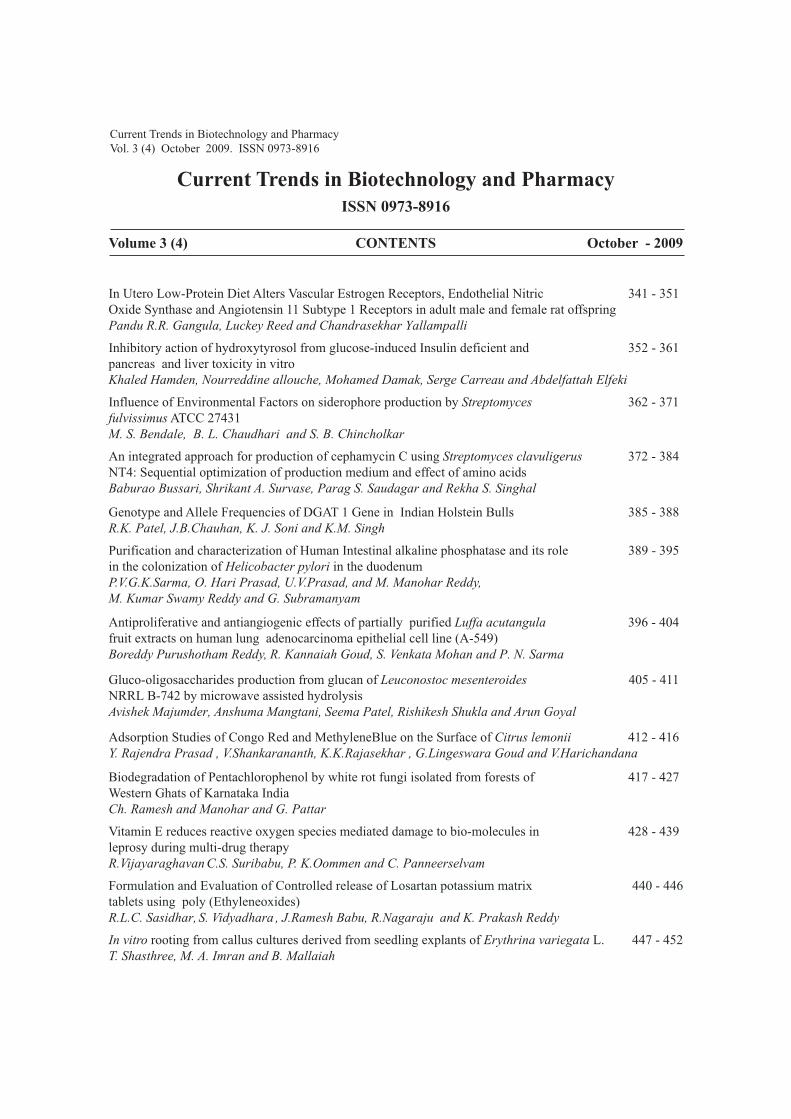
Volume 3 (4) CONTENTS October - 2009
In Utero Low-Protein Diet Alters Vascular Estrogen Receptors, Endothelial Nitric 341 - 351Oxide Synthase and Angiotensin 11 Subtype 1 Receptors in adult male and female rat offspringPandu R.R. Gangula, Luckey Reed and Chandrasekhar Yallampalli
Inhibitory action of hydroxytyrosol from glucose-induced Insulin deficient and 352 - 361pancreas and liver toxicity in vitroKhaled Hamden, Nourreddine allouche, Mohamed Damak, Serge Carreau and Abdelfattah Elfeki
fulvissimus ATCC 27431M. S. Bendale, B. L. Chaudhari and S. B. Chincholkar
NT4: Sequential optimization of production medium and effect of amino acidsBaburao Bussari, Shrikant A. Survase, Parag S. Saudagar and Rekha S. Singhal
Purification and characterization of Human Intestinal alkaline phosphatase and its role 389 - 395in the colonization of Helicobacter pylori in the duodenum
M. Kumar Swamy Reddy and G. Subramanyam
Antiproliferative and antiangiogenic effects of partially purified Luffa acutangula 396 - 404fruit extracts on human lung adenocarcinoma epithelial cell line (A-549)
Gluco-oligosaccharides production from glucan of Leuconostoc mesenteroides 405 - 411NRRL B-742 by microwave assisted hydrolysisAvishek Majumder, Anshuma Mangtani, Seema Patel, Rishikesh Shukla and Arun Goyal
Adsorption Studies of Congo Red and MethyleneBlue on the Surface of Citrus lemonii 412 - 416
Biodegradation of Pentachlorophenol by white rot fungi isolated from forests of 417 - 427Western Ghats of Karnataka India
Vitamin E reduces reactive oxygen species mediated damage to bio-molecules in 428 - 439leprosy during multi-drug therapyR.Vijayaraghavan
tablets using poly (Ethyleneoxides)R.L.C. Sasidhar, S. Vidyadhara , J.Ramesh Babu, R.Nagaraju and K. Prakash Reddy
T. Shasthree, M. A. Imran and B. Mallaiah
Current Trends in Biotechnology and PharmacyVol. 3 (4) October 2009. ISSN 0973-8916
Influence of Environmental Factors on siderophore production by Streptomyces 362 - 371
An integrated approach for production of cephamycin C using Streptomyces clavuligerus 372 - 384
Genotype and Allele Frequencies of DGAT 1 Gene in Indian Holstein Bulls 385 - 388
Formulation and Evaluation of Controlled release of Losartan potassium matrix 440 - 446
In vitro rooting from callus cultures derived from seedling explants of Erythrina variegata L. 447 - 452
P.V.G.K.Sarma, O. Hari Prasad, U.V.Prasad, and M. Manohar Reddy,
Ch. Ramesh and Manohar and G. Pattar
Y. Rajendra Prasad , V.Shankarananth, K.K.Rajasekhar , G.Lingeswara Goud and V.Harichandana
C.S. Suribabu, P. K.Oommen and C. Panneerselvam
R.K. Patel, J.B.Chauhan, K. J. Soni and K.M. Singh
Boreddy Purushotham Reddy, R. Kannaiah Goud, S. Venkata Mohan and P. N. Sarma
340
Information to AuthorsThe Current Trends in Biotechnology and Pharmacy is an official international journal ofAssociation of Biotechnology and Pharmacy. It is a peer reviewed quarterly journal dedicatedto publish high quality original research articles in biotechnology and pharmacy. The journalwill accept contributions from all areas of biotechnology and pharmacy including plant,animal, industrial, microbial, medical, pharmaceutical and analytical biotechnologies,immunology, proteomics, genomics, metabolomics, bioinformatics and different areas inpharmacy such as, pharmaceutics, pharmacology, pharmaceutical chemistry, pharma analysisand pharmacognosy. In addition to the original research papers, review articles in the abovementioned fields will also be considered.
Call for papers
The Association is inviting original research or review papers in any of the above mentionedresearch areas for publication in Current Trends in Biotechnology and Pharmacy. Themanuscripts should be concise, typed in double space in a general format containing a titlepage with a short running title and the names and addresses of the authors for correspondencefollowed by Abstract (350 words), 3 ñ 5 key words, Introduction, Materials and Methods,Results and Discussion, Conclusion, References, followed by the tables, figures and graphson separate sheets. For quoting references in the text one has to follow the numbering ofreferences in parentheses and full references with appropriate numbers at the end of the textin the same order. References have to be cited in the format below.
Mahavadi, S., Rao, R.S.S.K. and Murthy, K.S. (2007). Cross-regulation of VAPC2 receptorinternalization by m2 receptors via c-Src-mediated phosphorylation of GRK2. RegulatoryPeptides, 139: 109-114.
Lehninger, A.L., Nelson, D.L. and Cox, M.M. (2004). Lehninger Principles of Biochemistry,(4th edition), W.H. Freeman & Co., New York, USA, pp. 73-111.
Authors have to submit the figures, graphs and tables of the related research paper/article inAdobe Photoshop of the latest version for good illumination and allignment.
Authors can submit their papers and articles either to the editor or any of the editorial boardmembers for onward transmission to the editorial office. Members of the editorial board areauthorized to accept papers and can recommend for publication after the peer reviewingprocess. The email address of editorial board members are available in website www.abap.in.For submission of the articles directly, the authors are advised to submit by email [email protected] or [email protected].
Authors are solely responsible for the data, presentation and conclusions made in theirarticles/research papers. It is the responsibility of the advertisers for the statements madein the advertisements. No part of the journal can be reproduced without the permission ofthe editorial office.
Current Trends in Biotechnology and PharmacyVol. 3 (4) October 2009. ISSN 0973-8916

341
Flutamide elevates vascular estrogen receptors in female offspring
Current Trends in Biotechnology and PharmacyVol. 3 (4) 341 - 351, October 2009. ISSN 0973-8916
AbstractBackground/Aims: We investigated
whether: 1) in utero low-protein diet (LPD)induced adult hypertension alters vascularestrogen receptor (ER)-related mechanism inboth male and female vascular tissues; andwhether 2) flutamide, a specific, non-steroidalcompetitive antagonist of the androgen receptor,improved this system in female offspring.
Methods: Pregnant rats were fed eitherwith 20% protein (control), or 6% protein (LPD)from day 1 (LPD-1) or day 12 (LPD-2) ofgestation. Male and female hypertensiveoffspring were treated when adult with flutamide(10 mg/day/kg body weight, subcutaneous) forfour days. Aortas (vascular) were isolated fromcontrol, LPD-1 female, LPD-2 male andflutamide treated female LPD-1 offspring. ER-alpha (ER-α), ER-beta (ER-β), endothelial nitricoxide synthase (eNOS), and the angiotensin 11subtype 1 receptor 1 (AT
1-R) protein levels were
analyzed using western immunoblotting.
Results and Conclusion: In female LPD-1 offspring aortas there was a decrease in ER-α,ER-β, eNOS and an increase in AT
1-R protein
expression and flutamide treatment increased ER-β, eNOS and decreased AT
1-R protein expression.
In male LPD-2 offspring aortas, ER-β wasincreased with no changes in ER-α and eNOSproteins. Changes in vascular ER-mediated
In Utero Low-Protein Diet Alters Vascular Estrogen Receptors,Endothelial Nitric Oxide Synthase and Angiotensin 11
Subtype 1 Receptors in adult male and female rat offspring
Pandu R. R. Gangula1, Luckey Reed2 and Chandrasekhar Yallampalli2
1Department of Obstetrics and Gynecology, Meharry Medical College, Nashville, TN, USA2Department of Obstetrics and Gynecology, University of Texas Medical Branch, Galveston, Texas, USA
*For correspondence - [email protected], [email protected]
pathway may cause hypertension in female LPDoffspring and flutamide treatment reverses thiseffect.
Key Words: Low-protein diet, estrogenreceptors, nitric oxide, angiotensin receptor,flutamide.
Grant support: Supported in part by NIHthrough grants HL 58144, HD 30273, and HL72650 to Dr. Yallampalli
IntroductionEpidemiological observations suggest that
low birth weight is associated with an increasedrisk of developing cardiovascular disease, non-insulin dependent diabetes (1) and hypertensionin adulthood (1-6). Studies in rats employingmaternal low-protein diet (LPD) restrictionresults in the offspring developing high bloodpressure (BP) and diabetes (7). Severalmechanisms including alteration in maternalglucocorticoids (8), deficiency in placental 11β-hydroxy-steroid dehydrogenase activity (8,9),changes in kidney renin-angiotensin systemeither in newborns or adults (10), deficit in totalnephron number (11), upregulation of reninaldosterone axis (11) and inappropriate renal Na+retention leading to increased extracellularvolume (11) may be responsible in developinghypertension in adult offspring. However, noneof these studies have shown the involvement of
342
Gangula et al
estrogen receptor (ER) as a possible mechanismfor developing hypertension that was induced byin utero low-protein in adult offspring.
Recent observations from our laboratorydemonstrated that exposure to a LPD throughoutpregnancy (LPD-1) reduced feto-placentalweights and increased mortality of the pups (12).In addition, these studies demonstrated that bothsystolic and mean arterial BP were elevated inadult male and female offspring exposed tomaternal LPD-1. On the other hand, in utero LPDfrom day 12 of pregnancy (LPD-2) developedBP in adult male, but not in female offspringbeginning from five months old. These datasuggest that male offspring appeared to have agreater risk of developing hypertension exposedto in utero LPD either from day 1 or day 12 ofgestation. Interestingly, the circulatory levels ofestradiol decreased in female, but not in maleoffspring (12). Furthermore, flutamide, anandrogen receptor antagonist, significantlydecreased BP and increased serum estrogen levelsin female offspring (12). However, flutamidefailed to show an effect in lowering BP in malehypertensive rats (13, 14). These data suggest thataltered estrogen levels in circulation may beresponsible in developing hypertension in adultfemale offspring exposed to LPD in utero.However, the underlying mechanisms of estrogenactions remain uncertain in this study.
Estrogens have been shown to lower plasmalipoproteins (15), influence the renin-angiotensinsystem (16-19), exert anti-oxidative properties(20), and may act as calcium blocking agents (21).In addition, estrogens exert direct effects on thevessel wall, such as an increase of vascular nitricoxide (NO) production and modulation ofexpression of endothelial NO synthase (eNOS)(22-24). Studies of Nickening (25) demonstratedthat estrogen treatment caused angiotensinsubtype 1 receptor (AT
1-R) down-regulation
through NO-dependent pathway in vascular
smooth muscle cells. These studies furthersuggest that the beneficial effects of estrogensappeared to be mediated by estrogen receptors(ER) (25). Knowing the role of AT
1-R (T2)
(18,19) in the pathogenesis of hypertension, thesestudies suggest that estrogens play an importantrole in lowering BP through NO-AT1-R pathwaythrough activation of estrogen receptors (ER-αand ER-β).
The objectives of the present study are toinvestigate whether in utero LPD alters: 1)vascular ER-α , ER-β, eNOS and AT
1-R
expression in both male and female adultoffspring; and whether 2) flutamide treatmentreverses this effect in female LPD-1 offspring.
Materials and Methods
Adult, non-pregnant (180g – 220g bodyweight [bw]) rats were purchased from HarlanSprague Dawley (Houston, TX) and maintainedon a 12L : 12D schedule. Animals received adlibitum supply of rat chow and water. Allprocedures were approved by the Animal Careand Use Committee of the University of TexasMedical Branch, Galveston, Texas. Virgin femalerats were mated, and the day of observation of avaginal plug with the presence of sperm wasdesignated day 1 of gestation. Timed pregnantrats were fed a normal protein diet (20% casein,control) or a low-protein diet (6% casein) fromday 1 (LPD-1) or day 12 (LPD-2) gestation. Thedams delivered spontaneously at term and werethen immediately switched back to the standardrat chow. The offspring were nursed by theirmothers until weaned (21 days old) to regularchow. The isocaloric synthetic low-protein andnormal-protein diets were obtained from HarlanTekland (Madison, WI). The composition of thediets for two groups, except the protein content,was identical as described previously (11). Bothdiets also contained equal amounts of standardvitamins and minerals.
Current Trends in Biotechnology and PharmacyVol. 3 (4) 341 - 351, October 2009. ISSN 0973-8916
343
Flutamide elevates vascular estrogen receptors in female offspring
Effect of maternal LPD in developinghypertension in adult offspring has beendemonstrated and published recently from ourlaboratory 12. We have reported that maleoffspring exposed to either LPD-1 or LPD-2 inutero develop BP beginning from 2 or 5 monthold respectively (12). On the other hand, LPD-1,but not LPD-2, caused BP elevation in femaleoffspring. These studies further suggest that themagnitude of developing BP are greater in LPD-1 adult males compared to LPD-1 female rats. Inaddition, these studies suggest that flutamidetreatment (10 mg/day/4 days, subcutaneousinjections) decreases the BP in femalehypertensive LPD-1 but not in male hypertensive(LPD-1 or LPD-2) offspring (12). To assess themechanisms involved in elevated BP due tomaternal LPD and the BP lowering effects offlutamide, we have collected thoracic aorta(vascular) tissues from control, femalehypertensive LPD-1, male hypertensive LPD-2offspring and biochemical analysis wereperformed. Since, the BP values are comparablebetween LPD-2 males versus LPD-1 females, thecurrent studies were performed in these groups.
All animals were killed in a CO2 inhalation
chamber. Thoracic aortas were removedimmediately, quickly frozen in liquid nitrogenand stored at -70oC until used. Tissues werethawed on ice and homogenized in 50mM TRISbuffer (pH 7.4) containing 2 mM EGTA(Ethyleneglycol-bis-[b-aminoethylaster] N, N,N1, N1-Tetraacetic acid), 2mM b-mercaptoethanol, 1mM PMSF (phenylmethyl-sulfony fluoride) (Sigma, St. Louis, MO).Complete protease inhibitor tablets were used asper the recommendation of the supplier (proteaseinhibitor cocktail- Roche, IN). The homogenateswas centrifuged at 1000g for 15 minutes toremove tissue chunks and unbroken cells. Proteinconcentrations were determined by the PierceBCA protein assay kit according tomanufacturer’s protocol.
Determination of ER-α, ER-β and AT1-R and
eNOS protein expression in thoracic aortasWestern blotting: Equal amounts of total
protein (20µg each) from each preparation areresolved on an 8% SDS-polyacrylamide gel,transferred onto a nitrocellulose membrane byelectroelution. The membranes were incubatedin 5% non-fat milk Tris buffered saline (TBS) –Tween -20 at 22oC for 1 hr and incubated in theantibody solution at 4oC overnight. TBS-Tween-20 contained the following (in mmol/L): 80 Na
2
HPO4, 20 NaH
2PO
4, 100 Nacl, and 0.05% Tween
-20. Monoclonal anti-ER-b (1:1000, UpstateBiotechnolgoy, NY), polyclonal anti-ER-a(1:1000, Affinity Bioreagents, CO), monoclonalanti-eNOS antibody (1:1000, TransductionLaboratory) and monoclonal anti-AT
1–R
antibody (1:1000, Santa Cruz) were used.Nitrocellulose membranes were washed threetimes with TTBS (20mM Tris – [hydroxymethyl]aminomethane-HCl [ph 7.6], 0.05% Tween 20,10mM NaCl), and then incubated withhorseradish peroxidase-conjugated anti-mouse oranti-rabbit immunoglobulin G (Santa CruzBiotechnology, Inc., Santa Cruz, CA) (1:2000,1:5000 respectively) for 1.5 hrs. The blots weredeveloped using the enhancedchemiluminescence system (AmershamPharmacia Biotech, Piscataway, NJ) accordingto the manufacturer’s protocol. To verify equalloading of sample protein, the immunoblots werestripped in stripping solution (100 mM glycinepH 2-3 for 45 min) and reprobed with monoclonalanti-α -actin antibody (Sigma, 1:5000).Densitometric analysis was performed in thelinear range using a Flourchem Analysis System(Alpha Innotech; San Leandro, CA) and theamount of ER, eNOS and AT
1–R were normalized
to the α-actin signal.
Statistical AnalysisResults are expressed as the mean ± SEM.
Data were analyzed for statistical differences withthe Student t-test or one-way ANOVA followed
Current Trends in Biotechnology and PharmacyVol. 3 (4) 341 - 351, October 2009. ISSN 0973-8916

344
Gangula et al
by the Bonferroni t-test to verify differencesbetween individual groups. Differences wereconsidered to be significant if p < 0.05 (n = 3-5).
Results1. Effect of in utero LPD exposure and
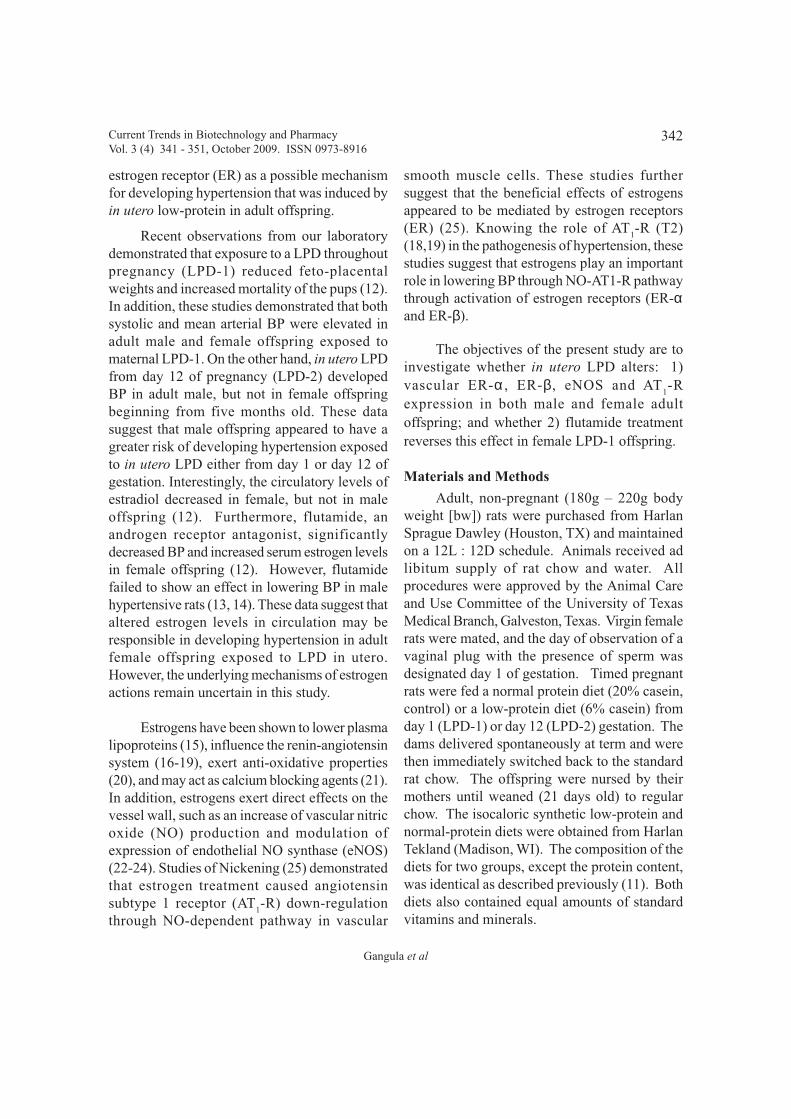
flutamide on vascular ER protein expression inadult female offspring: Figure 1 illustrates thechanges in ER receptor-protein concentrations ofvascular homogenates obtained from femaleoffspring exposed to in utero either 20% casein(control), 6% casein throughout the pregnancy(LPD-1) or LPD-1 female offspring when adulttreated with flutamide for four days prior to tissuecollection. Initial studies from our laboratory (12)confirmed that female adult offspring exposedin utero to LPD-1 developed hypertension anddecreased circulatory estrogen levels.Furthermore, flutamide treatment reversed bothhypertension and decreased estrogen levels in
Fig. 1. Expression of protein for estrogen receptors (ER) in thoracic aortas in female rat offspring exposed tointrauterine LPD during pregnancy. The LPD was given in utero from day 1 (LPD-1) of pregnancy untildelivery. The control group received 20% protein. Aortic tissue homogenates were prepared for Western blotanalysis. A (top): Representative Immunoblot of rat thoracic aortas showing the expression of ER-α (60kDa) and β-actin (50 kDa) from control, LPD-1, and LPD-1 + Flutamide (10mg/day/4 days; subcutaneousinjections). A (bottom): Densitometric analysis was performed and the ratio of ER-α to β-actin are calcu-lated. B (top): Representative immunoblot analysis of ER-β and β-actin from four animals per group. B(bottom): Densitometric analysis are performed and the ratio of ER-β (55 kDa) to β-actin are calculated. Thebars represent the mean ± SEM. Significant differences between control versus LPD are noted. * p < .05 forLPD-1 compared to control group; † p < .05 for LPD-1 + flutamide compared to LPD-1 group.
circulation (12). As shown in Figures 1A and1B, prominent bands at 60 and 55 kDa,corresponding to ER-α and ER-β protein wereobtained from vascular tissues respectively.Densitometric analysis of both ER-á and ER-âprotein followed by normalizing with â-actinsignal from each group showed that both ER-aand ER-b protein expression are decreasedsignificantly (p < 0.05) in LPD-1 rats comparedto control group. Flutamide treatment restoredthe decreased levels of ER-β (Figure 1B), but notER-α in LPD-1 females.
2. Effect of in utero LPD exposure onvascular ER protein expression in adult maleoffspring: Results from our laboratorydemonstrated 12 that rats with low-protein dieteither from day1 (LPD-1) or day 12 (LPD-2) ofpregnancy caused an increase in BP in male adultoffspring. In contrast to female offspring,
Current Trends in Biotechnology and PharmacyVol. 3 (4) 341 - 351, October 2009. ISSN 0973-8916

345
Flutamide elevates vascular estrogen receptors in female offspring
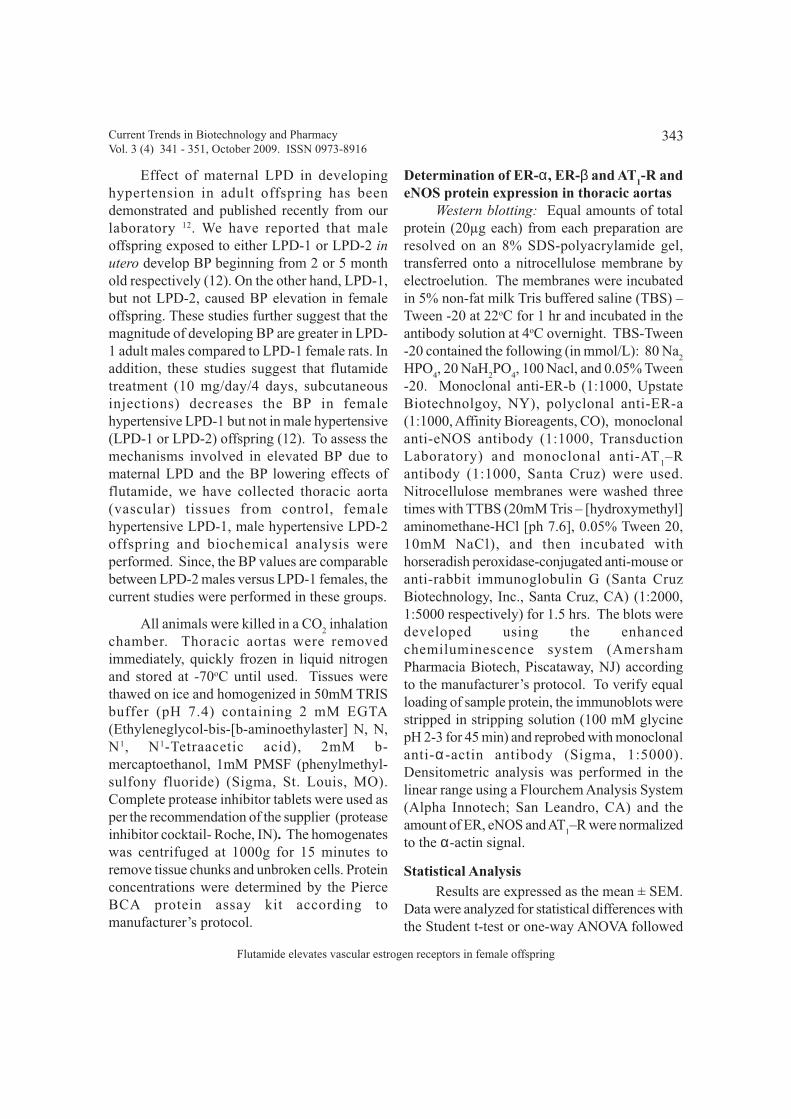
flutamide did not show an effect in attenuatinghypertension in both LPD-1 and LPD-2 maleoffspring. In this study, we investigated whetherin utero LPD during second half of pregnancy(LPD-2) alters the vascular ER protein expressionin male offspring. As shown in Figure 2A, theprotein expression for ER-a were unchanged inLPD-2 male offspring compared to control group.However, significant (p < .05) increases invascular ER-a protein expression was observed(Figure 2B) in LPD-2 male rats.
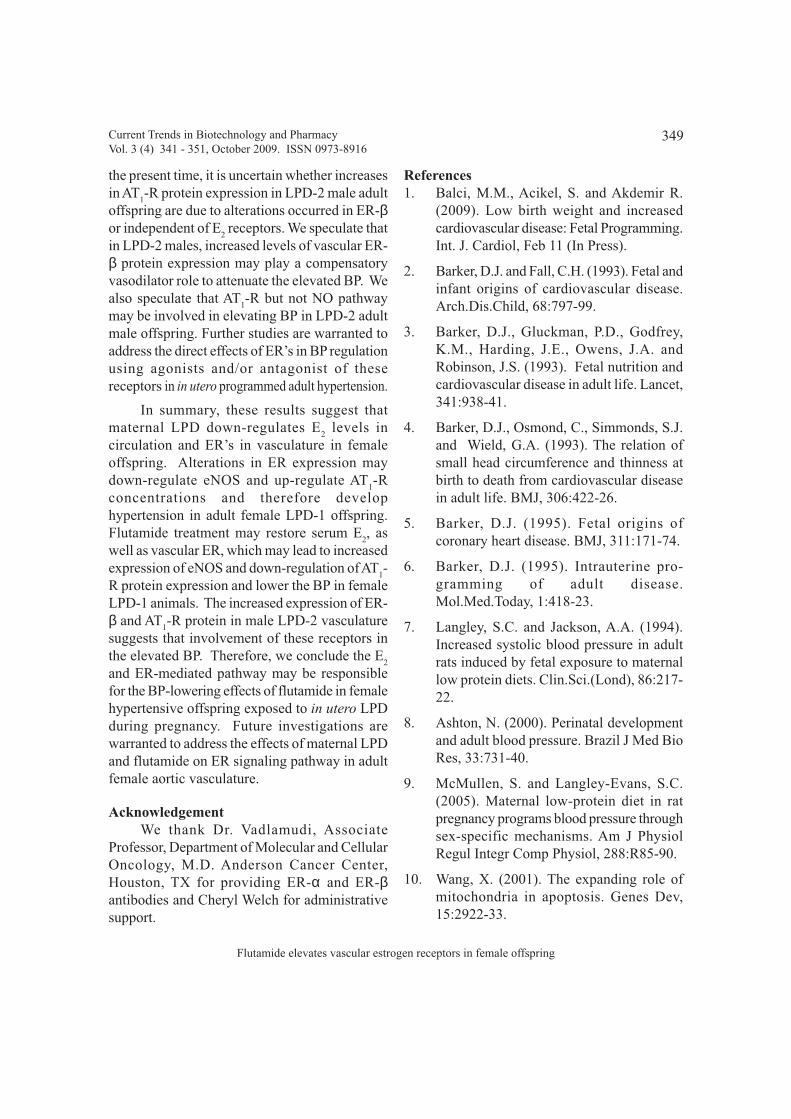
3. Effect of in utero LPD and flutamide onvascular eNOS protein expression in adultoffspring: Because ER’s expression is decreasedin adult female LPD-1 offspring and restored byflutamide treatment in aortic homogenates, weinvestigated whether eNOS protein expressionwas also altered in vascular tissues. As shown inFigures 3A and 3B, a single band of eNOS proteinwas obtained with a predicted size of 140 kDafrom both female LPD-1 (3A) and male LPD-2(3B) rat offspring. Densitometric analysis of the
eNOS protein from aorta homogenates in eachgroup showed that this protein in LPD-1 adultfemale rats were substantially decreased and thiseffect was significantly (p < 0.05) attenuated byflutamide treatment (Figure 3A). However, nochange in the vascular eNOS protein expressionin adult male LPD-2 offspring was noticed(Figure 3B).
4. Effect of in utero LPD on vascular AT1-
R protein expression in female and male adultoffspring: Next, we assessed whether AT
1-R
protein expression was altered in LPD-1 adultfemales and if so, does flutamide treatmentreverses this effect. We also examined whetherthe protein expression for AT
1-R is altered in male
LPD-2 rat offspring. Total protein was isolatedfrom aortic homogenates, and Western analysiswas used to quantify AT
1-R protein. As shown
in Figure 4A and 4B, a protein band was obtainedwith a predicted size of 50 kDa from vascularhomogenates. Densitometric analysis revealed
Fig. 2. Expression of protein for estrogen receptors (ER) in thoracic aortas in male rat offspring exposed to intrauterineLPD during pregnancy. The LPD was given in utero from day 12 (LPD-2) of pregnancy until delivery. The control groupreceived 20% protein. Aortic tissues homogenates were prepared for Western blot analysis. A (top): Representativeimmunoblot of rat thoracic aortas showing the expression of ER-α (60 kDa) and β-actin (50 kDa) from control and LPD-2. A (bottom): Densitometric analysis were performed and the ratio of ER-α to β-actin are calculated. B (top): Repre-sentative immunoblot analysis of ER-β and β-actin from five animals per group. B (bottom): Densitometric analysiswas performed and the ratio of ER-β (55 kDa) to β-actin are calculated. Values are mean ± SEM. * p < .05 comparedwith control group.
Current Trends in Biotechnology and PharmacyVol. 3 (4) 341 - 351, October 2009. ISSN 0973-8916

346
Gangula et al
that the expression of AT1-R receptor protein was
significantly (p < .05) elevated in adult femaleLPD-1 offspring and this was attenuated by theflutamide treatment (Figure 4A). Similarly, asignificant (p < 0.05) increase in AT
1-R protein
expression in vascular homogenates wereobserved in male LPD-2 rat offspring (Figure4B).
DiscussionIn the present study, for the first time, we
demonstrated that in utero LPD throughoutpregnancy (LPD-1) caused a decrease in theprotein expression of ER-α, ER-β, eNOS and anincrease in AT
1-R concentrations in adult female
offspring thoracic aortas. Flutamide treatmentsignificantly (p < .05) attenuated the alteredprotein expression for ER-β, eNOS and AT
1-R
in vascular homogenates in female adult LPD-1group. We also observed that an increase invascular protein expression of ER-β and AT
1-R
in adult males exposed to in utero LPD duringsecond half of pregnancy (LPD-2). Results fromour laboratory demonstrated that in utero LPDelevated BP in both male and female offspring(12). Moreover, theses studies demonstrated thatflutamide treatment lowers BP in female but notin male hypertensive offspring. The currentstudy, together with our previous findings (12)suggest that in female offspring, decreases incirculatory estrogens (E
2) and vascular ER may
down-regulate eNOS and perhaps elevate AT1-R
protein expression and this may provide aplausible mechanisms for developinghypertension reported in these animals.Flutamide treatment may increase the circulatoryE
2 levels (12), as well as, ER protein
concentrations in vasculature leading to anelevation of eNOS and down-regulation of AT
1-
R protein expression and therefore, restoringnormal BP. However, in adult male LPD-2offspring, an increase in vascular ER-â and/or
Fig. 3. Expression of protein for endothelial nitric oxide synthase (eNOS) in thoracic aortas in rat offspring exposed tointrauterine LPD during pregnancy. The LPD was given in utero either from day 1 (A; LPD-1) or day 12 (B; LPD-2) ofpregnancy until delivery. The control group received 20% protein. A (top): Representative immunoblot of female ratthoracic aortas showing the expression of eNOS (140 kDa) and β-actin (50 kDa) from control, LPD-1 and LPD-1 +flutamide (10mg/day/4 days; subcutaneous injections). A (bottom): Densitometric analysis were performed and the ratioof eNOS to β-actin are calculated. B (top): Representative immunoblot analysis of eNOS and β-actin from male ratoffspring. B (bottom): Densitometric analysis was performed and the ratio of eNOS to β-actin are calculated. The barsrepresent the mean ± SEM. Significant differences between control versus LPD offspring are noted. p < 0.05 for LPD-1compared to control group; † p < .05 for LPD-1 + flutamide compared to LPD-1 group.
Current Trends in Biotechnology and PharmacyVol. 3 (4) 341 - 351, October 2009. ISSN 0973-8916

347
Flutamide elevates vascular estrogen receptors in female offspring
AT1-R protein expression may be involved in
elevated BP.
Estrogens are known to exert beneficialeffects on the vascular wall. Results from someclinical observations suggest that estrogentherapy (ET) lowers BP in hypertensive post-menopausal women (19, 26-28). Thehypotensive effects of ET has been reported inspontaneous hypertensive rats (SHR) (29), high-fat diet induced females (30), rats withdeoxycorticosterone salt-induced hypertensionand non-pregnant ovariectomized rats with 31andwithout psychological stress (32). Studies fromour laboratory demonstrated that in hypertensivefemale LPD-1 offspring, circulatory E
2 but not
testosterone levels are significantly decreased(12). For the first time, in this study, we haveshown that both ER-a and ER-b proteinconcentrations in thoracic aortas are significantly(p < .05) lower in LPD-1 adult females (Figure1A and 1B). We suggest that in utero LPD-1during pregnancy may decrease serum E
2 levels
and ER concentrations in the vasculature, therebyleading to the development of hypertension infemale offspring. Further studies are warrantedto address the direct effects of ER-α and ER-βagonists or antagonists on BP regulation in femalein utero LPD offspring.
Recently, we have reported that flutamidelowers BP and as well as elevated serum E
2 levels
in females but not in male adult offspring exposedto in utero LPD-1 (12). In the present study, wefound that flutamide treatment in females restoredthe decreased ER-α but not ER-β proteinconcentrations in the vascular (Figure 1A and 1B)tissues. The hypotensive effects of flutamide hasbeen demonstrated in spontaneous malehypertensive rats, male rats lacking a functionalandrogen receptor (testicular feminization, TFM)(13) suggesting the androgen dependent and –independent effects of this agent in regulating BP.Previous studies demonstrated the presence ofaromatase (estrogen synthase), estradiol-17 β-
hydroxysteroid dehydrogenase and 17-Ketoreductase enzyme activities in rat and humanvascular smooth muscle cells 33. It is possible thatflutamide treatment may stimulate aromataseenzyme complex in both vascular and renaltissues, increases estrogen synthesis and itsreceptors, therefore lowering BP in LPD-1 adultfemale offspring. Additional work will berequired to better define the underlyingmechanism(s) involved on the action of flutamideon ER regulation.
In the present study, we observed that theprotein expression of vascular eNOS is reducedin LPD-1 female but not in LPD-2 male offspring,and this was restored by flutamide treatment(Figure 3A and 3B). Previous studies havedemonstrated the dysfunction of endothelium inthe adult rats received low-protein diet in utero(28). However, the mechanism(s) responsible forthis disorder is not well documented. It is wellestablished that E
2 is known to improve the
vascular dysfunction through up-regulation ofendothelial cell genes, such as eNOS 34-36.Furthermore, E
2 has rapid non-genomic effects
on the vascular endothelium, including activationof nitric oxide (NO) synthesis (22-24). Positivecardiovascular effects, and especially the increasein NO production by E
2, have been reported to
involve ER-α as well as ER-β (27, 35, 37). Inaddition, it has been demonstrated that selectiveER-α agonist Cpd 1471, significantly improvedthe endothelial dysfunction in ovariectomizedSHR rats. Taken together, these data suggest thatdecreases in both ER’s perhaps may down-regulate eNOS protein expression in vasculature,therefore increases BP in adult female offspring.Iliescu et al 38studies postulated that flutamidedose-dependently relaxes aorta via NO-cyclicguanosine monophosphate (cGMP) pathway inboth male and female Sprague Dawley ratslacking a functional androgen receptor.Collectively, the above data indicate that the up-regulation of ER-β expression by flutamide
Current Trends in Biotechnology and PharmacyVol. 3 (4) 341 - 351, October 2009. ISSN 0973-8916

348
Gangula et al
treatment may enhance the eNOS proteinexpression in the vasculature, therefore lower theBP in hypertensive adult female offspring.
In the present study, we further show thatvascular AT
1-R expression was significantly (p
< .05) elevated in adult female LPD-1 (Figure4A). Furthermore, flutamide treatment decreasedthe elevated levels of AT
1-R protein concentration
in this blood vessel obtained from adult femaleLPD-1 offspring (Figure 4A). The AT
1-R
mediates many biological functions of renin-angiotensin system including vasoconstriction(39). Previous studies demonstrated that E
2
deficiency has been shown to increase AT1-R
expression, as well as the efficacy of angiotensinson vasoconstriction, whereas E
2 replacement
therapy in ovariectomized rats reversed theoverexpression of AT
1-R concentration (39-40).
Moreover, studies of Nickenig et al (25) usingaortic vascular smooth muscle cells demonstrated
that E2 caused down-regulation of AT
1-R mRNA
expression through NO-dependent pathway andthis effect was mediated through activation ofER’s. These studies together with our currentfindings suggest that a deficiency in circulatoryE
2 and vascular ER may down-regulate the eNOS
and elevate AT1-R protein expression and
therefore increase the BP in female LPD-1offspring. These studies further suggest thatflutamide treatment reduces the elevated BP byaltering E
2-dependent pathway in LPD-1 adult
female offspring.
In LPD-2 adult male offspring, the vascularprotein expression for ER-β but not ER-αappeared to be elevated (Figure 2A and 2B).Furthermore, no changes in vascular eNOSprotein expression were noticed in this setting(Figure 3B). However, a significant increase invascular AT
1-R protein expression was observed
in adult male LPD-2 offspring (Figure 4B). At
Fig. 4. Expression of protein for subtype 1 angiotensin 11-receptor 1 (AT1-R) in thoracic aortas in rat offspring exposed to
intrauterine LPD during pregnancy. The LPD was given in utero either from day 1 (A; LPD-1) or day 12 (B; LPD-2) ofpregnancy until delivery. The control group received 20% protein. A (top): Representative immunoblot analysis offemale rat thoracic aortas showing the expression of AT
1-R (55 kDa) and β-actin (50 kDa) from control, LPD-1 and LPD-
1 + flutamide (10mg/day/4 days; subcutaneous injections). A (bottom): Densitometric analysis was performed and theratio of AT
1-R to β-actin are calculated. B (top): Representative Immunoblot analysis of AT
1-R and β-actin from male rat
offspring. B (bottom): Densitometric analysis was performed and the ratio of AT1-R to β-actin are calculated. The bars
represent mean ± SEM. Significant differences from control versus LPD offspring are noted. * p < .05 for LPD-1compared to control; † p < .05 for LPD-1 + flutamide compared to LPD-1.
Current Trends in Biotechnology and PharmacyVol. 3 (4) 341 - 351, October 2009. ISSN 0973-8916
349
Flutamide elevates vascular estrogen receptors in female offspring
the present time, it is uncertain whether increasesin AT
1-R protein expression in LPD-2 male adult
offspring are due to alterations occurred in ER-βor independent of E
2 receptors. We speculate that
in LPD-2 males, increased levels of vascular ER-β protein expression may play a compensatoryvasodilator role to attenuate the elevated BP. Wealso speculate that AT
1-R but not NO pathway
may be involved in elevating BP in LPD-2 adultmale offspring. Further studies are warranted toaddress the direct effects of ER’s in BP regulationusing agonists and/or antagonist of thesereceptors in in utero programmed adult hypertension.
In summary, these results suggest thatmaternal LPD down-regulates E
2 levels in
circulation and ER’s in vasculature in femaleoffspring. Alterations in ER expression maydown-regulate eNOS and up-regulate AT
1-R
concentrations and therefore develophypertension in adult female LPD-1 offspring.Flutamide treatment may restore serum E
2, as
well as vascular ER, which may lead to increasedexpression of eNOS and down-regulation of AT
1-
R protein expression and lower the BP in femaleLPD-1 animals. The increased expression of ER-β and AT
1-R protein in male LPD-2 vasculature
suggests that involvement of these receptors inthe elevated BP. Therefore, we conclude the E
2
and ER-mediated pathway may be responsiblefor the BP-lowering effects of flutamide in femalehypertensive offspring exposed to in utero LPDduring pregnancy. Future investigations arewarranted to address the effects of maternal LPDand flutamide on ER signaling pathway in adultfemale aortic vasculature.
AcknowledgementWe thank Dr. Vadlamudi, Associate
Professor, Department of Molecular and CellularOncology, M.D. Anderson Cancer Center,Houston, TX for providing ER-α and ER-βantibodies and Cheryl Welch for administrativesupport.
References1. Balci, M.M., Acikel, S. and Akdemir R.
(2009). Low birth weight and increasedcardiovascular disease: Fetal Programming.Int. J. Cardiol, Feb 11 (In Press).
2. Barker, D.J. and Fall, C.H. (1993). Fetal andinfant origins of cardiovascular disease.Arch.Dis.Child, 68:797-99.
3. Barker, D.J., Gluckman, P.D., Godfrey,K.M., Harding, J.E., Owens, J.A. andRobinson, J.S. (1993). Fetal nutrition andcardiovascular disease in adult life. Lancet,341:938-41.
4. Barker, D.J., Osmond, C., Simmonds, S.J.and Wield, G.A. (1993). The relation ofsmall head circumference and thinness atbirth to death from cardiovascular diseasein adult life. BMJ, 306:422-26.
5. Barker, D.J. (1995). Fetal origins ofcoronary heart disease. BMJ, 311:171-74.
6. Barker, D.J. (1995). Intrauterine pro-gramming of adult disease.Mol.Med.Today, 1:418-23.
7. Langley, S.C. and Jackson, A.A. (1994).Increased systolic blood pressure in adultrats induced by fetal exposure to maternallow protein diets. Clin.Sci.(Lond), 86:217-22.
8. Ashton, N. (2000). Perinatal developmentand adult blood pressure. Brazil J Med BioRes, 33:731-40.
9. McMullen, S. and Langley-Evans, S.C.(2005). Maternal low-protein diet in ratpregnancy programs blood pressure throughsex-specific mechanisms. Am J PhysiolRegul Integr Comp Physiol, 288:R85-90.
10. Wang, X. (2001). The expanding role ofmitochondria in apoptosis. Genes Dev,15:2922-33.
Current Trends in Biotechnology and PharmacyVol. 3 (4) 341 - 351, October 2009. ISSN 0973-8916

350
Gangula et al
11. Vehaskari, V.M., Aviles, D.H and Manning,J. (2001). Prenatal programming of adulthypertension in the rat. Kidney Int, 59:238-45.
12. Gangula, P. R., Reed, L. C. and YallampalliC. (2005). Anti-hypertensive effects offlutamide in the rats exposed to low-proteindiet in utero. Am J Obstet Gynecol, 192:952-960.
13. Baltatu, O., Cayla, C., Iliescu, R., Andreev,D., Jordan, C. and Bader, M. (2002).Abolition of hypertension-induced end-organ damage by androgen receptorblockade in transgenic rats harboring themouse ren-2 gene. J Am.Soc Nephrol,13:2681-87.
14. Baltatu, O., Cayla, C., Iliescu, R., Andreev,D. and Bader, M. (2003). Abolition of end-organ damage by antiandrogen treatmentin female hypertensive transgenic rats.Hyperten, 41:830-33.
15. Hong, M.K., Romm, P.A., Reagan, K.,Green, C.E. and Rackley, C.E. (1992).Effects of estrogen replacement therapy onserum lipid values and angiographicallydefined coronary artery disease inpostmenopausal women. Am J Cardiol,69:176-78.
16. Erkkola, R., Lammintausta, R., Punnonen,R. and Rauramo, L. (1978). The effect ofestriol succinate therapy on plasma reninactivity and urinary aldosterone inpostmenopausal women. Maturitas, 1:9-14.
17. Schunkert, H., Danser, A.H.J., Hense,H.W., Derkx, F.H., Kurzinger, S. andRiegger, G.A. (1997). Effects of estrogenreplacement therapy on the renin-angiotensin system in postmenopausalwomen. Circulation, 95:39-45.
18. Nickenig, G., Baumer, A.T., Grohe, C.,Kahlert, S., Strehlow, K., Rosenkranz, S.,
Stäblein, A., Beckers, F., Smits, J.F.,Daemen, M.J., Vetter, H. and Böhm, M.(1998). Estrogen modulates A.T. 1 receptorgene expression in vitro and in vivo.Circulation, 97:2197-201.
19. Mendelsohn, M.E. and Karas, R.H.(1999).The protective effects of estrogen on thecardiovascular system. N.Engl.J Med,340:1801-11.
20. Liehr, J.G. (1996). Antioxidant andprooxidant properties of estrogens. J LabClin Med, 128:344-45.
21. Freay, A.D., Curtis, S.W., Korach, K.S. andRubanyi, G.M. (1997). Mechanism ofvascular smooth muscle relaxation byestrogen in depolarized rat and mouse aorta.Role of nuclear estrogen receptor and Ca2+
uptake. Circ Res, 81:242-48.
22. Jiang, C.W., Sarrel, P.M., Lindsay, D.C.,Poole-Wilson, P.A. and Collins, P. (1991).Endothelium-independent relaxation ofrabbit coronary artery by 17 beta-oestradiolin vitro. Br J Pharmacol, 104:1033-37.
23. Lantin-Hermoso, R.L., Rosenfeld, C.R.,Yuhanna, I.S., German, Z., Chen, Z. andShaul, P.W. (1997). Estrogen acutelystimulates nitric oxide synthase activity infetal pulmonary artery endothelium. Am JPhysiol, 273:L119-L126.
24. Caullin-Glaser, T., Garcia-Cardena, G. andSarrel, P. (1997). 17 beta-estradiolregulation of human endothelial cell basalnitric oxide release, independent ofcytosolic Ca2+ mobilizatioin. Circ Res,81:885-92.
25. Nickenig, G., Strehlow, K., Wassmann, S.,Baumer, A.T., Albory, K., Sauer, H. andBöhm, M. (2000). Differential effects ofestrogen and progesterone on AT(1)receptor gene expression in vascular smoothmuscle cells. Circulation, 102:1828-33.
Current Trends in Biotechnology and PharmacyVol. 3 (4) 341 - 351, October 2009. ISSN 0973-8916

351
Flutamide elevates vascular estrogen receptors in female offspring
26. Dubey, R.K., Oparil, S., Imthurn, B. andJackson, E.K. (2002). Sex hormones andhypertension. Cardio Res, 53:688-708.
27. Orshal, J.M. and Khalil, R.A. (2004).Gender, sex hormones, and vascular tone.Am J Physiol Regul Integr Comp Physiol,286:R233-R249.
28. Qiao, X., Kristi, R., McConnell, B.S. andKhalil, R.A. (2008). Sex steroids andvascular responses in hypertension andaging, Gender Med, 5:S46-S64.
29. Peng, N., Clark, J.T., Wei, C.C. and Wyss,J.M. (2003). Estrogen depletion increasesblood pressure and hypothalamicnorepinephrine in middle-aged spont-aneously hypertensive rats. Hypertension,41:1164-67.
30. Roberts, C.K., Vaziri, N.D. and Barnard,R.J. (2001). Protective effects of estrogenon gender-specific development of diet-induced hypertension. J Appl.Physiol,91:2005-09.
31. Hernandez, I., Delago, J.L., Diaz, J.,Quesada, T., Teruel, M.J.G., Llanos, M.C.and Carbonell, L.F. (2000). 17-beta-Estradiol prevents oxidative stress anddecreases blood pressure in ovariectomizedrats. Am J Physiol Regul Integr CompPhysiol, 279:R1599-R1605.
32. Morimoto, K., Kurahashi, Y., Shintani-Ishida, K., Kawamura, N., Miyashita, M.,Uji, M., Tan, N. and Yoshida, K. (2004).Estrogen replacement suppresses stress-induced cardiovascular responses inovariectomized rats. Am J Physiol HeartCirc Physiol, 287:H1950-H1956.
33. Bayard, F., Clamens, S., Meggetto, F.,Blaes, N., Delsol, G. and Faye, J.C. (1995).Estrogen synthesis, estrogen metabolism,and functional estrogen receptors in rat
arterial smooth muscle cells in culture.Endocrinology, 136:1523-29.
34. Farsetti, A., Grasselli, A., Bacchetti, S.,Gaetano, C. and Capogrossi, C. (2009). Thetelomerase tale in vascular aging: regulationby estrogens and nitric oxide signaling. JAppl Physiol, 106:333-337.
35. Tan, E., Gurjar, M.V., Sharma, R.V. andBhalla, R.C. (1999). Estrogen receptor-alpha gene transfer into bovine aorticendothelial cells induces eNOS geneexpression and inhibits cell migration.Cardiovasc Res, 43:788-97.
36. Rupnow, H.L., Phernetton, T.M., Shaw,C.E., Modrick, M.L., Bird, I.M. andMagness, R.R. (2001). Endothelialvasodilator production by uterine andsystemic arteries. Am.J.Physiol, 280:H1699-H1705.
37. Haynes, M.P., Sinha, D., Russell, K.S.,Collinge, M., Fulton, D., Morales-Ruiz, M.,Sessa, W.C. and Bender, J.R. (2000).Membrane estrogen receptor engagementactivates endothelial nitric oxide synthasevia the PI3-kinase-Akt pathway in humanendothelial cells. Circ Res, 87:677-82.
38. Iliescu, R., Campos, L.A., Schlegel, W.P.,Morano, I., Baltatu, O. and Bader, M.(2003). Androgen receptor independentcardiovascular action of the antiandrogenflutamide. J Mol.Med, 81:420-27.
39. Fischer, M., Baessler, A. and Schunkert, H.(2002). Renin angiotensin system andgender differences in the cardiovascularsystem. Cardiovasc Res, 53:672-77.
40. Wu, Z., Maric, C., Roesch, D.M., Zheng,W., Verbalis, J.G. and Sandberg K. (2003).Estrogen regulates adrenal angiotensin AT1receptors by modulating AT1 receptortranslation. Endocrinology, 144:3251-61.
Current Trends in Biotechnology and PharmacyVol. 3 (4) 341 - 351, October 2009. ISSN 0973-8916

352
Anti-diabetic and antioxidant effects of Hydroxytyrosol in pancreas and slices liver incubation.
AbstractThe present study aims to investigate the
effect of hydroxytyrosol in insulin secretion andthe antioxidant activity in liver slices in vitro.For this, pancreas and liver slices were incubatedin presence of 1g/l or 4g/l glucose (±hydroxytyrosol (HT)) during 40 minutes. Weinterest to evaluate the action of HT in insulinsecretion, antioxidant enzymes activities(superoxide dismutase (SOD), catalase (CAT)and glutathione peroxidase (GPX)), reducedglutathione (GSH), lipid peroxidation, lactatedehydrogenase (LDH) and histological changesin pancreas and liver slices. For the first time,our results show that hydroxytyrosol significantlyinduces insulin secretion in pancreas incubation.Besides, the present work prove that HT has agood antioxidant activity by preventing thedecrease of superoxide dismutase (SOD), catalase(CAT) and gluthation peroxidase (GPX) activitiesand the reducing glutathione content (GSH) inhepatic slices incubated in high glucoseconcentration (HG) (4g/l). En parallel, asignificant decrease in lipid peroxidation rate andlactate dehydrogenase (LDH) activity areobserved after hydroxytyrosol administration inliver slices. Theses beneficial actions of HT areconfirmed by histological changes in hepatic andpancreatic tissues. Conclusion: HT supplemen-tation in diabetic can induces insulin secretionand prevents glucose toxicity in pancreas andliver.
Inhibitory action of hydroxytyrosol from glucose-inducedInsulin deficient and pancreas and liver toxicity in vitro
Khaled Hamdena*, Nourreddine alloucheb, Mohamed Damakb, Serge CarreauC andAbdelfattah Elfekia
aAnimal Ecophysiology, Faculty of Sciences, Sfax, TunisiabChemistry of Natural substances laboratory, Faculty of Sciences, Sfax, Tunisia
CUSC 2006 INRA- EA 2608, Biochemistry-University of Caen, France.*For correspondence - [email protected]
Keywords: Hydroxytyrosol, Pancreas, Glucosetoxicity, Insulin, Antioxidant, Liver slices.
IntroductionDiabetes mellitus (DM) is a major cause
of disability and hospitalization that presents asignificant burden on societies worldwide (1,2).Higher glucose level in vitro as well in vivo isthe principal sources of reactive oxygen species(ROS) which are play a key role in the apparitionof many diseases and disorders (3,4). Thegeneration of ROS has been implicated in thepathogenesis of several forms of acute cell injury,where the oxidative stress process plays a centralrole (5,6). Oxidative stress is now recognized tobe associated with more than 200 diseases (7).Dietary intake of foods rich in antioxidants, asphenolic compounds, is associated with theprevention of cardiovascular disease and reducesrisk of liver dysfunction (5) and neuroprotectiveand cardioprotective actions (8-10). There is acontinuing interest to define the preventive effectsof phenols against reactive oxygen speciesmediated degenerative diseases. Phenoliccompounds are important bioactive bio-molecules that are of increasingly interest for theirability to exert antioxidant actions. A significantnumber of reports exist in the literature indicatingthat hydroxytyrosol, a natural exist in olive oil,exerts antioxidative actions which are effectivein preventing or reducing the deleterious effectsof oxygen-derived free radicals associated with
Current Trends in Biotechnology and PharmacyVol. 3 (4) 352 - 361, October 2009. ISSN 0973-8916

353
Khaled Hamden et al
many diseases (11, 12). In fact hydroxytyrosolhas various biological activities, such as,preventing human erythrocytes from oxidativedamage induced by hydrogen peroxide in rats(13), and human (14), inhibiting LDL oxidationin vitro, and anti-inflammatory (15-17).
Materials and MethodsChromatographic purification of hydroxytyrosol
Fresh olive mill wastewaters (OMW) weresupplied by discontinuous three-phase oliveprocessing mill from a cooperative in Sfax(Tunisia). This sample was generated fromChemlali olive variety. Hydroxytyrosol waspurified from OMW as described previously (18).Briefly, the polyphenolic fraction was extractedfrom OMW using ethyl acetate as solvent. Theorganic extract was evaporated under reducedpressure below 45 °C. an aliquot (1 g) of theobtained residue was chromatographed on a C-18 silica gel (liChroprep RP-18; 25–40 µm)column (2.5 x 70 cm) under medium pressure.Phenolic compound elution was carried out witha mixture of water/acetonitrile (8:2, V:V) . Theflow rate was adjusted to 0.3 ml/min and 4.5 mlfractions were collected. These fractions weremeasured by optical density at 280 nm and thechromatogram (optical density versus fractionnumber) was represented (data not shown). Thefirst separated peak corresponds to purehydroxytyrosol.
Preparation of Liver SlicesMale adult Wister rat, weighing 280–200
g was taken and dissected after cervicaldislocation. The liver and pancreas wereremoved, transferred and then incubated in KRBbuffer (pH 7.4): 118 mM NaCl, 4 mM KCl, 2.5mM CaCl2, 1.2 mM MgSO4, 1.2 mM KH2PO4,25 mM NaHCO3, 1.25 g/l BSA and 40 g/l dextranT70). The perfusate was continuously gassed witha mixture of O2:CO2 (95:5). Liver was slicedinto small pieces (4–6 mg) of about 0.5∞ 0.5∞0.5
mm using a prep blade. Slices were divided intosmall portions (20–22 slices) of 100–120 mg wetweight. 1 g liver slices and 1 g pancreas wereincubated for 40 min in 5 ml KRB medium at 37°C equilibrated with 95% O
2 + 5%CO
2 gas.
Experiment Design1g liver slices and 1g pancreas were
divided in to three sets: set 1: control, tissuesincubated in KRB medium a final concentrationof glucose 1g/l; set 2: tissues incubated in KRBmedium a final concentration of glucose 4g/l; set3: slices incubated in KRB medium a finalconcentration of glucose 4g/l + 50 µg/mlHydroxytyrosol. Triplicate cultures were set upfor each concentration to minimize the errors.Effluent was fractionally collected every 10minute, and its insulin concentration wasmeasured by a radioimmunoassay kit for Bi-insulin RIA Diagnostic, Pasteur, Paris, France.
After the end of incubation, liver sliceswere homogenized in ice-cold 100 mMpotassium phosphate buffer (pH 7.4) andcentrifuged at 4,000∞g for 15 min at 4 °C. Livermarker enzyme lactate dehydrogenase (LDH) andantioxidant enzymes SOD, CAT, and glutathioneperoxidase (GPx) were estimated in thesupernatant. Lipid peroxidation and glutathione(GSH) contents were also measured. Forhistological studies, pieces of pancreas and liverwere fixed in a Bouin Hollande solution for 24hours, and then embedded in paraffin. Sectionsof 5µm thickness were stained with hematoxylin-eosin and examined under the Olympus CX41light microscope.
Biochemical assaysLipid peroxidation was estimated
colorimetrically by measuring thiobarbituric acidreactive substances (TBARS) using the methodsof Buege and Aust (19). In brief, 0.1 ml of liverslices was treated with 2 ml of TBA–
Current Trends in Biotechnology and PharmacyVol. 3 (4) 352 - 361, October 2009. ISSN 0973-8916
354
Anti-diabetic and antioxidant effects of Hydroxytyrosol in pancreas and slices liver incubation.
trichloroacetic acid–HCl reagent (0.37%TBA,0.25MHCl and 15%TCA, 1:1:1 ratio), placed for15 min in a water bath and then cooled andcentrifuged at 3500 ∞g for 10 min at roomtemperature. The absorbance of supernatant wasmeasured at 535 nm against a reference blank.Values were expressed as mM/mg protein.Catalase (CAT) was estimated by the method ofAebi (20). The reaction mixture contained 1.0ml of 0.01 M phosphate buffer (pH 7.0), 0.1 mlsperm medium and 0.4 ml of 50M H2O2. Thereaction was stopped by the addition of 2.0 ml ofdichromate-acetic acid reagent (5% potassiumdichromate and glacial acetic acid were mixedin 1:3 ratio). Then the absorbance was readdenat 620 nm; CAT activity was expressed as µM ofH2O2 consumed/min/mg protein. SOD wasassayed according to the technique of Marklundand Marklund (21) based on the inhibition of theformation of nicotinamide adenine dinucleotide,phenazine methosulfate, and amino bluetetrazolium formazan. A single unit of enzymewas expressed as 50% inhibition of nitrobluetetrazolium reduction per min/mg protein. GPxactivity was measured by the method describedby Pagila and Valentine (22). Briefly, the reactionmixture contained 0.2 mL of 0.4 M phosphatebuffer (pH 7.0), 0.1 mL of 10 mM sodium azide,0.2 mL of sperm medium (supernatant;homogenized in 0.4 M phosphatebuffer, pH 7.0),0.2 mL of GSH, and 0.1 mL of 0.2 mM hydrogenperoxide. The contents were incubated at 37°Cfor 10 min. The reaction was stopped by adding0.4 mL of 10% TCA and centrifuged. The GSHcontent was estimated in the liver slices by themethod of Ellman (23). Liver pieces were lysedwith 0.1% EDTA solution and precipitatingreagent which contains 0.16% metaphosphoricacid, 0.02% EDTA and 3% NaCl. After mixing,the solution was allowed to stand for 5 min beforebeing filtered. Two milliliter of filtrate was addedto 4 ml of disodium hydrogen phosphate (0.1 M,
pH 8.0) and 1 ml of DTNB reagent. A blank wasprepared from 1.2 ml of precipitating reagent, 0.8ml of EDTA solution, 4 ml of disodium hydrogenphosphate and 1 ml of DTNB reagent. The colorwas immediately readden at 412 nm with the helpof spectrophotometer. The amount of proteinswas determined by the method of Lowry et al(24) using bovine serum albumin as the standardat 660 nm. The activity of lactate dehydrogenase(LDH) and Glycogen content were assayed usingcommercial kits from Biomaghreb, Tunis,Tunisia. For histological studies, pieces ofpancreas and liver were fixed in a bouine’ssolution for 24 hrs and then embedded in aparaffin section of 5µm thickness were stainedwith hematoxylen, eosin and examined underolumpus CX41 light Microscope.
Statistical analysisData are presented as means ± SD. The
determinations were performed from 6 animalsper group and the differences were examined bythe one-way analysis of variance (ANOVA)followed by the Fisher test (Stat View) and thesignificance was accepted at p<0.05.
ResultsAntioxidant activity in vitro
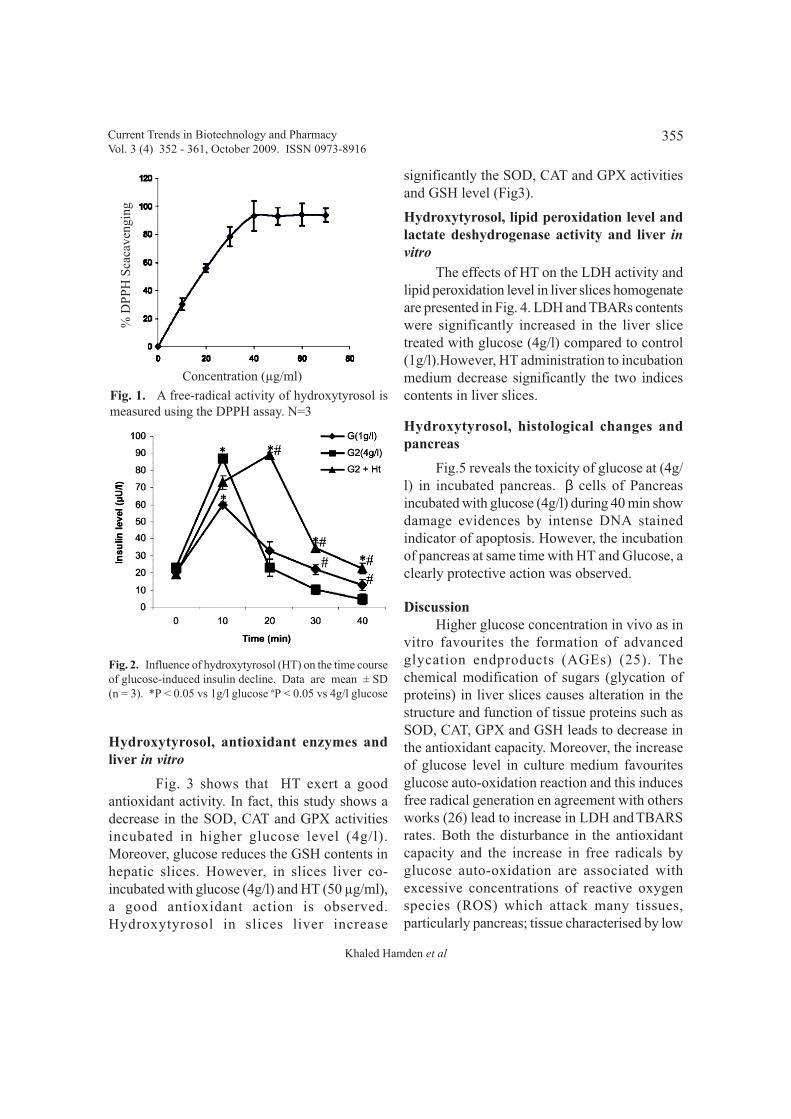
In vitro, the antioxidant activity of HTwas evaluated by its ability to scavenge DPPHfree radicals. HT showed a scavenging activitywith a percentage decrease, versus the absorbanceof DPPH standard solution of 96% at aconcentration of 40 µg/ml (Fig. 1).
Hydroxytyrosol, insulin and pancreas in vitro
Fig. 2 shows that higher glucoseconcentration causes a decline in insulin secretionafter 40 min of pancreas incubation. However,in pancreas incubated at same time with HGconcentration and hydroxytyrosol, weinvestigated in the first time a significant increasein the insulin secretion.
Current Trends in Biotechnology and PharmacyVol. 3 (4) 352 - 361, October 2009. ISSN 0973-8916
355
Khaled Hamden et al
Hydroxytyrosol, antioxidant enzymes andliver in vitro
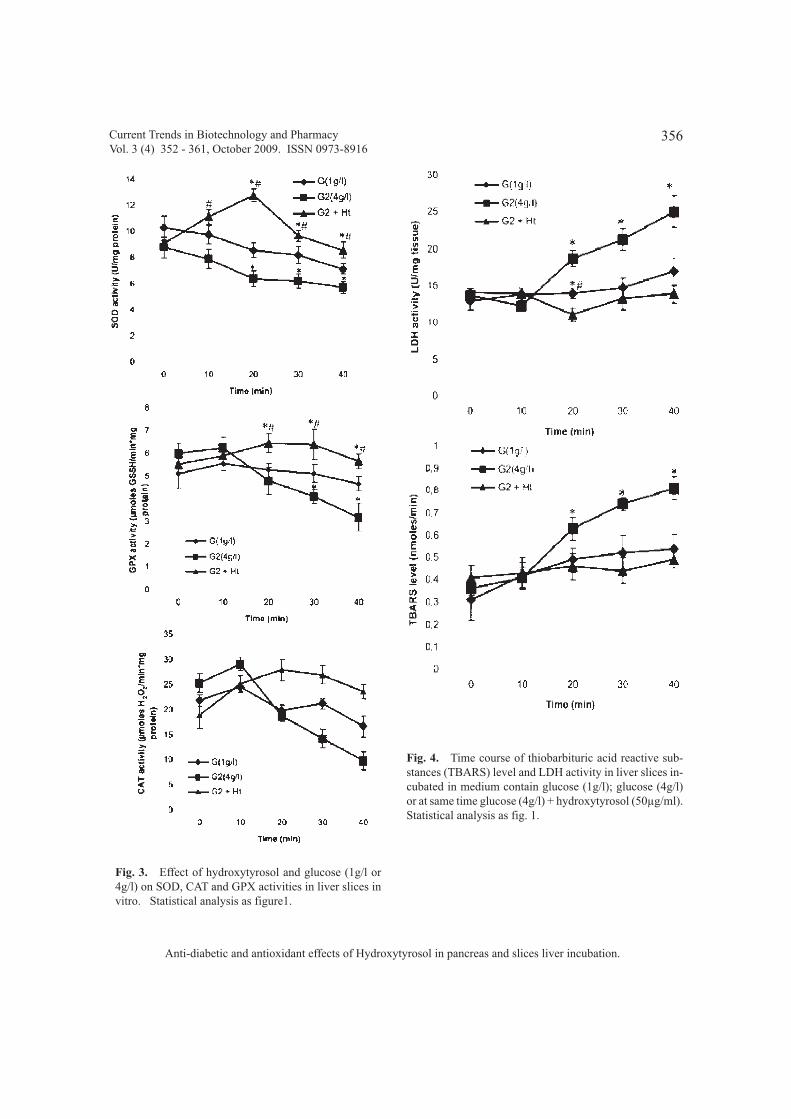
Fig. 3 shows that HT exert a goodantioxidant activity. In fact, this study shows adecrease in the SOD, CAT and GPX activitiesincubated in higher glucose level (4g/l).Moreover, glucose reduces the GSH contents inhepatic slices. However, in slices liver co-incubated with glucose (4g/l) and HT (50 µg/ml),a good antioxidant action is observed.Hydroxytyrosol in slices liver increase
significantly the SOD, CAT and GPX activitiesand GSH level (Fig3).
Hydroxytyrosol, lipid peroxidation level andlactate deshydrogenase activity and liver invitro
The effects of HT on the LDH activity andlipid peroxidation level in liver slices homogenateare presented in Fig. 4. LDH and TBARs contentswere significantly increased in the liver slicetreated with glucose (4g/l) compared to control(1g/l).However, HT administration to incubationmedium decrease significantly the two indicescontents in liver slices.
Hydroxytyrosol, histological changes andpancreas
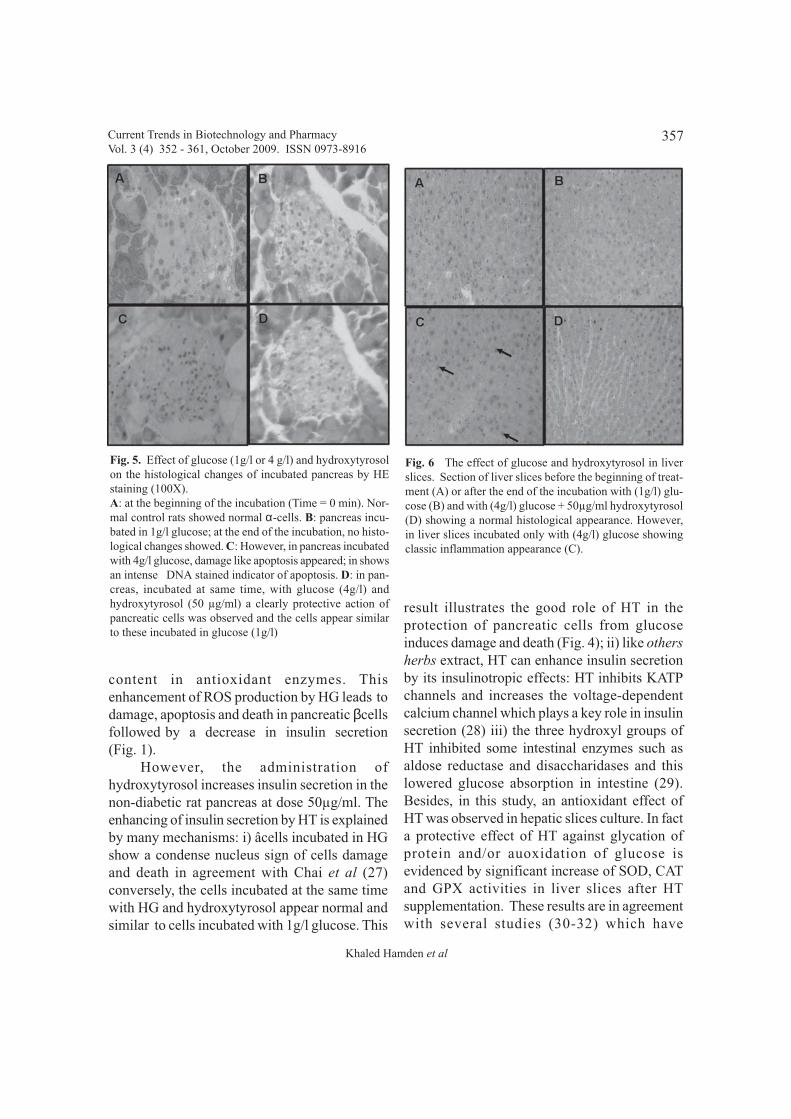
Fig.5 reveals the toxicity of glucose at (4g/l) in incubated pancreas. β cells of Pancreasincubated with glucose (4g/l) during 40 min showdamage evidences by intense DNA stainedindicator of apoptosis. However, the incubationof pancreas at same time with HT and Glucose, aclearly protective action was observed.
DiscussionHigher glucose concentration in vivo as in
vitro favourites the formation of advancedglycation endproducts (AGEs) (25). Thechemical modification of sugars (glycation ofproteins) in liver slices causes alteration in thestructure and function of tissue proteins such asSOD, CAT, GPX and GSH leads to decrease inthe antioxidant capacity. Moreover, the increaseof glucose level in culture medium favouritesglucose auto-oxidation reaction and this inducesfree radical generation en agreement with othersworks (26) lead to increase in LDH and TBARSrates. Both the disturbance in the antioxidantcapacity and the increase in free radicals byglucose auto-oxidation are associated withexcessive concentrations of reactive oxygenspecies (ROS) which attack many tissues,particularly pancreas; tissue characterised by low
Fig. 1. A free-radical activity of hydroxytyrosol ismeasured using the DPPH assay. N=3
Fig. 2. Influence of hydroxytyrosol (HT) on the time courseof glucose-induced insulin decline. Data are mean ± SD(n = 3). *P < 0.05 vs 1g/l glucose #P < 0.05 vs 4g/l glucose
Current Trends in Biotechnology and PharmacyVol. 3 (4) 352 - 361, October 2009. ISSN 0973-8916
Concentration (µg/ml)
% D
PPH
Sca
cave
ngin
g
356
Anti-diabetic and antioxidant effects of Hydroxytyrosol in pancreas and slices liver incubation.
Fig. 3. Effect of hydroxytyrosol and glucose (1g/l or4g/l) on SOD, CAT and GPX activities in liver slices invitro. Statistical analysis as figure1.
Fig. 4. Time course of thiobarbituric acid reactive sub-stances (TBARS) level and LDH activity in liver slices in-cubated in medium contain glucose (1g/l); glucose (4g/l)or at same time glucose (4g/l) + hydroxytyrosol (50µg/ml).Statistical analysis as fig. 1.
Current Trends in Biotechnology and PharmacyVol. 3 (4) 352 - 361, October 2009. ISSN 0973-8916
357
Khaled Hamden et al
result illustrates the good role of HT in theprotection of pancreatic cells from glucoseinduces damage and death (Fig. 4); ii) like othersherbs extract, HT can enhance insulin secretionby its insulinotropic effects: HT inhibits KATPchannels and increases the voltage-dependentcalcium channel which plays a key role in insulinsecretion (28) iii) the three hydroxyl groups ofHT inhibited some intestinal enzymes such asaldose reductase and disaccharidases and thislowered glucose absorption in intestine (29).Besides, in this study, an antioxidant effect ofHT was observed in hepatic slices culture. In facta protective effect of HT against glycation ofprotein and/or auoxidation of glucose isevidenced by significant increase of SOD, CATand GPX activities in liver slices after HTsupplementation. These results are in agreementwith several studies (30-32) which have
Fig. 5. Effect of glucose (1g/l or 4 g/l) and hydroxytyrosolon the histological changes of incubated pancreas by HEstaining (100X).A: at the beginning of the incubation (Time = 0 min). Nor-mal control rats showed normal α-cells. B: pancreas incu-bated in 1g/l glucose; at the end of the incubation, no histo-logical changes showed. C: However, in pancreas incubatedwith 4g/l glucose, damage like apoptosis appeared; in showsan intense DNA stained indicator of apoptosis. D: in pan-creas, incubated at same time, with glucose (4g/l) andhydroxytyrosol (50 µg/ml) a clearly protective action ofpancreatic cells was observed and the cells appear similarto these incubated in glucose (1g/l)
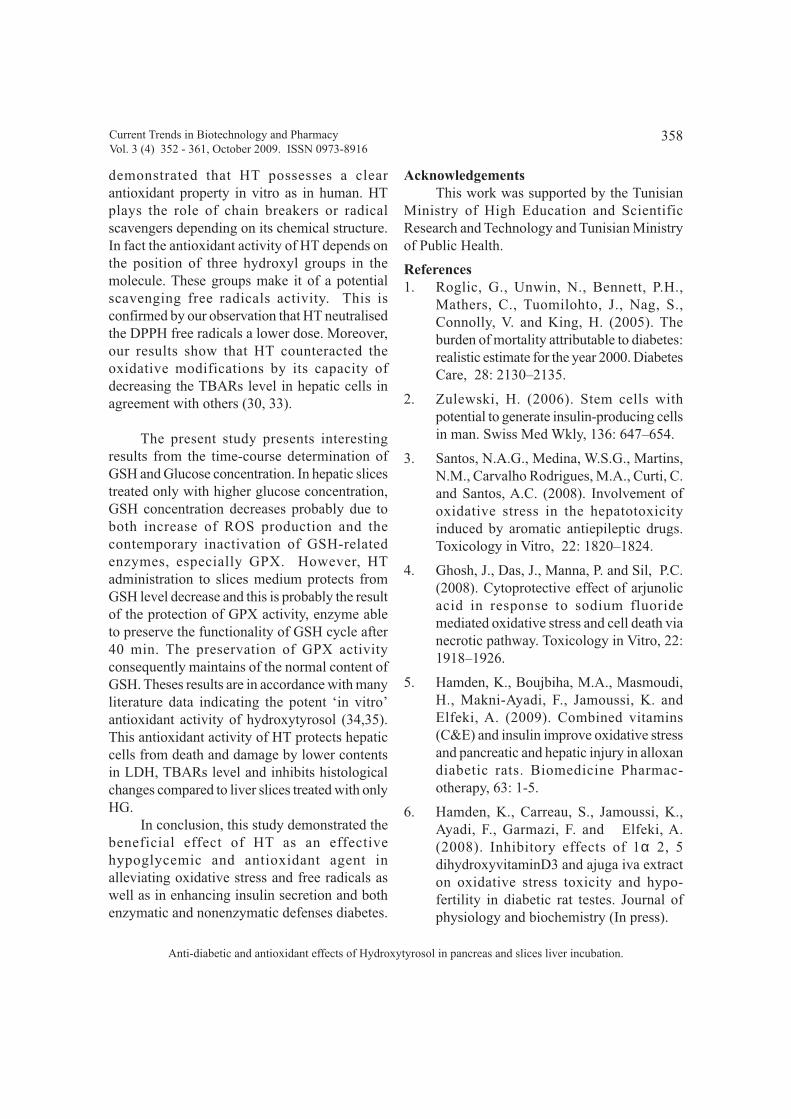
Fig. 6 The effect of glucose and hydroxytyrosol in liverslices. Section of liver slices before the beginning of treat-ment (A) or after the end of the incubation with (1g/l) glu-cose (B) and with (4g/l) glucose + 50µg/ml hydroxytyrosol(D) showing a normal histological appearance. However,in liver slices incubated only with (4g/l) glucose showingclassic inflammation appearance (C).
content in antioxidant enzymes. Thisenhancement of ROS production by HG leads todamage, apoptosis and death in pancreatic βcellsfollowed by a decrease in insulin secretion(Fig. 1).
However, the administration ofhydroxytyrosol increases insulin secretion in thenon-diabetic rat pancreas at dose 50µg/ml. Theenhancing of insulin secretion by HT is explainedby many mechanisms: i) âcells incubated in HGshow a condense nucleus sign of cells damageand death in agreement with Chai et al (27)conversely, the cells incubated at the same timewith HG and hydroxytyrosol appear normal andsimilar to cells incubated with 1g/l glucose. This
Current Trends in Biotechnology and PharmacyVol. 3 (4) 352 - 361, October 2009. ISSN 0973-8916
358
Anti-diabetic and antioxidant effects of Hydroxytyrosol in pancreas and slices liver incubation.
demonstrated that HT possesses a clearantioxidant property in vitro as in human. HTplays the role of chain breakers or radicalscavengers depending on its chemical structure.In fact the antioxidant activity of HT depends onthe position of three hydroxyl groups in themolecule. These groups make it of a potentialscavenging free radicals activity. This isconfirmed by our observation that HT neutralisedthe DPPH free radicals a lower dose. Moreover,our results show that HT counteracted theoxidative modifications by its capacity ofdecreasing the TBARs level in hepatic cells inagreement with others (30, 33).
The present study presents interestingresults from the time-course determination ofGSH and Glucose concentration. In hepatic slicestreated only with higher glucose concentration,GSH concentration decreases probably due toboth increase of ROS production and thecontemporary inactivation of GSH-relatedenzymes, especially GPX. However, HTadministration to slices medium protects fromGSH level decrease and this is probably the resultof the protection of GPX activity, enzyme ableto preserve the functionality of GSH cycle after40 min. The preservation of GPX activityconsequently maintains of the normal content ofGSH. Theses results are in accordance with manyliterature data indicating the potent ‘in vitro’antioxidant activity of hydroxytyrosol (34,35).This antioxidant activity of HT protects hepaticcells from death and damage by lower contentsin LDH, TBARs level and inhibits histologicalchanges compared to liver slices treated with onlyHG.
In conclusion, this study demonstrated thebeneficial effect of HT as an effectivehypoglycemic and antioxidant agent inalleviating oxidative stress and free radicals aswell as in enhancing insulin secretion and bothenzymatic and nonenzymatic defenses diabetes.
AcknowledgementsThis work was supported by the Tunisian
Ministry of High Education and ScientificResearch and Technology and Tunisian Ministryof Public Health.
References1. Roglic, G., Unwin, N., Bennett, P.H.,
Mathers, C., Tuomilohto, J., Nag, S.,Connolly, V. and King, H. (2005). Theburden of mortality attributable to diabetes:realistic estimate for the year 2000. DiabetesCare, 28: 2130–2135.
2. Zulewski, H. (2006). Stem cells withpotential to generate insulin-producing cellsin man. Swiss Med Wkly, 136: 647–654.
3. Santos, N.A.G., Medina, W.S.G., Martins,N.M., Carvalho Rodrigues, M.A., Curti, C.and Santos, A.C. (2008). Involvement ofoxidative stress in the hepatotoxicityinduced by aromatic antiepileptic drugs.Toxicology in Vitro, 22: 1820–1824.
4. Ghosh, J., Das, J., Manna, P. and Sil, P.C.(2008). Cytoprotective effect of arjunolicacid in response to sodium fluoridemediated oxidative stress and cell death vianecrotic pathway. Toxicology in Vitro, 22:1918–1926.
5. Hamden, K., Boujbiha, M.A., Masmoudi,H., Makni-Ayadi, F., Jamoussi, K. andElfeki, A. (2009). Combined vitamins(C&E) and insulin improve oxidative stressand pancreatic and hepatic injury in alloxandiabetic rats. Biomedicine Pharmac-otherapy, 63: 1-5.
6. Hamden, K., Carreau, S., Jamoussi, K.,Ayadi, F., Garmazi, F. and Elfeki, A.(2008). Inhibitory effects of 1α 2, 5dihydroxyvitaminD3 and ajuga iva extracton oxidative stress toxicity and hypo-fertility in diabetic rat testes. Journal ofphysiology and biochemistry (In press).
Current Trends in Biotechnology and PharmacyVol. 3 (4) 352 - 361, October 2009. ISSN 0973-8916
359
Khaled Hamden et al
7. Nelson, S.K., Bose, S.K., Grunwald, G.K.,Myhill, P. and Cord, J.M. (2006). Theinduction of human superoxide dismutaseand catalase in vivo: A fundamentally newapproach to antioxidant therapy. Freeradical Biology & Medicine 15, 341 – 347.
8. Thirupathi, K., Krishna, D.R., Ravi Kumar,B., Apparao, A.V.N. and Krishna Mohan,G. (2009). Hepatoprotective effect of leavesof Balanites roxburghii against carbontetrachloride-induced hepatic damage inrats. Current Trends in Biotechnology andPharmacy, 3: 219-224.
9. Gayathri, M. and Kannabiran K. (2008).Ameliorative potential of aqueous extractof Pterocarpus marsupium Roxb bark ondiabetes associated metabolic alterations.Current Trends in Biotechnology andPharmacy, Vol. 2 (2): 327 -333.
10. Dudley, J.I., Lekli, I., Mukherjee, S., Das,M., Bertelli, A.A. and Das, D.K. (2008).Does white wine qualify for Frenchparadox? Comparison of the cardiop-rotective effects of red and white wines andtheir constituents: resveratrol, tyrosol, andhydroxytyrosol. Journal of Agricultural andFood Chemistry, 56: 9362-73.
11. Mukherjee, S., Lekli, I., Gurusamy, N.,Bertelli, A.A.A. and Das, D.K. (2008).Expression of the longevity proteins byboth red and white wines and theircardioprotective components, resveratrol,tyrosol and hydroxytyrosol Journal ofAgricultural and Food Chemistry (In press).
12. Zhang, X., Jiang, L., Geng, C., Yoshimura,H. and Zhong, L. (2008). Inhibition ofacrylamide genotoxicity in human liver-derived HepG2 cells by the antioxidanthydroxytyrosol. Chemico-BiologicalInteractions, 176: 173–178.
13. Deiana, M., Incani, A., Rosa, A., Corona,G., Atzeri, A., Loru, D., Melis, M.P. andDessì, M.A. (2008). Protective effect ofhydroxytyrosol and its metabolitehomovanillic alcohol on H2O2 inducedlipid peroxidation in renal tubular epithelialcells. Food and Chemical Toxicology , 46:2984–2990.
14. Visioli, F., Bellomo, G. and Galli, C. (1998).Free radical-scavenging properties of oliveoil polyphenols. Biochemical andBiophysical Research Communications,247: 60–4.
15. Covas, M.I., de la Torre, K., Farré-Albaladejo, M., Kaikkonen, J., Fitó, M.,López-Sabater, C., Pujadas-Bastardes,M.A., Joglar, J., Weinbrenner, T., Lamuela-Raventós, R.M and de la Torre, R. (2006).Postprandial LDL phenolic content andLDL oxidation are modulated by olive oilphenolic compounds in humans. FreeRadical Biology & medicine 40:608–16.
16. Hannan, J.M.A., Marenah, L., Ali, L.,Rokeya, R., Flatt, P.R. and Abdel-Wahab,Y.H. (2006). Insulin secretory actions ofextracts of Asparagus racemosus root inperfused pancreas, isolated islets and clonalpancreatic b-cells. Journal ofEndocrinology, 192: 159–168.
17. Mokuda, O., Tanaka, H., Hayashi, T., Ooka,H. and Okazaki, R. (2004). Gliclazide at alower concentration than therapeutic doseincreases the sensitivity of insulin secretionto glucose in perfused rat pancreas.Diabetes & Metabolism, 30:193-6.
18. Allouche, N., Fki, I. and Sayadi, S. (2004).Towards a high yield recovery ofantioxidants and purified hydroxytyrosolfrom olive mill wastewaters. Journal ofAgricultural and Food Chemistry, 52: 267-273.
Current Trends in Biotechnology and PharmacyVol. 3 (4) 352 - 361, October 2009. ISSN 0973-8916

360
Anti-diabetic and antioxidant effects of Hydroxytyrosol in pancreas and slices liver incubation.
19. Buege, J.A. and Aust, S.D. (1984).Microsomal lipid peroxidation. Methods inEnzymology, 105: 302–310.
20. Aebi, H. (1984). Catalase in vitro. Methodsin Enzymology, 105:121–26.
21. Marklund, S. and Marklund, G. (1975).Involvement of the superoxide anion radicalin the autoxidation of pyrogallol andconvenient assay for superoxide dismutase.European Journal of Biochemistry, 47: 469–74.
22. Pagila, D.E. and Valentine, W.N. (1967).Studies on the quantitative and qualitativecharacterization of erythrocyte glutathioneperoxidase. The Journal of laboratory andClinical Medicine, 70: 158–169.
23. Ellman, G.C. (1952). Tissue sulfhydrylgroups. Arch Biochem Biophys., 82: 70–7.
24. Lowry, O.H., Rosebrough, N.J., Farr, A.L.and Randall, R.J. (1951). Proteinmeasurement with Folin phenol reagent.The Journal of Biological Chemistry, 193:265-275.
25. Gelain, D.P., de Bittencourt Pasquali, M.A.,Caregnato, F.F., Zanotto-Filho, A. andMoreira, J.C.F. (2008). Retinol up-regulatesthe receptor for advanced glycationendproducts (RAGE) by increasingintracellular reactive species. Toxicology inVitro, 22:1123-1127.
26. Ha, H. and Lee, H.B. (2000). Reactiveoxygen species as glucose signalingmolecules in mesangial cells cultured underhigh glucose. Kidney Int., 77:19-25.
27. Chai, W., Chen, J., Wang, H., Shen, J., Ma,L. and Ma, X. (2000). The effects ofglucose and insulin in oxidized low densitylipoprotein on apoptosis in vascular
endothelial cells. Chinese Medical Journal,113: 903-906.
28. Henquin, J.C., Debuyser, A., Drews, G. andPlant, T.D. (1992). Regulation of K+permeability and membrane potential ininsulin-secretory cells. In NutrientRegulation of Insulin Secretion Ed. PRFlatt. London: Porland 173–192.
29. Rout SP, Chowdary K. A., Kar D. M. andDas L. (2009). Plants as source of novelAnti-Diabetic Drug: Present Scenario andFuture Perspectives. Current Trends inBiotechnology and Pharmacy, 3(1): 37-55.
30. De Lucia, M., Panzella, L., Pezzella, A.,Napolitano, A. and d’Ischia, M. (2006).Oxidative chemistry of the naturalantioxidant hydroxytyrosol: hydrogenperoxide-dependent hydroxylation andhydroxyquinone/o-quinone couplingpathways. Tetrahedron, 62: 1273–1278.
31. Erkoc, F., Keskin, N. and Erkoc, S. (2003).Theoretical investigation of hydroxytyrosoland its radicals. Journal of MolecularStructure, 625: 87–94.
32. Grasso, S., Siracusa, L., Spatafora, C.,Renis, M. and Tringali, C. (2007).Hydroxytyrosol lipophilic analogues:Enzymatic synthesis, radical scavengingactivity and DNA oxidative damageprotection. Bioorganic & MedicinalChemistry, 35: 137–152.
33. González-Santiago M, Martín-Bautista E,Carrero JJ, Fonollá J, Baró L, BartoloméMV, Gil-Loyzaga P, López-Huertas E. One-month administration of hydroxytyrosol, aphenolic antioxidant present in olive oil, tohyperlipemic rabbits improves blood lipidprofile, antioxidant status and reduces
Current Trends in Biotechnology and PharmacyVol. 3 (4) 352 - 361, October 2009. ISSN 0973-8916
361
Khaled Hamden et al
atherosclerosis development. Theroscle-rosis. 188:35–42.
34. Casalino, E., Calzaretti, G., Sblano, C.,Landriscina, V., Tecce, M.F. andLandriscina, C. (2000). Antioxidant effectof hydroxytyrosol (DPE) and Mn2+ in liverof cadmium-intoxicated rats. ComparativeBiochemistry and Physiology, 133:625–632.
35. O’Dowd, Y., Driss, F., My-Chan Dang, P.,Elbim, C., Gougerot-Pocidalo, M.A.,Pasquiera, C. and El-Benna, J . (2008).Antioxidant effect of hydroxytyrosol, apolyphenol from olive oil: scavenging ofhydrogen peroxide but not superoxide anionproduced by human neutrophils.Biochemical Pharmacology, 68:2003–2008.
Current Trends in Biotechnology and PharmacyVol. 3 (4) 352 - 361, October 2009. ISSN 0973-8916
International Symposium on Emerging Trends inBiomedical and Nanobiotechnology:
Relevance to Human HealthDecember 19-21, 2009
VenueAcharya Nagarjuna University Guntur, India
Sponsored byAcharya Nagarjuna University
Organized jointly by
Centre for Biotechnology and Department ofNanotechnology
Registration fee : Rs 600 if paid before November 15th 2009, Rs. 800 afterwardsRs. 500 for accompanying persons and students For international participants US $50 dollars.
Invitation of Papers : Abstracts of the papers not more than 300 words should be submittedthrough e-mail : ISEBN2009@gmail. com (or) [email protected] - Last date to submit abstracts is15th November, 2009.
For further information :
Prof. K.R.S. Sambasiva RaoDirector, ISEBN-2009
Centre for BiotechnologyAcharya Nagarjuna University
Nagarjunanagar – 522 510, Guntur, A.P., [email protected]

362
Siderophore production by Streptomyces fulvissimus
AbstractStreptomyces fulvissimus ATCC 27431 was
studied for siderophore production. Biosynthesisof siderophore was found to be influenced byenvironmental factors. Out of various media tried,chemically defined low iron medium gavemaximum siderophore production (94 %siderophore units). A number of carbon andnitrogen compounds were tested for their effecton growth of Streptomyces fulvissimus andsiderophore production. Glycerol, sucrose andglucose were good carbon sources whileammonium chloride, sodium nitrate and ureawere good nitrogen sources. Moreover, 0.05 - 0.3M of Carbon, 0.05 - 0.1 M of Nitrogen sourcesand 20 - 30 mM of phosphate was required formaximum siderophore production (92 %siderophore units). Increase in Fe (III)concentration > 5 µM had a negative effect onsiderophore production. Optimum pH forsiderophore production was 8 while temperaturesbelow 20 ºC and above 40 ºC were not suitablefor culture growth and siderophore production.To the best of our knowledge this is the first reporton effects of environmental factors onsiderophore production by S. fulvissimus.
Key Words: Siderophore, Streptomycesfulvissimus, Carbon source, pH.
IntroductionMost of the living organisms require iron
for metabolic activities and growth. Aerobicmetabolism of microbes requires iron for varietyof functions including the electron transportchain, in deoxyribonucleotide synthesis, in thesynthesis of heme and for incorporation in theproteins involved in nitrogen fixation (1, 2). Ironis the fourth most abundant element in the earth’scrust (3). Although iron is abundant in theenvironment, it is not readily available since itexists mostly in ferric Fe (III) state. Reduced formiron Fe (II) is soluble and biologically availablethat can be easily taken into the living cell usingvarious mechanisms under aerobic conditions,ferrous is oxidized to ferric form existing asinsoluble oxyhydroxide polymers (4) and hencesuch complexes are not easily assimilated bymicroorganisms. Acquisition of iron thusbecomes a challenge. To solve this bioavailabilityproblem, microorganisms synthesize and excreteselective and strong Fe (III) binding lowmolecular weight molecules known assiderophores (3).
Streptomyces, Gram-positive soil bacteriaare well known for contributing majority ofantibiotics. Apart from this typical character, theonly commercially available siderophore,
Influence of Environmental Factors on siderophore productionby Streptomyces fulvissimus ATCC 27431
M. S. Bendale, B. L. Chaudhari and S. B. Chincholkar*School of Life Sciences, North Maharashtra University, P B 80, Jalgaon 425001, Maharashtra, India
* For correspondence - [email protected]
Current Trends in Biotechnology and PharmacyVol. 3 (4) 362 - 371, October 2009. ISSN 0973-8916

363
Bendale et al
Desferrioxamine B, called Desferal is producedby Streptomyces pilosus which is used to treatiron overload in humans (5). Streptomyces pilosusproduces a group of desferrioxamines (A1, A2,B, D1, D2, E, F, G, H) wherein B and E arepredominantly present (6), S. coelicolor A 3(2)is known to produce coelichelin (7), coelibactin,DFO G1 and DFO E (8). S. antibioticus producesdesferrithiocin (9) and S. griseoflavus producesferrimycins (6). Shimi and Dewedar (10) reportedproduction of gluconimycin by Streptomyces AS 9. Enterobactin is produced by S. tendae Tu901/8c (11) and oxachelin by Streptomycessp.GW9/1258 (12).
Streptomyces fulvissimus is known forproduction of an antibiotic, valinomycin (13), butsiderophore production by Streptomycesfulvissimus has not been studied earlier. Attributeslike production of spores, antibiotic andsiderophore may be helpful in exploitation of thisorganism in plant nutrition and biocontrol of plantdiseases. But as the biosynthesis and secretionof siderophores is strictly regulated byenvironmental factors (14), the aim of this studywas to find out the suitable parameters formaximum siderophore production.
Materials and MethodsMicroorganism and growth conditions
Streptomyces fulvissimus was used for thisstudy which was maintained by frequent transferon medium composed of (gl-1): Yeast extract 4,malt extract 4, and glucose 10, agar 20, and pH 7+ 0.2. For siderophore production, ChemicallyDefined Low Iron Medium (CDLIM) consistingof (gl-1): K
2SO
4 2, K
2HPO
4 3
, NaCl 1, and NH
4Cl
5 was used. To this solution, 2 mg thiamine andthe following elements were added (mgl-1):CaCl
2.2H
2O 100, MgSO
4.7H
2O 80, ZnSO
4.7H
2O
2, and MnSO4 0.0035, CuSO
4 0.005 and 2.5 %
glycerol as an energy source (15). The culturewas inoculated in CDLIM and incubated at 28ºC for 120 h with shaking at 220 rpm.
Factors affecting siderophore productiongrowth medium
Various media were used to study thesiderophore secretion CDLIM Glycerol AsperginMedium [(gl-1): Glycerol 10 , K
2HPO
41, L-
Aspragine 1, trace salt solution 1, pH 7.4(Pridham and Gotttlieb trace salt solution (gl-1):CuSO
4.5H
2O 0.64, FeSO
4.7H
2O 0.1, MnCl
2 0.79,
and ZnSO4 0.15)], Synthetic Medium [(gl-1):
K2HPO
4 1, MgSO
4.7H2O 0.5, KCl 0.5, NaNO
3
2, Glycerol 30, pH 7.2], Casein Starch Medium[(gl-1): Casein 0.3, Starch 10, NaCl 2, KNO
3 2,
K2HPO
4 2, MgSO
4 0.09, CaCO
3 0.02 , pH 7].
Siderophore production was checked aftercompletion of 120 h of incubation at 28 °C, on arotary shaker (Remi, Mumbai) at 220 rpm. Unlessand otherwise specified in the text through outthe experimentation cultivation conditions wereincubation period of 120 h at 28 °C temperatureand 220 rpm shaking speed.
Carbon sourceThe effect of different carbon sources such
as glucose, sucrose, glycerol, arabinose, maltose,sodium acetate, lactose was studied onsiderophore production by Streptomycesfulvissimus. All carbon sources were added atconcentration 2.5 % w/v. Also experiments werecarried out by varying the concentrations ofsucrose, glucose and glycerol in the range of 0.05– 0.4 M.
Nitrogen sourceEffect of urea, sodium nitrate, ammonium
chloride was studied at concentration 0.5 % w/vand varied in the concentration range of 0.04 –0.5 M. CDLIM was fortified with differentnitrogen sources.
PhosphateIn CDLIM, K
2HPO
4 is the source of
phosphate. Different concentrations of K2HPO
4
in the range of 0.005 – 0.05 M were used to studythe effect of phosphate on siderophoreproduction.
Current Trends in Biotechnology and PharmacyVol. 3 (4) 362 - 371, October 2009. ISSN 0973-8916
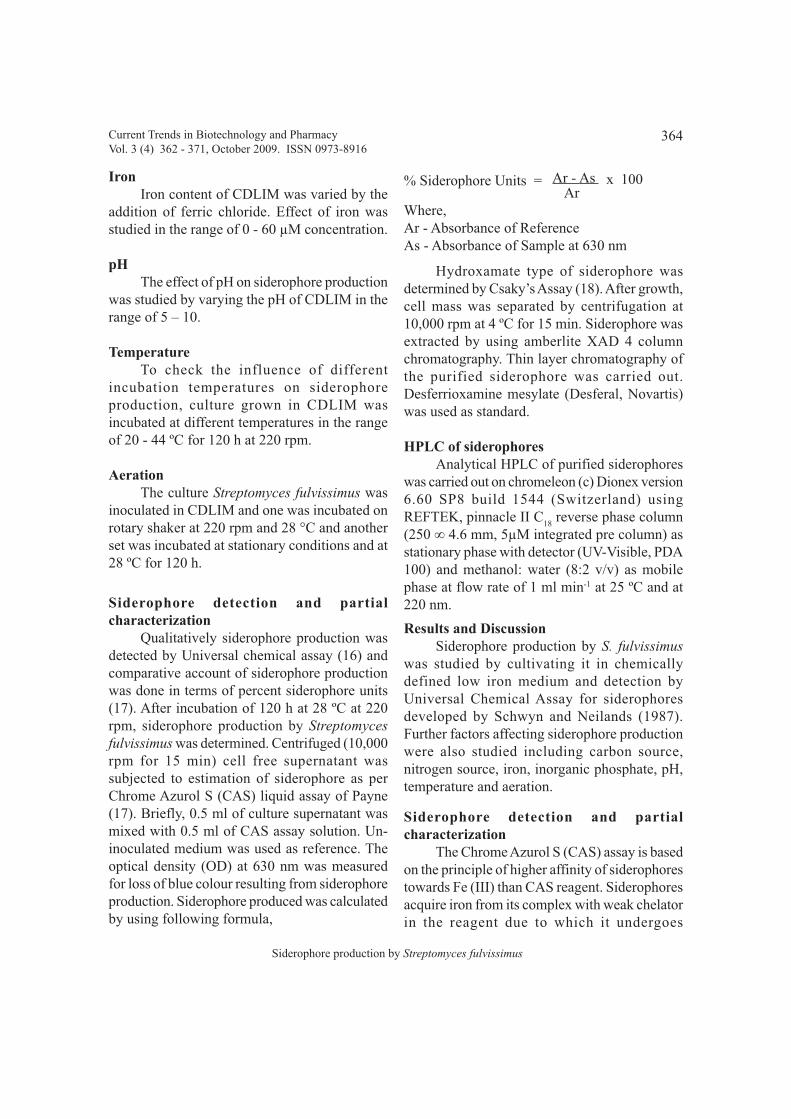
364
Siderophore production by Streptomyces fulvissimus
IronIron content of CDLIM was varied by the
addition of ferric chloride. Effect of iron wasstudied in the range of 0 - 60 µM concentration.
pHThe effect of pH on siderophore production
was studied by varying the pH of CDLIM in therange of 5 – 10.
TemperatureTo check the influence of different
incubation temperatures on siderophoreproduction, culture grown in CDLIM wasincubated at different temperatures in the rangeof 20 - 44 ºC for 120 h at 220 rpm.
AerationThe culture Streptomyces fulvissimus was
inoculated in CDLIM and one was incubated onrotary shaker at 220 rpm and 28 °C and anotherset was incubated at stationary conditions and at28 ºC for 120 h.
Siderophore detection and partialcharacterization
Qualitatively siderophore production wasdetected by Universal chemical assay (16) andcomparative account of siderophore productionwas done in terms of percent siderophore units(17). After incubation of 120 h at 28 ºC at 220rpm, siderophore production by Streptomycesfulvissimus was determined. Centrifuged (10,000rpm for 15 min) cell free supernatant wassubjected to estimation of siderophore as perChrome Azurol S (CAS) liquid assay of Payne(17). Briefly, 0.5 ml of culture supernatant wasmixed with 0.5 ml of CAS assay solution. Un-inoculated medium was used as reference. Theoptical density (OD) at 630 nm was measuredfor loss of blue colour resulting from siderophoreproduction. Siderophore produced was calculatedby using following formula,
% Siderophore Units = Ar - As x 100 ArWhere,Ar - Absorbance of ReferenceAs - Absorbance of Sample at 630 nm
Hydroxamate type of siderophore wasdetermined by Csaky’s Assay (18). After growth,cell mass was separated by centrifugation at10,000 rpm at 4 ºC for 15 min. Siderophore wasextracted by using amberlite XAD 4 columnchromatography. Thin layer chromatography ofthe purified siderophore was carried out.Desferrioxamine mesylate (Desferal, Novartis)was used as standard.
HPLC of siderophoresAnalytical HPLC of purified siderophores
was carried out on chromeleon (c) Dionex version6.60 SP8 build 1544 (Switzerland) usingREFTEK, pinnacle II C
18 reverse phase column
(250 ∞ 4.6 mm, 5µM integrated pre column) asstationary phase with detector (UV-Visible, PDA100) and methanol: water (8:2 v/v) as mobilephase at flow rate of 1 ml min-1 at 25 ºC and at220 nm.
Results and DiscussionSiderophore production by S. fulvissimus
was studied by cultivating it in chemicallydefined low iron medium and detection byUniversal Chemical Assay for siderophoresdeveloped by Schwyn and Neilands (1987).Further factors affecting siderophore productionwere also studied including carbon source,nitrogen source, iron, inorganic phosphate, pH,temperature and aeration.
Siderophore detection and partialcharacterization
The Chrome Azurol S (CAS) assay is basedon the principle of higher affinity of siderophorestowards Fe (III) than CAS reagent. Siderophoresacquire iron from its complex with weak chelatorin the reagent due to which it undergoes
Current Trends in Biotechnology and PharmacyVol. 3 (4) 362 - 371, October 2009. ISSN 0973-8916

365
Bendale et al
decolorization. For this, the pH of the culturesupernatant was adjusted to neutrality and equalamount of CAS reagent was added to it. Colourchange from blue to orange was observed atλmax 630 nm which indicated siderophoreproduction. The type of siderophore was detectedby Csaky’s test where formation of red colorationindicated the presence of hydroxamate group inthe siderophore.
Cell free supernatant was concentratedunder rotary vacuum evaporator (Buchi,Switzerland) and subsequently subjected toamberlite XAD 4 column chromatography. CAStest positive fractions were pooled together driedand weighed. About 90 – 100 mg.l-1 of purifiedsiderophore powder was obtainable and subjectedto HPLC. Thin layer chromatography of thepurified siderophore showed R
f value 0.65 in
butanol: acetic acid: water (9:1:1) which matchedwith desferrioxamine mesylate (Desferal,Novartis).
HPLC analysis of purified siderophoresThe HPLC of desferrioxamine showed the
peak at 6.60 min while the partially purifiedsample showed three peaks among which onepeak had similar retention time to standarddesferrioxamine (Fig. 1a, 1b), which clearlysuggested the presence of desferrioxamine in thesample.
Influence of media on siderophore productionThe influence of medium on siderophore
production was studied in four different mediasuch as CDLIM, GASPM, SM, and CSM.Optimum production of siderophores relies onperformance of producer organism, the choiceof medium, available iron content of the mediumused and the iron requirement level of theorganism (19). As depicted in Fig. 2, CDLIM wasfound to be the best medium among all otherscompared since it gave maximum yield ofsiderophores (94 % siderophore units); where as
Glycerol - L - Asparagine medium gave 89.14 %siderophore units. In case of casein starchmedium, siderophore production was lower with83 % siderophore units, followed by syntheticmedium for actinomycetes. Hence for furtherexperiments CDLIM was used.
Influence of different carbon sources onsiderophore production
Streptomyces species is reported for theutilization of simple sugars (20, 21), alcohol andsome organic acids (22). Pridham and Gottlieb(23) characterized actinomycetes according to theutilization of different carbon sources. Inantibiotic novobiocin production, the producerorganism S. niveus favored citrate over glucose(24) while S. kanamyceticus M 27 can utilizedextrose excellently for kanamycin production(25). Hence, Streptomyces fulvissimus was grownin CDLIM fortified with different carbon sourcesfor 120 h at 28 ºC at 220 rpm. Sucrose followedby glucose and glycerol were proved to be thebest carbon sources (Fig. 3) achieving maximumsiderophore production i.e. 93.08, 92.05, 91.61% siderophore units, respectively within 0.07 –0.2 M range of carbon source concentration.While sodium acetate and lactose, did not supportsiderophore production.
Glucose, sucrose and glycerol gave highersiderophore production. Concentration of thesethree carbon sources was varied in a range of 0.05– 0.4 M. Glucose did not support siderophoreproduction above 0.2 M concentration (Fig. 4)with about 91 % siderophore units in range of0.05 – 0.1 M concentration. In case of Sucrose(Fig. 4), the siderophore production was highest(93.25 % siderophore units) at 0.05 Mconcentration and thereafter it declined gradually.When glycerol (Fig. 4) was used as carbon sourceover a range of 0.05 to 0.4 M concentration, thesiderophore production remained constant inbetween concentration range 0.1 – 0.3 M i.e. 91
Current Trends in Biotechnology and PharmacyVol. 3 (4) 362 - 371, October 2009. ISSN 0973-8916
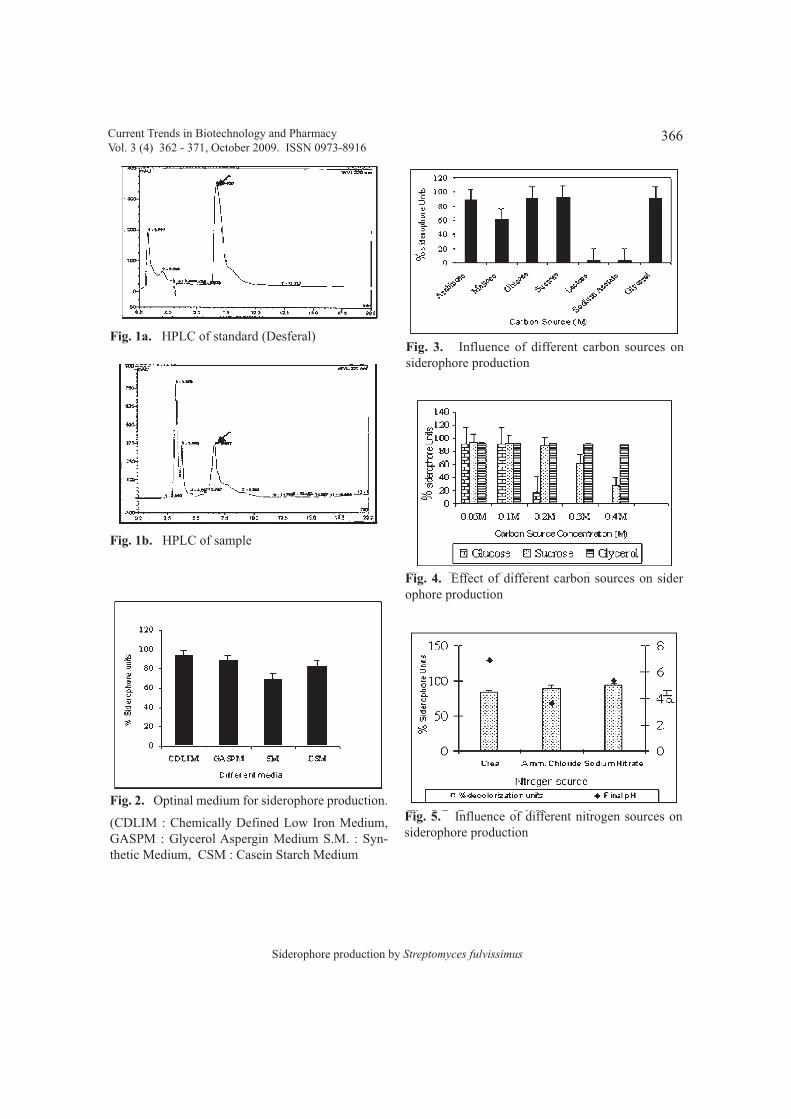
366
Siderophore production by Streptomyces fulvissimus
Current Trends in Biotechnology and PharmacyVol. 3 (4) 362 - 371, October 2009. ISSN 0973-8916
Fig. 1a. HPLC of standard (Desferal)
Fig. 1b. HPLC of sample
Fig. 2. Optinal medium for siderophore production.
(CDLIM : Chemically Defined Low Iron Medium,GASPM : Glycerol Aspergin Medium S.M. : Syn-thetic Medium, CSM : Casein Starch Medium
Fig. 3. Influence of different carbon sources onsiderophore production
Fig. 4. Effect of different carbon sources on siderophore production
Fig. 5. Influence of different nitrogen sources onsiderophore production

367
Bendale et al
Influence of inorganic phosphate onsiderophore production
Phosphate concentration is one of theimportant factors that affect siderophoreproduction (26). Effect of phosphateconcentration in the range of 0.005 – 0.05 M onsiderophore secretion by Streptomycesfulvissimus was studied. As depicted in Fig. 7,the range of 0.02 – 0.03 M phosphateconcentration was found to be optimum forsiderophore production, since within this rangemaximum (92 % siderophore units) siderophoreproduction was recorded which declined at higherconcentrations. Very high or low phosphateconcentration did not support siderophoreproduction. It needs to have specificconcentration of phosphates which is inagreement with results obtained by Barbhaiyaand Rao (22).
Influence of iron concentration on siderophoreproduction
Among environmental factors, ironconcentration is the most important that mainlyregulates the biosynthesis and secretion ofsiderophore (29, 30). Taking into account thisfactor, the influence of extraneously added Fe(III) in increasing order to the CDLIM on thesiderophore production was observed. Althoughcell growth reached maximum at value above 5µM of added Fe (III), (Fig. 8) siderophoreproduction was lowered at this concentration. Inthe absence of exogenous iron / less than 1 µMStreptomyces fulvissimus produced maximumsiderophores while in iron containing media,siderophore production was decreasedproportionally with the increase in ironconcentration. Concentration > 5 µM of ironcould not induce siderophore production. Thusindicating that 5 µM of iron showed the ironsufficiency which lead to negligible amount ofsiderophore production. Iron more than 5 µMenhanced the growth of S. fulvissimus but
%. The results indicated that glycerol can achievethe maximum siderophore production over a widerange of concentrations.
Influence of different nitrogen sources onsiderophore production
The production of secondary metabolites isinfluenced by the availability of nutrients. Theavailability of nitrogen and its source can affectthe production of secondary metabolites (26, 27).In this study, the regulation of siderophoreproduction by nitrogen using different nitrogensources and synthetic culture medium wasinvestigated. Wherein urea, ammonium chloride,sodium nitrate were used. Each nitrogen sourcewas studied at the concentration of 0.5 % w/v(Fig. 5). When sodium nitrate was used asnitrogen source, highest siderophore productioni.e. 93.12 % siderophore units was obtained. Ureaas nitrogen source was observed to give 83.3 %siderophore units and ammonium chloride gave90.05 % siderophore units. Urea at concentrationat 0.05 M showed 92 % siderophore units (Fig.6) on 120 h of incubation at 28 ºC. Siderophoreproduction gradually decreased to 23 %siderophore units as concentration was increasedto 0.4 M. Ammonium chloride gave maximum% siderophore units (91 %) at concentration rangeof 0.05 - 0.1 M (Fig. 6) which gradually decreasedto 70 % siderophore units at 0.5 M concentration.Ammonium salts are the principal nitrogensources which have been reported to interferewith antibiotic production. Gonzalez et al.,reported an increase in the growth and specificproduction of gentamicin, proportional to theamount of ammonium present in the culturemedium for ammonium concentration rangingfrom 20 - 150 mM (28). In case of sodium nitrate,siderophore production was 93.19 % siderophoreunits at 0.05 M concentration and declined withthe increase in concentration. At 0.5 Mconcentration it was 30 % siderophore units(Fig. 6).
Current Trends in Biotechnology and PharmacyVol. 3 (4) 362 - 371, October 2009. ISSN 0973-8916

368
Siderophore production by Streptomyces fulvissimus
Current Trends in Biotechnology and PharmacyVol. 3 (4) 362 - 371, October 2009. ISSN 0973-8916
Fig. 6. Influence of different nitrogen sources onSiderophore Production
Fig. 7. Influence of inorganic phosphate (Pi) onsiderophore production
Fig. 8. Influence of Iron on siderophore production
Fig. 9. Influence of pH on siderophore production
Fig. 10. Influence of temperature on siderophoreproduction
responsible for repression of siderophoreproduction. Similar results have been reportedby Yang et al. (31), for siderophore productionby P. pseudomallei U7.
Influence of pH on siderophore productionThe pH plays vital role in the solubility of
iron in production medium and therebysiderophore production. Iron is insoluble atneutral to alkaline pH but solubility increases atacidic pH values (32). So at the acidic conditionsiron is available to microorganisms which in turnreduce the siderophore production.

369
Bendale et al
For Streptomyces fulvissimus, pH 8 wasfound to be optimum for siderophore secretion(Fig. 9). At pH 8, highest siderophore production(93 % siderophore units) was seen, while verysharp decrease at pH 10. At alkaline pH, solubilityof iron is highly affected therefore theoreticallysiderophore yield should increase as the availableiron is less. But poor growth of Streptomycesfulvissimus would be the main reason for sharpdecrease in siderophore production at highalkaline pH (above 9). Very poor growth and thehigher alkaline conditions did not supportsiderophore production. In contrast, at acidic pH,iron is in soluble form, can repress thesiderophore production and so the yield wasnegligible.
Influence of temperature on siderophoreproduction
To check the influence of temperature onsiderophore production, S. fulvissimus was grownat various temperatures (Fig. 10). At 28 ºC,maximum siderophore production was observedi.e. 93.47 % siderophore units which was littlebit lowered at 37 ºC but no siderophoreproduction was induced at 20 ºC and at 44 ºCwhen grown in CDLIM.
This may be because at these temperatures,S. fulvissimus was not able to grow. Similarresults have been reported earlier. Worsham andKonisky (33) have reported decreasedsiderophore production by S. typhimurium atelevated temperatures, Garibaldi (34), andKochan (35), have also reported that in E. coliand S. typhimurium, enterochehin biosynthesiswas inhibited at temperatures greater than 40 ºC.The temperature range of 28 ºC to 37 ºC wassuitable for optimum siderophore production byS. fulvissimus.
Influence of aeration on siderophoreproduction
When incubation was carried out atstationary conditions, siderophore production
(Fig. 11) either did not take place or was toonegligible. Incubation with aeration at 220 rpmhad achieved high production i.e. 90 %siderophore units. Pseudomonas stutzeri, strainCCUG 36651, a facultative anaerobe was shownto produce siderophore when grown underaerobic conditions. In contrast no siderophoreswere observed from anaerobically grown P.stutzeri (36).
ConclusionStreptomyces fulvissimus was found to
produce siderophores under iron depletedconditions. Environmental factors such astemperature, pH, iron concentration, growthmedium, carbon, nitrogen and phosphateinfluence siderophore biosynthesis. Assiderophores have wide application in biocontrolof plant diseases and plant nutrition, theseattributes are very important.
AcknowledgementAuthors are thankful to UGC for financial
help through SAP- DRS project.
References1. Litwin, C.M. and Calderwood, S.B. (1993).
Role of iron in the regulation of virulencegenes. Clin. Microbiol. Rev, 6: 137 - 149.
2. Andrews, S.C. (1998). Iron Storage inbacteria. Advances in MicrobialPhysiology, 40: 281 - 351.
3. Challis, G.L. (2005). A widely distributedbacterial pathway for siderophorebiosynthesis independent of nonribosomalpeptide synthetases. ChemBioChem, 6: 601- 611.
4. Neilands, J.B. (1995). Siderophores:Structure and function of microbial irontransport compounds. J. Biol. Chem, 270:26723 - 26726.
Current Trends in Biotechnology and PharmacyVol. 3 (4) 362 - 371, October 2009. ISSN 0973-8916
370
Siderophore production by Streptomyces fulvissimus
5. Aouad, F.A., Zhang, Y., Collins, F., Henry,C., Ward, R.J. and Crichton, R.R. (2002).Evaluation of new iron chelators and theretherapeutic potential. Inorg. Chimi. Acta,339: 470 - 480.
6. Winkelman, G. and Drechsel, H. (1997).Microbial siderophores. In Rehm, H.-J. &Reed, G. eds. Biotechnology, 2nd Ed., VCHpublishers, Weinheim, Germany, Vol. 7 : pp.200 - 246.
7. Challis, G.L. and Ravel, J. (2000).Coelichelin, a new peptide siderophoreencoded by the Streptomyces coelicolorgenome: structure prediction from thesequence of its non-ribosomal peptidesynthetase. FEMS Microbiol. Lett, 187: 111- 114.
8. Bentley, S.D., Chater, K.F., Cerdeño-Tárraga, A.-M., Challis, G.L., Thomson,N.R, James, K.D., Harris, D. E., Quail, M.A., Kieser, H., Harper, D., Bateman, A. A.,Brown, S., Chandra, G., Chen, C.W.,Collins, M., Cronin, A., Fraser A., Goble,A., Hidalgo, J., Hornsby, T., Howarth, S.,Huang, C.-H., Kieser, T., Larke, L., Murphy,L., Oliver, K., O’Neil, S., Rabbinowitsch,E., Rajandream, M.-A., Rutherford, K.,Rutter, S., Seeger, K., Saunders, D., Sharp,S., Squares, R., Squares, S., Taylor, K.,Warren, T., Wietzorrek, A., Woodward, J.,Barrell, B. G., Parkhill, A. J. & Hopwood,D. A. (2002). Complete genome sequenceof the model actinomycetes StreptomycescoelicolorA3 (2). Nature, 417: 141 - 147.
9. Rao, L., Choppin, G.R. and Bergeron, R.J.(2000). Complexation of thorium (IV) withdesmethyldesferrithiocin. Radiochim. Acta,88: 851 - 856.
10. Shimi, I.R. and Dewedar, A. (1966).
Gluconimycin, a new antibiotic. Arch.Microbiol. 54:246 - 252.
11. Fiedler, H.-P., Krastel, P., Muller, J.,Gebhardt, K. and Zeeck, A. (2001).Enterobactin: the characteristic catecholatesiderophore of Enterobacteriaceae isproduced by Streptomyces species. FEMSMicrobiol. Lett, 196: 147 - 151.
12. Sontag, B., Gerlitz, M., Paululat, T., Rasser,H., Grün-Wollny, I., and Hansske, F. G.(2006). Oxachelin, a novel iron chelator andantifungal agent from Streptomyces sp.GW9/1258. J. Antibiot, 59(10): 659 - 663.
13. Ristow, H., Salnikow, J. and Kleinkauf, H.(1974). Biosynthesis of valinomycin. FEBSLett, 42:127 - 130.
14. Duffy, B.K. and De´Fago, G. (1999).Environmental factors modulatingantibiotic and siderophore biosynthesis byPseudomonas fluorescens biocontrolstrains. Appl. Environ. Microbiol, 65: 2429- 2438.
15. Muller, G. and Raymond, K.N. (1984).Specificity and Mechanism ofFerrioxamine-Mediated iron Transport inStreptomyces pilosus. J. Bacteriol, 160(1):304 - 312.
16. Schwyn, B. and Neilands, J.B. (1986).Universal Chemical Assay for the detectionand determination of siderophores. Anal.Biochem, 140: 47 - 56.
17. Payne, S.M. (1994). Detection, isolationand characterization of Siderophores. In:Methods Enzymol, 235: 329 - 344.
18. Csaky, T.Z. (1948) On the estimation ofbound hydroxylamine in biologicalmaterials. Acta. Chem. Scand, 2: 450 - 454.
19. Neilands, J.B. (1984). Methodology ofsiderophores. In: Siderophores frommicroorganisms and plants, Struct.Bonding, 58: pp.1 - 24.
Current Trends in Biotechnology and PharmacyVol. 3 (4) 362 - 371, October 2009. ISSN 0973-8916
371
Bendale et al
20. Banchio, C. and Gramajo, H.C. (1997).Medium- and long-chain fatty acid uptakeand utilization by Streptomyces coelicolorA3 (2): first characterization of a Gram-positive bacterial system. Microbiology,143: 2439 - 2447.
21. Locci, R. (1989). Streptomycetes andrelated genera, In: Williams, S., T. (Eds)Bergey’s Manual of Systemic Bacteriology,Williams and wilkins, Baltimore, USAvol.4: pp. 2451 - 91.
22. Sahin, N. (2004). Isolation andcharacterization of mesophilic, oxalate-degrading Streptomyces from plantrhizosphere and forest soils.Naturewissenschaften, 92: 498 - 502.
23. Pridham, T.G. and Gottlieb, D. (1948). Theutilization of carbon compounds by someactinomyceteles as an aid for speciesdetermination. J. Bacteriol, 56: 107 - 114.
24. Demain, A.L. and Martin, J.F. (1980).Control of antibiotic biosynthesis.Microbiol. Rev, 44:230 - 251.
25. Pandey, A., Shukla, A. and Majumdar, S.K.(2005). Utilization of carbon and nitrogensources by Streptomyces kanamyceticus M27 for the production of an Anti bacterialantibiotic. Afr. J. Biotechnol, 4: 909 - 910.
26. Barbhaiya, H.B and Rao, K.K. (1985)Production of pyoverdine, the fluorescentpigment of pseudomonas aeruginosa PA01.FEMS Microbiol Lett, 27: 233-235.
27. Aharonowitz, Y. (1980). Nitrogenmetabolite regulation of antibioticbiosynthesis. Annu. Rev. Microbiol, 34: 209- 33.
28. Gonzalez1, R., Islas, L., Obregon, A.M.,Escalante, L. and Sergio Sanchez, S. (1995).Gentamicin formation in Micromonospora
purpurea: stimulatory effect of ammonium.J. Antibiot, 48: 479 - 483.
29. Díaz de Villegas M.E., Villa, P. and Frías,A. (2002). Evaluation of the siderophoresproduction by Pseudomonas aeruginosaPSS. Rev. Latinoam. Microbiol, 44(3-4):112 - 117.
30. Manninen, O., Mattila-Sandholm, T.(1994). Methods for the detection ofPseudomonas siderophores. J. Microbiol.Methods, 19: 223 - 234.
31. Yang, H., Chaowagul, W. and Sokol, P.A.(1991). Siderophore production byPseudomonas pseudomallei. Infect.Immun, 59:776 - 780.
32. Winkelmann, G. (2007). Ecology ofsiderophores with special reference to thefungi. Biometals, 20: 379 - 392.
33. Worsham, P.L. and Konisky, J. (1984).Effect of growth temperature on theacquisition of iron by Salmonellatyphimurium and Escherichia coli. J.Bacteriol, 158:163 - 168.
34. Garibaldi, J.A. (1972). Influence oftemperature on the biosynthesis of Irontransport compounds by Salmonellatyphimurium. J. Bacteriol, 110:262 - 265.
35. Kochan, I. (1977). Role of iron in theregulation of nutritional immunity, In:Raymond, K.N. (Eds.), Bioinorganicchemistry - II. Adv. Chem. Ser. No. 162.American Chemical Society, Washington,D.C. p. 55 - 77.
36. Essen, S.A., Johnsson, A., Bylund, D.,Pederson, K. and Lundstrom, U. S. (2007).Siderophore production by Pesudomonasstutzeri under aerobic and anaerobicconditions. Appl. Environ. Microbiol, 73:5857 - 5864.
Current Trends in Biotechnology and PharmacyVol. 3 (4) 362 - 371, October 2009. ISSN 0973-8916
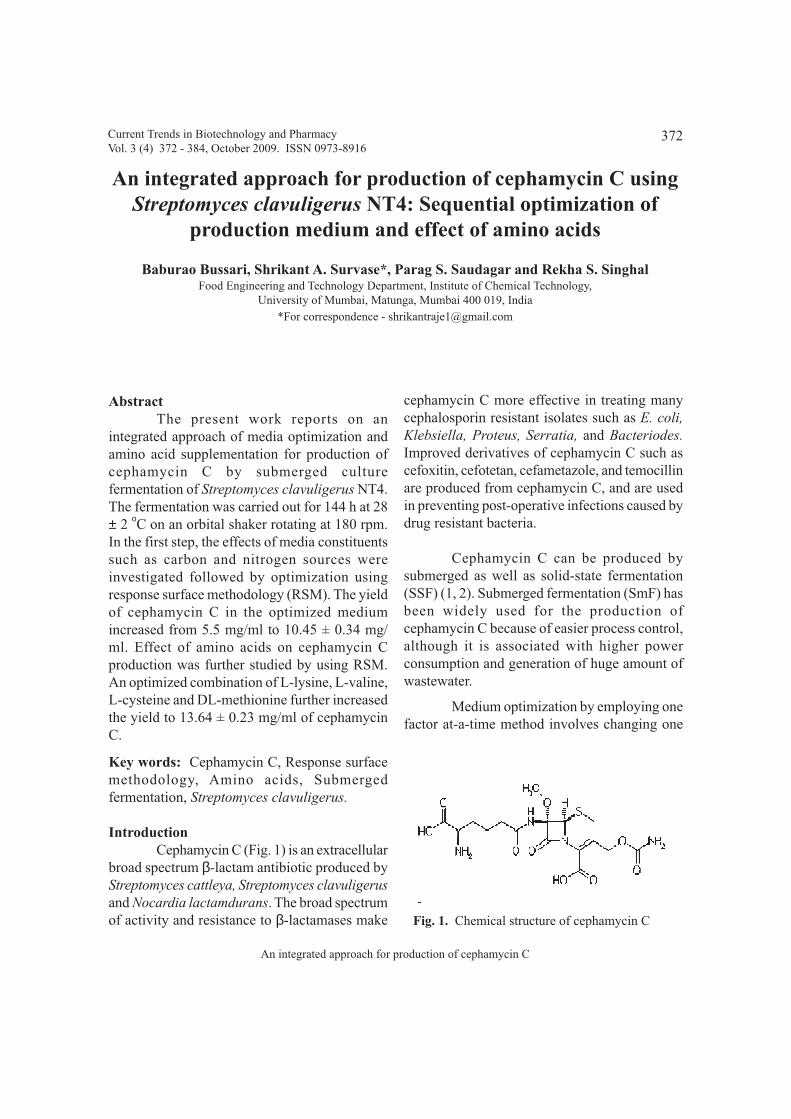
372
An integrated approach for production of cephamycin C
AbstractThe present work reports on an
integrated approach of media optimization andamino acid supplementation for production ofcephamycin C by submerged culturefermentation of Streptomyces clavuligerus NT4.The fermentation was carried out for 144 h at 28± 2 οC on an orbital shaker rotating at 180 rpm.In the first step, the effects of media constituentssuch as carbon and nitrogen sources wereinvestigated followed by optimization usingresponse surface methodology (RSM). The yieldof cephamycin C in the optimized mediumincreased from 5.5 mg/ml to 10.45 ± 0.34 mg/ml. Effect of amino acids on cephamycin Cproduction was further studied by using RSM.An optimized combination of L-lysine, L-valine,L-cysteine and DL-methionine further increasedthe yield to 13.64 ± 0.23 mg/ml of cephamycinC.
Key words: Cephamycin C, Response surfacemethodology, Amino acids, Submergedfermentation, Streptomyces clavuligerus.
IntroductionCephamycin C (Fig. 1) is an extracellular
broad spectrum β-lactam antibiotic produced byStreptomyces cattleya, Streptomyces clavuligerusand Nocardia lactamdurans. The broad spectrumof activity and resistance to β-lactamases make
cephamycin C more effective in treating manycephalosporin resistant isolates such as E. coli,Klebsiella, Proteus, Serratia, and Bacteriodes.Improved derivatives of cephamycin C such ascefoxitin, cefotetan, cefametazole, and temocillinare produced from cephamycin C, and are usedin preventing post-operative infections caused bydrug resistant bacteria.
Cephamycin C can be produced bysubmerged as well as solid-state fermentation(SSF) (1, 2). Submerged fermentation (SmF) hasbeen widely used for the production ofcephamycin C because of easier process control,although it is associated with higher powerconsumption and generation of huge amount ofwastewater.
Medium optimization by employing onefactor at-a-time method involves changing one
An integrated approach for production of cephamycin C usingStreptomyces clavuligerus NT4: Sequential optimization of
production medium and effect of amino acids
Baburao Bussari, Shrikant A. Survase*, Parag S. Saudagar and Rekha S. SinghalFood Engineering and Technology Department, Institute of Chemical Technology,
University of Mumbai, Matunga, Mumbai 400 019, India*For correspondence - [email protected]
Fig. 1. Chemical structure of cephamycin C
Current Trends in Biotechnology and PharmacyVol. 3 (4) 372 - 384, October 2009. ISSN 0973-8916

373
Baburao Bussari et al
independent variable (nutrient, pH, temperatureetc.) while fixing all the others at a certain level.This single dimensional approach is laborious andtime consuming, especially for large number ofvariables, and frequently does not guarantee thedetermination of optimal conditions. Analternative to this method is provided by theRSM, which can be employed to study therelationship between the medium componentsand their effects on microbial growth andproduction. In RSM, several factors aresimultaneously varied. The application of thesedesign techniques in fermentation process resultsin improved product yields, reduced processvariability, closer confirmation of the outputresponse (product yield or productivity) tonominal and target requirements and reduceddevelopment, and overall costs (3).
To the best of our knowledge, there isscarcity of literature on nutritional andenvironmental conditions for submerged cultureS. clavuligerus for cephamycin C production.Previous work in our laboratory on a mutantstrain of S. clavuligerus (Streptomycesclavuligerus MTCC 1142 was exposed to 1 mg/ml nitroso-guanidine, a chemical mutagen for 60min) showed it to totally inhibit production ofclavulanic acid, but produce unprecedentedamounts of cephamycin C. This mutant is referredto as S. clavuligerus NT4. In the present study, apreliminary optimization of carbon and nitrogensources for maximum production of cephamycinC using S. clavuligerus NT4 was followed byoptimization using RSM, wherein theconcentrations of selected media componentswere optimized. The amino acids were alsooptimized for maximum production ofcephamycin C by using RSM.
Materials and MethodsGlucose, yeast extract, agar, malt extract,
soybean meal, mycological peptone, ammonium
sulphate, ammonium chloride, p-dimethylaminobenzaldehyde, urea, sodium carbonate,NaOH and corn steep liquor were procured fromHimedia Ltd, Mumbai. Magnesium sulphate,potassium di-hydrogen phosphate, sodiumchloride, zinc chloride, manganese chloride andsolvents like acetonitrile, methanol, ethyl acetate,butyl acetate, acetone, ethanol, concentrated HCland concentrated H
2SO
4 were purchased from
Merck India Ltd. Mumbai. All solvents used wereof AR grade, except acetonitrile which was ofHPLC grade. Standard cephamycin C (authenticsample) was obtained as a gift sample throughthe kind courtesy of Merck ResearchLaboratories, USA.
Microorganism
The strain Streptomyces clavuligerusMTCC 1142 was procured from Microbial TypeCulture Collection (MTCC), Institute ofMicrobial Technology, Chandigarh, India. AnNTG mutant of the strain that gave enhancedproduction of cephamycin C was used in thestudy. This mutant strain was named as S.clavuligerus NT4 and maintained on a mediumcontaining (in g/l) yeast extract 4, malt extract 1,dextrose 4, and agar 20 at pH 7.2-7.4; the slantswere subcultured every 15 days.
Fermentation
In the present study, medium developedby Saudagar and Singhal (4) was used foroptimization of cephamycin C production by S.clavuligerus NT4. The production mediumcontained (in g/l) glycerol 15.0, sucrose 20.0,arginine 17.4, CaCl
2 0.4, K
2HPO
4 2.0, MnCl
2
0.05, ZnCl2
0.05, NaCl 5.0, MgSO41.0, L-
glutamic acid 16.3 with pH 6.5 After autoclavingat 121οC for 15 min, the media was inoculatedwith 3 ml of spore suspension (2 x 10⁶ spores/ml) and incubated in an orbital incubator shakerat room temperature (28 ± 2°C) for 6 days. Allexperiments were carried out in triplicate.
Current Trends in Biotechnology and PharmacyVol. 3 (4) 373 - 385, October 2009. ISSN 0973-8916

374
An integrated approach for production of cephamycin C
Optimization of fermentation medium usingone factor-at-a-time method
Sucrose in the basal media wassubstituted with other carbon sources such asglucose, maltose, fructose, galactose, soybean oil,palm oil and sesame oil at 20 g/l, and L-glutamicacid with yeast extract, biopeptone, beef extract,malt extract, ammonium acetate, urea, NH
4Cl,
NH4SO
4, NaNO
3 and KNO
3 to check their
suitability for cephamycin C production. Here,organic nitrogen sources were screened at 16.3g/l and inorganic nitrogen sources were used at0.111 M.
Optimization of media by RSMOptimization of concentrations of the selectedmedium components by RSM
A CCRD for four independent variableswas used to obtain the combination of values thatoptimizes the response within the region of threedimensional observation spaces, which allowsone to design a minimal number of experiments.The experiments were designed using thesoftware, Design Expert Version 6.0.10 trialversion (State ease, Minneapolis, MN).Regression analysis was performed on the dataobtained from the design experiments.
Coding of the variables was done according tothe following equation
xi = (Xi - Xcp) /∆Xi i =1, 2, 3, . . . , k (1)
Where: xi, dimensionless value of an independent
variable; Xi, real value of an independentvariable; Xcp, real value of an independentvariable at the center point; and _Xi, step changeof real value of the variable i corresponding to avariation of a unit for the dimensionless value ofthe variable i.
Four independent variables selected forevaluating the combined effect on cephamycinC production were glycerol, fructose, K
2HPO
4
and yeast extract. The media optimized by one
factor at-a-time method was used where sucroseand L-glutamic acid were substituted withfructose and yeast extract, respectively.
A central composite factorial design of16 plus 5 center points leading to 21 experimentswere performed. Each factor was varied at fivelevels. The coded and actual values ofindependent variables are given in (Table. 1). Theexperiments were carried out in triplicate.Replicates at the centre of the domain in threeblocks permit the checking of the absence of biasbetween several sets of experiments. Therelationship of the independent variables and theresponse was calculated by the second orderpolynomial equation:
k kY=β
0 +∑β
i X
i +∑β
ii X
i X
j +∑
i ∑j βij
Xi X
j (2)
i =1 i =1 i < j
Where: Y is the predicted response; β0 a constant;
βi the linear coefficient; β
ii the squared
coefficient; and βij the cross-product coefficient,
k is number of factors.
The second order polynomialcoefficients were calculated using the softwarepackage Design Expert Version 6.0.10 to estimatethe responses of the dependent variable. Responsesurface plots were also obtained using DesignExpert Version 6.0.10.
The effect of metabolic precursors oncephamycin C production by RSM
Based on the biosynthetic pathway ofcephamycin C in S. clavuligerus (5), and ourearlier work on the effect of four individual aminoacids (L-lysine hydrochloride, L-valine, L-cysteine and DL-methionine) on cephamycinbiosynthesis by Nocardia lactamdurans NRRL3802 (6), the combined effect of four differentamino acids on cephamycin C production wasexamined in the media optimized by RSM. Acentral composite factorial design of 16 plus 5
Current Trends in Biotechnology and PharmacyVol. 3 (4) 372 - 384, October 2009. ISSN 0973-8916
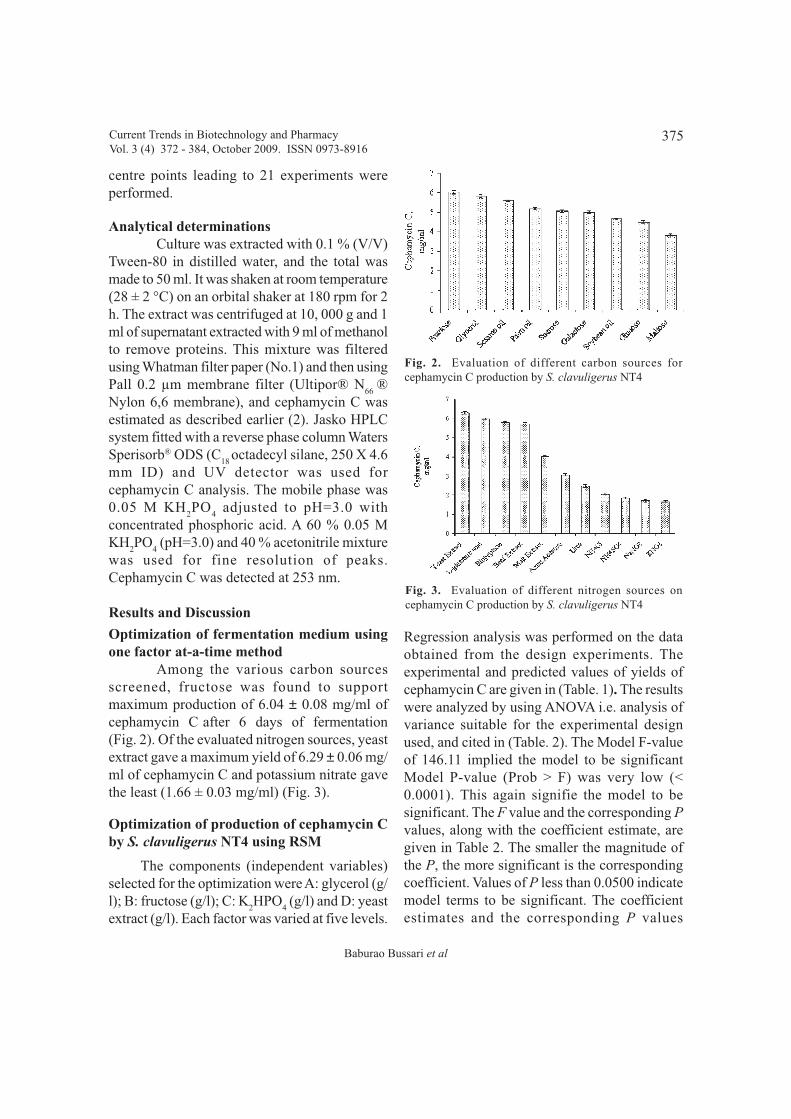
375
Baburao Bussari et al
centre points leading to 21 experiments wereperformed.
Analytical determinationsCulture was extracted with 0.1 % (V/V)
Tween-80 in distilled water, and the total wasmade to 50 ml. It was shaken at room temperature(28 ± 2 °C) on an orbital shaker at 180 rpm for 2h. The extract was centrifuged at 10, 000 g and 1ml of supernatant extracted with 9 ml of methanolto remove proteins. This mixture was filteredusing Whatman filter paper (No.1) and then usingPall 0.2 µm membrane filter (Ultipor® N
66 ®
Nylon 6,6 membrane), and cephamycin C wasestimated as described earlier (2). Jasko HPLCsystem fitted with a reverse phase column WatersSperisorb® ODS (C
18 octadecyl silane, 250 X 4.6
mm ID) and UV detector was used forcephamycin C analysis. The mobile phase was0.05 M KH
2PO
4 adjusted to pH=3.0 with
concentrated phosphoric acid. A 60 % 0.05 MKH
2PO
4 (pH=3.0) and 40 % acetonitrile mixture
was used for fine resolution of peaks.Cephamycin C was detected at 253 nm.
Results and Discussion
Optimization of fermentation medium usingone factor at-a-time method
Among the various carbon sourcesscreened, fructose was found to supportmaximum production of 6.04 ± 0.08 mg/ml ofcephamycin C after 6 days of fermentation(Fig. 2). Of the evaluated nitrogen sources, yeastextract gave a maximum yield of 6.29 ± 0.06 mg/ml of cephamycin C and potassium nitrate gavethe least (1.66 ± 0.03 mg/ml) (Fig. 3).
Optimization of production of cephamycin Cby S. clavuligerus NT4 using RSM
The components (independent variables)selected for the optimization were A: glycerol (g/l); B: fructose (g/l); C: K
2HPO
4 (g/l) and D: yeast
extract (g/l). Each factor was varied at five levels.
Regression analysis was performed on the dataobtained from the design experiments. Theexperimental and predicted values of yields ofcephamycin C are given in (Table. 1). The resultswere analyzed by using ANOVA i.e. analysis ofvariance suitable for the experimental designused, and cited in (Table. 2). The Model F-valueof 146.11 implied the model to be significantModel P-value (Prob > F) was very low (<0.0001). This again signifie the model to besignificant. The F value and the corresponding Pvalues, along with the coefficient estimate, aregiven in Table 2. The smaller the magnitude ofthe P, the more significant is the correspondingcoefficient. Values of P less than 0.0500 indicatemodel terms to be significant. The coefficientestimates and the corresponding P values
Fig. 2. Evaluation of different carbon sources forcephamycin C production by S. clavuligerus NT4
Fig. 3. Evaluation of different nitrogen sources oncephamycin C production by S. clavuligerus NT4
Current Trends in Biotechnology and PharmacyVol. 3 (4) 372 - 384, October 2009. ISSN 0973-8916

376
An integrated approach for production of cephamycin C
suggested that among the test variables used inthe study, A, B, C, D, A2, C2, D2, AB, AC, AD,BC, BD and CD (where A: glycerol (g/l); B:fructose (g/l); C: K
2HPO
4 (%) and D: yeast extract
(g/l)) were significant model terms. A, B, D, AC& BD (P< 0.0001) had the largest effect oncephamycin C production, followed by C, D2,AD, C2, BC, A2, CD & AB.
The corresponding second-order responsemodel for Eq. (2) that was found after analysisfor the regression was
Yield of cephamycin C (mg/ml) =4.390 + (1.725 x A) + (0.613 x B) – (0.372 x C) + (1.085 x D) + (0.179 x A2)+ (0.011 x B2) + (0.211 x C2) – (0.276 x D2 ) + (0.236 x A B) – (0.669 x AC) –
(0.631 x AD) + (0.361 x BC) + (1.661 x BD) + (0.256 x DC) ----------- Eq. (3)
R2 = 0.997 suggest the prediction ofexperimental data to be quite satisfactory. The“Pred R-squared” of 0.82 was found to be inreasonable agreement with the “Adj R-Squared”of 0.99. Here, Adeq Precision of 48.79 (>4)indicates an adequate signal.
The predicted values by “contour plotgeneration” and “point prediction” wereexperimentally verified. The maximumproduction of cephamycin C obtained using theoptimized medium was 10.45 ± 0.34 (mg/ml).Table 3 documents the yields of cephamycin Cby various predicted media combination. Thefinal media optimized by RSM contained (in g/l)glycerol 23.45, fructose 19.35, arginine 17.4,CaCl
2 0.4, K
2HPO
4 0.89, MnCl
2 0.05, ZnCl
2 0.05,
NaCl 5.0, MgSO4 1.0 and yeast extract 21.1. This
was further optimized for supplementation of fouramino acids.
Here, glycerol (A) plays a very significantrole (p< 0.0001). Glycerol supports antibioticproduction, and fructose supports the growth.This concept of dual carbon source utilizationappears to be the basis for published media, whichsupport commercial antibiotic synthesis. As theresidual concentration of glycerol is increased,antibiotic accumulation increases rapidly. In the
Current Trends in Biotechnology and PharmacyVol. 3 (4) 372 - 384, October 2009. ISSN 0973-8916
present study, glycerol at 23.45 g/l was found tobe optimum. Fructose (B), (p< 0.0001) alsoplayed an important role in determining theproduct yield in antibiotic fermentations. Whenthe concentration of fructose was low,cephamycin C production was relatively low. Asthe residual concentration of fructose increased,antibiotic accumulation increased rapidly. In thepresent study, the optimum fructose concentrationwas found to be 19.35 g/l. Yeast extract (D) asthe nitrogen source (p< 0.0001) also played animportant role in determining the product yieldin antibiotic fermentations. Cephamycin Cproduction was relatively low at lowerconcentrations of yeast extract, and itsaccumulation increased with an increase in theresidual level of yeast extract. In the present study,the optimum fructose concentration was foundto be 21.1 (g/l). K
2HPO
4 (C), (p = 0.0002) had a
great significance in cephamycin C fermentation.The required concentration of K
2HPO
4 is
governed mainly by the glycerol concentration.Even though an increase in phosphateconcentration does increase the cephamycin Cproduction, at higher concentrations of glycerolthe required concentration of K
2HPO
4 is
comparatively low. In the present study, theoptimum K
2HPO
4 concentration was found to be
0.89 %, as the glycerol concentration was higher(23.45 g/l).
Maltose and glucose as carbon source didnot have any major effect on cephamycin Cproduction. Streptomyces clavuligerus is a rareactinomycete unable to grow on glucose (7).Aharonowitz and Demain (8) have observed astrong suppressive effect of ammonia onantibiotic production in the cephamycin producerS. clavuligerus. The nature of this regulationappears to be similar to that observed with rapidlymetabolisable carbon sources. Khaoua et al. (9)reported that the production of cephamycin C byStreptomyces cattleya varies with the use ofasparagines, glutamine or ammonium as nitrogen
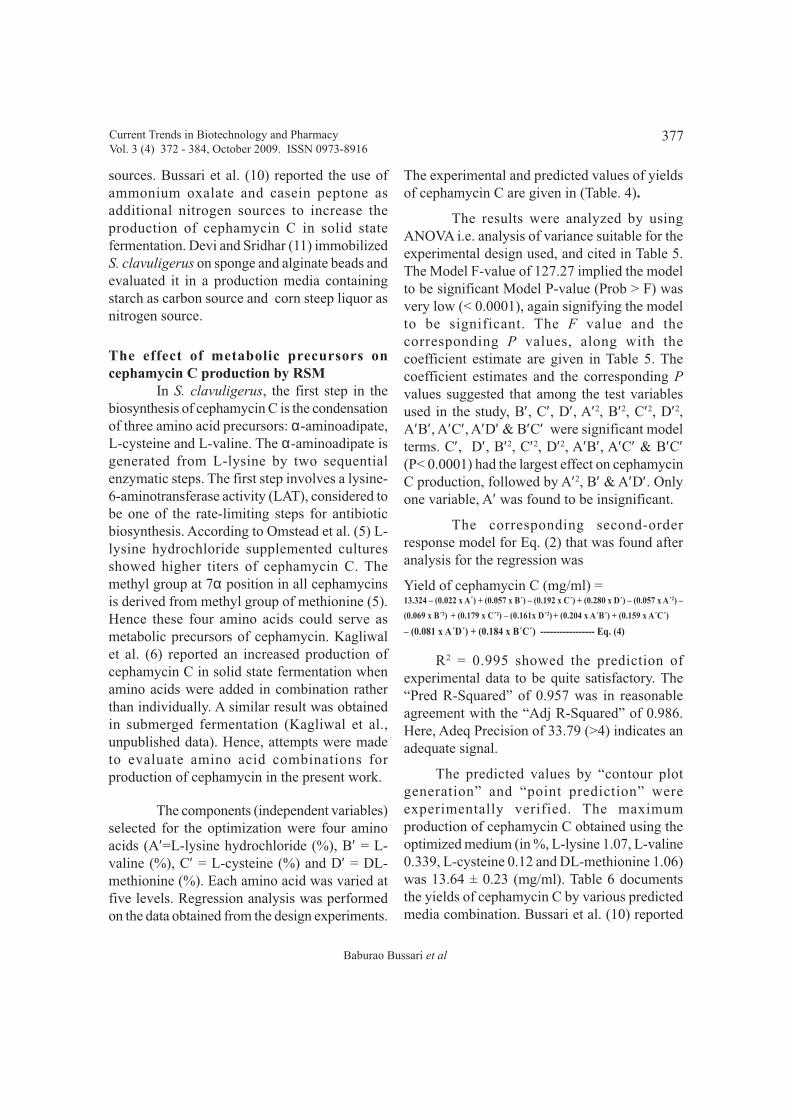
377
Baburao Bussari et al
sources. Bussari et al. (10) reported the use ofammonium oxalate and casein peptone asadditional nitrogen sources to increase theproduction of cephamycin C in solid statefermentation. Devi and Sridhar (11) immobilizedS. clavuligerus on sponge and alginate beads andevaluated it in a production media containingstarch as carbon source and corn steep liquor asnitrogen source.
The effect of metabolic precursors oncephamycin C production by RSM
In S. clavuligerus, the first step in thebiosynthesis of cephamycin C is the condensationof three amino acid precursors: α-aminoadipate,L-cysteine and L-valine. The α-aminoadipate isgenerated from L-lysine by two sequentialenzymatic steps. The first step involves a lysine-6-aminotransferase activity (LAT), considered tobe one of the rate-limiting steps for antibioticbiosynthesis. According to Omstead et al. (5) L-lysine hydrochloride supplemented culturesshowed higher titers of cephamycin C. Themethyl group at 7α position in all cephamycinsis derived from methyl group of methionine (5).Hence these four amino acids could serve asmetabolic precursors of cephamycin. Kagliwalet al. (6) reported an increased production ofcephamycin C in solid state fermentation whenamino acids were added in combination ratherthan individually. A similar result was obtainedin submerged fermentation (Kagliwal et al.,unpublished data). Hence, attempts were madeto evaluate amino acid combinations forproduction of cephamycin in the present work.
The components (independent variables)selected for the optimization were four aminoacids (A′=L-lysine hydrochloride (%), B′ = L-valine (%), C′ = L-cysteine (%) and D′ = DL-methionine (%). Each amino acid was varied atfive levels. Regression analysis was performedon the data obtained from the design experiments.
The experimental and predicted values of yieldsof cephamycin C are given in (Table. 4).
The results were analyzed by usingANOVA i.e. analysis of variance suitable for theexperimental design used, and cited in Table 5.The Model F-value of 127.27 implied the modelto be significant Model P-value (Prob > F) wasvery low (< 0.0001), again signifying the modelto be significant. The F value and thecorresponding P values, along with thecoefficient estimate are given in Table 5. Thecoefficient estimates and the corresponding Pvalues suggested that among the test variablesused in the study, B′, C′, D′, A′2, B′2, C′2, D′2,A′B′, A′C′, A′D′ & B′C′ were significant modelterms. C′, D′, B′2, C′2, D′2, A′B′, A′C′ & B′C′(P< 0.0001) had the largest effect on cephamycinC production, followed by A′2, B′ & A′D′. Onlyone variable, A′ was found to be insignificant.
The corresponding second-orderresponse model for Eq. (2) that was found afteranalysis for the regression was
Yield of cephamycin C (mg/ml) =13.324 – (0.022 x A´) + (0.057 x B´) – (0.192 x C´) + (0.280 x D´) – (0.057 x A´2) –
(0.069 x B´2) + (0.179 x C´2) – (0.161x D´2) + (0.204 x A´B´) + (0.159 x A´C´)
– (0.081 x A´D´) + (0.184 x B´C´) ----------------- Eq. (4)
R2 = 0.995 showed the prediction ofexperimental data to be quite satisfactory. The“Pred R-Squared” of 0.957 was in reasonableagreement with the “Adj R-Squared” of 0.986.Here, Adeq Precision of 33.79 (>4) indicates anadequate signal.
The predicted values by “contour plotgeneration” and “point prediction” wereexperimentally verified. The maximumproduction of cephamycin C obtained using theoptimized medium (in %, L-lysine 1.07, L-valine0.339, L-cysteine 0.12 and DL-methionine 1.06)was 13.64 ± 0.23 (mg/ml). Table 6 documentsthe yields of cephamycin C by various predictedmedia combination. Bussari et al. (10) reported
Current Trends in Biotechnology and PharmacyVol. 3 (4) 372 - 384, October 2009. ISSN 0973-8916
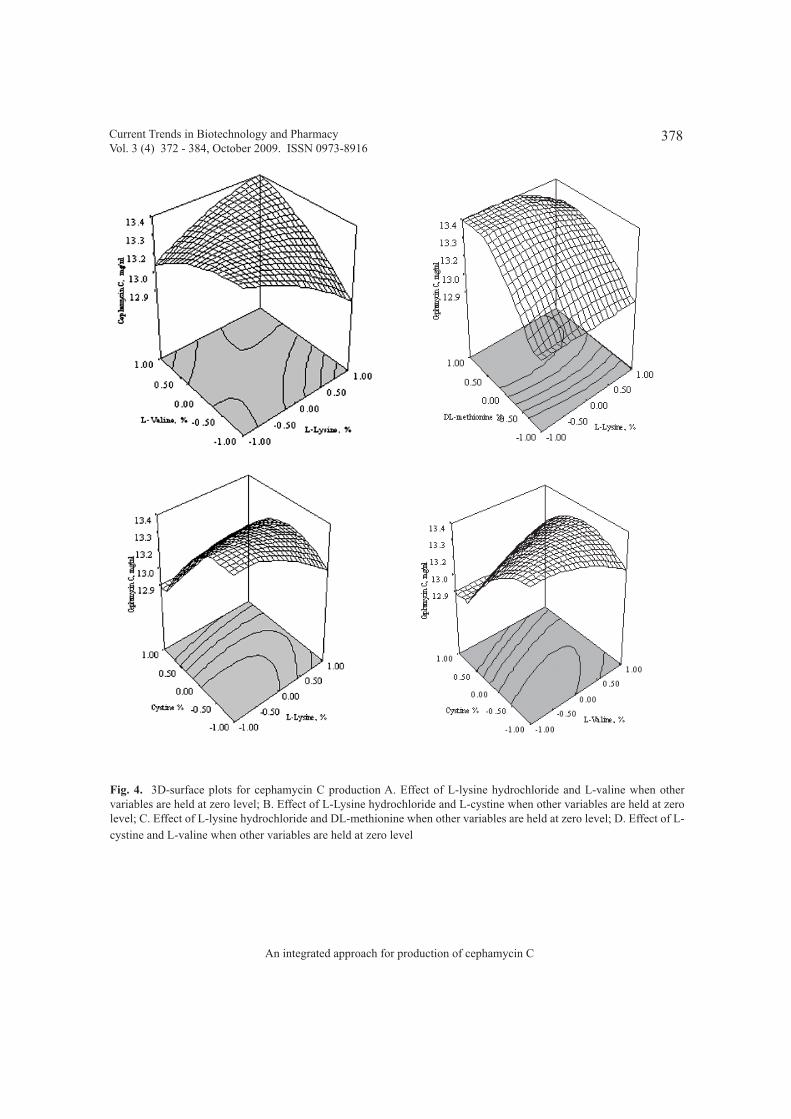
378
An integrated approach for production of cephamycin C
Fig. 4. 3D-surface plots for cephamycin C production A. Effect of L-lysine hydrochloride and L-valine when othervariables are held at zero level; B. Effect of L-Lysine hydrochloride and L-cystine when other variables are held at zerolevel; C. Effect of L-lysine hydrochloride and DL-methionine when other variables are held at zero level; D. Effect of L-cystine and L-valine when other variables are held at zero level
Current Trends in Biotechnology and PharmacyVol. 3 (4) 372 - 384, October 2009. ISSN 0973-8916

379
Baburao Bussari et al
on optimization of cephamycin C productionusing solid state fermentation. They examinedthe combined effect of four different amino acidson cephamycin C production, using RSM andfound the optimum L-lysine concentration to be3.86 %, valine 0.84 %, L-cysteine 0.1 % and DL-methionine 1.5 %. Accordingly, three-dimensional graphs were generated for the pair-wise combination of the five factors, whilekeeping the other three at their center point levels.Graphs are given here to highlight the rolesplayed by various factors (Fig. 4).
Mendelowitz and Aharonowitz (12)reported that addition of L-lysine to the cultureof S. clavuligerus grown in a chemically definedmedium increased specific antibiotic productionby 75 %. Fang et al. (13) observed 100 mM L-lysine to increase the production of β-lactamantibiotic approximately by 500 % with onlyminor effects on growth. Leitão et al. (14)reported the effect of exogenous lysine oncephamycin C production by N. lactamduransMA4213. Lysine-supplemented cultures showedhigher titers of cephamycin C, and the effect wasfound to be more significant in the early staes offermentation. It should be noted that all thesereports were using only exogenous L-lysine(without any other additional amino acidsimultaneously). In the present study, theoptimum L-lysine hydrochloride was found tobe 1.07 %, which also considers the effect of otheramino acids. From ANOVA (Table. 5) it wasconcluded that L-lysine hydrochloride(p=0.0891>0.05) had an insignificant role, whenall other three amino acids were present in the media.
L-cysteine (C`) and DL-methionine (D`),(p<0.00001) had a significant role in cephamycinC production. L-cysteine, DL-methionine andinorganic sulphate & thiosulphate are the majorsources of sulphur for cephamycin C production.To incorporate sulphur into β-lactam, one way isthe conversion of methionine in to cysteine prior
to formation of the Arnstein tripeptide. L-cysteineis incorporated into the Arnstein tripeptide.Contour plot and 3D-surface plot for L-cysteinewith other amino acids, predicts that a maximumcephamycin C production in the presence of L-cysteine at in the range 0 to 0.5 %. An increasein L-cysteine concentration from 0.5 to 2 %decreased the production of cephamycin Cdrastically. In this study, the optimum L-cysteinewas found to be 0.12 %. Contour plot and 3D-surface plot for DL-methionine with other aminoacids predicts that an increase in DL-methioninefrom 0 to 1.2 % increased the production ofcephamycin C. DL-methionine beyond 1.2 %decreased the production of cephamycin C. Inpresent study, the optimum DL-methionine wasfound to be 1.06 %.
L-valine (B`) also played a verysignificant role (p=0.007) in production ofcephamycin C. L-valine is incorporated into theArnstein tripeptide. The inclusion of L-valine, inaddition to other three amino acids stated above,stimulated antibiotic production by S.clavuligerus NT4. Contour plot and 3D-surfaceplot for L-valine with other amino acids predictedan increase in cephamycin C production with anincrease in concentration of L-valine. In thepresent study, 0.339 % L-valine was found to beoptimum, which also considered the effect ofother amino acids.
ConclusionFructose and yeast extract were found to
be suitable carbon and nitrogen source for theproduction of cephamycin C. Supplementationof the RSM-optimized fermentation medium witha combination of L-lysine hydrochloride, L-valine, L-cysteine and DL-methionine increasedthe cephamycin C production from 5.5 mg/ml to13.64 mg/ml. The work is significant in view ofthe cost of derivatives of cephamycin C in theworld market.
Current Trends in Biotechnology and PharmacyVol. 3 (4) 372 - 384, October 2009. ISSN 0973-8916

380
An integrated approach for production of cephamycin C
Table 1. The CCRD matrix of independent variables in coded and uncoded form with theircorresponding experimental and predicted yields of cephamycin C
Run Variables, g/l b Cephamycin C, mg/ml Glycerol Fructose K
2HPO
4 Yeast Extract Experimentala Predicted
1 1 (20) 1 (20) 1 (2.5) -1 (10) 4.02 ± 0.05 4.032 1 (20) 1 (20) -1 (1.0) -1 (10) 6.06 ± 0.09 5.913 1 (20) -1 (10) 1 (2.5) 1 (20) 3.03 ± 0.06 3.044 -1 (10) 1 (20) -1 (1.0) 1 (20) 5.78 ± 0.05 5.635 1 (20) -1 (10) -1 (1.0) 1 (20) 5.48 ± 0.04 5.326 -1 (10) -1 (10) 1 (2.5) -1 (10) 2.02 ± 0.06 2.037 -1 (10) 1 (20) 1 (2.5) 1 (20) 7.42 ± 0.04 7.458 -1 (10) -1 (10) -1 (1.0) -1 (10) 2.83 ± 0.13 2.679 -2 (5) 0 (15) 0 (2.0) 0 (15) 1.61 ± 0.16 1.6510 2 (25) 0 (15) 0 (2.0) 0 (15) 8.51 ± 0.11 8.5511 0 (15) -2 (5) 0 (2.0) 0 (15) 3.15 ± 0.02 3.2112 0 (15) 2 (25) 0 (2.0) 0 (15) 5.60 ± 0.13 5.6513 0 (15) 0 (15) -2 (0.5) 0 (15) 5.73 ± 0.09 5.9714 0 (15) 0 (15) 2 (2.5) 0 (15) 4.62 ± 0.07 4.4815 0 (15) 0 (15) 0 (2.0) -2 (5) 1.06 ± 0.02 1.1216 0 (15) 0 (15) 0 (2.0) 2 (25) 5.41 ± 0.07 5.4517 0 (15) 0 (15) 0 (2.0) 0 (15) 4.39 ± 0.05 4.3918 0 (15) 0 (15) 0 (2.0) 0 (15) 4.40 ±0.06 4.3919 0 (15) 0 (15) 0 (2.0) 0 (15) 4.38 ± 0.08 4.3920 0 (15) 0 (15) 0 (2.0) 0 (15) 4.41 ± 0.05 4.3921 0 (15) 0 (15) 0 (2.0) 0 (15) 4.37 ± 0.02 4.39
a results are mean ± SD of three determinationsb Values in parentheses are uncoded variables
Current Trends in Biotechnology and PharmacyVol. 3 (4) 372 - 384, October 2009. ISSN 0973-8916
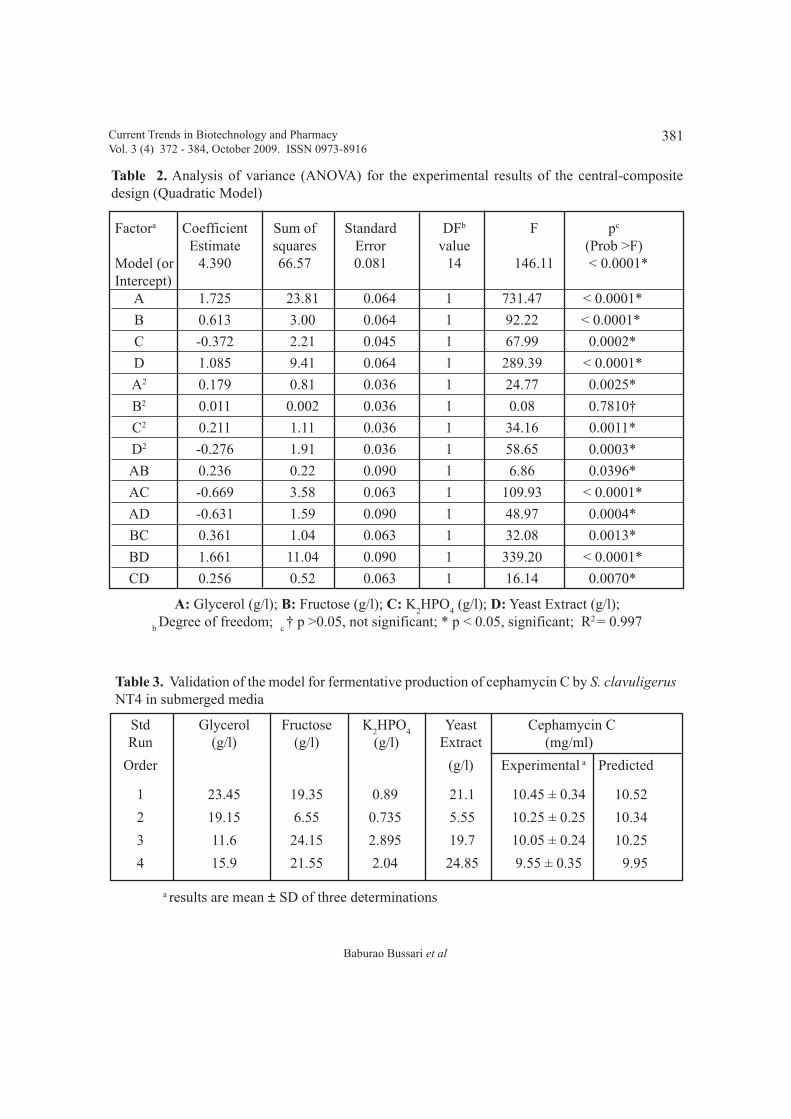
381
Baburao Bussari et al
Table 3. Validation of the model for fermentative production of cephamycin C by S. clavuligerusNT4 in submerged media
Std Glycerol Fructose K2HPO
4Yeast Cephamycin C
Run (g/l) (g/l) (g/l) Extract (mg/ml)
Order (g/l) Experimental a Predicted
1 23.45 19.35 0.89 21.1 10.45 ± 0.34 10.52
2 19.15 6.55 0.735 5.55 10.25 ± 0.25 10.34
3 11.6 24.15 2.895 19.7 10.05 ± 0.24 10.25
4 15.9 21.55 2.04 24.85 9.55 ± 0.35 9.95
a results are mean ± SD of three determinations
Table 2. Analysis of variance (ANOVA) for the experimental results of the central-compositedesign (Quadratic Model)
Factora Coefficient Sum of Standard DFb F pc
Estimate squares Error value (Prob >F) Model (or 4.390 66.57 0.081 14 146.11 < 0.0001* Intercept)
A 1.725 23.81 0.064 1 731.47 < 0.0001*
B 0.613 3.00 0.064 1 92.22 < 0.0001*
C -0.372 2.21 0.045 1 67.99 0.0002*
D 1.085 9.41 0.064 1 289.39 < 0.0001*
A2 0.179 0.81 0.036 1 24.77 0.0025*
B2 0.011 0.002 0.036 1 0.08 0.7810†
C2 0.211 1.11 0.036 1 34.16 0.0011*
D2 -0.276 1.91 0.036 1 58.65 0.0003*
AB 0.236 0.22 0.090 1 6.86 0.0396*
AC -0.669 3.58 0.063 1 109.93 < 0.0001*
AD -0.631 1.59 0.090 1 48.97 0.0004*
BC 0.361 1.04 0.063 1 32.08 0.0013*
BD 1.661 11.04 0.090 1 339.20 < 0.0001*
CD 0.256 0.52 0.063 1 16.14 0.0070*
A: Glycerol (g/l); B: Fructose (g/l); C: K2HPO
4 (g/l); D: Yeast Extract (g/l);
b Degree of freedom;
c † p >0.05, not significant; * p < 0.05, significant; R2 = 0.997
Current Trends in Biotechnology and PharmacyVol. 3 (4) 372 - 384, October 2009. ISSN 0973-8916
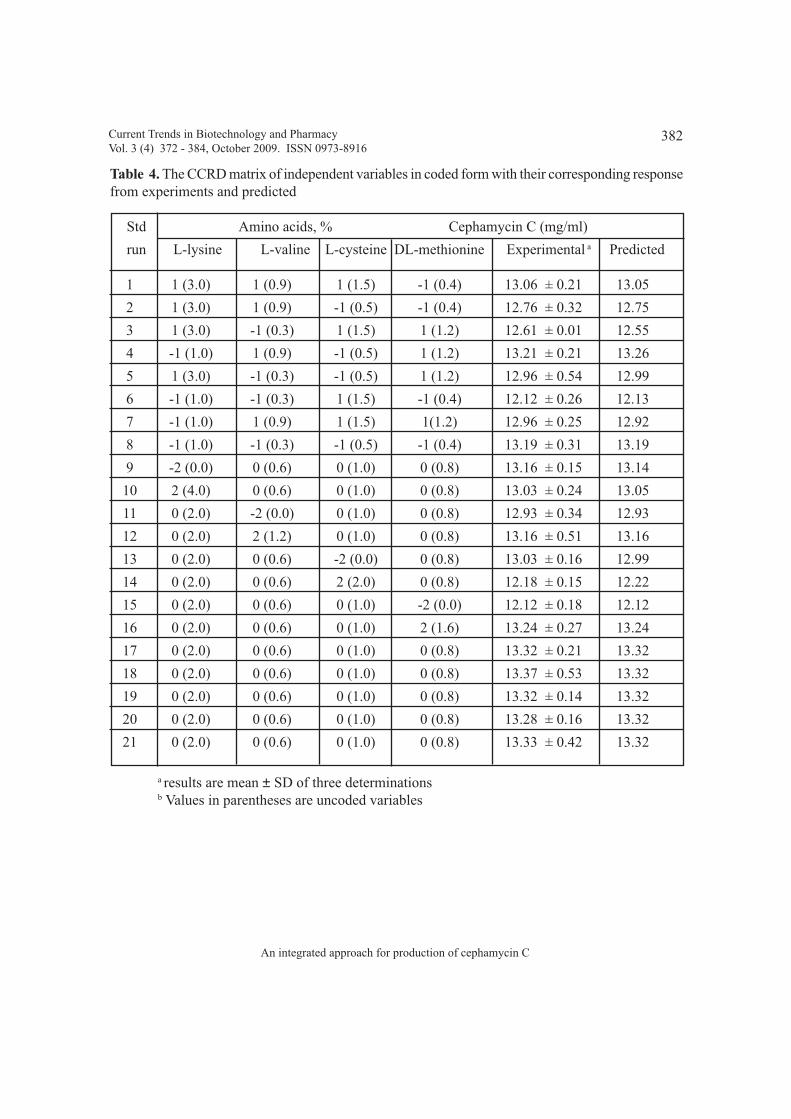
382
An integrated approach for production of cephamycin C
Table 4. The CCRD matrix of independent variables in coded form with their corresponding responsefrom experiments and predicted
Std Amino acids, % Cephamycin C (mg/ml)
run L-lysine L-valine L-cysteine DL-methionine Experimental a Predicted
1 1 (3.0) 1 (0.9) 1 (1.5) -1 (0.4) 13.06 ± 0.21 13.05
2 1 (3.0) 1 (0.9) -1 (0.5) -1 (0.4) 12.76 ± 0.32 12.75
3 1 (3.0) -1 (0.3) 1 (1.5) 1 (1.2) 12.61 ± 0.01 12.55
4 -1 (1.0) 1 (0.9) -1 (0.5) 1 (1.2) 13.21 ± 0.21 13.26
5 1 (3.0) -1 (0.3) -1 (0.5) 1 (1.2) 12.96 ± 0.54 12.99
6 -1 (1.0) -1 (0.3) 1 (1.5) -1 (0.4) 12.12 ± 0.26 12.13
7 -1 (1.0) 1 (0.9) 1 (1.5) 1(1.2) 12.96 ± 0.25 12.92
8 -1 (1.0) -1 (0.3) -1 (0.5) -1 (0.4) 13.19 ± 0.31 13.19
9 -2 (0.0) 0 (0.6) 0 (1.0) 0 (0.8) 13.16 ± 0.15 13.14
10 2 (4.0) 0 (0.6) 0 (1.0) 0 (0.8) 13.03 ± 0.24 13.05
11 0 (2.0) -2 (0.0) 0 (1.0) 0 (0.8) 12.93 ± 0.34 12.93
12 0 (2.0) 2 (1.2) 0 (1.0) 0 (0.8) 13.16 ± 0.51 13.16
13 0 (2.0) 0 (0.6) -2 (0.0) 0 (0.8) 13.03 ± 0.16 12.99
14 0 (2.0) 0 (0.6) 2 (2.0) 0 (0.8) 12.18 ± 0.15 12.22
15 0 (2.0) 0 (0.6) 0 (1.0) -2 (0.0) 12.12 ± 0.18 12.12
16 0 (2.0) 0 (0.6) 0 (1.0) 2 (1.6) 13.24 ± 0.27 13.24
17 0 (2.0) 0 (0.6) 0 (1.0) 0 (0.8) 13.32 ± 0.21 13.32
18 0 (2.0) 0 (0.6) 0 (1.0) 0 (0.8) 13.37 ± 0.53 13.32
19 0 (2.0) 0 (0.6) 0 (1.0) 0 (0.8) 13.32 ± 0.14 13.32
20 0 (2.0) 0 (0.6) 0 (1.0) 0 (0.8) 13.28 ± 0.16 13.32
21 0 (2.0) 0 (0.6) 0 (1.0) 0 (0.8) 13.33 ± 0.42 13.32
a results are mean ± SD of three determinationsb Values in parentheses are uncoded variables
Current Trends in Biotechnology and PharmacyVol. 3 (4) 372 - 384, October 2009. ISSN 0973-8916
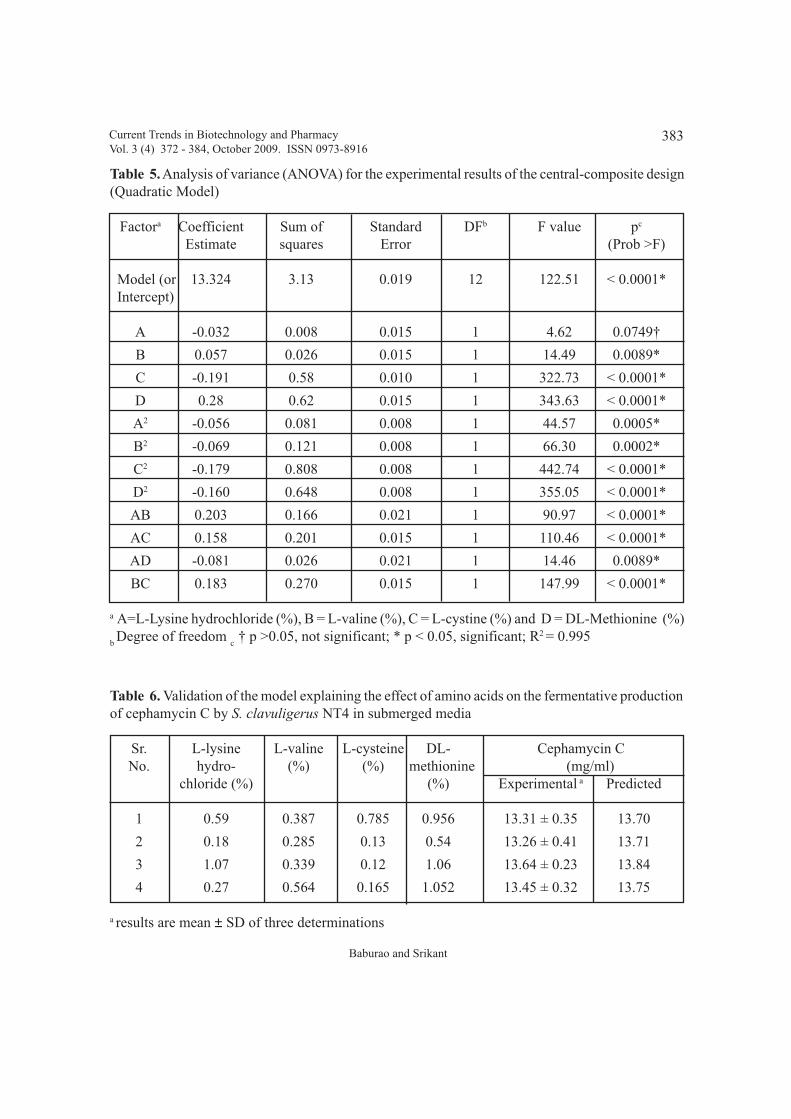
383
Baburao and Srikant
Table 6. Validation of the model explaining the effect of amino acids on the fermentative productionof cephamycin C by S. clavuligerus NT4 in submerged media
Sr. L-lysine L-valine L-cysteine DL- Cephamycin CNo. hydro- (%) (%) methionine (mg/ml)
chloride (%) (%) Experimental a Predicted
1 0.59 0.387 0.785 0.956 13.31 ± 0.35 13.70
2 0.18 0.285 0.13 0.54 13.26 ± 0.41 13.71
3 1.07 0.339 0.12 1.06 13.64 ± 0.23 13.84
4 0.27 0.564 0.165 1.052 13.45 ± 0.32 13.75
a results are mean ± SD of three determinations
Table 5. Analysis of variance (ANOVA) for the experimental results of the central-composite design(Quadratic Model)
Factora Coefficient Sum of Standard DFb F value pc
Estimate squares Error (Prob >F)
Model (or 13.324 3.13 0.019 12 122.51 < 0.0001* Intercept)
A -0.032 0.008 0.015 1 4.62 0.0749†
B 0.057 0.026 0.015 1 14.49 0.0089*
C -0.191 0.58 0.010 1 322.73 < 0.0001*
D 0.28 0.62 0.015 1 343.63 < 0.0001*
A2 -0.056 0.081 0.008 1 44.57 0.0005*
B2 -0.069 0.121 0.008 1 66.30 0.0002*
C2 -0.179 0.808 0.008 1 442.74 < 0.0001*
D2 -0.160 0.648 0.008 1 355.05 < 0.0001*
AB 0.203 0.166 0.021 1 90.97 < 0.0001*
AC 0.158 0.201 0.015 1 110.46 < 0.0001*
AD -0.081 0.026 0.021 1 14.46 0.0089*
BC 0.183 0.270 0.015 1 147.99 < 0.0001*
a A=L-Lysine hydrochloride (%), B = L-valine (%), C = L-cystine (%) and D = DL-Methionine (%)
b Degree of freedom
c † p >0.05, not significant; * p < 0.05, significant; R2 = 0.995
Current Trends in Biotechnology and PharmacyVol. 3 (4) 372 - 384, October 2009. ISSN 0973-8916
384
An integrated approach for production of cephamycin C
References1. Kota, K.P. and Sridhar, P. (1998). Solid-state
cultivation of Streptomyces clavuligerus forcephamycin C production. J. Sci. Ind. Res.57: 587-590.
2. Kota, K.P. and Sridhar, P. (1999). Solid-statecultivation of Streptomyces clavuligerus forcephamycin C production. Process Biochem.34: 325–328.
3. Rao, J.K., Kim, C. and Rhee, S. (2000).Statistical optimization of medium for theproduction of recombinant hirudin fromSaccharomyces cerevisiae using responsesurface methodology. Process Biochem. 35:639-647.
4. Saudagar, P.S., Singhal, R.S. (2007).Optimization of nutritional andenvironmental requirements and feedingstrategies for clavulanic acid production byStreptomyces clavuligerus. Bioresour.Technol. 98:2010-2017.
5. Omstead, D.R., Hunt, G.R. and Buckland,B.C. (1985) in Comprehensive Bio-technology: The principles, applications andregulations in industry, agriculture andmedicine, Vol 3: (Moo-Young M. Ed),Pergamon press., Oxford, pp. 187-210.
6. Kagliwal, L.D., Survase, S.A. and Singhal,RS. (2009). A novel medium for theproduction of cephamycin C by Nocardialactamdurans using solid state fermentation.Bioresour. Technol.100:2600-2606
7. Garcia-Dominguez, M., Martin, J.F. andLirasm P. (1989). Characterisation of sugaruptake in wild-type Streptomycesclavuigerus, which is impaired in glucoseuptake, and in a glucose-utilizing mutant. J.Bacteriology 171:6808-6814.
8. Aharonowitz, Y. and Demain, A.L. (1979).Nitrogen nutrition and regulation ofcephalosporin production in Streptomycesclavuligerus. Can. J. Microbiol. 25: 61-67.
9. Khaoua, S., Lebrihi, A., Germain, P. andLefebvre, G. (1991). Cephamycin Cbiosynthesis in Streptomyces cattleya:nitrogen source regulation. Appl. Microbiol.Bioechnol. 35: 253-257.
10. Bussari, B., Saudagar, P.S., Shaligram, N.S.,Survase, S.A. and Singhal, R.S. (2008).Production of cephamycin C by Streptomycesclavuligerus NT4 using solid-statefermentation. J. Ind. Microbiol. Biotechnol.35: 49–58.
11. Devi, S. and Sridhar, P. (2000). Productionof cephamycin C in repeated batch operationsfrom immobilized Streptomycesclavuligerus. Process Biochem. 36: 225-231.
12. Mendelowitz, S. and Aharonowitz, Y. (1982).Regulation of cephamycin C, synthesisaspartokinase, dihydrodipicolinic andsynthetase, and homoserine dehydrogenaseby aspartic acid family of amino acids inStreptomyces clavuligerus. Antimicrob.Agents Chemother. 21: 74-84.
13. Fang, A., Keables, P. and Demain, A.L.(1996). Unexpected enhancement of â-lactam antibiotic formation in Streptomycesclavuligerus by very high concentrations ofexogenous lysine. Appl. Microbiol.Biotechnol. 44: 705-709.
14. Leitão, A.L., Enguita, F.J., Martín J.F. andOliveira JFS. (2001) Effect of exogenouslysine on the expression of early cephamycinC biosynthetic genes and antibioticproduction in Nocardia lactamduransMA4213. Appl. Microbiol. Biotechnol. 56:
Current Trends in Biotechnology and PharmacyVol. 3 (4) 372 - 384, October 2009. ISSN 0973-8916
385
DGAT 1 polymorphism
AbstractA Polymerase Chain Reaction – Restriction
Fragment Length Polymorphism (PCR-RFLP)test was performed to investigate the allelefrequencies of the diacylglycerol o-acyltransferase 1 gene (DGAT 1) in IndianHolstein Friesian (HF) bulls. Recent studiesindicated that the DGAT 1 gene is responsiblefor fat production and found on centromericregion of bovine chromosome 14. Because ofpolymorphism, the DGAT 1 gene has two majorgenetic variants (K and A) which occurred dueto an amino acid substitution in the candidategene. The allele (K) encoding the lysine provedto be more efficient with regard to the milk fatsynthesis is obviously useful markers for milkfat traits on which bull can be evaluated andselected for future breeding programmes. DNAsamples were extracted from blood samples of281 HF bulls stationed at various sperm stationsacross the country. A 411 bp fragment of DGAT1 was amplified and digested with Cfr1 restrictionenzymes. Two types of alleles K and A and threetypes of genotypes KK, AA and KA wereobserved in the study. The results indicated allelicfrequency of K-allele (0.59) was higher comparedto A-allele (0.41) for DGAT 1 in Indian HFpopulation.
Key words: DGAT1, HF, Milk fat, QTL, PCR-RFLP, Genotype.
Introduction Milk fat is composed primarily of
triglycerides or triacylglycerides which accountsfor 98% of the total fat by weight. The synthesisof triglycerides is catalysed by acyl CoAdiacylglycerol acyltransferase (DGAT). Aquantitative trait locus (QTL) affecting milk fatpercentage has been mapped to the centromereregion of the bovine chromosome 14 (1). Thisgenomic area includes the DGAT 1 gene, whichencodes acyl CoA diacylglycerol acyltransferase1. The enzyme participates in a fundamental rolein metabolism of cellular diacylglycerol and isimportant in higher eukaryotes for physiologicprocesses involving triacylglycerol metabolism,such as intestinal fat absorption, lipoproteinassembly, adipose tissue formation, and lactation(2). It was shown that QTL variation is most likelycaused by a nonconservative two basessubstitution (AA→CG) in the candidate geneDGAT 1 changing lysine to alanine (K232A) inthe enzyme acyl CoA diacylglycerolacyltransferase (1,3). The allele encoding thelysine 232 variant proved to be more efficientwith regard to milk fat synthesis and other milkcharacteristics in the Dutch, Poland, NewZealand, German, Israeli Holstein cattle (1, 4, 5,6 and 7). The nucleotide variation underlying theK232A substitution can be determined by PCR-RFLP assay. The objective of the present studywas to characterize the DGAT 1 variants and to
Genotype and Allele Frequencies of DGAT 1 Gene in IndianHolstein Bulls
R. K. Patel, J. B. Chauhan, K. J. Soni, K. M. Singh R & D-Biotechnology, National Dairy Development Board, Anand- 388 001, India
*For correspondence - [email protected]
Current Trends in Biotechnology and PharmacyVol. 3 (4) 385 - 388, October 2009. ISSN 0973-8916

386
Patel et al
,
estimate the allele frequency of DGAT 1 gene inIndian Holstein Friesian (HF) bulls used forartificial insemination (AI) programmes.
Materials and Methods Blood samples were collected from 281 HF
bulls stationed at different semen collectioncentres across the country. The DNA wasextracted from blood cells by phenol chloroformmethod. The quality and quantity of DNA wasestimated using spectrophotometer and agarosegel electrophoresis. As described by Winter etal. (3), the 411 bp DNA fragment was amplifiedby Polymerase chain reaction (PCR), which wasset by adding sense primer: 5’ GCA CCA TCCTCT TCC TCA AG 3’ and antisense primer: 5'GGA AGC GCT TTC GGA TG 3’). The PCRmix contained 1X PCR buffer, 0.4 mM dNTPs,1 Unit of Taq DNA Polymerase, 0.4 pM each ofsense and antisense primer, 50 ng genomic DNAand sterilized distilled water to make a finalvolume of 25 µl. The PCR reaction included thefollowing steps: Predenaturation for 1 minute at
94oC followed by 30 cycles of 94oC for 45seconds, 55oC for 45 seconds, 72oC for 45seconds and final extension for 10 minutes at72oC. The PCR product of 411 bp was seen on2.5% agarose gel. The amplified PCR productwas digested by using CfrI restriction enzymeand 1X reaction buffer at 37 οC for overnight.The digested product was loaded and visualizedon 2.5% agarose gel after staining with ethidiumbromide. The genotype and allele frequencieswere estimated by direct counting.
Results and Discussion
The restriction digestion analysis of 411 bpPCR product of DGAT 1 indicates the presenceof three restriction patterns. In the first pattern,one fragment (uncut) of 411 bp was observedwhile in the second pattern two fragments 208and 203 bp was observed. The third patternproduced three fragments 411, 208, 203 bp, whichwas the coupling of first and second pattern, inother words it is a heterozygote (Fig. 1).Consistent with Pareek et al. (4), the first pattern
Fig. 1. Electrophoretogram of Cfr I digested PCR product generated by amplification of genomicDNA, using DGAT specific primers. Lane #1:PCR product of 411 bp. Lane # 2, 4, 6 & 7: 411,208, and 203 bp for KA variant. Lane # 3 & 8: 411 bp (uncut) for KK variant. Lane # 5: 25 bpDNA ladder.
Current Trends in Biotechnology and PharmacyVol. 3 (4) 385 - 388, October 2009. ISSN 0973-8916
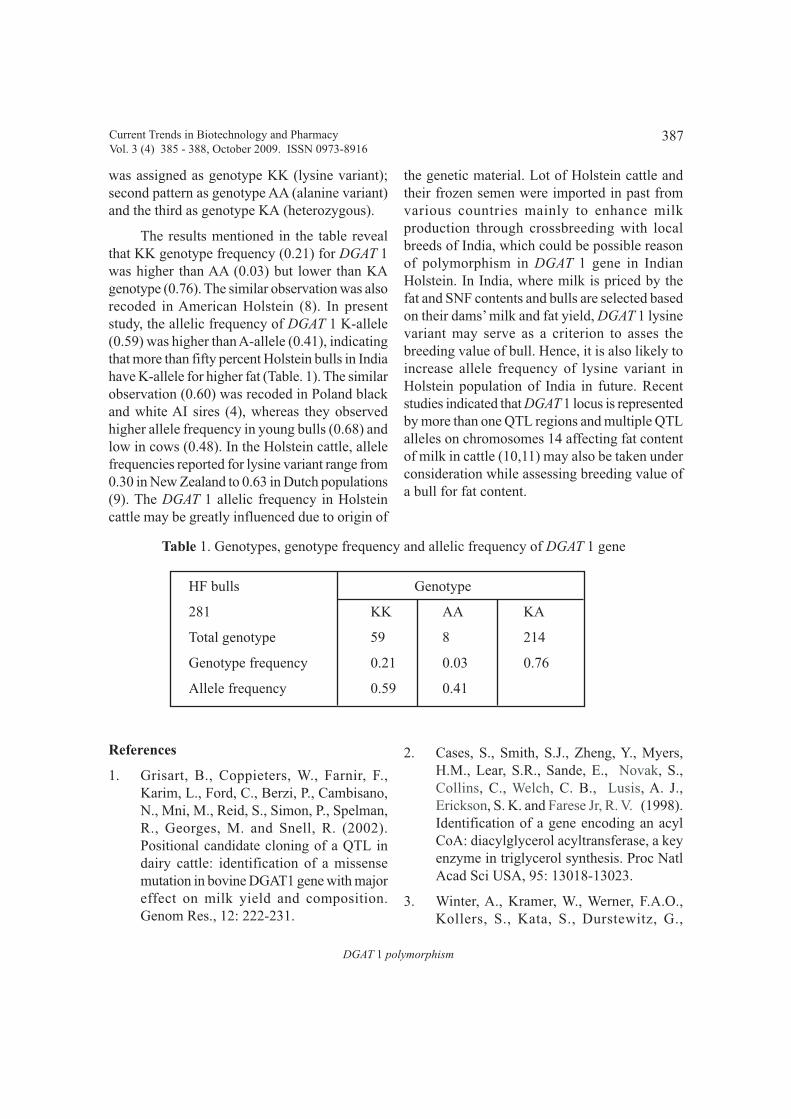
387
Table 1. Genotypes, genotype frequency and allelic frequency of DGAT 1 gene
HF bulls Genotype
281 KK AA KA
Total genotype 59 8 214
Genotype frequency 0.21 0.03 0.76
Allele frequency 0.59 0.41
DGAT 1 polymorphism
was assigned as genotype KK (lysine variant);second pattern as genotype AA (alanine variant)and the third as genotype KA (heterozygous).
The results mentioned in the table revealthat KK genotype frequency (0.21) for DGAT 1was higher than AA (0.03) but lower than KAgenotype (0.76). The similar observation was alsorecoded in American Holstein (8). In presentstudy, the allelic frequency of DGAT 1 K-allele(0.59) was higher than A-allele (0.41), indicatingthat more than fifty percent Holstein bulls in Indiahave K-allele for higher fat (Table. 1). The similarobservation (0.60) was recoded in Poland blackand white AI sires (4), whereas they observedhigher allele frequency in young bulls (0.68) andlow in cows (0.48). In the Holstein cattle, allelefrequencies reported for lysine variant range from0.30 in New Zealand to 0.63 in Dutch populations(9). The DGAT 1 allelic frequency in Holsteincattle may be greatly influenced due to origin of
the genetic material. Lot of Holstein cattle andtheir frozen semen were imported in past fromvarious countries mainly to enhance milkproduction through crossbreeding with localbreeds of India, which could be possible reasonof polymorphism in DGAT 1 gene in IndianHolstein. In India, where milk is priced by thefat and SNF contents and bulls are selected basedon their dams’ milk and fat yield, DGAT 1 lysinevariant may serve as a criterion to asses thebreeding value of bull. Hence, it is also likely toincrease allele frequency of lysine variant inHolstein population of India in future. Recentstudies indicated that DGAT 1 locus is representedby more than one QTL regions and multiple QTLalleles on chromosomes 14 affecting fat contentof milk in cattle (10,11) may also be taken underconsideration while assessing breeding value ofa bull for fat content.
Current Trends in Biotechnology and PharmacyVol. 3 (4) 385 - 388, October 2009. ISSN 0973-8916
References
1. Grisart, B., Coppieters, W., Farnir, F.,Karim, L., Ford, C., Berzi, P., Cambisano,N., Mni, M., Reid, S., Simon, P., Spelman,R., Georges, M. and Snell, R. (2002).Positional candidate cloning of a QTL indairy cattle: identification of a missensemutation in bovine DGAT1 gene with majoreffect on milk yield and composition.Genom Res., 12: 222-231.
2. Cases, S., Smith, S.J., Zheng, Y., Myers,H.M., Lear, S.R., Sande, E., Novak, S.,Collins, C., Welch, C. B., Lusis, A. J.,Erickson, S. K. and Farese Jr, R. V. (1998).Identification of a gene encoding an acylCoA: diacylglycerol acyltransferase, a keyenzyme in triglycerol synthesis. Proc NatlAcad Sci USA, 95: 13018-13023.
3. Winter, A., Kramer, W., Werner, F.A.O.,Kollers, S., Kata, S., Durstewitz, G.,
388
Patel et al
Buitkamp, J., Womack, J.E., Thaller, G. andFries, R. (2002). Association of a lysine-232/alanine polymorphism in a bovine geneencoding acyl-CoA:diacylglyceroleacyltransferase (DGAT1) with variation ata quantitative trait locus for milk fat content.Porc. Nat. Acad Sci USA, 99: 9300-9305.
4. Pareek, C.S., Czarnik, U., Zabolewicz, T.,Pareek, R.S. and Walawski, K. (2005).DGAT1 K232A quantitative traitsnucleotide polymorphism in Polish Black-and-White cattle. J Appl Genet., 46: 85-87.
5. Spleman, R.J., Ford, C.A., McElhinney, P.,Gregory, G.C. and Snell, R.G. (2002).Characterization of DGAT1 gene in theNew Zealand dairy population. J Dairy Sci.,85: 3514-1517.
6. Thaller, G., Kramer, W., Winter, A., Kaupe,B., Erhardt, G. and Fries, R. (2003). Effectsof DGAT1 variants on milk productiontraits in German cattle breeds. J Anim Sci.,81: 911-1918.
7. Weller, J.I., Golik, M., Seroussi, E., Ezra,E. and Ron, M. (2003). Population-wideanalysis of a QTL affecting milk-fatproduction in the Israeli Holsteinpopulation. J Dairy Sci., 86: 2219-2227.
8. Kuhn, C., Thaller, G., Winter, A., Bininda-Emonds, O.R.P., Kaupe, B., Erhardt, G.,Bennewitz, J. Schwerin, M. and Fries, R.(2004). Evidence for multiple alleles at theDGAT1 locus better explains a quantitativetrait locus with major effect on milk fatcontent in cattle. Gent., 167: 1873-1881.
9. Bovenhuis, H. and Schrooten, C. (2002).Quantitative trait loci for milk productiontraits in dairy cattle. In Proc. Of the 7th
World Congress on genetics applied tolivestock production, Montpellier , France.
10. Bennewitz, J., Reinsch, N., Paul, S., Looft,C., Kaupe, B., Weimann, C., Erhardt, G.,Thaller, G., Kuhn, C., Schwerin, M.Thomsen, H. Reinhardt, R. Reentsand, F.and Kalm, E. (2004). The DGAT1 K232Amutation is not solely responsible for themilk production quantitative trait locus onthe bovine chromosome 14. J Dairy Sci.,87: 431-442.
11. Kaupe, B., Winter, A., Ibeagha, E.,Ozbeyaz, C., Williams, J. L., Ajmone-Marsan, P., Fries, R. and Erhardt, G. (2002).Screening of Bos taurus and Bos indicuscattle for DGAT1 polymorphism. ProceedISAG, Gottingen, D162.
Current Trends in Biotechnology and PharmacyVol. 3 (4) 385 - 388, October 2009. ISSN 0973-8916

389
Helicobacter pylori in the duodenum
AbstractIntestinal alkaline phosphatase (IAP) from
normal duodenum was concentrated by 0-35%ammonium sulphate and was fractionated inDEAE cellulose column and thus, partiallypurified IAP was purified by passing throughSephadex G-75 column in all the steps thepurification was monitored through enzymeactivity. The purity of the IAP was establishedon C-18 RPHPLC which gave single peak at aretention time of 15 minutes and SDS-PAGEanalysis showed single band with molecularweight of 66 KD. Further, PAS stainingconfirmed the glycoprotein nature of IAP. It isvery well known that IAP dephosphorylates lipid-A moiety of lipopolysaccharide layer present inthe gram-negative bacteria and protects fromgram negative sepsis. However, in the presentstudy it was observed that colonisation of H.pylori in the duodenum showed decrease in theintestinal alkaline phosphatase activity andincreased Km (IAP from normal tissue 0.98 µMof PNP/ml/min and Km =0.4µM. IAP from H.pylori infected tissue and Km = 0.48 µM of PNP/ml/min and Km 1 µM). The reverse-transcriptPCR results indicated that, the expression of IAPwas normal in both H. pylori infected tissue andnormal intestinal tissue. Therefore, it can beconcluded that colonisation of H. pylori in theintestine resulted in the lowering of IAP activity.
Keywords: H. pylori, Intestinal alkalinephosphatase, Sepsis, Colonisation.
IntroductionAlkaline phosphatase activity is found
essentially in all tissues. In almost all mammals,the most abundant isozyme of alkalinephosphatase is the one found in liver, bone andkidney called non tissue specific alkalinephosphatase (AP). A second isozyme found ingreatest abundance in the intestine (IAP) of allmammals in particular human beings. In humansand higher primates a third type of isozyme ispresent in the placenta called placental alkalinephosphatase (PLAP). Human IAP has beencloned and sequenced. The tissue non-specificAP is located on the chromosome 1 and IAP ispresent on chromosome 2q.37.1, (1, 2).
The levels of AP vary in ABH secretors andnon-secretors. ABH non-secretors have lowlevels of IAP and are therefore, more prone toduodenal and peptic ulcers (3, 4). However,infections caused due to Helicobacter pylori, oneof the most common bacterial pathogens ofhumans, are not dependent on ABH alleles (4).H. pylori colonize in the gastric mucosa, whereit appears to persist throughout the host’s lifeunless the patient is treated. Colonization induceschronic gastric inflammation which can progress
Purification and characterization of Human Intestinal alkalinephosphatase and its role in the colonization of Helicobacter
pylori in the duodenum
P. V. G. K. Sarma1*, O. Hari Prasad, U. V. Prasad, M. Manohar Reddy, M. Kumar SwamyReddy2 and G. Subramanyam3.
1 Department of Biotechnology, Sri Venkateswara Institute of Medical Sciences; Tirupati, India2 Department of Pathology, Sri Venkateswara Institute of Medical Sciences; Tirupati, India
3Department of Cardiology, Director, Sri Venkateswara Institute of Medical Sciences, Tirupati, India * For correspondence - [email protected]
Current Trends in Biotechnology and PharmacyVol. 3 (4) 389 - 395, October 2009. ISSN 0973-8916
390
Sarma et al
to variety of diseases ranging in severity fromsuperficial gastritis and peptic ulcer to gastriccancer and mucosal associated lymphoma.Strain-specific genetic diversity has beenproposed to involve in the organisms ability tocause different diseases in the infected host. H.pylori cause more than 90% of duodenal ulcersand up to 80% of gastric ulcers (3, 5-7).One ofthe major functions of IAP is protection ofintestine and stomach from the infections of gramnegative bacteria. One of the most life-threatening lipopolysaccharide (LPS) mediateddiseases, Gram negative sepsis, is characterizedby excessive production of pro-inflammatorycytokines, activation of proteolytic cascades,coagulation abnormalities (8), and hemodynamicresponses, resulting in hypotension, poor tissueperfusion, and multi-organ failure (9,10). IAPdephosphorylates lipid A moiety of LPS layer ofgram negative bacteria thereby, protecting thehuman beings from severe inflammatoryresponses generated due to this LPS (11). In spiteof IAP clearing the infections caused due to gramnegative bacteria, how H. pylori a gram negativebacteria overcomes the action of IAP andcolonizes in the intestine, causing severe gastricand duodenal ulcers leading to cancerouscondition? In order to address this question inthe present study we have observed theexpression of IAP in the H. pylori infected tissuewhether the expression of IAP is down regulatedor the activity of IAP is down regulated whencompared with the normal IAP.
Material and Methods Human duodenal tissue was obtained from
Department of Pathology, SVIMS, and Tirupati
1. Histology: Duodenal biopsy specimenswere fixed in 10% formalin. Paraffin sectionswere cut, Warthin Starry silver and haematoxylinand eosin stained and scored for H. pylorimicroscopically by adopting upgraded Sydneyclassification (12-14), were considered as the
samples for the expressional studies of intestinalalkaline phosphatase (IAP).
2. Reverse-Transcript Polymerase chainreaction (RT-PCR): The total mRNA from bothnormal duodenal tissue and H. pylori infectedduodenal tissue and first strand synthesis wascarried using AMV-reverse transcriptase(Promega). Primers for this experiment wereconstructed from the cDNA clone of human IAP(2), Forward primer 5'-ACTTGGG TGGATCAGGACAC-’3 and Reverse primer 5'-TCTGAGTGGCTGTGACT TGG-’3. RT-PCRwas performed in the (900C for 60s, 550C for 30sand 720C for 30s for 45 cycles) EppendrofMastercycler gradient and the obtained PCRproduct was analysed by running 1% agarose gelelectrophoresis (15).
3. Purification and characterization ofHuman Intestinal Alkaline Phosphatase
3.1 Homogenization: 2gms of Humanduodenal tissue was homogenized in 0.1 M Tris-HCl, pH 7.4 that contain 0.25 N Sucrose. Thehomogenate was centrifuged at 1200 rpm for 10minutes at 40C in order to remove all the celldebris. The supernatant was used as a startingmaterial for the isolation and purification of IAPand for expression studies (16).
3.2 Enzyme AssayThe 3ml reaction mixture contains 800µl
of 0.1M Carbonate-bicarbonate buffer pH 10.0,2 ml p-Nitrophenyl phosphate and mixthoroughly. At zero time, add 200µl of enzyme.The absorbance was measured at 405nm againstblank. Enzyme activity was expressed asconcentration of product (PNP) formed perminute per ml. In order to check the maximumvelocity of the enzyme varying concentrationsof substrate p-Nitrophenyl phosphate from 1mMto 10mM were taken and enzyme assay wasperformed (17,19).
Determination of KM: Michaelis-Mentonconstant for IAP in the normal tissue and IAP in
Current Trends in Biotechnology and PharmacyVol. 3 (4) 389 - 395, October 2009. ISSN 0973-8916
391
Helicobacter pylori in the duodenum
H. pylori infected duodenal tissue weredetermined by Hanes – Woolf plot using [S] vs.[S]/ V(17, 19).
3.3 Purification of Human IAPFrom the crude extract the enzyme were
purified in the following manner
3.3.1 (NH4)
2SO
4 Fractionation: 0-35%
(NH4)
2SO
4 was added to concentrate the IAP from
the tissue extract and the solution was centrifugedat 10,000 rpm for 10 min. The pellet wassuspended in 2ml of 0.1M Tris-HCl pH 7.2, anddialysed against the same buffer for overnightwith intermittent changing of the buffer. Theenzyme assay was performed as mentioned in 3.2.The enzyme was concentrated in speed vacconcentrator.
3.3.2 DEAE Cellulose Chromatography:IAP was further fractionated on DEAE cellulosecolumn. 35µg of 0-35% (NH
4)
2SO
4 concentrate
was loaded on DEAE Cellulose column and IAPeluted with stepwise gradient of NaClconcentration prepared in 0.1M Tris-HCl pH 7.2.IAP was eluted using NaCl gradient 50mM to200mM concentration. The peak fractions in eachgradient were assayed using enzyme assaymentioned in 3.2. IAP was eluted in 100mM NaClgradient and this was dialysed against 0.1M Tris-HCl pH 7.2. The dialysed peak fraction wasconcentrated using speed vac concentrator (1, 16,23 and 26).
3.3.3 Gel filtration: 25µg IAP eluted at100mM NaCl concentration from DEAEcellulose column was loaded on Sephadex G-75(30cm x 1.5cm) which was swollen in 0.1M Tris-HCl pH 7.2 and the IAP was eluted with 0.1MTris-HCl pH 7.2 containing 500mM NaCl. Eachpeak fractions were assayed using enzyme assaymentioned in 3.2 (1, 16, 23 and 26).
3.3.4 Reverse Phase HPLC purificationof IAP: 5µg active fraction of IAP obtained fromgel filtration was purified on reverse phase C-18
column (4.6 x 150x 5 microns) HPLC (Shimadzu)equilibrated with 0.1% trifluoroacetic acid (TFA)and elute with a linear gradient of acetonitrilecontaining 0.1% TFA. (1and16).
3.4 Characterization of IAPMolecular weight determination of IAP
The molecular weight of purified IAP wasdetermined by running 7.5% SDS-PAGE and thegel was stained with 0.125% Coomassie Brilliantblue R250. 2.5µg of purified IAP was applied,also 25µg protein from H.pylori infected humanduodenal tissue and 25µg protein from normalhuman duodenal tissue was applied to assess thepresence of IAP isozymes. Standard molecularweight markers of molecular weights 96, 66, 43,29, 20, and 14 KD obtained from BangaloreGenei Pvt Ltd were used in the calculation ofIAP molecular weight. The glycoprotein natureof IAP was detected by staining with Periodicacid Schiff (PAS) stain (18 and 23).
The protein concentrations in all steps weredetermined by Bradford, 1976 method (25)
Results and DiscussionsIt is being observed that alkaline
phosphatase present in the intestine preventsseveral gram negative bacteria to colonize in theintestine thus, unable to establish itspathogenicity in the host organism. However, thisscenario changes dramatically in the ABH non-secretors where lower levels of IAP have beenobserved and are therefore, not only prone toduodenal ulcers but are also more prone toinfections caused due to gram negative bacteria(4). It has been demonstrated that calf intestinalalkaline phosphatase, has provided protectionagainst various gram-negative bacteria by de-phosphorylating the lipid A moiety of LPS (20,21). This has thrown the importance of thisenzyme in clearing infections posed by gramnegative bacteria (22). If high levels of IAP areexpressed in the human intestine what happensto IAP activity during H. pylori infection? The
Current Trends in Biotechnology and PharmacyVol. 3 (4) 389 - 395, October 2009. ISSN 0973-8916
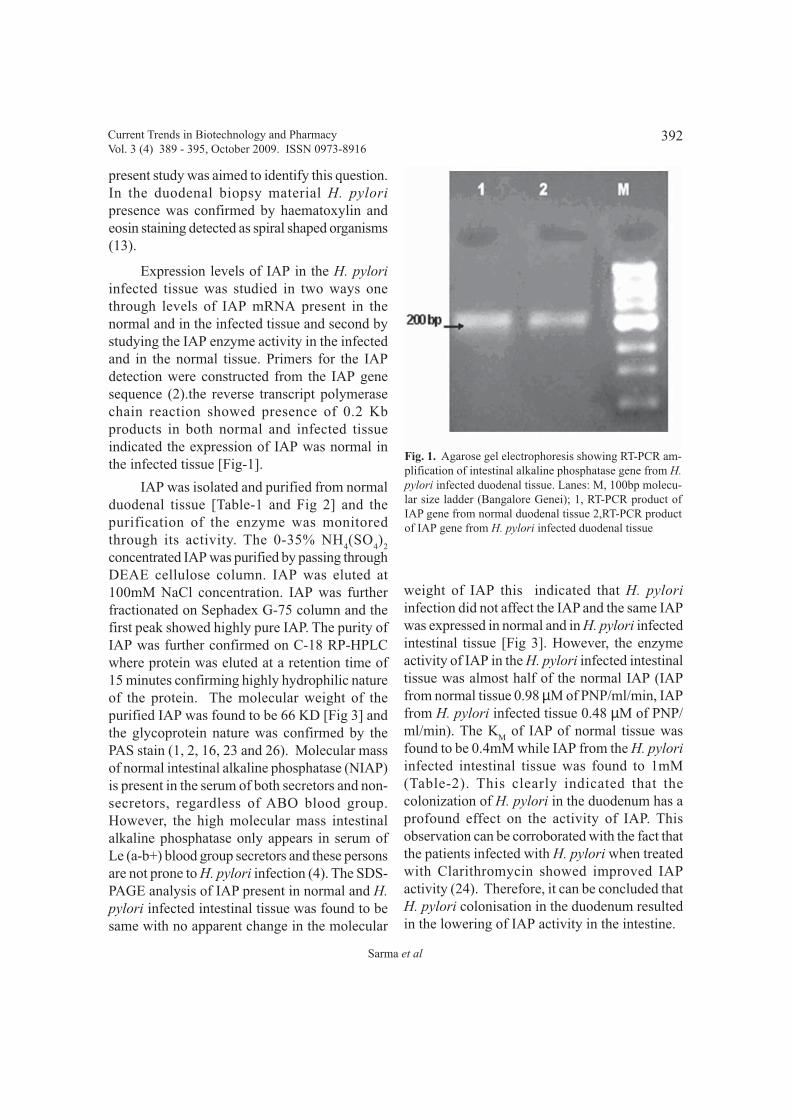
392
Sarma et al
present study was aimed to identify this question.In the duodenal biopsy material H. pyloripresence was confirmed by haematoxylin andeosin staining detected as spiral shaped organisms(13).
Expression levels of IAP in the H. pyloriinfected tissue was studied in two ways onethrough levels of IAP mRNA present in thenormal and in the infected tissue and second bystudying the IAP enzyme activity in the infectedand in the normal tissue. Primers for the IAPdetection were constructed from the IAP genesequence (2).the reverse transcript polymerasechain reaction showed presence of 0.2 Kbproducts in both normal and infected tissueindicated the expression of IAP was normal inthe infected tissue [Fig-1].
IAP was isolated and purified from normalduodenal tissue [Table-1 and Fig 2] and thepurification of the enzyme was monitoredthrough its activity. The 0-35% NH
4(SO
4)
2
concentrated IAP was purified by passing throughDEAE cellulose column. IAP was eluted at100mM NaCl concentration. IAP was furtherfractionated on Sephadex G-75 column and thefirst peak showed highly pure IAP. The purity ofIAP was further confirmed on C-18 RP-HPLCwhere protein was eluted at a retention time of15 minutes confirming highly hydrophilic natureof the protein. The molecular weight of thepurified IAP was found to be 66 KD [Fig 3] andthe glycoprotein nature was confirmed by thePAS stain (1, 2, 16, 23 and 26). Molecular massof normal intestinal alkaline phosphatase (NIAP)is present in the serum of both secretors and non-secretors, regardless of ABO blood group.However, the high molecular mass intestinalalkaline phosphatase only appears in serum ofLe (a-b+) blood group secretors and these personsare not prone to H. pylori infection (4). The SDS-PAGE analysis of IAP present in normal and H.pylori infected intestinal tissue was found to besame with no apparent change in the molecular
Fig. 1. Agarose gel electrophoresis showing RT-PCR am-plification of intestinal alkaline phosphatase gene from H.pylori infected duodenal tissue. Lanes: M, 100bp molecu-lar size ladder (Bangalore Genei); 1, RT-PCR product ofIAP gene from normal duodenal tissue 2,RT-PCR productof IAP gene from H. pylori infected duodenal tissue
weight of IAP this indicated that H. pyloriinfection did not affect the IAP and the same IAPwas expressed in normal and in H. pylori infectedintestinal tissue [Fig 3]. However, the enzymeactivity of IAP in the H. pylori infected intestinaltissue was almost half of the normal IAP (IAPfrom normal tissue 0.98 µM of PNP/ml/min, IAPfrom H. pylori infected tissue 0.48 µM of PNP/ml/min). The K
M of IAP of normal tissue was
found to be 0.4mM while IAP from the H. pyloriinfected intestinal tissue was found to 1mM(Table-2). This clearly indicated that thecolonization of H. pylori in the duodenum has aprofound effect on the activity of IAP. Thisobservation can be corroborated with the fact thatthe patients infected with H. pylori when treatedwith Clarithromycin showed improved IAPactivity (24). Therefore, it can be concluded thatH. pylori colonisation in the duodenum resultedin the lowering of IAP activity in the intestine.
Current Trends in Biotechnology and PharmacyVol. 3 (4) 389 - 395, October 2009. ISSN 0973-8916

393
Helicobacter pylori in the duodenum
Fig. 2. (a) Anion exchange chromatogram (DEAE cellulose) and IAP was eluted at 100mM NaCl concentration. (b) Gelfiltration on Sephadex G-75, I. IAP was eluted with 0.1M Tris-HCl pH 7.2 containing 500mM NaCl. (c) C-18 RP HPLCand IAP was eluted at a retention time of 15 minutes.
Current Trends in Biotechnology and PharmacyVol. 3 (4) 389 - 395, October 2009. ISSN 0973-8916
Fig. 3. Electrophoretogram showing the purification of human intestinal alkaline phosphatase 7.5% SDS-PAGE gel andthe gel was stained with 0.125% coomassie brilliant blue R250. 2.5µg of purified protein was applied in 1-4 lanes, lane 5,25µg protein from H.pylori infected human duodenal tissue, lane 6, 25µg protein from normal human duodenal tissue.Lane 1 IAP obtained from RP-HPLC column, lane 2 and 3 IAP obtained from gel filtration and lane 4 IAP obtained fromDEAE cellulose column, lane M Molecular weight markers obtained from Bangalore Genei Pvt Ltd (96KD, 66KD,45KD, 29KD, 21KD, 14KD).
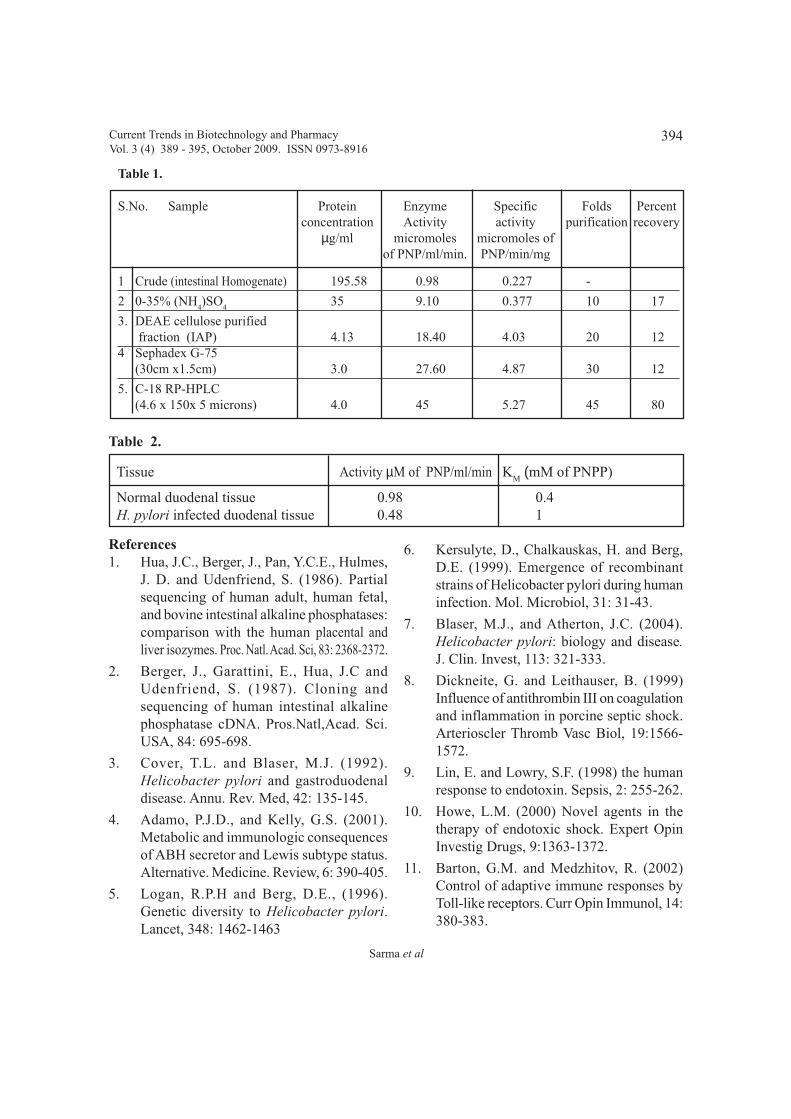
394
Sarma et al
References1. Hua, J.C., Berger, J., Pan, Y.C.E., Hulmes,
J. D. and Udenfriend, S. (1986). Partialsequencing of human adult, human fetal,and bovine intestinal alkaline phosphatases:comparison with the human placental andliver isozymes. Proc. Natl. Acad. Sci, 83: 2368-2372.
2. Berger, J., Garattini, E., Hua, J.C andUdenfriend, S. (1987). Cloning andsequencing of human intestinal alkalinephosphatase cDNA. Pros.Natl,Acad. Sci.USA, 84: 695-698.
3. Cover, T.L. and Blaser, M.J. (1992).Helicobacter pylori and gastroduodenaldisease. Annu. Rev. Med, 42: 135-145.
4. Adamo, P.J.D., and Kelly, G.S. (2001).Metabolic and immunologic consequencesof ABH secretor and Lewis subtype status.Alternative. Medicine. Review, 6: 390-405.
5. Logan, R.P.H and Berg, D.E., (1996).Genetic diversity to Helicobacter pylori.Lancet, 348: 1462-1463
6. Kersulyte, D., Chalkauskas, H. and Berg,D.E. (1999). Emergence of recombinantstrains of Helicobacter pylori during humaninfection. Mol. Microbiol, 31: 31-43.
7. Blaser, M.J., and Atherton, J.C. (2004).Helicobacter pylori: biology and disease.J. Clin. Invest, 113: 321-333.
8. Dickneite, G. and Leithauser, B. (1999)Influence of antithrombin III on coagulationand inflammation in porcine septic shock.Arterioscler Thromb Vasc Biol, 19:1566-1572.
9. Lin, E. and Lowry, S.F. (1998) the humanresponse to endotoxin. Sepsis, 2: 255-262.
10. Howe, L.M. (2000) Novel agents in thetherapy of endotoxic shock. Expert OpinInvestig Drugs, 9:1363-1372.
11. Barton, G.M. and Medzhitov, R. (2002)Control of adaptive immune responses byToll-like receptors. Curr Opin Immunol, 14:380-383.
Current Trends in Biotechnology and PharmacyVol. 3 (4) 389 - 395, October 2009. ISSN 0973-8916
Table 2.
Tissue Activity µM of PNP/ml/min KM (mM of PNPP)
Normal duodenal tissue 0.98 0.4H. pylori infected duodenal tissue 0.48 1
Table 1.
S.No. Sample Protein Enzyme Specific Folds Percentconcentration Activity activity purification recovery
µg/ml micromoles micromoles ofof PNP/ml/min. PNP/min/mg
1 Crude (intestinal Homogenate) 195.58 0.98 0.227 -
2 0-35% (NH4)SO
435 9.10 0.377 10 17
3. DEAE cellulose purified fraction (IAP) 4.13 18.40 4.03 20 12
4 Sephadex G-75(30cm x1.5cm) 3.0 27.60 4.87 30 12
5. C-18 RP-HPLC(4.6 x 150x 5 microns) 4.0 45 5.27 45 80
395
Helicobacter pylori in the duodenum
12. Dixon, M. F., Genta, R.M., Yardley, J.H.,and Correa, P. (1996). Classification andgrading of gastritis. The updated SydneySystem. International Workshop on theHistopathology of Gastritis, Houston, Tex.Am. J. Surg. Pathol, 20: 1161–1181.
13. Recavarren-Acre, S., Gilman, R.H., Leon-Barua, R., Salazar, G., McDonald, J.,Lozano, R., Diaz, F., Ramirez-Ramos, A.,and Berendson, R. (1997). Chronic atrophicgastritis: early diagnosis in a populationwhere Helicobacter pylori is frequent. Clin.Infect.Dis, 25: 1006-1012.
14. Zhang, J.P., Peng, Z.H., Zhang, J., Zhang,X. H. and Zheng, Q.Y. (2006). Helicobacterpylori infection in the pharynx of patientswith chronic pharyngitis detected with TDI-FP and modified Giemsa stain. World JGastroenterol. 12: 468-472.
15. Sarma, P.V.G.K., Swagatha, P., Madan, T.and Usha Sarma, P. (1999). Expression ofan epitopic region of Asp fI, an allergen/antigen/cytotoxin of A. fumigatus.Immunology Letters. 70: 151-155.
16. Yuasa, H., Hirano, K., Kodama, H.,Nakanishi, H., Imai, T., Tsuda, H., Imaida,K and Tatematsu, M (1994). Immunohisto-chemical demonstration of Intestinal typealkaline phosphatase in stomach tumoursinduced by N-methyl-N’-nitrosoguanidinein Rats. Jpn.J.Cancer. Res. 85, 897-903.
17. Mulivor, R.A., Hannig, V.L.and Harris, H.(1978). Developmental changes in humanintestinal alkaline phosphatase.Proc.Natl.Acad.Sci. USA. 75: 3909-3912.
18. Laemmili, U.K. (1970). Cleavage ofstructural proteins during the assembly ofthe head of bacteriophage T4. Nature. 227: 680-685.
19. Scholtens, H.B., Hardonk, M.J. and Meijer,D. K. (1982) A kinetic study of hepaticuptake of canine intestinal alkalinephosphatase in the rat. Liver. 2: 1-13.
20. Bentala, H., Verweij, W.R., Huizinga-Vander Vlag, A., Loenen-Weemaes, A.M.,Meijer, D.K., and Poelstra, K., (2002)Removal of phosphate from lipid a as astrategy to detoxify lipopolysaccharide.Shock. 18: 561-566.
21. Vesy, C.J., Kitchens, R.L., Wolfbauer, G.,Albers, J.J., and Munford, R.S. (2000)Lipopollysaccharide-binding protein andphospholipids transfer protein releaselipopolysaccharides from gram-negativebacterial membranes. Infect Immun 68:2410-2417.
22. Beumer. C, Wulferink, M., Raaben, W.,Fiechter, D., Brands, R., and Seinen, W.,(2003). Calf Intestinal alkaline phosphatase,a novel therapeutic drug forlipopolysaccharide (LPS)-mediateddiseases, attenuates LPS toxicity in Miceand Piglets. Journal of Pharmacology AndExperimental Therapeutics. 307: 737-744.
23. Komoda. T., and Sakagishi, Y. (1976).Partial purification of human intestinalalkaline phosphatase with affinity chro-matography. Some properties and interactionof concanavalin A with alkaline phosphatase.Biochim. Biophys. Acta. 445: 645-660.
24. Tanaka, J., Fukuda, Y., Shintani, S., K. Hori,T., Tomita, T., Ohkusa, T., Matsumoto andH. Miwa (2005). Influence of antimicrobialtreatment for Helicobacter pylori infectionon the intestine microflora in Japanesemacaques. J. Med. Microbiol. 54: 309-314.
25. Bradford, M. M (1976). Rpid and sensitivemethod for the quantitation of microgramquantities of protein utilizing the principleof protein–dye binding. Anal Biochem. 72:248–254.
26. Mckenna, M.J., Hamilton, T.A.,andSussman,H.H (1979). Comparison ofHuman Alkaline Phosphatase IsoenzymesStructural evidence for three protein classes.Biochem. J. 181, 67-73.
Current Trends in Biotechnology and PharmacyVol. 3 (4) 389 - 395, October 2009. ISSN 0973-8916
396
Antiproliferative and antiangiogenic effect of L. acuangula
AbstractThe present study was undertaken to evalu-
ate the possibility of Luffa acutangula(cucurbitaceae family) fruit as a potential anti-cancer agent by examining antiproliferative andantiangiogenic activities. Fruit methanolic extractshowed significant antiproliferative activity (IC-50, 131.63±2.31 µg/ml) on human lung adeno-carcinoma epithelial cell line (A-549). The ex-tract was partially purified by chromatography.Fraction F2-3 showed most potentantiproliferative activity (IC-50, 7.61±1.03 µg/ml)and was further evaluated for antiangiogenic ac-tivity by evaluating vascular endothelial growthfactor (VEGF), matrix metalloproteinases-2(MMP-2) and matrix metalloproteinases-2(MMP-9) as in-vitro, chick chorioallantoic mem-brane (CAM) as an in-vivo model for VEGF.VEGF and both MMP protein expressions weresignificantly inhibited in F2-3 treated A-549 cellscompared to control cells (VEGF: 4.36±0.47 and14±0.75 pg/ml, MMP-2: 10.17±1.3 and20.28±1.68, MMP-9: 12.93±1.70 and 21.12±2.12ng/ml, respectively). Egg chorioallantoic mem-brane treated with F2-3 fraction (10 µg) showedclear avascular zones compared to phosphate buff-ered saline (PBS) treated eggs. In conclusion, ourdata provides a scientific proof for Luffaacutangula as a potential antitumor agent.
Keywords: Vascular endothelial growth factor(VEGF), Matrix metalloproteinases MMP), Ex-tracellular matrix (ECM), Chick chorioallantoicmembrane (CAM) model.
Introduction
A new blood vessel sprouting from nearbypre-existing capillary is generally called asangiogenesis (1). It plays a crucial role in bothphysiological (wound-healing, acute injuryhealing, healing of chronic ulceration of thegastrointestinal mucosa, in embryonicdevelopment, female reproductive cycle etc) andpathological (tumors, rheumatoid arthritis,retinopathy of prematurity, etc.) aspects (2-5).Angiogenesis is considered to be the crucial stepfor tumor proliferation, expansion and metastasis.During avascular stage (<0.5 mm size), tumordoes not need any vessels to carryout the functionlike transport of O
2, CO
2, nutrients, etc. as these
function are taken by means of diffusion. Beyond0.5 mm, tumor needs vesicular vessels to carryoutthe transportation process for its survival (6, 7).In this avascular stage, tumor can not survivewithout vessels and gases cannot diffuse to thetumor.
Vascular endothelial growth factor (VEGF)is one of the first angiogenic factor and mostlyregulates both normal and pathological
Antiproliferative and antiangiogenic effects of partiallypurified Luffa acutangula fruit extracts on human lung
adenocarcinoma epithelial cell line (A-549)
Boreddy Purushotham Reddy, R. Kannaiah Goud,S. Venkata Mohan*, P. N. Sarma
Bioengineering and Environmental Centre, Indian Institute of Chemical Technology Hyderabad 500 607, India
* For correspondence - [email protected].
Current Trends in Biotechnology and PharmacyVol. 3 (4) 396 - 404, October 2009. ISSN 0973-8916

397
B.P. Reddy et al
angiogenesis. Loss or inactivation of tumorsuppressor gene and activation of oncogene areassociated with increased levels of VEGF incancer cells (8,9). Many tumors are reported tohave mutations in the p53 gene and ultimatelyloss the cell cycle regulation associated with highlevel of VEGF (10,11).
Matrix metalloproteinases (MMP) are alarge family of proteolytic enzymes and playimportant role in tumor metastasis and cellinvansion by acting as pro-enzyme in normalphysiological conditions secreted from a varietyof cells. These proteins are over expressed andcause extracellular matrix (ECM) proteinprecipitation and also facilitate metastasis andinvasion (12,13). Both MMP-2 and MMP-9 areover expressed in invasion prostate cancer andendothelial cells (14,15). MMP-9 (gelatinase-B)is the member of MMPs that denatures thecollagenase IV which is the major component ofthe basement membrane (laminin). MMP-2 isstructurally related to MMP-9 and cleaves ECMproteins such as collagen type I and IV.Angiogenesis in tumor progression became a newstrategy for cancer therapy (16), but manyangiogenic inhibitors are available which mightact non-specifically causing various side effects.Some non-toxic phytochemicals viz.,gastrodiaelata blume (17) and sedumsarmentosum bunge (18) were reported to haveno affect on the normal cells and act asantiangiogenesis (indirectly antitumerogenic).
In this study, effect of fruit methanolicfractions of Luffa acutangula on angiogenesisactivity was studied by measuring the VEGF,MMP-2 and MMP-9 as in vitro and CAM as invivo model. Luffa acutangula belongs toCucurbitaceae family which is having laxativeand antidiuritic property used as traditionalmedicine in India. None of its therapeuticpotentials are scientifically evaluated exceptribosome inactivating activity (19).
Materials and Methods
ExtractionAround 300 g of fresh plant material (fruit)
was washed with tap water, air dried and thenchopped into small fragments which were shadedried and reduced to coarse powder with mortarand pestle. The powdered materials were ex-tracted three times each with hexane (2.5 l), andmethanol (2.5 l) followed by distilled anddeionised water (1.0 l) at room temperature in acycle of 48 h each on orbital shaker. The com-bined hexane and methanolic extracts were thenconcentrated in rotavapour at reduced pressure,below 40oC and pooled water extracts were con-centrated by lyophilization.
Partial purification
Since methanolic extract showed significantantiproliferative activity, this extract was furtherfractionated chromatographically. Initially, 15 gof extract was loaded on a silica column (col-umn height and diameter were 24 and 2 inches,respectively) and was eluted with stepwise gra-dient elution of ethyl acetate-methanol (4:1?0:1,v/v). Four fractions were collected at regular in-tervals and named as F1, F2, F3 and F4.Antiproliferative activity of these fractions wasevaluated in MTT assay (20) and it was observedthat fraction F2 only was showing significantactivity. Hence, this fraction was furtherfractionated with the solvent system methanol-water (4:1?0:1, v/v). Four fractions were collectedat regular intervals and named as F2-1, F2-2, F2-3 and F2-4.
HPTLC fingerprinting
Fingerprinting of Luffa acutangula wasperformed on HPTLC plates (5x10 cm) coatedwith 0.25 mm layer of silica gel (60F254; Merck,Germany). The plates were washed with metha-nol and activated at 1100C for 5 min before thesamples were applied as 4 mm and 6 mm widebands by using a Camag (Muttenz, Switzerland)and Linomat IV sample applicator equipped with
Current Trends in Biotechnology and PharmacyVol. 3 (4) 396 - 404, October 2009. ISSN 0973-8916
398
Antiproliferative and antiangiogenic effect of L. acuangula
a 100 µl syringe. A constant application rate of 6µl/sec was used. With mobile phase of benzene:acetone (60:40) along with vanillin and H
2SO
4
as reducing agent. Chromatograms were recordedat 600 nm.
Phytochemical screening
Partially purified extracts that showed sig-nificant cytotoxicity were screened for the pres-ence of alkaloids, tannins, terpenoids, glycosides,flavonoids, saponins, anthraquinones and ster-oids. Chemical tests were carried out on themethanolic extracts using standard procedures toidentify the constituents as described in the lit-erature (21-23).
Cell culture conditions
Human lung cancer cell lines were broughtfrom the Center for Cellular and Molecular Bi-ology (CCMB), Hyderabad, India and were cul-tured in RPMI-1640 medium (Himedia, India).The media were supplemented with 10% fetalbovine serum (FBS), 10 mg/l penicillin–strepto-mycin (Sigma) and 2 mg/l gentamicin (Sigma)and maintained at 370C in 5% CO
2.
Antiproliferative effects of L. acutangulaextracts
Antiproliferative activity of the extracts wasevaluated according to the method described else-where (Reddy et al., 2008). The cells were seededin clear 96-well microplate at a density of 20,000cells per well and left overnight to recover fromhandling stress. After 12 h, the medium was re-placed with fresh medium containing variousconcentrations of crude extracts (hexane, metha-nol and water) of L. acutangula fruit (hexane andmethanol concentrations will be below 0.1%).Following incubation for 24 h, medium was re-moved and replaced with sterile MTT [3-(4, 5-dimethylthiazol-2-yl)-2,5-diphenyl tetrazoliumbromide] solution (50 µg/100 µl in DMEM), in-cubated for another 3 h and then the medium wasdiscarded and replaced with 200 µl of DMSO.
Formazan crystals formed were read at 570 nmusing SPECTRAmax PLUS®, Molecular De-vices, USA. IC-50 values (IC-50 values weretaken from the formula Y= mx+C)) were plottedfrom the results. Since the methanolic extractshowed significant antiproliferative activity, thiscrude extraction was fractionated as describedunder the section Partial purification and thesefractions (F1, F2, F3 & F4) were screened forantiproliferative activity at a concentration rangeof 6.25-100 µg/ml as described above. FractionF2 was active for antiproliferative activity andthis fraction was further fractionated as describedin the section Partial purification and these frac-tions (F2-1, F2-2, F2-3 & F2-4) were again sub-jected to MTT assay at a concentration range of1.25 to 25 µg/ml.
Detection of VEGF protein in supernatant ofL. acutangula treated cells
A-549 cells were seeded in 6-well plate ata density of 0.5 million/well and left overnightto recover from the stress. Medium was replacedwith serum free medium and incubated at 37oCfor another 24 h. Wells were marked as controland experimental groups. Later, the groups weregiven starvation medium along with various ex-tracts (hexane, methanol and water extracts at 75µg/ml) or methanolic fractions (F1, F2, F3 & F4were at 25 µg/ml and F2-1, F2-2, F2-3 & F2-4were at 5 µg/ml) and the former groups were in-cubated with starving medium alone. Control andexperimental groups were incubated for 3 daysand the supernatant samples were collected andanalyzed for the presence of VEGF according tothe ELISA Kit manufacture’s instructions (R&DSystem, USA). Samples were analyzed in tripli-cate and a graph was plotted with time againstthe concentration of VEGF present in thesupernatant (Fig 3). Since, partially purifiedmethanolic fraction F2-3 showed significant ac-tivity this fraction was further evaluated for timedependant inhibition
Current Trends in Biotechnology and PharmacyVol. 3 (4) 396 - 404, October 2009. ISSN 0973-8916
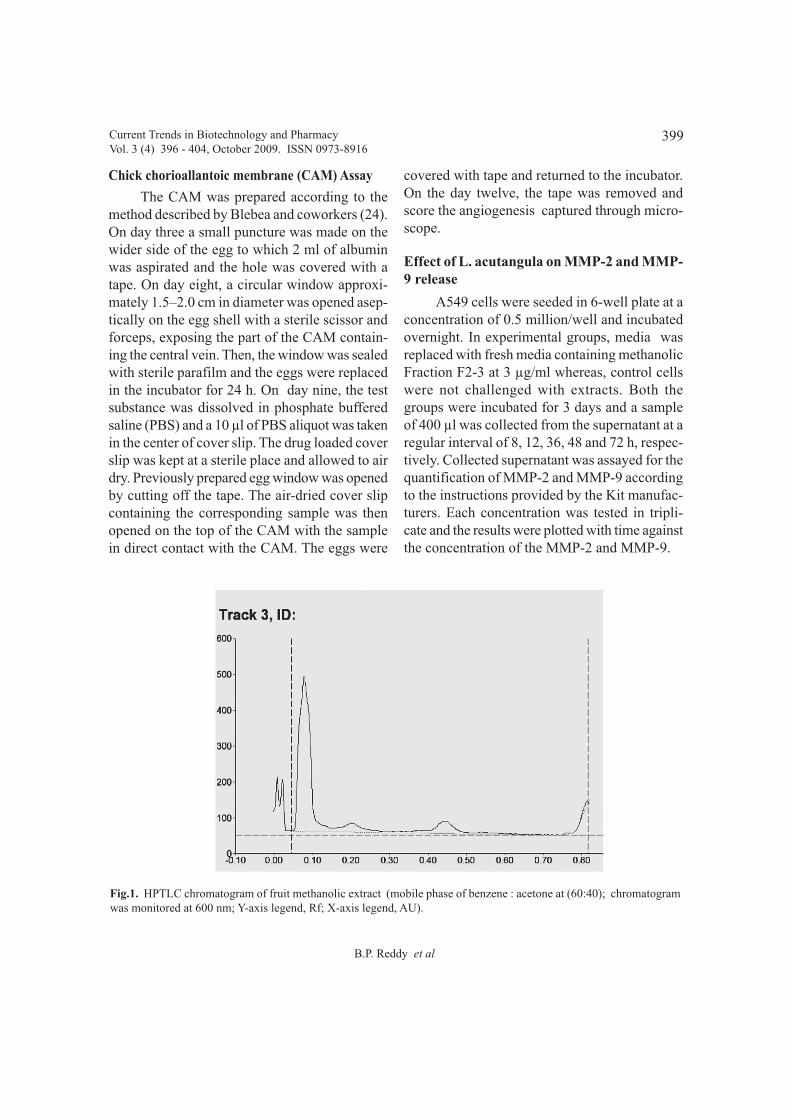
399
B.P. Reddy et al
Chick chorioallantoic membrane (CAM) Assay
The CAM was prepared according to themethod described by Blebea and coworkers (24).On day three a small puncture was made on thewider side of the egg to which 2 ml of albuminwas aspirated and the hole was covered with atape. On day eight, a circular window approxi-mately 1.5–2.0 cm in diameter was opened asep-tically on the egg shell with a sterile scissor andforceps, exposing the part of the CAM contain-ing the central vein. Then, the window was sealedwith sterile parafilm and the eggs were replacedin the incubator for 24 h. On day nine, the testsubstance was dissolved in phosphate bufferedsaline (PBS) and a 10 µl of PBS aliquot was takenin the center of cover slip. The drug loaded coverslip was kept at a sterile place and allowed to airdry. Previously prepared egg window was openedby cutting off the tape. The air-dried cover slipcontaining the corresponding sample was thenopened on the top of the CAM with the samplein direct contact with the CAM. The eggs were
covered with tape and returned to the incubator.On the day twelve, the tape was removed andscore the angiogenesis captured through micro-scope.
Effect of L. acutangula on MMP-2 and MMP-9 release
A549 cells were seeded in 6-well plate at aconcentration of 0.5 million/well and incubatedovernight. In experimental groups, media wasreplaced with fresh media containing methanolicFraction F2-3 at 3 µg/ml whereas, control cellswere not challenged with extracts. Both thegroups were incubated for 3 days and a sampleof 400 µl was collected from the supernatant at aregular interval of 8, 12, 36, 48 and 72 h, respec-tively. Collected supernatant was assayed for thequantification of MMP-2 and MMP-9 accordingto the instructions provided by the Kit manufac-turers. Each concentration was tested in tripli-cate and the results were plotted with time againstthe concentration of the MMP-2 and MMP-9.
Fig.1. HPTLC chromatogram of fruit methanolic extract (mobile phase of benzene : acetone at (60:40); chromatogramwas monitored at 600 nm; Y-axis legend, Rf; X-axis legend, AU).
Current Trends in Biotechnology and PharmacyVol. 3 (4) 396 - 404, October 2009. ISSN 0973-8916
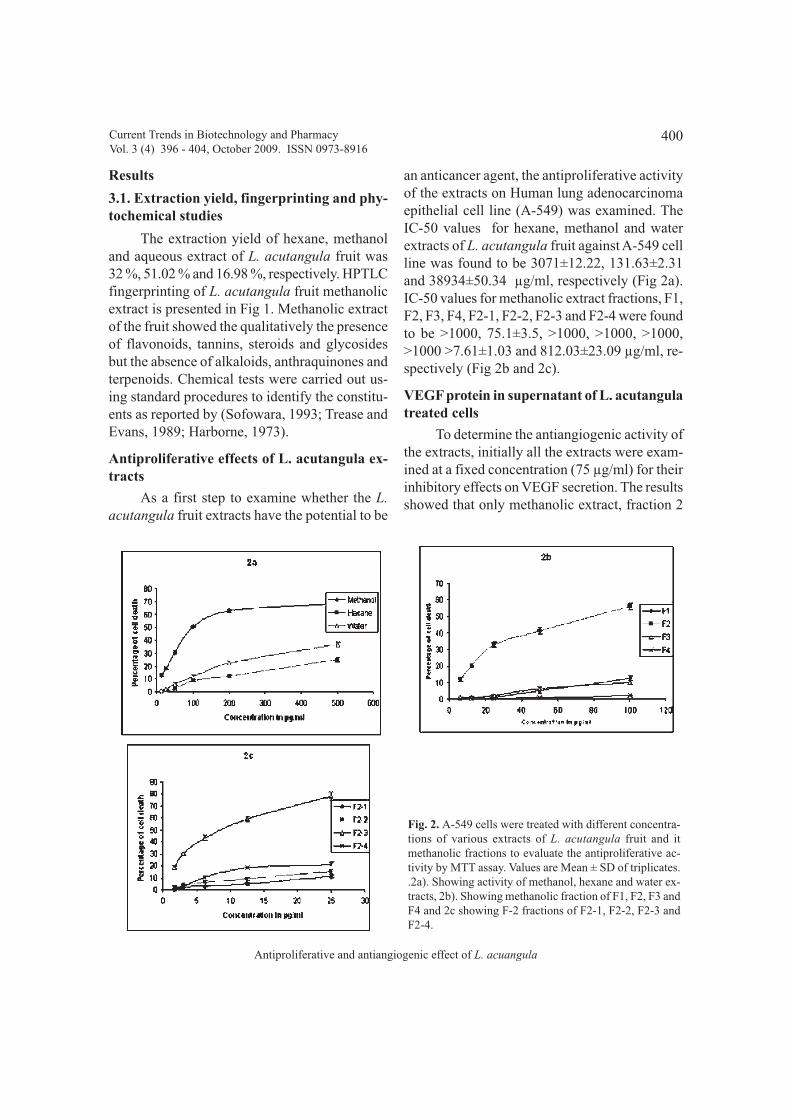
400
Antiproliferative and antiangiogenic effect of L. acuangula
Results
3.1. Extraction yield, fingerprinting and phy-tochemical studies
The extraction yield of hexane, methanoland aqueous extract of L. acutangula fruit was32 %, 51.02 % and 16.98 %, respectively. HPTLCfingerprinting of L. acutangula fruit methanolicextract is presented in Fig 1. Methanolic extractof the fruit showed the qualitatively the presenceof flavonoids, tannins, steroids and glycosidesbut the absence of alkaloids, anthraquinones andterpenoids. Chemical tests were carried out us-ing standard procedures to identify the constitu-ents as reported by (Sofowara, 1993; Trease andEvans, 1989; Harborne, 1973).
Antiproliferative effects of L. acutangula ex-tracts
As a first step to examine whether the L.acutangula fruit extracts have the potential to be
an anticancer agent, the antiproliferative activityof the extracts on Human lung adenocarcinomaepithelial cell line (A-549) was examined. TheIC-50 values for hexane, methanol and waterextracts of L. acutangula fruit against A-549 cellline was found to be 3071±12.22, 131.63±2.31and 38934±50.34 µg/ml, respectively (Fig 2a).IC-50 values for methanolic extract fractions, F1,F2, F3, F4, F2-1, F2-2, F2-3 and F2-4 were foundto be >1000, 75.1±3.5, >1000, >1000, >1000,>1000 >7.61±1.03 and 812.03±23.09 µg/ml, re-spectively (Fig 2b and 2c).
VEGF protein in supernatant of L. acutangulatreated cells
To determine the antiangiogenic activity ofthe extracts, initially all the extracts were exam-ined at a fixed concentration (75 µg/ml) for theirinhibitory effects on VEGF secretion. The resultsshowed that only methanolic extract, fraction 2
Fig. 2. A-549 cells were treated with different concentra-tions of various extracts of L. acutangula fruit and itmethanolic fractions to evaluate the antiproliferative ac-tivity by MTT assay. Values are Mean ± SD of triplicates..2a). Showing activity of methanol, hexane and water ex-tracts, 2b). Showing methanolic fraction of F1, F2, F3 andF4 and 2c showing F-2 fractions of F2-1, F2-2, F2-3 andF2-4.
Current Trends in Biotechnology and PharmacyVol. 3 (4) 396 - 404, October 2009. ISSN 0973-8916
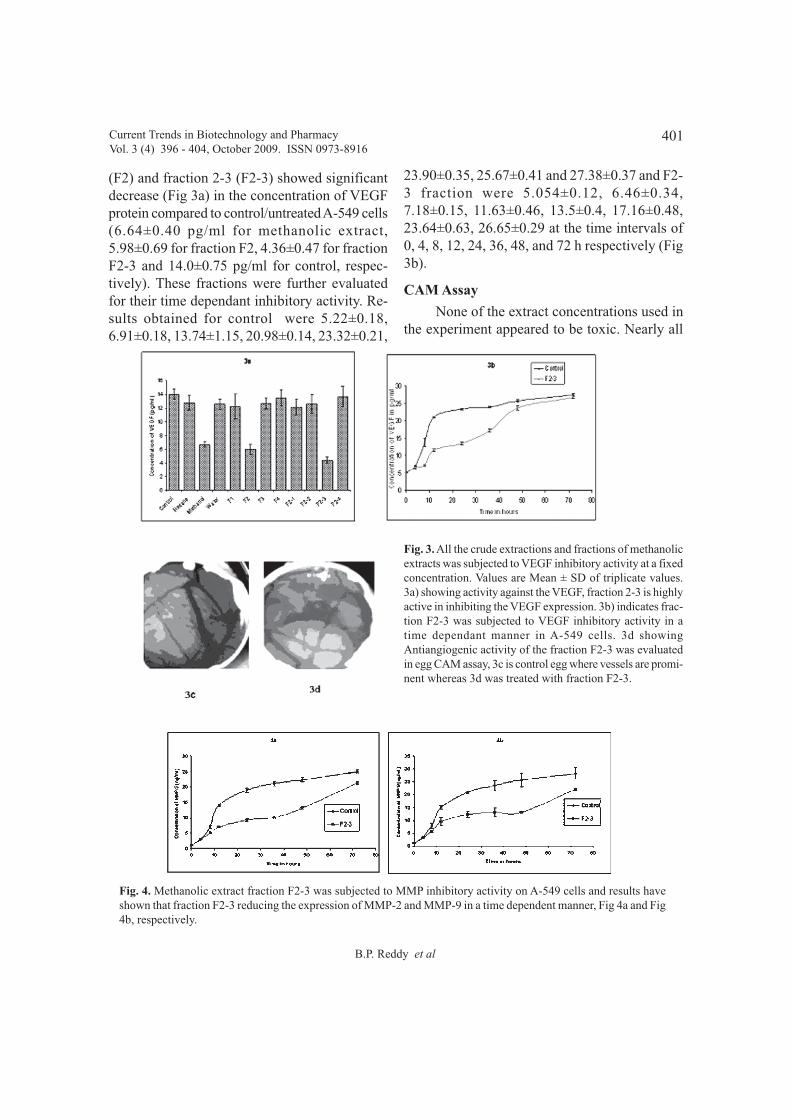
401
B.P. Reddy et al
(F2) and fraction 2-3 (F2-3) showed significantdecrease (Fig 3a) in the concentration of VEGFprotein compared to control/untreated A-549 cells(6.64±0.40 pg/ml for methanolic extract,5.98±0.69 for fraction F2, 4.36±0.47 for fractionF2-3 and 14.0±0.75 pg/ml for control, respec-tively). These fractions were further evaluatedfor their time dependant inhibitory activity. Re-sults obtained for control were 5.22±0.18,6.91±0.18, 13.74±1.15, 20.98±0.14, 23.32±0.21,
23.90±0.35, 25.67±0.41 and 27.38±0.37 and F2-3 fraction were 5.054±0.12, 6.46±0.34,7.18±0.15, 11.63±0.46, 13.5±0.4, 17.16±0.48,23.64±0.63, 26.65±0.29 at the time intervals of0, 4, 8, 12, 24, 36, 48, and 72 h respectively (Fig3b).
CAM Assay
None of the extract concentrations used inthe experiment appeared to be toxic. Nearly all
Fig. 3. All the crude extractions and fractions of methanolicextracts was subjected to VEGF inhibitory activity at a fixedconcentration. Values are Mean ± SD of triplicate values.3a) showing activity against the VEGF, fraction 2-3 is highlyactive in inhibiting the VEGF expression. 3b) indicates frac-tion F2-3 was subjected to VEGF inhibitory activity in atime dependant manner in A-549 cells. 3d showingAntiangiogenic activity of the fraction F2-3 was evaluatedin egg CAM assay, 3c is control egg where vessels are promi-nent whereas 3d was treated with fraction F2-3.
Fig. 4. Methanolic extract fraction F2-3 was subjected to MMP inhibitory activity on A-549 cells and results haveshown that fraction F2-3 reducing the expression of MMP-2 and MMP-9 in a time dependent manner, Fig 4a and Fig4b, respectively.
Current Trends in Biotechnology and PharmacyVol. 3 (4) 396 - 404, October 2009. ISSN 0973-8916

402
Antiproliferative and antiangiogenic effect of L. acuangula
embryos survived for additional 48 h with testcompound on CAMs. In comparison with thecontrols, application of the extracts showedsignificant inhibitory effect on the angiogenesis.Angiogenesis inhibition action of F2-3 at aconcentration of 5 µg/egg substantially inhibitednew blood vessel growth of chick embryos witha clearly avascular zone in CAM (Fig 3d), whileno avascular zones were observed in the controlembryos treated with phosphate buffered saline(Fig 3c).
Effect of L. acutangula on MMP-2 and MMP-9 release
MMP-2 and MMP-9 protein levels weresignificantly reduced compared to the controlcells time dependently. Both, MMP-2 and MMP-9 (Fig 4a & 4b respectively) decreased in thesupernatants of A-549 cells. Reduction in theseprotein levels started form 8 h and continued.
Discussion
An integrated approach for managing apatient with cancer should target the multiplebiochemical and physiologic pathways thatsupport tumour development and minimizenormal-tissue toxicity. Natural health productscontain a wide range of complex organicchemicals that may have synergistic activity.They may inhibit angiogenesis by interactingwith multiple pathways and by acting in otherways that can affect cell signalling. Anti-angiogenic therapy is one of the new approachesto anticancer therapy. At the molecular level,antiangiogenic mechanisms include inhibition ofMMP-2 and MMP-9 and VEGF along with otherfactors such as urokinase plasminogen activatorand repression of AP-1, NFnB and STAT-1transcription factor pathway (25).
Natural products are playing a key role inthe fields of health management and preventionor cure of diseases. Currently 11 angiogenesisinhibitors out of 22 are under clinical trials which
are from natural products indicating theirimportance (26). In this study, the medicinalplant, Luffa acutangula, was selected based onthe literature available in the Ayurveda, an Indiansystem of medicine. The possibility of the use ofthis plant as an anti-tumor agent was examinedby evaluating the two targets that isantiproliferative activity and anti-angiogenicactivity.
Initially, all the crude extracts viz; hexane,methanol and aqueous extracts were evaluatedfor antiprolefarative activity in A-549 cells byMTT assay and it was found that only methanolicextract showed significant antiprolefarativeactivity with IC-50 value of 131.63 µg/ml.Methanolic extract was further fractionated byactivity guided chromatography and it wasobserved that fractions F2 and F2-3 showedsignificant antiprolefarivie activity. Hence,fraction F2-3 was selected to evaluate theantiangiogenic activity. Since, VEGF and MMPplay key role in the promotion of angiogenesis,these parameters were selected to evaluate theantiangiogenic activity and it was furtherconfirmed in vivo by CAM assay.
VEGF is shown to be the most potentangiogenic factor (6). The availability of specificmonoclonal antibodies capable of inhibitingVEGF-induced angiogenesis in vivo and in vitromade it possible to generate direct evidence forthe role of VEGF in tumorgenesis (27). Theresults obtained in the present study demonstratedthat the expression of VEGF was reduced in atime-dependent manner by fraction F2-3. Matrixmetallo-proteinases (MMPs), a family of zinc-dependent endopeptidases, play a crucial role inECM degradation associated with tissue repair,cancer cell invasion, metastasis and angiogenesis.Among members of the MMP family, MMP-2(gelatinase-A) and MMP-9 (gelatinase-B) areparticularly up-regulated in malignant tumors(mmp-2 pcr.pdf). L .acutangula methanolic
Current Trends in Biotechnology and PharmacyVol. 3 (4) 396 - 404, October 2009. ISSN 0973-8916

403
B.P. Reddy et al
fraction F2-3 showed significant inhibition onMMP-2 and MMP-9 indicating the effective roleof extract in the prevention of angiogenesis.Finally, antiangiogenic activity of the L.actangula was confirmed by CAM assay. Eggstreated with fraction F2-3 showed clear avascularzones compared to control or PBS treated eggs.All extractions and fractions showedangiogenesis inhibitory activity in dose and timedependent manner, after certain concentrationsactivity showed intact because it may becompounds present in the extractions andfractions acting against the activity.
Conclusion
L. acutangula methanolic extract fraction(F2-3) showed significant antiproliferative andantiangiogenic activity and further studies arerequired to elucidate the molecular mechanismof the fraction. Hence, this fraction may be fur-ther fractionated and purified to isolate and char-acterize the active compound.
Acknowledgments
BPR thanks Council of scientific and in-dustrial research (CSIR), New Delhi for provid-ing research fellowship. Authors acknowledgeMr. Mubarak Ali for providing cell lines.
References1. 1. Folkman, J. (1972). Anti-angiogenesis:
a new concept for therapy of solid tumours.Ann. Surg., 175: 409–16.
2. Ferrara, N. (2002). Role of vascular en-dothelial growth factor in physiologic andpathologic angiogenesis: therapeutic impli-cations, Semin. Oncol., 29: 10–14.
3. Roccaro, A.M., Russo, F., Cirulli, T., DiPietro, G., Vacca, A. and Dammacco, F.(2005). Antiangiogenesis for rheumatoidarthritis, Curr. Drug Targets Inflamm.Allergy, 4: 27– 30.
4. Smith, L.E. (2004). Pathogenesis ofretinopathy of prematurity, Growth HormIGF Res., 14 (Suppl. A): S140–S144.
5. Lashkari, K., Hirose, T., Yazdany, J.,McMeel, J.W., Kazlauskas, A. and Rahimi,N. (2000). Vascular endothelial growthfactor and heapocyte growth factor levelsare differentially elevated in patients withadvanced retinopathy of prematurity, Am.J. Pathol., 156: 1337–1344.
6. Ferrara N. And Davis-Smith, T. (1997).The biology of vascular endothelial growthfactor. Endocr. Rev., 18: 4 -25.
7. Muller, Y.A., Christinger, H.W., Keyt, B.A.and de Vos, A.M. (1997). The crystal struc-ture of vascular endothelial growth factor(VEGF) refined to 1.93 A resolution: mul-tiple copy flexibility and receptor binding.Structure, 5: 1325– 1338.
8. Van Meir, E.G., Polverini, P.J., Chazin,V.R., Su Huang, H.J., de Tribolet, N. andCavenee, W.K. (1994). Release of an in-hibitor of angiogenesis upon induction ofwild type p53 expression in glioblastomacells. Nat. Genet., 171–176.
9. Kieser, A., Weich, H.A., Brandner, G.,Marme, D. and Kolch, W. (1994). Mutantp53 potentiates protein kinase C inductionof vascular endothelial growth factorexpression. Oncogene, 9: 963–969.
10. Linderholm, B.K., Lindahl, T., Holmberg,L., Klaar, S., Lennerstrand, J., Henriksson,R. and Bergh, J. (2001). The expression ofvascular endothelial growth factor corre-lates with mutant p53 and poor prognosisin human breast cancer. Cancer. Res,, 61:2256–2260.
11. Narendran, A., Ganjavi, H., Morson, N.,Connor, A., Barlow, J.W., Keystone, E.,Malkin, D. and Freedman, M.H. (2003).
Current Trends in Biotechnology and PharmacyVol. 3 (4) 396 - 404, October 2009. ISSN 0973-8916

404
Antiproliferative and antiangiogenic effect of L. acuangula
Mutant p53 in bone marrow stromal cellsincreases VEGF expression and supportsleukemia cell growth. Exp. Hematol., 31:693–701.
12. Imper, V. and Van Wart, H.E. (1998).Substrate specificity and mechanisms ofsubstrate recognition of the matrixmetalloproteinases. In: Parks W.C, MechamR.P, editors. Matrix Metalloproteinases. SanDiego, Academic Press, pp. 219–242.
13. Kleiner, D.E and Stetler-Stevenson,W.G.(1999). Matrix metalloproteinases andmetastasis. Cancer Chemother. Pharmacol.,43 (Suppl): S42–S51.
14. Mehta, P.B., Jenkins, B.L., McCarthy, L.,Thilak, L., Robson, C.N., Neal, D.E. andLeung, H.Y. (2003). MEK5 overexpressionis associated with metastatic prostate can-cer, and stimulates proliferation, MMP-9expression and invasion. Oncogene, 22:1381–1389.
15. Takaha, N., Resar, L.M,, Vindivich, D. andCoffey, D.S. (2004). High mobility groupprotein HMGI(Y) enhances tumor cellgrowth, invasion, and matrixmetalloproteinase-2 expression in prostatecancer cells. Prostate, 60: 160–167.
16. Tariq, A., Bhat and Rana P. Singh. (2008).Tumor angiogenesis – A potential target incancer chemoprevention. Food. Chem.Toxicol., 46:1334–1345.
17. Ahn, E.K., Jeon, H.J., Lim, E.J., Jung, H.J.and Park, E.H. (2007). Anti-inflammatoryand ntiangiogenic activities of Gastrodiaelata Blume. J. Ethnopharmacol., 110: 476–482.
18. Jung, H.J., Kang, H.J., Song, Y.S., Park,E.H., Kim, Y.M. and Lim, C.J. (2008).Antiinflammatory, anti-angiogenic andanti-nociceptive activities of Sedum
sarmentosum extract. J. Ethnopharmacol.,116: 138–143.
19. Wang, H. and Ng, T.B. (2002). Luffangulin,a novel ribosome inactivating peptide fromridge gourd (Luffa acutangula) seeds. J.Life. Sci., 11: 899-906.
20. Reddy, B.S., Reddy, B.P., Raghavulu, S.V.,Ramakrishna. S., Venkateswarlu, Y. andDiwan, P.V. (2008). Evaluation of antioxi-dant and antimicrobial properties ofSoymida febrifuga leaf extracts. Phytother.Res., 22: 943-7.
21. Sofowora, A. (1993). Medicinal Plants andTraditional Medicines in Africa. Chiches-ter John Wiley & Sons New York, pp 97- 145.
22. Trease, A. and Evans, W.C. (1989). Treaseand Evans Pharmacognosy (13th ed.),Bailiere Tindall, London.
23. Harbone, J. B. (1983). In: J.B Harbone,Phytochemical methods, A Guide to Mod-ern Techniques of Plant Analysis, Chapmanand Hall, London.
24. Blebea, J., Mazo, J.E., Kihara, T.K., Vu,J.H., McLaughlin, P.J., Atnip, R.G. andZagon, I.S. (2000). Opioid growth factormodulates angiogenesis. J. Vasc. Surg. 32:364–373.
25. Garbisa, S., Sartor, L., Biggin, S., Salvato,B., Benelli, R. and Albini, A. (2001). Tumorgelatinases and invasion inhibited by thegreen tea flavanol epigallocatechin-3-gal-late. Cancer., 91(4): 822-32.
26. Sayed, E.l. (2005). Natural products as an-giogenesis modulators. Mini. Rev. Med.Chem. 5(11): 971-93.
27. Kim KJ, Li B, Houck K, Winer J. andFerrara N. (1992). The vascular endothelialgrowth factor proteins: identification ofbiologically relevant regions by neutralizingmonoclonal antibodies. Growth Factors 7:53-64.
Current Trends in Biotechnology and PharmacyVol. 3 (4) 396 - 404, October 2009. ISSN 0973-8916

405
Production of glucooligosacchairdes by glucan hydrolysis
AbstractThe glucan composed of α -(1→6)
linkages with α -(1→3) and α -(1→4) branchedlinkages points was produced from Leuconostocmesenteroides NRRL B-742. The glucan washydrolysed by acid using microwave oven forproduction of gluco-oligosaccharides for timeintervals of 2 min and 3 min and the optimumtime period for oligosaccharide production wasdetermined. The yield of oligosaccharidesproduction from glucan was 2.5% for 2 min ofhydrolysis time. The hydrolysed glucan was runon Sephadex G-10 column using FPLC andoligosaccharides produced were eluted andanalyzed by MALDI Q-TOF mass spectrometerin MS/MS mode. The glucan sample hydrolysedby microwave for 2 min yielded the peak at ~527m/z value showing the presence of 3 glucose units(m/z ~180) corresponding to the glucooligo-saccharide with degree of polymerisation 3.
Key words: Glucansucrase, Leuconostocmesenteroides, Glucan, Gluco-oligosaccharide,MALDI-TOF.
IntroductionLactic acid bacteria produce a wide variety
of exopolysaccharides that have nutritional andhealth applications (1). In addition to
Gluco-oligosaccharides production from glucan of Leuconostocmesenteroides NRRL B-742 by microwave assisted hydrolysis
Avishek Majumder1, Anshuma Mangtani, Seema Patel,Rishikesh Shukla and Arun Goyal*
Department of Biotechnology, Indian Institute of Technology GuwahatiGuwahati 781 039, Assam, India
1Present address: Department of System Biology, Enzyme and Protein Chemistry Group, Technical University ofDenmark, Building 224, DK-2800 Kgs. Lyngby, Denmark
*For correspondence - [email protected]
heteropolysaccharides lactic acid bacteriaproduce homopolysaccharides which containonly one type of monosaccharide, fructose orglucose called fructans and glucans, respectively.Most of the glucans share the feature of beingsynthesized by extracellular glucansucrases usingsucrose as the glucosyl or fructosyl donor. Glucansynthesis in lactic acid bacteria has been mainlystudied from Leuconostoc spp. (2-4). Glucans areused as viscosifying, stabilizing, emulsifying,sweetening, gelling, or water-binding agents, inthe food as well as in the non-food industries(5,6). The biological importance ofoligosaccharides is increasing rapidly. Certainoligosaccharides (e.g. fructooligosaccharides,isomaltooligosaccharides and lactulose) andpolysaccharides (e.g. fructans) are used asprebiotic foods (7,8). Prebiotics are nondigestiblefood ingredient that beneficially affects the hostby selective stimulation of growth and activityof one or a number of bacteria including probioticbacteria in the colon. Other applications foroligosaccharides such as an anticariogenic agentor a low-sweetness humectant have been explored(8). Prebiotic oligosaccharides arenoncarcinogenic, nondigestible and low calorificcompounds stimulating the growth anddevelopment of gastrointestinal microfloradescribed as probiotic bacteria such as
Current Trends in Biotechnology and PharmacyVol. 3 (4) 405 - 411, October 2009. ISSN 0973-8916
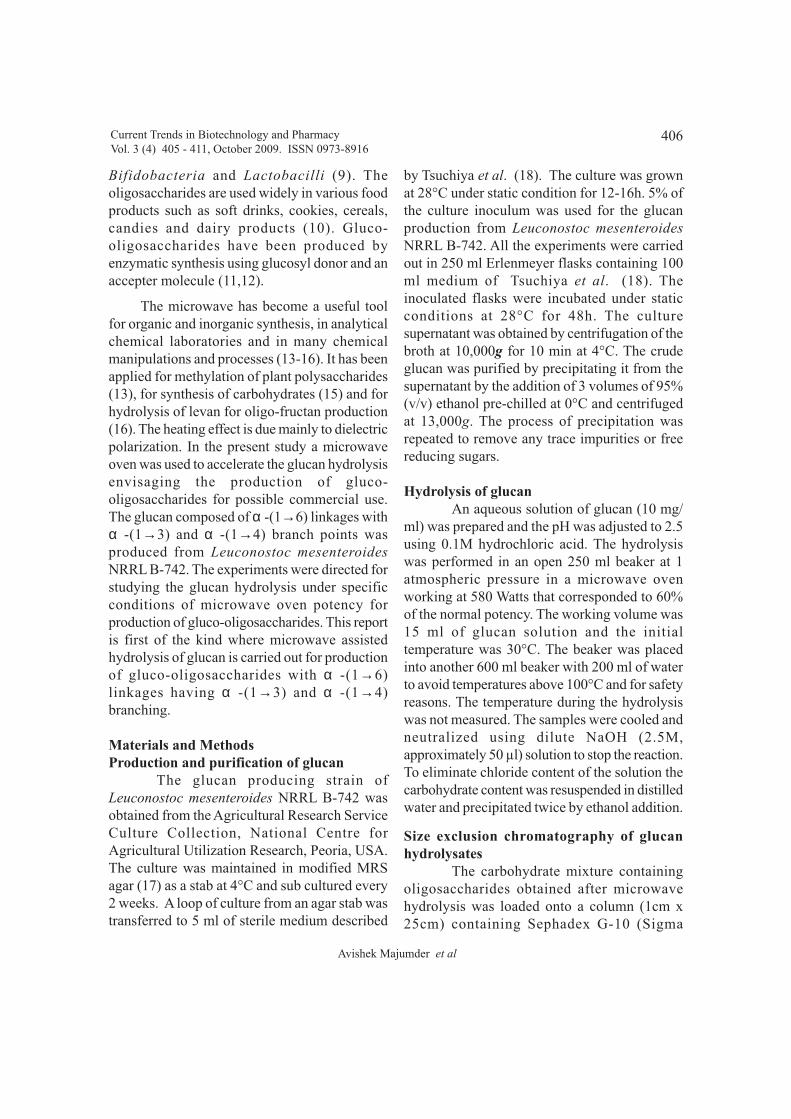
406
Avishek Majumder et al
Bifidobacteria and Lactobacilli (9). Theoligosaccharides are used widely in various foodproducts such as soft drinks, cookies, cereals,candies and dairy products (10). Gluco-oligosaccharides have been produced byenzymatic synthesis using glucosyl donor and anaccepter molecule (11,12).
The microwave has become a useful toolfor organic and inorganic synthesis, in analyticalchemical laboratories and in many chemicalmanipulations and processes (13-16). It has beenapplied for methylation of plant polysaccharides(13), for synthesis of carbohydrates (15) and forhydrolysis of levan for oligo-fructan production(16). The heating effect is due mainly to dielectricpolarization. In the present study a microwaveoven was used to accelerate the glucan hydrolysisenvisaging the production of gluco-oligosaccharides for possible commercial use.The glucan composed of α -(1→6) linkages withα -(1→3) and α -(1→4) branch points wasproduced from Leuconostoc mesenteroidesNRRL B-742. The experiments were directed forstudying the glucan hydrolysis under specificconditions of microwave oven potency forproduction of gluco-oligosaccharides. This reportis first of the kind where microwave assistedhydrolysis of glucan is carried out for productionof gluco-oligosaccharides with α -(1→6)linkages having α -(1→3) and α -(1→4)branching.
Materials and MethodsProduction and purification of glucan
The glucan producing strain ofLeuconostoc mesenteroides NRRL B-742 wasobtained from the Agricultural Research ServiceCulture Collection, National Centre forAgricultural Utilization Research, Peoria, USA.The culture was maintained in modified MRSagar (17) as a stab at 4°C and sub cultured every2 weeks. A loop of culture from an agar stab wastransferred to 5 ml of sterile medium described
by Tsuchiya et al. (18). The culture was grownat 28°C under static condition for 12-16h. 5% ofthe culture inoculum was used for the glucanproduction from Leuconostoc mesenteroidesNRRL B-742. All the experiments were carriedout in 250 ml Erlenmeyer flasks containing 100ml medium of Tsuchiya et al. (18). Theinoculated flasks were incubated under staticconditions at 28°C for 48h. The culturesupernatant was obtained by centrifugation of thebroth at 10,000g for 10 min at 4°C. The crudeglucan was purified by precipitating it from thesupernatant by the addition of 3 volumes of 95%(v/v) ethanol pre-chilled at 0°C and centrifugedat 13,000g. The process of precipitation wasrepeated to remove any trace impurities or freereducing sugars.
Hydrolysis of glucanAn aqueous solution of glucan (10 mg/
ml) was prepared and the pH was adjusted to 2.5using 0.1M hydrochloric acid. The hydrolysiswas performed in an open 250 ml beaker at 1atmospheric pressure in a microwave ovenworking at 580 Watts that corresponded to 60%of the normal potency. The working volume was15 ml of glucan solution and the initialtemperature was 30°C. The beaker was placedinto another 600 ml beaker with 200 ml of waterto avoid temperatures above 100°C and for safetyreasons. The temperature during the hydrolysiswas not measured. The samples were cooled andneutralized using dilute NaOH (2.5M,approximately 50 µl) solution to stop the reaction.To eliminate chloride content of the solution thecarbohydrate content was resuspended in distilledwater and precipitated twice by ethanol addition.
Size exclusion chromatography of glucanhydrolysates
The carbohydrate mixture containingoligosaccharides obtained after microwavehydrolysis was loaded onto a column (1cm x25cm) containing Sephadex G-10 (Sigma
Current Trends in Biotechnology and PharmacyVol. 3 (4) 405 - 411, October 2009. ISSN 0973-8916
407
Chemical Co., St. Louis, USA). The hydrolysedfractions containing oligosaccharides were freezedried and dissolved in 50 mM sodium phosphatebuffer pH 7.0 and 500 µl sample each of 100 mg/ml were loaded on a Sephadex G-10 column. 1ml fractions were eluted using the same buffer ata flow rate of 0.1 ml/min on FPLC (GEHealthcare, model AktaPrime). The fractionscontaining oligosaccharides were pooled. Thetotal carbohydrate content of hydrolyzed wasdetermined by phenol sulfuric acid method of Fox& Robyt, 1991 (19) using glucose as the standard.The pooled fractions were lyophilized for furtheranalysis.
Estimation of glucan and glucooligo-saccharides
The carbohydrate content before andafter hydrolysis of glucan was determined byphenol-sulfuric acid method of Dubois et al.,1956 (20) in a micro titer plate as described byFox & Robyt, 1991 (19). To 0.025 ml of sampleon a microtitre plate, 0.025 ml of 5% (w/v) phenolwas added. The plate was mixed at slow speedon a vortex mixer for 30s. The plate was thenplaced onto ice bath and 0.125 ml of concentratedsulfuric acid was added to each well containingthe sample and phenol. The plate was again mixedusing vortex mixer for 30 s and then incubatedin water bath at 80°C for 30 min. It was thencooled and the absorbance was read at 490 nmon a microplate reader (BioRad, model 680).Standard curve was prepared using dextran (10kDa, Amersham) in the concentration range 0.1-1 mg/ml.The concentration of glucan and oligosaccharideswas calculated as follows:
∆ A490
x CGlucan concentration (mg/ml) = ———— = (mg/ml)
vC = 1 OD equivalent of glucan from standard plot ∆ A
490 = change in absorbance of the samplev = volume of the sample
Oligosaccharide analysis by massspectrometry
Mass spectrometry was performed on aMALDI Q-TOF Premier mass spectrometer(Waters). The mass spectrometer was operatedin negative ion mode and prior to analysis wascalibrated over the range 50–1000 m/z usingglucose, sucrose and raffinose (Himedia, India).Mass spectra were acquired manually over them/z range 100–1000. In MS/MS mode, precursorions were isolated using MS (quadrupole) andfragmented in an argon filled collision cell(4 x 10⁻³ mbar). MS/MS data were acquired withthe collision energy adjusted in such a way thatthe majority of the precursor ion was attenuated.Collision energies used were typically between50eV and 100 eV.
Results and DiscussionMirowave hydrolysis of glucan and sizeexclusion chromatography analysis
Leuconostoc mesenteroides NRRL B-742 was selected for the production ofoligosaccharides as the glucan produced by thisstrain contains 50% main chain α (1→6) and rest50% α (1→3) and α (1→4) branched linkagesthat are of single glucose residues (21). This givesa structure with glucose branch on every glucoseresidue in the α (1→6) linked main chains. Thisstructure has been described as a bifurcated combdextran. The α (1→6) linked glucose residues inthe main chain are the back bone of the comband α (1→3) linked single branched glucoseresidues are the teeth of the comb (21). Thehydrolysis of this polymer would yield oligomerswith α (1→3) or α (1→4) branches.
The glucan from Leuconostocmesenteroides NRRL B-742 was produced andpurified by alcohol precipitation. The purifiedglucan samples (10 mg/ml) were subjected tohydrolysis in a microwave oven for 2 and 3 mintime intervals. The hydrolysed glucan sampleswere freeze dried and dissolved in 50 mM sodium
Production of glucooligosacchairdes by glucan hydrolysis
Current Trends in Biotechnology and PharmacyVol. 3 (4) 405 - 411, October 2009. ISSN 0973-8916

408
Avishek Majumder et al
phosphate buffer pH 7.0 and 500 µl sample eachof 100 mg/ml were loaded on Sephadex G-10column connected to FPLC. The fractions (1 ml)were eluted using the same buffer at a flow rateof 0.1 ml/min. Fig. 1 shows the elution profile ofthe microwave hydrolysates obtained by after 2and 3 min. The increase in hydrolysis time ofglucan increased the fragmentation of thepolysaccharide glucan and thus reduction in thecarbohydrate content. The elution ofcarbohydrate fractions from column for the 3 minhydrolysed sample occurred later (Fig. 1B). Thefractions 4 and 5 from 2 min hydrolysed sampleand the fractions 6 and 7 from 3 min hydrolysedsample were pooled separately and the totalcarbohydrate content was determined usingphenol-sulphuric acid method. The Fig. 2 showsthe total carbohydrate content obtained aftermicrowave hydrolysis of glucan for 2 min and 3min. The 2 min hydrolysis fraction pool showedmore carbohydrate content than the 3 min pooledfraction (Fig. 2). The 15 ml of glucan solution(10 mg/ml) was partially converted tooligosaccharides and the yield was 2.5% for 2min of hydrolysis time. For 3 min hydrolysis theglucan might have been over hydrolysed to evenglucose break down products or more elementalforms as shown by mass spectrometry.
Oligosaccharide analysis by massspectrometry
The pooled fractions fromchromatography were analysed by massspectrometer. The mass spectrometer wasoperated in negative ion mode and prior toanalysis was calibrated over the m/z range 50-1000 using glucose, sucrose and raffinose (Fig.3). The MALDI-TOF MS peaks for standardswere obtained at following m/z values: glucose,179.0149; sucrose, 341.0426; raffinose,503.0623. The MALDI-TOF-MS of fraction 2revealed [M+Na]+ pseudomolecular ions at m/z527.1527 corresponding to Hex
3 that was
A
B
Fig. 1. Elution profiles of carbohydrates (concentration inmg/ml) from Sephadex G-10 column of glucan samples (10mg/ml) run after microwave hydrolysis for a) 2 min; b) 3min.
Fig. 2. Carbohydrate content (concentration in mg/ml) ob-tained after elution from Sephadex G-10 column after mi-crowave hydrolysis of glucan samples for 2 and 3 min.
Current Trends in Biotechnology and PharmacyVol. 3 (4) 405 - 411, October 2009. ISSN 0973-8916
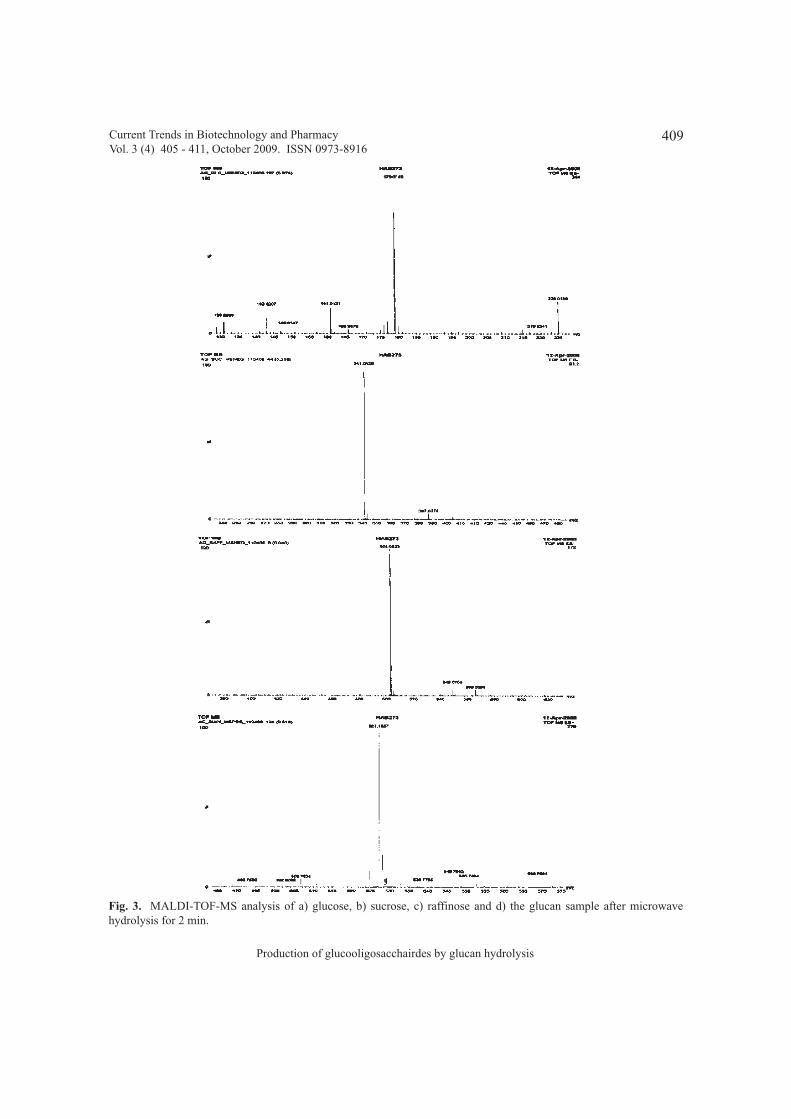
409
Production of glucooligosacchairdes by glucan hydrolysis
Fig. 3. MALDI-TOF-MS analysis of a) glucose, b) sucrose, c) raffinose and d) the glucan sample after microwavehydrolysis for 2 min.
Current Trends in Biotechnology and PharmacyVol. 3 (4) 405 - 411, October 2009. ISSN 0973-8916
410
Avishek Majumder et al
comparable to molecular weight of raffinose orthree times molecular weight of glucose (Fig.3C). Thus the degree of polymerization (DP) ofthe 2 min hydrolysed glucan was 3. This alsoshowed that glucan hydrolysed for 2 min gaveonly one type of gluco-oligosaccharides withDP3. In mass spectrum of the sample hydrolysedfor 3 min, multiple peaks were obtained alongwith one prominent peak at 186 m/z value (datanot shown) showing the breakdown of glucan tomonomer glucose. No other conclusions formultiple peaks could be drawn as mass spectrumwas not interpretable.
The peak was obtained at ~527 m/z valueusing MALDI-TOF-MS showed presence of 3Glucose units of (m/z ~180). A degree ofpolymerisation of 3 (DP-3) for theoligosaccharide was obtained for the glucansample hydrolysed for 2 min. Enzymaticsynthesis of gluco-oligosacchairde iscumbersome and not feasible on industrial scalewhereas the microwave is able to reduce thereaction times from hours to minutes and can beapplied on large scale. The use of microwaveoven in the glucan hydrolysis leads toconsiderable reduction in the hydrolysis time. Theoptimum time period for gluco-oligosaccharidefrom glucan was determined. The results allowone to infer that the procedure may be useful foroligosaccharide production from anypolysaccharide. Further studies are in progressto find exactly the optimum time period for eacholigomer and their identification and linkages.For the purpose of production of other gluco-oligosaccharides it is worthwhile to experimentwith other hydrolysis time periods, effect of pHand microwave potency.
Acknowledgements
The research work in part was supportedby a project grant from Department ofBiotechnology, Ministry of Science and
Technology, New Delhi, India to AG. AM, SPand RS are supported by PhD fellowships fromIndian Institute of Technology Guwahati throughMinistry of Human Resource Development,Government of India.
References1. Purama, R.K. and Goyal, A. (2005).
Dextransucrase production by Leuconostocmesenteroides. Indian J. Microbiol., 2, 89-101.
2. Monsan, P.F., Bozonnet, S., Albenne, C.,Joulca, G., Willemot, R.M. and Remaud-Simeon, M. (2001). Homopolysaccharidesfrom lactic acid bacteria. Int. Dairy J., 11,675-685.
3. Majumder, A., Singh, A. and Goyal, A.(2009). Application of response surfacemethodology for glucan production fromLeuconostoc dextranicum and its structuralcharacterization. Carbohydr. Polym., 75,150-156.
4. Purama, R.K., Goswami, P., Khan, A.T. andGoyal, A. (2009). Structural analysis andproperties of dextran produced byLeuconostoc mesenteroides NRRL B-640.Carbohydr. Polym., 76, 30-35.
5. Sutherland, I.W. 1998. Novel and establishedapplications of bacterial polysaccharides.Trends Biotechnol., 16, 41–46.
6. Welman, A.D. and Maddox, I.S. (2003).Exopolysaccharides from lactic acid bacteria:perspectives and challenges. TrendsBiotechnol., 21, 269-274.
7. Kennedy, J.F., Stevenson, D.L., White, C.A.and Viikari, L. (1989). The chromatographicbehaviour of a series offructooligosaccharides derived from levanproduced by the fermentation of sucrose byZymomonas mobilis. Carbohydr. Polym., 10,103-113.
Current Trends in Biotechnology and PharmacyVol. 3 (4) 405 - 411, October 2009. ISSN 0973-8916
411
Production of glucooligosacchairdes by glucan hydrolysis
8. Chung, C.H. and Day, D.F. (2002). Gluco-oligosaccharides from Leuconostocmesenteroides B-742 (ATCC 13146): Apotential prebiotic. J. Ind. Microbiol.Biotechnol., 29, 196-199.
9. Kubik, C., Sikora, B. and Bielecki, S. (2004).Immobilization of dextransucrase and its usewith soluble dextranase forglucooligosaccharides synthesis. EnzymeMicrob. Technol. 34, 555-560.
10. Barreteau, H., Delattre, C. and Michaud, P.(2006). Production of oligosaccharides aspromising new food additive generation.Food Technol. Biotechnol. 44, 323-333.
11. Monsan, P. and Paul, F. (1995). Enzymaticsynthesis of oligosaccharides. FEMSMicrobiol. Rev., 16, 187-192.
12. Iliev, I., Vassileva, T., Ignatova, C., Ivanova,I., Haertlé, T., Monsan, P. and Chobert, J.M.(2008). Gluco-oligosaccharides synthesizedby glucosyltransferases from constitutivemutants of Leuconostoc mesenteroides strainLm28. J. Appl. Microbiol., 104, 243-250.
13. Singh, V., Tiwari, A., Tripathi, D.N. andMalviya, T. (2003). Microwave promotedmethylation of plant polysaccharides.Tetrahedr. Lett., 44, 7295-7297.
14. Corsaro, A., Chiacchio, U., Pistara, V. andRomeo, G. (2004). Microwave assistedchemistry of carbohydrates. Curr. Org.Chem., 8, 511-538.
15. Das, S.K. (2004). Application of microwaveirradiation in the synthesis of carbohydrates.Syn Lett., 6, 915–932.
16. dePaula, V.C., Pinheiro, I.O., Lopes, C.E. andCalazans, G.C. (2008). Microwave-assistedhydrolysis of Zymomonas mobilis levanenvisaging oligofructan production.Bioresour. Technol., 99, 2466-2470.
17. Goyal, A. and Katiyar, S.S. (1996).Regulation of dextransucrase productivityfrom Leuconostoc mesenteroides NRRL B-512F by the maintenance media. J. Gen.Appl. Microbiol., 42, 81-85.
18. Tsuchiya, H.M., Koepsell, H.J., Corman, J.,Bryant, G., Bogard, M.O., Feger, V.H. andJackson, R.W. (1952). The effect of certaincultural factors on production ofdextransucrase by Leuconostocmesenteroides. J. Bacteriol., 64, 521-527.
19. Fox, J.D. and Robyt, J.F. (1991).Miniaturization of three carbohydrateanalyses using a microsample plate reader.Anal. Biochem. 195, 93-96.
20. Dubois, M., Gilles, K.A., Hamilton, J.K.,Rebers, P.A. and Smith, F. (1956).Colorimetric method for determination ofsugars and related substances. Anal. Chem.,28, 350-356.
21. Robyt, J.F. (1995). Mechanism in theglucansucrase synthesis of polysaccharidesand oligosaccharides from sucrose. Adv.Carbohydr. Chem. Biochem., 51, 133-168.
Current Trends in Biotechnology and PharmacyVol. 3 (4) 405 - 411, October 2009. ISSN 0973-8916
412
Adsorption studies on surface of Citrus lemonii
Abstract The adsorption of organic dyes like congo
red and methylene blue on Citrus lemonii usingbatch adsorption process has been investigated.The effect of certain parameters on adsorptionhas been studied. Applicability of Freundlichadsorption isotherm and Langmuir isotherm hasalso been tested.
Keywords: Adsorption, Congo red, Methyleneblue, Citrus lemonii.
IntroductionTechniques for removal of colour from
waste water include biological treatment,coagulation, floatation, oxidation, hyperfiltrationand adsorption. Adsorption on to granulatedactivated carbon or powdered activated carbonis widely practiced, particularly for the organics,which are not easily broken down by biologicaltreatment and by other methods. The technologyfor manufacturing good quality activated carbonis still cost-prohibitive and regeneration of theused carbon is often problematic. This hasprompted the use of many novel materials asadsorbents with a two fold objective to replaceactivated carbon with cheaper alternatives andto utilize various waste products for the purpose(1,2). Plant materials are used as a cheap andlow cost material for adsorption,for example,modified corn starch (3), modified onion skins(4), saw dust (5), phosphate treated saw dust
(6),water lettuce (7), Alterneuthera triandra(8),Citrus aurantium(9), Musa paradiasca(10),Achras sapota (11) etc. In the present study,it is demonstrated that fine charcoal powderobtained from Citrus lemonii can be a suitablealternative to activated carbon for treatingcoloured effluents.
Materials and MethodsCongo red was supplied by S.D.Fine
Chemicals Ltd., Mumbai,Methylene blue wassupplied by Qualigens Ltd., Mumbai. TheseChemicals were used without further purification.The synthetic effluent solutions were made bydissolving the required amount of dye in doubledistilled water. Lemon fruit peels were collectedand washed repeatedly with water to remove dustand soluble impurities and were allowed to dryat room temperature in a shade and then in an airoven at 333-3430 K for a long time till the peelsbecome completely dry and crisp. Then peelswere burned in presence of incomplete oxygento peel charcoal powder. The adsorptionexperiments were carried out in a batch processby using aqueous solutions of the dye in a fixedconcentration range. The other variableparameters were adsorbent dose, contact time (1-5 hrs) and pH of the medium (2.0-10.0). In eachexperiment, an accurately weighed amount ofpeel charcoal powder was added to a fixedvolume of the dye solution in a 100 ml conical
Adsorption Studies of Congo Red and MethyleneBlue on theSurface of Citrus lemonii
Y. Rajendra Prasad 1, V. Shankarananth *, K. K. Rajasekhar 2, G. Lingeswara Goud2, and V. Harichandana2
1Department of Pharmaceutical Sciences, Andhra University, Visakhapatnam, A.P., India.2Department of Pharmaceutical Chemistry, Sri Padmavathi School of
Pharmacy, Tiruchanoor, Tirupathi-517503, India*For correspondence - [email protected]
Current Trends in Biotechnology and PharmacyVol. 3 (4) 412 - 416, October 2009. ISSN 0973-8916
413
Prasad et al
flask and the mixture was agitated on athermostatic magnetic stirrer for a given lengthof time at a fixed temperature. The mixture wascentrifuged rapidly and the dye remainingunadsorbed was determined spectrophotometrically (Elico-SL 180). The concentrationswere determined with the help of carefullyprepared calibration curves with standard dyesolutions and the amount adsorbed was found bymass balance procedure.
Results and DiscussionAdsorption at a surface largely the result of
binding forces between the individual atoms,ionsor molecules of an adsorptive and the surface,all of these forces having their origin inelectromagnetic interactions. The net dispersion,electrostatic,chemisorptive and functional groupinteractions broadly define the affinity of anadsorbent for a specific adsorption. A number ofparameters, specific to a given system,affectadsorption. With respect to the adsorptive, thesefactors are concentration, molecular weight,molecular size,molecular structure, molecularpolarity, steric form or configuration and thenature of background or competitive adsorption.The important characteristics of the adsorbent thatdetermine equilibrium capacity and rate, are thesurface area, the physio-chemical nature of thesurface, the availability of that surface toadsorptive molecules or ions, the physical sizeand form of the adsorbent particles. Systemparameters such as temperature and pH can alsomarkedly influence adsorption to the extent thatthey effect changes in any one or more of theabove mentioned parameters.
Effect of contact timeIt was observed that Citrus lemonii peels
can be used as low cost adsorbent effectively. Themaximum time required for 25 to 42% adsorptionof congo red is 1 hr.The contact time has littleimpact on adsorption of congo red (42 to 65%)on peel charcoal powder.The maximum time
required for 65 to 77% adsorption of methyleneblue is 1 hr. The contact time has positive impacton adsorption of methylene blue (77 to 99%) onpeel charcoal powder (Tables. 1and 2). In bothcases, the effect of contact time on adsorptioncontinued even after 1 hr.
Effect of pHThe pH of the medium does not have much
effect on adsorption of congo red on peel charcoalpowder. Thus as the pH of the medium changesfrom 2.0 to 10.0, the adsorption of dye oscillatesbetween 79 to 86%.This is contrary to what otherworkers have observed for adsorption of the basicdye on a variety of adsorbents where the pH wasshown to have a positive influence (12). It islikely that the surfaces of peel charcoal powderparticles are neither acidic nor basic and congored seems to have equal preference for theadsorption sites at all pH values. Thus theadsorption can be carried out without a controlof the pH. Almost similar observations have beenrecorded with the Methylene blue.
Adsorption equilibriumThe adsorption process was described by
the following isotherms:
Freundlich adsorption isotherm:qc= k
fcne
Langmuir isotherm:Ce/q
e=(1/k
d)c
1+(1/b)C
e
Ce is the equilibrium adsorptive
concentrations in aqueous phase, qc is the amount
of dye adsorbed on unit mass of peel charcoalpowder, n and k
f are Freundlich constants,c
1 and
kd are Langmuir constants.
The linear Freundlich and Langmuir plotsare obtained by plotting log q
c vs logc
e and c
e/q
e
vs ce,respectively,from which adsorption
constants are evaluated.A further analysis of the Langmuir equation
was made on the basis of a dimensionlessequilibrium parameter R
l.
Rl=1/(1+k
dC
ref)
Current Trends in Biotechnology and PharmacyVol. 3 (4) 412 - 416, October 2009. ISSN 0973-8916

414
Adsorption studies on surface of Citrus lemonii
Cref
is any equilibrium liquid phaseconcentration of the solute.The range 0<R
l<1
reflects favourable adsorption.With both congored and methylene blue,excellent fit withFreundlich isotherm and Langmuir isotherms areobtained. The values of the adsorptioncoefficients are given in (Table. 3).
AcknowledgementsThe authors are thankful to Smt. P.
Sulochana, Correspondent, Sri Padmavathi groupof educational institutions, Tirupathi forproviding facilities to carry out this work.
Table 1. Effect of contact time on adsorption of Congo red on peel charcoal powder at 300 K.(DyeConcentration 40 mg/dm3).
Contact time(min) Amount adsorbed (%) for peel charcoal powder dose of
2 gm dm-3 4 gm dm-3 6 gm dm-3 8 gm dm-3 10 gm dm-3
60 25.6 30.1 34.9 37.7 41.2
90 29.4 32.9 36.7 40.9 44.6
120 32.3 35.5 39.8 43.7 47.1
150 35.5 39.7 43.3 46.5 49.6
180 38.2 41.9 44.1 47.9 51.3
210 41.1 44.2 47.7 51.9 54.7
240 44.5 47.9 50.2 53.9 57.9
270 47.1 51.4 54.7 57.9 60.7
300 50.2 53.4 56.9 59.1 63.2
Current Trends in Biotechnology and PharmacyVol. 3 (4) 412 - 416, October 2009. ISSN 0973-8916

415
Prasad et al
Table 2. Effect of contact time on adsorption of Methylene blue on peel charcoal powder at 300 K.(Dye Concentration 40 mg/dm3).
Contact time Amount adsorbed (%) for peel charcoal powder dose of
(min) 2 gm dm-3 4 gm dm-3 6 gm dm-3 8 gm dm-3 10 gm dm-3
60 65.3 68.9 71.6 74.3 76.2
90 67.5 71.6 74.8 77.9 80.2
120 69.8 72.9 75.2 78.8 83.8
150 73.5 76.7 79.2 83.1 86.2
180 75.5 78.8 82.8 86.7 89.1
210 77.7 81.9 84.5 88.2 92.8
240 80.2 83.1 86.2 89.1 94.9
270 83.1 86.5 89.2 93.1 96.2
300 86.3 89.2 93.4 95.5 98.8
Current Trends in Biotechnology and PharmacyVol. 3 (4) 412 - 416, October 2009. ISSN 0973-8916
Table 3. Freundlich and Langmuir Adsorption co-efficients for the adsorption of congo red on peelcharcoal powder (PCP) at 300 K.
PCP dose Freundlich Constants Langmuir Constants (gm dm-3)
n Kf(dm3g-1) C
1(dm3g-1) K
d(mg g-1) R
L
2 0.55 8.31 0.31 38.32 0.072
4 0.47 6.35 0.23 28.43 0.075
6 0.57 4.21 0.26 24.34 0.082
8 0.47 3.12 0.35 15.43 0.061
10 0.43 2.50 0.39 12.85 0.067
Mean 0.498 4.898 0.308 23.874 0.0714
416
Adsorption studies on surface of Citrus lemonii
Current Trends in Biotechnology and PharmacyVol. 3 (4) 412 - 416, October 2009. ISSN 0973-8916
References
1. Namasivayam, C. and Yamuna, R.T. (1992).Removal of Congo red from aqueoussolution by biogass slurry. J. Chem.Technol. Biotechnol, 35A:153-157.
2. Namasivayam, C., Kanchana, N. andYamuna, R.C. (1995) Waste banana pith asadsorbent for the removal of Rhodamine-B from aqueous solution. Waste Manage,13: 89-95.
3. Dani, S.P. and Dara, S.S. (1983). Effect ofadsorption on modified corn starch. J.IPHE, 47.
4. Bankar, D.B., and Dara, S.S.(1982) Effectof adsorbent on the surface of onions.Chem. Era, 18:251.
5. Day, D.S. and Basu, J.K. (1999). Adsorptionof methylene blue onto a low cost adsorbentdeveloped from sawdust. Indian J EnvironProt, 19:416-421.
6. Siddiqui, B.A., Sharma, P.P. and Sulthan,M. (1999). Adsorption studies on adsorbentfrom saw dust. Indian J.Environ. Prot, 19:846-849.
7. Selvapathi,J., Jesline, J., and Prabha, S.(1998). Effect of adsorption on the wastewater. Indian J.Environ.Prot, 18:15-18.
8. Hussain, S., Farooqui, M. and Shookur,M.A. (2005). Adsorption studies onactivated charcoal of low cost material.Acta Ciencia Indica Chemistry, 31:117-122.
9. Rajasekhar,K.K. and Haribabu, R . (2009).Adsorption Studies of Congo red andMethylene blue on the Surface of CitrusAurantifolium. Asian.J.Chem, 21:1531-1533.
10. Rajasekhar, K.K., and Ranganayakulu,D.(2009) Adsorption Studies of Congo red andMethylene blue on the Surface of Musaparadiasca.The Pharmacist, 1: 45-47.
11. Rajasekhar, K.K.,and Shankarananth,V.(2009). Adsorption Studies of Congo redand Methylene blue on the Surface ofAchras sapota. Journal of Pharmacyresearch, 2:1528-1529.
12. Jain Ruby., Manoj,SV.,and Gupta, KS.(1999) Removals of dyes from textiledyeing and printing industry effluentthrough charcoal as an adsorbent. Indian JEnviron. Prot., 19:36-42.

417
Biodegradation by white rot fungi
AbstractPentachlorophenol (PCP) is a major
organic compound used in the wood preservation.White rot fungal strains screened from localsources such as wood trunks and twigs of higherplants. Five selected isolates of White Rot Fungi(WRF) Viz: Laetiporus cincinnatus, Trametesversicolor, Fomes fomentarius, Ganodermaaplanutum and Pleurotus ostreatus isolated fromSambrani and Dandeli forests of Western Ghatsof Karnataka. The isolates were evaluated for thein-vitro biodegradation of PCP. The presence ofextracellular laccase shows that these isolates arecapable of degrading variety of xenobioticsincluding biodegradation of PCP. The maximumlaccase activity (0.14 ± 003U) of F. fomentarius,P. ostreatus followed by T. versicolor study hasshown significant efficiency on biodegradationof PCP which was quantitatively estimated andanalyzed by High Performance LiquidChromatography (HPLC). The static culturestudies have been worked on all the isolates. F.fomentarius (100%) and P. ostreatus(99.40±1.29%) which have degraded the PCPover 30 days of incubation.
Key words: Pentachlorophenol, White RotFungi, HPLC, Western Ghats.
Abbreviations: PCBs - Poly chlorinatedbiphenyls, DDT – Dichlorodiphenyltrichloroethane, PCP - Pentachlorophenol.
IntroductionPentachlorophenol (PCP) has been used
extensively as a wood preservative, pesticide andfungicide. The wood preserving industry is theprimary source of producing PCP containingwastewater and ground waters. However, theprocess of PCP biodegradation has been observedto be very slow. Chlorophenols are the mostdangerous classes of environmental pollutantshave been produced in thousands of tons annuallyby the pulp, paper and agrochemical industries.Chlorophenols are known substrates for theoxidative enzyme laccase (benzenediol:oxygenoxidoreductase, EC 1.10.3.2) that can react withall the chlorophenols including the mostrecalcitrant compound pentachlorophenol (1).Many reports showed that white rot fungi candegrade a variety of persistent aromaticorganopolluntants such as PCP, PCBs, DDT, andphenanthrene (2).
Pentachlorophenol synthesized for thefirst time in 1872 due to its broad spectrum andlow cost. Its esters have also been used asbiocides. This generalized use has led to thecontamination of many ecosystems, with PCPcurrently considered to be a product of priorityfor decontamination studies according to theEuropean Community and the AmericanEnvironmental Protection Agency (3). Thecapacity of Basidiomycetes to degrade PCP aswell the possibility of using these organisms inprocesses of reclamation of PCP contaminated
Biodegradation of Pentachlorophenol by white rot fungiisolated from forests of Western Ghats of Karnataka India
Ch. Ramesh and Manohar G. Pattar*Mycology Laboratory, Department of Botany
Karnatak University Dharwad – 580003, Karnataka, India*For correspondence - [email protected]
Current Trends in Biotechnology and PharmacyVol. 3 (4) 417 - 427, October 2009. ISSN 0973-8916

418
Ramesh and Pattar
soils, have been the subject of much previousresearch.
White rot fungi are a group offilamentous wood-decay fungi, primarilyBasidiomycetes with some Ascomycetes, whichshare the ability to simultaneously metabolizelignin and the polysaccharide components ofwood. Research has demonstrated that these fungiare capable of degrading a variety of xenobiotics(recalcitrant chemicals) including PCP. White-rot fungi vary greatly in their ability to degradewood and remove constituents. The combinedability to degrade wood and PCP makes thosefungi attractive candidates for use in destroyingPCP treated wood products (4).
The literature concerning biodegradationand bioremediation of organic chemical wastes(xenobiotics) dealt almost exclusively withbacteria. It is now becoming apparent that fungialso play an important role in degrading organicmaterials in the ecosystem, and that they havepotential for remediating contaminated soils andwaters. The higher Basidiomycetous fungiprobably play the major role in recycling thecarbon of lignocellulosics, which are the mostabundant renewable organic materials on earth(5). Because of its environmental significance,biotreatment is of great interest. Both anaerobicand aerobic biodegradation pathways of PCP andother chlorophenols have been widely reported.Due to improper treatment of PCP, soil andgroundwater has been widely contaminated andtheir toxicity seriously affected living organisms(6).
In 1990, PCP use was restricted to thatof a wood preservative since it is a probablehuman carcinogen (7). Short term ingestion orinhalation results in neurological disorders,Leukemia, liver damage, and eye irritation (7).Long-term exposure damages the respiratorytract, blood, kidneys, liver, immune system, eyes,and skin (7). The wide spread use, accumulation
in the environment, and negative impact onhuman health and environment has rendered PCPremediation to be of critical importance (7).
Laccase are glycosylated phenoloxidases that exist as monomers, homodimers orhomotertamers. Fungal laccase have a very broadsubstrate range compared to other multi copperoxidase (8). Fungal reactivity with chlorophenolsis due to the production of lignin degradingenzymes, particularly laccase and Mn-peroxidasethat are secreted in increased quantities by thefungus during ligninolytic activity (1). The Whiterot fungi have been widely studied for their abilityto degrade variety of environmental soilpollutants, including PCP and efficiently degradelignin, a complex aromatic polymer in the wood,where the White rot fungi Phanerochatechrysosporium can be used for bioremediationof phenolic, xenobiotic compounds anddecolonization and remediation of the effluent(9).
In the present experiment in-vitro studyof laccase production and degradation of PCPwere evaluated for the bioremediation potentialof white rot fungi isolated from Sambrani andDandeli forests of Western Ghats of Karnataka,India. The coastal areas of India have some ofthe best developed industrial areas, metros andports. The Indian coastal area is underconsiderable stress from the effluents dischargedby the industries and the municipalities. Theindustrialized centers release a horde of chemicalpollutants through their effluents in the streamsand nalas draining in to the nature. Most dreadedare the municipal wastes, sewage sludge anddredged spill dumping, oil spills and leakages.The wastes have a wide range of hazardouselements such as petroleum hydrocarbons,chlorinated hydrocarbons and heavy metals (10).The table-2 shows the compilation of differenttypes of pollutant and annual quantum ofpollution report by Tata Energy Research
Current Trends in Biotechnology and PharmacyVol. 3 (4) 417 - 427, October 2009. ISSN 0973-8916
419
Biodegradation by white rot fungi
Institute, New Delhi, Elrich de Sa, Director,National Institute of Oceanography (NIO).
Materials and MethodsMushrooms
Fruiting bodies were collected on deadwoods from different localities of Sambrani andDandeli forests of Western Ghats of Karnataka.Isolates are identified as Laetiporus cincinnatusMorgan, Trametes versicolor Arora, Fomesfomentarius Kickx, Ganoderma aplanutumSmith & Weber and Pleurotus ostreatus Smith,A.H. Identification was done based on theirmorphological, physiological and biochemicalcharacteristics. Taxonomic features are verifiedwith monographs and descriptions of the Manual(11), taxonomic research articles (12) and alsothrough the electronic data on identification keysof mushrooms (13). Herbariums of the isolateswere deposited at Mycology laboratory,Department of Botany, Karnatak University,Dharwad, India. These isolates of white rot fungiwere selected based on their known high lignindegrading capacity for evaluating the PCPdegradation. Isolates were raised by asepticallytransferring a piece of fruiting bodies into cultureson 5 % Malt Extract Agar (MEA) at pH – 4.5and incubated statically for fungal colonizationat ambient temperature in complete darkness.Isolates were sub cultured and transferred to thefresh slant for every fortnight. Each agar plugs(6mm diameter) from the outer circumference ofa fungal colony growing on MEA plates (7 days)used as the inoculum. Young cultures (mycelialstate) were used to determine efficacy of laccaseactivity and PCP degradation. All the experimentswere performed in triplicate.
ChemicalsPentachlorophenol Obtained from
Aldrich Chemical Co. (Milwaukee WI, USA)Acetonitrile, Glacial acetic acid, ABTS (2, 2’-azino–bis 3-ethylbenzothiazoline-6-sulphonicacid), Sodium azide, and other chemicals are ofanalytical grade from Merck Bombay.
Laccase assayFor laccase enzyme assay all the isolates
were grown on nutrient deficient (PCP solution50 ppm/L) liquid medium consisted of 5gglucose, 1g KH2
PO4, 0.5g MgSO
4.7H
2O, 0.2g
NH4NO
3, 0.1g yeast extract, 0.01g CaCl
2, 1mg
CuSO4.5H
2O, 1 mg FeSO
4.7H
2O and 1mg
MnSO4 per liter of water (14) Finally 50 ppm/L
of PCP was added into 250ml erlenmeyer flaskscontaining 50mL of liquid medium with PCP ascarbon source and incubated at room temperatureon shaker at 150 rpm and final adjusted to pH -4.5. Laccase activity was measured by using themethod described by Godliving and Rose (15).The oxidation rate of (2, 2-azino–bis 3-ethylbenzothiazoline 6 sulphonic acid) ABTSwas determined by Spectrophotometric method.The reaction mixture contained 600 ìL sodiumacetate buffer (0.1 M, pH 5.0 at 27oC), 300 ìLABTS (5 mM), 300 ìL mycelial liquid fractionand 1.4ml distilled water. The mixture was thenincubated for 2 min at 30oC. The absorbance wasmeasured at 420 nm at room temperature. OneUnit of laccase activity was defined as activityof an enzyme that catalyzes the conversion of 1m mole of ABTS per minute. Laccase activitywas defined as 1ìmole of ABTS oxidized productformed per minute. The experiment wasperformed in triplicate. Control was done withoutsubstrates.
PCP concentration analysisMycelial plugs inoculated in 50ml of
liquid broth with PCP as carbon source (50 ppm/L) were harvested after the 10th, 20th and 30th dayof incubation. One ìmole of sodium azide wasadded to the cultures to inhibit enzyme activity.The harvested cultures were stored at -20°C. Thecultures were homogenized and flasks wererinsed with absolute ethanol (5ml), followed bywater (5 ml), and the rinses were pooled with thehomogenates and stored at -20°C. PCP wasextracted from 0.5- to 5-ml samples of culturehomogenates with hexane (0.5 to 2 ml) following
Current Trends in Biotechnology and PharmacyVol. 3 (4) 417 - 427, October 2009. ISSN 0973-8916

420
Ramesh and Pattar
the addition of 1 ml of H20 saturated with NaCl.
The sample was filtered through membrane filterof 0.4ìm and used for quantification of PCP byHPLC. The amount of PCP remaining wasdetermined by HPLC (16). A standard curve wasdetermined daily by plotting the peak areaobtained from the integrator versus knownstandard amounts of PCP injected. PCP wasanalyzed using (Model. HPLC WATERS 2487with EMPOWER software) with a Symmetry C-18 reverse-phase column (4.6 by 250 mm, 5 µm).20 µl of each sample was eluted from the columnwith acetonitrile-H
20-glacial acetic acid (75:25:
0.125) at a flow rate of 1 mL/min. Elution wasmonitored at 238 nm. The remaining PCPconcentration of each sample was calculated withknown concentration and peak area of standardPCP.
All the test organisms were studied foradsorption of PCP to mycelial mass. Culturesused in this study were grown only up toinoculum level and incubation period maintainedas described above for degradation experimentsso as to facilitate sufficient adsorption of PCP.Heating at 55oC for 24hr killed all the cultures.
Statistical analysis
All the data was subjected to one-wayanalysis of variance (ANOVA) and thesignificance of the difference between the meanswas determined by the Duncan’s multiple rangetests significant difference (p < 0.05) by usingSPSS 9 Student version software.
Results and DiscussionIn vitro studies were performed with five
isolates for their ability to produce extra cellularlaccase and PCP degradation. These two criteriaare important in assessing the bioremediationpotential of white rot isolates. During theexperiment all the sets of 10th, 20th and 30th daysamples were assessed for laccase activity andbiodegradation of PCP. The table-1 showspercentage of degradation, remaining
Pentachlorophenol and laccase production atdifferent interval of incubation where increasingrates of PCP removal recorded from theseisolates. Initial rate of PCP degradation (10th day)is very slow when compared with final incubationperiod (30th day). This indicates initially culturehad not become fully acclimatized to thisconcentration of PCP. Biodegradation of PCP instatic culture was evaluated based ondisappearance of PCP. When compared to thecontrol all the five isolates of white rot fungi haveshown the significant results were PCPdegradation ranged (91.94±1.34% to 100±00%)and laccase production ranged (0.10±003U to0.14±003U) over the 30th day of incubation. Thestatic culture experiments were done in triplicate.
Laccase activityAll the isolates were produced laccase
at some stages over the 10th, 20th and 30th day ofincubation period. The fig. 1 shows laccaseactivity was highest was found (0.14±003U) inF.fomentarius, T.versicolor and P.ostreatus overthe 30th day of incubation. The lowest laccaseactivity was found (0.10±003U) in L. cincinnatus.Laccase activity was varying slowly on initial 10th
day when compared to 30th day of analysis. Theinitial concentration 50 ppm of PCP supportedLaccase activity by enhancing production oflaccase two fold from 0.03 ± 003U to 0.14±003Uin active sample. The results obtained clearlyshowed that the laccase activity assayed by theABTS substrate was significantly higher and theexperiment support the research work done inprevious literatures. According to workers (1) Inthe free cell cultures the initial rise to 8 units whenthe first addition of 200 ppm PCP was inducedthe production of laccase accompanied by a 10-fold increase in laccase activity When 1000 ppmof PCP was added to the culture, both laccaseand MnP activities increased from 0.3 to 0.5 unitsand from 0.001 to 0.18 units respectively. Thecatalytic efficiency of laccase from fungi testedwas much lower for the substrates of o-
Current Trends in Biotechnology and PharmacyVol. 3 (4) 417 - 427, October 2009. ISSN 0973-8916
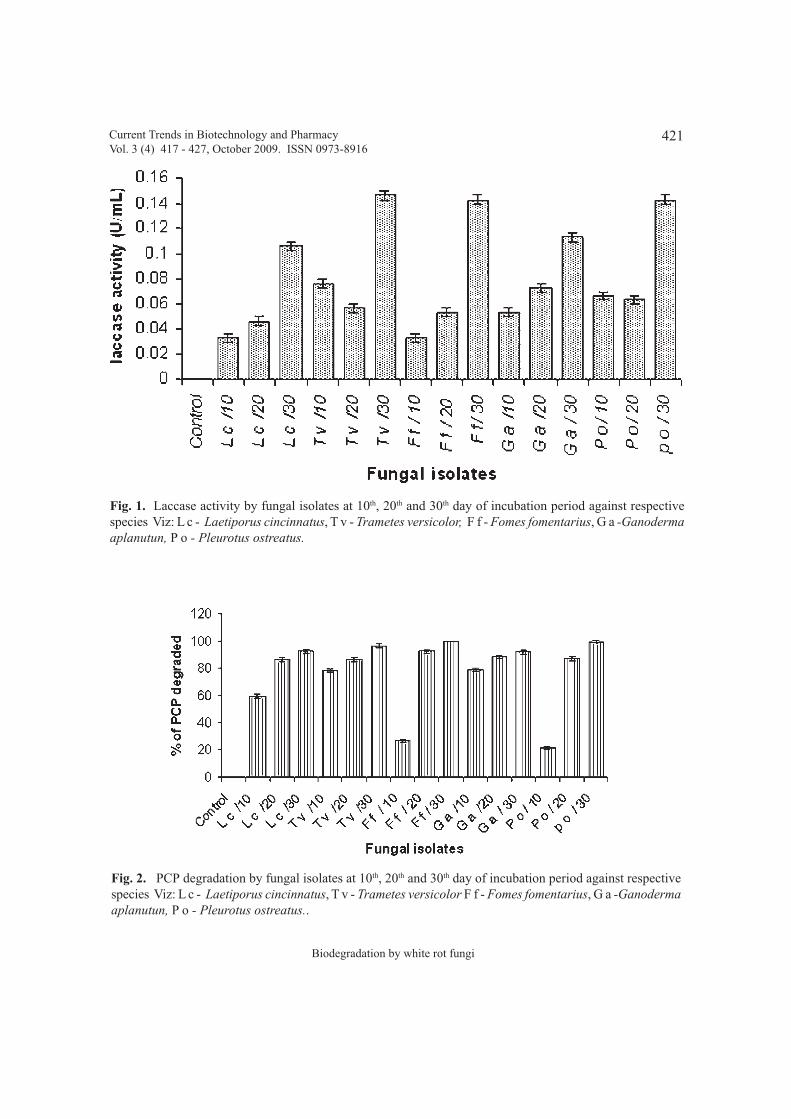
421
Biodegradation by white rot fungi
Fig. 1. Laccase activity by fungal isolates at 10th, 20th and 30th day of incubation period against respectivespecies Viz: L c - Laetiporus cincinnatus, T v - Trametes versicolor, F f - Fomes fomentarius, G a -Ganodermaaplanutun, P o - Pleurotus ostreatus.
Fig. 2. PCP degradation by fungal isolates at 10th, 20th and 30th day of incubation period against respectivespecies Viz: L c - Laetiporus cincinnatus, T v - Trametes versicolor F f - Fomes fomentarius, G a -Ganodermaaplanutun, P o - Pleurotus ostreatus..
Current Trends in Biotechnology and PharmacyVol. 3 (4) 417 - 427, October 2009. ISSN 0973-8916
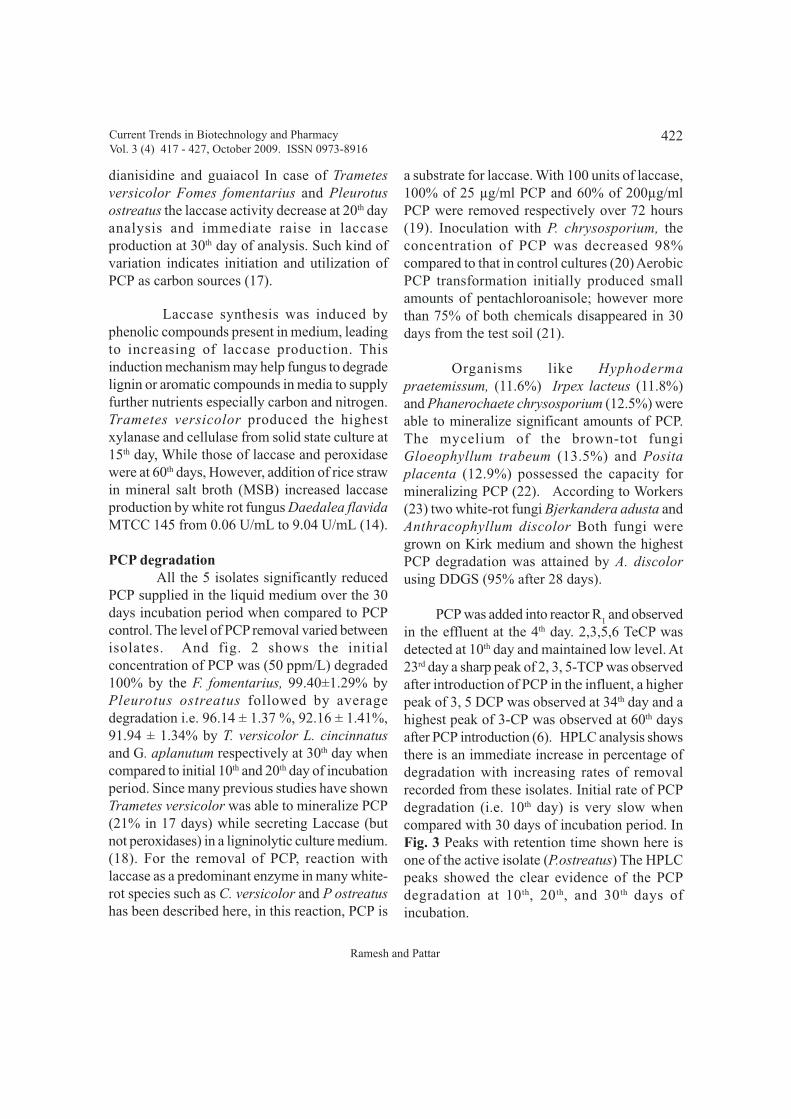
422
Ramesh and Pattar
dianisidine and guaiacol In case of Trametesversicolor Fomes fomentarius and Pleurotusostreatus the laccase activity decrease at 20th dayanalysis and immediate raise in laccaseproduction at 30th day of analysis. Such kind ofvariation indicates initiation and utilization ofPCP as carbon sources (17).
Laccase synthesis was induced byphenolic compounds present in medium, leadingto increasing of laccase production. Thisinduction mechanism may help fungus to degradelignin or aromatic compounds in media to supplyfurther nutrients especially carbon and nitrogen.Trametes versicolor produced the highestxylanase and cellulase from solid state culture at15th day, While those of laccase and peroxidasewere at 60th days, However, addition of rice strawin mineral salt broth (MSB) increased laccaseproduction by white rot fungus Daedalea flavidaMTCC 145 from 0.06 U/mL to 9.04 U/mL (14).
PCP degradationAll the 5 isolates significantly reduced
PCP supplied in the liquid medium over the 30days incubation period when compared to PCPcontrol. The level of PCP removal varied betweenisolates. And fig. 2 shows the initialconcentration of PCP was (50 ppm/L) degraded100% by the F. fomentarius, 99.40±1.29% byPleurotus ostreatus followed by averagedegradation i.e. 96.14 ± 1.37 %, 92.16 ± 1.41%,91.94 ± 1.34% by T. versicolor L. cincinnatusand G. aplanutum respectively at 30th day whencompared to initial 10th and 20th day of incubationperiod. Since many previous studies have shownTrametes versicolor was able to mineralize PCP(21% in 17 days) while secreting Laccase (butnot peroxidases) in a ligninolytic culture medium.(18). For the removal of PCP, reaction withlaccase as a predominant enzyme in many white-rot species such as C. versicolor and P ostreatushas been described here, in this reaction, PCP is
a substrate for laccase. With 100 units of laccase,100% of 25 µg/ml PCP and 60% of 200µg/mlPCP were removed respectively over 72 hours(19). Inoculation with P. chrysosporium, theconcentration of PCP was decreased 98%compared to that in control cultures (20) AerobicPCP transformation initially produced smallamounts of pentachloroanisole; however morethan 75% of both chemicals disappeared in 30days from the test soil (21).
Organisms like Hyphodermapraetemissum, (11.6%) Irpex lacteus (11.8%)and Phanerochaete chrysosporium (12.5%) wereable to mineralize significant amounts of PCP.The mycelium of the brown-tot fungiGloeophyllum trabeum (13.5%) and Positaplacenta (12.9%) possessed the capacity formineralizing PCP (22). According to Workers(23) two white-rot fungi Bjerkandera adusta andAnthracophyllum discolor Both fungi weregrown on Kirk medium and shown the highestPCP degradation was attained by A. discolorusing DDGS (95% after 28 days).
PCP was added into reactor R1 and observed
in the effluent at the 4th day. 2,3,5,6 TeCP wasdetected at 10th day and maintained low level. At23rd day a sharp peak of 2, 3, 5-TCP was observedafter introduction of PCP in the influent, a higherpeak of 3, 5 DCP was observed at 34th day and ahighest peak of 3-CP was observed at 60th daysafter PCP introduction (6). HPLC analysis showsthere is an immediate increase in percentage ofdegradation with increasing rates of removalrecorded from these isolates. Initial rate of PCPdegradation (i.e. 10th day) is very slow whencompared with 30 days of incubation period. InFig. 3 Peaks with retention time shown here isone of the active isolate (P.ostreatus) The HPLCpeaks showed the clear evidence of the PCPdegradation at 10th, 20th, and 30th days ofincubation.
Current Trends in Biotechnology and PharmacyVol. 3 (4) 417 - 427, October 2009. ISSN 0973-8916
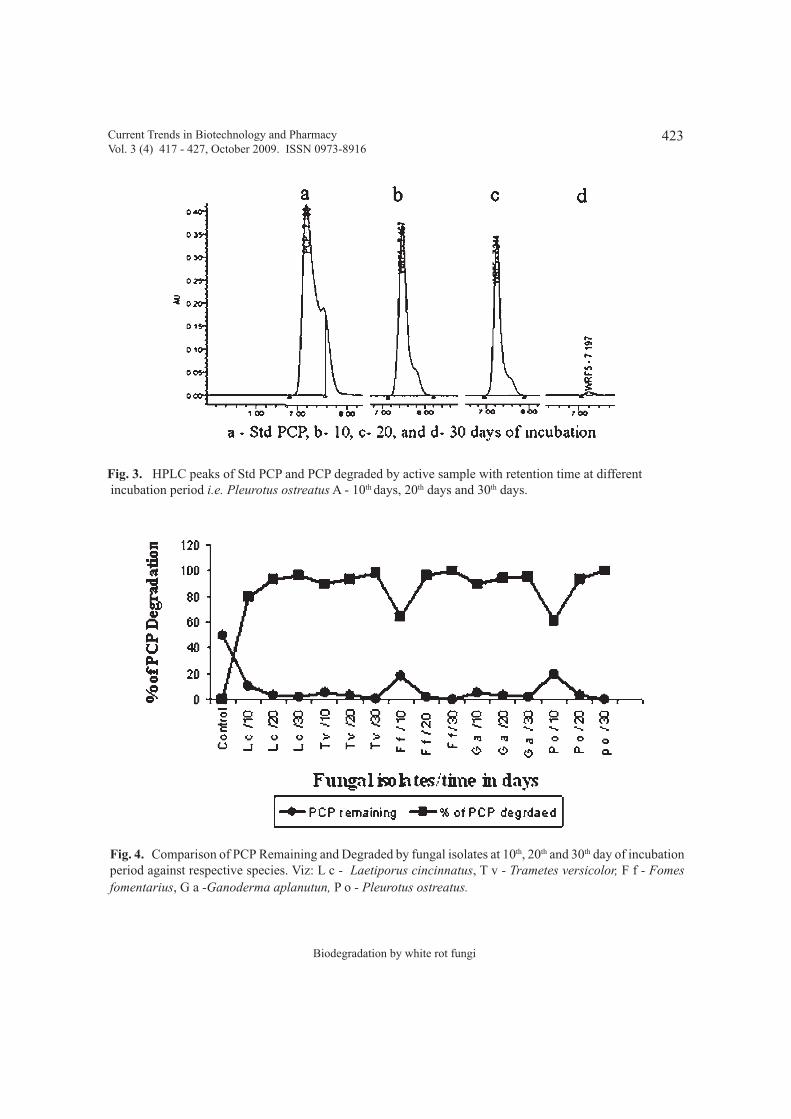
423
Biodegradation by white rot fungi
Fig. 4. Comparison of PCP Remaining and Degraded by fungal isolates at 10th, 20th and 30th day of incubationperiod against respective species. Viz: L c - Laetiporus cincinnatus, T v - Trametes versicolor, F f - Fomesfomentarius, G a -Ganoderma aplanutun, P o - Pleurotus ostreatus.
Fig. 3. HPLC peaks of Std PCP and PCP degraded by active sample with retention time at different incubation period i.e. Pleurotus ostreatus A - 10th days, 20th days and 30th days.
Current Trends in Biotechnology and PharmacyVol. 3 (4) 417 - 427, October 2009. ISSN 0973-8916

424
Ramesh and Pattar
The PCP biodegradation rate in the 30 daysaged controls was found in traces on a dry weightbasis. Recovery of PCP from heat killed controlcultures appeared to be unaffected. There is rateis similar to a killed control biodegradation ratereported in another study (24) with a similarPCP–soil mix. Therefore, this result was nodifferent from a zero PCP biodegradation rate. Itis reasonable to assume that mineralization wouldfollow dehalogenation since aromatic compoundssuch as phenol have been shown to serve as solecarbon sources for growth of P. chrysosporium.
Comparison of these results presumed thatthe initially culture had not become fullyacclimatized to this concentration (50 ppm/L) ofPCP. But 30th day of analysis indicates the abilityof White rot isolates to use the PCP as sole carbonsource. Fig. 4 shows the PCP remaining andbiodegradation rate calculated in the 30 days ofthe time course in the culture medium at differenttime of analysis. PCP remaining at differentincubation periods it was found in trace quantitywith F. fomentarius (0.001ppm), and maximumwith Ganoderma aplanutum (2.106ppm), In the
Table 1. Concentration of PCP remaining and PCP Degraded by isolates at 10th, 20th and 30th day
of incubation period (Mean ± Standard deviation; n=3)
Isolates/ PCP Degraded Laccases activity PCP Remainingtime in days in ppm in Units in ppm
Control 00±00 00±00 50.000
L c /10 59.53 ± 1.34 0.03 ± 003 10.216
L c /20 86.14 ± 1.17 0.04 ± 003 3.466
L c /30 92.16 ± 1.41 0.10 ± 003 1.871
T v /10 78.23 ± 1.26 0.07 ± 003 5.310
T v /20 86.27 ± 1.23 0.05 ± 003 3.174
T v /30 96.14 ± 1.37 0.14 ± 003 0.901
F f / 10 26.94 ± 1.41 0.03 ± 003 18.195
F f / 20 92.10 ± 1.21 0.05 ± 003 1.967
F f / 30 100 ± 00 0.14 ± 003 0.001
G a /10 78.72 ± 1.24 0.05 ± 003 5.273
G a /20 88.36 ± 1.23 0.07 ± 003 2.909
G a / 30 91.94 ± 1.34 0.11 ± 003 2.106
P o / 10 21.79 ± 1.32 0.06 ± 003 19.512
P o / 20 87.13 ± 1.35 0.06 ± 003 3.341
p o / 30 99.40 ± 1.29 0.14 ± 003 0.052
L c - Laetiporus cincinnatus, T v - Trametes versicolor, F f - Fomes fomentarius, G a - Ganoderma aplanutun, P o - Pleurotus ostreatus.
Current Trends in Biotechnology and PharmacyVol. 3 (4) 417 - 427, October 2009. ISSN 0973-8916
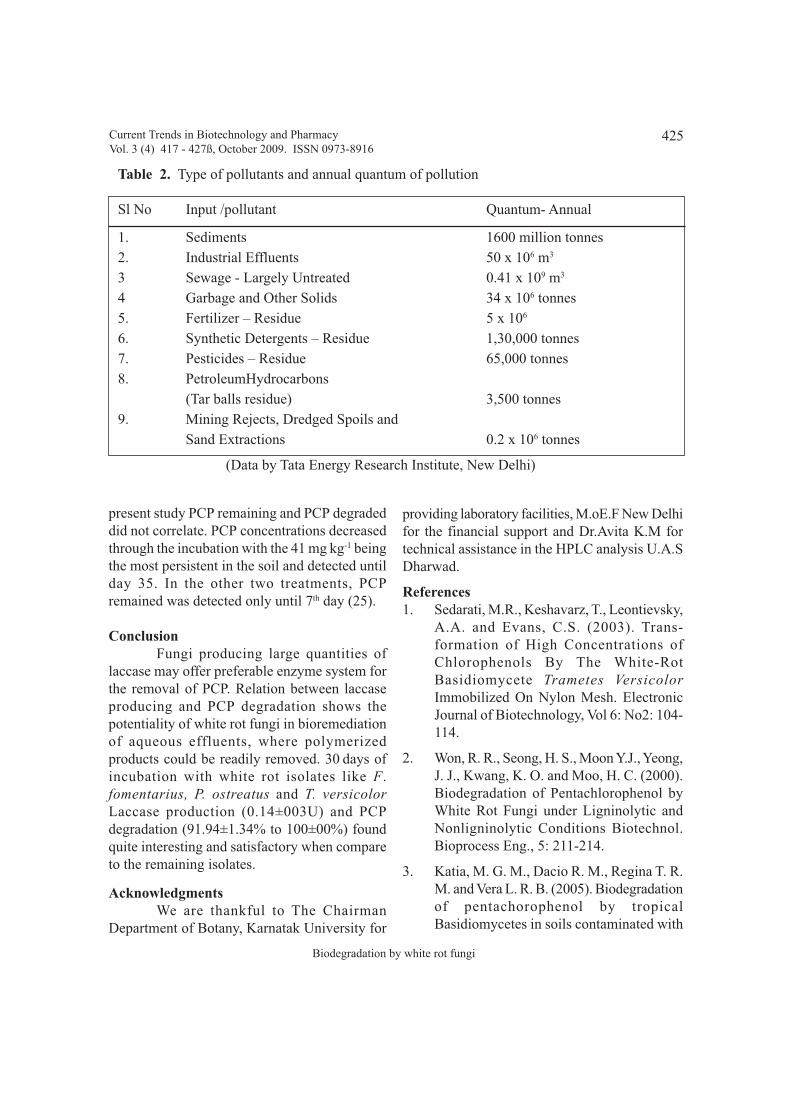
425
Biodegradation by white rot fungi
Table 2. Type of pollutants and annual quantum of pollution
Sl No Input /pollutant Quantum- Annual
1. Sediments 1600 million tonnes2. Industrial Effluents 50 x 106 m3
3 Sewage - Largely Untreated 0.41 x 10⁹ m3
4 Garbage and Other Solids 34 x 106 tonnes5. Fertilizer – Residue 5 x 10⁶
6. Synthetic Detergents – Residue 1,30,000 tonnes7. Pesticides – Residue 65,000 tonnes8. PetroleumHydrocarbons
(Tar balls residue) 3,500 tonnes9. Mining Rejects, Dredged Spoils and
Sand Extractions 0.2 x 10⁶ tonnes
(Data by Tata Energy Research Institute, New Delhi)
present study PCP remaining and PCP degradeddid not correlate. PCP concentrations decreasedthrough the incubation with the 41 mg kg-1 beingthe most persistent in the soil and detected untilday 35. In the other two treatments, PCPremained was detected only until 7th day (25).
ConclusionFungi producing large quantities of
laccase may offer preferable enzyme system forthe removal of PCP. Relation between laccaseproducing and PCP degradation shows thepotentiality of white rot fungi in bioremediationof aqueous effluents, where polymerizedproducts could be readily removed. 30 days ofincubation with white rot isolates like F.fomentarius, P. ostreatus and T. versicolorLaccase production (0.14±003U) and PCPdegradation (91.94±1.34% to 100±00%) foundquite interesting and satisfactory when compareto the remaining isolates.
AcknowledgmentsWe are thankful to The Chairman
Department of Botany, Karnatak University for
providing laboratory facilities, M.oE.F New Delhifor the financial support and Dr.Avita K.M fortechnical assistance in the HPLC analysis U.A.SDharwad.
References1. Sedarati, M.R., Keshavarz, T., Leontievsky,
A.A. and Evans, C.S. (2003). Trans-formation of High Concentrations ofChlorophenols By The White-RotBasidiomycete Trametes VersicolorImmobilized On Nylon Mesh. ElectronicJournal of Biotechnology, Vol 6: No2: 104-114.
2. Won, R. R., Seong, H. S., Moon Y.J., Yeong,J. J., Kwang, K. O. and Moo, H. C. (2000).Biodegradation of Pentachlorophenol byWhite Rot Fungi under Ligninolytic andNonligninolytic Conditions Biotechnol.Bioprocess Eng., 5: 211-214.
3. Katia, M. G. M., Dacio R. M., Regina T. R.M. and Vera L. R. B. (2005). Biodegradationof pentachorophenol by tropicalBasidiomycetes in soils contaminated with
Current Trends in Biotechnology and PharmacyVol. 3 (4) 417 - 427ß, October 2009. ISSN 0973-8916

426
Ramesh and Pattar
industrial residues World Journal ofMicrobiology & Biotechnology, 21: 297–301.
4. Richard, R.T. and Lamar, J.S. (1992). Whiterot fungi biodegradation of PCP treatedAmmunition boxes in Proceedings of R&D92 National research and development,conference on the control of hazardousmaterial, San Francisco 84-94.
5. Kent, K.T., Lamar, R.T. and Glaser, J.A.(1992). The potential of white-rot fungi inbioremediation, Proceedings of aninternational conference on biotechnologyand environmental science: molecularapproaches, New York, 131-134.Doi:10.1007/s11274-004-3693-z
6. Fen, X. and Ying, L.Y. (2007). Biosorptionand biodegradation of pentachlorophenol(PCP) in an up flow anaerobic sludgeblanket (UASB) reactor Biodegradation,18: 617–624.
7. Xunchi, Pu. and Teresa, J. C. (2007)Degradation of Pentachlorophenol by Pureand Mixed Cultures in Two Different SoilsEnv Sci Pollut Res 14 (4) 244-250.
8. Jenness, M.G. (2007). Degradation of PCPby laccase of the White rot fungus Trametessp PhD thesis, Massey University,Palmerston North New Zealand
9. Udayasoorian, C., Prabu P.C. andBalasubramanian, G. (2007). Degradationof Pentachlorophenol by white rot fungus(Phanerochate Chrysosporium- TL 1)growth in ammonium lignosulphonatemedia. Biotechnology 6 (1): 76-80.
10. Joshi, V.K (2007). Environmentalbiomarkers. Retrieved from the boloji.comweb site. www.boloji.com/Enveronmental/Index.html
11. Charles, L.F. (1960). Illustrated Genera ofwood decay fungi. Burgess PublishingCompany, (1st edition) Minnesota U S A.
12. Harold, H., Burdsall, J.R. and Banik, M.T.(2001). The Genus Laetiporus In NorthAmerica Harvard Papers in Botany, Vol. 6,NO. 1: 43-55.
13. Kuo, M. (2004). Contributors Retreivedfrom the MushroomExpert.Com Web site:h t tp : / /www.mushroomexper t .com/contributors.html.
14. Chawachart, N., Khanongnuch, C.,Watanabe, T. and Lumyong, S. (2004). Ricebran as an efficient substrate for laccaseproduction from thermotolerantbasidiomycete Coriolus versicolor strainRC3. Fungal Diversity 15: 23-32.
15. Godliving, M. and Rose, M. (2008).Extracellular enzymes from brown-rotfungus Laetiporus sulphureus isolated frommangrove forests of coastal TanzaniaScientific Research and Essay Vol. 3 (4):154-161.
16. Gerald, J.M., John, A., Maria, B., Jurek, A.and Aust, S.D. (1988). Biodegradation ofPentachlorophenol by the White RotFungus Phanerochaete chrysosporiumApplied And Environmental Microbiology,Vol. 54, No. 12: 2885-2889.
17. Airong, L., Yue, Z., Liang, X., Wenqing, Z.and Xingjun, T. (2008). Comparative studyon the determination of assay for laccaseof Trametes sp. African Journal ofBiochemistry Research, Vol.2 (8): 181-183.
18. Pointing, S.B. (2001). Feasibility ofbioremediation by white-rot fungi, MiniReview Appl Microbiol Biotechnol., 57:20–33.
19. Ullaha, M.A., Bedford, C.T. and Evans,C.S. (2000). Reactions of
Current Trends in Biotechnology and PharmacyVol. 3 (4) 417 - 427, October 2009. ISSN 0973-8916

427
Biodegradation by white rot fungi
pentachlorophenol with laccase fromCoriolus versicolor Appl MicrobiolBiotechnol 53: 230 – 234.
20. Lamar, R.T., Glaser, J.A. and Kirk, T.K.(1990). Fate of Pentachlorophenol (PCP)in sterile soils inoculated with the white-rot basidiomycete phanerochaetechrysosporium Mineralization,volatilization and depletion of PCP. SoilBiol Biochem. 22. 4. 431-440.
21. Olfa, S. (2006). Wood and Tree Fungi,Springer, (1st edition) Germany. pp- 334
22. Lamar, R.T., Laura, M.M, Diane, M.D. andJohn, A.G. (1999). Screening of Fungi forSoil Remediation Potential Bioremediationof Contaminated Soils, AgronomyMonograph no. 37.
23. Rubilar, O., Feijoo, G., Diez, C., LuChau,T.A., Moreira, M.T. and Lema, J.M. (2007).Biodegradation of Pentachlorophenol inSoil Slurry Cultures by Bjerkandera adustaand Anthracophyllum discolor Ind. Eng.Chem. Res., 46: 6744-6751.
24. Walter, M., Boyd-Wilson, K.S.H.,McNaughton, D. and Northcott, G. (2005).Laboratory trials on the bioremediation ofaged pentachlorophenol residues Int.Biodeterior. Biodegrad. 55:121–130.
25. Diez, J.M.C., Felipe. G.A., Gissele, S.,Mara, C.L., Gianfreda. L. and Marysol.A.Z., (2006). Effect of pentachlorophenolon selected soil enzyme activities in aChilean Andisol .J.Soil Sc.Plant Nutr., 6(3):40-51.
Current Trends in Biotechnology and PharmacyVol. 3 (4) 417 - 427, October 2009. ISSN 0973-8916

428
Vitamin E therapy for leprosy
Abstract
Chronic infectious disease process of leprosycaused by the intracellular parasitic pathogenMycobacterium leprae involves accumulation ofhighly reactive oxygen species (ROS). Thepresent treatment method available for leprosyis MDT (Multi Drug Therapy) involvescombination of Rifampicin, Dapsone andClofazimine, although MDT disinfect leprosypatients, it has limited impact on the increasedROS production and decreased antioxidant statusin affected individuals. In the present study wehave investigated the causative bacillary load,lipid peroxidation, DNA damage in single cellsusing single cell gel electrophoresis (alkalinecomet assay), oxidative stress indices in multibacillary leprosy patients. The mean valuesplasma lipid peroxidation, erythrocyte oxidativestress indices in untreated leprosy cases werehigher than the controls, this further increasessignificantly (p<0.05) with MDT. Uponsupplementation with 400 IU antioxidant vitaminE we noticed a significant decrease was noticedin plasma lipid peroxidation, oxidative stressindices, and DNA damage. Hence we concludethat MDT along with vitamin E supplementationreduces the oxidative stress mediated insult tocells and bio-molecules during the chronic courseof treatment in leprosy.
Keywords: Mycobacterium leprae, Multi DrugTherapy, Alkaline Comet Assay, Peroxidation,Oxidative stress.
AbbreviationsMDT : Multi Drug Therapy, ROS : Reactive
oxygen species, LPO: Lipid Peroxidation ,TBARS: Thio Barbutric Acid ReactiveSubstances, DNA: Deoxy Ribo nuclic Acid,MDA: Malondialdehyde, DMSO: DimethylSulphoxide, WBC: White Blood Cell, SOD:Superoxide Dismutase, NBT: Nitrobluetetrazolium, EDTA: Ethelene Diamine TetraAcetic acid.
Introduction Hansen’s disease “historically known asleprosy” is a mutilating, debilitating, devastatingand deforming disease of mankind. The causativeintra cellular germ Mycobacterium lepraemediate strong inflammatory response and causegross destruction of tissues during the chroniccourse of infection in affected individuals.Patients with leprosy are treated with Multi DrugTherapy (MDT) consisting of Rifampicin,Dapsone and Clofazimine. Despite of large-scaleimplementation of MDT by the world healthorganization, the incidence of the disease is stillcause of concerned in several hyper-endemiccountries (1). MDT although disinfect leprosy
Vitamin E reduces reactive oxygen species mediated damage tobio-molecules in leprosy during multi-drug therapy
R. Vijayaraghavan1* C. S. Suribabu1, P. K. Oommen1 and C. Panneerselvam2
1 Central Leprosy Teaching and Research Institute, Chengalpattu Pin code # 603001, India2Department of Medical Bio-Chemistry, Postgraduate Institute of Basic Medical Sciences,
University of Madras, Taramani Campus, Madras (Chennai) - 600 113, India.*For correspondence - [email protected]
Current Trends in Biotechnology and PharmacyVol. 3 (4) 428 - 439, October 2009. ISSN 0973-8916
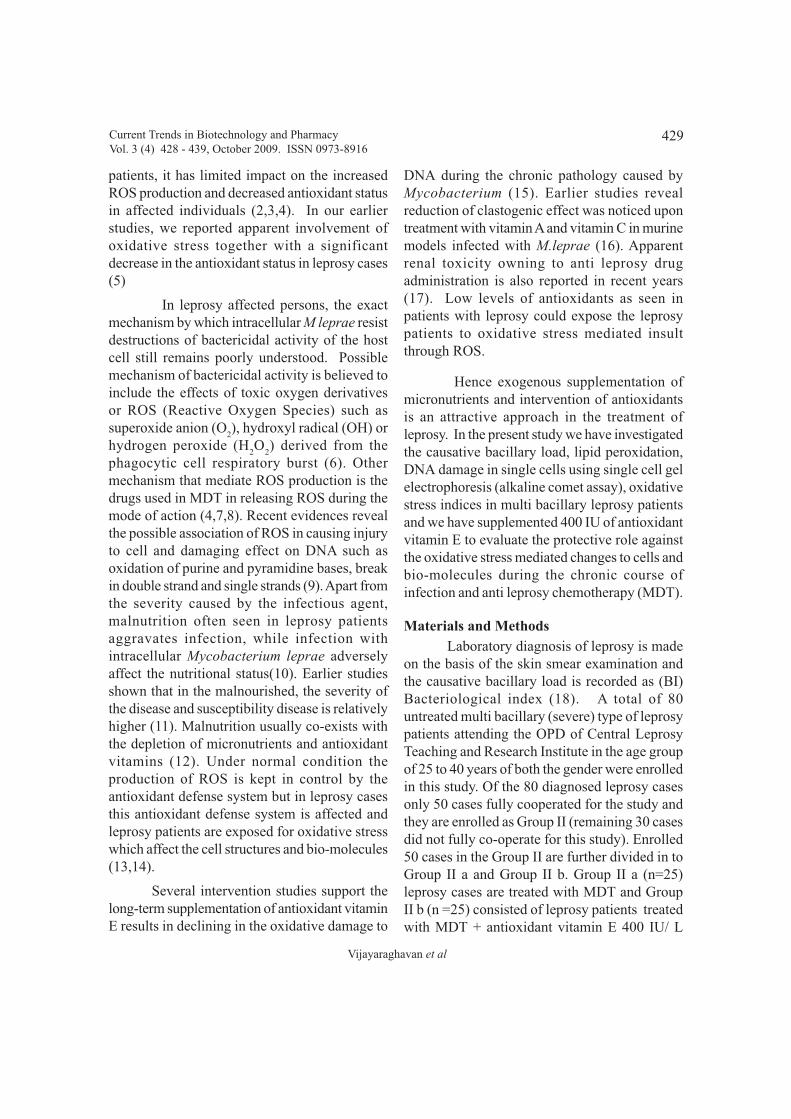
429
Vijayaraghavan et al
patients, it has limited impact on the increasedROS production and decreased antioxidant statusin affected individuals (2,3,4). In our earlierstudies, we reported apparent involvement ofoxidative stress together with a significantdecrease in the antioxidant status in leprosy cases(5)
In leprosy affected persons, the exactmechanism by which intracellular M leprae resistdestructions of bactericidal activity of the hostcell still remains poorly understood. Possiblemechanism of bactericidal activity is believed toinclude the effects of toxic oxygen derivativesor ROS (Reactive Oxygen Species) such assuperoxide anion (O
2), hydroxyl radical (OH) or
hydrogen peroxide (H2O
2) derived from the
phagocytic cell respiratory burst (6). Othermechanism that mediate ROS production is thedrugs used in MDT in releasing ROS during themode of action (4,7,8). Recent evidences revealthe possible association of ROS in causing injuryto cell and damaging effect on DNA such asoxidation of purine and pyramidine bases, breakin double strand and single strands (9). Apart fromthe severity caused by the infectious agent,malnutrition often seen in leprosy patientsaggravates infection, while infection withintracellular Mycobacterium leprae adverselyaffect the nutritional status(10). Earlier studiesshown that in the malnourished, the severity ofthe disease and susceptibility disease is relativelyhigher (11). Malnutrition usually co-exists withthe depletion of micronutrients and antioxidantvitamins (12). Under normal condition theproduction of ROS is kept in control by theantioxidant defense system but in leprosy casesthis antioxidant defense system is affected andleprosy patients are exposed for oxidative stresswhich affect the cell structures and bio-molecules(13,14).
Several intervention studies support thelong-term supplementation of antioxidant vitaminE results in declining in the oxidative damage to
DNA during the chronic pathology caused byMycobacterium (15). Earlier studies revealreduction of clastogenic effect was noticed upontreatment with vitamin A and vitamin C in murinemodels infected with M.leprae (16). Apparentrenal toxicity owning to anti leprosy drugadministration is also reported in recent years(17). Low levels of antioxidants as seen inpatients with leprosy could expose the leprosypatients to oxidative stress mediated insultthrough ROS.
Hence exogenous supplementation ofmicronutrients and intervention of antioxidantsis an attractive approach in the treatment ofleprosy. In the present study we have investigatedthe causative bacillary load, lipid peroxidation,DNA damage in single cells using single cell gelelectrophoresis (alkaline comet assay), oxidativestress indices in multi bacillary leprosy patientsand we have supplemented 400 IU of antioxidantvitamin E to evaluate the protective role againstthe oxidative stress mediated changes to cells andbio-molecules during the chronic course ofinfection and anti leprosy chemotherapy (MDT).
Materials and Methods Laboratory diagnosis of leprosy is made
on the basis of the skin smear examination andthe causative bacillary load is recorded as (BI)Bacteriological index (18). A total of 80untreated multi bacillary (severe) type of leprosypatients attending the OPD of Central LeprosyTeaching and Research Institute in the age groupof 25 to 40 years of both the gender were enrolledin this study. Of the 80 diagnosed leprosy casesonly 50 cases fully cooperated for the study andthey are enrolled as Group II (remaining 30 casesdid not fully co-operate for this study). Enrolled50 cases in the Group II are further divided in toGroup II a and Group II b. Group II a (n=25)leprosy cases are treated with MDT and GroupII b (n =25) consisted of leprosy patients treatedwith MDT + antioxidant vitamin E 400 IU/ L
Current Trends in Biotechnology and PharmacyVol. 3 (4) 428 - 439, October 2009. ISSN 0973-8916

430
Vitamin E therapy for leprosy
supplementation. Group I (n=25) consist ofcontrol subjects and they are age matched healthywithout any signs and symptoms of the disease.Informed consent from the participants andclearance of ethical bodies of the institution wasobtained. Persons with systemic ailments havingthe habit of smoking, consuming alcohol, takingtreatment for any other ailments were excludedfrom the study. No study subject consumedvitamin E in the last 6 months.
All diagnosed leprosy patients weretreated with anti leprosy chemotherapy (MDT)and patients in group II b is treated with vitaminE 400 IU along with MDT. Following diagnosis,anti coagulated blood samples were collectedfrom the control and experimental subjects (groupII at the time of diagnosis) and group II a andgroup II b (after the treatment period) wereprocessed for the separation of plasma, WBC(Using Ficoll Hypaque) and red blood cells andhaemolysate. Lipid peroxidation assay wasestimated using plasma samples. Detection ofDNA damage in single cells (WBC) wereestimated using the separated WBC fraction,erythrocyte and haemolysate was used for theestimation of oxidative stress indices.Haemolysate was prepared according to standardbio-chemical method (19). Skin smear gradingis used to understand the grading of bacterial loadin a leprosy patient (20). Mean standard deviationvalues are tabulated and when found significantANOVA tests is performed for inter groupcomparison at P<0.05 significance level.
Oxidative stress indicesSuperoxide radical assay
Superoxide radical is a very labile radical andanalysis was made in all samples processedidentically from the collection site. The bloodsamples were cooled during the transport fromthe collection site during the transport and thenitro blue tetrazolium (NBT) reduction wasmeasured exactly at the end of one hour after
blood collection to obtain uniformity. For eachsample of blood superoxide was measured asNBT reduction in two sets of tubes of which SODwas inhibited in one set. The difference gave thesuperoxide radicals present at the time of assay.A stock solution containing 100 mM of NBT wasprepared in water and diluted to make a workingstandard of 10mM/ml of NBT served as standardfor the assay of superoxide radicals. Superoxidelevels in erythrocytes were expressed in terms ofmilli moles of NBT reduced/ 10 12 cells/ 10minutes (21).
Hydroxyl radical assay
Hydroxyl radicals in the haemolysate wereestimated by the method of Gutteridge by theirreaction (hydrogen abstraction) from 2-deoxyribose, resulting in the formation of thiobarbutric acid and reactive substances. 2.0 ml of0.5 % hemolysate, 2.0ml of deoxyribose wasadded and incubated at 37_C for one hour. Then0.5 ml of TBA (thiobarbituric acid solution) and0.5 ml of trichloroacetic acid solution were addedand heated in a boiling water bath for 15minutes.The mixture was cooled and the reading wastaken at absorbance at 530 nm. Blank wereincluded without 2-deoxy ribose to assess thebasal thiobabuturic acid reactive substance in thehemolysate for each blood samples analyzed.Standards in the range of 5 to 30 nanomoles werealso developed. Amount of hydroxyl radicalspresent in the erythrocytes were expressed interms of nanomoles of MDA/1012 cells/ hour (22).
Hydrogen peroxide assay
Hydrogen peroxide in the erythrocyteswere estimated by the method of Wolf (23).Hydrogen peroxide oxidizes ferrous iron to ferriciron selectively and the resultant Fe3+ can bedetermined by sensitive dye xylenol orange (O-cresol sulfonapthalene, 3’3’-bis methylaminodiacetic acid which is highly sensitive to Fe3+ toform a blue-purple complex measured at 560 nm.
Current Trends in Biotechnology and PharmacyVol. 3 (4) 428 - 439, October 2009. ISSN 0973-8916

431
Vijayaraghavan et al
Fresh blood samples containing heparin and1mM sodium azide a catalase inhibitor was usedin this assay. Solution containing 1-5µM ofhydrogen peroxide were treated in a similar wayis used a standard. Erythrocyte hydrogenperoxide levels were expressed as µ moles/ 10 12
cells.
Lipid peroxidation
Lipid peroxidation in the plasma wasestimated using TBA (Thiobarbutric acid)reaction. Standard MDA 50 mM solution ofmalondialdehyde was prepared in distilled waterusing 1,1,3,3 tetrahydroxypropane. This wasstored in 4 °C and diluted just before use suchthat working standard contains 50nM/ml. PlasmaTBARS values were expressed as n moles ofMDA/ L (24).
Detection of DNA damage in single cells(Comet assay)
DNA damage in the separated portion ofwhite blood cells (WBC’s) was carried out bythe method of detection of DNA damage in singlecells (25). Comet assay: single cell gelelectrophoresis is a technique which detects DNAdamage and repair in individual cells like WBC.100 µl of normal melting agarose in phosphatebuffer was dropped on a frosted slide,immediately covered with a cover slip and keptfor 10 minutes in a refrigerator to solidify. Then,cover slips were removed and 100 µl low meltingagarose containing 75 µl of WBC in PBS and100 µl low melting point agarose) were added tothe slides. Again the cover slips were replacedand slides were kept in refrigerator for another10 minutes. After this, the cover slips wereremoved and the top layer of 100 µl low meltingagarose was added and cooled again for another10 minutes. After this step, the slides wereimmersed in cold lysing solution (2.5 M NaCl,100 mM EDTA and 10 mM Tris-Hydrochloricacid, pH adjusted to 10.0 with NaOH; 1% Triton
X – 100 and 10% DMSO were added freshly)and slides were kept in dark at 4°C for at least 1hr to prevent additional DNA damage thefollowing procedures were carried out under dimlight. The slides were removed from lysingsolution and placed on a horizontalelectrophoresis tank. The electrophoresis unitwas filled freshly made electrophoresis buffer(300 mM NaOH and 1mM EDTA, pH 13.0) to alevel of 0.25 cm above the slides. The cells wereexposed to alkali for 20 minutes to allowunwinding of DNA. An electric current of 25volt and 300mA (high voltage electrophoresis)was applied for 20 minutes. After electrophoresis,slides were placed horizontally and neutralizedwith Tris-HCl. Finally, 50µl of ethidium bromidewas added to each slide and covered with coverslip again and analyzed under the high powermagnification of fluorescent microscope with acalibrated ocular. Images of 50 randomly selectedcells were analyzed from each sample. For eachcell, the length of the image (diameter of thenucleus plus migrated DNA) was measured. Theintact DNA appear like a spot while the damagein DNA appear as comet with tail. The tail lengthis directly proportional to the DNA damage insingle cell (WBC). The damage is representedby an increase of DNA fragments that havemigrated out of the cell nucleus in the form of acharacteristic streak similar to the tail of a comet.
Results
Table 1: depicts the levels of toxicmetabolites of oxygen derived free radicals likesuperoxide radicals, hydroxide radicals, andhydrogen peroxide in controls and experimentalsubjects, Superoxide and hydroxyl levels wereestimated in the haemolysates prepared fromerythrocytes and the levels of hydrogen peroxidewere estimated in the erythrocytes of control andexperimental subjects. Nearly two fold increasein the levels of oxygen-derived free radicalsnoticed in group II. The levels of oxygen derivedfree radicals increase further upon treatment with
Current Trends in Biotechnology and PharmacyVol. 3 (4) 428 - 439, October 2009. ISSN 0973-8916
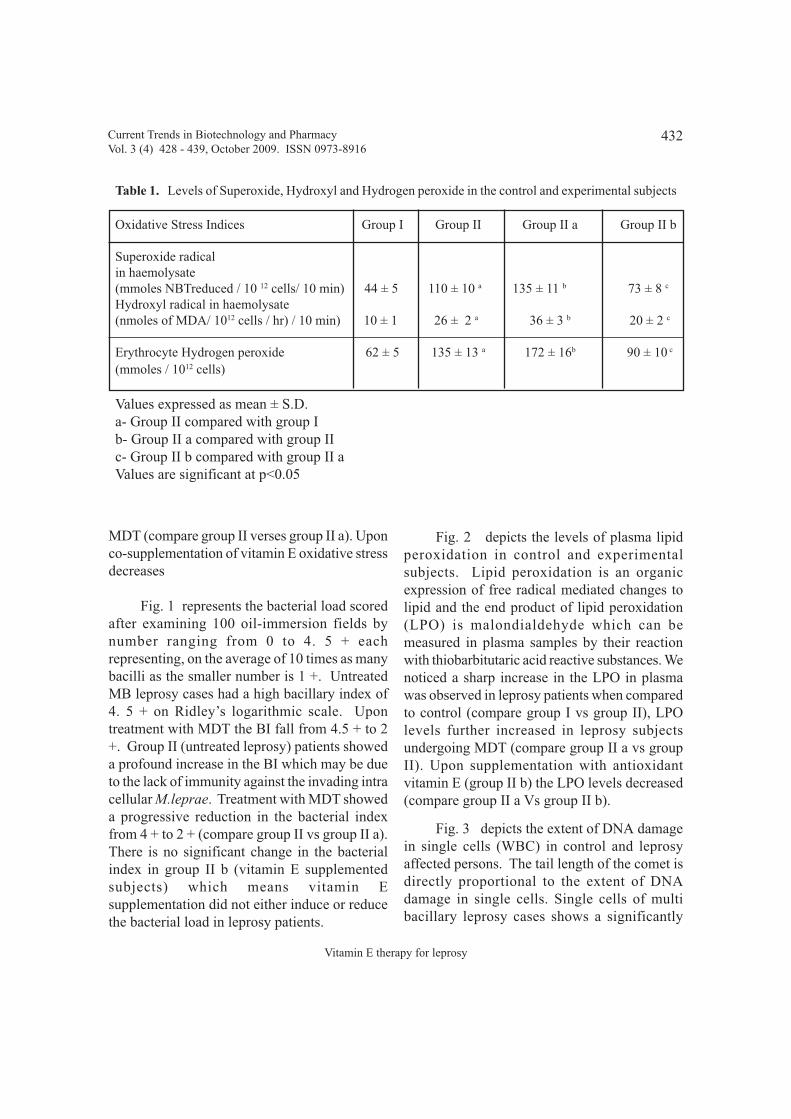
432
Vitamin E therapy for leprosy
MDT (compare group II verses group II a). Uponco-supplementation of vitamin E oxidative stressdecreases
Fig. 1 represents the bacterial load scoredafter examining 100 oil-immersion fields bynumber ranging from 0 to 4. 5 + eachrepresenting, on the average of 10 times as manybacilli as the smaller number is 1 +. UntreatedMB leprosy cases had a high bacillary index of4. 5 + on Ridley’s logarithmic scale. Upontreatment with MDT the BI fall from 4.5 + to 2+. Group II (untreated leprosy) patients showeda profound increase in the BI which may be dueto the lack of immunity against the invading intracellular M.leprae. Treatment with MDT showeda progressive reduction in the bacterial indexfrom 4 + to 2 + (compare group II vs group II a).There is no significant change in the bacterialindex in group II b (vitamin E supplementedsubjects) which means vitamin Esupplementation did not either induce or reducethe bacterial load in leprosy patients.
Fig. 2 depicts the levels of plasma lipidperoxidation in control and experimentalsubjects. Lipid peroxidation is an organicexpression of free radical mediated changes tolipid and the end product of lipid peroxidation(LPO) is malondialdehyde which can bemeasured in plasma samples by their reactionwith thiobarbitutaric acid reactive substances. Wenoticed a sharp increase in the LPO in plasmawas observed in leprosy patients when comparedto control (compare group I vs group II), LPOlevels further increased in leprosy subjectsundergoing MDT (compare group II a vs groupII). Upon supplementation with antioxidantvitamin E (group II b) the LPO levels decreased(compare group II a Vs group II b).
Fig. 3 depicts the extent of DNA damagein single cells (WBC) in control and leprosyaffected persons. The tail length of the comet isdirectly proportional to the extent of DNAdamage in single cells. Single cells of multibacillary leprosy cases shows a significantly
Table 1. Levels of Superoxide, Hydroxyl and Hydrogen peroxide in the control and experimental subjects
Oxidative Stress Indices Group I Group II Group II a Group II b
Superoxide radicalin haemolysate(mmoles NBTreduced / 10 12 cells/ 10 min) 44 ± 5 110 ± 10 a 135 ± 11 b 73 ± 8 c
Hydroxyl radical in haemolysate(nmoles of MDA/ 1012 cells / hr) / 10 min) 10 ± 1 26 ± 2 a 36 ± 3 b 20 ± 2 c
Erythrocyte Hydrogen peroxide 62 ± 5 135 ± 13 a 172 ± 16b 90 ± 10 c
(mmoles / 1012 cells)
Values expressed as mean ± S.D.a- Group II compared with group Ib- Group II a compared with group IIc- Group II b compared with group II aValues are significant at p<0.05
Current Trends in Biotechnology and PharmacyVol. 3 (4) 428 - 439, October 2009. ISSN 0973-8916
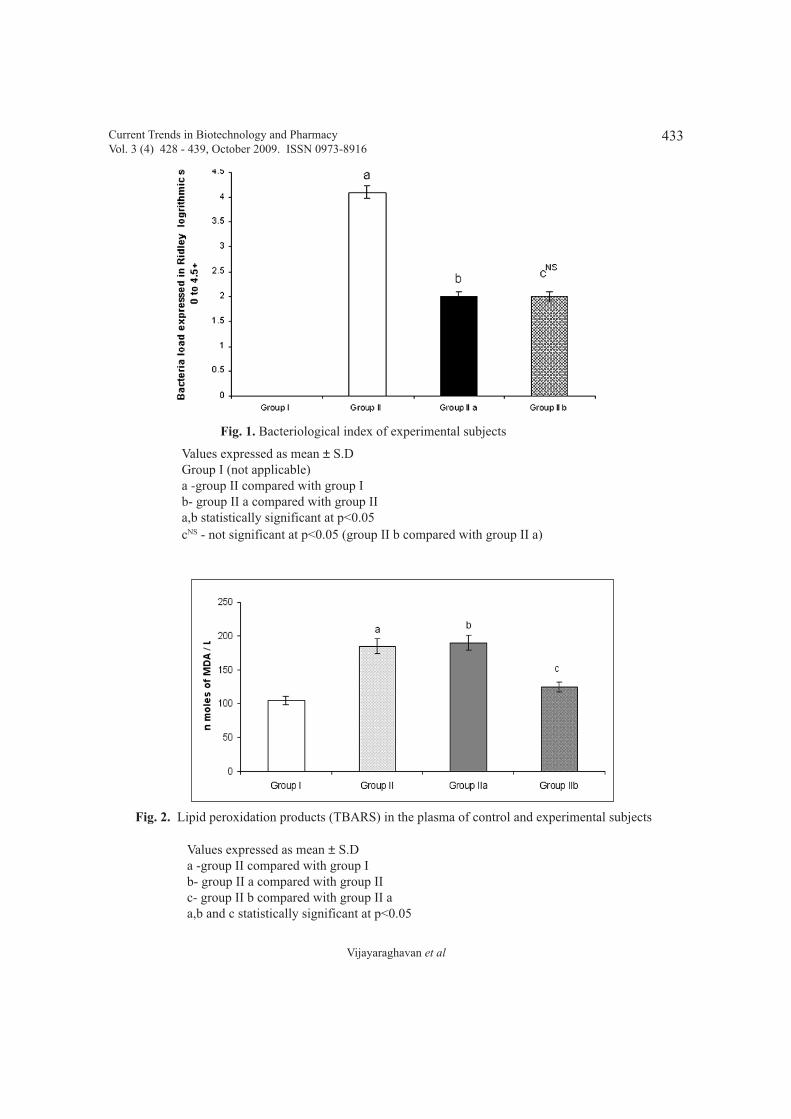
433
Vijayaraghavan et al
Fig. 1. Bacteriological index of experimental subjects
Values expressed as mean ± S.DGroup I (not applicable)a -group II compared with group Ib- group II a compared with group IIa,b statistically significant at p<0.05cNS - not significant at p<0.05 (group II b compared with group II a)
Values expressed as mean ± S.Da -group II compared with group Ib- group II a compared with group IIc- group II b compared with group II aa,b and c statistically significant at p<0.05
Current Trends in Biotechnology and PharmacyVol. 3 (4) 428 - 439, October 2009. ISSN 0973-8916
Fig. 2. Lipid peroxidation products (TBARS) in the plasma of control and experimental subjects
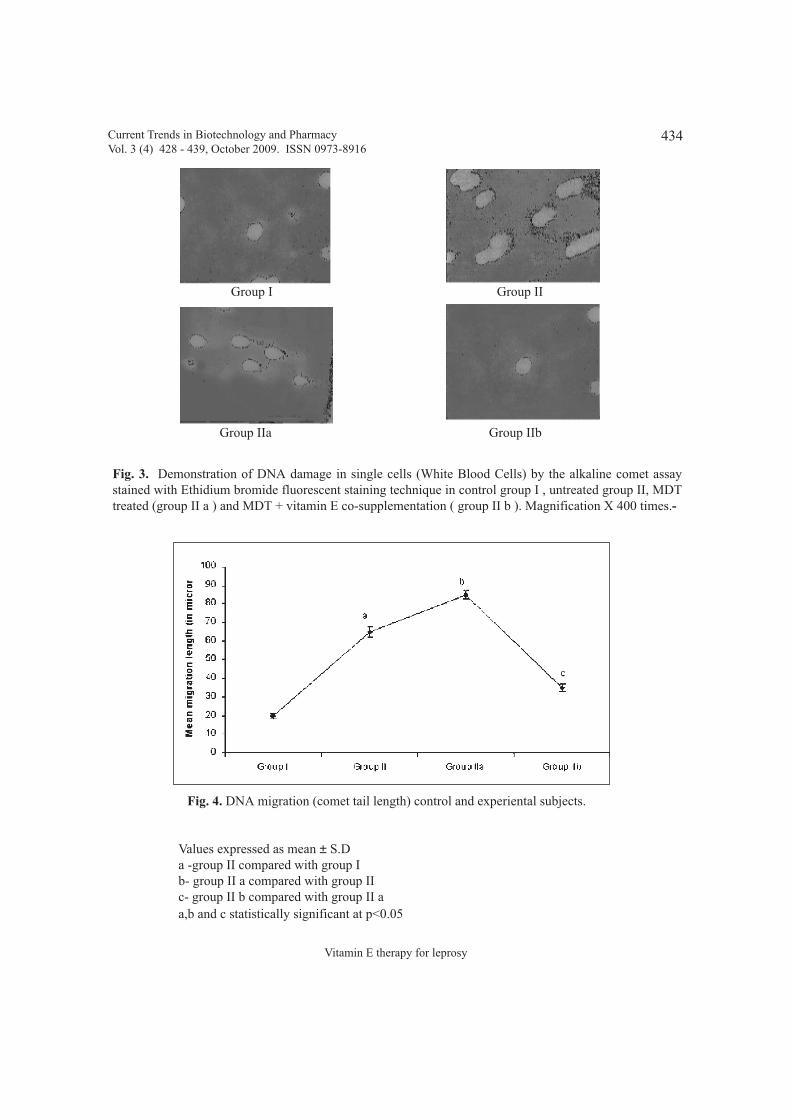
434
Vitamin E therapy for leprosy
Fig. 3. Demonstration of DNA damage in single cells (White Blood Cells) by the alkaline comet assaystained with Ethidium bromide fluorescent staining technique in control group I , untreated group II, MDTtreated (group II a ) and MDT + vitamin E co-supplementation ( group II b ). Magnification X 400 times.-
Group I Group II
Group IIa Group IIb
Values expressed as mean ± S.Da -group II compared with group Ib- group II a compared with group IIc- group II b compared with group II aa,b and c statistically significant at p<0.05
Current Trends in Biotechnology and PharmacyVol. 3 (4) 428 - 439, October 2009. ISSN 0973-8916
Fig. 4. DNA migration (comet tail length) control and experiental subjects.
435
Vijayaraghavan et al
increased tail length (P<0.05) indicates theincreased DNA damage in response to theinfection, Fig. 4. There was a significantprotection against the DNA damage in single cellsupon treatment with antioxidant vitamin E.
Discussion
The greatest paradox of aerobic respirationis oxygen, which is essential for energyproduction may also be detrimental, because itleads to the production of reactive oxygen species(26). Oxidative stress is a condition in whichthe elevated levels of ROS damage cells, tissuesand internal organs (27,28). Oxygen derived freeradicals are produced as a result of metabolismof oxygen biradical during reduction reactions(29). Superoxide radicals are unique in that it canlead to the formation of many other reactiveoxygen species including hydroxyl radical (HO
2).
Superoxide radicals also reacts with Hydrogenperoxide to generate the singlet oxygen molecule(30). The hydroxyl radicals are most potentoxidant encountered in the biological system,because they readily react with almost allbiological substrates (31). Hydrogen peroxideis not a radical by definition but it remains mostextensively as they are formed as a secondaryproduct of one-electron transfer oxidation ofoxygen biradical during reduction reaction (32).Oxidative DNA damage refers to the functionalor structural alterations of DNA resulting fromthe insults of ROS (33). DNA base modificationand DNA strand breaks are two of the majorforms of oxidative DNA damage caused by ROS.DNA also has the ability to repair itself againstthe toxic substances and deleterious effects ofreactive oxygen species (34,35). When theoxidative stress override the antioxidant status, aphysiological imbalance is produced in multibacillary leprosy patients, such imbalance exposethe DNA to persistent attack of ROS.
At molecular level, damage to DNA causedby ROS, oxidize the purine and pyrimidine bases,
there by result in gross changes in DNA such assingle strand breaks, sister chromatid exchangesand the formation of micronuclei during thechronic infectious disease process and treatmentwith drugs used in MDT. They are producedcontinuously in the cells either as accidental by-products of metabolism or deliberately during thepathogenesis of chronic infectious, inflammatorydiseases. It is difficult to block the oxidativestress-induced injury to cells or tissues becauseROS are continuously produced by cellularaerobic metabolism (36). Oxidative stress maybe limited by using chain-breaking antioxidantssuch as vitamin E which neutralizes hydroxyl,superoxide, and hydrogen peroxide radicals andprevents oxidative stress (37). In addition, it alsohelps in membrane stability and recycling ofvitamin C. In our earlier studies we have reportedfree radical mediated oxidation of lipids andproteins in untreated and MDT treated leprosypatients (38,39).
Dietary antioxidants form an essential partof the human antioxidant defense system. Fruitsand vegetables as well as daily dietarysupplements constitute the potential sources ofvarious antioxidants (38). The daily requirementof vitamin E varies from 50 to 800 mg. The‘antioxidant hypothesis’ proposes thatantioxidants like vitamin C, vitamin E,carotenoids present in fruits and fresh leafyvegetables afford protection against the oxidativedamage to cells and bio-molecules (39). Butleprosy patients do not get antioxidant rich dietlike fruits and fresh leafy vegetables everydayand moreover, the deranged liver function affectsthe homeostasis of in vivo antioxidant status inaffected individuals (40). Agnihotri et al, reportedhigher plasma LPO with decreased activity ofrenal brush border membrane in M.lepraeinfected mouse models (41). The elevation ofLPO in the plasma is considered as a cause fordegeneration of organs and tissues in leprosypatients. Lipid peroxides formed at the primary
Current Trends in Biotechnology and PharmacyVol. 3 (4) 428 - 439, October 2009. ISSN 0973-8916
436
Vitamin E therapy for leprosy
site could be transferred through blood circulationto other organs and tissues provoke damage bylipid peroxidation (42).
Mycobacterium leprae does not affect allthe individuals who are exposed to it, nor does itproduce the same degree of illness in those whobecome infected by it. A variety of risk factorshave been invoked to explain this variation indisease susceptibility and morbidity of whichnutrition plays a key role in determining the typeof disease. Leprosy afflicted patients are devoidof balanced food for various reasons like: lackof job opportunity, loss of social status, deformity,disfigurement, social stigma and further thederanged liver function as seen in leprosy patientscould affect the homeostasis of micronutrients.Further, the drugs used in MDT (multi drugtherapy) for treatment of leprosy is very effectivein controlling the proliferation of M.leprae but,during the mode of action produce copiousamount of oxygen-derived free radicals thisprocess could affect the functional integrity ofthe cells. In the present study we have noticed adecline in the oxidative stress indices uponsupplementation of antioxidant vitamin E whichcompel us to examine more and more onoxidative stress mediated changes to cells andbio-molecules in affected individuals. Advancesin understanding of the oxidative stress relatedchanges to biomolecules like lipid and DNA maylead to tools for use of specific drugs used incontrol programmes in leprosy and will providenew insights on Mycobacterium leprae virulence,pathogenecity and treatment of leprosy. Thisstudy offers an opportunity for correlating levelsof MDT therapy-induced DNA damage withadministered dose and modulating effect ofexogenous supplementation of antioxidantvitamin E in genotoxicity during the chroniccourse of the disease and anti-leprosychemotherapy.
Acknowledgements
Author acknowledge Dr. R. K. Jeevan Ram,Health and Safety Division, IGCAR, Kalpakkam,Tamil Nadu, India for providing training indetection of DNA damage in single cells. Authoralso thanks the Director, Central LeprosyTeaching and Research Institute, Chengalpattu,Tamilnadu, India for permitting to collect samplesfrom leprosy patients. Author thanks the leprosypatients for providing the vital benchmarks tomount the findings on.
References
1. Walker, S.L. and Lockwood, D.N.J. (2006).The clinical and immunological features ofleprosy. British Medical Bulletin. 77-78:103-121.
2. Roy, B. and Das, R.K. (1990). Evaluationof genotoxicity of clofazimine, an antileprosy drug in mice in vivo. I:Chromosomal analysis in bone marrow andspermatocytes, Mutation Research.241:161-168.
3. Jallow, D., Timothy, B. and McMillan, D.C.(1995). Dapsone induced haemolyticanemia, Drug Metabolism Reviews.27(182): 107-127.
4. Arutla, S.A., Ganga, S.A., Chinnappa, M.,Prabhakar. and Devarakonda R.K. (1998).Pro and antioxidant effects of someantileprotic drugs in vitro and theirinfluence on superoxide dismutase activity,Arzneim-Forsch/ Drug Resch. 48:1024-1027.
5. Vijayaraghavan, R., Suribabu, C.S., Sekar,B., Oommen, P.K., Kavithalakshmi, S.N.,Madhusudhanan, N. and Panneerselvam, C.(2005). Protective role of vitamin E on theoxidative stress in Hansen’s disease
Current Trends in Biotechnology and PharmacyVol. 3 (4) 428 - 439, October 2009. ISSN 0973-8916

437
Vijayaraghavan et al
(Leprosy) patients, Europen J ClinicalNutrition. 59:1121-1128.
6. Rojas, E.O., Wek, R.K., Arce, P., Patrick,P., (2002). Effect of exogenous peroxidaseon the evolution of murine leprosy, Int JLeprosy. 70:191-200.
7. Sahu, A., Saha, K., Banerjee, N.R., Sehga,V.N. and Jagga, C.R. (1991). Effect of antileprosy drugs on superoxide anionproduction by rat peritoneal macrophagewith special reference to light exposedclofazimine, Int. J. Immuno. Pharmacol. 13:419-428.
8. Rao, D.N. and Cederbaum (1997). A.comparative study on redox cycling of aquinone ( rifampicin S) and quinomine(rifambutin) antibiotic by rat livermicrosomes, Free radical Biol Med. 22:439-446.
9. Gandhi, G. and Singh, B., (2004). DNAdamage studies in untreated and treatedleprosy patients. Mutagenesis, 19:483 –488.
10. Vaz, M., Diffey, B., Auburn, J.W., Jacob.and Manjulika, V. (2001). Shouldnutritional status evaluation be included inthe initial needs assessment at leprosypatients with disability and socio-economicstatus. Leprosy Review, 72: 206-211.
11. Diffey, B., Vaz, M., Soares, M.J., Jacob, A.J.and Piers, L.S. (2000). The effect of leprosydeformity on the nutrition status index andtheir household members in rural southIndia : A socio-economic perspective. EurJ Clin Nutrition, 54: 643-649.
12. Rao, K.N., Saha, K. and Chakrabarti, A.K.(1987). Under nutrition in lepromatousleprosy. Part III. Micronutrients and theirtransport protein. Human Nutri Clin Nutri,41: 127-134.
13. Safarian, M.D., Karangezian, K.G.,Karapetian, E.T. and Avenesian, N.A.(1990). The efficiency of antioxidanttherapy in patients with tuberculosis oflungs and the correction of lipid peroxidationprocess. Probl Tuberk, 5: 40-44.
14. D’Souza, D. and Das, B.C. (1994).Genotoxic effect of Mycobacterium lepraeinfection in human. Mutation research, 305:211-222.
15 Liu, W., Liu, X.J.,Yu, O., Zhao, J., Lei, Z.L.and Li, L. (2003). A study on oxidativeDNA damage and lipid peroxidation Ipatients with tuberculosis pleurisy.Zhonghua Jie He He Hu Xi Za Zhi,26: 781-784.
16. Sahu, K. and Das, R.K. (1994). Reductionof clastogenic effect of clofazimine: anantileprosy drug , by vitamin A and vitaminC in bone marrow cells of mice. FoodChem toxicol, 32 (10): 911-915.
17. Muthukumar, T., Jayakumar, M., Edwin,M.F., Muthusethupathi, M.A. (2002). Acuterenal failure due to Rifampicin. AmericanJ. of Kidney disease, 40: 690-696.
18. Bhatia, V.N. (1987). Skin smearexamination in relation to multi drugtherapy campaigns. IndJ Leprosy, 59(1):75-78.
19. Quist, E.M. (1980). Regulation oferythrocyte membrane shape by calcium.Biochem Biophys Res Commun, 92:631-637.
20. Ridley, D.S. (1964). Bacterial indices: In:Cocharane RG and Davey TF (Edn)Leprosy in theory and practice. Baltimore,Williams and Wilkin, 620-622
21. Nishikimi, M., Rao, N.A. and Yagi, K.(1979). The occurrence of sulphoxide anion
Current Trends in Biotechnology and PharmacyVol. 3 (4) 428 - 439, October 2009. ISSN 0973-8916
438
Vitamin E therapy for leprosy
in relation to reduced phenazinemetabisulphae and molecular oxygen.Biochem Biophys Resch Commun, 46:849-854.
22. Gutteridge, J.M.C. (1981). Reactivity ofhydroxyl and hydroxyl-like radicaldiscriminated by release of thiobabituricacid-reactive material from deoxy sugars,nucleosides and benzoate. Biochem J,224:761-779.
23. Wolf, S.P. (1994). Ferrous ion oxidation inthe presence of ferric ion indicator xylenolorange for measurement of hydrogenperoxides. Methods Enzymol, 233:182-189.
24. Yagi, K. (1982). In: Lipid peroxides inBiology and Medicine. Academic Press,New York, 223-242.
25. Singh, N.P., Graham, M.M., Singh, V. andKhan, A. (1995). Induction of DNA singlestrand breaks in human lymphocytes by lowdoses of gama-rays. Int J Radiation Biol,68 (5): 563-569.
26. Saleh, R.A., Agarwal, A. (2002). Oxidativestress and male infertility: from researchbench to clinical practice. J Andrology , 23:737–752
27. Prasad Balasubramanya, C.V., Malikaurjun,V., Kodliwadmath, Girija BasavarajKodliwadmath. (2007). Erythrocytesuperoxide dismutase,Catalase activitiesand hydrogen peroxide induced lipidperoxidation in leprosy. Leprosy review,78(4): 391-397.
28. Saleh, R.A., Agarwal, A., Nada, E.A., El-Tonsy, M.H., Sharma, R.K., Meyer, A.,Nelson, D.R., Thomas, A.J. (2003).Negative effects of increased sperm DNAdamage in relation to seminal oxidative
stress in men with idiopathic and malefactor infertility. Fertil Steril. 79 (suppl3):597-1605.
29. Mark, T., Quinn, I.A., Schepetkin. (2009).Role of NADPH oxidase in formation andfunction of multinucleated giant cells, J ofInnate Immunity, 1: 509-526.
30. Esterbauer, H., Koller, E., Slee, R.G. andKoster, J.F. (1986). Possible involvementof the lipid peroxidation product 4-hydroxynonenal in the formation offluorescent chromolipids. Biochem J, 239:405-409.
31. Wilson, R.L. (1979). Hydroxyl radicals andbiological damage in vivo: What releavancein vivo?. In: Oxygen free radicals and tissuedamage. Ciba foundation symphosium 65,Expert Medica, Amsterdam, 19-42.
32. Amos, A.F., Trever, W.S., Robert, A.S.(2006). Hydrogen peroxide-inducedoxidative stress in MC3T3-E1 Cells: Theeffect of glutamate and production bypurines, Bone (Official Journal of Int Boneand Min Society), 39(3): 542-551.
33. Tice, R.R., Andrews, P.W. and Singh, N.P.(1990). The single cell gel assay: a sensitivetechnique for evaluating intracellulardifferences in DNA damage and repair. In:Methods for the detection of DNA damagein human cells, Sutherland B and WoodheadA (Edition), Plenum press, 291-301.
34. Demble, B. and Harrison, L. (1994). Repairof oxidative damage to DNA. Enzymologyand Biology: Ann Rev Biochem, 63: 915-948.
35. Javier, G.P., Jaumi, F., Aurelio, V.D.T.,Ester, V., Felix, J., Joaquin, J., Merce, P.and Antoni, C. (2009). Oxidative stress-induced DNA damage and cell cycleregulation in B65 dopaminergic cell line.Free radical Research, 43:985-994.
Current Trends in Biotechnology and PharmacyVol. 3 (4) 428 - 439, October 2009. ISSN 0973-8916
439
Vijayaraghavan et al
36. Davies, K.J. (2000). Oxidative stress,antioxidant defenses, and damage removal,repair, and replacement systems. IUBMBLife, 50: 279 -289.
37. Agarwal, A., Nallella, K.P., Allamaneni,S.S., Said, T.M. (2004). Role of antioxidantsin treatment of male infertility: an overviewof the literature. Reprod Biomed Online.616 –627.
38. Hincha, D. (2008). Effect of alphatocopherol (vitamin E) on the stability andlipid dynamics of a model membranemimicking the lipid composition of plantchloroplast membrane. FEBS letter, 568:3687-3692.
39. Tengerdy, R.P. (1990). The role of vitaminE in immune response and diseaseresistance. Ann NY Acad Sci, 587, 24-33.
39. Bergel, M. (1998). Metabolic theory ofLeprosy. Institute of Leprological research,Buenos Aires, Argentina.
40. Vaishnavi, C. (1994). Vitamins and essentialelements in Hansen’s disease. The Star,May-June, Pg 11.
41. Agnihotri, N., Ganguli, N.K., Kaur, S.,Khullur, M., Sharma, S.C. and Chaugh,K.S. (1995). Role of reactive oxygenspecies in renal damage in experimentalleprosy. Leprosy Review, 66:201-209.
42. Hiramatzu, K., Rosen, H., Heinecke, J.W.,Wolfbauer. and Chait, A. (1987).Superoxide initiates oxidation of lowdensity lipoproteins by human monocytes.Artherosclerosis. 7:55-60.
Current Trends in Biotechnology and PharmacyVol. 3 (4) 428 - 439, October 2009. ISSN 0973-8916
International Symposium on Emerging Trends inBiomedical and Nanobiotechnology:
Relevance to Human HealthDecember 19-21, 2009
VenueAcharya Nagarjuna University Guntur, India
Organized jointly by
Centre for Biotechnology and Department of NanotechnologyRegistration fee : Rs 600 if paid before November 15th 2009, Rs. 800 afterwardsRs. 500 for accompanying persons and students For international participants US $50 dollars.Invitation of Papers : Abstracts of the papers not more than 300 words should be submitted throughe-mail : ISEBN2009@gmail. com (or) [email protected] - Last date to submit abstracts is15th November, 2009.
For further information :
Prof. K.R.S. Sambasiva RaoDirector, ISEBN-2009
Centre for BiotechnologyAcharya Nagarjuna University
Nagarjunanagar – 522 510, Guntur, A.P., [email protected]

440
Controlled release of Losartan potassium matrix tablets
AbstractIn the present investigation an attempt has
been made to increase therapeutic efficacy,reduced frequency of administration andimproved patient compliance by developingcontrolled release matrix tablets of LosartanPotassium. Losartan Potassium was formulatedas oral controlled release matrix tablets by usingpoly(ethylene oxides) { Polyox WSR 303 }.Theaim of this study was to investigate the influenceof polymer level and type if fillers namely lactose[soluble filler], microcrystalline cellulose andanhydrous dibasic calcium phosphate [insolublefillers] on the release rate and mechanism ofLosartan Potassium from matrix tablets preparedby direct compression process. Higher polymericcontent in the matrix decreased the release rateof drug because of increased tortuosity anddecreased porosity. At lower polymeric level therate and extent of drug release was elevated. Onthe other hand, replacement of lactose withanhydrous dibasic calcium phosphate andmicrocrystalline cellulose have significantlyretarded the release rate of Losartan Potassium.
Key words: Losartan Potassium, Matrix tablets,Poly (ethylene oxides).
Formulation and Evaluation of Controlled release of Losartanpotassium matrix tablets using poly (Ethyleneoxides)
R. L. C. Sasidhar 1 *, S. Vidyadhara 1 , J. Ramesh Babu1 , R. Nagaraju 2 and
K. Prakash Reddy3
1Chebrolu Hanumaiah Institute of Pharmaceutical Sciences , Chowdavaram,Guntur-6, Andhra Pradesh, India
2Institute of Pharmaceutical Technology, Sri Padmavathi Women’sUniversity, Tirupathi, India
3Dr. Reddy’s laboratories, Hyderabad, India*For correspondence - [email protected]
IntroductionOral route has been one of the most
popular routes of drug delivery due to its ease ofadministration, patient compliance, least sterilityconstraints and flexible design of dosage forms.Hydrophilic polymeric matrices have attractedmany researchers due to their wide applicationsin controlled drug delivery. When the releasemedium (i.e. water) is thermodynamicallycompatible with a polymer, the polymer mayundergo relaxation process so that the polymerchains become more flexible and the matrixswells. This could allow the encapsulated drugto diffuse more rapidly out of the matrix. On theother hand, it would take more time for drug todiffuse out of the matrix since the diffusion pathis lengthened by matrix swelling. Moreover, ithas been widely known that swelling anddiffusion are not the only factors that determinethe rate of drug release (1). For dissolvablepolymer matrix, polymer dissolution is anotherimportant mechanism that can modulate the drugdelivery rate. While either swelling or dissolutioncan be the predominant factor for a specific typeof polymer (2), in most cases drug release kineticsis a result of a combination of these twomechanisms (3,4). Among the variety of
Current Trends in Biotechnology and PharmacyVol. 3 (4) 440 - 446, October 2009. ISSN 0973-8916

441
Sasidhar et al
Current Trends in Biotechnology and PharmacyVol. 3 (4) 440 - 446, October 2009. ISSN 0973-8916
hydrophilic polymers, poly(ethylene oxide)(PEO) is one of the most important material usedin the pharmaceutical industries mainly becauseof its non-toxicity, high water-solubility andswellability, insensitivity to the pH of thebiological medium and ease of production.Recently the swelling and dissolution behaviorof PEO tablets (5–8) and hydrogels [9] as wellas their influences on drug release characteristicshave been studied. It is found that, compared withlow molecular weight PEO, the high molecularweight PEO tablet swells to a greater extent andthe swelling of the polymer rather than thedissolution of the polymer is the governing factorfor drug release. The compression force appliedduring the manufacturing process, pH of therelease medium and the stirring rate do not affectthe drug release behavior significantly. Onemethod of fabricating controlled-release dosageforms is the incorporation of the drug in a matrixcontaining a hydrophilic, rate-controllingpolymer. Matrix systems are popular incontrolled-release formulation systems in termsof economic, process development and scale-upprocedures (10–13). Various cellulose derivativesare widely used in the pharmaceutical field asexcipients for the preparation of matrix systemsused in sustained release formulations (14).Several factors, such as the polymer type andconcentration, the drug particle size and thepresence of additives and excipients in the finalformulation can modify the drug release from thematrices (15–17). The present study on controlledrelease PEO matrix tablets containing LosartanPotassium with different types of diluents suchas Lactose, DCP & Microcrystalline cellulose,and their influence on matrix erosion and drugdiffusion to achieve steady state drug release wasperformed.
Materials and MethodsLosartan Potassium was kindly supplied
from Dr.Reddy’s Laboratories Ltd (Hyderabad),PEO’s { Polyox WSR 303}, Microcrystalline
cellulose (MCC)(Avicel PH 102) were obtainedfrom Dow chemicals Asia Pvt., Ltd., Mumbai.Dibasic calcium phosphate(DCP) and lactose andMagnesium stearate is of analytical grade andprocured commercially. All other chemicals wereof analytical grade and were used as received.
Preparation of matrix tabletsThe PEO matrix tablets containing
Losartan Potassium was prepared by a directcompression method. Poly (ethylene oxides)(POLYOX WSR 303) was used as a swellablehydrophilic polymer that controls drug releaserates. The Controlled release tablet formulationsconsisted of a drug & polymer were in the ratioof 1: 0.5, 1:0.75 and 1: 1 for Polyox WSR 303.The diluents such as Lactose, DCP &Microcrystalline cellulose were added at differentproportions to the matrix tablets to achieveuniform weight of all the matrix tabletformulations. The drug, polymer and diluent werescreened through #45 sieve and blended in a labscale double cone blender. The lubricant such asmagnesium stearate in the concentration of 0.5% was added and the blend was mixed againprior to compression. The drug blends weredirectly compressed by using cadmach rotarycompression machine using 9 mm flat punches.The different forms of tablets compressedtogether with their compositions are given in thetable 1.
Evaluation of TabletsThe prepared tablets were tested as per
standard procedure for weight variation (n = 20),hardness (n = 6), drug content, thickness (n =20) and friability(n = 20) characteristics. Matrixtablet hardness was determined by using aMonsanto tablet hardness tester (CampbellElectronics,Mumbai, India). Friability test (n =20) was conducted using Roche friabilator.Thickness of the tablets was measured by digitalVernier caliper . Drug content of LosartanPotassium was analyzed by measuring the

442
Controlled release of Losartan potassium matrix tablets
Current Trends in Biotechnology and PharmacyVol. 3 (4) 440 - 446, October 2009. ISSN 0973-8916
75 rpm using 900 mL of 0.1 N HCl (2 h) andphosphate buffered solution, pH 6.8 (PBS) (24h), as the dissolution media. Dissolution studieswere carried out in triplicate, maintaining the sinkconditions for all the formulations. A 5 ml aliquotof samples were withdrawn at regular timeintervals, filtered and assayed spectrophotome-trically at 205 nm. Some diffusion models
absorbance of standard and samples at λ = 205nm using UV/Visible spectrophotometer (Elicomodel SL-159).
In Vitro Drug Release CharacteristicsDrug release was assessed by dissolution
test under the following conditions: n = 6 (intriplicate), USP type II dissolution apparatus at
Table 1. Compositions of Various Matrix Tablet Formulations of Losartan Potassium
Formulations Ingredients[mg/tablet] F1 F2 F3 F4 F5 F6 F7 F8 F9
Losartan Potassium 100 100 100 100 100 100 100 100 10050
Polyox-WSR 303 50 75 100 50 75 100 50 75 100
Microcrystalline cellulose 148.5 123.5 98.5 — — — — — —
Dicalcium phosphate — — — 148.5 123.5 98.5 — — —
Lactose — — — — — — 148.5 123.5 98.5
Magnesium stearate 1.5 1.5 1.5 1.5 1.5 1.5 1.5 1.5 1.5
Total wt of tablet (mg) 300 300 300 300 300 300 300 300 300
Table 2. Pharmacokinetic Parameters of Various Matrix Tablet Formulations of Losartan Potassium
Formula First order Correlation Dissolution rate Correlation Peppas Correlationtions constants coefficient constants coefficient constant coefficient
(hr -1 ) (r) (mg/hr 1\2 ) (r) (n) (r)
F01 0.268 0.9976 34.65 0.9971 0.77 0.9974
F02 0.152 0.9957 26.62 0.9980 0.59 0.9917
F03 0.116 0.9952 23.62 0.9979 0.62 0.9922
F04 0.199 0.9970 33.17 0.9995 0.65 0.9931
F05 0.110 0.9967 24.99 0.9983 0.63 0.9911
F06 0.087 0.9895 22.32 0.9988 0.64 0.9915
F07 0.338 0.9803 43.07 0.9963 0.89 0.9958
F08 0.151 0.9819 32.69 0.9916 0.85 0.9983
F09 0.138 0.9856 26.51 0.9934 0.80 0.9940
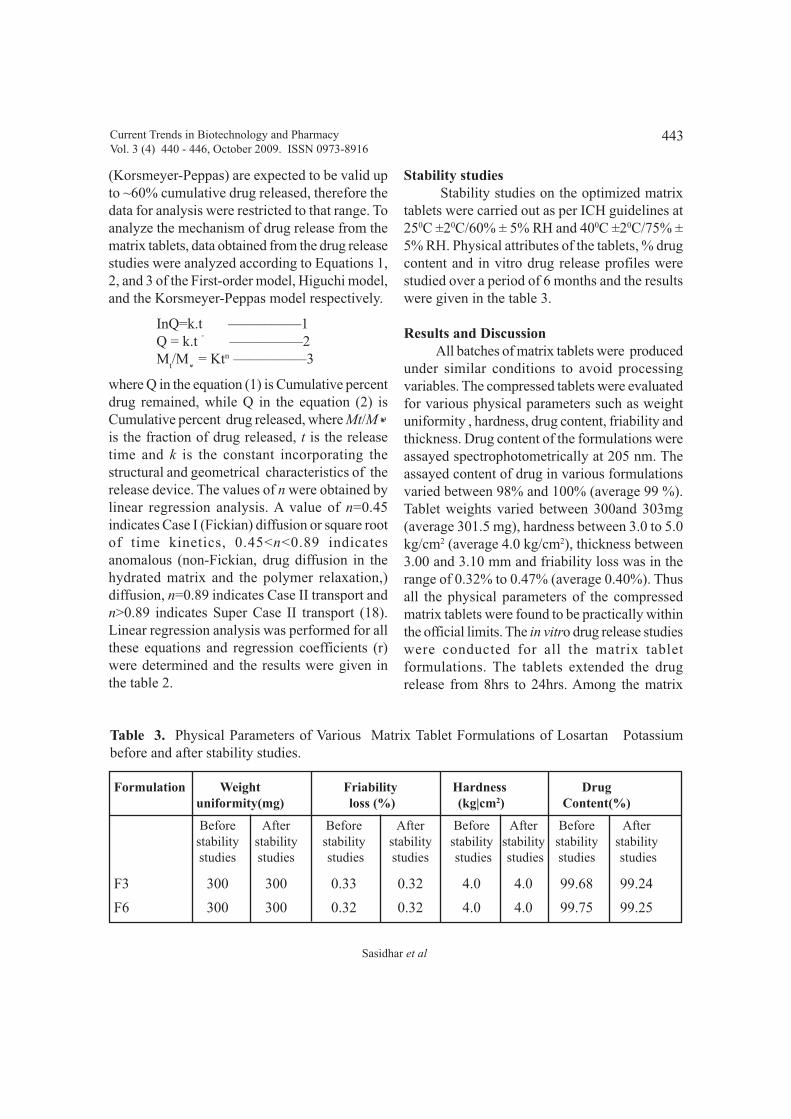
443
Sasidhar et al
Current Trends in Biotechnology and PharmacyVol. 3 (4) 440 - 446, October 2009. ISSN 0973-8916
(Korsmeyer-Peppas) are expected to be valid upto ~60% cumulative drug released, therefore thedata for analysis were restricted to that range. Toanalyze the mechanism of drug release from thematrix tablets, data obtained from the drug releasestudies were analyzed according to Equations 1,2, and 3 of the First-order model, Higuchi model,and the Korsmeyer-Peppas model respectively.
InQ=k.t —————1Q = k.t ˚ —————2M
t/M
á = Ktn —————3
where Q in the equation (1) is Cumulative percentdrug remained, while Q in the equation (2) isCumulative percent drug released, where Mt/Má
is the fraction of drug released, t is the releasetime and k is the constant incorporating thestructural and geometrical characteristics of therelease device. The values of n were obtained bylinear regression analysis. A value of n=0.45indicates Case I (Fickian) diffusion or square rootof time kinetics, 0.45<n<0.89 indicatesanomalous (non-Fickian, drug diffusion in thehydrated matrix and the polymer relaxation,)diffusion, n=0.89 indicates Case II transport andn>0.89 indicates Super Case II transport (18).Linear regression analysis was performed for allthese equations and regression coefficients (r)were determined and the results were given inthe table 2.
Stability studies Stability studies on the optimized matrix
tablets were carried out as per ICH guidelines at250C ±20C/60% ± 5% RH and 400C ±20C/75% ±5% RH. Physical attributes of the tablets, % drugcontent and in vitro drug release profiles werestudied over a period of 6 months and the resultswere given in the table 3.
Results and DiscussionAll batches of matrix tablets were produced
under similar conditions to avoid processingvariables. The compressed tablets were evaluatedfor various physical parameters such as weightuniformity , hardness, drug content, friability andthickness. Drug content of the formulations wereassayed spectrophotometrically at 205 nm. Theassayed content of drug in various formulationsvaried between 98% and 100% (average 99 %).Tablet weights varied between 300and 303mg(average 301.5 mg), hardness between 3.0 to 5.0kg/cm2 (average 4.0 kg/cm2), thickness between3.00 and 3.10 mm and friability loss was in therange of 0.32% to 0.47% (average 0.40%). Thusall the physical parameters of the compressedmatrix tablets were found to be practically withinthe official limits. The in vitro drug release studieswere conducted for all the matrix tabletformulations. The tablets extended the drugrelease from 8hrs to 24hrs. Among the matrix
Table 3. Physical Parameters of Various Matrix Tablet Formulations of Losartan Potassiumbefore and after stability studies.
Formulation Weight Friability Hardness Druguniformity(mg) loss (%) (kg|cm2) Content(%)
Before After Before After Before After Before Afterstability stability stability stability stability stability stability stabilitystudies studies studies studies studies studies studies studies
F3 300 300 0.33 0.32 4.0 4.0 99.68 99.24
F6 300 300 0.32 0.32 4.0 4.0 99.75 99.25
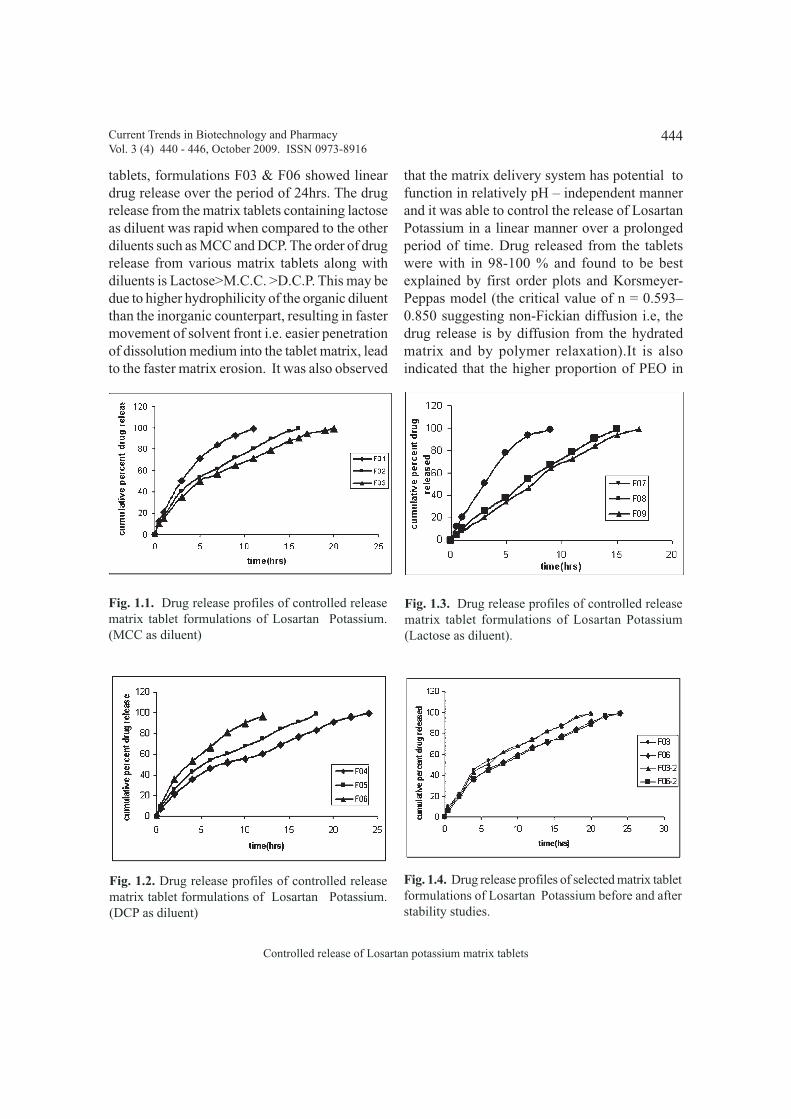
444
Controlled release of Losartan potassium matrix tablets
Current Trends in Biotechnology and PharmacyVol. 3 (4) 440 - 446, October 2009. ISSN 0973-8916
tablets, formulations F03 & F06 showed lineardrug release over the period of 24hrs. The drugrelease from the matrix tablets containing lactoseas diluent was rapid when compared to the otherdiluents such as MCC and DCP. The order of drugrelease from various matrix tablets along withdiluents is Lactose>M.C.C. >D.C.P. This may bedue to higher hydrophilicity of the organic diluentthan the inorganic counterpart, resulting in fastermovement of solvent front i.e. easier penetrationof dissolution medium into the tablet matrix, leadto the faster matrix erosion. It was also observed
that the matrix delivery system has potential tofunction in relatively pH – independent mannerand it was able to control the release of LosartanPotassium in a linear manner over a prolongedperiod of time. Drug released from the tabletswere with in 98-100 % and found to be bestexplained by first order plots and Korsmeyer-Peppas model (the critical value of n = 0.593–0.850 suggesting non-Fickian diffusion i.e, thedrug release is by diffusion from the hydratedmatrix and by polymer relaxation).It is alsoindicated that the higher proportion of PEO in
Fig. 1.4. Drug release profiles of selected matrix tabletformulations of Losartan Potassium before and afterstability studies.
Fig. 1.1. Drug release profiles of controlled releasematrix tablet formulations of Losartan Potassium.(MCC as diluent)
Fig. 1.2. Drug release profiles of controlled releasematrix tablet formulations of Losartan Potassium.(DCP as diluent)
Fig. 1.3. Drug release profiles of controlled releasematrix tablet formulations of Losartan Potassium(Lactose as diluent).

445
Sasidhar et al
Current Trends in Biotechnology and PharmacyVol. 3 (4) 440 - 446, October 2009. ISSN 0973-8916
the matrix results in the delay of drug release overan extended period of time. Formulations F3 andF6 are prepared with highest proportion of PEOthan other formulations. The stability studies onselected formulations were carried out for 6months as per ICH guidelines. Under the specificstorage conditions, no significant changes inLosartan Potassium profiles from the preparedtablets was observed. The result of stability testsindicated that Losartan Potassium releaseproperties from the prepared tablets were stableunder the accelerated stability storage conditions.
ConclusionsThis work has provided a novel and simple
approach to formulate an oral, swellablemonolithic controlled release delivery systemdesigned for delivery of Losartan Potassium overan extended period of time. An important featureof this system is the potential for generatingconstant drug release. The formulations F3 & F6are considered to be best formulations and canfurther evaluated for Invivo pharmacokineticstudies.
AcknowledgementsThe authors are thankful to Chebrolu
Hanumaiah Institute of pharmaceutical sciencesfor providing necessary facilities and for constantencouragement.
References1. Sujja-areevath, J., Munday, D.L., Cox, P.J.
and Khan, K.A. (1998). Relationshipbetween swelling, erosion and drug releasein hydrophilic natural gum mini-matrixformulations, Eur. J.Pharm. Sci. 6:207– 217.
2. Lee, P.I. (1981). In: D.H. Lewis (Ed.).Controlled Release of Pesticides andPharmaceuticals, Plenum Press, New York,39– 48.
3. Tahara, K., Yamamoto, K. and Nishihata,T. (1995). Overall mechanism behind
matrix sustained release (SR) tabletsprepared with hydroxypropyl methyl-cellulose 2910, J. Control. Release 35:59–66.
4. Efentakis, M. and Buckton, G. (2002). Theeffect of erosion and swelling on thedissolution of theophylline from low andhigh viscosity sodium alginate matrices,Pharm. Dev. Technol. 7:69– 77.
5. Apicella, A., Cappello, B., Nobile, M.A.D.,Rotonda, M.I.L., Mensitieri. and G. L.Nicolais, (1993). Poly (Ethylene Oxide)(PEO) and different molecular-weight PEOblends monolithic devices for drug release,Biomaterials. 14:83–90.
6. Kim, C.J. (1995). Drug release fromcompressed hydrophilic polyoxRWSRtablets, J. Pharm. Sci. 84:303– 306.
7. Kim, C.J. (1995). Compressed donut-shaped tablets with zero-order releasekinetics, Pharm. Res. 12:1045–1048.
8. Maggi, L., Segale, L., Torre, M.L.,Machiste, E.O. and Conte, U. (2002).Dissolution behavior of hydrophilic matrixtablets containing two differentpolyethylene oxides (PEOs) for thecontrolled release of a water-soluble drug.Dimensionality study, Biomaterials.23:1113– 1119.
9. Savas, H. and Gqven, O. (2001).Investigation of active substance releasefrom poly(ethylene oxide) hydrogels, Int.J. Pharm. 224:151– 158.
10. Takka, S., Rajbhandari, S. and Sakr, A.(2001). Effect of anionic polymers on therelease rate of Propronolol Hydrochloridefrom matrix tablets, Eur. J.Pharm.Biopharm. 52:75–82.
11. Cameron, C.G. and McGinity, J.W. (1987).

446
Controlled release of Losartan potassium matrix tablets
Current Trends in Biotechnology and PharmacyVol. 3 (4) 440 - 446, October 2009. ISSN 0973-8916
Controlled release theophylline tabletformulations containing acrylic resins, II.Combination resin formulations, Drug Dev.Ind. Pharm. 13 1409–1427.
12. Rekhi, G.S., Nellore, R.V., Hussain, A.S.,Tillman, L.G., Malinowski, H.J. andAugsburger, L.L. (1999). Identification ofcritical formulation and processingvariables for metoprolol tartarate extendedrelease (ER)matrix tablets, J. ControlledRelease. 59:327–342.
13. Vandelli, M.A., Leo, E., Foni, F. andBernabei, M. T. (1998). Drug release fromperforated matrices containingHydroxypropylcellulose, Int. J.Pharm.171:165–175.
14. Akbari, J., Adrangi, M., Farid, D., Siahi-Shadbad, M.R., Saeedi, M. and Nokhodchi,A. (2000). The effect of various factors onthe release rate of poorly soluble drug(carbamazepine) from Hydroxypropyl
methylcellulose matrices, STP Pharmacol.Sci. 10:473–478.
15. Ford, J.L., Rubinstein, M.H., McCaul, F.,Hogan, J.E. and Edgar, P. (1987).Importance of drug type, tablet shape andadded diluents on drug release kinetics fromHydroxypropylmethylcellulose matrixtablets 40:223–234.
16. Feely, L.C. and Davis, S.S. (1988). Theinfluence of polymeric excipients on drugrelease from Hydroxypropyl-methylcellulose matrices, Int. J. Pharm.41:83–90.
17. Hogan, J.E. (1998). Hydroxypropy lmethylcellulose sustained release technology,Drug Dev. Ind. Pharm. 15:975–999.
18. Korsmeyer, R. W., Gurny, R., Doelker, E.,Buri, P. and Peppas. N. A. (1983).Mechanisms of solute release from poroushydrophilic polymers, Int. J. Pharm. 15:25–35.
447
In vitro rooting from callus cultures of Erythrina variegata L.
Current Trends in Biotechnology and PharmacyVol. 3 (4) 447-452 October 2009. ISSN 0973-8916
AbstractShoot differentiation from seedling
explants of Erythrina variegata, an importantmedicinal plant, was tried on Murashige andSkoog’s (MS) medium containing different plantgrowth regulators, but without any success. Thus,Erythrina variegata appeared to be a highlyrecalcitrant leguminous plant. However,rhizogenesis was frequent and achieved directlyfrom different seedling explants (stem, leaf androots) as well as from explant derived calli. Rootswere produced along with callus formation. NAAis the most effective auxin for induction of roots.Natural auxins IAA and IBA were also used forrooting. The media used were (1) MS + 2 mg/l2,4-D + 1 mg/l NAA and (2) MS + 2 mg/l 2,4-D+ 1 mg/l BAP + 1 mg/l IBA for in vitro inductionof roots from root, stem and leaf calli respectively.Thus, like in other legumes, in the present studyalso, Erythrina displayed a strong ability for invitro rhizogenesis than caulogenesis.
Key words: Rhizogenesis, Auxins, Adventitiousroots.
Abbreviations: BAP- 6-benzylaminopurine,NAA- a-naphthaleneacetic acid, IBA- indole-3-butyric acid, IAA- indole-3-acetic acid, 2,4-D-2,4-dichlorophenoxyacetic acid.
IntroductionMost seed legumes have a higher
propensity for root formation than for shootformation. For most species, the frequency of rootinitiation is quite high despite the concentrationsof cytokinins in media. Only root initiation wasobserved in earlier efforts to obtain shootregeneration for Psophocarpus tetragonolobus(1), Glycine max (2) and Phaseolus vulgaris (3).Root formation occurs prior to shoot regenerationin Stylosanthes hamata (4). Forage legumes willform roots but at a lower frequency than seedlegumes. Though root differentiation in in vitrois frequent, difficulty in root formation has alsobeen reported in both Trifolium pratense (5) andLathyrus sativus (6). Numerous studies haveindicated that, among the common auxins, NAAis the most effective auxin for induction of rootregeneration (7, 8). Usually natural auxin IAAand synthetic auxin NAA and IBA are used forrooting. Janes et al (9) used filter sterilized IBAin their experiments. Auxins alone or withcytokinins, GA
3, ABA and phenolics exert their
effect mainly during the root induction andinitiation phase. In many plant species it wasshown that optimal root formation occurred inthe presence of auxins and cytokinins (10). Theaim of the present study was to induce somaticembryogenesis or whole plants from Erythrina.
In vitro rooting from callus cultures derived from seedlingexplants of Erythrina variegata L.
T. Shasthree, M. A. Imran and B. MallaiahPlant Cell and Tissue Culture Laboratory
Department of Botany, Kakatiya University, Warangal – 506 009, IndiaFor correspondence - [email protected]

448
Shasthree et al
However, all our efforts failed in the inductionof shoots or somatic embryos.Materials and Methods
The seeds of Erythrina variegata werecollected from a locally available variety. Theseeds were germinated in pots. Young healthyleaf, stem, cotyledon and root explants wereisolated, washed with 1% laboline and kept underrunning tap water for 30 minutes andsubsequently surface sterilized with 0.1%
mercuric chloride for 2 minutes. The explantswere washed with sterile distilled water 3-4 times.The medium was supplemented with 0.5 mg/l to2 mg/l auxins (NAA, IBA, IAA and 2,4-D) and2 mg/l to 4 mg/l cytokinins (Kn and BAP). Allmedia were autoclaved at a temperature of 1210C (15 psi) for 20 minutes. The percentage ofrhizogenesis was recorded from each explantdirectly or via explant derived callus. Root andshoot (only on one occasion) lengths in mm were
Fig. 1 Rhizogenesis from stem cultures of Erythrinavariegata L. a) Induction of roots from stem derived calluson MS + 2.0 mg/l 2,4-D + 1.0mg/l BAP + 1.0 mg/l IBA.b) Induction of single root from cotyledon derived calluson MS +2.0 mg/l 2,4-D+1.0 mg/l BAP + 2.0 mg/l NAA.c) The direct rooting from stem explant before callus is in-duced on MS +2.0 mg/l 2,4-D+1.0 mg/l BAP + 2.0 mg/lIBA. d) Roots with root caps formed from stem explantcultures on MS +2.0 mg/l 2,4-D+1.0 mg/l Kn + 1.5 mg/lIBA.
Fig. 2 Rhizogenesis from different explant cultures ofErythrina variegata L. a) Direct multiple root productionfrom leaf cultures on MS + 1.0mg/l BAP + 2.0 mg/ NAA.b) Single root production from stem explant culture on theMS + 2.0 mg/l 2,4-D + 2.0 mg/l BAP + 2.0 mg/l NAA.c) Induction of small adventitious roots from stem explanton MS + 2.0 mg/l 2,4-D+1.0 mg/l NAA + 1.0 mg/l IAA.d) Rooting from root cultures on MS + 2.0 mg/l 2,4-D + 1.0mg/l NAA.
Current Trends in Biotechnology and PharmacyVol. 3 (4) 447-452 October 2009. ISSN 0973-8916
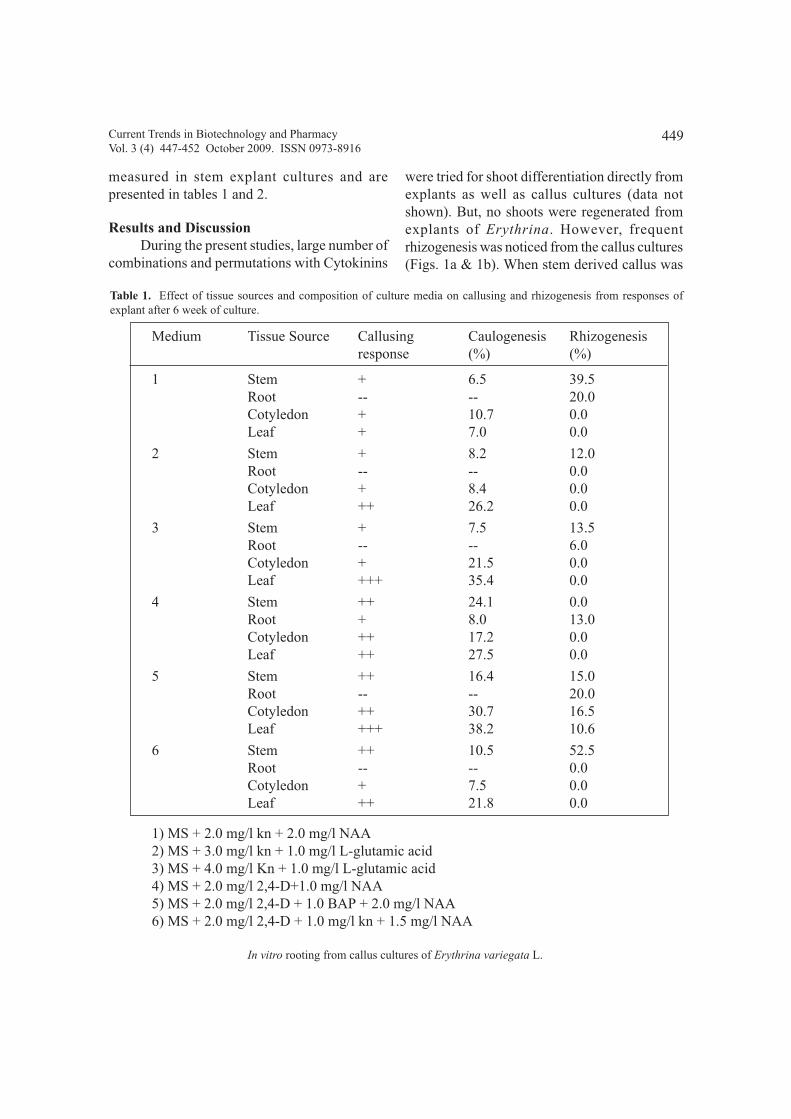
449
In vitro rooting from callus cultures of Erythrina variegata L.
measured in stem explant cultures and arepresented in tables 1 and 2.
Results and DiscussionDuring the present studies, large number of
combinations and permutations with Cytokinins
were tried for shoot differentiation directly fromexplants as well as callus cultures (data notshown). But, no shoots were regenerated fromexplants of Erythrina. However, frequentrhizogenesis was noticed from the callus cultures(Figs. 1a & 1b). When stem derived callus was
Table 1. Effect of tissue sources and composition of culture media on callusing and rhizogenesis from responses ofexplant after 6 week of culture.
Medium Tissue Source Callusing Caulogenesis Rhizogenesisresponse (%) (%)
1 Stem + 6.5 39.5Root -- -- 20.0Cotyledon + 10.7 0.0Leaf + 7.0 0.0
2 Stem + 8.2 12.0Root -- -- 0.0Cotyledon + 8.4 0.0Leaf ++ 26.2 0.0
3 Stem + 7.5 13.5Root -- -- 6.0Cotyledon + 21.5 0.0Leaf +++ 35.4 0.0
4 Stem ++ 24.1 0.0Root + 8.0 13.0Cotyledon ++ 17.2 0.0Leaf ++ 27.5 0.0
5 Stem ++ 16.4 15.0Root -- -- 20.0Cotyledon ++ 30.7 16.5Leaf +++ 38.2 10.6
6 Stem ++ 10.5 52.5Root -- -- 0.0Cotyledon + 7.5 0.0Leaf ++ 21.8 0.0
1) MS + 2.0 mg/l kn + 2.0 mg/l NAA2) MS + 3.0 mg/l kn + 1.0 mg/l L-glutamic acid3) MS + 4.0 mg/l Kn + 1.0 mg/l L-glutamic acid4) MS + 2.0 mg/l 2,4-D+1.0 mg/l NAA5) MS + 2.0 mg/l 2,4-D + 1.0 BAP + 2.0 mg/l NAA6) MS + 2.0 mg/l 2,4-D + 1.0 mg/l kn + 1.5 mg/l NAA
Current Trends in Biotechnology and PharmacyVol. 3 (4) 447-452 October 2009. ISSN 0973-8916
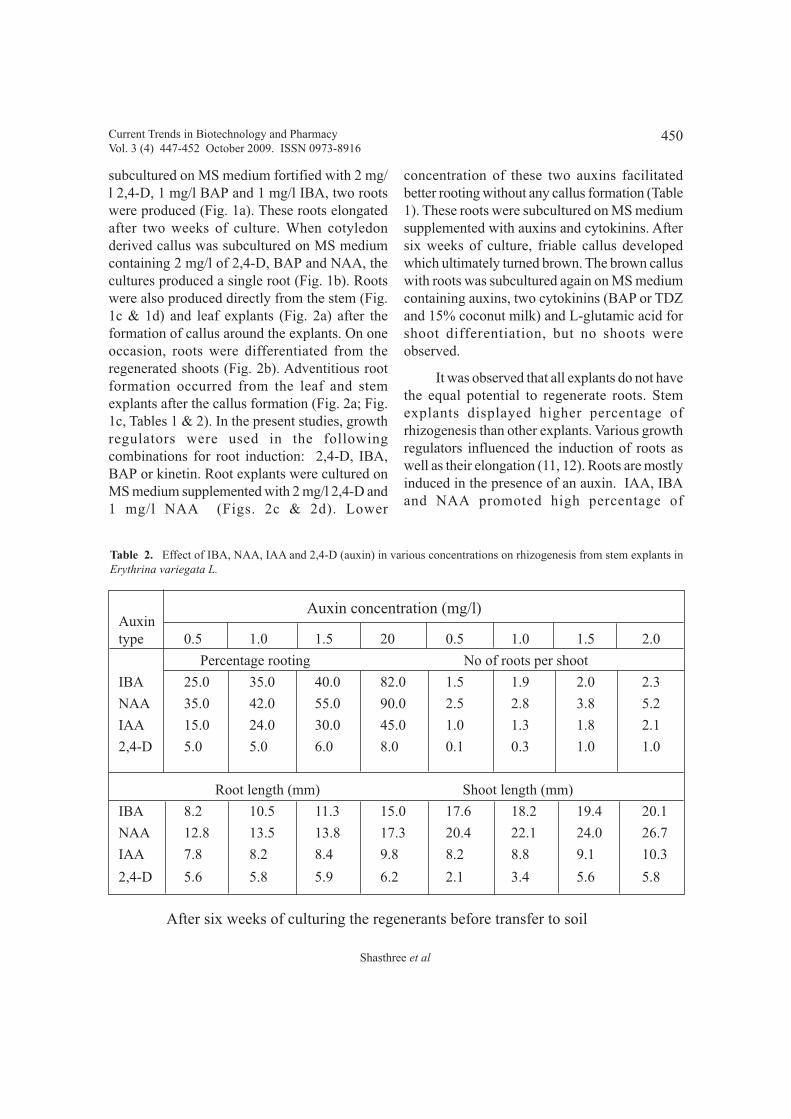
450
Shasthree et al
subcultured on MS medium fortified with 2 mg/l 2,4-D, 1 mg/l BAP and 1 mg/l IBA, two rootswere produced (Fig. 1a). These roots elongatedafter two weeks of culture. When cotyledonderived callus was subcultured on MS mediumcontaining 2 mg/l of 2,4-D, BAP and NAA, thecultures produced a single root (Fig. 1b). Rootswere also produced directly from the stem (Fig.1c & 1d) and leaf explants (Fig. 2a) after theformation of callus around the explants. On oneoccasion, roots were differentiated from theregenerated shoots (Fig. 2b). Adventitious rootformation occurred from the leaf and stemexplants after the callus formation (Fig. 2a; Fig.1c, Tables 1 & 2). In the present studies, growthregulators were used in the followingcombinations for root induction: 2,4-D, IBA,BAP or kinetin. Root explants were cultured onMS medium supplemented with 2 mg/l 2,4-D and1 mg/l NAA (Figs. 2c & 2d). Lower
concentration of these two auxins facilitatedbetter rooting without any callus formation (Table1). These roots were subcultured on MS mediumsupplemented with auxins and cytokinins. Aftersix weeks of culture, friable callus developedwhich ultimately turned brown. The brown calluswith roots was subcultured again on MS mediumcontaining auxins, two cytokinins (BAP or TDZand 15% coconut milk) and L-glutamic acid forshoot differentiation, but no shoots wereobserved.
It was observed that all explants do not havethe equal potential to regenerate roots. Stemexplants displayed higher percentage ofrhizogenesis than other explants. Various growthregulators influenced the induction of roots aswell as their elongation (11, 12). Roots are mostlyinduced in the presence of an auxin. IAA, IBAand NAA promoted high percentage of
Table 2. Effect of IBA, NAA, IAA and 2,4-D (auxin) in various concentrations on rhizogenesis from stem explants inErythrina variegata L.
Auxin concentration (mg/l)Auxintype 0.5 1.0 1.5 20 0.5 1.0 1.5 2.0
Percentage rooting No of roots per shoot
IBA 25.0 35.0 40.0 82.0 1.5 1.9 2.0 2.3
NAA 35.0 42.0 55.0 90.0 2.5 2.8 3.8 5.2
IAA 15.0 24.0 30.0 45.0 1.0 1.3 1.8 2.1
2,4-D 5.0 5.0 6.0 8.0 0.1 0.3 1.0 1.0
Root length (mm) Shoot length (mm)
IBA 8.2 10.5 11.3 15.0 17.6 18.2 19.4 20.1
NAA 12.8 13.5 13.8 17.3 20.4 22.1 24.0 26.7
IAA 7.8 8.2 8.4 9.8 8.2 8.8 9.1 10.3
2,4-D 5.6 5.8 5.9 6.2 2.1 3.4 5.6 5.8
After six weeks of culturing the regenerants before transfer to soil
Current Trends in Biotechnology and PharmacyVol. 3 (4) 447-452 October 2009. ISSN 0973-8916

451
In vitro rooting from callus cultures of Erythrina variegata L.
rhizogenesis in general. However, in the presentstudy, IBA showed no promotive effect on lateralroot induction. On the other hand, NAA showedthe most positive effect on induction andelongation of lateral roots (Table 2). Such aneffect of NAA was also observed by Taylor et al(13) in tomato. The capacity of phenoliccompounds to act as auxin synergists in therooting process is well known, although the modeof action remains obscure. The difficulty ininducing in vitro rooting in woody species (14)led to explore the phenolics and they obtainedsatisfactory results with phloroglucinol.Subsequently, the in vitro root inducing capacityof phenolics was demonstrated in applerootstocks (15), Fragaria (16), Prunus insititia(14). According to Mosella Chancel et al (17)phenolics specifically act on the middle phase,the “initiation phase” of rhizogenesis. James etal (18) reported that the presence ofphloroglucinol during the shoot proliferationstage significantly promoted root formation whenmeasured as rooting percentage or number ofroots per shoot.
The concentration of agar in rooting shouldvary from 0.6-0.8%. Anderson (19) considers thatits concentration should be as low as possible forrooting. Physiologically, agar is not a completelyinert material, and is a source of various types ofsubstances which may affect growth. Agar, thus,may result in poor root growth in certain sensitivespecies. Lane (20) reported rooting inhibition inSequea and Prunus when 0.6% agar was used.Kitto et al (7) observed an inverse relationshipbetween the rooting ability and agarconcentration. In addition to the presence ofpossible growth inhibiting substances, the reasonfor poor rooting in agar medium may also be dueto poor aeration and a slow rate of diffusion ofthe toxic metabolic wastes released by growingtissue. Two methods are commonly used tocircumvent the inhibitory effect of agar medium:(a) supplementing fine powder of activated
charcoal to the agar medium; and (b) using aliquid and filter-paper-bridge system in place ofagar. Activated charcoal may absorb toxicsubstances in the medium, thereby improvingroot regeneration and development (21, 22). Itmay also absorb residual cytokinin from medium.Takayama et al (22) reported an inhibition of rootformation of Lilium by BA. Such an inhibitionwas completely reversed by the addition ofcharcoal. Media, in general, having a lowconcentration of salts and sugar provedsatisfactory for rooting of shoots.
Reference1. Bottino, P.J., Maire, C.E. and Goff, L.M.
(1979). Tissue Culture and organogenesisin the winged bean. Can. J. Bot, 57 : 1773-1776.
2. Evan, D.A., Sharp, W.R. and Paddock,E.F. (1976). Variation in callusproliferation and root morphogenesis inleaf tissue cultures of Glycine max strainT 219. Phytomorphology, 26 : 379-384.
3. Haddon, L. and Northcote, D.H. (1976).The influence of gebberellic acid andabscisic acid on cell and tissuedifferentiation of bean callus. J. Cell Sci,20 : 47-55.
4. Scowcroft, W.R. and Adamson, J.A.(1976). Organogenesis from calluscultures of the legume, Stylosantheshamata. Plant Sci. Lett, 7 : 39-42.
5. Phillips, G.C. and Collins, G.B. (1979).In vitro tissue culture of selected legumesand plant regeneration from callus culturesof red clover. Crop Sci, 19 : 59-64.
6. Mukhopadhyay, A. and Bhojwani, S.S.(1978). Shoot bud differentiation in tissuecultures of leguminous plants. Z.Pflanzenphysiol, 88 : 263-268.
Current Trends in Biotechnology and PharmacyVol. 3 (4) 447-452 October 2009. ISSN 0973-8916
452
7. Kitto, S.L. and Young, M.J. (1981). Invitro propagation of Carrizo citrange.Hort. Science, 16 : 305-306.
8. Johnson, B.B. (1978). In vitro propagationof Episcia cupreata. Hort Science, 13: 596.
9. Jones, O.P., Hopgood, M.E., O’Farrell, D.(1977a). Propagation in vitro of M26 appleroot stocks. J. Hortic. Sci, 52 : 235-238.
10. Dudits, D., Nemeth, G. and Haydu, Z.(1975). Study of callus growth and organformation in wheat Triticum aestivumtissue culture. Can. J. Bot, 53 : 957-963.
11. Balvanyos, I., Kursinszki, L. and Szoke,E. (2001). The effect of plant growthregulators on biomass formation andlobeline production of Lobelia inflata L.hairy root cultures. Plant Growth Reg, 34:339-345.
12. Balestri, E. and Bertini, S. (2003). Growthand development of Posidonia oceanicaseedlings treated with plant growthregulators : Possible implications formeadow restoration. Aquat. Bot, 76 : 291-297.
13. Taylor, J.L.S. and Van Staden, J. (1998).Plant-derived smoke solutions stimulatethe growth of Lycopersicon esculentumroots in vitro. Plant Growth Reg, 26 : 77-83.
14. Jones, O.P. and Hopgood, M.E. (1979).The successful propagation in vitro of tworoot stocks of Prunus. The plum root stockPixy (P. insititia) and the every root stockF12/1 (P. avium). J. Hort. Sci, 54 : 63-66.
15. James and Thurbon, I.J. (1979). Rapid invitro rooting of the apple rootstock M-9.J. Hort. Sci, 54 : 309-311.
16. James, D.J. (1979). The role of auxins andphloroglucinol in adventitious rootformation in Rubus and Fragaria grownin vitro. J. Hort. Sci, 54 : 273-277.
17. Mosella Chancel, L., Mactteix, J.J. andJonard, R. (1980). Les conditions dumicrobouturage in vitro du Pecher (Prunuspersica Batsch) : Influences combines dessubstances d croissance et de diverscomposes phenoliques. Physiol. Veg, 18 :597-608.
18. James and Thurbon, I.J. (1981). Shoot androot initiation in vitro in apple root stockM-9 and the promotive effects ofphloroglucinol. J. Hort. Sci, 56: 15-20.
19. Anderson, W.C. (1980). Tissue culturepropagation of red rasberries. In:Proceedings of conference on nurseryproduction of fruit plants through tissueculture – Applications and FeasibilityAgriculture Res. Sci. Educ. Admin.,U.S.D.A., Beltsville, pp. 27-34.
20. Lane, W.D. (1979b). In vitro propagationof Spirea bumalda and Prunus cistenafrom shoot apices. Can. J. Plant Sci, 59 :1025-1029.
21. Ziv, M. (1979). Transplanting Gladiolus plantspropagated in vitro. Sci. Hort, 11: 257-260.
22. Takayama, S. and Misawa, M. (1980).Differentiation in Lilium bulbscales grownin vitro. Effects of activated charcoal,physiological age of bulbs and sucroseconcentration of differentiation and scaleleaf formation. In vitro Physiol. Plant, 48:121-125.
Shasthree et al
Current Trends in Biotechnology and PharmacyVol. 3 (4) 447-452 October 2009. ISSN 0973-8916

453
International Symposium on Emerging Trends inBiomedical and Nanobiotechnology:
Relevance to Human HealthDecember 19-21, 2009
VenueAcharya Nagarjuna University Guntur, India
Sponsored byAcharya Nagarjuna University
Organized jointly by
Centre for Biotechnology and Department of Nanotechnology
Young Scientist Awards : There will be young scientist awards of various categoriessuch as below 30 years, above 30 years, students awards, best poster awards, spon-sored by various organizations are available. The persons competing for young scien-tist competition, should clearly indicate their choice and category.
Gold Medals : Two of the selected young scientists will be awarded with gold medals1) Sri Nannapaneni Bapaiah & Smt.Sarojini Memorial Pharmacy Gold Medal and 2)Sri Vege Venkata Krishna Rao & Smt.Vege Neelakanteswari Gold Medal for excellentpresentation in the symposium.
Registration fee : Rs 600 if paid before November 15th 2009, Rs. 800 afterwardsRs. 500 for accompanying persons and students For international participants US $50 dollars.
Invitation of Papers : Abstracts of the papers not more than 300 words should be submitted throughe-mail : ISEBN2009@gmail. com (or) [email protected] - Last date to submit abstracts is15th November, 2009.
For further information :Prof. K.R.S. Sambasiva Rao
Director, ISEBN-2009Centre for Biotechnology
Acharya Nagarjuna UniversityNagarjunanagar – 522 510, Guntur, A.P., India
Prof. D. Krishna Rao Dr. M. Rami ReddyOrganizing Secretary, ISEBN-2009 Treasurer, ISEBN-2009
Department of Nanotechnology Department of NanotechnologyAcharya Nagarjuna University Acharya Nagarjuna University
Nagarjunanagar – 522 510, Guntur, A.P., India Nagarjunanagar – 522 510, Guntur, A.P., [email protected] [email protected]

Association of Biotechnology and Pharmacy(Regn. No. 28OF 2007)
Executive CouncilHon. PresidentProf. B. Suresh
President, Pharmacy Council of India, New Delhi
President ElectProf. K. Chinnaswamy
Chairman, IPA Education Division and EC Member, Pharmacy Council of India
Vice-Presidents Prof. M. Vijayalakshmi, Guntur Prof. T. K. Ravi, Coimbatore
General SecretaryProf. K. R. S. Sambasiva Rao, Guntur
Regional Secretary
Prof. T. V. Narayana, BangaloreSouthern Region
TreasurerJ.Ramesh Babu, Guntur
Advisory Board
Prof. C. K. Kokate, Belgaum Prof. M. D. Karwekar, Bangalore
Prof. B. K. Gupta, Kolkata Prof. K. P. R.Chowdary, Vizag
Prof. Y. Madhusudhana Rao, Warangal Dr. V. S.V. Rao Vadlamudi, Hyderabad
Executive MembersProf. V. Ravichandran, Chennai Prof. T. Somasekhar, BangaloreProf. Gabhe, Mumbai Prof. S. Vidyadhara,GunturProf. Unnikrishna Phanicker, Trivandrum Prof. K. S. R. G. Prasad,TirupathiProf. R. Nagaraju, Tirupathi Prof. G. Devala Rao, VijayawadaProf. S. Jaipal Reddy, Hyderabad Prof. B. Jayakar, SalemProf. C. S. V. Ramachandra Rao, Vijayawada Prof. S. C. Marihal, GoaDr. C. Gopala Krishna, Guntur M. B. R. Prasad, VijayawadaDr. K. Ammani, Guntur Dr. M. Subba Rao, NuzividuDr. P. Sudhakar, Guntur Prof. Y. Rajendra Prasad, Vizag
Prof. G. Vidyasagar, Kutch Prof. P. M.Gaikwad, Ahamednagar
Printed by Fr. Gnanam at Don Bosco Technical School Press, Ring Road, Guntur, published by Prof. K.R.S. Sambasiva Rao on behalf ofProf. K.R.S. Sambasiva Rao and Printed at Don Bosco Technical School Press, Ring Road, Guntur, and published at # 5-69-64 ; 6/19,Brodipet, Guntur - 522 002, Andhra Pradesh, India. Editor : Prof. K.R.S. Sambasiva Rao.
No. APENG/2008.28877Registered with Registrar of News Papers in India