current status and future of cardiac mapping in atrial ...cdn.intechweb.org/pdfs/25796.pdf ·...
TRANSCRIPT

6
Current Status and Future of Cardiac Mapping in Atrial Fibrillation
Doosang Kim1 and Hyuk Ahn2 1Seoul Veterans Hospital,
2Seoul National University, Korea
1. Introduction
AF is a major concern in general population worldwide. Every year, 3 million suffer from AF related stroke, 1.5 million die from AF related stroke within a year, and 1 million are severely disabled by AF related stroke. Only 1% of AF patients underwent a treatment such as ablation or AF surgery. 99% remain as they are or prophylactic anticoagulation medication only. The reason why is due to the limitation in diagnostic mapping and ablation treatment. Incomplete, vague and fragmented maps give us incomplete AF information, and lead to incomplete cure chance. Standard 12-lead ECG, which composed of 6 bipolar Einthoven limb leads and 6 unipolar Wilson pre-cordial leads, are used for more than 100 years giving us the information about rhythm, electric axis, activation sequence, and repolarization pattern. However, the F wave information of standard ECG signals during AF has limitation that only a few signals are available to show whether AF or not, or little information of source or location of its origin. The exact location of source origin and propagation route or pattern of reentry is too difficult to be elucidated by conventional low-sensitive ECG method due to its very weak signal amplitude of F-wave. Therefore, in order to manage AF successfully, we should get detailed information of AF activity in atrium using a high sensitive mapping methodology. Accurate mapping is the essential to successful treatment of arrhythmia. Endocardial mapping techniques for AF are now well developed and its accuracy reached high to treat AF effectively, however, they demand invasiveness, moderate costs and selection of patients. They are not suitable for mass screening to general population yet. Non-invasive mapping for AF is still far from bed-side due to its insufficient information of AF, not enough to detect F wave and to make a sufficient map to treat AF. According to the recently updated worldwide survey on AF ablation by Cappato et al. [1] in 2010, anti-arrhythmic drug-off success rate and overall success rate are 75% and 83% for paroxysmal AF, 65% and 75% for persistent AF, and 63% and 72% for long-standing persistent AF. Major complications were reported 4.5% from catheter ablation for AF. They reported that CARTO-guided left atrial circumferential ablation (48% of all treated patients) and Lasso-guided ostial electric disconnection (27% of all treated patients) were the most commonly used techniques for AF treatment. To improve the success rate, exact cardiac mapping of AF is essential. In this chapter, we described several topics of cardiac map, such as history, importance,
composition, classification, basic principle, clinically available maps, and my study work,
Magnetocardiography Action Potential Activity mapping for AF and future frontiers.
www.intechopen.com

Atrial Fibrillation - Basic Research and Clinical Applications
94
2. History of cardiac activation mapping
Cardiac activity is an electro-physiologic phenomenon including time course and wave propagation distribution of excitatory process of the myocardium. To understand this complicated phenomenon, we need the isolated beating heart model. It began with the basic investigation of Oskar Langendorff who developed a method for investigation of the isolated heart (Langendorff, 1895). In 1950s, Dick Durrer, cardiologist and Henk van der Tweel, physist opened the Amsterdam era of cardiac activation study. They developed instruments to reveal the excitation of heart with ECG. They reported the monumental ventricular wall excitation in 2D and 3D results from dog heart [2-5]. After success of dog heart model, in 1970, with informed consent of family members, human isolated hearts were obtained from individuals who had died, within 30 minutes after death. Thru the isolated Langendorff human heart perfusion apparatus, the hearts were perfused with an oxygenated, heparinized, modified Tyrode solution, with washed bovine erythrocytes, and resumed beating spontaneous sinus rhythm for periods ranging from 4 to 6 hours. During the activity, electrical activity of the heart was recorded from epicardial activity by hand-held electrodes and intramural activity by needle electrodes using 14-channel Ampex tape recorder with 870 terminals. They reported the 2D and 3D isochronic representation of atrial activation of an isolated normal human heart at first (fig.1) [6].
Fig. 1. Isochronic representation of the normal human atrial activation from isolated Langendorff human heart perfusion apparatus made by Durrer et al. at first. Reprinted with permission from Ref. 6
www.intechopen.com
Current Status and Future of Cardiac Mapping in Atrial Fibrillation
95
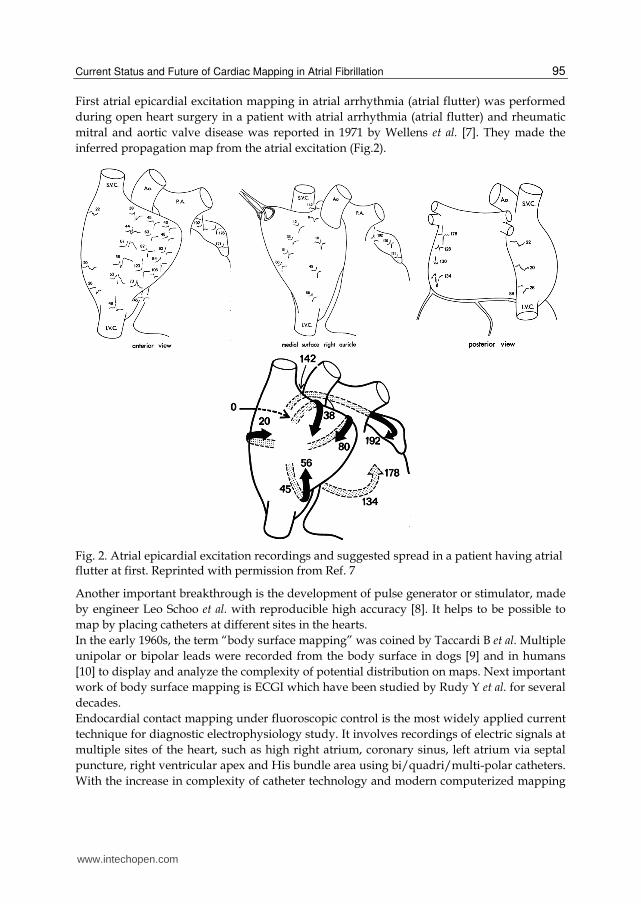
First atrial epicardial excitation mapping in atrial arrhythmia (atrial flutter) was performed
during open heart surgery in a patient with atrial arrhythmia (atrial flutter) and rheumatic
mitral and aortic valve disease was reported in 1971 by Wellens et al. [7]. They made the
inferred propagation map from the atrial excitation (Fig.2).
Fig. 2. Atrial epicardial excitation recordings and suggested spread in a patient having atrial flutter at first. Reprinted with permission from Ref. 7
Another important breakthrough is the development of pulse generator or stimulator, made
by engineer Leo Schoo et al. with reproducible high accuracy [8]. It helps to be possible to
map by placing catheters at different sites in the hearts.
In the early 1960s, the term “body surface mapping” was coined by Taccardi B et al. Multiple
unipolar or bipolar leads were recorded from the body surface in dogs [9] and in humans
[10] to display and analyze the complexity of potential distribution on maps. Next important
work of body surface mapping is ECGI which have been studied by Rudy Y et al. for several
decades.
Endocardial contact mapping under fluoroscopic control is the most widely applied current
technique for diagnostic electrophysiology study. It involves recordings of electric signals at
multiple sites of the heart, such as high right atrium, coronary sinus, left atrium via septal
puncture, right ventricular apex and His bundle area using bi/quadri/multi-polar catheters.
With the increase in complexity of catheter technology and modern computerized mapping
www.intechopen.com

Atrial Fibrillation - Basic Research and Clinical Applications
96
technique, the classical endocardial electrogram recording via a few positioned catheters
appeared old-fashioned more and more.
New mapping technologies are under development actively. CARTO, CARTO Merge
(Biosense-Webster, Baldwin Park, CA, USA), Real-time Position Management (RPM)
(Cardiac Pathways-Boston Scientific EP Medsystems, Sunnyvale, CA, USA), NavX (St. Jude
Medical, Inc., St. Paul, MN, USA), Ensite 3000 (St. Jude Medical, Inc., St. Paul, MN, USA)
hane been introduced recently and used actively worldwide now. We describe these new
mapping technologies in detail at this chapter.
3. Body surface potential mapping (BSPM)
Isopotential body surface maps are used to provide a complete picture of the effects of the
currents from the heart on the body surface. The potential distributions are represented by
contour lines of equal potential, and each distribution is displayed instant throughout
activation or recovery, or both. Since Body surface mapping was introduced, its role has
been proved in the field of ischemia detection, accessory pathway localization, Brugada
syndrome, long QT syndrome, and idiopathic VT and reentrant VT analysis, which have
abnormalities of relatively big enough signal, QRS activity, ventricular activation to be
detected easily. However, for AF, very weak signal, F wave activity is too small to be used
as a definite diagnostic solution by BSPM. Body surface potential mapping of atrial events
was first described by SippensGroenewegen et al. in characterizing P waves during ectopic
atrial activation [11] and during atrial flutter [12] in 1998. This system uses many leads,
more than 12 lead-standard ECG. BSPM records simultaneously all signals from all leads,
not sequential acquisition of endocardial signals from contact-based conventional
endocardial mapping. Therefore, BSPM results in real-time characterizing and localizing the
pattern and propagation route of AF. Guillem et al. reports 40+16 leads systems in 16 AF
patients with 2,048 Hz sampling rate, 1 μV resolution, and 500 Hz bandwidth (fig.3) [13].
Using 240-seconds recordings, wavefront propagation maps were classified according to the
different patterns; I (single wavefront), II (single wavefront with wave breakages and
splitting) or III (multiple simultaneous wavefronts). This classification showed to be highly
reproducible over 4 minutes, and these results give us new insights of varing AF
characteristics, from simple pattern to very chaotic ones.
Similar AF pattern analysis was also made by Kornings et al. using epicardial contact
mapping electrode, and this will be described later in the part of “epicardial contact
mapping” of this chapter.
In spite of limited usefulness, non-invasive cardiac mapping, such as BSPM, has unique
necessity for (i) screening people with genetic predisposition or altered myocardial substrate
for risk of life-threatening arrhythmias, in order to take prophylactic measures; (ii) specific
diagnosis of the arrhythmia mechanism to determine the most suitable intervention; (iii)
determination of cardiac location for optimal localized intervention (such as ablation,
pacing, targeted drug delivery or targeted gene transfer); (iv) evaluation of efficacy and
guidance of therapy over time; (v) studying the mechanisms and properties of cardiac
arrhythmias in human, where the electrophysiological substrate is quite different from
experimental animal models used thus far for this purpose [14]. Although these procedures
are of interest, their clinical utilities have not been established yet.
www.intechopen.com

Current Status and Future of Cardiac Mapping in Atrial Fibrillation
97
Fig. 3. Body surface potential mapping (BSPM) is a non-invasive simultaneous mapping. (a) Left panel; Arrangement of the electrodes and belt used for their attachment to the patient. A total of 56 ECG leads were placed on the chest over the atria on the front (n=40) and on the back (n=16). (b) Right panel; Wavefront propagation maps of three dominant activation patterns were shown in AF patients; single wavefront (1), single wavefront with wave breakages and splitting (2 and 3), and multiple simultaneous wavefronts (4). Fine figures by courtesy of Prof. MS Guillem and Reprinted with permission from Ref. 13
4. Electrocardiographic Imaging (ECGI)
ECGI combines alleged established technologies, BSPM and CT in a unique fashion to generate noninvasive images of cardiac electrical activity. Rudy Y et al. provided ECGI applications in normal heart, heart with a conduction disorder, focal activation initiated by right or left ventricular pacing, and atrial flutter, successfully using a multi-electrode vest records 224 body-surface electrograms [14]. Electrical potentials and isochrones are reconstructed on the heart’s surface using geometrical information from computed tomography (CT) and a mathematical algorithm. Left panel of Fig.4 shows the ECGI application procedures briefly. A 224-electrode vest strapped to the patient’s torso and connected to a multichannel mapping system measured body surface potential (a), and then the patient underwent a thoracic CT scan (b). The CT images provided epicardial surface geometry and vest-electrode positions (c). The potential and geometry data were processed through ECGI software (CADIS) (f). Through this process, ECGI isochrones map and epicardial surface potential map were constructed (g). Right panel of Fig.4 shows the normal atrial isochrone map (a) and atrial flutter isochrones map (b) having the reentrant circuit beginning from isthmus, entering septum, emerging from Bachman bundle and propagating down RAFW (right atrial free wall) to reenter isthmus again. Wang et al. reported the successful ECGI isochrones map in scar-related atypical atrial flutter with a high spatial and temporal resolution [15].
www.intechopen.com

Atrial Fibrillation - Basic Research and Clinical Applications
98
Fig. 4. ECGI application procedure (Left panel) and atrial activation ECGI map (Right panel) in nomal conduction (a) and atrial flutter (b). In Left panel, a 224-electrode vest strapped to the patient’s torso and connected to a multichannel mapping system measured body surface potential (a), and then the patient underwent a thoracic CT scan (b). The CT images provided epicardial surface geometry and vest-electrode positions (c). The potential and geometry data were processed through ECGI software (CADIS) (f). Through this process, ECGI isochrones map and epicardial surface potential map were constructed (g). In Right panel, the normal atrial isochrone map (a) and atrial flutter isochrones map (b) having the reentrant circuit beginning from isthmus, entering septum, emerging from Bachman bundle and propagating down RAFW (right atrial free wall) to reenter isthmus again. ECGI is a non-invasive simultaneous BSPM mapping, not sequential invasive endocardial contact mapping. Reprinted with permission from Ref. 14
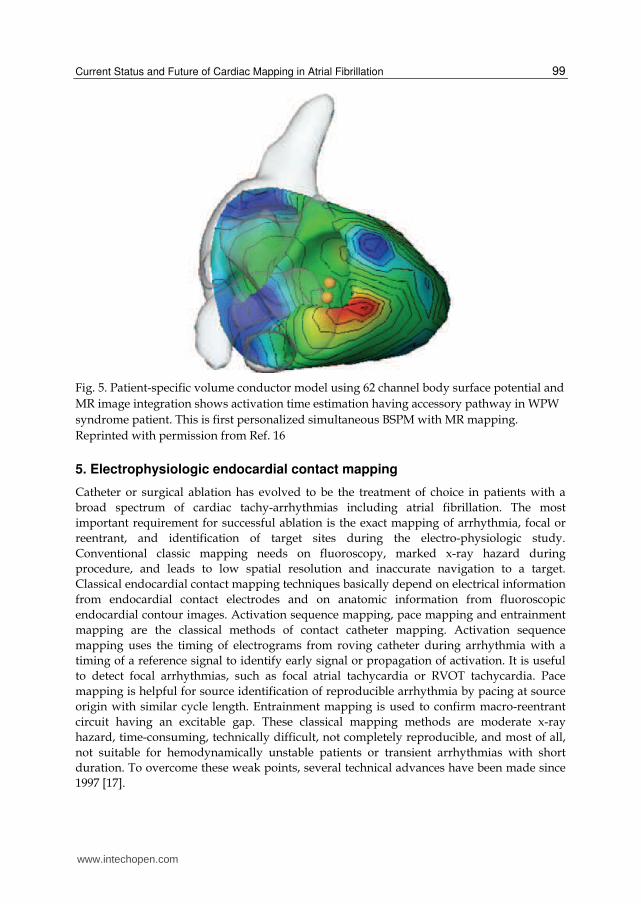
ECGI has higher results in resolution than BSPM, which located pacing sites to within 7mm in RV and 11mm in LV. It results in clinical benefit to explore source origin during troublesome catheter work. Recently, Patient-specific volume conductor modeling with magnetic resonance imaging was reported by Pfeiter et al. in 2008 [16]. They used 1.5 Tesla cine MRI images, and makes volume conductor model using (i) segmentation, (ii) extraction process of chest, lung, and blood mass, (iii) myocardial reconstruction, and (iv) volume conductor integration. And using 62 channel Mark-8 system (Biosemi V.O.F.), body surface potential map is acquired and defines by Wilson-Central-terminal (WCT) with 2048 Hz sampling rate, and band-filtered with a lower and upper edge frequency of 0.3 and 400 Hz, respectively, so the AC resolution of them was 500nVit-1 (16 bits per channel) (Fig.5). This method gives a fast and accurate insight to us non-invasively. Still, it is remained not at clinic but at experimental circumstances.
www.intechopen.com
Current Status and Future of Cardiac Mapping in Atrial Fibrillation
99
Fig. 5. Patient-specific volume conductor model using 62 channel body surface potential and
MR image integration shows activation time estimation having accessory pathway in WPW
syndrome patient. This is first personalized simultaneous BSPM with MR mapping.
Reprinted with permission from Ref. 16
5. Electrophysiologic endocardial contact mapping
Catheter or surgical ablation has evolved to be the treatment of choice in patients with a
broad spectrum of cardiac tachy-arrhythmias including atrial fibrillation. The most
important requirement for successful ablation is the exact mapping of arrhythmia, focal or
reentrant, and identification of target sites during the electro-physiologic study.
Conventional classic mapping needs on fluoroscopy, marked x-ray hazard during
procedure, and leads to low spatial resolution and inaccurate navigation to a target.
Classical endocardial contact mapping techniques basically depend on electrical information
from endocardial contact electrodes and on anatomic information from fluoroscopic
endocardial contour images. Activation sequence mapping, pace mapping and entrainment
mapping are the classical methods of contact catheter mapping. Activation sequence
mapping uses the timing of electrograms from roving catheter during arrhythmia with a
timing of a reference signal to identify early signal or propagation of activation. It is useful
to detect focal arrhythmias, such as focal atrial tachycardia or RVOT tachycardia. Pace
mapping is helpful for source identification of reproducible arrhythmia by pacing at source
origin with similar cycle length. Entrainment mapping is used to confirm macro-reentrant
circuit having an excitable gap. These classical mapping methods are moderate x-ray
hazard, time-consuming, technically difficult, not completely reproducible, and most of all,
not suitable for hemodynamically unstable patients or transient arrhythmias with short
duration. To overcome these weak points, several technical advances have been made since
1997 [17].
www.intechopen.com
Atrial Fibrillation - Basic Research and Clinical Applications
100
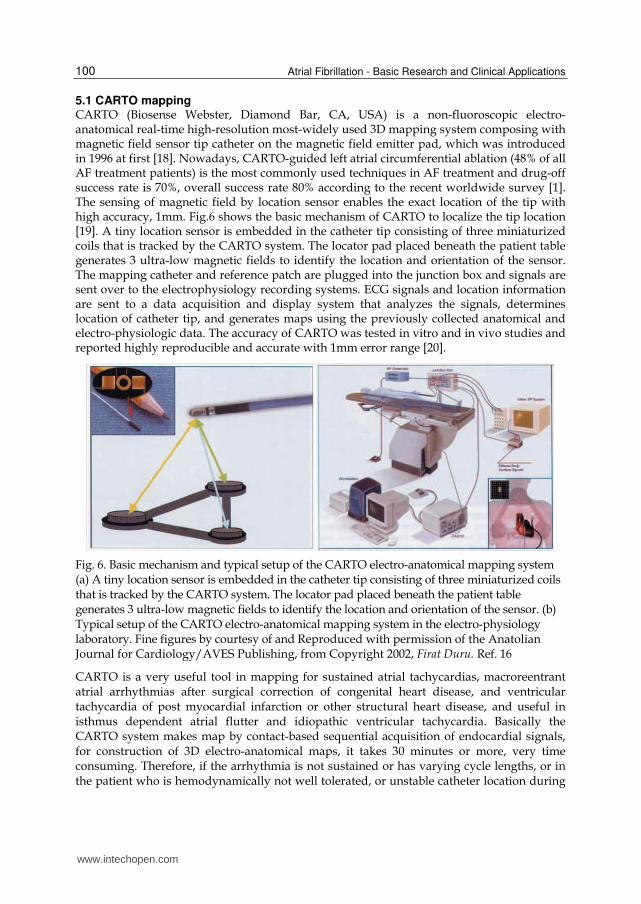
5.1 CARTO mapping CARTO (Biosense Webster, Diamond Bar, CA, USA) is a non-fluoroscopic electro-anatomical real-time high-resolution most-widely used 3D mapping system composing with magnetic field sensor tip catheter on the magnetic field emitter pad, which was introduced in 1996 at first [18]. Nowadays, CARTO-guided left atrial circumferential ablation (48% of all AF treatment patients) is the most commonly used techniques in AF treatment and drug-off success rate is 70%, overall success rate 80% according to the recent worldwide survey [1]. The sensing of magnetic field by location sensor enables the exact location of the tip with high accuracy, 1mm. Fig.6 shows the basic mechanism of CARTO to localize the tip location [19]. A tiny location sensor is embedded in the catheter tip consisting of three miniaturized coils that is tracked by the CARTO system. The locator pad placed beneath the patient table generates 3 ultra-low magnetic fields to identify the location and orientation of the sensor. The mapping catheter and reference patch are plugged into the junction box and signals are sent over to the electrophysiology recording systems. ECG signals and location information are sent to a data acquisition and display system that analyzes the signals, determines location of catheter tip, and generates maps using the previously collected anatomical and electro-physiologic data. The accuracy of CARTO was tested in vitro and in vivo studies and reported highly reproducible and accurate with 1mm error range [20].
Fig. 6. Basic mechanism and typical setup of the CARTO electro-anatomical mapping system (a) A tiny location sensor is embedded in the catheter tip consisting of three miniaturized coils that is tracked by the CARTO system. The locator pad placed beneath the patient table generates 3 ultra-low magnetic fields to identify the location and orientation of the sensor. (b) Typical setup of the CARTO electro-anatomical mapping system in the electro-physiology laboratory. Fine figures by courtesy of and Reproduced with permission of the Anatolian Journal for Cardiology/AVES Publishing, from Copyright 2002, Firat Duru. Ref. 16
CARTO is a very useful tool in mapping for sustained atrial tachycardias, macroreentrant atrial arrhythmias after surgical correction of congenital heart disease, and ventricular tachycardia of post myocardial infarction or other structural heart disease, and useful in isthmus dependent atrial flutter and idiopathic ventricular tachycardia. Basically the CARTO system makes map by contact-based sequential acquisition of endocardial signals, for construction of 3D electro-anatomical maps, it takes 30 minutes or more, very time consuming. Therefore, if the arrhythmia is not sustained or has varying cycle lengths, or in the patient who is hemodynamically not well tolerated, or unstable catheter location during
www.intechopen.com

Current Status and Future of Cardiac Mapping in Atrial Fibrillation
101
intra-cardiac activation and patient movement, CARTO sequential mapping is not possible or inaccurate, requiring the reconstruction of a whole new map. CARTO XP improves some these drawbacks. The other limitations of CARTO include that it is mostly applied to single target chamber only per one trial, and it is impossible to obtain information from the epicardial activity. Risk to patient from invasiveness during procedure, higher costs and limited reusability of this system is another hurdle to prevent widely distribution.
5.2 CARTO Merge mapping CARTO Merge (Biosense Webster, Diamond Bar, CA, USA) is a recently developed fusion
system of 3D CT or MR images with an electro-anatomic map. Fig. 7 shows the differences
between CARTO and CARTO Merge systems for right atrium [21].
Fig. 7. CARTO (Left) and CARTO Merge (Right) map in right anterior oblique view of right atrium from postoperative Fontan operation patient. In CARTO Merge, CT based anatomy (blue) and underlying map (mesh) show the detailed anatomy of right atrium with coronary sinus, connected pulmonary arteries and its branches from postoperative Fontan patient. CARTO and CARTO Merge are sequential endocardial contact mapping. Reprinted with permission from Ref. 21
In CARTO Merge, the high-resolution anatomical information from contrast enhanced 64-slice cardiac computed tomography (CT) was reconstructed and the heart chambers were segmented and implemented in the new electro-anatomical mapping system. However, roving magnetic tip catheter mapping is basically a sequential, beat-by-beat approach, which demands stable rhythm and fixed reference point, and may have possible error from ferromagnetic noise. Multiple factors create discrepancies between electro-anatomic maps and merged, preacquired computed tomographic images. The accuracy of the integrated 3D geometry is highly dependent on image quality and on the merge process. Errors may develop from changes in cardiac chamber volume or rhythm occurring between the time of 3D anatomic image acquisition and electro-anatomic mapping in EP lab. Gating of image
www.intechopen.com
Atrial Fibrillation - Basic Research and Clinical Applications
102
acquisition to the cardiac cycle and respiratory phase may affect rendered volumes. Usually volume image acquisitions were gated at 80% of the R-R interval for atrial and at 0% of the R-R interval (R wave) for ventricular imaging during the end-expiratory phase.
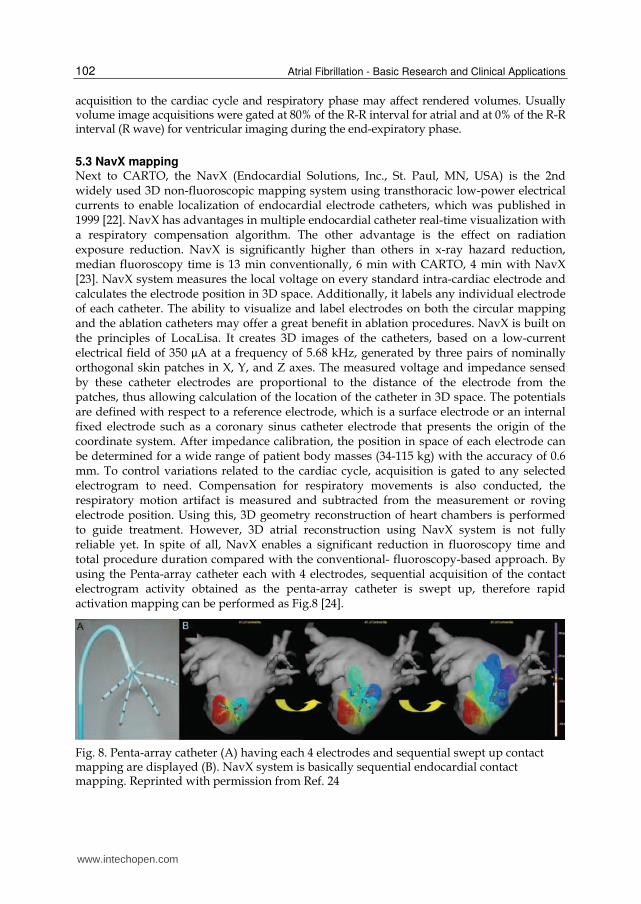
5.3 NavX mapping Next to CARTO, the NavX (Endocardial Solutions, Inc., St. Paul, MN, USA) is the 2nd widely used 3D non-fluoroscopic mapping system using transthoracic low-power electrical currents to enable localization of endocardial electrode catheters, which was published in 1999 [22]. NavX has advantages in multiple endocardial catheter real-time visualization with a respiratory compensation algorithm. The other advantage is the effect on radiation exposure reduction. NavX is significantly higher than others in x-ray hazard reduction, median fluoroscopy time is 13 min conventionally, 6 min with CARTO, 4 min with NavX [23]. NavX system measures the local voltage on every standard intra-cardiac electrode and calculates the electrode position in 3D space. Additionally, it labels any individual electrode of each catheter. The ability to visualize and label electrodes on both the circular mapping and the ablation catheters may offer a great benefit in ablation procedures. NavX is built on the principles of LocaLisa. It creates 3D images of the catheters, based on a low-current electrical field of 350 μA at a frequency of 5.68 kHz, generated by three pairs of nominally orthogonal skin patches in X, Y, and Z axes. The measured voltage and impedance sensed by these catheter electrodes are proportional to the distance of the electrode from the patches, thus allowing calculation of the location of the catheter in 3D space. The potentials are defined with respect to a reference electrode, which is a surface electrode or an internal fixed electrode such as a coronary sinus catheter electrode that presents the origin of the coordinate system. After impedance calibration, the position in space of each electrode can be determined for a wide range of patient body masses (34-115 kg) with the accuracy of 0.6 mm. To control variations related to the cardiac cycle, acquisition is gated to any selected electrogram to need. Compensation for respiratory movements is also conducted, the respiratory motion artifact is measured and subtracted from the measurement or roving electrode position. Using this, 3D geometry reconstruction of heart chambers is performed to guide treatment. However, 3D atrial reconstruction using NavX system is not fully reliable yet. In spite of all, NavX enables a significant reduction in fluoroscopy time and total procedure duration compared with the conventional- fluoroscopy-based approach. By using the Penta-array catheter each with 4 electrodes, sequential acquisition of the contact electrogram activity obtained as the penta-array catheter is swept up, therefore rapid activation mapping can be performed as Fig.8 [24].
Fig. 8. Penta-array catheter (A) having each 4 electrodes and sequential swept up contact mapping are displayed (B). NavX system is basically sequential endocardial contact mapping. Reprinted with permission from Ref. 24
www.intechopen.com

Current Status and Future of Cardiac Mapping in Atrial Fibrillation
103
5.4 Real-time Position Management mapping Another new mapping system is Real-time Position Management (RPM) (Cardiac Pathways-Boston Scientific EP Medsystems, Sunnyvale, CA, USA) system that was first described by de Groot et al. in 2000 [25]. RPM uses ultrasound to measure the distance between the reference ultrasound transducer and catheters. Two reference catheters and one mapping catheter were introduced by either arterial or venous approach. Ultrasound ranging technique is used to (i) construct a 3D representation of catheters including electrodes and transducers, anatomic structures, and ablation sites and (ii) display real-time movement of the tip and shaft of the catheters. As a non-fluoroscopic map-guide system, RPM, cooled RF ablation was tested in animal experience [26]. RPM system has advantages over CARTO or NavX system regarding stable catheter position that is minimally influenced by body, cardiac, respiratory movement, and sweating, and also no need for skin electrodes or patches. However, one major disadvantage is that the RPM system requires a special catheter, a mapping catheter and two reference catheters equipped with ultrasound transducers which limited steerability of the mapping catheter, and dislocation of the reference catheters due to roving catheter manipulation.
5.5 Clinical Implication We described briefly several mapping systems having current clinical usage. New technical advance in mapping system results in new treatment concept and clinical success. Substrate CFAE mapping in AF, activation/propagation mapping in atrial tachycardia/atrial flutter, and voltage mapping in scar-related atrial tachycardias are the current useful examples of 3D electro-anatomical mapping systems. From the data acquisition of single mapping system, several maps are generated such as activation map, propagation map, voltage map, frequency map and geometric map. Activation map describes the dispersion of activation times in the mapped region. Propagation map is a dynamic graphic representation of the activation wavefront throughout the cardiac cycle. Voltage map is a graphic representation of the peak-to-peak voltage of the local electrograms recorded. Frequency map is a graphic representation of the frequency spectra, such as dominant frequency (DF) or complex fractionated atrial electrogram (CFAE), of the local electrogram recorded. Geometric map present graphic representation of the mapped anatomy. Substrate mapping is benefit to treat AF by substrate modification. In 1959, Moe and Abildskov hypothesized that AF is due to multiple randomly propagating reentry waves in the atrium, suggesting that functional reentry is the mechanism underlying fibrillation [27]. Wijffels et al. confirmed that AF was shown to require at least 6 to 8 circulating reentrant wavefronts [28]. Maintenance of AF depends on a critical atrial mass on conduction velocity and refractory periods in the atrial tissue to support functional reentry. Since Cox et al. reported the higher success rate in AF treatment using surgical Maze procedure [29-30], substrate modification is accepted as a new target for AF treatment and substrate mapping is recently accepted as very important one. The Cox-Maze procedure incorporates 4 lesion sets and involves; (i) encirclement of the Pulmonary Veins, (ii) a lesion joining the circumferential PV lesion to the mitral annulus with amputation of the left atrial appendages, (iii) a circumferential lesion in the Coronary Sinus, and (iv) ablation of the right atrium. However, Maze procedure remains complex and is associated with a significant increase in cardiopulmonary bypass time, morbidity, and mortality. Although the exact mechanisms of AF treatment by linear lesion set like surgical Maze procedure still remains not completely elucidated yet, (i) reduction of excitable LA myocardial mass may be account for these success. Besides mass reduction, (ii) attenuation of vagal innervations, (iii) abolition of non-PV foci, especially related with ligament of
www.intechopen.com
Atrial Fibrillation - Basic Research and Clinical Applications
104
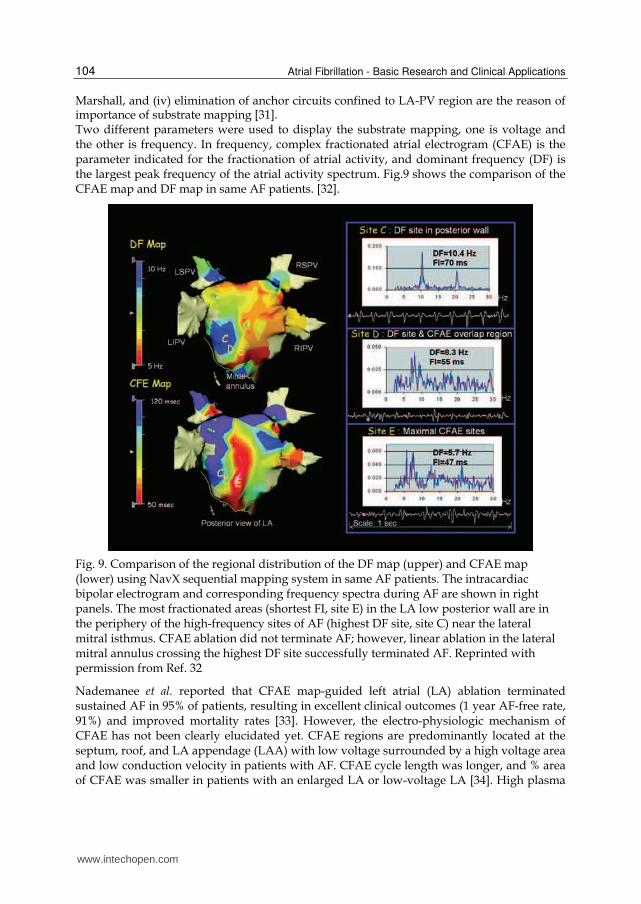
Marshall, and (iv) elimination of anchor circuits confined to LA-PV region are the reason of importance of substrate mapping [31]. Two different parameters were used to display the substrate mapping, one is voltage and the other is frequency. In frequency, complex fractionated atrial electrogram (CFAE) is the parameter indicated for the fractionation of atrial activity, and dominant frequency (DF) is the largest peak frequency of the atrial activity spectrum. Fig.9 shows the comparison of the CFAE map and DF map in same AF patients. [32].
Fig. 9. Comparison of the regional distribution of the DF map (upper) and CFAE map (lower) using NavX sequential mapping system in same AF patients. The intracardiac bipolar electrogram and corresponding frequency spectra during AF are shown in right panels. The most fractionated areas (shortest FI, site E) in the LA low posterior wall are in the periphery of the high-frequency sites of AF (highest DF site, site C) near the lateral mitral isthmus. CFAE ablation did not terminate AF; however, linear ablation in the lateral mitral annulus crossing the highest DF site successfully terminated AF. Reprinted with permission from Ref. 32
Nademanee et al. reported that CFAE map-guided left atrial (LA) ablation terminated sustained AF in 95% of patients, resulting in excellent clinical outcomes (1 year AF-free rate, 91%) and improved mortality rates [33]. However, the electro-physiologic mechanism of CFAE has not been clearly elucidated yet. CFAE regions are predominantly located at the septum, roof, and LA appendage (LAA) with low voltage surrounded by a high voltage area and low conduction velocity in patients with AF. CFAE cycle length was longer, and % area of CFAE was smaller in patients with an enlarged LA or low-voltage LA [34]. High plasma
www.intechopen.com

Current Status and Future of Cardiac Mapping in Atrial Fibrillation
105
concentrations of TGF-beta and TIMP-1 had lower LA voltage and greater LA volume significantly in non-valvular AF patients [35]. RF ablation of atrial flutter, focal atrial tachycardia, AV nodal reentry tachycardia, and scar-related (incisional) atrial reentrant tachycardia under activation/propagation mapping using CARTO or NavX are accepted as clinical success. Especially, incisional atrial tachycardias in patients following surgery for congenital heart disease having complex structural abnormalities were treated by catheter ablation [36]. Electroanatomical activation 3D map allowed a rapid distinction between focal and reentrant mechanisms and visualization of the activation wavefronts along anatomical and surgically created barriers, such as reentrant tachycardia propagating through the tricuspid annulus-vena cava inferior isthmus or along peri-atriotomy loops. Target sites in complex congenital heart disease patients are often slow-conducting narrow isthmus bordered by areas of scar tissue [37] and voltage criteria have been developed by areas of scar tissue by De Groot et al. [38]. Voltage-based scar-related delineation in patients with congenital heart disease is the good example of 3D electroanatomic mapping which has clinical impact. In spite of many clinical advantages, endocardial contact mapping has several weak points to be solved, (i) detection source problem, alteration or interference of magnetic field or ultrasound, (ii) contact issues, missing or noise signals from contact problems, (iii) motion artifact from reference point, cardiac cycle, respiration movement, (iv) un-mappable arrhythmia, (v) sequential fragmented map, not simultaneous single snapshot map, (vi) fractionated electrograms not to trace whole propagation of each F wave, and (vii) position error during image registration. However, in spite of several weak points, these endocardial contact maps provide us valuable insights into the mechanism of arrhythmias and enhanced understanding of substrate –EP relationships.
6. Non-contact endocardial mapping
The most important drawback of contact mapping is the error from the missing or noisy signal due to poor contact problem. So, some electrograms were deleted when artifacts or poor contact were observed. To overcome this problem, noncontact concept was introduced in 1987 by Taccardi B et al. in which intra-cavitary potentials were measured from olive-shape probe electrodes introduced through the LV apex of animal heart [39]. 64 Multi-electrode array (MEA) (EnSite Array, St. Jude Medical, St. Paul, MN, USA) is very rapid, 3360 virtual electrogram complete map generation on a single beat, relatively accurate, and usable even in hemodynamically unstable or non-sustained VT patients. However, this system has limitations in (i) distance problem, between catheter and tissue, decreased accuracy more than 34mm apart from tissue, (ii) signal-to-noise ratio problem, (iii) chamber size dependent, and (iv) virtual electrogram not real one, (v) inadequate substrate mapping and (vi) the associated moderate costs. Recently, an ultrasound-based 3D imaging modality, CARTO-based 3D ultrasound image system (Biosense Webster Inc., USA) has been developed to minimize merge process error [34]. The axial CT images were transferred to the electro-anatomic mapping system equipped with CARTO Merge image integration software (Biosense Webster). The surface reconstruction of the RA with superior vena cava, left arium, pulmonary veins, right ventricle, and left ventricle were segmented from each chamber volume. An electro-anatomic location sensor was incorporated into the IntraCardiac Echocardiography (ICE) catheter tip to allow the establishment of (i) tip location in 3D space, (ii) tip direction, and
www.intechopen.com

Atrial Fibrillation - Basic Research and Clinical Applications
106
(iii) the origin and direction of the 2D ICE sector image. Three second segments of 2D ultrasound images were acquired during ECG gating to a coronary sinus atrial electrogram for atrial imaging, and ECG gating to the R wave of V1-3 electrogram for ventricular imaging. This system was not automatically gated to respiration, so the images were acquired in late expiration phase (79%). Point-to-point component interpolation from a family of the chamber contour data makes the complete volume rendering and 3D geometry. They reported the point-source error of 3D ultrasound-derived geometries was 2.1mm for atrial and 2.4mm for ventricular sites, and significantly less than CARTO Merge CT images, 3.3mm for atria and 4.8mm for ventricle. Fig.10 shows 3D ultrasound geometry creation [40].
Fig. 10. CARTO-based 3D ultrasound geometry creation. A) 2D ICE view of the LA with endocardial perimeter (left) and simultaneously rendered endocardial contour (right). B) Collated multiple LA perimeters created with multiple catheter rotations. C) Overall segmented volume using point-to-point component interpolation. D) Complete LA and PV geometry created from individual volume components. LA indicates left atrium; LAA, left atrial appendage; PV, pulmonary vein; RS, right superior; RI, right inferior; LS, left superior; and LI, left inferior. It took some time to make several contours for each chamber. This is an invasive non-contact endocardial sequential mapping. Reprinted with permission from Ref. 40
In canine experimental model, a 3D ultrasound-derived geometry was created by 51 contours for RA, 22 contours for SVC, 22 contours for LA, 7 contours for PV and 8 contours for LAA. So, the total rendering time was 23 minutes for RA and 26 minutes for LA. The
www.intechopen.com

Current Status and Future of Cardiac Mapping in Atrial Fibrillation
107
limitations of this 3D US derived images are (i) error from respiratory cycle, (ii) poorer resolution than CT imaging, (iii) error from acoustic shadowing or incomplete penetration of ultrasound, (iv) not fully contact images.
7. Epicardial contact mapping
Unlike the invasive endocardial sequential mappings such as CARTO, NavX, MEA, etc, Body surface potential mapping (BSPM) or ECGI gives us non-invasive simultaneous electrical information, but their resolution is limited due to relatively weak signal intensities from F-wave of AF. Epicardial contact mapping helps to show exact propagation route of F-wave. 256-channel 3-dimensional dynamic mapping system with intra-operative epicardial patch electrodes was used [42]. Successful results were reported, but it is useful only during the operation, so it is still invasive, useless for preoperative exam or follow-up, and it does not show normal activity under physiological conditions, such as closed chest, no anesthesia, presence of neural inputs, mechanical loading, and normal perfusion in intact human subjects. Epicardial electrode system has also limitation to detect any conduction via
Fig. 11. Using 244-lead epicardial electrode mapping systems (upper), three different AF types were classified along mapping results (lower) in RA free wall of AF patients, such as single uniformly propagating waves (I), single non-uniformly conducting waves or two wavelets (II) and three or more wavelets associated with multiple areas of slow conduction and arcs of conduction block (III). This invasive epicardial contact mapping is simultaneous mapping to show the different pattern of AF complexity. Reprinted with permission from Ref. 42
www.intechopen.com
Atrial Fibrillation - Basic Research and Clinical Applications
108
inter-atrial septum and coronary sinus musculature. However, epicardial contact mapping gives us some clue of AF characteristics to understand their pathophysiology of different propagation pattern like previously described report by Guillem et al. [13]. Konings et al. reported three different types of AF according to the F-wave propagation pattern using 244-lead epicardial mapping electrode system in RA free wall (Fig.11). They classified AF as the degree of complexity of atrial activation during fibrillation, (i) single broad wave fronts propagating without significant conduction delay, exhibiting only short arcs of conduction block or small areas of slow conduction not disturbing the main course of propagation, (ii) single waves associated with a considerable amount of conduction block and/or slow conduction or the presence of two wavelets, and (iii) three or more wavelets associated with areas of slow conduction (<10 cm/s) and multiple arcs of conduction block [42]. Patients with a left atrial (LA) thrombus are accepted as a known contraindication for endocardial mapping and procedure. In this circumstance, hybrid epicardial and endocardial mapping and ablation technique would be possible [43]. Mapping catheter is inserted into pericardial space via a subxyphoid approach. Although this new approach resulted in a successful outcome for LA thrombi patient, the risk of complications such as hemo-pericardium, phrenic nerve injury, great vessel injury, coronary artery damage or pericarditis should also be considered before procedure.
8. Magnetocardiographic action potential activity mapping
Magnetocardiographic action potential activity mapping is a new experimental non-invasive non-contact high-sensitive simultaneous 3D mapping system for AF using superconducting quantum interface device and CT image co-registration. It is very rapid to register signals like an ECG, but very sensitive enough to analyze F-wave for source localization sufficiently, having many channels, more than 64 channels simultaneously, and shows results easily to physician as a 3D map. Its feasibility were reported in 2007 at first [44], and we introduce it for understanding including basic concept, history, main differences between ECG and MCG, its resolution, source localization, CT co-registration, clinical application, MCG studies at rhythm disorders, etc. in this chapter.
8.1 Biomagnetism The movement of charged ions such as Na, K, and Ca across cell membranes generates electrical potentials on body surface which can be detected by electrographic mapping methods such as ECG. The same ion fluxes also generate electrical currents, which in turn give rise to magnetic fields. These magnetic fields can be registered outside the body, and measurement of the biomagnetic fields generated by the electrical activity of the human body is termed biomagnetism. The magnetic field strength is quantified with field density, whose unit is the Tesla (T). The magnetic fields of the body are so weak, for example, the magnetic field of the heart is < 100 picotesla (1 pT = 10-12 T) and that of the brain is femtotesla (1 fT = 10-15 T) (the earth’s magnetic field is 10-4 T), so therefore some kind of shielding from external magnetic fields and high sensitive device are usually necessary. Biomagnetic measurements have been performed on several organs, besides the heart with electrical activity including the brain (magneto-encephalogram, MEG), eye (magneto-oculogram, MOG) and peripheral nerves (magneto-neurogram, MNG). MEG is currently used world-wide and studied actively to localize brain lesion such as epileptic focus, and gives higher information than EEG.
www.intechopen.com
Current Status and Future of Cardiac Mapping in Atrial Fibrillation
109
8.2 History of MCG Magnetocardiography(MCG) is a technique to register the extracorporeal magnetic field of the heart which is generated by the same currents as the ECG. First MCG signals were registered in 1963 using a set of two copper coils and no external shielding by Baule et al. [45]. In 1967, MCG measurement was performed in a magnetically shielded room to cancel out the effects of external magnetic fields such as the earth’s magnetic field and that of urban traffic [46]. A significant step forward was the invention and implementation of the superconducting quantum interference device (SQUID) in liquid helium at 4.2 °K (-269 °C) at 1970 by Cohen et al. [47]. During the next two decades, MCGs were registered with single channel device, and mappings were performed by placing the sensor at several locations over the thorax and measuring signals from one location at a time. First normal MCG patterns based on such mapping systems was reported in 1978 by Saarinen et al. [48]. In the 1990’s, multi-channel devices have emerged, allowing simultaneous recording of the magnetic signals over large precordial areas by Van Leeuwen et al. [49-50]. Today, MCG measurements can be performed with highly sensitive second-order SQUID gradiometers sensors in low-cost aluminium magnetically shielded rooms, resulting in high sensitivities, and with a modern multi-channel device, MCG registration can be performed in a few minutes, rendering the method suitable for clinical patient measurements.
8.3 Main differences between MCG and ECG MCG has morphological features similar to the P-wave, QRS complex, and T- and U- waves of the ECG and the temporal relationships between them are generally the same [48]. The main difference between spatial ECG and MCG patterns is the spatial angle of 90° between them, an essential feature of the MCG and ECG maps [51]. ECG and MCG are sensitive to different configurations of the source current: body surface potential measurements reflect the flux of the primary current distribution whereas the magnetic measurements are associated with the curl of the same source [52]. Therefore, certain source configurations can be undetectable in one measurement but visible in the other. A radial dipole in a sphere produces no magnetic signal outside the volume conductor, on the other hand, a vortex type current, curl current, a loop current would be undetectable in ECG measurements, but generates a measurable magnetic field. Almost all MCG studies are based on measurement of the magnetic field component perpendicular (radial or Z-component) to the anterior chest (Bz). MCG is thus most sensitive to currents tangential to the chest surface, whereas especially chest leads of ECG are more sensitive to radial currents. MCG is more sensitive to the terminal phase of the depolarization when the activation wavefront occurs in a more tangential direction than at the initial part [53]. ECG (the isointegral BSPM maps) shows abnormalities mainly during the depolarization period, whereas in MCG, better discrimination results from use of the abnormalities in the repolarization period [54]. MCG is also not affected by conductivity variations caused by the lungs, pericardial effusion, muscles, and skin, unlike ECG [51]. In MCG, there are no potentials generated by the skin-electrode interference needing to be filtered out, it does not require skin-electrode contact, which is prone to noise, as in body surface ECG. MCG is totally non-invasive and even non-contact device.
8.4 Temporal and spatial resolution of MCG Bioelectric and biomagnetic studies offer functional information about electrically active organs, such as the heart and the brain, which is difficult to obtain by other imaging
www.intechopen.com

Atrial Fibrillation - Basic Research and Clinical Applications
110
techniques. For example, MRI, computed tomography (CT) and X-ray imaging mainly provide only static anatomical information with relatively good spatial resolution. The alternative functional imaging methods, such as perfusion-MRI, PET, and SPECT, involve the use of intravenous enhancing markers to produce knowledge about metabolic process. In addition, the time resolution of perfusion-MRI, PET and SPECT is only around one second and the spatial resolution is only around a few centimeters. As with ECG signals, the MCG signals of the heart are obtained relatively good within millisecond time resolution. In spite of higher temporal resolution of MCG, spatial resolution of MCG has a few measurable error ranges. In a phantom study by Fenici et al in 1998 [55], the accuracies of MCG dipole localizations were investigated by using a non-magnetic stimulation catheter, and the average MCG localization accuracy was 2-7 mm, while Body Surface Potential Mapping was 4-10 mm [56]. MCG localization accuracy is dependent to the signal-to-noise ratio (SNR) of MCG. With the SNR between 5 and 10, the average localization error was found to be 9 ± 8 mm, while for the SNR between 30 and 40, and for the goodness of fit between 99.5 % and 100 %, the average error reduced to 3.2 ± 0.3 mm. Therefore, the high SNR is essential to have a good spatial resolution. These previous resolution were originated from the QRS study. In atrial F wave localization, the F wave localization error is larger than QRS wave, because of its small size and irregularly irregular pattern. To minimize the atrial F wave localization error, co-registration with MDCT and MCG signals is essential.
8.5 Source localization In source localization studies, the forward problem has to be solved first, i.e. one has to calculate the electrical potential or the magnetic field, generated by the current sources in the heart, on and outside of the body, respectively. In the inverse problem, the current source is determined from the MCG and BSPM measurements. However, even with a complete knowledge of the electromagnetic field outside of the source region, the inverse problem cannot be uniquely solved because the same field distribution can be produced by infinitely many current source configurations. Therefore, restrictive assumptions about the current sources are needed. The conventional way is to use equivalent source models for describing the actual currents. The parameters of the source model can then be determined from the measured data, e.g., in a least-squares sense. In addition to the current source, the media surrounding it needs to be modeled. The volume conductor models used in cardio-magnetic source imaging studies are usually referred to as torso models. For atrial F wave source localization, separative Surface Potential Activation Beamformer (sSPAB) is introduced by Kim et al. [44]. Minimum variance beamformer (MVB) is a well-known spatial filtering technique explaining the covariance matrix of measured fields and the technique is proper to deal with rhythmic oscillation fields like F-waves in atrial arrhythmia because the covariance matrix of the measured signal contains spatiotemporal information. However, the MVB has two intrinsic drawbacks: First, the result is not robust to the source dipole orientation although the technique has originally been developed for Equivalent current dipole (ECD) source model – a collective excitation of pyramidal cells on the brain cortex can be well approximated by the ECD source. Because the dipole orientation estimation prior to calculating the source power at the position is crucial to obtain a good result with MVB, the estimation should be done very carefully. Moreover, in a heart as opposed to a brain, the ECD is not a good model describing heart current sources. Second, MVB is unable to
www.intechopen.com
Current Status and Future of Cardiac Mapping in Atrial Fibrillation
111
separate one source from the others for correlated multi-sources, especially for successively activating sources just like the myocardial current sources. Separative Surface Potential Activation Beamformer (sSPAB) is an effective dynamic source localization technique for electrical reentrant excitation of myocardium from AF. sSPAB technique is based on Minimum varience beamformer (MVB), but it circumvent the drawbacks of MVB mentioned previously by adopting Equivalent double layer (EDL) model rather than Equivalent current dipole (ECD) and by using higher order statistics of measured signals. Current dipole sources are not suitable for explaining the reentrant excitation feature
appearing on the myocardium. Instead of Equivalent current dipole (ECD), this surface
source model based on the Equivalent double layer (EDL) model is utilizing the fact that all
the primary current sources in a heart can be described by epicardial transmembrane action
potential on the closed surface enclosing the heart. With the Boundary element model (BEM)
– conductor model considering the effect of the volume current, it confines the dependent
variables to the action potentials on the Boundary element model (BEM) heart surface. The
estimated sSPAB power is corresponding to each other the source activity on the heart
tissue. Therefore, it is no need to estimate the orientation of current dipole at the vertexes.
The lead fields are calculated by a multi-surface Boundary element model (BEM) consists of
heart, lung and torso. The source potentials are located only on the heart surface using
sSPAB technique [44].
By using the Independent component analysis (ICA), the F-wave was separated from the
other activations such as ventricular excitation, and also the feature in a time sequence.
Generally, Minimum varience beamformer (MVB) uses a covariance matrix of measured
signals obtained by multi-channel detectors, which means that Minimum varience
beamformer (MVB) separate sources with the second order statistics (e.g. according to the
magnitude of variance). The second order statistics are not enough to separate an MCG
signal into the characteristic components such as P-wave, QRS complex, and T-wave.
Therefore, higher order statistics of the measured signals are required. Separative Surface
Potential Activation Beamformer (sSPAB) adopts the JADE algorithm using the 4th order
cumulants of the measured data. The moving dipole forms a magnetic field trace at each
sensor position as it moves along a route. The measured magnetic field can be separated into
several independent waveforms by Independent component analysis (ICA) with a degree of
freedom in permutation.
Fig.12 shows some examples of Activity map of action potential (AMAP) as application
results of separative Surface Potential Activation Beamformer (sSPAB) for clinical use of
source localization. Fig. 12 (a) and (b) are AMAPs for patients having dimished F-wave and
coarse F-wave respectively. Patient 1 is a 61 years-old male diabetes with rheumatic valvular
heart disease. He suffered from severe mitral stenosis (mitral valve area is 0.68 cm2) and he
has calcified Aortic valve leaflet with leaflet fusion of Rt coronary cusp and noncoronary
cusp. He has large LA (size 67 mm) and long-standing persistent AF. High amplitude
activity of action potential can be observed around the inferior part of right atrial surface.
Patient 2 is a 57 years-old male with rheumatic valvular heart disease showing severe mitral
regurgitation. It is due to A1 and A3 prolapse of mitral valve leaflet. His LA size is 67 mm
big and his rhythm is long-standing persistent AF. He shows coarse F-wave in MCG, the
excitation is very strong and expanded to the ventricle so that we could guess it transferring
an atrial flutter.
www.intechopen.com

Atrial Fibrillation - Basic Research and Clinical Applications
112
Fig. 12. Activity map of the action potential (AMAP) examples produced by sSPAB method. Red color implies high activity amplitude on the atrial myocardial surface. (a) Patient I: diminished F-wave and high activity on the inferior of Right atrium. (b) Patient II: coarse F-wave and activity on the RAA expanded to ventricle.
8.6 Clinical application of MCG MCG has been used for many cardiac disorders. MCG can detect exercise-induced myocardial ischemia in heterogeneous CAD patient population with several ST-segment and T-wave parameters as well as ST amplitude, and spatial evaluation of ischemia-induced post-exercise T-wave changes may be useful in localization of the ischemic myocardial region [57]. MCG can detect patients with LV hypertrophy [58] and quantify its degree in patients with increased LV mass [59]. In patients with acute chest pain and without ST-segment elevation (Non-STEMI), MCG predicted CAD with a 97.8% probability and excluded CAD with an 84.8% probability, superior to ECG, Troponin I and Echocardiography [60]. Fetal MCG recordings are another important application of magnetic measurements to detect the heart rate of the fetus and even some cardiac abnormalities throughout the course of pregnancy [61], because the ECG signal of a fetus decreases after the 25th week of gestation and becomes practically undetectable due to vernix caseosa, an insulating layer covering the fetus, while the MCG signal increases [62]. After the 30th week, the ECG signal increases again together with the MCG signal [63].
8.7 MCG studies at rhythm disorders MCG has proven accurate in localization of accessory pathways causing pre-excitation in Wolff-Parkinson-White syndrome [64], as well as in localization of the tachycardia points of origin [65] and premature ventricular ectopic complexes [66]. MCG have been superior to signal-averaged ECG in indicating a propensity toward life-threatening arrhythmias and magnetocardiographic intra-QRS fragmentation [67] and QT dispersion have identified post-MI patients prone to ventricular arrhythmias [68], the former being independent of the extent of LV dysfunction. All of this study targets for rhythm disorders are the relatively big signal component, QRS complex. Atrial F wave is very weak and small, so hard to detect and analyze, that is the reason why it prevents the study of atrial rhythm disorders using MCG. To overcome this hurdle of sensitivity, top-notched DROS SQUID 64 channel MCG system and software is used to detect atrial F wave easily.
8.8 MCG recording and data processing MCG signals were recorded at supine position with about 5 minutes (30 to 60 seconds a session, several sessions) recording time under the MCG dewar. The MCG system utilizes
www.intechopen.com

Current Status and Future of Cardiac Mapping in Atrial Fibrillation
113
double relaxation oscillation Superconducting Quantum Interference Device sensors [69-70]. The average noise spectral density of the whole system in a magnetic shielded room is 10 fT/√Hz @ 1 Hz and 5 fT/√Hz @ 100 Hz. The KRISS MCG has 64 planar first-order SQUID gradiometers, which measure the tangential components of the cardiomagnetic fields. Measuring tangential field components is effective to obtain the overall heart information with a relatively small area of sensor distributions, that is, feasible to detect deeply-located sources like an electrical activity caused by the atrial excitation [71]. In this system, the tri-polar magnetic field map patterns were changed into ordinary dipolar field maps by using the minimum norm estimate [72]. The typical recording time is 30 to 60 seconds and the subjects are in their supine position under the MCG dewar. In Root mean square (RMS) peak ratio, supine position gives lesser P than T in ratio, however the real size of amplitude of P wave is 1.5 fold larger in supine. Therefore, the signal of P wave is well detected in supine position from MCG (Fig.13). [71].
Fig. 13. Comparison of supine versus prone position for adequate MCG signal register. Modified reprinted with permission from Ref. 71
The MCG data of all subjects were analyzed by the application software KRISSMCG64 (Biomagnetism Research Center, Korea Research Institute of Standards and Science, Daejeon, KOREA). The signal processing software provides automatic digital filtering, synthetic gradiometer formation, and baseline correction for the acquired records. To analyze atrial F-wave in atrial surface, F-wave were separated from other components such as P, QRS, and T-wave component in a time sequence using Minimum variance beamformer (MVB) localization combined Independent component analysis (ICA), which separate successfully waveforms of moving current dipoles.
8.9 Generation of CT geometry for 3D heart modeling In order to make an exact conductor model and to combine anatomical information with MCG results, Computed tomogram (CT) images were recorded previously for the individual patients. The generation procedure of geometric heart modeling is as follows: (i) Heart image preparation from computed tomography having several landmarks for co-registration with MCG, (ii) Characteristic line data extraction of the heart shape from CT
www.intechopen.com

Atrial Fibrillation - Basic Research and Clinical Applications
114
images, (iii) Surface constructions from the extracted line data. This modeling is achieved by computer aided Non-Uniform Rational B-Spline (NURBS) procedure. It uses the absolute coordinate data as the reading coordinates, creates ASCII file, interpolate NURBS curve creation, generates curve by modification and optimization, and finally gives NURBS surface creation for modeling. By the co-registration process between MCG and CT, the volumetric conductor models were established. The conductor model explains the volume current effect in calculation of forward problems with the Boundary element model, which results in a more accurate localization than in case of using a simple conductor model such as a horizontally layered model.
8.10 Propagation path tracing (Inferred route) from AMAPs From the Activity map of action potential (AMAP) using separative Surface Potential Activation Beamformer (sSPAB) and Independent component analysis (ICA), the propagation route of the atrial activity were inferred as a MCG map. Fig. 14 shows the process for inferring an atrial excitation route originating the F-wave. The AMAP examples by using sSPAB for AF demonstrated in other patient, 70 years-old male who had severe mitral stenosis (MVA 0.67 cm2) due to severe calcified MV leaflet, large LA (size 60 mm) and chronic AF. The measurement and analysis were shown in Fig. 14. As expected, the F-wave
Fig. 14. The process for inferring propagation route as a MCG map. (a) Atrial fibrillation time traces recorded by using an MCG. The R-and T-waves were chopped for their relatively large amplitudes. (b) The separated independent components of the f-waves. The time window is corresponding to the red box in the Fig (a). (c) The activity maps of the action potential found by using sSPAB; the upper row is corresponding to the #14 waveform (early excitation) in Fig. (b), and the bottom row is corresponding to the #6 waveform (later excitation), respectively. The red color implies the active change in the action potential for each corresponding waveform. (d) The inferred propagation trace of the atrial excitation. LAA, left atrial appendage; RAA, right atrial appendage; LPV, left pulmonary vein; RPV, Right pulmonary vein. Reprinted with permission from Ref. 44
www.intechopen.com
Current Status and Future of Cardiac Mapping in Atrial Fibrillation
115
caused by AF is relatively small compared to R- and T-peaks. The oscillatory behavior of F-wave between the previous T-wave and the next R-waves can be observed in the multi-channel MCG record (fig. 14(a)). Using the ICA process in the sSPAB, we can separate the independent components of the F-waves and each the waveform can be marked visually time by time (fig. 14(b)). In Fig. 14(c), the Activity maps of the action potential were found by using sSPAB; the upper row is corresponding to the #14 waveform (early excitation) in Fig. 14(b), and the bottom row is corresponding to the #6 waveform (later excitation), respectively. The left panels are seen from the right lateral side of the subject and the right panels are seen from the right posterior position of the subject. The red color on the myocardium implies the active change in the action potential for each corresponding waveform. From the AMAPs at the two sequential time instants, we can infer the propagation trace of the atrial excitation. The expected propagation route was drawn in Fig. 14(d) [44].
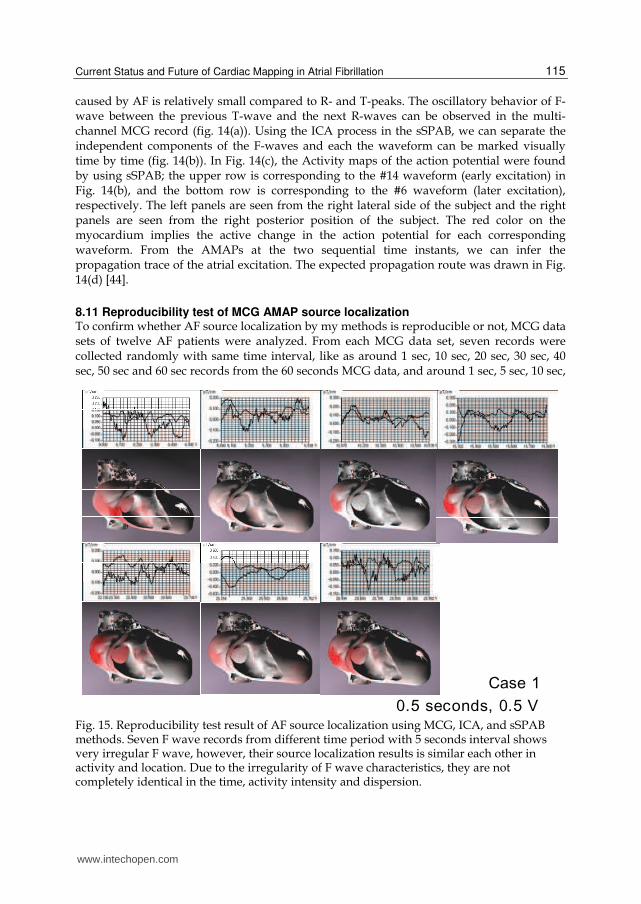
8.11 Reproducibility test of MCG AMAP source localization To confirm whether AF source localization by my methods is reproducible or not, MCG data sets of twelve AF patients were analyzed. From each MCG data set, seven records were collected randomly with same time interval, like as around 1 sec, 10 sec, 20 sec, 30 sec, 40 sec, 50 sec and 60 sec records from the 60 seconds MCG data, and around 1 sec, 5 sec, 10 sec,
Case 10.5 seconds, 0.5 V
Fig. 15. Reproducibility test result of AF source localization using MCG, ICA, and sSPAB methods. Seven F wave records from different time period with 5 seconds interval shows very irregular F wave, however, their source localization results is similar each other in activity and location. Due to the irregularity of F wave characteristics, they are not completely identical in the time, activity intensity and dispersion.
www.intechopen.com
Atrial Fibrillation - Basic Research and Clinical Applications
116
15 sec, 20 sec, 25 sec, 30 sec records from the 30 seconds MCG data. Each record is 0.5 second-long and moved a little to acquire only F wave without QRS and T wave. Each record is used to make 3D AF source localization through baseline correction filtering without averaging, raw data analysis and 3D Equivalent double layer (EDL) localization method in sSPAB algorithm of KRISSMCG64 application software. The relative locations of AF source are similar between them, but some different in activity strength and in detailed location each other so, not completely identical in all (Fig. 15). However, the relative reproducibility is more than 5 of 7. The reason why they show no completely identical result is might be originated from the irregularity of F wave. AMAP source localization could not acquire identical acquisition of F wave in time, activity intensity, and dispersion. However, the F wave source is localized within near location with variant activity.
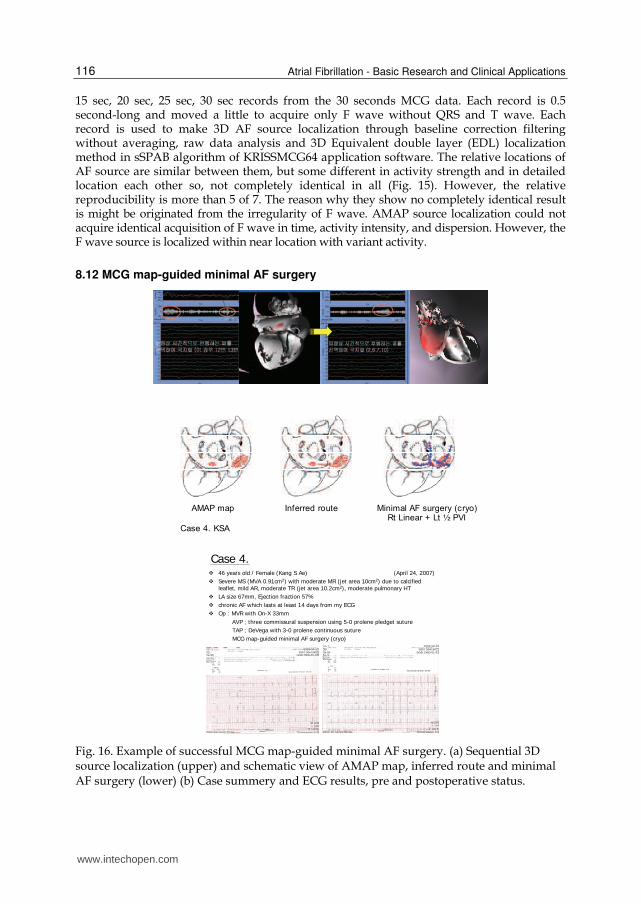
8.12 MCG map-guided minimal AF surgery
AMAP map Inferred route Minimal AF surgery (cryo)Rt Linear + Lt ½ PVI
Case 4. KSA
Case 4. ¬ 46 years old / Female (Kang S Ae) (April 24, 2007)
¬ Severe MS (MVA 0.91cm2) with moderate MR (jet area 10cm2) due to calcified leaflet, mild AR, moderate TR (jet area 10.2cm2), moderate pulmonary HT
¬ LA size 67mm, Ejection fraction 57%
¬ chronic AF which lasts at least 14 days from my ECG
¬ Op : MVR with On-X 33mm
AVP ; three commissural suspension using 5-0 prolene pledget suture
TAP ; DeVega with 3-0 prolene continuous suture
MCG map-guided minimal AF surgery (cryo)
Fig. 16. Example of successful MCG map-guided minimal AF surgery. (a) Sequential 3D source localization (upper) and schematic view of AMAP map, inferred route and minimal AF surgery (lower) (b) Case summery and ECG results, pre and postoperative status.
www.intechopen.com

Current Status and Future of Cardiac Mapping in Atrial Fibrillation
117
After making the MCG map for AF, AF ablation operation method were planned, such as
location and length of incision or cryo-ablation, and other combined procedures according
to the patient’s disease status; atrium size, valve incompetence, coronary artery stenosis, etc.
Under the institutional ethical review board’s approval, using MCG map, 8 cases of MCG
map-guided minimal AF surgery were conducted successfully. 46 years-old female patient
case is shown at fig. 16. There are no sick sinus syndrome, no permanent pacemaker
insertion, 100% sinus conversion at immediate postoperative time and 5 of 7 reached sinus
rhythm successfully with drug-off.
9. Conclusions
The proposed separative Surface potential activation beamformer (sSPAB) visualized
successfully the Activity map of action potential (AMAP) corresponding to the F-wave in
the Magnetocardiography (MCG) records of a patient with AF. In addition, a prompt
visualization of the electrical excitation of the myocardium is crucial for a clinical
application of the MCG. By confining the source power calculation of the sSPAB to the
coordinates on the endocardial and epicardial surfaces, the AMAP could be obtained on the
heart boundary in a very short time, a couple of minutes. The obtained F-waves show
periodic oscillatory behaviors. By using the sSPAB, the F-wave was separated from the other
activations and localized the position of a reentry circuit corresponding to the F-wave. By
separating the F-wave time-by-time and visualizing the AMAP for each time-separated
waveform, the propagation trace of the AF was able to be inferred.
From the reproducibility test of source localization using Equivalent double layer 3D
method, the result is very similar to each other in different seven records. Map-guided AF
surgery facilitates less-extensive procedures and has an ultimate benefit to patient. Smaller
incision, simple minimal procedure, reduced postoperative bleeding, shortened
cardiopulmonary bypass time, etc could be the advantages of map-guided surgery. MCG is
a totally noninvasive and even non-contact method for analyzing AF. The visualization of
the myocardial current distribution corresponding to the reentrant excitation would be a
great help for planning the AF surgery and the follow-up examination. However, more
technical development in sensitivity of MCG system and image processing solution are
required for more accurate source localization and propagation.
10. Future experimental mappings
Ideal future mapping methods should offer (i) high sensitivity to detect very small targets,
(ii) high spatio-temporal resolution to localize precisely and follow a propagation route in
real-time, (iii) noninvasiveness to allow repeat exam, (iv) personalized anatomical
information, (v) feasibility in clinical application, (vi) minimal adverse effects including
radiation hazard. To fulfill these goals, many experimental studies are conducted. Novel
mapping and imaging technologies such as cardiac MRI, MR spectroscopy, diffused optical
spectroscopy, optical imaging, cardiac coherence tomography is under development for
clinical use.
Optical mapping, cardiac electrical activity mapping using fluorescence imaging techniques provides unprecedented details of cardiac electrical activity at high spatial and temporal resolution and optical recordings of action potentials with signals similar to the shape and
www.intechopen.com

Atrial Fibrillation - Basic Research and Clinical Applications
118
time course of action potentials recorded with intracellular microelectrodes. It can image electrical activity at sufficiently fast rates to map rapid activation of cardiac tissue during reentry, and provide detailed maps of repolarization sequences. Experimental studies using high-resolution optical mapping of impulse propagation during AF in the isolated sheep heart demonstrate that acetylcholine (Ach) dose-dependent reentrant sources in the left atrium can drive the fibrillatory activity throughout both atria. Using phase representation of the local impulse kinetics, Berenfeld et al. [73-74] establish that rotors can arise from unidirectional blocks of propagation at functional obstacles. Further spatiotemporal tracking of the wavebreak sites identifies a functional isthmus in the wake of such an obstacle whose minimal width supporting a figure-of-eight reentry substance is about 4 mm. In the absence of Ach, increasing the intra-atrial pressure revealed a consistent increase in the frequency and dominance of activation in an area between the atrium and a pulmonary vein with the appearance of intermittent reentrant activity there. From the development of molecular biology and genetics, channelopathy, disease of structure and function of cardiac ion channel, results in atrial tachyarrhythmias. The role of mapping in channelopathies is important subjects such as in Brugada syndrome, long-QT syndrome, idiopathic VF, etc. To overcome the limitation of current morphological and functional imaging technique, molecular cardiovascular imaging with SPECT and PET will be facilitated, which directly and noninvasively visualize molecular pathways in normal and diseased condition in vivo.
Fig. 17. Future advancement in mapping including (upper left) personalized 3D atrial modeling, (upper right) detailed anatomy information including PA, LAA, etc, (lower) detailed endoscopic view. Courtesy from Prof. Eun-Bo Shim and Whal Lee.
www.intechopen.com
Current Status and Future of Cardiac Mapping in Atrial Fibrillation
119
The role of mapping will be expanded in the fields of early detection of disease, risk
evaluation, treatment guidance and outcome accessment. In technical viewpoint of mapping
in AF, (i) personalized 3D atrial modeling, (ii) detailed anatomy information including PA,
LAA, etc, (iii) detailed endoscopic view, (iv) real-time processing map, and (v) 4D cine-MR
based map should be made near future (Fig.17).
11. References
[1] Cappato R, Calkins H, Chen SA, Davies W, Iesaka Y, Kalman J, Kim YH, Klein G, Natale
A, Packer D, Skanes A, Ambrogi F, Biganzoli E. Updated worldwide survey on the
methods, efficacy, and safety of catheter ablation for human atrial fibrillation. Circ
Arrhythm Electrophysiol 2010; 3:32-38.
[2] Durrer D, van der Tweel LH. Spread of activation in the left ventricular wall of the dog. I.
Amer Heart J 1953; 46:683-91.
[3] Durrer D, van der Tweel LH. Spread of activation in the left ventricular wall of the dog.
II. Amer Heart J 1954; 47:192-203.
[4] Durrer D, van der Tweel LH, Blickman JR. Spread of activation in the left ventricular
wall of the dog. III. Amer Heart J 1954; 48:13-35.
[5] Durrer D, van der Tweel LH, Berreklouw S, van der Wey LP. Spread of activation in the
left ventricular wall of the dog. IV. Amer Heart J 1955; 50:860-82.
[6] Durrer D, van Dam R Th, Freud GE, Janse MJ, Meijler FL, Arzbaecher RC. Total
excitation of the isolated human heart. Circulation 1970; 41:899-912.
[7] Wellens HJ, Janse MJ, van Dem RT, Durrer D. Epicardial excitation of the atria in a
patient with atrial flutter. British Heart J 1971; 33:233-237.
[8] Durrer D, Schoo LM, Schuilenburg RM, Wellens HJJ. The role of premature beats in the
initiation and the termination of supraventricular tachycardia in the Wolff-
Parkinson_White syndrome. Circulation 1967; 36:644-62.
[9] Taccardi B. Distribution of heart potentials on dog’s thoracic surface. Circ Res 1962;
11:862-69.
[10] Taccardi B. Distribution of heart potentials on the thoracic surface of normal human
subjects. Circ Res 1963; 12:341-52.
[11] SippensGroenewegen A, Roithinger FX, Peeters HA, Linnenbank AC, van Hemel NM,
Steiner PR, et al. Body surface mapping of atrial arrhythmias: Atlas of paced P wave
integral maps to localize the focal origin of right atrial tachycardia. J Electrocardiol
1998; 31(Suppl):85-91.
[12] SippensGroenewegen A, Lesh MD, Roithinger FX, Ellis WS, Steiner PR, Saxon LA, Lee
RJ, Scheinman MM. Body surface mapping of counterclockwise and clockwise
typical atrial flutter: A comparative analysis with endocardial activation sequence
mapping. J Am Coll Cardiol 2000; 35:1276-1287.
[13] Guillem MS, Climent AM, Castells F, Husser D, Millet J, Arya A, Piorkowski C,
Bollmann A. Noninvasive mapping of human atrial fibrillation. J Cardiovasc
Electrophysiol 2008; 1-7.
[14] Ramanathan C, Ghanem RN, Jia P, Ryu K, Rudy Y. Noninvasive electrocardiographic
imaging for cardiac electrophysiology and arrhythmia. Nat Med 2004 April;
10(4):422-28.
www.intechopen.com
Atrial Fibrillation - Basic Research and Clinical Applications
120
[15] Wang Y, Schuessler RB, Damiano RJ, Woodard PK, Rudy Y. Noninvasive
electrocardiographic imaging (ECGI) of scar-related atypical atrial flutter. Heart
Rhythm 2007; 4(12):1565-67.
[16] Pfeifer B, Hanser F, Seger M, Fischer G, Modre-Osprian R, Tilg B. Patient-specific
volume conductor modeling for non-invasive imaging of cardiac electrophysiology.
The Open Medical Informatics J 2008; 2:32-41.
[17] Gepstein L, hayam G, Ben HS. A novel method for non-fluoroscopic catheter-based
electroanatomical mapping of the heart: in vitro and in vivo accuracy results.
Circulation 1997; 95:1611-22.
[18] Ben-Haim SA, Osadchy D, Schuster I et al. Nonfluoroscopic, in vivo navigation and
mapping technology. Nat Med 1996; 2:1393-95.
[19] Firat Duru. CARTO Three-Dimensional Non-Fluoroscopic Electroanatomic Mapping for
Catheter Ablation of Arrhythmias: A Useful Tool or an Expensive Toy for the
Electrophysiologist? Anadolu Kardiyol Derg 2002; 4:330-7.
[20] Gepstein L, Hayam G, Ben-Haim SA. A novel method for nonfluoroscopic catheter-
based electroanatomical mapping of the heart. In vitro and in vivo accuracy results.
Circulation 1997; 21:1268-78.
[21] Pflaumer A, Deisenhofer I, Hausleiter J, Zrenner B. Mapping and ablation of atypical
flutter in congenital heart disease with a novel three-dimensional mapping system
(CARTO Merge). Europace 2006; 8:138-139.
[22] Wittkampf F, Wever E, Derksen R et al. LocaLisa: new technique for real-time 3-
dimensional localization of regular intracardiac electrodes. Circulation 1999;
99:1312-17.
[23] Early MJ, Showkathali R, Alzetani M et al. Radiofrequency ablation of arrhythmias
guided by nonfluoroscopic catheter location: a prospective randomized trial. Eur
heart J 2006; 27:1223-29.
[24] Patel AM, d’Avila A, Neuzil P, Kim SJ, Mela T, Singh JP, Ruskin JN, Reddy VY. Atrial
tachycardia after ablation of persistent atrial fibrillation. Circ Arrhythmia
Electrophysiol. 2008; 1:14-22.
[25] De Groot NM, Bootsma M, van der Velde ET, Schalij MJ. Three-dimensional catheter
positioning during radiofequency ablation in patients: first application of a real-
time position management system. J Cardiovasc Electrophysiol 2000;11:1183-92.
[26] Watanabe I, Min N, Okumura Y, Ohkubo K, Kofune M, Ashino S, Nagashima K, Nakai
T, Kasamaki Y, Hirayama A. Temperature-controlled cooled-tip radiofrequency
linear ablation of the atria guided by a realtime position management system. Int
Heart J 2011; 52:50-55.
[27] Moe GK, Abildskov JA. Atrial fibrillation as a self-sustaining arrhythmia independent
of focal discharge. Am Heart J 1959; 58:59-70.
[28] Wijffels MC, Kirchof CJ, Dorland R, Allessie MA. Atrial fibrillation begets atrial
fibrillation. A study in awake chronically instrumented goats. Circ 1995; 92:1954-
68.
[29] Cox JL, Boineau JP, Schuessler RB, Jaquiss RD, Lappas DG. Modification of the maze
procedure for atrial flutter and atrial fibrillation. I. Rationale and surgical results. J
Thorac Cardiovasc Surg 1995; 110:473-84.
www.intechopen.com

Current Status and Future of Cardiac Mapping in Atrial Fibrillation
121
[30] Cox JL, Jaquiss RD, Schuessler RB, Boineau JP. Modification of the maze procedure for
atrial flutter and atrial fibrillation. II. Surgical technique of the maze III procedure. J
Thorac Cardiovasc Surg 1995; 110:485-95.
[31] Willems S, Klemm H, Rostock T, Brandstrup B, Ventura R, Steven D, Risius
T, Lutomsky B, Meinertz T. Substrate modification combined with pulmonary
vein isolation improves outcome of catheter ablation in patients with persistent
atrial fibrillation: a prospective randomized comparison. Eur Heart J 2006;
27:2871-78.
[32] Lin YJ, Tai CT, Kao T, Chang SL, Lo LW, Tuan TC, Udyavar AR, Wongcharoen W, Hu
YF, Tso HW, Tsai WC, Chang CJ, Ueng KC, Higa S, Chen SA. Spatiotemporal
organization of the left atrial substrate after circumferential pulmonary vein
isolation of atrial fibrillation. Circ Arrhythmia Electrophysiol. 2009; 2:233-241.
[33] Nademanee K, McKenzie J, Kosar E, Schwab M, Sunsaneewitayakul B, Vasavakul T et
al. A new approach for catheter ablation of atrial fibrillation: mapping of the
electrophysiologic substrate. J Am Coll Cardiol 2004;43:2044-53.
[34] Park JH, Park SW, Kim JY, Kim SK, Jeoung B, Lee MH, Hwang C, Kim YH, Kim SS, Pak
HN. Characteristics of complex fractionated atrial electrogram in the
electroanatomically remodeled left atrium of patients with atrial fibrillation. Circ J
2010; 74:1557-63.
[35] Kim SK, Park JH, Kim JY, Choi JI, Joung B, Lee MH, Kim SS, Kim YH, Pak HN. High
plasma concentrations of transforming growth factor-beta and tissue inhibitor of
metalloproteinase-1. Circ J 2011; 75:557-564.
[36] Reithmann C, Hoffmann E, Dorwarth U, Remp T, Steinbeck G. Electroanatomical
mapping for visualization of atrial activation in patients with incisional atrial
tachycardias. Eur Heart J 2001; 22:237-246.
[37] Nakagawa H, Shah N, Matsudaira K et al. Characterization of reentrant circuit in
macroreentrant right atrial tachycardia after surgical repair of congenital heart
disease: isolated channels between scars allow “focal” ablation. Circ 2001; 103:699-
709.
[38] De Groot NMS, Kuijper AFM, Blom NA et al. 3-D distribution of bipolar atrial
electrogram voltages in patients with congenital heart disease. Pacing Clin
Electrophysiol. 2001; 24:1334-42.
[39] Taccardi B, Arisi G, Macchi E, Baruffi S, Spaggiari S. A new intracavitary probe for
detecting the site of origin of ectopic ventricular beats during one cardiac cycle.
Circulation 1987;75:272-81.
[40] Okumura Y, Henz BD, Johnson SB, Bunch TJ, O’Brien CJ, Hodge DO, Altman A, Govari
A, Packer DL. Three-dimensional ultrasound for image-guided mapping and
intervention: methods, quantitative validation, and clinical feasibility of a novel
multimodality image mapping system. Circ Arrhythm Electrophysiol 2008; 1:110-
119.
[41] Nitta T, Ohmori H, Sakamoto S, Miyagi Y, Kanno S, Shimizu K. Map-guided surgery for
atrial fibrillation. J Thorac Cardiovasc Surg 2005;129:291-9.
www.intechopen.com
Atrial Fibrillation - Basic Research and Clinical Applications
122
[42] Konings KTS, Kirchhof CJHJ, Smeets JRLM, Wellens HJJ, Penn OC, Allessie MA. High-
density mapping of electrically-induced atrial fibrillation in humans. Circulation
1994; 89:1665-1680.
[43] Choi JI, Pak HN, Kim YH. Hybrid epicardial and endocardial catheter ablation in a
patient with atrial fibrillation and suspicious left atrial thrombus. Circ J 2009;
73:384-87.
[44] Doosang Kim, Kiwoong Kim, Yong-Ho Lee, Hyuk Ahn. Detection of atrial arrhythmia
in superconducting quantum interference device magnetocardiography;
preliminary result of a totally-noninvasive localization method for atrial current
mapping. Interact CardioVasc Thorac Surg 2007;6:274-279.
[45] Baule G, McFee R. Detection of magnetic field of the heart. Am Heart J 1963;66:95-96.
[46] Cohen D. Magnetic fields around the torso: production by electrical activity of the
human heart. Science 1967;156:652-54.
[47] Cohen D, Edelsack EA, Zimmermann JE. Magnetocardiograms taken inside a shielded
room with a superconducting point-contact magnetometer. Appl Phys Lett
1970;16:278-280.
[48] Saarinen M et al. The normal magnetocardiogram: I Morphology. Ann Clin Res
1978;10(suppl21):1-43.
[49] Van Leeuwen P et al. A 67-channel biomagnetometer designed for cardiology and other
applications. In: Yoshimoto T et al. eds. Recent Advances in Biomagnetism. Tohoku
University Pres, Sendai 1999:89-92.
[50] Montonen J et al. Magnetocardiographic functional imaging studies in Biomag
laboratory. In: Aine C et al. eds. Biomag96, Proceedings of the 10th international
conference on biomagnetism. Springer, New York 2000:494-497.
[51] Maniewski R, Katila T, Poutanen T, Siltanen P, Varpula T, Wikswo JP Jr. Magnetic
measurements of cardiac mechanical activity. IEEE Trans Biomed Eng
1988;35(9):662-70.
[52] Plonsey R. Capability and limitations of electrocardiography and
magnetocardiography. IEEE 1972;19:239-244.
[53] Nousiainen JJO Lekkala JO, Malmivuo JAV. Comparative study of the normal vector
magnetocardiogram and vector electrocardiogram. J Electrocardiol 1986; 19:275-
290.
[54] Lant J et al. Complementary nature of electrocardiographic and magnetocardiographic
data in patients with ischemic heart disease. J Electrocardiol 1990;23:315-322.
[55] Fenici R et al. Nonfluoroscopic localization of an amagnetic catheter in a realistic torso
phantom by magnetocardiographic and body surface potential mapping. Pacing
Clin Electrophysiol 1998;21:2485-2491.
[56] Pesola K et al. Bioelectromagnetic localization of a pacing catheter in the heart. Phys
Med Biol 1999a;44:2565-2578.
[57] Hanninen H, Takala P, Korhonen P, Oikarinen L, Makijarvi M, Nenonen J, Katila T,
Toivonen L. Features of ST segment and T-wave in exercise-induced myocardial
ischemia evaluated with multichannel magnetocardiography. Ann Med 2002;34(2);
120-9.
www.intechopen.com

Current Status and Future of Cardiac Mapping in Atrial Fibrillation
123
[58] Fujino K, Sumi M, Saito K, Murakami M, Hiquchi T, Nakaya Y, Mori H.
Magnetocardiograms of patients with left ventricular overloading recorded with a
second-derivatives SQUID gradiometer. J Electrocardiol 1984; 17(3):219-28.
[59] Karvonen M, Oikarinen L, Takala P, Kaartinen M, Rossinen J, Hanninen H, Montonen J,
Nenonen J, Makijarvi M, Keto P, Toivonen L, Nieminen MS, Katila T.
Magnetocardiographic indices of left ventricular hypertrophy. J Hypertens
2002;20(11):2285-92.
[60] Park JW, Jung F. Qualitative and quantitative description of myocardial ischemia by
means of magnetocardiography. Biomed Technik 2004; 49:267-73.
[61] Kariniemi V, Ahopelto J, Karp PJ, Katila TE. The fetal magnetocardiogram J Perinat
Med 1974;2(3):214-6.
[62] Hamada H et al. Prenatal diagnosis of long QT syndrome using fetal
magnetocardiography. Prenat Diagn 1999;19:677-680.
[63] Oostendorp TF, van Oosterom A. Modeling the fetal magnetocardiogram. Clin Phys
Physiol Meas 1991;12(suppl.A):15-18.
[64] Makijarvi M et al. Localization of accessory pathways in Wolff-Parkinson_White
syndrome by high-resolution magnetocardiographic mapping. J Electrocardiol
1992;25:143-155.
[65] Moshage W et al. Evaluation of the non-invasive localization accuracy of the cardiac
arrhythmias attainable by multichannel magnetocardiography (MCG). Int J Cardiac
Imaging 1996;12:47-59.
[66] Oeff M et al. Magnetocardiographic localization of the origin of ventricular ectopic
beats. Pacing Clin Electrophysiol 1994;17:517-522.
[67] Korhonen P, Montonen J, Makijarvi M, Katila T, Nieminen MS, Toivonen L. Late fields
of the magnetocardiographic QRS complex as indicators of propensity to sustained
ventricular tachycardia after myocardial infarction. J Cardiovasc Electrophysiol
2000;11(4):413-20.
[68] Oikarinen L et al. Postmyocardial infarction patients susceptible to ventricular
tachycardia show increased T wave dispersion independent of delayed ventricular
conduction. J Cardiovasc Electrophysiol 2001;12:1115-1120.
[69] Lee YH, Kwon H, Kim JM, Park YK, Park JC. Double relaxation oscillation SQUID with
high flux-to-voltage transfer and its application to a biomagnetic multichannel
system. J Korean Phys Soc 1998; 32(4):600.
[70] Kim K, Lee YH, Kwon H, Kim JM, Kim IS, Park YK. Optimal sensor distribution for
measuring the tangential field components in MCG. Neurol Clin Neurophysiol
2004; 1:60.
[71] Kim K, Kwon H, Kim KD, Lee YH, Kim JM, Kim IS, Lim HK, Park YK, Kim D, Lim SP.
Detection of Rapid Atrial Arrhythmias in SQUID Magnetocardiography. Progress
in Superconductivity 2005; 7(1): 28-35.
[72] Numminen J, Ahlfors S, Ilmoniemi R, Montonen J, Neonen J. Transformation of
multichannel magnetocardiographic signals to standard grid form. IEEE Trans
Biomed Eng. 1995; 42(1):72-8.
[73] Jalife J, Berenfeld O, Mansour M. Mother rotors and fibrillatory conduction: a
mechanism of atrial fibrillation. Cardiovasc Res 2002;54:204-16.
www.intechopen.com

Atrial Fibrillation - Basic Research and Clinical Applications
124
[74] Berenfeld O, Mandapati R, Dixit S, et al. Spatially distributed dominant excitation
frequencies reveal hidden organization in atrial fibrillation in the Langendorff
perfused sheep heart. J Cardiovasc Electrophysiol 2000;11:869-79.
www.intechopen.com

Atrial Fibrillation - Basic Research and Clinical ApplicationsEdited by Prof. Jong-Il Choi
ISBN 978-953-307-399-6Hard cover, 414 pagesPublisher InTechPublished online 11, January, 2012Published in print edition January, 2012
InTech EuropeUniversity Campus STeP Ri Slavka Krautzeka 83/A 51000 Rijeka, Croatia Phone: +385 (51) 770 447 Fax: +385 (51) 686 166www.intechopen.com
InTech ChinaUnit 405, Office Block, Hotel Equatorial Shanghai No.65, Yan An Road (West), Shanghai, 200040, China
Phone: +86-21-62489820 Fax: +86-21-62489821
Atrial Fibrillation-Basic Research and Clinical Applications is designed to provide a comprehensive review andto introduce outstanding and novel researches. This book contains 22 polished chapters and consists of fivesections: 1. Basic mechanisms of initiation and maintenance of atrial fibrillation and its pathophysiology, 2.Mapping of atrial fibrillation and novel methods of signal detection. 3. Clinical prognostic predictors of atrialfibrillation and remodeling, 4. Systemic reviews of catheter-based/surgical treatment and novel targets fortreatment of atrial fibrillation and 5. Atrial fibrillation in specific conditions and its complications. Each chapterupdates the knowledge of atrial fibrillation, providing state-of-the art for not only scientists and clinicians whoare interested in electrophysiology, but also general cardiologists.
How to referenceIn order to correctly reference this scholarly work, feel free to copy and paste the following:
Doosang Kim and Hyuk Ahn (2012). Current Status and Future of Cardiac Mapping in Atrial Fibrillation, AtrialFibrillation - Basic Research and Clinical Applications, Prof. Jong-Il Choi (Ed.), ISBN: 978-953-307-399-6,InTech, Available from: http://www.intechopen.com/books/atrial-fibrillation-basic-research-and-clinical-applications/current-status-and-future-of-cardiac-mapping-in-atrial-fibrillation