current expected credit loss (cecl) - fi consulting · new current expected credit loss (cecl)...
TRANSCRIPT
White PaPer
Lessons from the Federal Government experience with Lifetime expected Credit Loss
Current Expected Credit Loss (CECL)
1
2
3
4
5
A Real-World Experience with ECL – USG Credit Programs
KEy LESSonS5 Changes to expected lifetime losses can have a major impact on the
size and volatility of financial results, but that impact is hard to
predict until making substantial progress towards implementation
Data is a critical asset, and having more data provides greater
capabilities to implement estimation methods that are defensible and
suitable to your organization
the amount of sophistication built into your forecasting models
directly impacts the level of control you have over financial results
and the business
the transition impacts stakeholders across the organization and is
not confined to finance and risk functions
Audits will become more complicated and more expensive
in what follows, we discuss each of these lessons in greater detail and offer key
recommendations to help your organization move ahead with a successful
transition to CeCL.
Federal loan programs that oversee loan
and loan guarantee portfolios — such as
the troubled asset relief Program (tarP),
the Federal housing administration
(Fha) Mortgage insurance Program,
Department of Veterans affairs
(Va) home Loan Program, and the
Department of agriculture (USDa)
rural Development Program — have
been operating under an accounting
framework directly analogous to the
new current expected credit loss (CeCL)
standard for the last 25 years. Since
19921, federal agencies have had to
estimate lifetime credit losses and use
these estimates on agency balance
sheets, income statements, and to inform
congressional appropriations that cover
the costs of agencies’ credit programs.
today, the US government holds
more than $3.5 trillion in outstanding
exposure across more than a hundred
different credit programs — all of which
is accounted, reported, and budgeted
under a lifetime credit loss approach. as
of the end of 2016, that exposure was
represented by a roughly $100B liability
on the federal balance sheet.
1 the Federal Credit reform act of 1990 (FCra) requires Federal credit programs to estimate the cost of credit based on the net present value of the discounted future cash flows over the life of loans.
www.ficonsulting.com | 1
Based on our experience working with federal agencies, we have identified five key lessons that are directly relevant to those adopting CeCL
a key question for CeCL is the magnitude of its impact on
loss allowances — and with that, the provision, earnings,
and capital. in 2011, the aBa estimated that CeCL would
raise allowances between 30% and 50%. in addition to
direct financial impacts, organizations are also thinking
about how CeCL will impact their business strategy, since
it could impact the profitability of different portfolio
segments. this in turn may lead to aggregate shifts in the
economy as lenders move out of some segments and into
others.
Federal agencies faced the same basic question: how
would moving to a lifetime credit loss approach impact
their financial reporting, and the amount of money they
need to ask Congress for each year? When the federal
government moved to a lifetime losses approach, they saw
a 50% increase in their credit loss provision relative to the
previous paradigm. On a portfolio of about $770B at the
time, credit costs went from about $20B a year to more
than $30B.
Changing economic conditions cause volatility in the
allowance. the Federal housing administration’s allowance
went up by more than $14B during the financial crisis,
attributed primarily to lower expectations for future house
price growth. Financial results can change even when
economic forecasts aren’t changing. Federal organizations
regularly review and enhance their models, and they
incorporate more historical data into their projections.
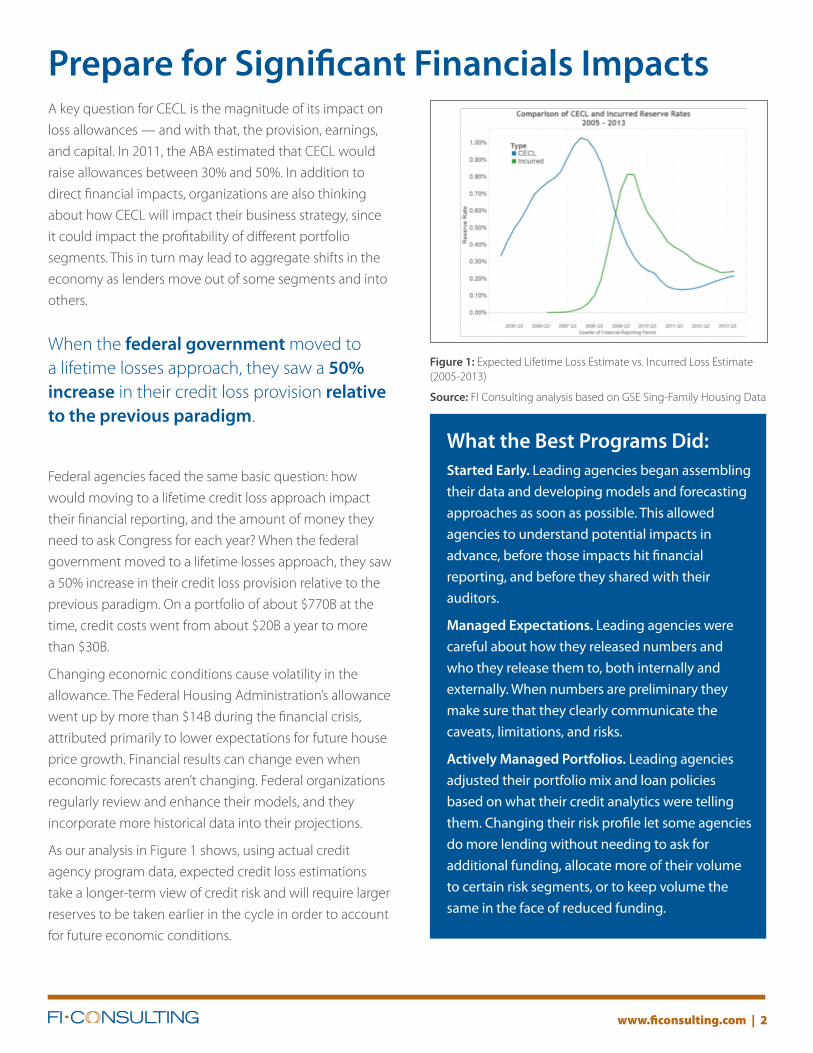
as our analysis in Figure 1 shows, using actual credit
agency program data, expected credit loss estimations
take a longer-term view of credit risk and will require larger
reserves to be taken earlier in the cycle in order to account
for future economic conditions.
Prepare for Significant Financials Impacts
What the Best Programs Did: Started Early. Leading agencies began assembling
their data and developing models and forecasting
approaches as soon as possible. This allowed
agencies to understand potential impacts in
advance, before those impacts hit financial
reporting, and before they shared with their
auditors.
Managed Expectations. Leading agencies were
careful about how they released numbers and
who they release them to, both internally and
externally. When numbers are preliminary they
make sure that they clearly communicate the
caveats, limitations, and risks.
Actively Managed Portfolios. Leading agencies
adjusted their portfolio mix and loan policies
based on what their credit analytics were telling
them. Changing their risk profile let some agencies
do more lending without needing to ask for
additional funding, allocate more of their volume
to certain risk segments, or to keep volume the
same in the face of reduced funding.
Figure 1: expected Lifetime Loss estimate vs. incurred Loss estimate (2005-2013)
Source: Fi Consulting analysis based on GSe Sing-Family housing Data
www.ficonsulting.com | 2
When the federal government moved to a lifetime losses approach, they saw a 50% increase in their credit loss provision relative to the previous paradigm.
www.ficonsulting.com | 3
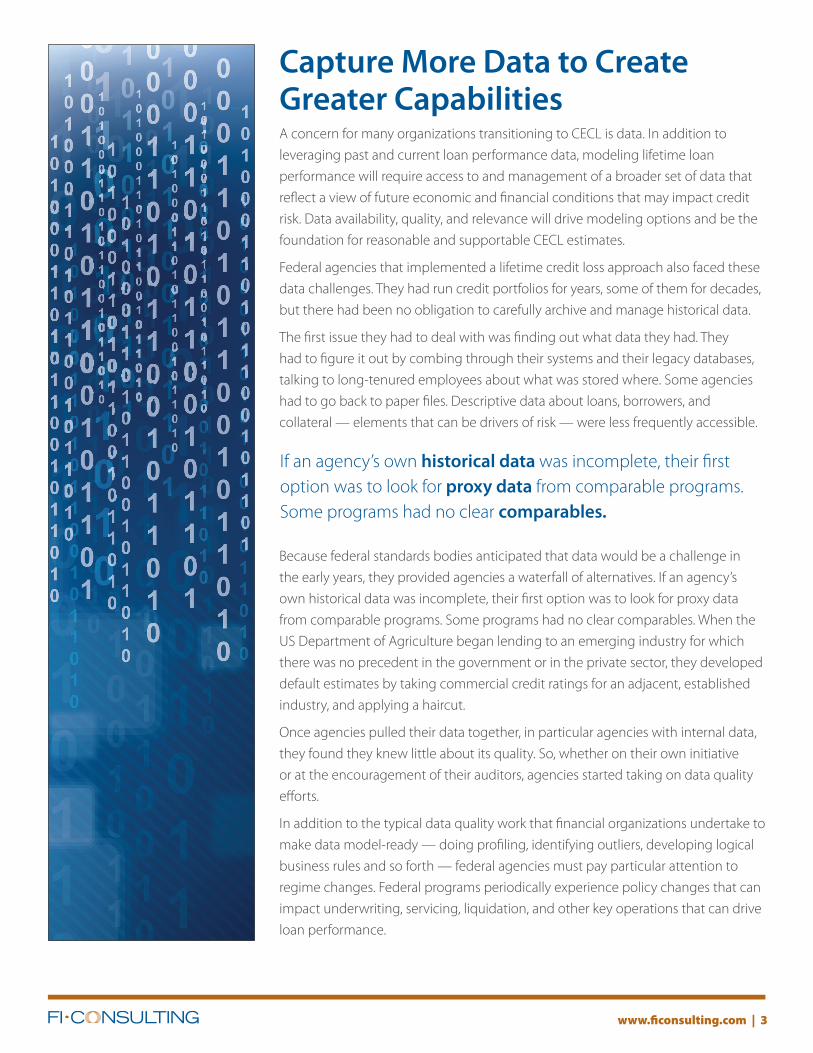
Capture More Data to Create Greater Capabilitiesa concern for many organizations transitioning to CeCL is data. in addition to
leveraging past and current loan performance data, modeling lifetime loan
performance will require access to and management of a broader set of data that
reflect a view of future economic and financial conditions that may impact credit
risk. Data availability, quality, and relevance will drive modeling options and be the
foundation for reasonable and supportable CeCL estimates.
Federal agencies that implemented a lifetime credit loss approach also faced these
data challenges. they had run credit portfolios for years, some of them for decades,
but there had been no obligation to carefully archive and manage historical data.
the first issue they had to deal with was finding out what data they had. they
had to figure it out by combing through their systems and their legacy databases,
talking to long-tenured employees about what was stored where. Some agencies
had to go back to paper files. Descriptive data about loans, borrowers, and
collateral — elements that can be drivers of risk — were less frequently accessible.
Because federal standards bodies anticipated that data would be a challenge in
the early years, they provided agencies a waterfall of alternatives. if an agency’s
own historical data was incomplete, their first option was to look for proxy data
from comparable programs. Some programs had no clear comparables. When the
US Department of agriculture began lending to an emerging industry for which
there was no precedent in the government or in the private sector, they developed
default estimates by taking commercial credit ratings for an adjacent, established
industry, and applying a haircut.
Once agencies pulled their data together, in particular agencies with internal data,
they found they knew little about its quality. So, whether on their own initiative
or at the encouragement of their auditors, agencies started taking on data quality
efforts.
in addition to the typical data quality work that financial organizations undertake to
make data model-ready — doing profiling, identifying outliers, developing logical
business rules and so forth — federal agencies must pay particular attention to
regime changes. Federal programs periodically experience policy changes that can
impact underwriting, servicing, liquidation, and other key operations that can drive
loan performance.
if an agency’s own historical data was incomplete, their first option was to look for proxy data from comparable programs. Some programs had no clear comparables.
www.ficonsulting.com | 4
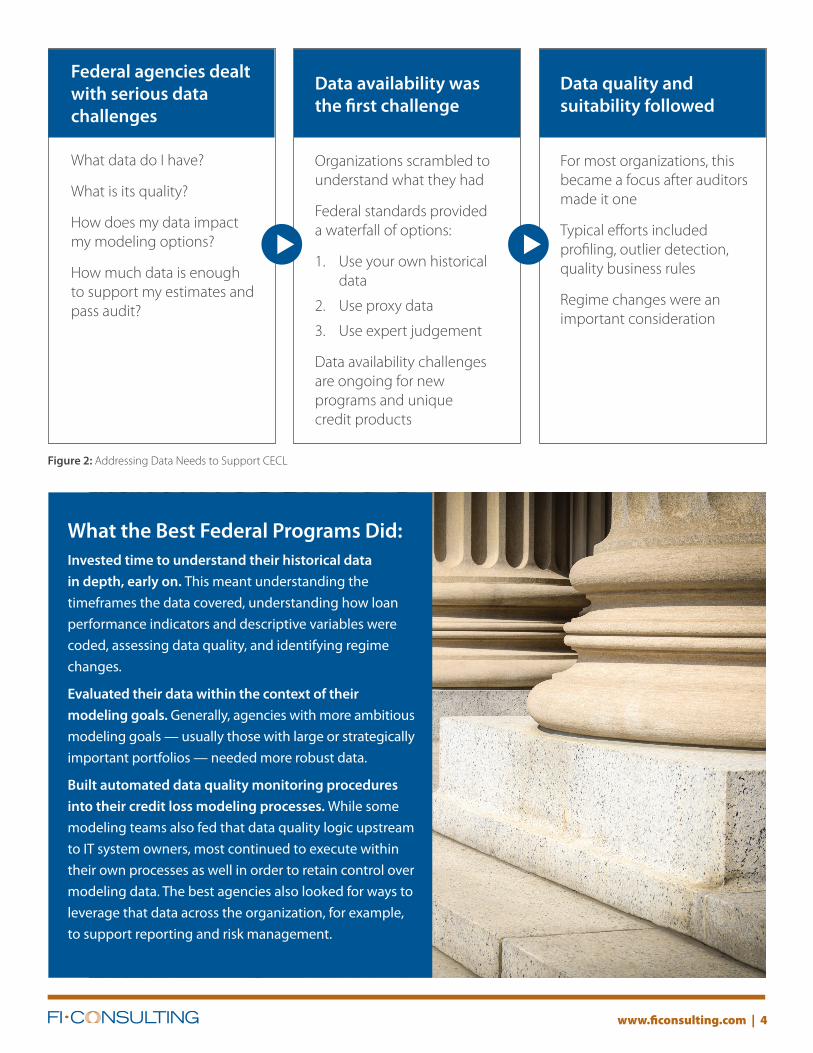
Figure 2: addressing Data Needs to Support CeCL
Federal agencies dealt with serious data challenges
What data do i have?
What is its quality?
how does my data impact my modeling options?
how much data is enough to support my estimates and pass audit?
Data availability was the first challenge
Organizations scrambled to understand what they had
Federal standards provided a waterfall of options:
1. Use your own historical data
2. Use proxy data
3. Use expert judgement
Data availability challenges are ongoing for new programs and unique credit products
Data quality and suitability followed
For most organizations, this became a focus after auditors made it one
typical efforts included profiling, outlier detection, quality business rules
regime changes were an important consideration
ssWhat the Best Federal Programs Did: Invested time to understand their historical data
in depth, early on. This meant understanding the
timeframes the data covered, understanding how loan
performance indicators and descriptive variables were
coded, assessing data quality, and identifying regime
changes.
Evaluated their data within the context of their
modeling goals. Generally, agencies with more ambitious
modeling goals — usually those with large or strategically
important portfolios — needed more robust data.
Built automated data quality monitoring procedures
into their credit loss modeling processes. While some
modeling teams also fed that data quality logic upstream
to IT system owners, most continued to execute within
their own processes as well in order to retain control over
modeling data. The best agencies also looked for ways to
leverage that data across the organization, for example,
to support reporting and risk management.
www.fi consulting.com | 5
Base Model Sophistication on organizational needWhen it comes time to build your CeCL models, the standard does not prescribe
a particular framework or model type. Moving from the incurred loss framework
to the CeCL framework will require more sophisticated models because they will
need to estimate future conditions that may impact loss amounts. also, the need to
incorporate more data elements to generate lifetime forecasts will mean that new
models need to be built to handle the infl ux of increased data requirements.
the federal government builds new models when it establishes new credit
programs. agencies face a choice over how complex the model needs to be to
satisfy the standard.
Simple models require fewer resources to maintain. it requires a great deal of time
and eff ort to generate forecasts each quarter. Stress testing models — such as those
for DFaSt or CCar — are also sophisticated, forward-looking models that require
signifi cant time and resources to produce results on an annual basis. Under CeCL,
the allowance needs to be produced quarterly, so a simple streamlined model
will have the advantage fi tting into a quarterly production schedule more easily.
however, simple models may be less accurate and will not have as many analytic
options, such as segmentation, that will target allowance reductions strategically.
More sophisticated models will give you greater ability to fi nd ways to reduce your
allowance through rebalancing your portfolio or using data to pinpoint factors that
reduce credit risk estimations for certain asset types. Complex models will require
more documentation, explanation, and demonstrated control to key stakeholders
such as the board and regulators.
What the Best Did:Calibrated the sophistication
of their model toward
their unique portfolio.
The best organizations also
were realistic about their
organizational resources that
could sustain models long-
term.
Used models proactively.
For example, using the
model to test the impact of
proposed policy changes.
The best organizations also
proactively developed model
diagnostics. They tested the
sensitivity of their forecasts
to diff erent economic
scenarios and portfolio
mix — allowing them to
understand how their
fi nancial results would react
to diff erent conditions,
before those conditions
occurred.
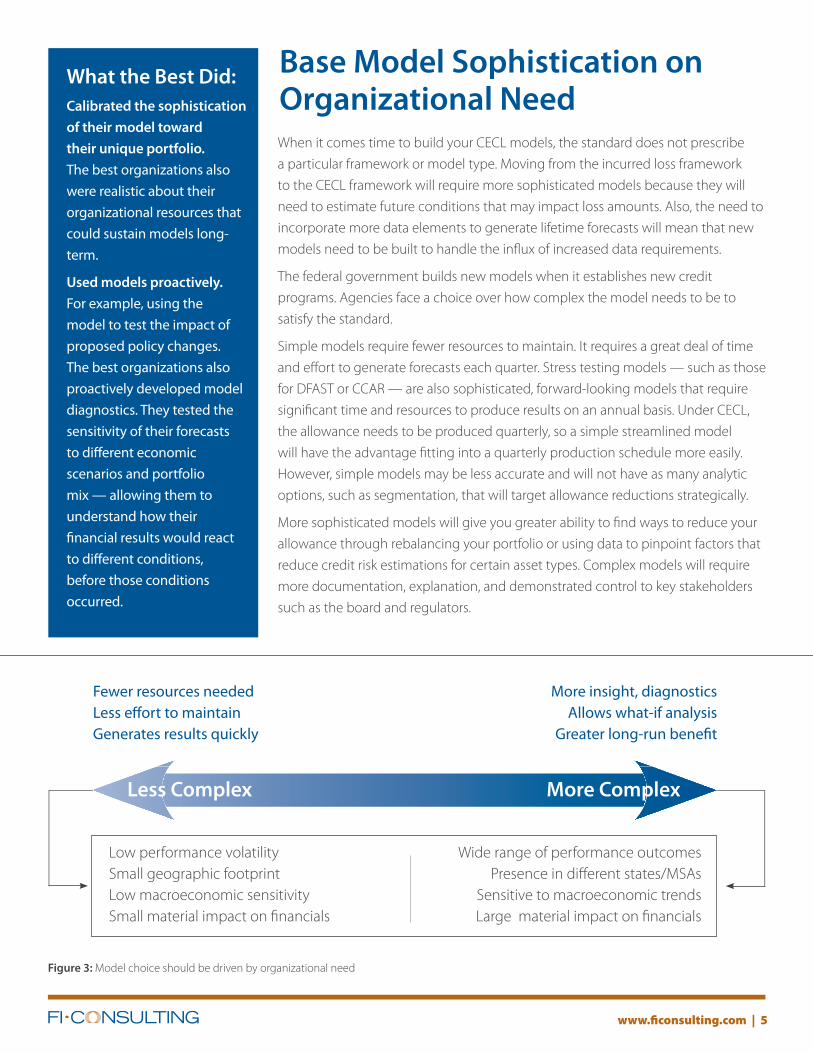
Figure 3: Model choice should be driven by organizational need
Less Complex More Complex
Fewer resources neededLess eff ort to maintainGenerates results quickly
More insight, diagnosticsAllows what-if analysis
Greater long-run benefi t
Wide range of performance outcomesPresence in diff erent states/MSas
Sensitive to macroeconomic trendsLarge material impact on fi nancials
Low performance volatilitySmall geographic footprintLow macroeconomic sensitivitySmall material impact on fi nancials
Because CeCL is an accounting
standard, its key stakeholder is most
naturally the organization’s finance
or accounting department. Such was
the case with federal agencies, where
CFO organizations were charged with
implementing the lifetime credit loss
standard.
But CFOs learned quickly that there
were other key stakeholders that
needed to be involved. internally,
credit program offices, it, and top
agency executives were critical
participants, while externally, financial
auditors and agency overseers such as
the Office of Management and Budget
(OMB) were involved as well. Credit
program offices understood that
changes to subsidy rates would affect
the volume of loan guarantees and
insurance. higher costs meant either
increasing congressional budget
appropriation or reducing volume.
it organizations needed to provide
computational infrastructure and data
support to the modeling efforts and
to ensure that related systems were
integrated upstream and downstream.
When this didn’t happen quickly
enough, problems arose across
organizations:
• Program managers were asked
to sign off on assumptions about
portfolio performance that they
had no involvement in developing
• auditors challenged model
decisions that didn’t undergo
sufficient organization review
www.ficonsulting.com | 6
Identify and Engage all Stakeholders Impacted by CECL
What the Best Programs Did:Devised outreach plans to
identify and engage with their
stakeholders. They carefully
thought through how expected
loss accounting would impact
their mission and the costs of
their programs. Understanding
the full scope and scale of
these impacts allowed them to
proactively identify who needed
to be involved to minimize
impacts and ensure that audits
would be successful.
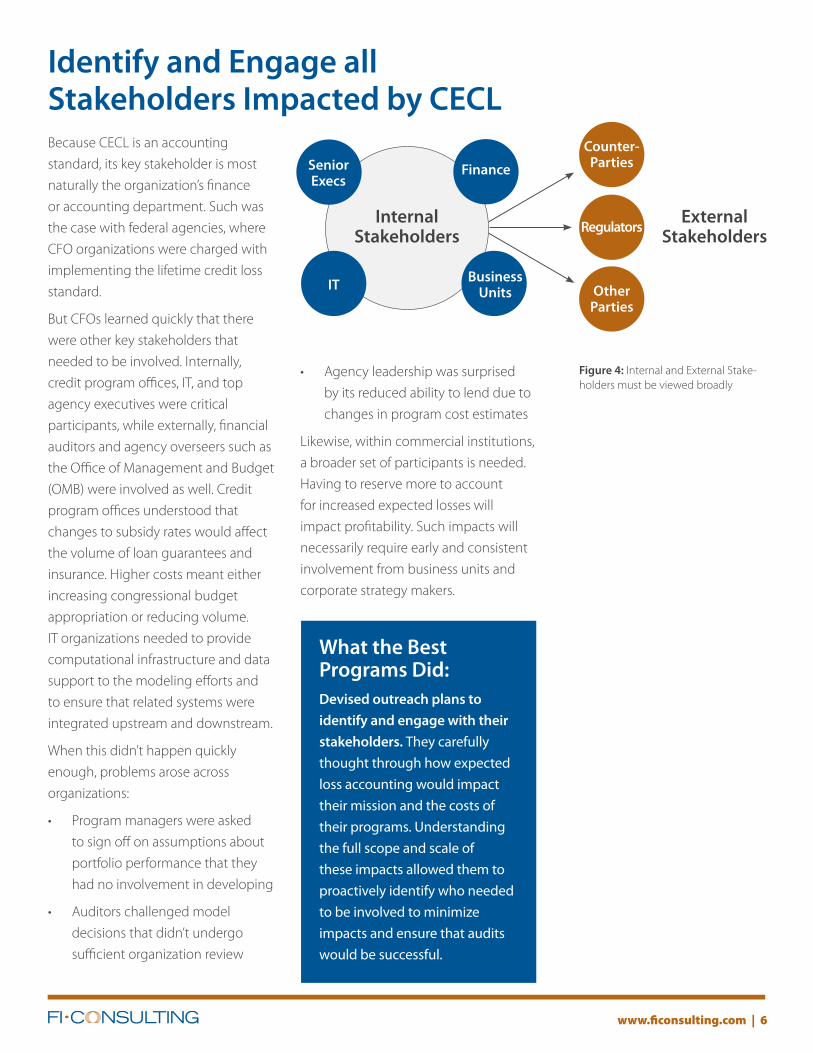
Figure 4: internal and external Stake-holders must be viewed broadly
SeniorExecs
Finance
IT BusinessUnits
ExternalStakeholders
InternalStakeholders
Counter-Parties
Regulators
otherParties
• agency leadership was surprised
by its reduced ability to lend due to
changes in program cost estimates
Likewise, within commercial institutions,
a broader set of participants is needed.
having to reserve more to account
for increased expected losses will
impact profitability. Such impacts will
necessarily require early and consistent
involvement from business units and
corporate strategy makers.
www.ficonsulting.com | 7
Prepare for More Complex and Costly Auditsthe increased complexity under the new standard will mean that audits take more
resources, management attention, and involvement from more stakeholders, which
means that they will likely take longer and be costlier to complete.
For federal agencies, the data, models, and processes underlying lifetime credit
loss estimates were much more complex than under the previous accounting
paradigm. there was more to audit and with that more things that could go wrong.
there was also more modeling infrastructure that needed to be substantiated and
documented. in our experience, the degree of audit scrutiny that government
agencies face is the same, and sometimes more, than what we’ve seen at private
sector institutions.
the standard for model documentation requires that expected loss models can
be independently redeveloped. also, the model development audit trail must
show not only what the final, agreed upon model is, but also all the techniques
considered and why certain ones are chosen. For example, in cases where agencies
that tested dozens or hundreds of econometric specifications, they needed to track
the results of each of those tests, give the results to their auditors, and explain why
they chose the specification they did.
Due to increased complexity, controls and governance became more involved.
audits evolved to cover not only the end results, but the reliability of the process
used to obtain them. as recently as 2016, for example, the Department of housing
and Urban Development’s Office of inspector General expressed a disclaimer of
opinion on hUD’s fiscal years 2014 and 2015. One key finding was that Ginnie Mae’s
valuation allowance for a $5.4 billion portfolio could not be audited because the
agency could not provide adequate data and documentation for auditors to review.
a final consideration is that these new, complicated models have increased the
timeline for audits — in the federal government we’ve seen instances where the
audit timeline increased by up to six months. this has meant not just more time
from the auditors, but more time from the modeling team and financial reporting
team, responding to inquiries, providing code walk throughs, and explaining the
methodology in depth.
What the Best Did:Expended significant
resources to establish
strong control and
governance over the
model development and
execution process. Auditors
were required to meet
very stringent standards
established by FASAB and
enforced by compliance
agencies such as OIGs and
OMB. Having ready access
to evidence that justified
modeling decisions and
demonstrated strong
control over data sources
was a key element to
obtain a clean audit. Lack of
evidentiary trail has been a
leading source of poor audit
results and restatements.
the standard for model documentation requires that expected loss models can be independently redeveloped.
www.ficonsulting.com | 8
RecommendationsBased on our work with federal agencies
implementing lifetime loss estimates,
organizations transitioning to CeCL
should:
Start now
You will give yourself as much runway as
possible to understand the likely impact
on your financial results, to inform key
stakeholders, and to make adjustments to
your business strategy as appropriate. You
will give yourself more time to build a process
that is strong enough to get through audit.
in our experience, organizations that delay
will be at a major disadvantage. the work has
to be done — shortening the timeframe will
not reduce the amount of work that has
to be done.
Prove your Work and Prove your Effort
it may not be possible to fully implement
in-depth, sophisticated models for every
segment of your portfolio in your first year
of implementation. it may not be possible
to obtain and leverage ideal datasets in your
first year. Showing your auditors that you are
developing a reasonable solution given the
realities of your situation coupled with a plan
for how things will change in future years will
help get the auditors on board with your plan
and can prevent findings in the mean time.
Determine where to be on the spectrum of modeling options
Several factors drive the decision about
how much sophistication to build into loss
forecasting models: 1) materiality, in both
relative and absolute terms, 2) volatility of the
segment’s loss performance, and 3) strategic
importance to the bank. even within one
institution it can make sense to implement
simpler models for some segments and
complex models for others. it is important to
make this decision thoughtfully, and not fall
into it due to resource or time constraints.
Make stakeholder management a priority
CeCL will impact many parts of the
organization — both directly and indirectly.
there are stakeholders whose help will be
needed to implement CeCL, and stakeholders
who will be impacted by the implementation
of CeCL. the transition will go best if both
types of stakeholders are educated and
engaged. to enable this, it is very helpful to
have a CeCL implementation team that has
experience across multiple disciplines, who
can both see the big picture and master
the details, so they can communicate most
effectively across the diverse groups they’ll
need to interact with.
Recognize the opportunities that CECL can bring
CeCL can be much more than a compliance
exercise. it can create value for the business.
the investment that you’ll need to make,
especially in modeling and data, can pay
off not only in financial reporting, but can
increase your capabilities in risk, pricing,
portfolio management, and a number of
other functions across your institution.
CeCL can be much more than a compliance exercise. it can create value for the business.
Case Study: Implementing CECL on a Business Loan Portfolio
www.ficonsulting.com | 9
Using data from a federally-financed
small business loan portfolio from
1992 to 2017, and a set of simplifying
assumptions, we ran analyses to
illustrate how a loss reserve based on
lifetime loss forecasts can differ from a
loss reserve based on incurred losses.
Our results confirm the intended
result from the new FaSB standard —
that reserves will need to be larger
and taken earlier in the cycle to fully
account for expected losses.
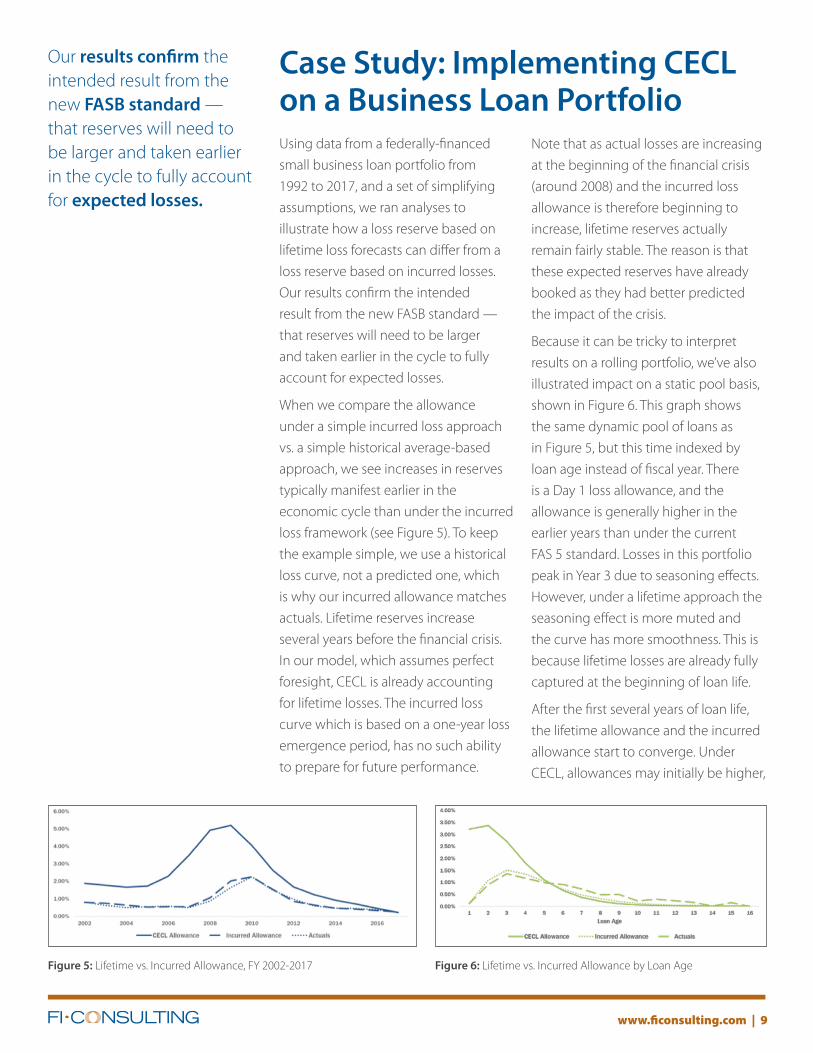
When we compare the allowance
under a simple incurred loss approach
vs. a simple historical average-based
approach, we see increases in reserves
typically manifest earlier in the
economic cycle than under the incurred
loss framework (see Figure 5). to keep
the example simple, we use a historical
loss curve, not a predicted one, which
is why our incurred allowance matches
actuals. Lifetime reserves increase
several years before the financial crisis.
in our model, which assumes perfect
foresight, CeCL is already accounting
for lifetime losses. the incurred loss
curve which is based on a one-year loss
emergence period, has no such ability
to prepare for future performance.
Note that as actual losses are increasing
at the beginning of the financial crisis
(around 2008) and the incurred loss
allowance is therefore beginning to
increase, lifetime reserves actually
remain fairly stable. the reason is that
these expected reserves have already
booked as they had better predicted
the impact of the crisis.
Because it can be tricky to interpret
results on a rolling portfolio, we’ve also
illustrated impact on a static pool basis,
shown in Figure 6. this graph shows
the same dynamic pool of loans as
in Figure 5, but this time indexed by
loan age instead of fiscal year. there
is a Day 1 loss allowance, and the
allowance is generally higher in the
earlier years than under the current
FaS 5 standard. Losses in this portfolio
peak in Year 3 due to seasoning effects.
however, under a lifetime approach the
seasoning effect is more muted and
the curve has more smoothness. this is
because lifetime losses are already fully
captured at the beginning of loan life.
after the first several years of loan life,
the lifetime allowance and the incurred
allowance start to converge. Under
CeCL, allowances may initially be higher,
Figure 5: Lifetime vs. incurred allowance, FY 2002-2017 Figure 6: Lifetime vs. incurred allowance by Loan age
Our results confirm the intended result from the new FASB standard — that reserves will need to be larger and taken earlier in the cycle to fully account for expected losses.
www.ficonsulting.com | 10
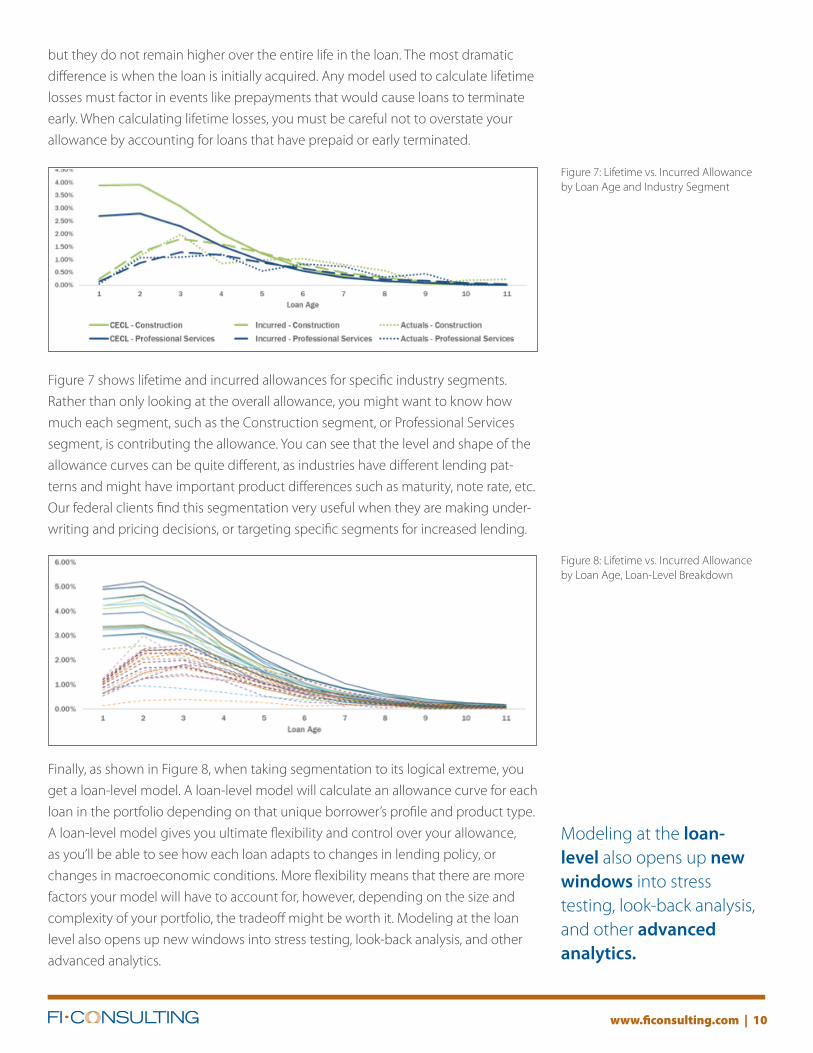
but they do not remain higher over the entire life in the loan. the most dramatic
difference is when the loan is initially acquired. any model used to calculate lifetime
losses must factor in events like prepayments that would cause loans to terminate
early. When calculating lifetime losses, you must be careful not to overstate your
allowance by accounting for loans that have prepaid or early terminated.
Figure 7 shows lifetime and incurred allowances for specific industry segments.
rather than only looking at the overall allowance, you might want to know how
much each segment, such as the Construction segment, or Professional Services
segment, is contributing the allowance. You can see that the level and shape of the
allowance curves can be quite different, as industries have different lending pat-
terns and might have important product differences such as maturity, note rate, etc.
Our federal clients find this segmentation very useful when they are making under-
writing and pricing decisions, or targeting specific segments for increased lending.
Finally, as shown in Figure 8, when taking segmentation to its logical extreme, you
get a loan-level model. a loan-level model will calculate an allowance curve for each
loan in the portfolio depending on that unique borrower’s profile and product type.
a loan-level model gives you ultimate flexibility and control over your allowance,
as you’ll be able to see how each loan adapts to changes in lending policy, or
changes in macroeconomic conditions. More flexibility means that there are more
factors your model will have to account for, however, depending on the size and
complexity of your portfolio, the tradeoff might be worth it. Modeling at the loan
level also opens up new windows into stress testing, look-back analysis, and other
advanced analytics.
Figure 7: Lifetime vs. incurred allowance by Loan age and industry Segment
Figure 8: Lifetime vs. incurred allowance by Loan age, Loan-Level Breakdown
Modeling at the loan-level also opens up new windows into stress testing, look-back analysis, and other advanced analytics.

About the Authors
Roman Iwachiw, CEo | [email protected]
roman iwachiw is the co-founder and CeO of Fi Consulting. he has led financial modeling efforts and
developed data and analytics-focused solutions at clients that comprise US government agencies,
financial regulators, the GSes, banks, and non-profit sector lenders.
Mark Jordan, GSE Account Manager | [email protected]
Mark Jordan is a portfolio and project management expert with over 15 years of experience
working with federal and commercial clients to create best practices for financial management and
organizational effectiveness. at Fi, he manages teams of modelers and technology experts for our
commercial and GSe clients.
Robert Chang, Model Lead | [email protected]
rob Chang has over 12 years of experience in financial modeling, risk management, and large scale
data analysis working for investment banks and hedge funds. he leads teams that build and validate
CCar, DFaSt, and aLLL models for banks and other financial institutions.
1500 Wilson Blvd. | 4th Floor
Arlington, VA 22209
Phone: 571.255.6900
www.ficonsulting.com
about FiFI Consulting (FI) delivers solutions that help
financial institutions and government agencies
get better information, make insightful and
substantiated decisions, manage risk, and
improve performance. FI’s approach applies
data, analytics, modeling, and technology
through agile, customer-centric principles
that recognize the complexities of our clients’
businesses as well as leading practices.
FI has successfully delivered CECL-equivalent
credit modeling projects covering numerous
asset classes and more than $2T in total credit
exposure.