current clamprecordings with patchmaster™ software€¦ · what can we measure: • membrane...
TRANSCRIPT

Telly Galiatsatos
General Manager HEKA instruments Inc.
Current Clamp Recordings with
PATCHMASTER™ Software

TALK OVERVIEW
• EPC 10 revision T hardware overview
• Intracellular recordings with high resistance electrodes
• Current clamp recording
• Voltage clamp recording using AP as stimulus
• Online analysis – AP functions
Slide 2
12/18/2013

What can we measure:
• Membrane resting potential
• Spontaneous action potentials
• Elicited action potentials
Current Clamp mode
Slide 3
12/18/2013
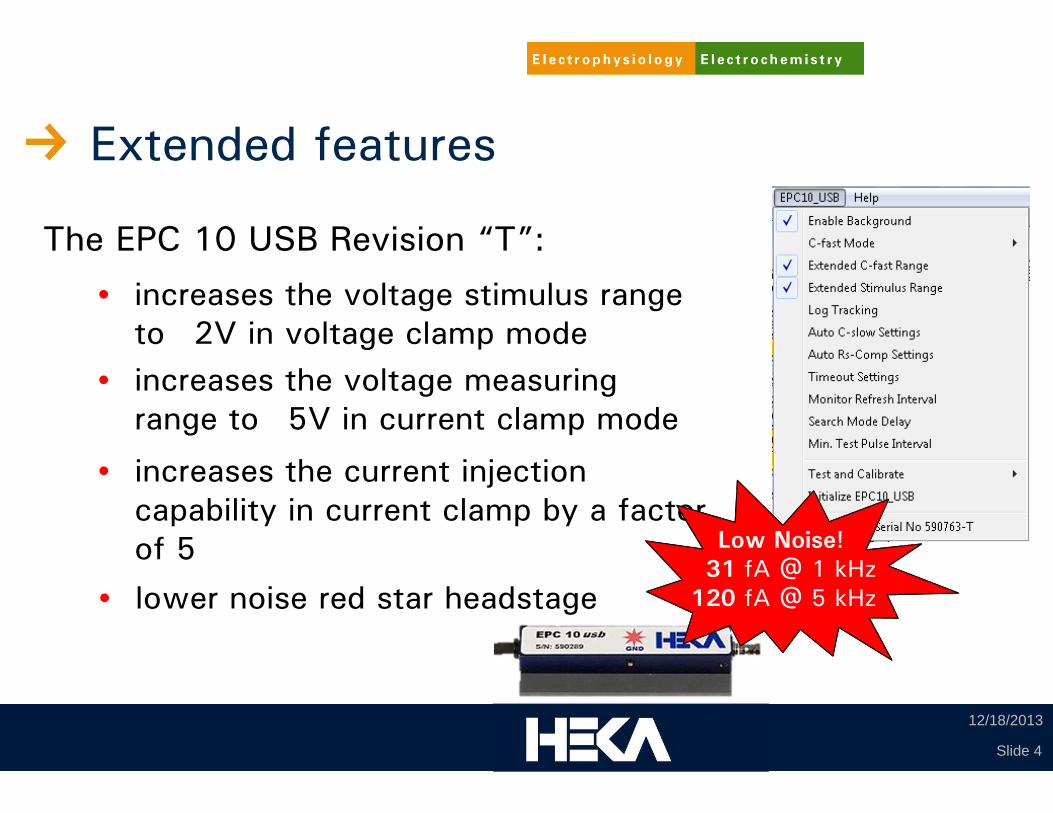
The EPC 10 USB Revision “T”:
Extended features
Slide 4
12/18/2013
• increases the voltage stimulus range to 2V in voltage clamp mode
• increases the voltage measuring range to 5V in current clamp mode
• increases the current injection capability in current clamp by a factor of 5 Low Noise!
31 fA @ 1 kHz120 fA @ 5 kHz• lower noise red star headstage

EPC 10 Hardware Controls
I-membrane
CC Gain
Gentle Switch
V-mon Gain
Ext Command
Filter1
Slide 5
12/18/2013
Current Gain
CC Mode
C-fast
C-slow
Bridge
Filter2

• OFF - I-membrane will be set to 0pA
Gentle CC-Switch
Slide 6
12/18/2013
• ON - I-membrane will be set to the proper value to keep the membrane voltage at the commanded voltage in voltage clamp

CC-Gain & Current Gain
Slide 7
12/18/2013
CC-gain ranges of 10.0 or 100.0pA/mV will operate in the low gain range
CC-gain ranges of 0.1 or 1.0pA/mV will operate in the medium gain range
Four gain ranges for setting maximum current injection

Measured voltage can be amplified by either a factor of 10 or 100 before digitization
V-mon Gain
Slide 8
12/18/2013
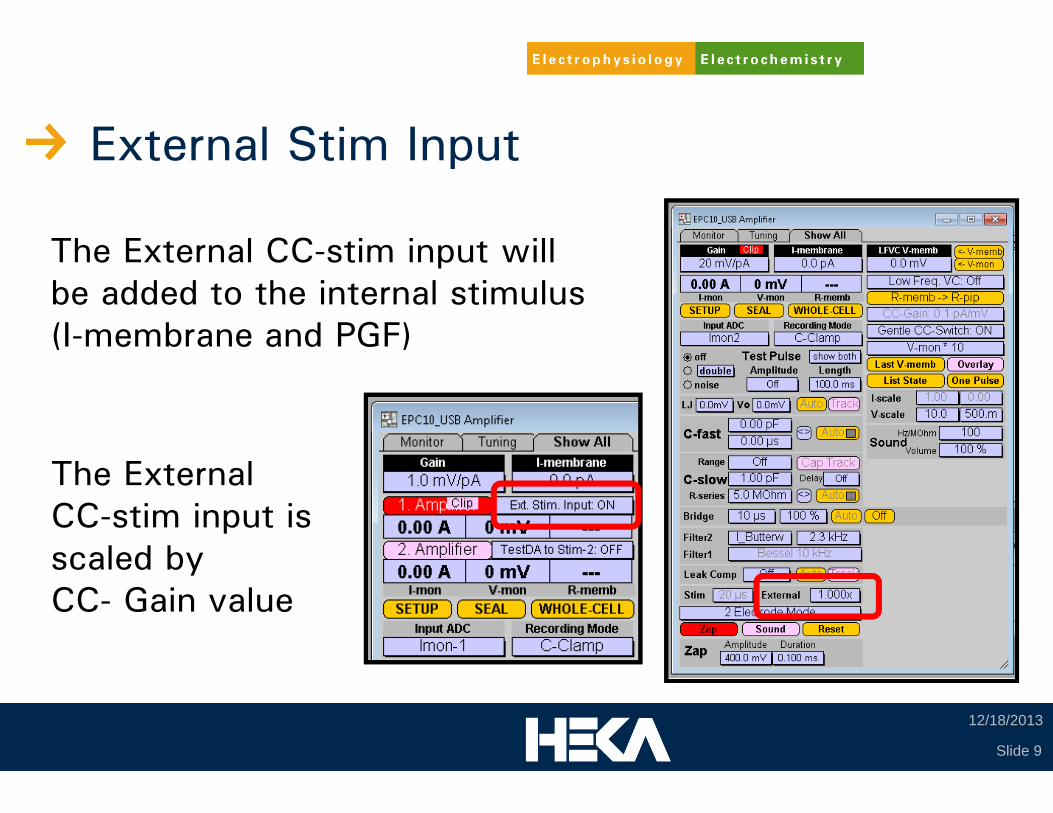
The External CC-stim input will be added to the internal stimulus (I-membrane and PGF)
External Stim Input
Slide 9
12/18/2013
The ExternalCC-stim input is scaled byCC- Gain value

• 10kHz when CC-gain = 0.1 or 1.0pA/mV
• 30kHz when CC-gain = 10.0 or 100.0pA/mV
Filter1
Automatically set
Slide 10
12/18/2013

Filter2 can be applied to:
Filter2
• Bypassed
• Current signal
• Voltage signal
Slide 11
12/18/2013

A balanced bridge is the ability to inject current through the resistance of the pipette while still measuring the true membrane voltage
Bridge Balance
When switching modes:
• Rs Comp is transformed to Bridge• Bridge is initially OFF
Slide 12
12/18/2013

Bridge Balance settings
Time constant - vary based on CC-Gain range settings
Percentage control - % of R-Series used for compensation
Maximum access resistances that can be compensated:
• 0.1pA/mV and 1.0pA/mV CC-gain: 500MΩ• 10pA/mV and 100pA/mV CC-gain: 5MΩ
Slide 13
12/18/2013

In VC mode perform Auto C-fast to neutralize capacitance of the electrode
C-fast compensation
Automatic C-fast compensation is disabled
C-fast is reduced by 0.5pF to reduce possibility of oscillation and potentially the destruction of the cell membrane
Slide 14
12/18/2013
CC-mode:

CC-mode:
C-slow compensation
C-slow affects cellular parameters which will distort the voltage signal
Slide 15
12/18/2013
Perform Auto C-slow in VC mode to:
• Cancel any remaining capacitive transients
C-slow compensation is automatically turned OFF
WHY?
• Get initial estimates of membrane capacitance and series resistance

Current clamp recording mode
• The input of the headstage acts as a high impedance voltage follower
• The feedback resistor is used for stimulation
• I-membrane is set
• Internal stimulation stopped
• Filter1 is set to Bessel 10kHz or 30kHz
• C-slow = Off
• C-fast reduced by 0.5pF
• Rs-compensation =“bridge balance”
Slide 16
12/18/2013

Example - high resistance electrodes
Top: high resistance ~50 MΩpipette in the bath
Rs = 50 MΩ
C-fast = 4.7 pF
C –fast = 4.7 pF
Middle: a clogged electrode or an “ideal” On Cell configuration
Rs = 100 MΩ
4.7 pF 47 pF
Rm = 500 MΩ
Lower: impaled cell with high access resistance
Slide 17
12/18/2013

Electrode in bath
Example - high resistance electrodes
Test Pulse is executed
Setup to Reset
Current and voltage acquired
R-memb ~50MΩ
Slide 18
12/18/2013

Have Gigaseal
Example - high resistance electrodes
Auto C-Fast
Slide 19
12/18/2013

Impale cell
Example - high resistance electrodes
Auto C-slow
Slide 20
12/18/2013

Current clamp mode
Example - high resistance electrodes
Slide 21
12/18/2013
Enable Test Pulse

Set Bridge values to 10µs and 100%
Example - high resistance electrodes
Slide 22
12/18/2013

Current clamp recording - AP
Slide 23
12/18/2013
Depolarization phase Repolarization phase
Action Potential
Threshold
Resting potential
Refractory period
Stimulus

Current clamp recording
PGF sequence to record an action potential.
Slide 24
12/18/2013

Current clamp recording
Slide 25
12/18/2013
PGF sequence to record an action potential train

Current clamp recording
PGF sequence to elicit action potentials
Slide 26
12/18/2013

To export the voltage trace:
Using an AP as stimulus
Replay menu select Export Trace - As Stimulus Template
Select the trace from data tree
Enter file name
Slide 27
12/18/2013

Using an AP as stimulus
To use the file template we need to create a pgf sequence:
Enter AP_template as new sequence
Select Copy
Slide 28
12/18/2013

Using an AP as stimulus
A few minor adjustments
For DA channel 1 “load from file template” needs to be activated
Slide 29
12/18/2013

Using an AP as stimulus
Change PGF type to Voltage Clamp
Slide 30
12/18/2013

Using an AP as stimulus
Results!
Slide 31
12/18/2013
Current
Stimulus

AP Online analysis
The AP Analysis is designed for analysis of evoked action potentials
Slide 32
12/18/2013

AP Online analysis
Y-axis parameters:
• Baseline• AP Amplitude• Repolarization
Amplitude• Up Slope• Down Slope
Slide 33
12/18/2013

AP Online analysis
X-axis parameters:
• Time to Repolarization Amplitude
• Time to AP Amplitude• Rise Time• Rise Time Delay• Decay Time• Decay Time Delay• Decay Tau
Slide 34
12/18/2013

AP Online analysis
Sweep of at least three segments:
Stimulus segment is marked as Relevant X-and Y-segment
baseline segment
stimulus segment
waiting segment
Slide 35
12/18/2013

AP Online analysis
Cursor ranges
start of the second segment
end of the third segment
Slide 36
12/18/2013

AP Online analysis example
Slide 37
12/18/2013
X Function
Y Function

AP Online analysis example
Slide 38
12/18/2013
Create Graph
• Select x and y parameters
• Specify axis scaling
• Select graph position

AP Online analysis example
Slide 39
12/18/2013
Sub-threshold depolarization

AP Online analysis – APD80
Slide 40
12/18/2013
Resting potential
80% Rise Time Delay 80% Decay Time Delay
APD80 = a - b
ab
Action Potential

Online analysis – APD80
Slide 41
12/18/2013
a
b

Online analysis – APD80
Slide 42
12/18/2013
APD80

Online analysis – APD80
Slide 43
12/18/2013
Create Graph
• Select x and y parameters
• Specify axis scaling
• Select graph position

Online analysis – APD80
Slide 44
12/18/2013

Summary
Slide 45
12/18/2013
• Proper C-fast and C-slow compensation before switching to CC mode defines initial parameters
• When adjusting Bridge Balance start with an initial value of 100%
• To initiate an Action Potential the current injection (stimulus) must be above the threshold
• Variety of online analysis functions are available, including Math functions and user defined Equations

Thank you!