currency invoicing decision: new evidence from a
TRANSCRIPT

c e n t e r o n j a p a n e s e e c o n o m y a n d b u s i n e s s
Working Paper Series March 2011, No. 293
Currency Invoicing Decision: New Evidence from a Questionnaire Survey of Japanese Export Firms
Takatoshi Ito, Satoshi Koibuchi, Kiyotaka Sato, and
Junko Shimizu
This paper is available online at www.gsb.columbia.edu/cjeb/research
C O L U M B I A U N I V E R S I T Y I N T H E C I T Y O F N E W Y O R K
1
Currency Invoicing Decision: New Evidence from a Questionnaire Survey of Japanese Export Firms
Takatoshi Itoa, Satoshi Koibuchib, Kiyotaka Satoc, Junko Shimizud
Abstract
There have been only a few studies that empirically examine the firm's decision on
price setting or currency invoicing in international trade. This paper is the first study that
conducts the questionnaire survey with all manufacturing firms listed in Tokyo Stock Exchange
concerning the choice of invoicing currency at a firm level. Questionnaires were sent out to 920
Japanese firms in September 2009 and 227 firms responded. We present the new firm-level
evidence on the choice of invoicing currency by destination and by type of trading partner, and
also the share of invoicing currency of Japanese production subsidiaries in Asia. By conducting
cross-section analysis, we found the following evidences: (1) highly differentiated goods and/or
strong competitiveness of the products promote Japanese yen invoicing in exports to all
countries, (2) larger share of intra-firm trade in exports promotes importer's currency invoicing
in exports to advanced countries, and (3) the production-sales networks of Japanese firms whose
Asian production subsidiaries export their final products to other countries/region promote US
dollar invoicing in exports to Asian countries.
Keywords: Invoice currency; Japanese exports; intra-firm trade; production network
a Graduate School of Economics, The University of Tokyo (Corresponding Author: [email protected]) and Faculty Fellow, RIETI. b Faculty of Commerce, Chuo University. c Faculty of Economics, Yokohama National University. d School of Commerce, Senshu University

2
1. Introduction
The objective of this paper is to investigate determinants of invoicing
currencies among Japanese exporters based on a new firm-level data set constructed from
an original questionnaire survey for this purpose.
How firms choose the currency of their exports has been a popular topic of
investigation in the field of international economics. At the firm level, the choice of invoicing
currency plays a crucial role in determining whether exporters or importers bear the exchange
rate risk. At the macro level, the international transmission of economic fluctuations, at least in
the short run, is influenced by the firms’ behavior of price setting and/or currency invoicing, as
discussed in the literature on New Open Economy Macroeconomics.
While there is a growing theoretical literature on a firm choosing an invoice currency,
a rigorous empirical analysis based on the firm-level data is scarce. Friberg and Wilander (2008)
conducted a questionnaire survey to Swedish exporting firms to overcome the data limitation
and presented the empirical results on the determinants of their currency invoicing. To our
knowledge, there has been no other study based on a questionnaire survey on invoicing currency
in an advanced country, probably due to the difficulty and cots in collecting data. However, the
firm-level data are crucial for rigorous empirical analysis.
Investigating a currency invoicing pattern of Japanese exporters is particularly
interesting in the invoicing literature, since many regard it a puzzle that the yen has not become
a major invoicing currency in Asia, despite its only status of fully convertible currency in the
region. The micro-survey data will give us the glimpse to decision making that would explain
this puzzle. It has been documented, mostly in macro data, that there is a strong tendency among
Japanese exporters to choose the importer's currency for their export to advanced countries and
to choose the US dollar for exports to emerging markets and developing countries in East Asia.1
The latter is more puzzling because Japanese firms have built a regional production network
over the last two decades.
To solve the puzzles, we conducted a questionnaire survey analysis involving all
Japanese manufacturing firms that are listed in the Tokyo Stock Exchange (TSE). With the
support of the Research Institute of Economy, Trade, and Industry (RIETI), questionnaires were
sent out to 920 listed firms in September 2009, and 227 firms responded. The questionnaire
contains questions on various information not only on the firms' invoicing choice by industry,
destination, and type of trading partners, but also on the firms' foreign exchange rate risk
management.
1 See Ito, Koibuchi, Sato and Shimizu (2010b) that analyzes the currency invoicing choice of Japanese exporting firms by the interview with 23 representative firms.

3
By conducting cross-section analysis, we found the following evidences. First, highly
differentiated goods and/or strong competitiveness of the products promote Japanese yen
invoicing in exports to all countries/region. Second, larger share of intra-firm trade in exports
and lower hedging cost of importer's currency vis-à-vis Japanese yen promotes importer's
currency invoicing in exports to advanced countries/region. Third, the production-sales
networks of Japanese firms whose Asian production subsidiaries export their final products to
other countries/region promote US dollar invoicing in exports to Asian countries.
The novelties of this paper are three-fold. First, by the questionnaire, we collected
firm-level information on the share of invoicing currency by destination. Such destination
breakdown data on the invoicing share at a firm-level has not been published before. Second,
we obtained the share of invoicing currency by trading partner. Specifically, the choice of
invoicing currency may depend on whether importers are own subsidiary/group-company
(intra-firm trade) or independent company (inter-firm trade). We show the difference in
invoicing decision between intra-firm and inter-firm trade. Third, we investigate the invoicing
choice of Japanese production subsidiaries in Asia. Specifically, we obtained information on
where and in which currency the production subsidiaries sell/export their products. It is well
recognized that Japanese production subsidiaries in Asia, which procure intermediate inputs
from Japan and regional economies, tend to export their products to the United States. A
questionnaire used by Friberg and Wilander (2008) lacked information on destination and
characteristics of trading partners.
The remainder of this paper is organized as follows. Section 2 surveys the existing
researches on currency invoicing. Section 3 describes the 2009 RIETI survey and the
characteristics of responded firms. Sections 4 shows the new evidence of the share of invoicing
currency classified by destination and type of trading partner. In section 5, determinants of
currency invoicing decision are empirically examined. Section 6 concludes this study.
2. Existing literature
The existing empirical studies on invoice currency can be classified into the following
two types. The first is a group of papers to investigate facts and tendencies of invoice currency
choices in the trade. The classic studies such as Grassman (1973) and Page (1981) discovered a
pattern of the invoice currency choice in the trade between advanced countries, and the trade
between advanced and developing countries. However, no major innovation occurred in this line
of research until Friberg and Wilander (2008) that collected information by questionnaire. Ito et
al. (2010b) conducted interviews to collect information on the Japanese major export companies
4
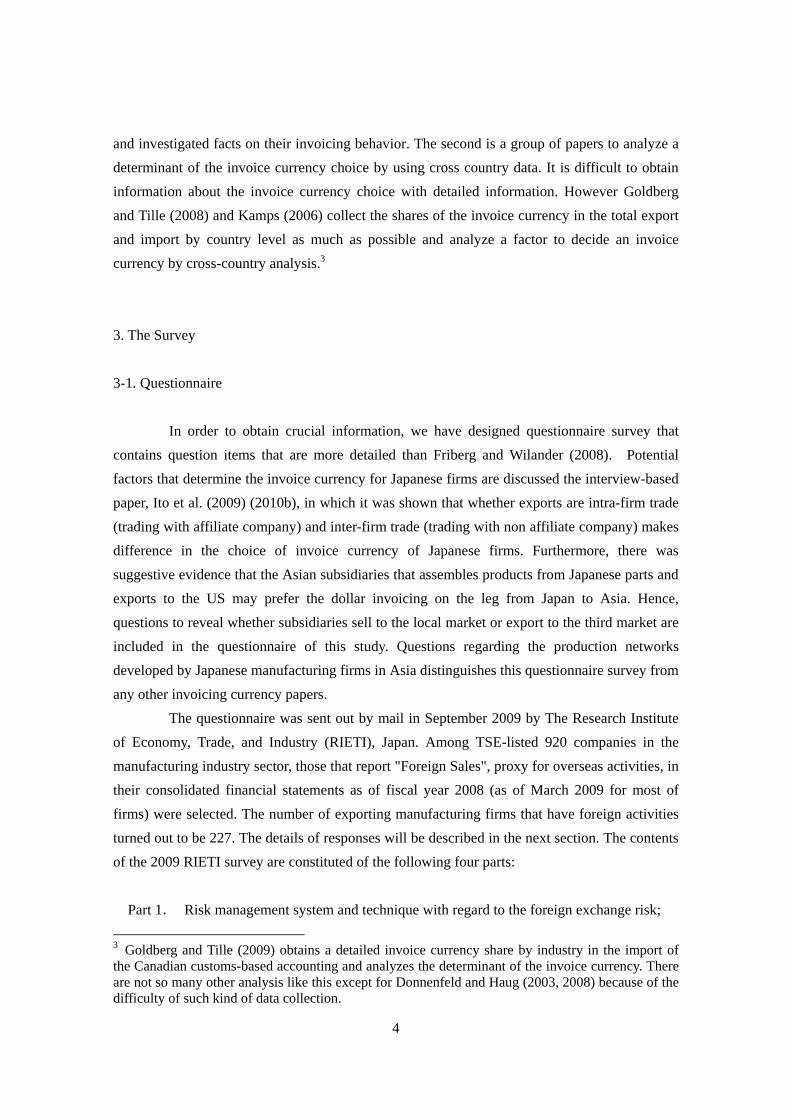
and investigated facts on their invoicing behavior. The second is a group of papers to analyze a
determinant of the invoice currency choice by using cross country data. It is difficult to obtain
information about the invoice currency choice with detailed information. However Goldberg
and Tille (2008) and Kamps (2006) collect the shares of the invoice currency in the total export
and import by country level as much as possible and analyze a factor to decide an invoice
currency by cross-country analysis.3
3. The Survey
3-1. Questionnaire
In order to obtain crucial information, we have designed questionnaire survey that
contains question items that are more detailed than Friberg and Wilander (2008). Potential
factors that determine the invoice currency for Japanese firms are discussed the interview-based
paper, Ito et al. (2009) (2010b), in which it was shown that whether exports are intra-firm trade
(trading with affiliate company) and inter-firm trade (trading with non affiliate company) makes
difference in the choice of invoice currency of Japanese firms. Furthermore, there was
suggestive evidence that the Asian subsidiaries that assembles products from Japanese parts and
exports to the US may prefer the dollar invoicing on the leg from Japan to Asia. Hence,
questions to reveal whether subsidiaries sell to the local market or export to the third market are
included in the questionnaire of this study. Questions regarding the production networks
developed by Japanese manufacturing firms in Asia distinguishes this questionnaire survey from
any other invoicing currency papers.
The questionnaire was sent out by mail in September 2009 by The Research Institute
of Economy, Trade, and Industry (RIETI), Japan. Among TSE-listed 920 companies in the
manufacturing industry sector, those that report "Foreign Sales", proxy for overseas activities, in
their consolidated financial statements as of fiscal year 2008 (as of March 2009 for most of
firms) were selected. The number of exporting manufacturing firms that have foreign activities
turned out to be 227. The details of responses will be described in the next section. The contents
of the 2009 RIETI survey are constituted of the following four parts:
Part 1. Risk management system and technique with regard to the foreign exchange risk;
3 Goldberg and Tille (2009) obtains a detailed invoice currency share by industry in the import of the Canadian customs-based accounting and analyzes the determinant of the invoice currency. There are not so many other analysis like this except for Donnenfeld and Haug (2003, 2008) because of the difficulty of such kind of data collection.

5
Part 2. Price setting strategy against the foreign exchange rate fluctuations;
Part 3. Shares of invoice currencies of the total export from the head office (Japan) to the
world and any principle in choosing invoice currencies;
Part 4. Invoice currency share by destination country (or region) and by types of trading
partners
The first question in Part 1 is whether a settlement currency is the same as an invoice
currency. Whether a settlement currency could be distinguished with the invoice currency has
been debated in the literature for a long time. The question is intended to reveal how Japanese
firms treat invoicing and settlement in their business.4 Next, it is asked what kind of currencies
that Japanese firms uses in their foreign trades and ask what kind of inconveniences that they
face when they handle each currency. Then, the next question asks how foreign exchange risk is
managed in detail: i) hedging instruments and hedging horizon, ii) company's policy on hedging,
iii) in-house foreign exposure control such as "marry" and "netting", iv) the type of foreign
exchange risk management system.
Part 2 is concerned about the pass-through of the exchange rate fluctuation to the
export price. After inquiring whether there exists an internal price revision rule in response to
the foreign exchange fluctuation, it is asked whether Japanese firms revised their price in
response to a sudden appreciation of the Japanese yen after the Lehman shock in September
2008.
Parts 3 and 4 are the core of our questionnaire survey. In Part 3, it is asked the share
of invoice currencies in their total exports from Japan to the world. In Part 4, is is asked the
share of invoice currencies by three phases as follows: the share of invoice currency by
destination country (region); the share of invoice currency by types of trading partner, such as
intra-firm trade (production base), intra-firm trade (sales base), or inter-firm trade (local
distributer). The second question is whether the firm is Japanese trading company
("Sogo-shosha") and others (Table b), followed by the question on the share of invoice
currencies in local sales or exports from an overseas production base to the third countries
(Table c).5 These questions correspond to the structures of production and sales network that
Japanese firms have developed in many parts of the world.
3-2. Responded Firms
4 Friberg and Wilander (2008) which performed the questionnaire survey about the invoice currency among Swedish firms also asked a same question. 5 Please refer to Appendix 1 for more information about a questionnaire about Q4.
6
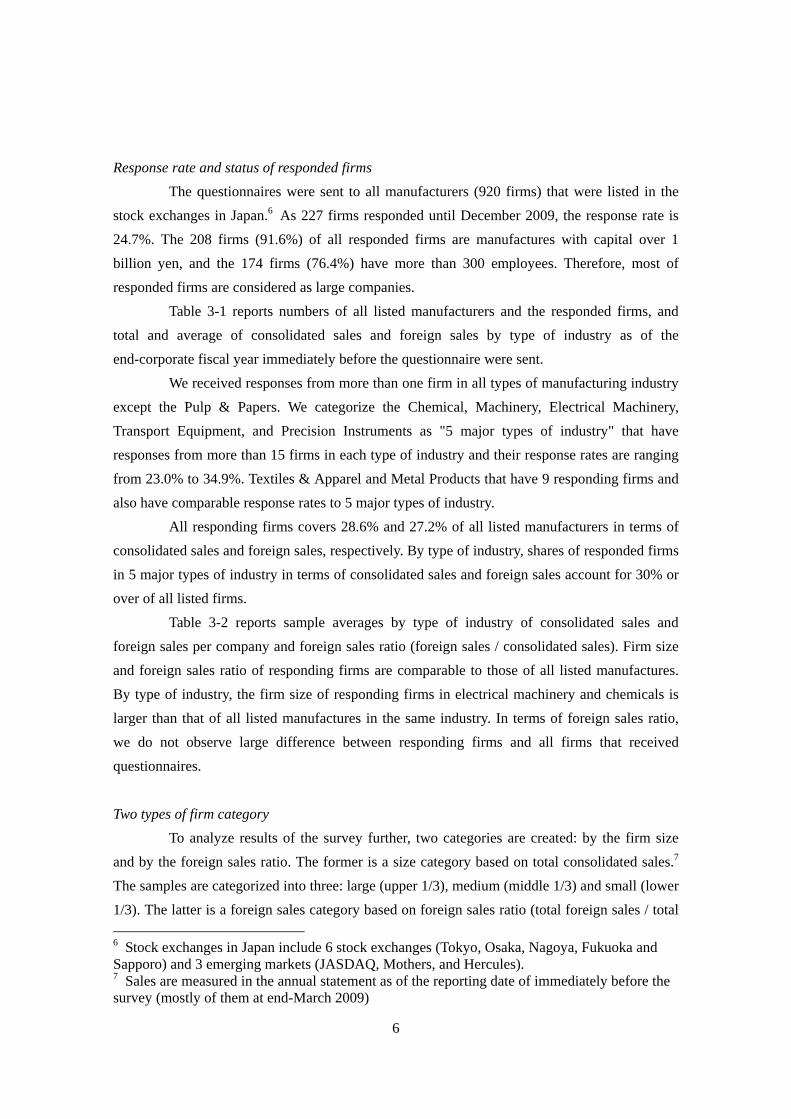
Response rate and status of responded firms
The questionnaires were sent to all manufacturers (920 firms) that were listed in the
stock exchanges in Japan.6 As 227 firms responded until December 2009, the response rate is
24.7%. The 208 firms (91.6%) of all responded firms are manufactures with capital over 1
billion yen, and the 174 firms (76.4%) have more than 300 employees. Therefore, most of
responded firms are considered as large companies.
Table 3-1 reports numbers of all listed manufacturers and the responded firms, and
total and average of consolidated sales and foreign sales by type of industry as of the
end-corporate fiscal year immediately before the questionnaire were sent.
We received responses from more than one firm in all types of manufacturing industry
except the Pulp & Papers. We categorize the Chemical, Machinery, Electrical Machinery,
Transport Equipment, and Precision Instruments as "5 major types of industry" that have
responses from more than 15 firms in each type of industry and their response rates are ranging
from 23.0% to 34.9%. Textiles & Apparel and Metal Products that have 9 responding firms and
also have comparable response rates to 5 major types of industry.
All responding firms covers 28.6% and 27.2% of all listed manufacturers in terms of
consolidated sales and foreign sales, respectively. By type of industry, shares of responded firms
in 5 major types of industry in terms of consolidated sales and foreign sales account for 30% or
over of all listed firms.
Table 3-2 reports sample averages by type of industry of consolidated sales and
foreign sales per company and foreign sales ratio (foreign sales / consolidated sales). Firm size
and foreign sales ratio of responding firms are comparable to those of all listed manufactures.
By type of industry, the firm size of responding firms in electrical machinery and chemicals is
larger than that of all listed manufactures in the same industry. In terms of foreign sales ratio,
we do not observe large difference between responding firms and all firms that received
questionnaires.
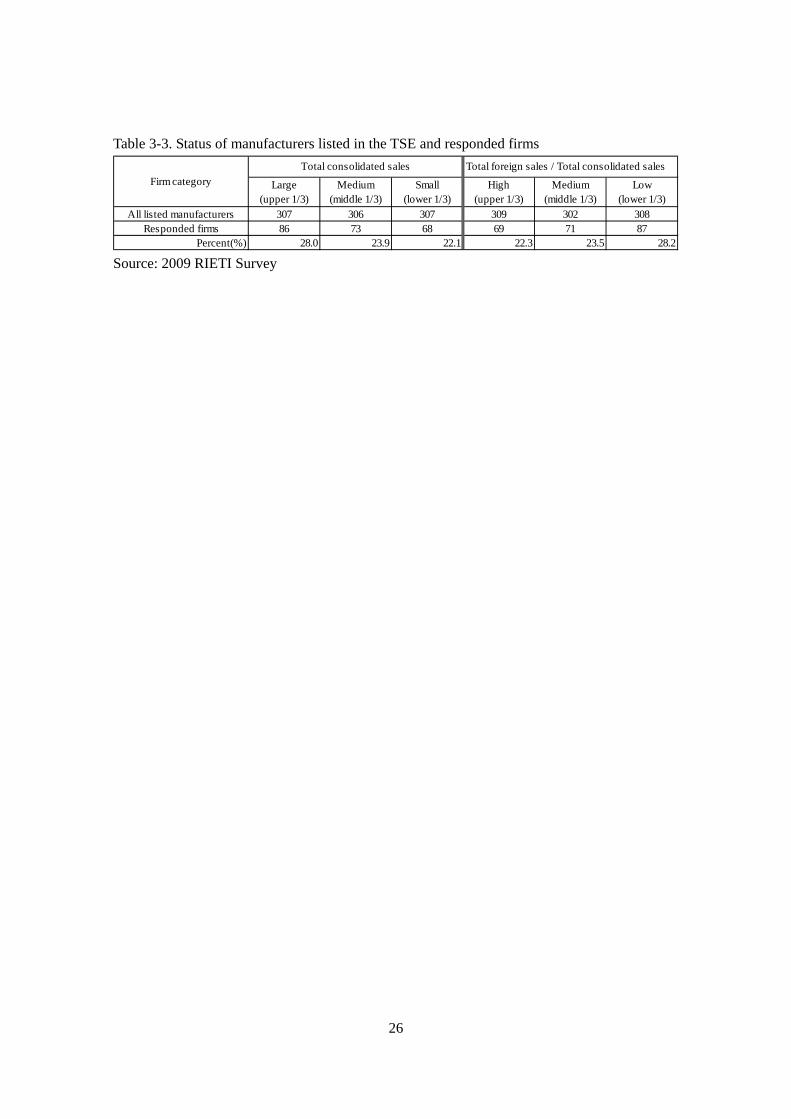
Two types of firm category
To analyze results of the survey further, two categories are created: by the firm size
and by the foreign sales ratio. The former is a size category based on total consolidated sales.7
The samples are categorized into three: large (upper 1/3), medium (middle 1/3) and small (lower
1/3). The latter is a foreign sales category based on foreign sales ratio (total foreign sales / total
6 Stock exchanges in Japan include 6 stock exchanges (Tokyo, Osaka, Nagoya, Fukuoka and Sapporo) and 3 emerging markets (JASDAQ, Mothers, and Hercules). 7 Sales are measured in the annual statement as of the reporting date of immediately before the survey (mostly of them at end-March 2009)

7
consolidated sales) splitting all listed manufacturers into high (upper 1/3), medium (middle 1/3)
and low (lower 1/3). Table 3-3 reports the number of firms included in two types of firm
category. Table 3-3 shows that firms with larger consolidated sales and lower foreign sales ratio
have higher response rates. If any, these observations give indications of caution with respect to
a sampling bias. However, we do not think the bias is serious one.
Which department responded the survey?
The questionnaire required firms to answer which department (or division) of the
company a respondent belongs to. Table 3-4 summarizes results showing that in 179 firms
(78.9%), a person working for the treasury (accounting) department responded to our survey.
4. Currency Invoicing
4-1. Invoice Currency in Export of Japanese Firms
Invoice currency and settlement currency
Table 4-1 summarizes the result of the first question whether a settlement currency (a
currency to use when a trade payment is settled) is the same as an invoice currency (a currency
to use when a trade price is quoted). The estimated proportion of Japanese firms that use the
same currency for invoice and settlement is 88.4%, which is 200 firms out of 226 respondents.
In other words, most Japanese exporting firms handles an invoice currency and a settlement
currency as the same. According to a type of industry, the ratio of the affirmative firms was
the lowest in "Transport Equipment" (74.0%).
The most frequent reason why the settlement currency differs from the invoice
currency is due to the foreign exchange regulation. When the local currency transaction is
regulated for a non-resident firm, the different settlement currency (mostly, the US dollar or the
Japanese yen) is used alternatively. Such a case is outstanding in the case of some Asian
currencies, such as the Korean won, the Malaysia ringgit, and the Indonesia rupiah.
Result 1: For most of Japanese firms, the invoice and settlement are denominated in the
same currency.
The number of the handling foreign currencies
We ask a firm to choose its handling foreign currencies from 20 kinds of foreign
currencies (excluding Japanese yen) including the U.S. dollar in multiple answers allowed.

8
Table 4-1(A) shows the results of 227 firms' answers. The mean of the number of the handling
foreign currencies in the answered manufacturing industry is 3.1. Then, we can conclude
approximately three kinds of foreign currencies in one company are used on the average. An
electric machinery firm answered to handle 15 kinds of currencies at the maximum.8 According
to a type of industry, the mean of the number of the handling foreign currencies is 4 in
"Transport Equipment", 3.5 in "Electrical Machinery", and 3 in "Machinery", respectively. It
indicates that Japanese representative industries, which are supposed to develop production
networks in abroad, handle various kinds of foreign currencies.9
Table 4-2(B) summarize the number of the handling foreign currencies of 5 major
types of industry by firm size (total consolidated sales) and foreign sales ratio (total foreign
sales/total consolidated sales). The number of the handling foreign currencies tends to increase
monotonously as the firm size becomes large. According to a type of industry, this tendency is
particularly remarkable in "Chemical", "Machinery", and "Electrical Machinery" (upper table).
In addition, the number of the handling foreign currencies tends to increase monotonously as the
ratio of total foreign sales over total consolidated sales becomes larger, and this tendency is
remarkable in "Transport Equipment" (lower table).
Result 2: Average Japanese firm uses 3 kinds of foreign currencies for exports. Larger
firms or firms with higher exposure to foreign markets use more kinds of currencies.
4-2. Invoice Currency Decision of Japanese
The Share of Currency Invoicing in Japanese Exports to the World
Table 4-3(A) presents the results of questionnaires upon the invoicing choice of
Japanese firms' exports to the world, where a simple arithmetic average of the invoicing share is
reported. First, in all manufacturing industries, where 217 firms responded, the share of
yen-invoicing is the largest (48.2 percent) and that of US dollar invoicing is the next (42.2
percent). The share of euro invoicing accounts for only 7.1 percent, while the share of other
currency invoicing is very low (2.7 percent). Second, when looking at the industry breakdown
data, the share of yen-invoicing is large in the glass and ceramics, metal products, machinery,
and transport equipment industry. On the other hand, the share of US dollar invoicing is the
largest in the rubber products, steel products, nonferrous metals, and electrical machinery
8 The number of 0 means that no foreign currency is handled but the Japanese yen is used for all the trade. 9 Although the number of answer is only 3, the mean of "Pharmaceutical" is 3.7, which is higher than other industries, too.

9
industry. Third, other currency invoicing typically accounts for a relatively small share, while
the share of Euro invoicing is around 10 percent or more in the pharmaceuticals and machinery
industry.
Let us next look at the invoicing share across the firm size (Table 4-3(B)). In terms of
the consolidated sales, it is clearly shown that the smaller the firm size, the higher the share of
yen-invoicing is. In contrast, the larger the firm size, the higher the share of US dollar invoicing
is. In terms of the foreign sales ratio, however, any clear pattern of the invoicing choice is not
observed.
Result 3: The yen and the US dollar are mainly used in Japanese total exports to the world.
The smaller (larger) the firm size, the higher the share of yen (US dollar) invoicing is.
Table 4-3(B) shows that larger firms have lower share of yen invoicing and larger
share of US dollar invoicing. This suggests that sample arithmetic average of the invoicing
share by currency in Table 4-3(A) can underestimate actual share of currency invoicing in
exports of Japanese listed firms. To confirm this, we calculate weighted average of share by
currency using amount of total foreign sales of each responded firm, which is supposed as proxy
for exports from Japan to the World.10 Table 4-4 reports sample arithmetic average (inner
circle) and weighted average using foreign sales (outer circle) of invoicing share by currency,
respectively. The share of yen invoicing substantially decreases by 19 percent from 48 percent
in arithmetic average to 29 percent in weighted average. In exchange, the share of dollar
invoicing increases most by 12 percent from 42 percent to 54 percent while the euro and other
currency also increase by around 3 percent.
The Share of Currency Invoicing by Destination
Table 4-5(A) presents the results of the invoicing choice by destination and by type of
industry in exports to countries/regions in Americas, Europe, Africa, and Pacific. First, in
exports to the United States, 77.9 percent of all manufacturing exports are invoiced in US
dollars and 21.8 percent are in the yen.
Second, in exports to the Euro area, 51.0 percent of all manufacturing exports are
invoiced in the euro, and 35.3 percent are invoiced in the yen. The share of US dollar invoicing
is only 13.6 percent. In contrast, only 30 percent of precision instrument exports are invoiced in
10 Since Japanese accounting standard does not require firms with less than 10 percent foreign sales ratio (= total foreign sales / total consolidated sales) report their foreign sales in annual financial statement, we calculated amounts of total foreign sales of these firms under the assumptions that their foreign sales ratios are 10 percent of total consolidated sales.

10
the euro and 61.7 percent are invoiced in the yen.
Third, in exports to other advanced countries (the UK, Canada and Australia), around
20 to 30 percent of all manufacturing exports are invoiced in the importer's currency. However,
the US dollar is most frequently used in all manufacturing exports to Canada (48.2 percent),
while the share of the yen is the largest in exports to the UK (35.0 percent) and in exports to
Australia (52.5 percent).
Finally, in exports to emerging economies including New Zealand, the importer's
currency is rarely used for invoicing. Surprisingly, US dollar invoicing accounts for the largest
share only in all manufacturing exports to Mexico. In exports to other countries, the share of
yen invoicing is the largest and exceeds at least 50 percent.
The results of the currency invoicing share by destination and by type of industry are
reclassified into the firm size breakdown data on the destination specific invoicing. Table 4-5(A)
also presents the firm size breakdown data in terms of the total consolidated sales.
First, in exports to the United States and the Euro area, the share of the importer's
currency invoicing is the largest in the case of large size firms. The larger the firm size, the
higher the share of the importer's currency is in exports to these two countries. A similar
invoicing pattern is observed in exports to other advanced countries, although the most
frequently used currency is not necessarily the importer's currency.
Second, in the case of small size firm's exports, the share of yen invoicing is the
largest for most destination countries except the United States. In exports to Russia, Eastern
Europe, Australia, New Zealand and African countries, the share of yen invoicing is the largest
even in large size firm's exports. In exports to North and Latin American countries, however, the
US dollar is the most frequently used currency in large size firm's exports.
Result 4: The share of importer's currency invoicing is the largest in exports to the United
States, the Euro area and the UK. In exports to North and Latin American countries, the
US dollar is the most frequently used currency in large size firms. In contrast, in exports
to other emerging/developing countries, Australia and New Zealand, the share of yen
invoicing is the largest even in large size firms.
Table 4-5(B) shows the results of the invoicing choice by destination and by firm size.
First, the yen and the US dollar are mainly used as an invoice currency, while the importer's
currency is rarely used except for exports to Thailand. Second, the yen is the most frequently
used currency in all manufacturing exports to all Asian countries except the Hong Kong where
the share of US dollar invoicing is the largest. In terms of all manufacturing exports, around 55
to 70 percents are invoiced in the yen, while around 25 to 40 percents are invoiced in US
11
dollars.
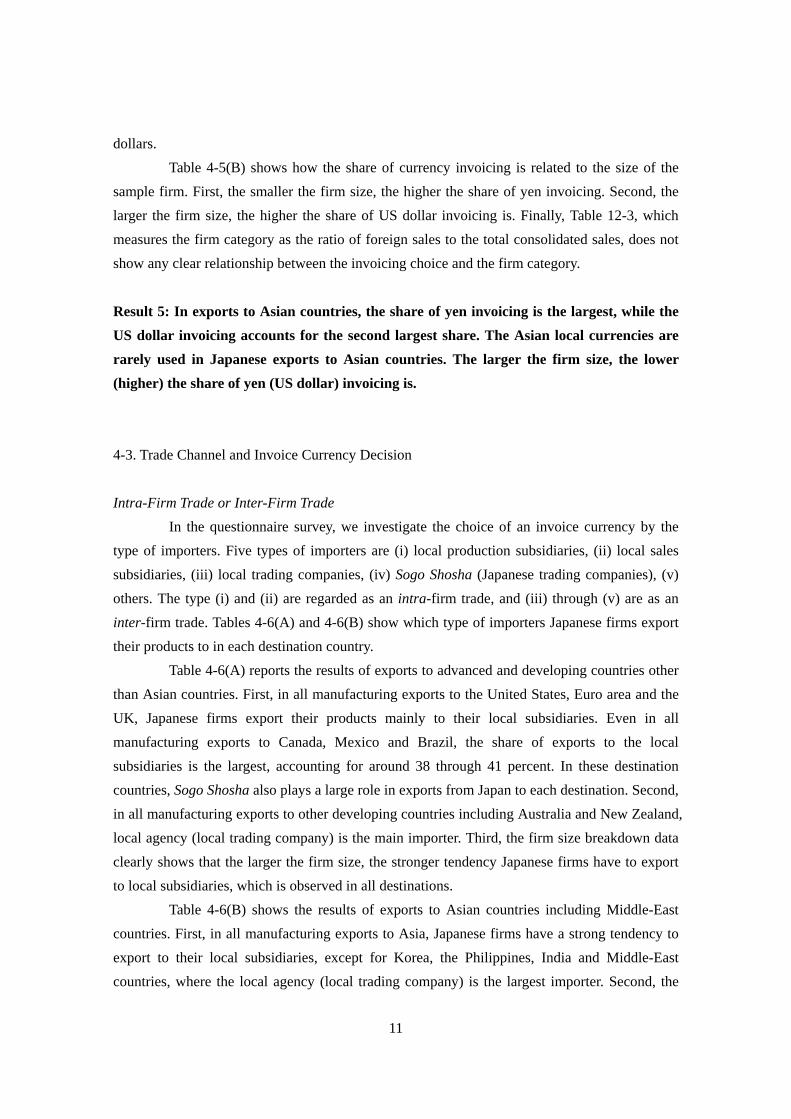
Table 4-5(B) shows how the share of currency invoicing is related to the size of the
sample firm. First, the smaller the firm size, the higher the share of yen invoicing. Second, the
larger the firm size, the higher the share of US dollar invoicing is. Finally, Table 12-3, which
measures the firm category as the ratio of foreign sales to the total consolidated sales, does not
show any clear relationship between the invoicing choice and the firm category.
Result 5: In exports to Asian countries, the share of yen invoicing is the largest, while the
US dollar invoicing accounts for the second largest share. The Asian local currencies are
rarely used in Japanese exports to Asian countries. The larger the firm size, the lower
(higher) the share of yen (US dollar) invoicing is.
4-3. Trade Channel and Invoice Currency Decision
Intra-Firm Trade or Inter-Firm Trade
In the questionnaire survey, we investigate the choice of an invoice currency by the
type of importers. Five types of importers are (i) local production subsidiaries, (ii) local sales
subsidiaries, (iii) local trading companies, (iv) Sogo Shosha (Japanese trading companies), (v)
others. The type (i) and (ii) are regarded as an intra-firm trade, and (iii) through (v) are as an
inter-firm trade. Tables 4-6(A) and 4-6(B) show which type of importers Japanese firms export
their products to in each destination country.
Table 4-6(A) reports the results of exports to advanced and developing countries other
than Asian countries. First, in all manufacturing exports to the United States, Euro area and the
UK, Japanese firms export their products mainly to their local subsidiaries. Even in all
manufacturing exports to Canada, Mexico and Brazil, the share of exports to the local
subsidiaries is the largest, accounting for around 38 through 41 percent. In these destination
countries, Sogo Shosha also plays a large role in exports from Japan to each destination. Second,
in all manufacturing exports to other developing countries including Australia and New Zealand,
local agency (local trading company) is the main importer. Third, the firm size breakdown data
clearly shows that the larger the firm size, the stronger tendency Japanese firms have to export
to local subsidiaries, which is observed in all destinations.
Table 4-6(B) shows the results of exports to Asian countries including Middle-East
countries. First, in all manufacturing exports to Asia, Japanese firms have a strong tendency to
export to their local subsidiaries, except for Korea, the Philippines, India and Middle-East
countries, where the local agency (local trading company) is the largest importer. Second, the

12
tendency to export to local subsidiaries becomes more evident in the large size firm’s exports,
where the share of exports to the local subsidiaries is the largest in all Asian countries. In
contrast, in the small size firm’s exports, the local agency (local trading company) is the largest
importer in all Asian countries except China.
Result 6: In exports to North America, Brazil, the Euro area, the UK, and most Asian
countries, intra-firm trade (exports to the local subsidiaries) accounts for the largest share.
In exports to other countries, inter-firm trade (exports to non-grouped firms, especially to
local trading companies) plays a major role. The Larger the firm size, the stronger
tendency the Japanese firms have to conduct intra-firm trade.
The Choice of Invoice Currency in Intra- or Inter-Firm Trade
Tables 4-7(A) and 4-7(B) show how the choice of an invoice currency differs across
the types of importers in Japanese exports to each destination country.
Table 4-7(A) reports the results of exports to advanced and developing countries other
than Asian countries. First, in all manufacturing exports to advanced countries such as the
United States, the Euro area, the UK and Australia, the importer’s currency is most frequently
used. In North and Latin American countries, the share of US dollar invoicing is the largest in
exports to the local subsidiaries (intra-firm trade). In Eastern Europe, the share of euro invoicing
is the largest in exports to the local subsidiaries, while the yen is the most frequently used
currency in Japanese exports to the local subsidiaries. Second, the yen is generally used in
inter-firm trade (i.e., exports to local trading companies and Sogo Shosha) in all destination
countries except the United States and the Euro area where the importer’s currency invoicing is
dominant.
Table 4-7(B) shows the results of exports to Asian countries. First, the yen and the US
dollar are dominantly used in both intra- and inter-firm trade with Asian countries. The share of
local currency invoicing is small and at most 13 percent or less in intra-firm trade. In contrast,
the local currency is rarely used in inter firm trade. Second, in exports to local production
subsidiaries, the yen is used somewhat more than the US dollar for trade invoicing. In exports to
sales subsidiaries, the share of yen invoicing is almost the same level as that of US dollar
invoicing. Third, in inter-firm trade, there is a strong tendency to choose yen-invoicing.
Result 7: The importer’s currency tends to be used in intra-firm trade from Japan to
developed countries/area. The yen and the US dollar are mainly used in intra-firm trade
from Japan to Asian countries.

13
Result 8: The share of yen invoicing is the largest in inter-firm trade, which is more
evident in exports to Asia and other developing countries. The share of US dollar invoicing
is the second largest, but it is much lower than the corresponding share of yen invoicing.
4-4. Invoice Currency Decision of Production Subsidiaries
The Choice of an Invoice Currency by Production Subsidiaries
Table 4-8 shows which invoice currency is used for local sales in each country where
the production subsidiaries are located. The local currency invoicing is typically observed in all
countries. The currency other than the local currency is sometimes used. Specifically, only the
US dollar is used in North and Latin American countries, where around 17 through 25 percent
are invoiced in US dollars for their local sales. In the Euro area, the euro is used for local market
sales, especially in Eastern Europe countries. Interestingly, in Asian countries, the US dollar is
the only foreign currency that used for local sales. On average, around 10 percent is sold in US
dollars in Asian local markets.
Result 9: The local currency is mainly used for local market sales of the Japanese firm’s
production subsidiaries.
The Invoicing Choice in Exports of the Local Production Subsidiaries
In the questionnaires, we have obtained the information on the top three export
destinations by the production subsidiaries. First, Table 4-9 shows that Japanese productions
subsidiaries are located mainly in Asia. The number of production subsidiaries in the United
States and the Euro area are relatively large but far smaller than that in Asia. Second, the
production subsidiaries actively export to foreign countries. Asian production subsidiaries,
especially subsidiaries in China, have a strong tendency to export to foreign countries.
Tables 4-10(A) through 4-10(D) present the destination specific data on the invoicing
choice of Japanese production subsidiaries in the United States, the Euro area, China, and
Thailand. First, Japanese production subsidiaries in the United States generally use the US
dollar in exports to foreign countries including Japan. Only in a few cases, the importer’s
currency is used for export invoicing. Production subsidiaries in the Euro area also tend to
choose euro invoicing in exports to foreign countries except the United States, Russia and
African countries. Second, Japanese production subsidiaries in Asia (China and Thailand) have
a strong tendency to choose US dollar invoicing in their exports to foreign countries. Even in
exports to Japan and the Euro area, the production subsidiaries in Asia tend to choose US dollar

14
invoicing compared to yen or euro invoicing. The use of the Asian currency is very limited in
exports of the Asian production subsidiaries to foreign countries.
Result 11: Japanese production subsidiaries in Asia have a strong tendency to choose US
dollar invoicing in their exports to foreign countries.
5. Empirics on determinants of currency invoicing
5-1. Possible Determinants of Currency Invoicing
Ito, et.al. (2010b) obtained the following possible determinants of currency invoicing
through a face-to-face discussion with each firm.
(i) Intra- or inter-firm trade
Japanese firms that have a majority of their exports destined for their own local
subsidiaries strongly tend to choose the importer's currency invoicing and to manage all
exchange rate risks at the finance department of its head office to free their local subsidiaries
from any exchange rate risks,. In contrast, in the case that firms have a substantial portion of
exports directed toward independent firms including local agencies and local customers and
trades via Japanese trading companies (Sogo Shosha), Japanese headquarters have less incentive
to take the exchange rate risk and, hence, have a tendency to invoice not in the importer's
currency but in the yen. Thus, the ownership relationship with trade partners affects the choice
of an invoice currency. We propose the following hypothesis to be tested:
Hypothesis 1: The intra-firm is more likely invoiced in importer's currency. Thus, large
share of intra-firm trade in exports decreases the share of Japanese yen invoicing, and
increases the share of importers currency invoicing.
(ii) Cost of exchange rate hedging
For many Japanese firms, the hedging cost of currency is one of the most important
factors in choosing an invoice currency. The hedging cost of local currencies in Asia and other
developing countries tends to be higher than that advanced countries/region mainly due to
various regulations and restrictions. Japanese firms will not choose the importer’s currency
invoicing to the extent that the hedging cost is high between the yen and the importer’s currency.
Thus, the following hypothesis is typically tested in the empirical analysis of the invoicing

15
choice.
Hypothesis 2: The higher (lower) the hedging cost between the yen and the importer's
currency is, the lower (higher) the use of the importer's currency is as an invoice currency.
(iii) The degree of market competition and differentiation of exporting products
As discussed in previous section, the importer's currency invoicing prevails in exports
to advanced countries, which has to do with the PTM behavior of Japanese firms. Specifically,
many Japanese firms pointed out that it was too difficult to impose the exchange rate risk on
importers in advanced countries due to high degree of competition in the markets. In contrast, a
firm that exports differentiated products and has the largest market share in global market
answered that its local subsidiaries could manage the exchange rate risk even when the
headquarter chose yen-invoicing in exports to the local subsidiaries. Thus, the degree of product
differentiation and market competition is an important factor in determining an invoice currency.
This determinant of currency invoicing is conformed to the recent theoretical
development of the choice of an invoice currency. The previous studies, such as Giovannini
(1988) and Donnenfeld and Zilcha (1991), model the firm’s choice of an invoice currency by
solving the maximization problem of the firm’s expected profit with an uncertainty of exchange
rate movements. They show that the choice of an invoice currency depends on the shape of the
firm’s profit function that is, in turn, conditional on the curvature of the demand function in the
destination markets. The more (less) differentiated the firm’s export product is, the lower
(higher) the elasticity of demand for them is, which leads to the exporter’s (importer’s) currency
invoicing. Thus, it is theoretically shown that the invoicing choice depends on the
characteristics of the goods traded, which is consistent with the classical stylized fact 3. Some
of machinery firms and electrical component firms in our sample, which export/sell competitive
and highly differentiated products in the global market, clearly have a strong position to
negotiate their invoicing currency with customers.
Hypothesis 3: Export products tend to be invoiced in the yen if they are highly
differentiated and/or competitive.
(iv) Exports from Asian production base to the US market
Most of electrical machinery and electrical components firms that choose US dollar
invoicing in exports to Asian countries have a particular trade structure in that their production
subsidiaries exhibit a strong tendency to export their products to the US markt. Under this
production/distribution structure, it is found that the firms typically choose US dollar invoicing

16
not only from the local subsidiaries in Asia to the US market but also from Japanese
headquarters to the local subsidiaries in Asia, since it is advantageous to use the same currency
in both transactions. This aspect is particularly important when considering the second puzzle of
the Japan’s currency invoicing pattern in exports to Asia. While exports to the United States
previously accounted for the largest share in the total exports of Japan and Asian countries, it is
now well recognized that intra-regional trade in Asia has become more important for these
countries in recent years. For many Japanese firms, however, the final destination market was
still the United States, since growing intra-regional trade was largely driven by processing trade.
Whereas such an Asian trade structure is often pointed out, to our knowledge, it has never been
tested empirically in the literature on invoicing choice. We attempt empirical examination to
take into account this aspect in our cross-sectional analysis.
Hypothesis 4: Japanese firms tend to choose US dollar invoicing in exports their products
to the production subsidiaries mainly in Asia to the extent that the production subsidiaries
exhibit higher propensity to export to other countries/region.
5-2. Empirical Results
The Explanatory Variables
We set up the following explanatory variables to empirically investigate the
determinants of currency invoicing in Japanese exporting firms.
The first explanatory variables are associated with the determinants (i) "Intra- or
inter-firm trade" (Hypothesis 1). We use "Share of exports to sales subsidiaries" and "Share of
exports to plants", which are based on the answers of the questionnaire survey. "Share of
exports to sales subsidiaries" is a firm i's amount of exports to its sales subsidiary in country (or
region) j divided by a firm i's amount of total exports to country j. "Share of exports to plants" is
a firm's amount of exports to its production subsidiary in country (or region) j divided by a
firm's amount of total exports to country j. We also use "Share of intra-firm trade", which is the
sum of "Share of exports to sales subsidiaries" and "Share of exports to plants".
The second explanatory variable is related with the determinant (ii) “cost of exchange
rate hedging” (Hypothesis 2). We use a bid-ask spread of outright three month forward
transactions between the yen and the importing country’s currency as a straightforward proxy
for the cost of exchange rate hedging.
The third explanatory variables are associated with the determinant (iii) "the degree of
market competition and differentiation of exporting products" (Hypothesis 3). We consider two

17
kinds of product differentiation and competitiveness. The first is "Dummy for the company
producing differentiated goods defined by Rauch’s classification". Rauch (1990) divides
products into three types of goods; differentiated products, reference priced goods (for instance
in trade journals), and goods with prices that are set on competitive exchanges. We identify
whether the company produce and export differentiated goods by matching the company’s list
of main products in the financial statement to the Rauch’s SITC (Standard International Trade
Classification) Rev.2 list. The second is "Dummy for top share goods", which is a proxy for the
firm's competitiveness in the global market. The variable takes 1 if the firm produces a
product(s) having the largest share in the global market, or 0 if the firm does not have such
goods.
The forth explanatory variable is based on the determinant (iv) “exports from
production subsidiaries to other countries/region” (Hypothesis 4). We set a "Dummy for plant to
export" based on the firm's answer on the questionnaire survey, which takes 1 if its production
base in country/region j exports goods to other countries/regions, otherwise 0. By taking
intersection of this dummy variable with "Share of exports to plants", we represent firm's
dependency on exports to the plant in country/region j that exports its products to third
countries/regions.
Estimation on the Determinants of Currency Invoicing
We empirically test the hypothesis about the determinants of an invoice currency by
using the above explanatory variables. We conduct OLS estimation to analyze the determinants
of currency invoicing share by export destination, where the dependent variable is each firm's
share of Japanese yen invoicing in exports to each destination.
First, the results of estimation including exports to all destinations are presented in
Table 5-1. Number of observations is 1,534. As we described in section 4, the share of Japanese
yen invoicing is strongly correlated with firm size. Thus, we incorporate "Log of total
consolidated sales" into the estimation to control size effects. In columns (1) through (3), the
firm size is negative and statistically significant at 1 percent level, which indicates that larger
firm have smaller share of Japanese yen invoicing, which is consistent with questionnaire
results in section 4.
The coefficient of the forward spread is positive and statistically significant at 1
percent, which strongly suggests the larger the hedging cost of importer's currency is, the less
the such a currency is used for trade invoicing, and more Japanese yen is used, which supports
Hypothesis 2.
Among two different measures of product differentiation and competitiveness, only
dummy for differentiated product defined by Rauch (1999) is positive and statistically

18
significant at 1 percent level while coefficient of dummy for top share goods has negative sign.
This suggests that differentiability of products is a determinants of home currency invoicing,
which suggest that the company having highly differentiated goods has strong bargaining power
in the choice of invoice currency against its final customers, and, however, the firm having a top
share goods in the global market does not necessarily successful to exert such bargaining power
in the negotiation. These results partly support Hypothesis 3.
As for the explanatory variables for intra-firm trade, both the share of exports to sales
subsidiaries and the share of exports to plants have statistically significant negative coefficients
at 1 percent level although the absolute impact of exports to sales subsidiaries on Japanese yen
invoicing is much larger than that of exports to plants. These results are consistent with the
Hypothesis 1. We also incorporate dummy for plant to export in the specification (2), and add its
intersection with the share of exports to plants to the specification (3). Especially in column (3),
intersection term exploits the exports from Japan to overseas exporting production base that in
turn exports its products to the third countries/regions. Estimated coefficient of the intersection
term is negative and statistically significant at 1 percent level while the share of exports to plant
does not have statistically significant coefficient anymore. This result means that exports from
Japan to overseas exporting production base largely hinders the Japanese yen invoicing not only
in exports from overseas plants to other countries but also in exports from Japanese head office
to the overseas plants. This is consistent with our Hypothesis 4.
We also incorporate "Industry dummies", which are dummies for 15 types of industry
within manufacturing11, into the estimation (4) through (6) in Table 5-1 by taking transport
equipment as a benchmark type of industry. Even after controlling the industry effect, results is
column (4) through (6) are same as those in column (1) through (3).
Next, we divide the sample in Table 5-1 into two categories of export destinations,
exports to all Asian countries (Table 5-2) and exports to 5 advanced economies having
international currencies with full convertibility (Table 5-3). Results in Table 5-2 are very similar
to those in Table 5-1. However, results in Table 5-3 have two different characteristics comparing
with all sample estimation in Table 5-1. First, in the estimation using the sample of advanced
economies, dummy for top share goods has statistically positive impacts on Japanese yen
invoicing in exports from Japan to the advanced economies. Second, dummy for plant to export
and its intersection with the share of exports to plants do not have statistically significant
coefficients. These results suggest that dummy for top share goods that is a proxy for firm's
product competitiveness tends to have positive impact on home currency invoicing only in
11 15 types of industries are Foods, Textile&Apparel, Chmeical, Pharmacrticals, Oil&Coal Products, Glass&Ceramics, Steel Products, Nonferrous Metals, Metal Products, Machinery, Electrical Machinery, Transport Equipment, Precision Instruments, and Other Products.

19
exports to the market in the advanced economies that is considered as final destination for many
of Japanese firms. On the other hand, Japanese subsidiaries in Asian countries are still
important as production bases exporting their products to the advanced economies rather than
final destination for Japanese firms.
As we have seen in the section 4, there is local currency invoicing behind lower use of
Japanese yen invoicing in exports to advanced economies with international currencies like US,
Canada, UK, Euro zone, and Australia. In Table 5-4, we explore the determinants the local
currency invoicing by taking the share of local currency as a dependent variable. The results are
consistent with those of Table 5-1 and Table 5-3.
6. Conclusion
In this paper, we present the results of the 2009 RIETI survey, a questionnaire survey
sent out to all TSE (Tokyo Stock Exchange) listed firms in the manufacturing industry as of
September 2009. The questionnaire covers various issues not only on the firms' invoicing choice
by type of industry, destination, and the type of trading partners, but also on the firms' foreign
exchange rate risk management. The survey results are investigated by classifying by industry,
the firm size, and destination using the annual securities reports of each sample firm. New
findings are presented on the exchange rate risk management and the choice of an invoice
currency by Japanese exporting firms and their overseas production subsidiaries, which is
summarized into 10 results.
Although considered to be an important research theme, there have so far been only a
limited number of empirical studies on the issue of firm’s invoicing strategy and exchange rate
risk managements. The reason is that such information is rarely published or disclosed at a firm
level or a disaggregated commodity level. Our findings based on the questionnaire survey will
provide useful information for an analysis of the exporter’s pricing behavior. Our findings also
provide significant implications for further economic integration and monetary arrangements in
the Asian region. Finally, further efforts on collecting the data regularly by the questionnaire
survey will undoubtedly be necessary so that we will be able to construct the database for a
rigorous empirical examination on this issue.

20
References
Bacchetta, Philippe and Eric van Wincoop, 2005, A Theory of the Currency Denomination of
International Trade, Journal of International Economics, 67(2), pp.295-319.
Deutsche Bundesbank, 1991. “The Significance of the Deutsche Mark as an Invoicing Currency
in Foreign Trade,” Monthly Report, November, pp.40-44.
Donnenfeld, Shabtai and Itzhak Zilcha, 1991, “Pricing of Exports and Exchange Rate
Uncertainty,” Review of International Economics, 32, pp.1009–1022.
Donnenfeld, Shabtai and Alfred Haug, 2003, “Currency Invoicing in International Trade: an
Empirical Investigation,” Review of International Economics, 11(2), pp.332-345.
Donnenfeld, Shabtai and Alfred Haug, 2008, “Currency Invoicing of US Imports,” International
Journal of Finance and Economics, 13(2), pp.184-198.
Friberg, Richard. 1998 "In which Currency Should Exporters Set their Prices?" Journal of
International Economics, 45(1), pp.59-76.
Friberg, Richard and Fredrik Wilander, 2008, "The Currency Denomination of Exports---A
Questionnaire Study," Journal of International Economics, 75, pp.54-69.
Fukuda, Shin-ichi and Ji Cong, 1994, “On the Choice of Invoice Currency by Japanese
Exporters: The PTM Approach,” Journal of the Japanese and International Economies, 8,
pp.511–529.
Giovannini, Alberto, 1988, “Exchange Rates and Traded Goods Prices,” Journal of International
Economics, 24, pp.45-68.
Goldberg, Linda S. and Cédric Tille, 2008, “Vehicle Currency Use in International Trade,”
Journal of International Economics, 76(2), pp.177-192.
Goldberg, Linda S. and Cédric Tille, 2009, “Micro, Macro, and Strategic Forces in International
Trade Invoicing,” NBER Working Paper No.15470, National Bureau of Economic Research.

21
Grassman, Sven, 1973, “A Fundamental Symmetry in International Payments.” Journal of
International Economics, 3, pp.105-16.
Grassman, Sven, 1976, “Currency Distribution and Forward Cover in Foreign Trade,” Journal
of International Economics, 6, pp.215–221.
Ito, Takatoshi, 1993. “The Yen and the International Monetary System,” in C.F. Bergsten and M.
Noland, eds., Pacific Dynamism and the International Economic System, (Washington, D.C.:
Institute of International Economics), pp.299-322.
Ito, T., S. Koibuchi, K. Sato, and J. Shimizu, 2010a, "2009 RIETI Survey on Currency Invoicing
and Exchange Rate Management," (in Japanese), RIETI Discussion Paper Series 10-J-032, June
2010.
Ito, T., S. Koibuchi, K. Sato, and J. Shimizu, 2010b, "Why has the yen failed to become a
dominant invoicing currency in Asia? A firm-level analysis of Japanese Exporters' Invoicing
Behavior," NBER Working Paper 16231, July 2010.
Johnson, Martin and Daniel Pick, 1997, "Currency Quandary: The Choice of Invoicing
Currency under Exchange-Rate Uncertainty,” Review of International Economics, 5(1),
pp.118-128.
Kawai, Masahiro, 1996. “The Japanese Yen as an International Currency: Performance and
Prospects,” in Ryuzo Sato, Rama Ramachandran, and Hajime Hori, eds., Organization,
Performance, and Equity: Perspectives on the Japanese Economy, (Massachusetts: Kluwer
Academic Publishers), pp.305-355.
Kamps, Annette, 2006, “The Euro as Invoicing Currency in International Trade,” ECB Working
Paper No.665, European Central Bank.
Knetter, Michael M., 1989, “Price Discrimination by U.S. and German Exporters,” American
Economic Review, 79(1), pp.198-210.
Knetter, Michael M., 1993. “International Comparison of Pricing-to-Market Behavior,”
American Economic Review, 83, pp.473-486.

22
Krugman, Paul, 1980, "Vehicle Currencies and the Structure of International Exchange," Journal
of Money, Credit and Banking, 12, pp.513-526.
Krugman, Paul, 1984, "The International Role of the Dollar: Theory and Prospect," in John
Bilson and Richard Marston, eds., Exchange Rate Theory and Practice, Chicago: University of
Chicago Press, pp.261-278.
Krugman, Paul R., 1987. “Pricing to Market When the Exchange Rate Changes,” in Sven W.
Arndt and J. David Richardson, eds., Real-Financial Linkage among the Open Economies,
(Cambridge: MIT Press), pp.49-70.
Ligthart, Jenny and Jorge A. da Silva, 2007, "Currency Invoicing in International Trade: A Panel
Data Approach," Tilburg University Discussion Paper, No.2007-25.
Marston, Richard C., 1990. “Pricing to Market in Japanese Manufacturing,” Journal of
International Economics, 29, pp.217-236.
Marston, Richard C., 1991. “Pricing Behavior in Japanese and US Manufacturing,” in P.
Krugman (ed.), The US and Japan: Trade and Investment, University of Chicago Press.
McKinnon, Ronald, I., 1979, Money in International Exchange: The Convertible Currency
System, Oxford University Press.
Ogawa, Eiji, and Junko Shimizu, 2005, “A Deviation Measurement for Coordinated Exchange
Rate Policies in East Asia,” RIETI Discussion Paper, 05-E-017.
Ogawa, Eiji, and Junko Shimizu, 2007, “Progress toward a Common Currency Basket System
in East Asia,” RIETI Discussion Paper, 07-E-002.
Page, S. A. B., 1977, “Currency of Invoicing in Merchandise Trade,” National Institute
Economic Review, 33, pp.1241–1264.
Page, S. A. B., 1981, “The Choice of Invoicing Currency in Merchandise Trade,” National
Institute Economic Review, 85, pp.60–72.
Parsons, Craig and Kiyotaka Sato, 2008, “New Estimates of Exchange Rate Pass-Through in

23
Japanese Exports,” International Journal of Finance and Economics, 13(2), pp.174-183.
Rauch, J., 1999, “Networks versus markets in international trade,” Journal of International
Economics 48, 7-35.
Sato, Kiyotaka, 1999, “The International Use of the Japanese Yen: The Case of Japan’s Trade
with East Asia,” The World Economy, 22(4), pp.547–584.
Sato, Kiyotaka, 2003, “Currency Invoicing in Japanese Exports to East Asia: Implications for
the Yen Internationalization,” Asian Economic Journal, 17(2), pp.129-154.
Takagi, Shinji and Yushi Yoshida, 2001, “Exchange Rate Movements and Tradable Goods
Prices in East Asia: An Analysis Based on Japanese Customs Data, 1988-1999,” IMF Staff
Papers, 48(2), pp.266-289.
Tavlas, George S., 1997. “The International Use of the US Dollar: An Optimum Currency Area
Perspective,” The World Economy, Vol.20, No.6, pp.709-747.
Tavlas, George S. and Yuzuru Ozeki, 1992. The Internationalization of Currencies: An Appraisal
of the Japanese Yen, Occasional Paper, 90, (Washington, D.C.: International Monetary Fund).

24
Table 3-1. Status of manufacturers listed in the TSE and responded firms
Type of Industry# of sample
firms(A)
Consolidatedsales (sum,million yen)
(B)
Foreign sales(sum, million yen)
(C)
# of samplefirms(D)
(D)/(A)(%)
Consolidatedsales (sum,million yen)
(E)
(E)/(B)(%)
Foreign sales(sum, million yen)
(F)
(F)/(C)(%)
All manufacturers 920 302,290,060 143,760,877 227 24.7 86,475,914 28.6 39,169,835 27.2Foods 15 12,889,824 4,678,669 3 20.0 1,451,476 11.3 454,748 9.7
Textiles & Apparel 28 5,025,318 1,646,818 9 32.1 919,282 18.3 158,263 9.6Pulp &papers 7 379,274 93,342 0 0.0 --- 0.0 --- 0.0
Chemicals 143 29,680,695 10,458,282 36 25.2 9,831,227 33.1 3,472,935 33.2Pharmaceuticals 20 6,266,656 2,462,544 3 15.0 692,592 11.1 68,852 2.8
Oil & Coal Products 7 19,119,287 2,583,049 1 14.3 3,428,211 17.9 399,070 15.4Rubber Products 16 5,410,788 3,353,052 4 25.0 394,042 7.3 141,373 4.2Glass & Ceramics 29 5,393,874 2,552,011 6 20.7 331,891 6.2 155,869 6.1
Steel Products 29 16,724,111 5,364,899 6 20.7 5,296,590 31.7 1,493,327 27.8Nonferrous Metals 21 8,840,646 2,717,890 5 23.8 1,016,916 11.5 154,716 5.7
Metal Products 30 2,976,691 957,658 9 30.0 1,555,912 52.3 657,107 68.6Machinery 174 22,407,692 10,996,155 40 23.0 6,334,195 28.3 3,231,035 29.4
Electrical Machinery 231 81,506,235 41,219,988 55 23.8 29,123,918 35.7 11,781,163 28.6Transport Equipment 86 73,011,842 48,799,919 27 31.4 23,981,759 32.8 15,775,875 32.3Precision Instruments 43 4,449,396 2,595,533 15 34.9 1,657,104 37.2 1,026,057 39.5
Other Products 41 8,207,731 3,281,068 8 19.5 460,799 5.6 199,445 6.1
Firms that questionnaire were sent(All manufacturers with foreign sales listed in the
stock exchanges)Responded firms
Source: 2009 RIETI Survey

25
Table 3-2. Status of manufacturers listed in the TSE and responded firms (sample average)
Type of IndustryConsolidated
sales (average,million yen)
Foreign sales(average, million
yen)
Foreign sales /Consolidate sales(average, million
yen)
Consolidatedsales (average,
million yen)
Foreign sales(average, million
yen)
Foreign sales /Consolidate sales(average, million
yen)
All manufacturers 328,576 159,912 37.6 380,951 190,145 37.0
Foods 859,322 334,191 22.3 483,825 227,374 32.3Textiles & Apparel 179,476 58,815 24.2 102,142 17,585 23.2
Pulp &papers 54,182 13,335 21.2 --- --- ---Chemicals 207,557 74,702 30.2 273,090 105,240 34.7
Pharmaceuticals 313,333 123,127 29.7 230,864 22,951 10.5Oil & Coal Products 2,731,327 369,007 17.6 3,428,211 399,070 11.6
Rubber Products 338,174 223,537 34.5 98,511 47,124 32.2Glass & Ceramics 185,996 88,000 36.4 55,315 25,978 30.3
Steel Products 576,693 191,604 27.8 882,765 298,665 23.4Nonferrous Metals 420,983 129,423 28.0 203,383 30,943 17.6
Metal Products 99,223 31,922 30.7 172,879 73,012 37.8Machinery 128,780 64,683 40.9 158,355 89,751 35.7
Electrical Machinery 352,841 181,586 43.4 529,526 231,003 43.7Transport Equipment 848,975 580,951 45.7 888,213 631,035 41.3Precision Instruments 103,474 64,888 44.6 110,474 85,505 48.2
Other Products 200,189 84,130 36.2 57,600 33,241 37.0
Firms that questionnaire were sent(All manufacturers with foreign sales listed in the stock
exchanges)Responded firms
Source: 2009 RIETI Survey
26
Table 3-3. Status of manufacturers listed in the TSE and responded firms
Large(upper 1/3)
Medium(middle 1/3)
Small(lower 1/3)
High(upper 1/3)
Medium(middle 1/3)
Low(lower 1/3)
All listed manufacturers 307 306 307 309 302 308Responded firms 86 73 68 69 71 87
Percent(%) 28.0 23.9 22.1 22.3 23.5 28.2
Firm category
Total consolidated sales Total foreign sales / Total consolidated sales
Source: 2009 RIETI Survey

27
Table 3-4. Respondents' department and division
Department(or division)
Treasury(accounting)department
Businessmanagement
division
Ovearseassales division
Business(sales)
department
Otherdepartment
N.A.
Responded firms (227 firms) 179 25 14 2 4 3Percent (%) 78.9 11.0 6.2 0.9 1.8 1.3
Source: 2009 RIETI Survey

28
Table 4-1. Invoicing currency and settlement currency Is the same currency used for invoicing and settlemt?
Type of IndustryAll
manufacturersFoods
Textiles &Apparel
ChemicalsPharmaceutical
sOil & CoalProducts
RubberProducts
Glass &Ceramics
Answer # of sample firms (A) 226 3 9 36 3 1 4 6# of answers (B) 200 3 8 31 3 1 4 6
(B)/(A)[%] 88.4 100.0 88.8 86.1 100.0 100.0 100.0 100.0# of answers (C) 26 0 1 5 0 0 0 0
(C)/(A)[%] 11.5 0.0 11.1 13.8 0.0 0.0 0.0 0.0
Type of Industry Steel ProductsNonferrous
MetalsMetal
ProductsMachinery
ElectricalMachinery
TransportEquipment
PrecisionInstruments
OtherProducts
Answer # of sample firms (A) 6 5 9 40 55 27 14 8# of answers (B) 5 5 8 36 50 20 12 8
(B)/(A)[%] 83.3 100.0 88.8 90.0 90.9 74.0 85.7 100.0# of answers (C) 1 0 1 4 5 7 2 0
(C)/(A)[%] 16.6 0.0 11.1 10.0 9.0 25.9 14.2 0.0
1.Yes. (or nodistinction)
2. No.
1.Yes. (or nodistinction)
2. No.
Source: 2009 RIETI Survey

29
Table 4-2. Number of foreign currency used for international trade
(A) By industry
How many kinds of foreign currencies is used for international trade? (by industry)
Type of IndustryAll
manufacturers
FoodsTextiles &Apparel
ChemicalsPharmaceuti
calsOil & CoalProducts
RubberProducts
Glass &Ceramics
# of answers 227 3 9 36 3 1 4 6Average 3.1 2.3 2.9 2.7 3.7 1.0 3.0 2.7
Max 15 3 6 9 5 5 7Min 0 2 1 1 2 1 1
Type of IndustrySteel
ProductsNonferrous
MetalsMetal
ProductsMachinery
ElectricalMachinery
TransportEquipment
PrecisionInstruments
OtherProducts
# of answers 6 5 9 40 55 27 15 8Average 2.0 2.8 2.3 3.3 3.5 4.0 2.1 2.8
Max 6 4 8 12 15 14 4 5Min 1 1 0 0 0 0 1 1
Number of foreigncurrencies for
international trade
Number of foreigncurrencies for
international trade
(B) By firm category
Type of IndustryAll
manufacturers
Allmanufactur
ersChemicals Machinery
ElectricalMachinery
TransportEquipment
PrecisionInstruments
Total consolidatedsales
# of firms Average Average Average Average Average Average
Large (upper 1/3) 86 4.4 3.2 5.0 5.5 5.5 3.0Medium (middle 1/3) 73 2.7 2.8 3.2 2.9 1.7 1.8
Small (lower 1/3) 68 1.9 2.0 1.7 1.8 3.0 2.0
Type of IndustryAll
manufacturers
Allmanufactur
ersChemicals Machinery
ElectricalMachinery
TransportEquipment
PrecisionInstruments
Total foreign sales /Total consolidated
sales# of firms Average Average Average Average Average Average
High (upper 1/3) 69 3.7 2.6 3.7 3.5 6.4 2.7Medium (middle 1/3) 71 3.2 3.3 3.0 4.6 3.0 2.2
Low (lower 1/3) 87 2.5 1.9 3.2 3.0 2.3 1.3
Number of foreigncurrencies for
international trade
Number of foreigncurrencies for
international trade
Source: 2009 RIETI Survey

30
Table 4-3 (A). Currency invoicing share in exports from Japan to the World
Currency invoicing share in exports from Japan to the World (by industry)All
manufacturers
FoodsTextiles &Apparel
ChemicalsPharmaceuti
calsOil & CoalProducts
RubberProducts
Glass &Ceramics
217 2 7 36 3 1 4 6JPY 48.2 50.0 50.0 50.4 54.0 0.0 38.0 57.2USD 42.1 50.0 41.3 41.0 20.3 100.0 54.3 40.8Euro 7.1 0.0 3.7 7.7 17.0 0.0 7.5 1.0
Others 2.7 0.0 5.0 0.9 10.0 0.0 0.3 1.0
SteelProducts
NonferrousMetals
MetalProducts
MachineryElectrical
MachineryTransportEquipment
PrecisionInstruments
OtherProducts
6 5 9 38 51 27 14 8JPY 35.7 23.6 57.2 56.2 38.8 56.3 44.4 53.9USD 63.5 70.4 41.7 29.7 50.7 33.3 44.3 38.3Euro 0.0 5.0 1.0 11.0 8.2 4.5 9.0 5.3
Others 0.8 1.0 0.1 3.2 2.5 5.9 2.3 2.6
Type of industry
# of firms
Currencyinvoicing
share
Sample average (Unit: %)
Type of industry
# of firms
Currencyinvoicing
share
Source: 2009 RIETI Survey

31
Table 4-3(B). Currency invoicing share in exports from Japan to the World (by firm category)
Currency invoicing share in exports from Japan to the World (by firm category)
Large(upper 1/3)
Medium(middle 1/3)
Small(lower 1/3)
High(upper 1/3)
Medium(middle 1/3)
Low(lower 1/3)
# of sample firms 80 70 67 64 70 83
JPY
All manufacturers 38.1 50.0 58.3 41.2 52.2 50.2Chemicals 33.1 54.2 66.8 52.1 50.1 49.8Machinery 36.8 73.8 56.5 47.5 67.3 55.0Electrical Machinery 25.7 36.5 54.3 25.1 48.9 50.7Transport Equipment 49.0 71.9 56.6 47.5 47.0 77.9Precision Instruments 29.8 40.4 55.0 43.8 63.5 21.3
USD
All manufacturers 47.8 41.7 35.8 45.5 39.0 42.1Chemicals 55.9 38.7 25.9 39.4 41.7 40.9Machinery 41.0 18.0 31.1 31.3 19.8 35.8Electrical Machinery 59.2 51.4 41.5 62.4 41.8 40.7Transport Equipment 35.3 23.4 41.2 40.2 38.0 19.5Precision Instruments 42.6 51.6 39.2 37.8 27.3 73.8
Euro
All manufacturers 10.5 5.1 5.2 11.0 5.7 5.3Chemicals 10.5 5.1 7.3 8.4 6.4 9.2Machinery 17.5 5.8 10.1 18.5 9.6 5.9Electrical Machinery 12.8 7.8 3.8 10.3 6.8 6.2Transport Equipment 6.1 2.7 2.1 7.0 4.4 1.3Precision Instruments 25.4 3.0 5.8 16.8 8.5 0.0
Other currencies
All manufacturers 3.7 3.3 0.7 2.5 3.0 2.5Chemicals 0.6 2.1 0.0 0.1 1.8 0.1Machinery 4.7 2.4 2.5 3.0 3.3 3.2Electrical Machinery 2.3 4.9 0.3 2.6 2.6 2.4Transport Equipment 9.6 2.0 0.1 5.3 10.6 1.3Precision Instruments 2.2 5.0 0.0 1.6 0.7 5.0
Sample average (Unit: %)
Total consolidated salesTotal foreign sales
/ Total consolidated sales
Source: 2009 RIETI Survey

32
Table 4-4. Currency invoicing share in total exports from Japan to the world
(Unit: percent)Japanese yen US dollar Euro Other currencies
Arithmetic average1)
(all responded firms)48.2 42.1 7.1 2.6
Weighted average by foreign sales2)
(all responded firms)28.7 54.1 11.3 5.9
1) Arithemetic average is culculated as sample aveage of invoicing currency share of all responded firms.
2) Weghted average is culculated as average of invoicing currency share of all responded firms weighted by amount offoreign sales in FY2008 of each firm.
Source: 2009 RIETI Survey

33
Table 4-5(A). Currency invoicing share in exports from Japan to Americas, Europe, Africa, and
Pacific Currency invoicing in exports from Japan to Americas, Europe, Africa, and Pacific (by firm size)
Destination
US Canada Mexico BrazilCentral& Latin
Americas
EuroArea
UK RussiaEast
Europeancountries
AustraliaNew
ZealandAfrican
countries
# of answers 168 50 36 51 39 133 65 34 40 70 37 35A. JPY
All manufacturers 21.8 29.2 34.0 50.3 50.3 35.3 35.0 63.0 58.9 52.5 56.5 63.3Large 16.0 13.7 23.0 37.6 41.7 29.7 30.5 58.8 52.0 42.6 54.3 61.5
Medium 23.9 45.0 45.7 60.0 55.6 30.1 17.7 37.5 46.8 50.3 33.2 62.5Small 26.5 61.4 57.1 80.0 71.6 49.2 65.0 90.0 88.9 84.6 80.0 75.0
B. USDAll manufacturers 77.9 48.2 66.0 45.6 45.1 13.6 18.5 29.7 13.1 29.1 32.6 34.7
Large 83.5 59.6 77.0 61.7 54.7 11.4 12.7 30.1 12.5 30.6 32.4 35.4Medium 76.1 30.0 54.3 30.0 44.4 16.4 30.0 50.0 15.9 41.4 66.8 37.5
Small 72.9 29.5 42.9 11.0 14.4 13.9 21.4 11.1 11.1 7.7 7.5 25.0
C. EuroAll manufacturers 0.3 1.7 0.0 4.1 4.6 51.0 15.7 8.4 28.0 1.3 0.0 2.0
Large 0.7 2.7 0.0 0.6 3.6 58.8 23.6 11.1 35.5 2.4 0.0 3.1Medium 0.0 0.0 0.0 10.0 0.0 53.2 10.7 12.5 37.3 0.0 0.0 0.0
Small 0.0 0.0 0.0 9.0 14.0 36.9 0.7 0.0 0.0 0.0 0.0 0.0
D. Importer's currencyAll manufacturers --- 20.0 0.0 0.0 0.0 --- 32.1 0.0 0.0 18.5 2.7 0.0
Large --- 22.6 0.0 0.0 0.0 --- 35.7 0.0 0.1 25.9 0.0 0.0Medium --- 25.0 0.0 0.0 0.0 --- 41.7 0.0 0.0 11.1 0.0 0.0
Small --- 9.1 0.0 0.0 0.0 --- 12.9 0.0 0.0 7.7 12.5 0.0
E. Other currenciesAll manufacturers 0.0 0.0 0.0 0.0 0.0 0.3 0.0 0.0 0.0 0.0 8.2 0.0
Large 0.0 0.0 0.0 0.0 0.0 0.6 0.0 0.0 0.0 0.0 13.3 0.0Medium 0.0 0.0 0.0 0.0 0.0 0.1 0.0 0.0 0.0 0.0 0.0 0.0
Small 0.0 0.0 0.0 0.0 0.0 0.0 0.0 0.0 0.0 0.0 0.0 0.0
Sample average (Unit: %)
Source: 2009 RIETI Survey

34
Table 4-5(B). Currency invoicing share in exports from Japan to Asian countries
Currency invoicing in exports from Japan to Asia (by firm size)
Destination
China Korea TaiwanHongKong
Singapore Thailand Malaysia Indonesia Philipines Vietnam IndiaMid-Eastcountries
# of answers 174 142 150 106 103 122 94 84 71 61 72 63A. JPY
All manufacturers 55.4 69.0 62.5 45.6 56.9 60.1 56.1 61.6 63.0 64.9 76.3 51.9Large 45.3 62.5 53.3 33.3 52.0 54.7 51.1 53.3 52.6 67.9 68.6 41.5
Medium 60.5 68.9 63.0 44.5 54.0 57.3 45.7 66.7 64.7 41.9 81.3 50.3Small 63.4 78.9 75.2 68.3 70.5 75.5 84.1 74.9 82.4 80.9 91.0 73.4
B. USD
All manufacturers 43.7 25.5 35.3 49.4 37.8 30.4 42.4 33.8 35.8 35.1 21.2 42.7Large 52.4 32.8 42.6 61.9 42.6 35.4 48.4 41.0 43.9 32.1 29.4 49.4
Medium 40.9 25.8 35.7 46.7 43.1 32.5 50.7 27.5 35.3 58.1 18.7 49.1Small 34.2 13.8 24.0 30.7 21.2 16.7 15.4 25.1 18.8 19.1 1.9 23.4
C. Euro
All manufacturers 0.5 1.1 0.3 0.0 0.5 0.2 0.3 0.6 0.0 0.0 1.1 4.2Large 0.4 0.5 0.0 0.0 1.0 0.4 0.5 1.2 0.0 0.0 2.1 6.7
Medium 0.0 1.1 0.0 0.0 0.0 0.0 0.0 0.0 0.0 0.0 0.0 0.6Small 1.2 1.9 1.0 0.0 0.0 0.0 0.0 0.0 0.0 0.0 0.0 3.1
D. Importer's currency
All manufacturers 1.3 4.5 2.4 4.8 4.8 9.4 1.1 4.0 1.4 0.0 1.4 2.4Large 3.2 4.2 4.1 4.7 4.2 9.5 0.0 4.5 2.9 0.0 0.0 4.9
Medium 0.0 4.2 2.1 8.9 2.9 10.1 3.6 5.8 0.0 0.0 0.0 0.0Small 0.0 5.4 0.4 0.0 8.4 7.8 0.0 0.1 0.0 0.0 7.1 0.0
E. Other currencies
All manufacturers 0.0 0.0 0.0 0.0 0.1 0.0 0.0 0.0 0.3 0.0 0.0 0.3Large 0.0 0.0 0.0 0.0 0.2 0.0 0.0 0.0 0.7 0.0 0.0 0.6
Medium 0.0 0.0 0.0 0.0 0.0 0.0 0.0 0.0 0.0 0.0 0.0 0.0Small 0.0 0.0 0.0 0.0 0.0 0.0 0.0 0.0 0.0 0.0 0.0 0.0
Sample average (Unit: %)
Source: 2009 RIETI Survey

35
Table 4-6(A). Share of export channel from Japan to Americas, Europe, Africa, and Pacific
Share of export channel from Japan to Americas, Europe, Africa, and Pacific (all manufacturers, by firm size)
Destination
US Canada Mexico BrazilCentral& Latin
Americas
EuroArea
UK Russia
EastEuropeancountries
AustraliaNew
ZealandAfrican
countries
Number of answers 150 44 32 45 35 117 61 31 34 63 34 33
Export channel
All overseas subsidiaries (a)+(b) 70.8 38.7 38.1 40.5 22.3 52.1 55.6 16.1 30.9 31.5 26.5 12.2
(a) Subsidiaries(plants) 20.8 10.0 11.0 28.6 6.0 12.2 15.5 1.0 20.6 6.7 8.8 3.1(b) Subsidiaries(sales) 50.0 28.7 27.1 11.8 16.3 39.8 40.1 15.1 10.3 24.7 17.6 9.1
Local agencies (no capital ties) 10.4 35.6 20.3 33.3 41.3 25.3 23.3 36.7 31.7 37.3 55.9 44.3Via Japanese trading companies 7.6 11.6 18.7 16.4 24.9 7.7 1.3 30.7 22.7 16.4 5.6 29.6Others 11.0 14.2 22.9 9.8 11.4 15.2 19.8 17.5 15.9 15.8 12.1 13.9
Number of answers 57 28 22 28 24 52 37 16 18 35 23 21
Export channel
All overseas subsidiaries (a)+(b) 77.1 45.4 46.4 58.4 28.6 69.5 66.0 25.7 46.9 42.5 39.3 19.3
(a) Subsidiaries(plants) 26.5 12.2 16.1 39.3 8.9 18.9 20.3 2.0 27.9 9.3 13.1 4.9
(b) Subsidiaries(sales) 50.5 33.1 30.4 19.1 19.7 50.6 45.7 23.7 19.1 33.2 26.2 14.4
Local agencies (no capital ties) 4.2 27.2 20.6 17.9 32.4 12.0 16.3 26.8 15.5 30.1 47.9 45.9
Via Japanese trading companies 7.4 11.8 13.0 11.8 22.7 4.9 1.6 28.5 26.4 15.8 4.4 25.2
Others 8.9 12.4 16.0 8.6 12.6 12.0 13.7 14.8 7.9 10.8 4.4 5.3
Number of answers 49 6 5 8 7 33 12 6 9 17 5 8
Export channel
All overseas subsidiaries (a)+(b) 75.2 39.2 20.0 12.5 0.0 55.3 72.9 16.7 22.2 17.6 0.0 0.0
(a) Subsidiaries(plants) 26.8 0.0 0.0 12.5 0.0 8.5 16.7 0.0 22.2 0.0 0.0 0.0
(b) Subsidiaries(sales) 48.4 39.2 20.0 0.0 0.0 46.8 56.3 16.7 0.0 17.6 0.0 0.0
Local agencies (no capital ties) 8.7 34.2 0.0 50.0 52.9 21.7 8.3 16.7 33.3 47.1 80.0 25.0
Via Japanese trading companies 9.6 10.0 40.0 37.5 32.9 6.6 2.1 50.0 22.2 10.6 0.0 43.8
Others 6.5 16.7 40.0 0.0 14.3 16.4 16.7 16.7 22.2 24.7 20.0 31.3
Number of answers 45 11 6 10 5 33 13 10 8 12 7 5
Export channel
All overseas subsidiaries (a)+(b) 56.6 18.2 16.7 9.0 20.0 20.0 6.2 0.0 0.0 16.7 0.0 0.0
(a) Subsidiaries(plants) 6.7 9.1 0.0 9.0 0.0 5.2 0.0 0.0 0.0 8.3 0.0 0.0
(b) Subsidiaries(sales) 49.9 9.1 16.7 0.0 20.0 14.8 6.2 0.0 0.0 8.3 0.0 0.0
Local agencies (no capital ties) 19.9 54.5 33.3 60.0 60.0 48.8 55.4 60.0 62.5 41.7 57.1 60.0
Via Japanese trading companies 5.4 10.9 19.2 11.0 20.0 12.9 0.0 19.5 12.5 25.0 12.9 20.0
Others 18.1 16.4 30.8 20.0 0.0 18.3 38.5 20.5 25.0 16.7 30.0 20.0
By size
Large
Medium
Small
Sample average (Unit: %)
All size
Source: 2009 RIETI Survey

36
Table 4-6(B). Share of export channel from Japan to Asian countries
Share of export channel from Japan to Asian countries (all manufacturers, by firm size)
Destination
China Korea TaiwanHongKong
Singapore Thailand Malaysia Indonesia Philipines Vietnam IndiaMid-Eastcountries
Number of answers 155 131 135 96 93 110 82 77 65 56 65 57
Export channel
All overseas subsidiaries (a)+(b 59.8 27.2 39.6 54.1 46.2 54.7 44.8 42.2 30.9 32.8 28.4 12.2
(a) Subsidiaries(plants) 35.0 9.7 16.7 6.6 6.1 40.4 33.8 32.7 22.5 24.9 18.4 2.6
(b) Subsidiaries(sales) 24.8 17.5 22.8 47.6 40.2 14.3 11.0 9.4 8.4 7.9 10.1 9.6
Local agencies (no capital ties) 14.2 38.3 34.6 25.6 30.5 23.2 29.9 25.1 37.9 30.9 29.7 40.6
Via Japanese trading companie 13.5 12.2 9.7 6.7 9.9 8.6 7.0 16.0 13.5 18.3 17.9 27.2
Others 13.5 22.2 16.1 13.5 13.4 13.6 19.2 16.7 17.7 20.2 24.0 20.0
Number of answers 64 56 55 45 43 49 44 40 34 28 36 31
Export channel
All overseas subsidiaries (a)+(b 63.5 34.8 52.2 63.6 60.3 62.7 54.3 52.1 45.3 41.7 44.5 16.2
(a) Subsidiaries(plants) 32.2 10.7 21.4 4.7 8.3 48.6 44.0 36.8 30.9 29.8 27.7 1.7
(b) Subsidiaries(sales) 31.2 24.2 30.8 58.9 52.1 14.2 10.4 15.2 14.3 11.9 16.8 14.5
Local agencies (no capital ties) 7.8 24.1 23.9 16.4 19.3 14.4 22.8 17.4 20.5 21.9 24.3 32.4
Via Japanese trading companie 12.6 14.4 8.6 9.7 8.4 8.5 5.4 13.1 13.8 23.4 15.9 32.3
Others 14.8 25.2 13.6 8.3 9.9 12.5 15.4 15.2 17.7 13.9 12.8 16.2
Number of answers 51 40 43 27 27 39 23 22 16 13 17 12
Export channel
All overseas subsidiaries (a)+(b 67.0 32.7 36.7 54.3 41.1 60.2 47.4 44.1 10.9 27.9 11.8 8.3
(a) Subsidiaries(plants) 44.1 17.0 20.1 11.9 4.1 50.3 27.7 43.2 7.2 27.9 11.8 8.3
(b) Subsidiaries(sales) 22.9 15.7 16.6 42.4 37.0 9.9 19.7 0.9 3.8 0.0 0.0 0.0
Local agencies (no capital ties) 8.1 43.7 35.7 23.9 23.3 16.4 20.9 20.0 47.8 19.2 23.8 34.2
Via Japanese trading companie 16.5 6.0 11.6 0.0 17.0 10.8 10.4 26.4 16.3 19.2 23.2 24.2
Others 8.9 17.7 16.0 21.8 18.5 12.5 21.3 9.5 25.0 33.6 41.2 33.3
Number of answers 41 36 38 25 24 23 16 16 16 16 13 15
Export channel
All overseas subsidiaries (a)+(b 43.3 8.7 23.6 35.5 25.0 25.9 12.5 12.5 18.8 18.8 3.8 6.7
(a) Subsidiaries(plants) 27.0 0.1 5.7 4.0 4.2 4.3 12.5 6.3 18.8 12.5 0.0 0.0
(b) Subsidiaries(sales) 16.3 8.6 17.9 31.5 20.8 21.5 0.0 6.3 0.0 6.3 3.8 6.7
Local agencies (no capital ties) 32.1 53.6 48.0 43.2 57.5 52.2 58.8 50.0 62.5 55.0 50.0 60.0
Via Japanese trading companie 10.9 15.6 9.0 8.4 4.2 4.6 5.9 8.1 9.4 7.2 15.3 17.3
Others 16.7 22.2 19.5 13.6 13.3 17.4 25.3 29.4 9.4 19.1 30.8 16.0
All size
By size
Large
Medium
Small
Sample average (Unit: %)
Source: 2009 RIETI Survey

37
Table 4-7(A). Currency invoicing choice by trade channel in exports from Japan to Americas,
Europe, Africa, and Pacific countries
Destination
US Canada Mexico BrazilCentral& Latin
Americas
EuroArea
UK RussiaEast
Europeancountries
AustraliaNew
ZealandAfrican
countries
150 44 32 45 35 117 61 31 34 63 34 33
Subsidiaries(plants)
# of answers 51 6 5 17 4 29 12 1 7 5 3 2
1. JPY 21.6 16.7 0.0 23.5 0.0 24.1 16.7 100.0 28.6 40.0 33.3 50.0
2. USD 78.4 66.7 100.0 64.7 100.0 6.9 16.7 0.0 0.0 20.0 66.7 50.0
3. Euro 0.0 0.0 0.0 11.8 0.0 69.0 25.0 0.0 71.4 0.0 0.0 0.0
4. Importer's currency --- 16.7 0.0 0.0 0.0 --- 41.7 0.0 0.0 40.0 0.0 0.0
5. Others 0.0 0.0 0.0 0.0 0.0 0.0 0.0 0.0 0.0 0.0 0.0 0.0
Subsidiaries(sales)
# of answers 109 17 11 7 8 62 27 6 6 20 7 4
1. JPY 7.3 0.0 18.2 14.3 25.0 24.2 22.2 50.0 50.0 25.0 42.9 50.0
2. USD 92.7 58.8 72.7 85.7 50.0 11.3 11.1 33.3 0.0 25.0 14.3 50.0
3. Euro 0.0 0.0 0.0 0.0 25.0 64.5 18.5 16.7 50.0 5.0 0.0 0.0
4. Importer's currency --- 41.2 9.1 0.0 0.0 --- 48.1 0.0 0.0 45.0 0.0 0.0
5. Others 0.0 0.0 0.0 0.0 0.0 0.0 0.0 0.0 0.0 0.0 42.9 0.0
Local agencies (no capital ties)
# of answers 31 17 8 14 19 46 17 12 14 28 20 15
1. JPY 38.7 52.9 50.0 85.7 63.2 45.7 47.1 83.3 85.7 53.6 65.0 73.3
2. USD 61.3 29.4 50.0 14.3 36.8 6.5 23.5 16.7 7.1 35.7 25.0 26.7
3. Euro 0.0 0.0 0.0 0.0 0.0 47.8 0.0 0.0 7.1 0.0 0.0 0.0
4. Importer's currency --- 17.6 0.0 0.0 0.0 --- 29.4 0.0 0.0 10.7 5.0 0.0
5. Others 0.0 0.0 0.0 0.0 0.0 0.0 0.0 0.0 0.0 0.0 0.0 0.0
Via Japanese trading companies# of answers 25 12 8 11 12 20 8 12 11 14 4 151. JPY 56.0 58.3 37.5 54.5 75.0 45.0 62.5 58.3 72.7 78.6 75.0 86.72. USD 44.0 16.7 62.5 45.5 25.0 0.0 0.0 41.7 9.1 21.4 25.0 13.33. Euro 0.0 8.3 0.0 0.0 0.0 55.0 25.0 0.0 18.2 0.0 0.0 0.04. Importer's currency --- 16.7 0.0 0.0 0.0 --- 12.5 0.0 0.0 0.0 0.0 0.05. Others 0.0 0.0 0.0 0.0 0.0 0.0 0.0 0.0 0.0 0.0 0.0 0.0
Others# of answers 30 11 14 10 8 29 15 10 9 14 6 91. JPY 43.3 27.3 50.0 80.0 62.5 48.3 40.0 60.0 55.6 71.4 50.0 66.72. USD 56.7 54.5 50.0 20.0 37.5 24.1 20.0 30.0 22.2 28.6 33.3 33.33. Euro 0.0 0.0 0.0 0.0 0.0 27.6 20.0 10.0 22.2 0.0 0.0 0.04. Importer's currency --- 18.2 0.0 0.0 0.0 --- 20.0 0.0 0.0 0.0 0.0 0.05. Others 0.0 0.0 0.0 0.0 0.0 0.0 0.0 0.0 0.0 0.0 0.0 0.0
Percent of number of "main currency," most frequently used currency in exports from Japan to each destination, over total number of answers
Number of answers
Source: 2009 RIETI Survey

38
Table 4-7(B). Currency invoicing choice by trade channel in exports from Japan to Asian
countries
Destination
China Korea TaiwanHongKong
Singapore Thailand Malaysia Indonesia Philipines Vietnam IndiaMid-Eastcountries
Number of answers 131 135 96 93 110 82 77 65 56 65 57
Subsidiaries(plants)
# of answers 93 23 36 10 12 62 35 30 16 17 15 2
1. JPY 51.6 56.5 63.9 20.0 58.3 58.1 51.4 46.7 37.5 29.4 73.3 50.0
2. USD 45.2 30.4 30.6 70.0 41.7 30.6 45.7 43.3 56.3 64.7 20.0 50.0
3. Euro 0.0 0.0 0.0 0.0 0.0 0.0 0.0 0.0 0.0 0.0 0.0 0.0
4. Importer's currency 3.2 13.0 5.6 10.0 0.0 11.3 2.9 10.0 6.3 0.0 6.7 0.0
5. Others 0.0 0.0 0.0 0.0 0.0 0.0 0.0 0.0 0.0 0.0 0.0 0.0
Subsidiaries(sales)
# of answers 75 37 44 53 48 28 14 14 9 9 10 9
1. JPY 42.7 64.9 52.3 32.1 37.5 57.1 57.1 35.7 44.4 77.8 60.0 33.3
2. USD 57.3 29.7 40.9 60.4 54.2 32.1 42.9 57.1 55.6 22.2 30.0 66.7
3. Euro 0.0 0.0 0.0 1.9 0.0 0.0 0.0 0.0 0.0 0.0 10.0 0.0
4. Importer's currency 0.0 5.4 6.8 5.7 8.3 10.7 0.0 7.1 0.0 0.0 0.0 0.0
5. Others 0.0 0.0 0.0 0.0 0.0 0.0 0.0 0.0 0.0 0.0 0.0 0.0
Local agencies (no capital ties)
# of answers 41 63 65 33 34 31 32 23 26 20 21 25
1. JPY 68.3 73.0 66.2 60.6 85.3 87.1 68.8 69.6 76.9 75.0 71.4 68.0
2. USD 29.3 23.8 32.3 39.4 11.8 12.9 31.3 30.4 23.1 25.0 28.6 32.0
3. Euro 0.0 1.6 1.5 0.0 0.0 0.0 0.0 0.0 0.0 0.0 0.0 0.0
4. Importer's currency 2.4 1.6 0.0 0.0 2.9 0.0 0.0 0.0 0.0 0.0 0.0 0.0
5. Others 0.0 0.0 0.0 0.0 0.0 0.0 0.0 0.0 0.0 0.0 0.0 0.0
Via Japanese trading companies
# of answers 47 28 29 10 16 21 14 23 16 19 20 26
1. JPY 76.6 82.1 79.3 70.0 68.8 76.2 71.4 82.6 87.5 78.9 90.0 65.4
2. USD 21.3 17.9 20.7 20.0 25.0 23.8 28.6 8.7 12.5 21.1 10.0 30.8
3. Euro 0.0 0.0 0.0 0.0 0.0 0.0 0.0 0.0 0.0 0.0 0.0 3.8
4. Importer's currency 2.1 0.0 0.0 10.0 6.3 0.0 0.0 8.7 0.0 0.0 0.0 0.0
5. Others 0.0 0.0 0.0 0.0 0.0 0.0 0.0 0.0 0.0 0.0 0.0 0.0
Others
# of answers 39 45 33 20 18 27 24 21 19 18 22 16
1. JPY 56.4 68.9 60.6 45.0 88.9 70.4 62.5 71.4 68.4 72.2 86.4 37.5
2. USD 43.6 28.9 39.4 50.0 11.1 29.6 37.5 28.6 31.6 27.8 13.6 37.5
3. Euro 0.0 0.0 0.0 0.0 0.0 0.0 0.0 0.0 0.0 0.0 0.0 12.5
4. Importer's currency 0.0 2.2 0.0 5.0 0.0 0.0 0.0 0.0 0.0 0.0 0.0 12.5
5. Others 0.0 0.0 0.0 0.0 0.0 0.0 0.0 0.0 0.0 0.0 0.0 0.0
Percent of number of "main currency," most frequently used currency in exports from Japan to each destination, over total number of answers
Source: 2009 RIETI Survey

39
Table 4-8. The Choice of an Invoice Currency in Local Sales
Which currency is most frequently used for sales to local customers?
# ofanswers
(B)
(B)/(A)(%)
# ofanswers
(C)
(C)/(A)(%)
# ofanswers
(D)
(D)/(A)(%)
# ofanswers
(E)
(E)/(A)(%)
Americas (total) 70 68 97.1 2 2.9
US 49 49 100.0Canada 6 5 83.3 1 16.7Mexico 4 3 75.0 1 25.0
Brazil 13 13 100.0Central & Latin Americas 4 3 75.0 1 25.0
Europe (total) 41 36 87.8 5 12.1
Euro Area 25 25 100.0UK 10 9 90.0 1 10.0
Russia 0East European countries 6 2 23.3 4 66.7
Pacific & Africa (total) 9 7 2 22.2
Australia 4 4 100New Zealand 3 2 66.7 1 33.3
African countries 2 1 50.0 1 50.0
Asia (total) 303 271 89.4 30 9.9 1 0.3China 80 76 95.0 4 5.0Korea 18 15 83.3 2 11.1
Taiwan 28 24 85.7 4 14.2Hong Kong 8 6 75.0 2 25.0
Singapore 14 9 64.2 4 28.6Thailand 52 49 94.2 3 5.7Malaysia 29 25 86.2 4 13.7
Indonesia 30 28 93.3 2 6.6Philipines 15 12 80.0 3 20.0
Vietnam 15 14 93.3 11) 6.6 1
1) 6.6
India 12 12 100.0Mid-East countries 2 1 50.0 1 50.0
1) One company in Vietnam answered USD and JPY as currencies most frequently used for sales to local customers.
Local currency USD Euro JPYNumber offirms toanswer
(A)
Country/region wheresample firms have
subsidiaries (plants)
Source: 2009 RIETI Survey

40
Table 4-9. Destination of exports from overseas plants
Destination of exports from overseas plants
USEuroArea
China
Americas (total) 76 28 6 36 9 9 7 5 2 0US 49 15 4 19 --- 7 5 4 2 0
Canada 6 3 0 3 3 0 0 1 0 0Mexico 4 3 0 3 2 0 0 0 0 0
Brazil 13 7 2 11 4 2 2 0 0 0Central & Latin Americas 4 0 0 0 0 0 0 0 0 0
Europe (total) 45 21 4 5 4 19 9 5 1 1Euro Area 25 10 3 3 3 7 --- 4 1 1
UK 12 7 1 2 1 5 5 1 0 0Russia 1 0 0 0 0 0 0 0 0 0
East European countries 7 4 0 0 0 7 4 0 0 0
Pacific & Africa (total) 9 5 0 2 1 0 0 4 0 3Australia 4 3 0 1 0 0 0 4 0 2
New Zealand 3 2 0 1 1 0 0 0 0 1African countries 2 0 0 0 0 0 0 0 0 0
Asia (total) 330 184 103 41 40 33 31 169 19 5China 85 55 35 17 17 15 14 25 --- 0
Korea 19 11 8 2 1 2 1 11 3 0Taiwan 33 19 7 1 1 1 1 27 8 1
Hong Kong 9 6 4 1 1 2 2 5 3 0Singapore 14 9 3 3 3 3 3 9 0 1
Thailand 58 33 20 9 9 5 5 29 1 2Malaysia 33 17 9 1 1 1 1 20 1 0
Indonesia 30 14 7 2 2 2 2 23 1 0Philipines 16 10 5 3 3 1 1 10 2 0
Vietnam 16 8 5 2 2 1 1 7 0 0India 14 1 0 0 0 0 0 1 0 0
Mid-East countries 3 1 0 0 0 0 0 2 0 1
Country/region wheresample firms have
subsidiaries (plants)
Number offirms havingsubsidiaries
(plants)
# of firms toanswer
destination
Export destination
Japan Americas Europe AsiaPacific
& Africa
Source: 2009 RIETI Survey

41
Table 4-10(A). Invoice currency choice in exports from plants in US by destination
Invoice currency choice in exports from plants in US to each destination[# of "main currency," most frequently used currency in exports from plants in US to each destination / total number of answers]
Destination Japan US Canada Mexico BrazilCentral &
LatinAmerica
Euro Area UK RussiaEast
EuropeAustlaria
NewZealand
Africa
# of answers 4 --- 7 7 3 2 4 2A. JPY ---B. USD [4/4] --- [7/7] [6/7] [2/3] [1/2] [4/4] [1/2]C. Euro ---E. Importer's currency --- [1/7] [1/3] [1/2] [1/2]
China Korea TaiwanHongKong
Singapore Thailand Malaysia Indonesia Philipine Vietnam IndiaMid-EastAsia
# of answers 3 2 1A. JPYB. USD [3/3] [2/2] [1/1]C. EuroE. Importer's currency
Destination Asia
Source: 2009 RIETI Survey

42
Table 4-11(B). Invoice currency choice in exports from plants in Euro zone by destination
Invoice currency choice in exports from plants in Euro Area to each destination[# of "main currency," most frequently used currency in exports from plants in Euro Area to each destination / total number of answers]
Destination Japan US Canada Mexico BrazilCentral &
LatinAmerica
Euro Area UK RussiaEast
EuropeAustlaria
NewZealand
Africa
# of answers 3 2 --- 2 1 3 1A. JPY ---B. USD [2/2] --- [1/1] [1/1]C. Euro [3/3] --- [1/2] [3/3]E. Importer's currency --- [1/2]
China Korea TaiwanHongKong
Singapore Thailand Malaysia Indonesia Philipine Vietnam IndiaMid-East
Asia
# of answers 3 1 2A. JPYB. USDC. Euro [3/3] [1/1] [2/2]E. Importer's currency
Destination Asia
Source: 2009 RIETI Survey

43
Table 4-12(C). Invoice currency choice in exports from plants in China by destination
Invoice currency choice in exports from plants in China to each destination[# of "main currency," most frequently used currency in exports from plants in China to each destination / total number of answers]
Destination Japan US Canada Mexico BrazilCentral &
LatinAmerica
Euro Area UK RussiaEast
EuropeAustlaria
NewZealand
Africa
# of answers 35 17 14 1 1A. JPY [14/35] [1/14]B. USD [20/35] [17/17] [8/14] [1/1] [1/1]C. Euro [1/35] [5/14]D. Chinese YuanE. Importer's currency
China Korea TaiwanHongKong
Singapore Thailand Malaysia Indonesia Philipine Vietnam IndiaMid-East
Asia
# of answers 24 --- 4 4 9 2 1 1 1 2A. JPY [2/24] --- [1/4] [1/9]B. USD [20/24] --- [3/4] [3/4] [7/9] [2/2] [1/1] [1/1] [1/1] [2/2]C. Euro ---D. Chinese Yuan [2/24] --- [1/4] [1/9]E. Importer's currency ---
Destination Asia
Source: 2009 RIETI Survey

44
Table 4-13(D). Invoice currency choice in exports from plants in Thailand by destination
Invoice currency choice in exports from plants in Thailand to each destination[# of "main currency," most frequently used currency in exports from plants in Thailand to each destination / total number of answers]
Destination Japan US Canada Mexico BrazilCentral &
LatinAmerica
Euro Area UK RussiaEast
EuropeAustlaria
NewZealand
Africa
# of answers 19 9 5 1A. JPY [5/19] [1/5]B. USD [11/19] [9/9] [2/2]C. Euro [2/2]D. Thai Baht [3/19] [1/1]E. Importer's currency
China Korea TaiwanHongKong
Singapore Thailand Malaysia Indonesia Philipine Vietnam IndiaMid-East
Asia
# of answers 22 1 2 2 4 5 --- 1 3 1 2 1A. JPY [1/22] [1/2] ---B. USD [17/22] [1/1] [1/2] [2/2] [4/4] [4/5] --- [1/1] [1/3] [2/2] [1/1]C. Euro ---D. Thai Baht [4/22] [1/5] --- [2/3] [1/1]E. Importer's currency ---
Destination Asia
Source: 2009 RIETI Survey

45
Table 5-1. Determinants of Japanese yen invoicing in exports to all countries/region
Dependent variable: Share of Japanese yen invoicing in total exports from Japan to each destination country/regionMethod: OLS regression
Dependent variable (1) (2) (3) (4) (5) (6)-0.029*** -0.027*** -0.029*** -0.036*** -0.034*** -0.036***
(0.006) (0.006) (0.006) (0.007) (0.007) (0.007)0.158*** 0.159*** 0.164*** 0.160*** 0.161*** 0.166***(0.028) (0.028) (0.028) (0.028) (0.028) (0.028)
0.319*** 0.323*** 0.323*** 0.344*** 0.347*** 0.344***(0.031) (0.031) (0.031) (0.041) (0.041) (0.040)-0.024 -0.009 -0.013 0.047 0.052 0.048(0.040) (0.040) (0.040) (0.041) (0.041) (0.041)
-0.315*** -0.315*** -0.318*** -0.294*** -0.296*** -0.299***(0.028) (0.028) (0.028) (0.028) (0.028) (0.028)
-0.150*** -0.094*** -0.045 -0.175*** -0.137*** -0.088**(0.031) (0.036) (0.039) (0.032) (0.038) (0.041)
-0.114*** 0.082 -0.072* 0.116(0.039) (0.073) (0.039) (0.072)
-0.300*** -0.290***(0.094) (0.092)
Industry dummies No No No Yes Yes Yes0.649*** 0.628*** 0.648*** 0.804*** 0.765*** 0.782***(0.081) (0.082) (0.082) (0.105) (0.107) (0.107)
Observations 1,534 1,534 1,534 1,534 1,534 1,534Adj. R-squared 0.175 0.179 0.184 0.209 0.210 0.215
1) Estimated coefficient and its standard error, (in parentheses), are reported in each column.2) Asterisk(s), ***, **, and * mean that the estimated coeffcients are statistically significant at 1%, 5%, and 10%, respectively.
Destination: US, Canada, Mexico, Euro area, UK, Russia, Australia, China, HongKong, Taiwan, Korea, Phillipines, Vietnam, Singapore,Thailand, Malaysia, Indonesia, and India
Constant
Log of total consolidated sales
Spread (vis-à-vis JPY, 3 months, April 2009, %)
Dummy for differeciated product (Rauch)
Dummy for top share goods
Share of exports to plants
Dummy for plant to export * Share of exports toplants
Share of exports to sales subsidiaries
Dummy for plant to export

46
Table 5-2. Determinants of Japanese yen invoicing in exports to Asian countries
Dependent variable: Share of Japanese yen invoicing in total exports from Japan to each destination country/regionMethod: OLS regression
Dependent variable (1) (2) (3) (4) (5) (6)-0.032*** -0.030*** -0.034*** -0.041*** -0.038*** -0.042***
(0.007) (0.007) (0.007) (0.008) (0.008) (0.008)0.063** 0.060** 0.067** 0.061** 0.059** 0.066**(0.030) (0.030) (0.029) (0.029) (0.029) (0.028)
0.350*** 0.354*** 0.350*** 0.405*** 0.407*** 0.399***(0.037) (0.036) (0.036) (0.048) (0.048) (0.047)-0.076 -0.052 -0.056 0.017 0.022 0.018(0.047) (0.047) (0.047) (0.047) (0.047) (0.047)
-0.279*** -0.275*** -0.281*** -0.245*** -0.247*** -0.253***(0.035) (0.035) (0.035) (0.035) (0.035) (0.034)
-0.159*** 0.069* 0.000 -0.175*** -0.126*** -0.056(0.034) (0.041) (0.045) (0.034) (0.042) (0.046)
-0.167*** 0.082 -0.102** 0.139*(0.042) (0.079) (0.043) (0.077)
-0.382*** -0.369***(0.102) (0.099)
Industry dummies No No No Yes Yes Yes0.764*** 0.735*** 0.776*** 0.940*** 0.881*** 0.917***(0.097) (0.097) (0.097) (0.123) (0.125) (0.125)
Observations 1,048 1,048 1,048 1,048 1,048 1,048Adj. R-squared 0.162 0.173 0.183 0.231 0.234 0.244
1) Estimated coefficient and its standard error, (in parentheses), are reported in each column.2) Asterisk(s), ***, **, and * mean that the estimated coeffcients are statistically significant at 1%, 5%, and 10%, respectively.
Destination: Asian countries (China, HongKong, Taiwan, Korea, Phillipines, Vietnam, Singapore, Thailand, Malaysia, Indonesia, and India)
Log of total consolidated sales
Dummy for plant to export * Share of exports toplants
Constant
Spread (vis-à-vis JPY, 3 months, April 2009, %)
Dummy for differeciated product (Rauch)
Dummy for top share goods
Share of exports to sales subsidiaries
Share of exports to plants
Dummy for plant to export

47
Table 5-3. Determinants of Japanese yen invoicing in exports to advanced economies
Dependent variable: Share of Japanese yen invoicing in total exports from Japan to each destination country/regionMethod: OLS regression
Dependent variable (1) (2) (3) (4) (5) (6)-0.020* -0.018 -0.018 -0.029** -0.027** -0.027**(0.012) (0.012) (0.012) (0.012) (0.013) (0.013)
1.223*** 1.270*** 1.263*** 1.278*** 1.316*** 1.318***(0.441) (0.441) (0.447) (0.442) (0.443) (0.449)
0.172*** 0.178*** 0.178*** 0.145* 0.152** 0.152**(0.057) (0.057) (0.057) (0.074) (0.074) (0.075)0.122* 0.134* 0.134* 0.171** 0.180** 0.180**(0.073) (0.073) (0.073) (0.075) (0.075) (0.075)
-0.292*** -0.292*** -0.292*** -0.299*** -0.298*** -0.298***(0.049) (0.049) (0.049) (0.051) (0.051) (0.051)
-0.191*** -0.157** -0.160** -0.261*** -0.230*** -0.230***(0.067) (0.071) (0.075) (0.073) (0.078) (0.082)
-0.131 -0.145 -0.107 -0.104(0.091) (0.155) (0.092) (0.155)
0.025 -0.003(0.219) (0.218)
Industry dummies No No No Yes Yes Yes0.412*** 0.381*** 0.382*** 0.631*** 0.591*** 0.591***(0.144) (0.146) (0.146) (0.185) (0.188) (0.188)
Observations 424 424 424 424 424 424Adj. R-squared 0.144 0.146 0.146 0.164 0.165 0.163
1) Estimated coefficient and its standard error, (in parentheses), are reported in each column.2) Asterisk(s), ***, **, and * mean that the estimated coeffcients are statistically significant at 1%, 5%, and 10%, respectively.
Share of exports to sales subsidiaries
Share of exports to plants
Dummy for plant to export
Dummy for plant to export * Share of exports toplants
Destination: Advanced economies (US, Canada, Euro zone, UK, and Australia)
Log of total consolidated sales
Spread (vis-à-vis JPY, 3 months, April 2009, %)
Dummy for differeciated product (Rauch)
Dummy for top share goods
Constant

48
Table 5-4. Determinants of local currency invoicing in exports to advanced economies
Dependent variable: Share of importer's currency invoicing in total exports from Japan to each destination country/regionMethod: OLS regression
Dependent variable (1) (2) (3) (4) (5) (6)0.008 0.006 0.006 0.015 0.014 0.014
(0.011) (0.011) (0.011) (0.012) (0.012) (0.012)-4.106*** -4.142*** -4.124*** -4.150*** -4.175*** -4.164***
(0.430) (0.431) (0.436) (0.429) (0.431) (0.437)-0.029 -0.033 -0.032 -0.029 -0.033 -0.033(0.055) (0.055) (0.055) (0.072) (0.072) (0.072)
-0.151** -0.159** -0.160** -0.157** -0.162** -0.163**(0.071) (0.071) (0.071) (0.072) (0.073) (0.073)
0.298*** 0.298*** 0.297*** 0.323*** 0.323*** 0.323***(0.048) (0.048) (0.048) (0.049) (0.049) (0.049)
0.212*** 0.189*** 0.195*** 0.265*** 0.246*** 0.250***(0.065) (0.069) (0.072) (0.070) (0.075) (0.078)
0.095 0.129 0.066 0.086(0.089) (0.151) (0.089) (0.151)
-0.059 -0.035(0.213) (0.211)
Industry dummies No No No Yes Yes Yes0.754*** 0.776*** 0.774*** 0.625*** 0.649*** 0.648***(0.140) (0.142) (0.142) (0.179) (0.182) (0.182)
Observations 426 426 426 426 426 426Adj. R-squared 0.307 0.307 0.306 0.329 0.329 0.327
1) Estimated coefficient and its standard error, (in parentheses), are reported in each column.2) Asterisk(s), ***, **, and * mean that the estimated coeffcients are statistically significant at 1%, 5%, and 10%, respectively.
Destination: Advanced economies (US, Canada, Euro zone, UK, and Australia)
Log of total consolidated sales
Spread (vis-à-vis JPY, 3 months, April 2009, %)
Dummy for differeciated product (Rauch)
Dummy for top share goods
Share of exports to sales subsidiaries
Share of exports to plants
Dummy for plant to export
Dummy for plant to export * Share of exports toplants
Constant

49
Figure 4-1. Share of Japanese yen invoicing by destination
0.0
20.0
40.0
60.0
80.0
100.0US
Canada
Mexico
Brazil
Central&Latin Americas
UK
Euro Area
Russia
East European countries
African countries
AustraliaNew Zealand
ChinaHong Kong
Taiwan
Korea
Singapore
Malaysia
Thailand
Indonesia
Philipines
Vietnam
India
Mid-East Asian countries
Share of Japanese Yen InvoicingAll firms Large firms Small firms
Source: 2009 RIETI Survey

50
Figure 4-2. Share of inter-firm trade by destination
0.0
20.0
40.0
60.0
80.0
100.0US
Canada
Mexico
Brazil
Central&Latin Americas
UK
Euro Area
Russia
East European countries
African countries
Australia
New ZealandChina
Hong Kong
Taiwan
Korea
Singapore
Malaysia
Thailand
Indonesia
Philipines
Vietnam
India
Mid-East Asian countries
Share of Inter-firm TradeAll firms Large firms Small firms
Source: 2009 RIETI Survey

51
Figure 4-4. Most frequently used currency in exports from Japan to Advanced economies (US,
Canada, UK, Euro zone, and Australia)
22.6
15.3
49.1
59.0
46.7
64.2
70.2
33.3
30.128.6
0.0
10.0
20.0
30.0
40.0
50.0
60.0
70.0
80.0
To Subsidiaries(Plants) To Subsidiaries(Sales) To Local agencies Via trading companies To Others
Yen is main currency Importer's currency is main currency
%
Trade partner in export from Japan
Source: 2009 RIETI Survey

52
Figure 4-5. Most frequently used currency in exports from Japan to Asian countries
52.4
46.6
72.0
77.7
65.6
41.0
48.3
26.8
20.1
32.5
0.0
10.0
20.0
30.0
40.0
50.0
60.0
70.0
80.0
90.0
To Subsidiaries(Plants) To Subsidiaries(Sales) To Local agencies Via trading companies To Others
Yen is main currency US dollar is main currency
%
Trade partner in export from Japan
Source: 2009 RIETI Survey