culture of trust and division of labor · culture of trust and division of labor stephan meiery...
TRANSCRIPT
Culture of Trust and Division of Labor∗
Stephan Meier†
Matthew Stephenson‡
June 24, 2015
Abstract
Firms exhibit heterogeneity in size, productivity, and internal struc-ture, and this is true even within the same industry. Our paper pro-vides evidence of a link between an organization’s culture—specificallythe trust environment—and its level of specialization. We show ex-perimentally that exogenously imposed culture endogenously leads tovariation in organizational form. We prime trust and demonstrate thatthe level of trust within an organization affects division of labor andconsequently productivity. This evidence is consistent with a cross-country link between trust and the division of labor that we observein data from the European Social Survey.
JEL Classification: D03, D2, L2, Z1
Keywords: Trust, Culture, Organizational Structure, Division of Labor, Ex-periments
∗We thank Roberto Weber, Evan Rawley, Phanish Puranam, Ernst Fehr, Bruce Kogut,Ko Kuwabara, Ernesto Reuben, Marlo Raveendran and participants at various workshopsand conferences for very valuable comments.†Columbia University, Graduate School of Business, 710 Uris Hall, 3022 Broadway,
New York, NY 10027; [email protected]‡Columbia University, Graduate School of Business, 7F Uris Hall, 3022 Broadway, New
York, NY 10027; [email protected]
1

1 Introduction
Organizations differ in observed performance but they also differ internally;
for instance, in some organizations the division of labor is extensive while
in other it is not. And internal differences between firms can help account
for their performance differences, as when differing management practices
within an organization affect firm productivity. While it has been known
since Adam Smith that an organization’s internal structure, e.g. degree
of division of labor, may profoundly affect its productivity, the process by
which such structure evolves and is sustained is less understood. Part of this
internal form may be determined by the production characteristics of its in-
dustry, but there exist substantial differences in organizational structures
even within an industry (Almazan & Molina, 2005; Porter, 1979). Explain-
ing differences in firms’ organizational structures is an important aspect of
explaining differences in productivity differences.1
This paper investigates whether some of the difference in organizational
structure can be traced back to corporate culture. In particular, we argue
and show empirically that changing an organization’s level of trust affects
its division of labor and thus that exogenously imposed differences in cul-
ture endogenously lead to different organizational forms. Existing literature
suggests that corporate culture might play an important part in explain-
ing firms’ performance (e.g. Sørensen, 2002; Guiso et al., 2014) and that
trust is crucial for cooperation within organizations (e.g. Fehr & List, 2004;
Fehr et al., 1998). We want to extend those two strands of literature by
arguing that the trust dimension of corporate culture affects performance
through organizational structure, in particular the degree of division of la-
bor. Theoretically, a link between trust (culture) and the division of labor
(organizational structure) is evident when considering that the division of
labor is limited by coordination costs, one of which is “whether workers trust
1The organization of a firm has been argued to depend on many factors, includingstrategy (Chandler, 1990), technology (Woodward, 1965), and environment (Lawrence &Lorsch, 1967; Wan & Hoskisson, 2003). Additionally, factors such as identity (Kogut &Zander, 1996; Santos & Eisenhardt, 2005) social comparison (Nickerson & Zenger, 2008),and reciprocity (Akerlof, 1982; Fehr et al., 1998) can affect the organization and functionof firms.
2
each other” (Becker & Murphy, 1992, p. 303).
To provide some intuition on how trust affects the division of labor, con-
sider the example of a group of co-authors specializing in different sections
of a paper. This can be efficient because 1) the person doing the literature
review and write-up does not need to spend time decoding the proofs, re-
focusing, and/or physically going from the field to the computer lab; and
2) the writer has familiarized herself with relevant literature, major papers,
and authors to an extent beyond that of her co-authors.2 Meanwhile, her co-
authors have done the same mutatis mutandis. This efficiency has come at
the expense of, for instance, the writer’s ability to understand and improve
the proofs in the formal model that another co-author has been developing.
Division of labor thus imposes an evident cost, and in a case where the value
of the product is effectively the minimum effort in each subtask—so that a
paper with a thorough literature review but a non-functioning model is not
publishable—the cost can be great.
In light of such a cost we think the existence and sustainability of di-
vision of labor depend on whether the workers trust one another. Early
sociological writing on the division of labor observes that “each in doing
his specialized task must trust that others will do certain things... and will
forbear from certain other things” (Ross, 1896, p. 525). In the absence
of trust, workers can lose efficiency switching between tasks, thereby “de-
specializing” the group.3 An East Asian engineering manager, describing
team-based construction work, makes this process clear: “Those that can’t
trust... end up doing everything themselves” (Girmscheid & Brockmann,
2009, p. 357). Another evocative example set in a firm comes from manage-
ment guru Stephen Covey, who describes a circumstance in which a division
he managed depended on another division to help meet a customer’s needs.
Because Covey believed that the other division had a bad reputation, he
2These efficiencies are adapted from Smith & Nicholson (1887), which we will returnto in Section 2.
3That is to say that trust affects task allocation. We focus here on “endogenous” taskallocation by measuring actual effort provision in tasks, though delegation-based taskallocation is also very important and plausibly affected by trust. For a review of thesefoundational concepts, see Puranam et al. (2014)
3
opted to take the “easy but expensive way out” by doing everything within
his division, “creat(ing) our own redundant systems”. He added that “the
whole organization was taxed for it in terms of the time and effort we had to
put into something that should have been done by somebody else” (Covey,
2006, p. 264).4
The question of the impact of trust on the division of labor is difficult to
study empirically since, first, data on trust levels within a large number of
firms and their degrees of division of labor is difficult to obtain. Second and
more importantly, a correlation between trust and division of labor could be
due to omitted variables, e.g. the management team puts in place structure
or institutions that affect both trust levels and division of labor. Reverse
causality, i.e. the organizational structure affecting trust levels, makes it
almost impossible to interpret a correlation between trust and division of
labor as causal. Due to this problem, we provide two types of complementary
evidence for the link between trust and division of labor. The main evidence
comes from a laboratory experiment that establishes a causal effect between
trust and division of labor.5 We also use cross-country evidence to establish
a correlation between trust and division of labor.
In the laboratory experiment, individuals engage in a productive en-
terprise in groups of three and they are given the ability to alter how they
divide labor among specialist and generalist task allocations. Performance is
compensated at the group level, an arrangement “far more common than in-
dividual performance-based pay” within firms (Larkin et al., 2012, p. 1196).
For simplicity we also assume a minimum-effort production process in which
the group performance is the result of the least effort among the three tasks.
Individuals can all specialize on their own task and if they do they will be
maximally productive as a group. However, individuals are also given the
4Team sports presents another intuitive example: Dean Oliver, analyst for the NBA’sDenver Nuggets, notes that zone defense relies on “trust” that teammates will “cover theirown zones” (Oliver, 2004). As in Covey’s example, a coach may have specified high divisionof labor—with each player defending a specialized zone—but players and employees canalter their tasks to de-specialize the group.
5For experimental methods used in answering questions in organizational studies andstrategy, see Puranam et al. (2006), Camerer & Weber (2013), Croson et al. (2007),Chatterji et al. (2015).
4
ability to engage in a non-specialized task, which comes at a productivity
cost but also confers the advantage of ensuring that non-specialized task is
completed to some standard. This game effectively models the real world
division of labor situations we describe above, in which members of a team
can choose to “de-specialize” at a cost. Before the individuals engage in the
real effort task we randomly manipulate their level of trust, allowing us to
study whether exogenously changing a culture of trust endogenously creates
different levels of division of labor.
Our laboratory findings show a significant effect of exogenously imposed
trust on specialist behavior at the intensive and extensive margins. Specif-
ically, we find positive and significant effects of trust on the level of real-
ized specialization within a group, as well as the total performance of the
group. Exogenously changing the trust level across our organizations, i.e.
our groups of three, leads to the emergence of different forms of working
together, i.e. extent of division of labor. We find that even exogenously
imposed trust levels can minimize uncertainty about other co-workers. Fur-
thermore, by repeating this experiment with feedback, we observe that these
effects intensify over time, with high-trust groups increasing in specialization
over time.
Cross-country evidence, using data from the European Social Survey,
supports this finding in that the level of generalized trust within a country
corresponds to a higher level of specialization within that country’s indus-
tries. The correlation between our proxy of division of labor—a measure of
specialized job descriptions within a country’s industries—and generalized
trust is robust to economic controls and country and time fixed effects. We
also instrument for trust using the measure ”feeling of safety” and find re-
sults consistent with the cross-country evidence. While the evidence is not
interpreted as causal, it supports the experimental evidence by showing that
trust level is correlated to the division of labor in observational data.
Our paper makes at least three important contributions to the literature:
First, our paper contributes to the debate about the effect of culture
on organizational structure. A recent paper by Bloom et al. (2012) finds
5

that trust is associated with larger firm size and a flattening of hierarchical
structures within the firm. We test a distinct but complementary theory:
that trust affects the organization of production within firms, with higher-
trust environments endogenously producing more specialized task alloca-
tions. The trust environment within a firm is an important feature of a
company’s culture (Kreps, 1990). Zanini (2007) observes that “the function
of corporate culture is to assure information for interactive partners...” and
under incomplete contracts this is the “strategic function of trust embedded
in the corporate culture of the firm.” We find that a culture of trust can help
a firm to facilitate a stable division of labor. In particular, we show that
initial differences in trust level can endogenously lead to different degrees of
specialization within an organization. These initial differences are important
for three reasons: 1) Firm structure is inertial (Nelson, 1991), so the early
structure of an organization remains important even as a firm grows in size,
2) A firm’s culture is formed early and is difficult to change (Schein, 2010),
and 3) Trust only increases by a small amount as a function of relation-
ship duration, so the existence of relationships among individuals within a
firm does not by itself impact trust substantially over time (Vanneste et al.,
2013).
Second and related to the first contribution, our paper can shed light on
a mechanism explaining the relationship between trust and growth. Trust
levels within a country have been thought to affect a number of economic
variables, most notably growth. A number of studies show a significant
correlation between trust and economic growth (e.g., Knack & Keefer (1997);
Algan & Cahuc (2010)). However, the precise mechanism through which
trust affects growth is still an open question. Our evidence shows that a
potential mechanism for the relationship between trust and growth is the
organization of firms. If trust affects the division of labor as we observe
in our study, and the division of labor affects the “wealth of nations”, this
illuminates a plausible mechanism that links trust to growth: organizational
structure.
Third, we contribute to the literature on the relationship between trust
and economic behavior. There exists significant (mostly experimental) work
6

on the ways in which institutions and organizational forms causally foster
the trusting and trustworthy behavior of individuals (Glaeser et al. (2000);
Fershtman & Gneezy (2001); Bohnet et al. (2008); Falk & Zehnder (2013)).
Our contribution lies in studying the converse of this research: addressing
the manner in which individual’s trust-levels causally impact institutions
and organizational forms. The only other paper that we are aware of that
studies the causal effect of trust on economic behavior is Bartling et al.
(2013). This paper applies a very similar manipulation of high and low trust
to the one we use, but investigates the role of trust and trustworthiness in
inducing high and low effort equilibria in a gift exchange game, whereas we
study the role of trust in the division of labor.
The paper proceeds as follows: Section 2 discusses concepts used within
the paper and includes a model of the effects of trust on specialization. Sec-
tion 3 presents evidence from cross-country data on the relationship between
generalized trust and division of labor. Section 4 introduces the experimen-
tal design and the results of the experiment are exhibited in Section 5.
Section 6 provides concluding thoughts and suggestions for further research.
2 Conceptual Considerations
The division of labor is thought to be paramount in accounting for the
productivity of organizations going back to Adam Smith. However, the
process by which the division of labor emerges has received, to the best of our
knowledge, limited prior attention in the scholarly literature.6 Raveendran
et al. (2015) constitutes a rare recent exception, focusing on factors that
precipitate and sustain the division of labor.
Below we present a simple game theoretic model that illustrates how
trust can affect division of labor. It shows that, in the presence of gains from
6Vernon Smith and coauthors have several important experimental papers that in-vestigate aspects of the division of labor. They explore the role of specialization in theformation of long-distance trade under different institutional environments (Kimbroughet al., 2008), the discovery and emergence of specialization (Crockett et al., 2009), and theemergence of property rights due to specialization and gains from exchange Kimbroughet al. (2010).
7
specialization, trust makes division of labor more likely. Increasing trust also
increases the payoff from specialization, as well the “risk dominance” profile
of choosing to specialize vs. generalize.
Gains to Specialization
In order to analyze the division of labor, let there exist some set of tasks
y∈{y1,...,yn} divided among N workers. Ri is a switching variable denoting
the number of tasks a worker engages in, Ri ∈{1,...,N}. Thus if there are
two workers who work on all tasks in y, then Ri=N=2 whereas if they divide
the tasks with no overlap Ri=1. Effort for a worker i in task k is eik and
their production in task k is as follows:
yik =eikRαi
Where α is a constant that determines the productivity effects of special-
ization. Smith’s classical treatment of gains from specialization identified
distinct efficiencies that come with division of labor: saving on switching
costs and the increase in skill that comes from repeating a task (1887).7
Arrow (1962) refers to this as “learning by doing”. Recognizing these effi-
ciencies, we focus on the “gains from specialization” case in which α>1.8 In
such a case, with fixed effort and two or more workers, individual productive
output is decreasing in the number of tasks worked on, reflecting decreased
switching costs and/or learning by doing. Under fully divided labor with
no task overlap, overall productivity for worker i is∑k
yik=ei whereas full
generalization gives∑k
yik=eiR1−αi < ei , ∀ R >1.
Note that α is not specialization but rather the productive benefits that
accrue to specialization, benefits that vary by the productive technology
available in a given industry for instance.
It is useful here to restrict attention to a simple case of two workers
7Smith identifies a third efficiency—the creation of productive tools—but this is outsidethe scope of our paper.
8Observe that with α = 1 there would be no productivity losses from switching tasks.
8

and two tasks. We follow Becker & Murphy (1992)’s paper on the divi-
sion of labor and specify a “minimum effort” production technology. Out-
put Y is thus equal to the minimum production in either of the two tasks:
Y=min((y11+y21), (y12+y22)). That is, productivity is equal to either the
sum of worker 1 and worker 2’s production in task y1 or the sum of worker
1 and worker 2’s production in task y2, whichever is less. Payoffs are then
split equally between the workers, and effort and task-allocation are non-
contractible, so that πi=Y (yik)N .
Trust
Having introduced a set of tasks with production benefits from greater divi-
sion of labor, we will now consider the effect of trust. Trust is a notoriously
hard concept to define, but within the existing definitions there appears to
be a convergence on the role of belief as an important element. Gambetta
(2000) summarizes an inter-disciplinary consensus as follows: trust is the
“subjective probability with which an agent assesses that another agent or
group of agents will perform a particular action, both before he can monitor
such action and in a context in which it affects his own action.” Benabou &
Tirole (2003) propose that, in a productive context, a trusting belief can be
thought of as one that regards the other’s “cost or pleasure of accomplishing
the task” (p. 494).9 Following this, we define trust as a probabilistic belief
about another agent’s incentive problem.
With respect to the productive tasks defined above, suppose that there
exist two types of workers who differ only in effort provision for these tasks,
type θi = θ sets ei=1 while θi = θ sets ei=0 in all cases. Effort is thus “all
or none” and these types, respectively, are workers who find it profitable
to exert effort given the potential payoffs or not at all.10 Workers have a
trust parameter, a common prior θ=(0,1) about the probability of a worker
9The “trust effect” in their model is about perceived incentive problems, which con-trasts with a “profitability effect” regarding worker ability. We do not treat the profitabil-ity effect here.
10We will consider this assumption explicitly in Appendix D. Relaxing it does not sub-stantively impact our conclusions.
9
being type θ. They also know their own type θi with certainty. The risk-
neutral worker then sets a level of specialization based on the level of trust
and their type, choosing Ri|(θ , θi) to maximize their expected payoffs in a
simultaneous move game between workers.
Suppose that worker 1 is of type θ.11 To see what values of θ produce
a specializing (R=1) equilibrium, we check for profitable deviations by fix-
ing worker 2 ’s decision as being full specialization (R2=1) with y22=θ and
y21=0.12 This produces payoffs as follows:
π1(R1) =Y (R1)
N= min
((y11 | R1) , (y12 | R1) + θ
)N−1
Because worker 1, as type θ, sets e=1 and worker 2 sets e=1 with prob-
ability θ, we can omit the subscripts on e. R is a discrete choice variable
that can equal 1 or 2 in the two-person case, so we have:
π1(R1) =
min ( e , θe )N−1 = θeN if R1 = 1
min(e2α ,
e2α + θe
)N−1= e
2αN if R1 = 2
Worker 1 will not find it profitable to deviate from R=1 if θe ≥ e2α . By
symmetry, this is also the case for worker 2. Thus we can see then that the
existence of equilibrium specialization benefits from increasing both gains
from specialization (α) and trust (θ). Treating α as fixed by a technol-
ogy, at a sufficient level of trust specializing constitutes a Bayesian Nash
Equilibrium in pure strategies.
Under what conditions is generalizing an equilibrium? Now suppose that
worker 2 fully generalizes (R2 = 2, y21 = y22 = θe2α ) and we thus check worker
1’s incentive to deviate:
11A worker of type θ is indifferent in the choice of tasks so for simplicity we assume theyfollow the same decision rule as θ.
12We are here assuming that the “task coordination” problem is solved. Includingproblems of task coordination makes specialization less profitable and this is discussed inAppendix D.
10
π1(R1) =
min(e+ θe
2α ,θe2α
)N−1 = θe
2αN if R1 = 1
min(e(1+θ)
2α , e(1+θ)2α
)N−1 = e(1+θ)
2αN if R1 = 2
Generalizing is always an equilibrium since e(1+θ)≥θe → e≥0 and ei≥0
∀ i . If trust is low (θe ≤ e2α ) and θi=θ then generalizing constitutes the
unique equilibrium.13 With the level of trust greater than or equal to e2α we
have multiple equilibria, one in which both specialize and one in which both
generalize.
Trust and organizational form
At a level of trust such that two organizational forms are feasible (θe≥ e2α ), we
can say more about the equilibrium properties of these forms. Specializing
will payoff dominate generalizing only if θe> e(1+θ)2α → θ(2α − 1) > 1. The
relative payoff of the specialized form of organization is greater with more
gains the specialization α and trust θ.
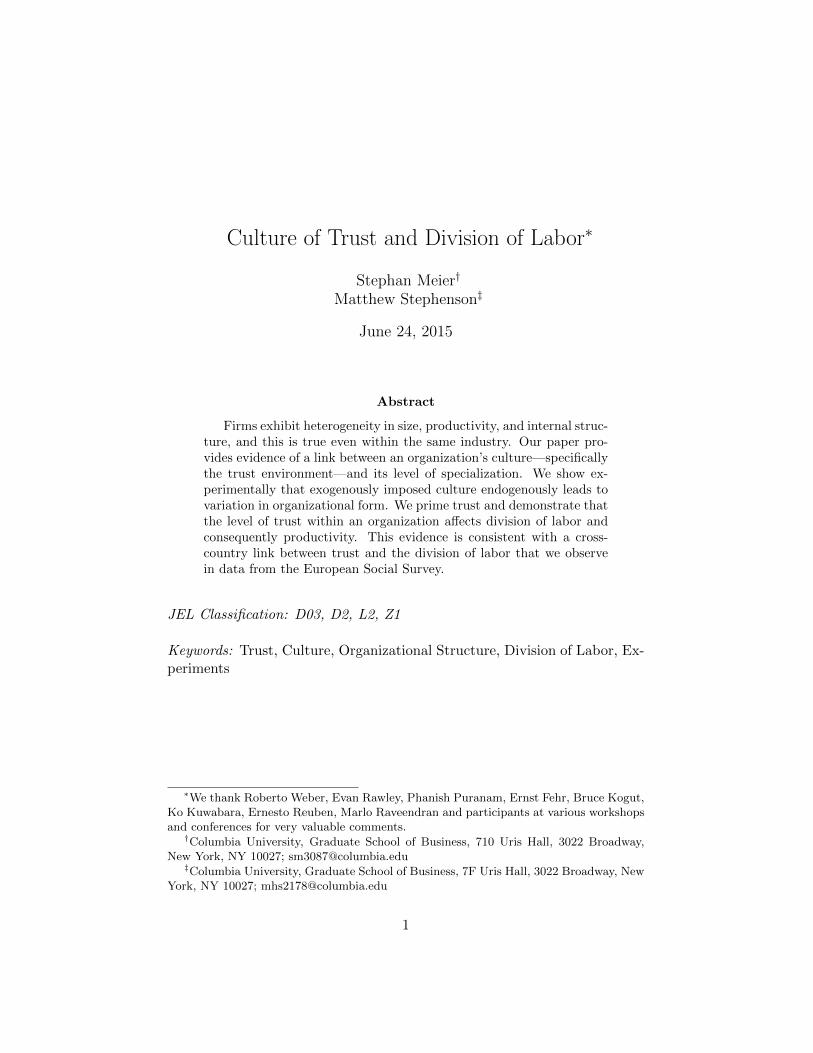
To clarify these relationships, Figure 1 displays a graph of the existence
and dominance properties of the specialization (R=1) equilibrium. Any
combination of values for trust and gains to specialization that lies above
the solid line creates a specializing equilibrium in the game. Specializing is
payoff dominant for values above the dashed line, and is risk dominant14 for
values above the dotted line. To observe the effect of trust on division of
labor, it is useful to pick a value for α, supposing a fixed production tech-
nology. With α=4/3, an individual’s productivity gains from specialization
are ≈25 percent for a constant level of effort.15 At this value of α, special-
ization is only an equilibrium if trust ≈ 0.4 or greater. Specialization is only
payoff dominant with trust greater than ≈ 0.7, and generalizing always risk
dominates regardless of the level of trust.
13For θi=θ, all choices of R produce Nash Equilibria, since they exert no effort anddon’t affect payoffs. This is a less interesting case.
14It is risk dominant if it provides a higher payoff on the assumption that the opponentcompletely randomizes. In this case, that means θ > 2
2α−1.
15Recall from earlier that overall productivity under generalization is eiR1−αi while
productivity under specialization is ei.
11
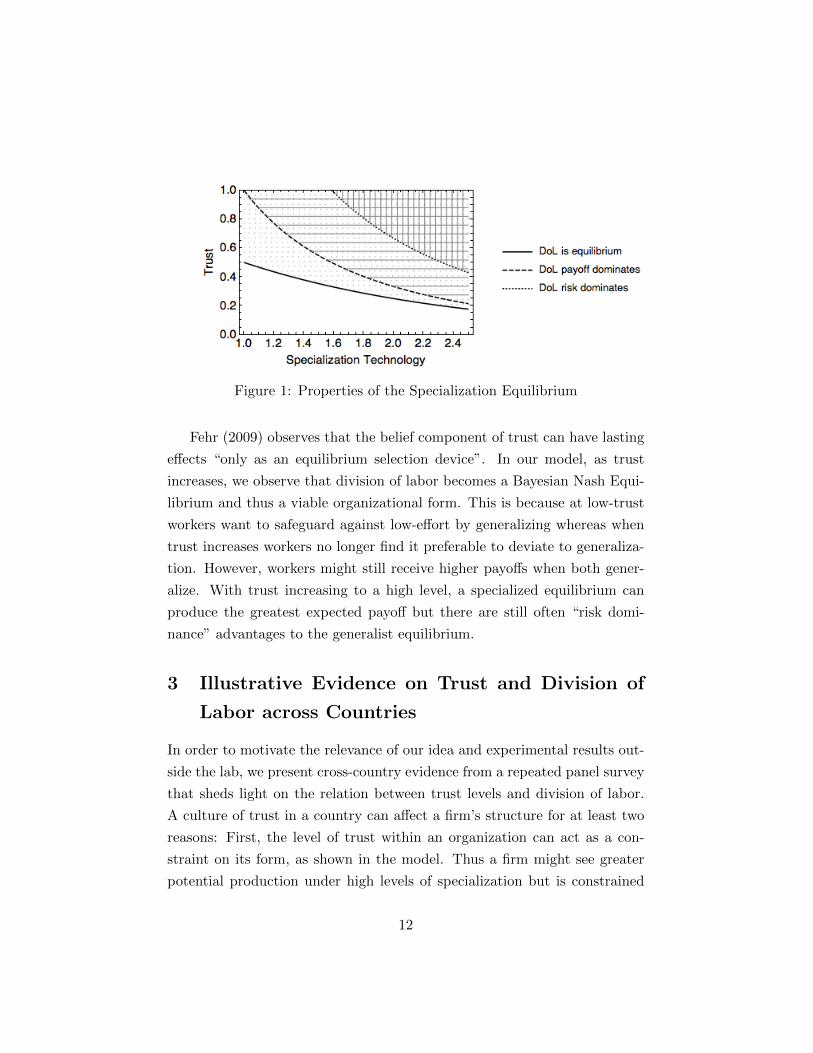
Figure 1: Properties of the Specialization Equilibrium
Fehr (2009) observes that the belief component of trust can have lasting
effects “only as an equilibrium selection device”. In our model, as trust
increases, we observe that division of labor becomes a Bayesian Nash Equi-
librium and thus a viable organizational form. This is because at low-trust
workers want to safeguard against low-effort by generalizing whereas when
trust increases workers no longer find it preferable to deviate to generaliza-
tion. However, workers might still receive higher payoffs when both gener-
alize. With trust increasing to a high level, a specialized equilibrium can
produce the greatest expected payoff but there are still often “risk domi-
nance” advantages to the generalist equilibrium.
3 Illustrative Evidence on Trust and Division of
Labor across Countries
In order to motivate the relevance of our idea and experimental results out-
side the lab, we present cross-country evidence from a repeated panel survey
that sheds light on the relation between trust levels and division of labor.
A culture of trust in a country can affect a firm’s structure for at least two
reasons: First, the level of trust within an organization can act as a con-
straint on its form, as shown in the model. Thus a firm might see greater
potential production under high levels of specialization but is constrained
12
by the trust environment that makes such an arrangement unstable. Hence
we have a within-country hypothesis suggesting that the division of labor
will respond to changes in trust. The model suggests that this effect should
be observed at a given specialization technology, and thus industry-level ob-
servations are relevant. Secondly, the nascent structure of a firm is often
team-production (Alchian & Demsetz, 1972) and, because firm structure is
inertial and resistant to change (Nelson, 1991), trust’s effects on division of
labor could be expected to persist. Thus we would predict a cross-sectional
correlation between trust and the division of labor. While we find support
for both hypotheses, controlling for time-invariant factors on the country
level and instrumenting for trust, we consider the evidence correlational
and suggestive. We therefore couple these findings with our experimental
evidence investigating the causal effect of trust on division of labor. Nev-
ertheless, the evidence provided in this section resembles evidence on trust
and growth (Knack & Keefer, 1997; Algan & Cahuc, 2010) and we see it as
a complementary illustration to our experimental evidence.
Data sets: We draw on data from the European Social Survey (ESS) for
the available years of 2002-2012. The range provides 217,250 individual ob-
servations drawn from 35 countries.16 We then pair this data with country-
level economic measures from the Penn World Tables (Feenstra et al., 2013).
Proxy for division of labor: We exploit a unique feature of the data in the
European Social Survey (ESS) to construct a measure of division of labor.
The ESS contains classifications for both an individual’s occupation as well
as the industry in which they are employed, using the International Standard
Classification of Occupations (ISCO-88) and Nomenclature of Economic Ac-
tivity (NACE) codes respectively. Within our sample we have 492 unique
ISCO-classified occupations and 91 NACE-classified industries. Using this
data we use an idea from Gibbs & Poston (1975) and construct an index of
16Austria, Belgium, Bulgaria, Croatia, Cyprus, Czech Republic, Denmark, Estonia, Fin-land, France, Germany, Greece, Hungary, Iceland, Ireland, Israel, Italy, Kosovo, Latvia,Lithuania, Luxembourg, Netherlands, Norway, Poland, Portugal, Romania, Russian Fed-eration, Slovakia, Slovenia, Spain, Sweden, Switzerland, Turkey, Ukraine, and the UnitedKingdom.
13
division of labor, d, for each industry j within a country from this data as
follows (for more details, see Appendix A):
dj =
∑ni=1 x
2ij
(∑n
i=1 xij)2
Where n is the number of possible occupations and xi is the number
of individuals in a given occupation i. This form is maximized when x is
constant for all i, suggesting a uniform distribution of individuals among the
possible occupations within an industry. If we suppose that each possible
occupation within an industry is a “bucket” which can be filled by employees,
d measures how levelly those buckets are filled within a country’s given
industry. As described above, our division of labor index d is computed
for each year within a domestic industry. That is, within a country, each
industry has a unique division of labor score for a given year of the ESS.
To provide intuition on this measure, consider the forestry industry in
Greece and Finland. These countries differ substantially in generalized trust,
with Finland having a high average and Greece a low one. We also observe
that Greece and Finland have different occupational structures within their
forestry industries: a majority (61 percent) of Greek forestry workers classify
their occupation as “manufacturing laborer”, a classification which denotes
no obvious specialized skill. Compare this with Finland, in which there are
no observed “manufacturing laborers” but instead there are “wood process-
ing plant operators”, “wood products machine operators”, “wood treaters”,
“woodworking machine setters”, “motorized forestry plant operators”, “lift-
ing truck operators” and so on.17 Moreover, these occupations are flatly
distributed in the Finnish sample and no clear majority occupation is evi-
dent. As we would expect, these observations are reflected in the industry d
score, within Finland’s forestry industry being much higher than Greece’s.
We maintain that the differentiation of skills and specific tasks form the
17In principle using more specific job titles could be explained by the hypothesis thattrust increases the thoroughness of the ESS survey and thereby results in more specificanswers. However a spearman correlation finds no evidence for a link between interviewtime and trust (p=0.769).
14

basis on which a worker chooses to either classify themselves as a general
laborer or a machine operator.18 Thus our measure d captures an element
of division of labor within industries.
Trust measure: The ESS includes a measure of trust. It is based on the
question “Generally speaking would you say that most people can be trusted
or that you need to be very careful in dealing with people”. Responders pro-
vide an answer on a 10-point scale with the lowest category being “You can’t
be too careful” and the highest “Most people can be trusted”. The mean re-
sponse to the generalized trust question in our sample is 4.83 with a standard
deviation (s.d.) of 0.986, and a range of 2.7-6.9.19 Sapienza et al. (2013)
note that the “trust in strangers” survey question that we use is most rele-
vant to beliefs within a laboratory, rather than preferences. McEvily et al.
(2012) find that, when the “target of trust” is a stranger, surveyed measures
of trust do correlate with trusting behavior in a controlled environment.
Because our model and experiment treats an interaction among strangers
in a productive context, these surveyed measures of trust (and production
activities) are relevant.
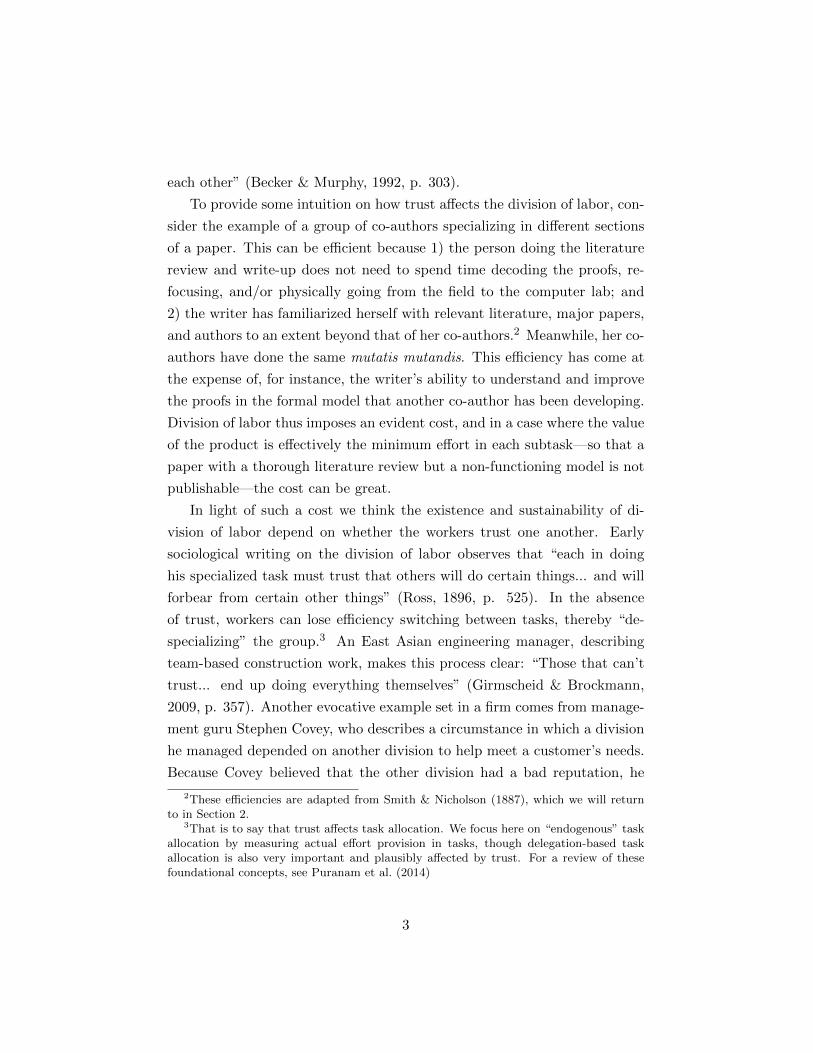
Results: We evaluate the relationship between the division of labor and
trust using the measures described above. Figure 2 displays the results for
the aggregated d scores plotted against generalized trust at the country
level with a linear fit line projected on the data. Trust and d are positively
correlated (p<.01)20 and indicating that an increase of one s.d. in measured
trust results in a .45 s.d. increase in the observed d -score.
In Table 1 we explore the robustness of the association between trust
and division of labor by making use of the panel structure of our data and
fitting several models with a variety of controls. The specification controls
for growth as well as population size, trade openness, and capital investment
which are variables commonly used to explain growth. We also include
18So a worker charged with the task of treating the wood, driving the truck, and settingthe machine for operation should be more apt to describe their occupation in generalterms (“laborer”) than a worker whose entire job consists of treating wood.
19These statistics are reported at the country level.20Results in this section are from a OLS regressions unless otherwise specified.
15

Figure 2: Trust and Division of Labor
Note: Data taken from European Social Survey and measures averaged acrosscountries from 2002-2012. Plot omits graphical outliers Cyprus (CY), Israel (IS),and Kosovo (XK). These countries are not omitted from the statistical analysis.
16
controls plausibly related to division of labor: the number of industries in a
country, number of individuals self-employed, and number of family firms.
We instrument for trust using the ”feeling of safety after dark”21, a measure
that should only affect the division of labor through its effect on trust.
Column 1 reports results on a model which considers the smallest unit
of analysis given our data: the yearly domestic industry. Column 2 reports
results at the country level, pooling industries within countries and years,
and this exhibits a similar coefficient on trust. In columns 3 and 4 we re-
port the same specifications but using controls. In both specifications we
find a similarly significant and positive relationship between trust and the
division of labor with roughly similar effect sizes. In columns 5 and 6 we
add time and group level fixed effects and, while the industry-level specifi-
cation remains significant, the country-level specification is only significant
at the 10 percent level. Thus the result is largely robust to controlling for
time-invariant effects. Columns 7 and 8 display the results of a two stage
least squares regression, with column 7 reporting the first stage results and
column 8 reporting the results with instrumented trust. We use the ESS
survey measure ”feeling of safety” as in instrument for trust (F<0.01). This
instrument helps alleviate concerns about endogeniety, and the coefficient is
significant and similar in size to the other results.
In sum, we observe that trust is positively and significantly associated
with the division of labor within the ESS dataset. This finding is not simply
due to time-invariant country and country-industry factors, and a plausible
instrument helps to rule out questions of reverse causality. Prominent re-
search on trust and organizations treats the level of trust within a region as
being primarily determined by historical particulars and thus “largely exoge-
nous” with respect to the organization of firms (Bloom et al. 2012a). Trust
has been found to depend on weather conditions (Durante 2010), past liter-
acy rates and institutions (Tabellini, 2008) and “crucial events in city-states
during the medieval period and earlier” (Guiso et al., 2008, cited in Bloom
et al. 2012) Nevertheless, we are sensitive to the possibility of endogeneity
21”How safe do you - or would you - feel walking alone in [your neighborhood] afterdark?”, surveyed on a scale from 0-5.
17

Tab
le1:
Tru
stan
dth
eD
ivis
ion
ofL
abor
inth
eE
SS
Dat
ase
t
(1)
(2)
(3)
(4)
(5)
(6)
(7)
(8)
Dep
end
ent
Var
iab
led
dd
dd
dT
rust
d
Tru
st0.
0782**
*0.
0683
**0.
109*
**0.
0639
**0.
105*
**0.
179
*0.
071
3**
(0.0
125)
(0.0
310)
(0.0
161)
(0.0
287)
(0.0
143)
(0.0
983
)(0
.033
9)F
eeli
ng
of
Saf
ety
0.228
***
(0.0
0840
)C
on
stant
0.58
5***
0.72
4***
0.20
30.
497*
**0.
512
0.9
47
0.355
***
0.2
47*
*(0
.0199)
(0.0
515)
(0.1
34)
(0.1
76)
(1.3
77)
(1.3
02)
(0.1
22)
(0.1
16)
Contr
ols
NN
YY
YY
YY
Fix
edeff
ects
NN
NN
YY
NN
Ob
serv
atio
ns
9,12
315
06,
406
110
6,40
611
06,
406
6,4
06
R-s
qu
ared
0.0
090.
092
0.03
10.
433
0.01
50.2
86
0.162
0.0
29
Note
:D
ata
from
the
Eu
rop
ean
Soci
alS
urv
ey,
2002-2
012.
Res
ult
sfr
om
an
OL
Sm
ult
iple
regre
ssio
n,
rob
ust
erro
rsin
par
enth
eses
,cl
ust
ered
atth
ed
omes
tic
ind
ust
ry(1
,3,5
,7)
an
dco
untr
y(2
,4,6
)le
vels
.C
ontr
ol
vari
ab
les
are
pop
ula
tion
size
,tr
ade
open
nes
s,ca
pit
alin
vest
men
t,th
enu
mb
erof
ind
ust
ries
ina
cou
ntr
y,num
ber
of
ind
ivid
uals
self
-em
plo
yed
,an
dnu
mb
erof
fam
ily
firm
s.A
llin
dep
end
ent
vari
able
sin
logs.
Colu
mn
7re
port
sth
efi
rst
stage
of
two-s
tage
least
squ
are
sre
gre
ssio
nin
stru
men
tin
gT
rust
wit
h”F
eeli
ng
ofS
afet
y”,
an
dco
lum
n8
rep
ort
sth
ese
con
dst
age
wit
hin
stru
men
ted
tru
st.
Fix
edeff
ects
are
tim
ean
dgr
oup
-lev
el:
dom
esti
cin
du
stry
(5)
an
dco
untr
y(6
).C
han
ge
inob
serv
ati
on
isd
ue
tole
vel
of
analy
sis
an
dso
me
mis
sin
gd
ata
for
the
contr
olva
riab
les.
***
p<
0.01,
**
p<
0.0
5,
*p<
0.1
18
given our sample and we prefer to present the results as correlational. We
believe that the findings are suggestive and point to external validity for our
experiment demonstrating a causal effect of trust on division of labor.
4 Experimental Design
To test whether the level of trust in an organization causally affects division
of labor, we need (1) a task that measures the extent of specialization and
(2) a way to randomly assign individuals/teams into high or low trust envi-
ronments. We will describe the operationalization of our experiment in turn.
Full instructions were available for participants to read and were read aloud
prior to the experiment. These instructions are presented in Appendix B.
4.1 Task
We sought to devise an experimental game that could approximate the feel-
ing of an actual work environment, leading us to use a real-effort task in
continuous time. Our design attempts to capture the process of specializa-
tion in our model, treating distinct complementary tasks under “minimal
effort” production. However, because the division of labor can be driven
by heterogenous skills among a group, as well as beliefs about such skills,
it was important to use a design in which individuals have similar levels of
potential productivity while allowing for different levels of actual productiv-
ity within the game. That is to say, we did not want individuals switching
to a different task simply because they thought they would be more skilled
at it. To avoid these pitfalls, our design uses the same simple task for all
subjects. The interdependence of the tasks comes from the payoff structure
and we model specialization by imposing costs of switching between tasks
(so α > 1).
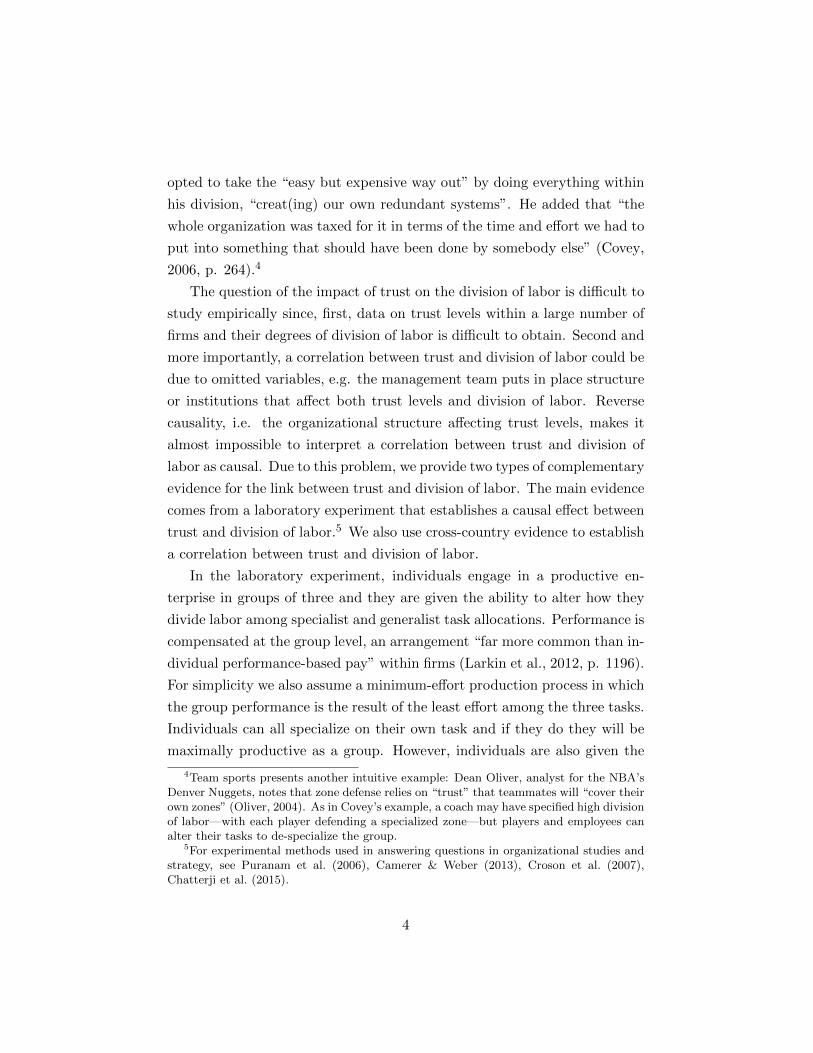
The task is to clear blocks in a 20x20 grid (see Figure 3 for a screenshot)
via simple clicking, with a 9 second enforced delay between clicks. We expect
that all students should have a similar ability in clicking. However, they may
have a different utilities of effort as is considered in our model.
19

Figure 3: Clicking Task
20
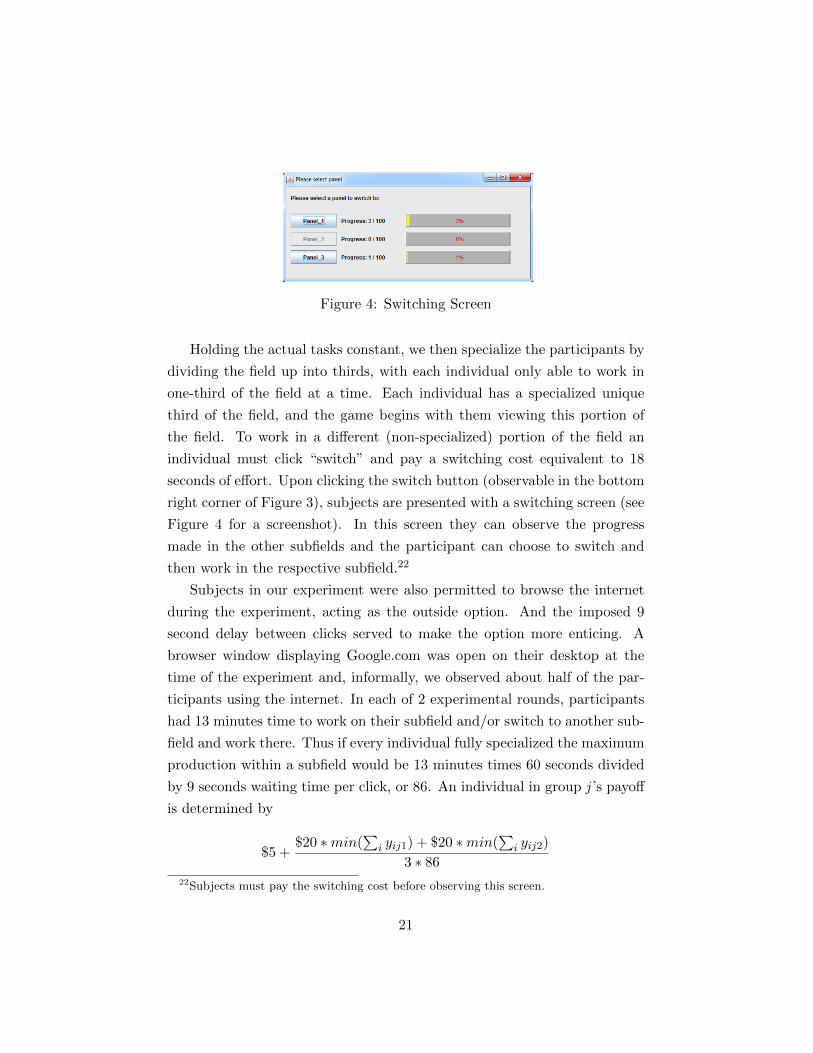
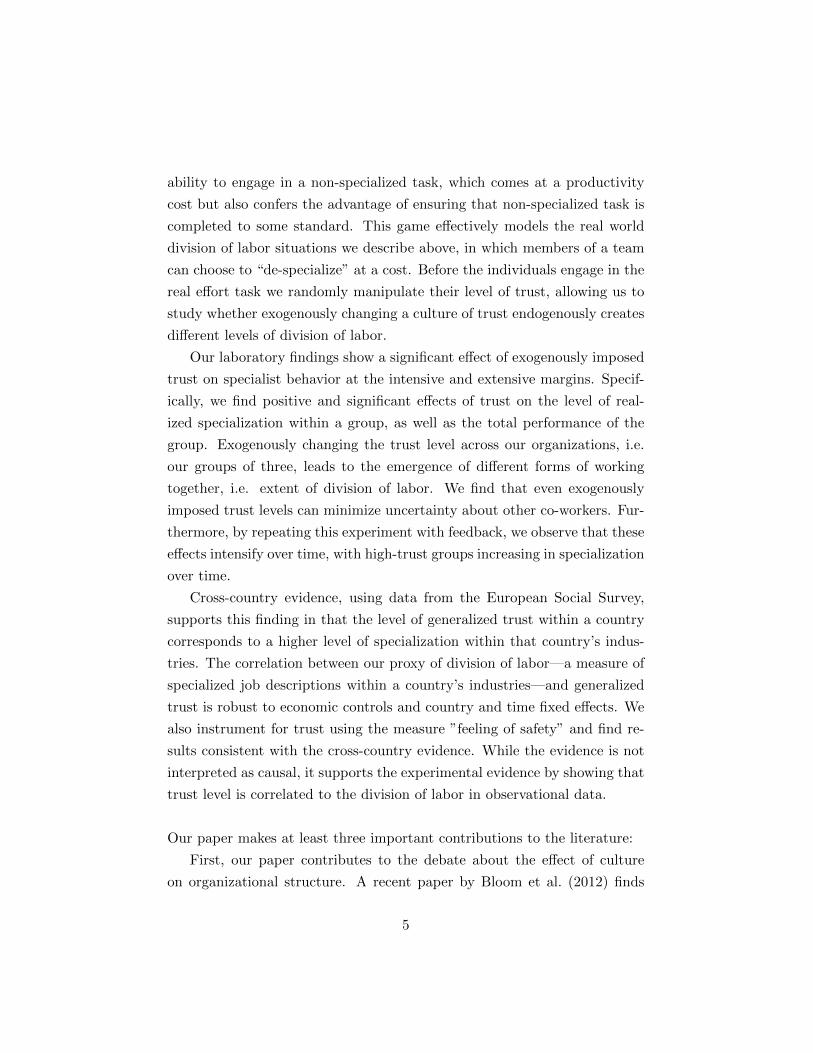
Figure 4: Switching Screen
Holding the actual tasks constant, we then specialize the participants by
dividing the field up into thirds, with each individual only able to work in
one-third of the field at a time. Each individual has a specialized unique
third of the field, and the game begins with them viewing this portion of
the field. To work in a different (non-specialized) portion of the field an
individual must click “switch” and pay a switching cost equivalent to 18
seconds of effort. Upon clicking the switch button (observable in the bottom
right corner of Figure 3), subjects are presented with a switching screen (see
Figure 4 for a screenshot). In this screen they can observe the progress
made in the other subfields and the participant can choose to switch and
then work in the respective subfield.22
Subjects in our experiment were also permitted to browse the internet
during the experiment, acting as the outside option. And the imposed 9
second delay between clicks served to make the option more enticing. A
browser window displaying Google.com was open on their desktop at the
time of the experiment and, informally, we observed about half of the par-
ticipants using the internet. In each of 2 experimental rounds, participants
had 13 minutes time to work on their subfield and/or switch to another sub-
field and work there. Thus if every individual fully specialized the maximum
production within a subfield would be 13 minutes times 60 seconds divided
by 9 seconds waiting time per click, or 86. An individual in group j ’s payoff
is determined by
$5 +$20 ∗min(
∑i yij1) + $20 ∗min(
∑i yij2)
3 ∗ 8622Subjects must pay the switching cost before observing this screen.
21
This payoff includes a $5 show-up fee plus $20 times the minimum pro-
duction y within a subfield i in both round 1 and round 2. These round-
specific payoffs are then split evenly among the group (there are 3 people
per group and thus they are divided by 3) as well as normalized by the
maximum possible production (divided by 86). Thus the maximum payoff
within this game is just over $18 for each individual.
After Period 1, i.e. the first 13 minutes, subjects were given information
on the performance of their group. Subjects observed their group production
for the round—min(∑
i yij1)—and were reminded of the maximum number
of clicks (86) for context. They then repeated the task again in period 2
with the same group.
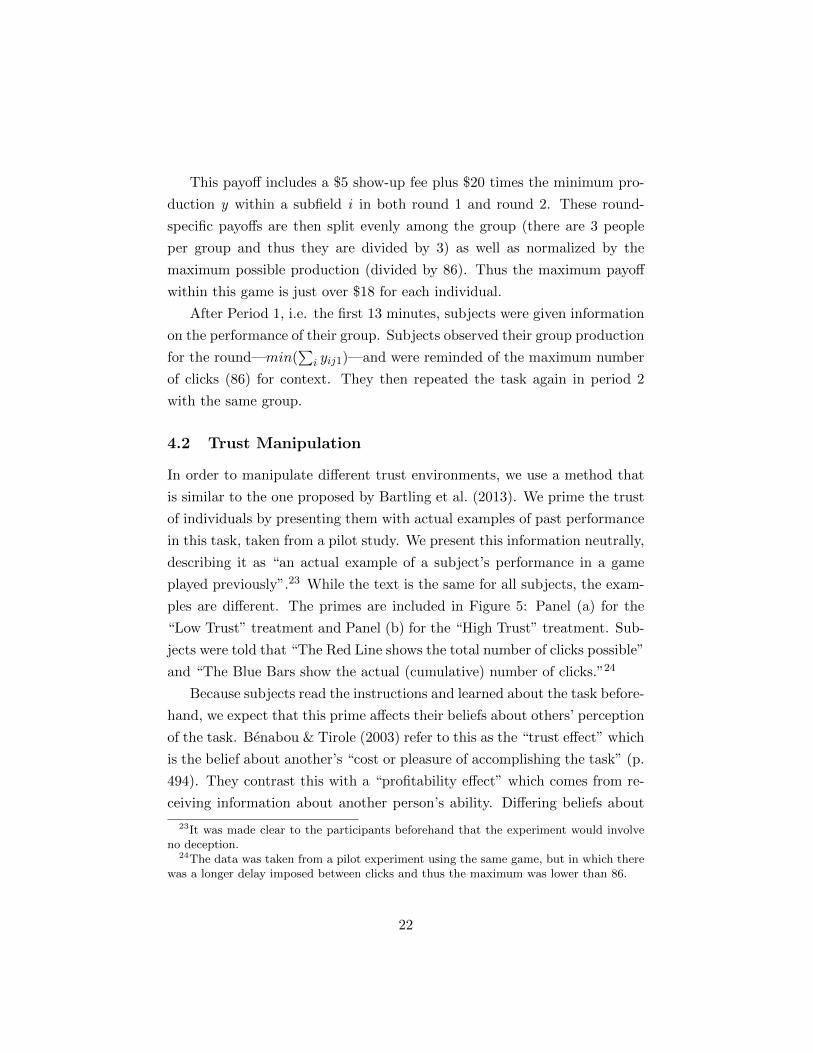
4.2 Trust Manipulation
In order to manipulate different trust environments, we use a method that
is similar to the one proposed by Bartling et al. (2013). We prime the trust
of individuals by presenting them with actual examples of past performance
in this task, taken from a pilot study. We present this information neutrally,
describing it as “an actual example of a subject’s performance in a game
played previously”.23 While the text is the same for all subjects, the exam-
ples are different. The primes are included in Figure 5: Panel (a) for the
“Low Trust” treatment and Panel (b) for the “High Trust” treatment. Sub-
jects were told that “The Red Line shows the total number of clicks possible”
and “The Blue Bars show the actual (cumulative) number of clicks.”24
Because subjects read the instructions and learned about the task before-
hand, we expect that this prime affects their beliefs about others’ perception
of the task. Benabou & Tirole (2003) refer to this as the “trust effect” which
is the belief about another’s “cost or pleasure of accomplishing the task” (p.
494). They contrast this with a “profitability effect” which comes from re-
ceiving information about another person’s ability. Differing beliefs about
23It was made clear to the participants beforehand that the experiment would involveno deception.
24The data was taken from a pilot experiment using the same game, but in which therewas a longer delay imposed between clicks and thus the maximum was lower than 86.
22
(a) Low Trust (b) High Trust
Figure 5: Trust Manipulation
ability are unlikely in our experiment, since the task is simply clicking a
mouse every nine seconds. To further ensure that we were manipulating
trust, we asked subjects in a post-experimental survey to recall how trust-
worthy they believed their team was (on a scale of 1-7) “as they began the
task” and “at the end of the task.”25 Among the subjects who responded we
find a significant difference in how trustworthy they thought their team was
at the end of the experiment, as well as how likely they were to experience
a decline in trust. Subjects in the “Low Trust” condition are significantly
more likely (p < 0.05)26 to report a lower “trustworthy” rating after the
experiment than those in the “High Trust” condition. Subjects in “Low
Trust” were also significantly more likely to exhibit an overall decrease in
trust (“trust after” minus “trust before”), and the mean change in trust was
negative in low trust groups (-0.285).
4.3 Procedure
We conducted the experiment at the Columbia Experimental Laboratory for
the Social Sciences (CELSS), using 63 Columbia University undergraduates
who were recruited via ORSEE (Greiner, 2004). There were 3 sessions last-
ing approximately 45 minutes apiece. A show up fee of $5 combined with
25This survey was voluntary and there was some observed attrition (10 of the 63 subjectsdid not complete the survey) which reduces our number of observations somewhat.
26All reported p values are from OLS regressions clustered at the group level unlessotherwise noted.
23
the incentivized earnings produced an average payoff of $15 per subject.
Participants were unaware of the nature of the experiment before entering
the laboratory.
5 Experimental Results
In the following, we treat the number of task switches as examples of gener-
alist behavior and we measure the effect of trust on generalist behavior on
the intensive and extensive margins. We define a task switch as occurring
when one subject switches to another’s field and then proceeds to click one
or more times on this non-specialized field, switching back to the specialized
task is costless and not counted as a task switch. Monitoring switches—in
which one switches to another field but then (costlessly) switches back with-
out working—were possible in this game but somewhat uncommon. Of the
131 acts of switching we observe, only 14 (10.6 percent) were monitoring
switches. We test whether there is a significant effect of trust on a pure
monitoring switch, and the results are insignificant (p=0.86) with a coef-
ficient of .01. While the inclusion of these monitoring switches does not
substantively impact our results (see Appendix C), we exclude them for our
main analysis and focus on task switching, in which subjects actually work
on non-specialized tasks.
Figure 6 presents the number of switches in a cumulative distribution
function (CDF) for both treatments. The figure shows clearly the difference
between the treatments in specialized behavior. In the High Trust treat-
ment, 66 percent of the participants fully specialize, i.e. they never switched
to another field. In stark contrast, only 28 percent of participants in the
Low Trust treatment never switched, i.e. fully specialized on their field. The
figure shows not only that there are differences on the extensive margin but
also that the number of switches are higher in the Low Trust treatment (on
average, subjects in this treatment switched 0.92 times) compared to the
High Trust treatment (0.5 switches).
While Figure 6 pools our observations across both periods, Figure 7
shows the trend in specialist behavior across periods. While we observe posi-
24
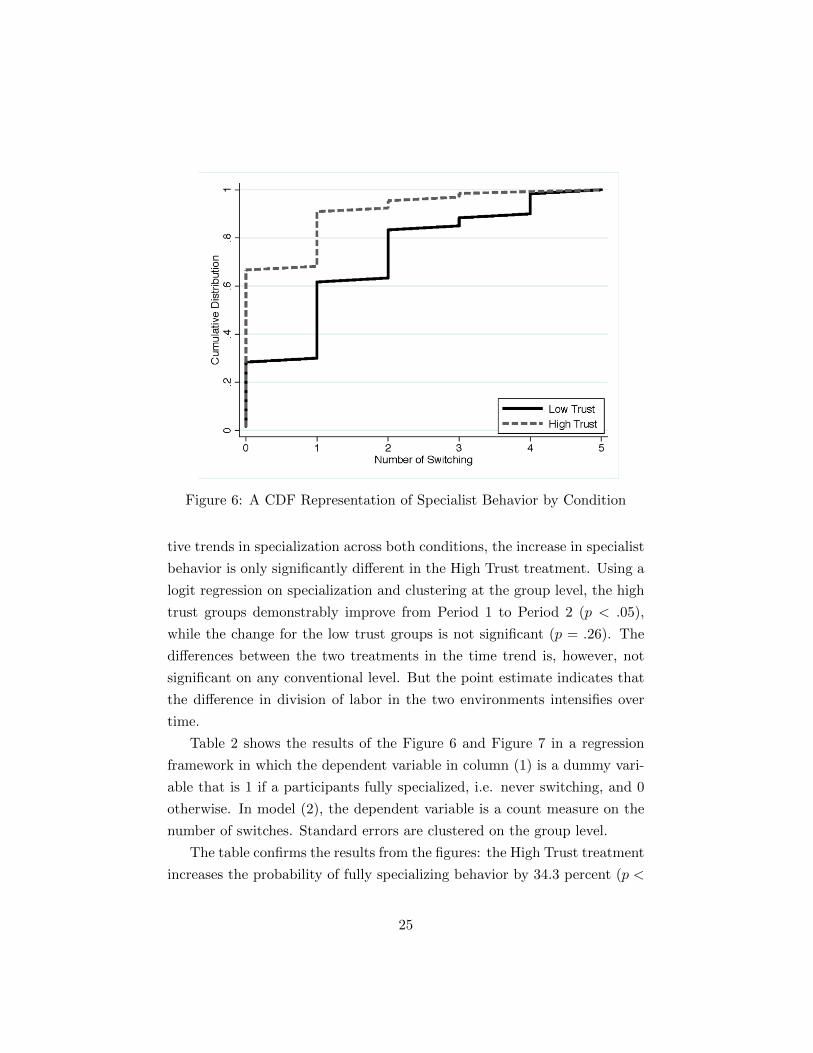
Figure 6: A CDF Representation of Specialist Behavior by Condition
tive trends in specialization across both conditions, the increase in specialist
behavior is only significantly different in the High Trust treatment. Using a
logit regression on specialization and clustering at the group level, the high
trust groups demonstrably improve from Period 1 to Period 2 (p < .05),
while the change for the low trust groups is not significant (p = .26). The
differences between the two treatments in the time trend is, however, not
significant on any conventional level. But the point estimate indicates that
the difference in division of labor in the two environments intensifies over
time.
Table 2 shows the results of the Figure 6 and Figure 7 in a regression
framework in which the dependent variable in column (1) is a dummy vari-
able that is 1 if a participants fully specialized, i.e. never switching, and 0
otherwise. In model (2), the dependent variable is a count measure on the
number of switches. Standard errors are clustered on the group level.
The table confirms the results from the figures: the High Trust treatment
increases the probability of fully specializing behavior by 34.3 percent (p <
25

Figure 7: Division of Labor over Time
0.05). The High Trust treatment also decreases the number of switches
(Column 2). Participants in the High Trust treatment exhibit 1.036 fewer
switches than participants in the Low Trust treatment. The coefficients
on “Round” show that for participants in the Low Trust treatment, the
incidence of fully specializing increases somewhat but this increase is not
statistically significant (p = 0.25). The interaction “High Trust x Round”
indicates that for the High Trust treatment specialized behavior increase
further (p = 0.327). While the difference in the time trend between the
treatments is not statistically significant, the increase in specialized behavior
is statistically significant for the High Trust treatment (p < 0.05).
The results so far show that creating a high trust environment endoge-
nously leads to more specialization and less switching tasks. One possible
explanation for increased specialized behavior in the high trust groups is
that the high trust manipulation might have induced more effort, perhaps
because the prime functions as an anchor. However, our prime does not
specify that the clicks were made in a specialist field, and thus it is not triv-
26

Table 2: The Causal Impact of Trust on Division of Labor
(1) (2)Dependent Variable Specialize Dummy # of Switches
High Trust (=1) 1.372** -1.036**(0.623) (0.473)[0.343]
Round 0.496 -0.667**(0.434) (0.293)[0.124]
High Trust × Round 0.633 0.273(0.646) (0.331)[0.158]
Constant -1.190** 1.733***(0.472) (0.381)
R-squared 0.190N 126 126
Note: Results from a logit (1) and an OLS (2) regression, ro-bust errors clustered at the group level and reported in parenthe-ses. Marginal effects reported in brackets. ∗ ∗ ∗p < 0.01, ∗ ∗ p <0.05, ∗p < 0.1
27

Figure 8: Effort across Periods and Treatments
ial that specializing would be a straightforward result from a “high effort”
anchor. Figure 8 plots effort levels in the two treatment for the two peri-
ods together. There are no significant differences in effort overall (p=.13).
Splitting the sample by round, round 1 effort is higher in the High Trust
treatment compared to the Low Trust treatment (p < 0.05), and there is no
difference in effort in round 2. Thus, even with indistinguishable effort in
round 2, the Low Trust groups exhibit significantly less specialization.
In sum, the experimental evidence shows that exogenously changed trust
levels affect how specialized members of a group work together. In a high
trust environment, we observe more division of labor, i.e. individuals work
on their specialized task and do not switch as often to the task of others. As
a result, they also earn more. Payoffs are $15.10 in High Trust groups versus
$14.56 in Low Trust groups (p < 0.01). Trust makes groups more specialized
and more productive, with level of specialization seem to increase over time.
The experimental approach allows us to provide internally valid effects of
our manipulation (trust) on our outcome measure (division of labor), which
28

complements the results from the cross-country analysis (section 3).
6 Conclusion
This paper investigates whether differences in corporate culture can explain
the emergence of different organizational structure, especially different de-
grees of division of labor. We begin our study with a model of the effect of
trust on organization form, and then provide evidence on the cross-country
correlation between trust and the division of labor. We then experimentally
evaluate a productive group that can attain different levels of productivity
depending on its level of division of labor. This provides causal evidence on
the question of trust and division of labor by showing in an experiment that
exogenously ‘shocking’ an organization with high or low trust levels leads
to the emergence of different degrees of division of labor. This evidence
suggests that one aspect of corporate culture—trust—can have an effect
on corporate performance through organizational structure. Demonstrating
that trust affects organizational structure is important both because it sheds
light on the nature of firms—an age-old puzzle in economics and strategy—
and also because it represents a plausible mechanism which could drive the
relationship between trust and economic growth.
While the experimental evidence provides high internal validity, the
cross-country evidence is high on external validity. Taken together, these
two pieces of empirical evidence provide a solid foundation to study further
the effect of trust on division of labor.
While demonstrating the causal impact of trust on specialization, this
paper raises several important questions and points to areas where further
research is needed. Of major interest is how easy it is to change an existing
culture of trust, since levels of trust can have long-lasting effects on organi-
zations. To that end it would be useful to document how start-ups confront
this problem by establishing strong cultures. Additional field evidence in
this vein would be of significant value. There is also the matter of trust
as only one component of corporate culture, but of course culture extends
far beyond this and it thought to determine orientations toward innovation,
29

fairness, experimentation and more (O’Reilly et al., 1991). Finally, it could
be very useful to analyze the effect of trust on the span of control, including
task division as well as task allocation. The relationships among organiza-
tional form and these other aspects of culture should prove to be a fruitful
avenue of exploration.
References
Akerlof, G. A. (1982). Labor contracts as partial gift exchange. The Quar-terly Journal of Economics, 97(4), 543–569.
Alchian, A. A. & Demsetz, H. (1972). Production, information costs, andeconomic organization. The American Economic Review, (pp. 777–795).
Algan, Y. & Cahuc, P. (2010). Inherited trust and growth. The AmericanEconomic Review, 100(5), 2060–2092.
Almazan, A. & Molina, C. A. (2005). Intra-industry capital structure dis-persion. Journal of Economics & Management Strategy, 14(2), 263–297.
Arrow, K. J. (1962). The economic implications of learning by doing. TheReview of Economic Studies, 29(3), 155–173.
Bartling, B., Fehr, E., & Huffman, D. (2013). Institutions and the causaleffect of trust. Working Paper.
Becker, G. S. & Murphy, K. M. (1992). The division of labor, coordinationcosts, and knowledge. The Quarterly Journal of Economics, 107(4), 1137–1160.
Benabou, R. & Tirole, J. (2003). Intrinsic and extrinsic motivation. TheReview of Economic Studies, 70(3), 489–520.
Bloom, N., Sadun, R., & Van Reenen, J. (2012). The organization of firmsacross countries*. The Quarterly Journal of Economics, 127(4), 1663–1705.
Bohnet, I., Greig, F., Herrmann, B., & Zeckhauser, R. (2008). Betrayalaversion: Evidence from brazil, china, oman, switzerland, turkey, and theunited states. The American Economic Review, 98(1), 294–310.
30

Camerer, C. & Weber, R. (2013). Experimental organizational economics.The Handbook of Organizational Economics, (pp. 213).
Chandler, A. D. (1990). Strategy and structure: chapters in the history ofthe industrial enterprise, volume 120. MIT press.
Chatterji, A., Findley, M., Jensen, N. M., Meier, S., & Nielson, D. L. (2015).Field experiments in strategy research. Strategic Management Journal,forthcoming.
Covey, S. M. (2006). The speed of trust: The one thing that changes every-thing. Simon and Schuster.
Crockett, S., Smith, V. L., & Wilson, B. J. (2009). Exchange and specialisa-tion as a discovery process*. The Economic Journal, 119(539), 1162–1188.
Croson, R., Anand, J., & Agarwal, R. (2007). Using experiments in corpo-rate strategy research. European Management Review, 4(3), 173–181.
Falk, A. & Zehnder, C. (2013). A city-wide experiment on trust discrimina-tion. Journal of Public Economics, 100(C), 15–27.
Feenstra, R. C., Inklaar, R., & Timmer, M. (2013). The next generation ofthe Penn World Table. Technical report, National Bureau of EconomicResearch.
Fehr, E. (2009). On the economics and biology of trust. Journal of theEuropean Economic Association, 7(2-3), 235–266.
Fehr, E., Kirchsteiger, G., & Riedl, A. (1998). Gift exchange and reciprocityin competitive experimental markets. European Economic Review, 42(1),1–34.
Fehr, E. & List, J. A. (2004). The hidden costs and returns of incentives,trust, and trustworthiness among ceos. Journal of the European EconomicAssociation, 2(5), 743–771.
Fershtman, C. & Gneezy, U. (2001). Discrimination in a segmented society:An experimental approach. Quarterly Journal of Economics, 116(1), 351–377.
Gambetta, D. (2000). Can we trust trust. Trust: Making and breakingcooperative relations, 2000, 213–237.
31
Gibbs, J. P. & Poston, D. L. (1975). The division of labor: Conceptualizationand related measures. Social Forces, 53(3), 468–476.
Girmscheid, G. & Brockmann, C. (2009). Inter-and intraorganizational trustin international construction joint ventures. Journal of Construction En-gineering and Management, 136(3), 353–360.
Glaeser, E. L., Laibson, D. I., Scheinkman, J. A., & Soutter, C. L. (2000).Measuring trust. Quarterly Journal of Economics, 115(3), 811–846.
Greiner, B. (2004). An online recruitment system for economic experiments.Forschung und wissenschaftliches Rechnen.
Guiso, L., Sapienza, P., & Zingales, L. (2008). Long term persistence. NBERWorking Paper, 14.
Guiso, L., Sapienza, P., & Zingales, L. (2014). The value of corporateculture. Journal of Financial Economics.
Kimbrough, E. O., Smith, V. L., & Wilson, B. J. (2008). Historical prop-erty rights, sociality, and the emergence of impersonal exchange in long-distance trade. American Economic Review, 98(3), 1009–1039.
Kimbrough, E. O., Smith, V. L., & Wilson, B. J. (2010). Exchange, theft,and the social formation of property. Journal of Economic Behavior &Organization, 74(3), 206–229.
Knack, S. & Keefer, P. (1997). Does social capital have an economic pay-off? a cross-country investigation. The Quarterly Journal of Economics,112(4), 1251–1288.
Kogut, B. & Zander, U. (1996). What do firms do? coordination, identity,and learning. Organization Science, 7(5), 502–518.
Kreps, D. M. (1990). Corporate culture and economic theory. Perspectiveson Positive Political Economy, (pp. 109–110).
Larkin, I., Pierce, L., & Gino, F. (2012). The psychological costs of pay-for-performance: Implications for the strategic compensation of employees.Strategic Management Journal, 33(10), 1194–1214.
Lawrence, P. R. & Lorsch, J. W. (1967). Differentiation and integration incomplex organizations. Administrative Science Quarterly, 12(1), 1–47.
32
McEvily, B., Radzevick, J. R., & Weber, R. A. (2012). Whom do you distrustand how much does it cost? an experiment on the measurement of trust.Games and Economic Behavior, 74(1), 285–298.
Nelson, R. R. (1991). Why do firms differ, and how does it matter? StrategicManagement Journal, 12(S2), 61–74.
Nickerson, J. A. & Zenger, T. R. (2008). Envy, comparison costs, andthe economic theory of the firm. Strategic Management Journal, 29(13),1429–1449.
Oliver, D. (2004). Basketball on paper: rules and tools for performanceanalysis. Potomac Books, Inc.
O’Reilly, C. A., Chatman, J., & Caldwell, D. F. (1991). People and or-ganizational culture: A profile comparison approach to assessing person-organization fit. Academy of Management Journal, 34(3), 487–516.
Palan, N. (2010). Measurement of specialization—the choice of indices. FIWWorking Paper Series, 062.
Porter, M. E. (1979). The structure within industries and companies’ per-formance. The Review of Economics and Statistics, 61(2), 214–227.
Puranam, P., Alexy, O., & Reitzig, M. (2014). What’s ”new” about newforms of organizing? Academy of Management Review, 39(2), 162–180.
Puranam, P., Powell, B. C., & Singh, H. (2006). Due diligence failure as asignal detection problem. Strategic Organization, 4(4), 319–348.
Raveendran, M., Puranam, P., & Warglien, M. (2015). Emergence andstability of the division of labor: Experimental evidence. ManagementScience, forthcoming.
Ross, E. A. (1896). Social control. The American Journal of Sociology, 1(5),513–535.
Santos, F. M. & Eisenhardt, K. M. (2005). Organizational boundaries andtheories of organization. Organization Science, 16(5), 491–508.
Sapienza, P., Toldra-Simats, A., & Zingales, L. (2013). Understanding trust.The Economic Journal, 123(573), 1313–1332.
Schein, E. H. (2010). Organizational culture and leadership, volume 2. JohnWiley & Sons.
33

Smith, A. & Nicholson, J. S. (1887). An Inquiry Into the Nature and Causesof the Wealth of Nations... T. Nelson and Sons.
Sørensen, J. B. (2002). The strength of corporate culture and the reliabilityof firm performance. Administrative Science Quarterly, 47(1), 70–91.
Tabellini, G. (2008). Presidential address: Institutions and culture. Journalof the European Economic Association, 8(4), 255–294.
Vanneste, B., Puranam, P., & Kretschmer, T. (2013). Trust over time inexchange relationships: Meta-analysis and theory. Strategic ManagementJournal, forthcoming.
Wan, W. P. & Hoskisson, R. E. (2003). Home country environments, cor-porate diversification strategies, and firm performance. Academy of Man-agement Journal, 46(1), 27–45.
Woodward, J. (1965). Industrial organization: theory and practice. OxfordUniversity Press.
Zanini, M. T. (2007). Trust Within Organizations of the New Economy: ACross-industrial Study. Springer-Verlag.
34

For Online Publication Only
Appendix
A Construction of a measure for the division oflabor
Existing measures of specialization, such as the Krugman SpecializationIndex, are suited to analyzing a country’s level of industrial specialization.Though there are several of these measures (an overview of which is providedin Palan (2010)) they focus on the extent to which an industry dominates theoutput of a country. Our model offers no clear prediction for a relationshipbetween industrial concentration and trust, thus we constructed a measurebased on Gibbs & Poston (1975). Recall from the main text that an industryj ’s d -score is calculated as follows:
dj =
∑ni=1 x
2ij
(∑n
i=1 xij)2
Where n is the number of possible occupations and x is the number ofindividuals in that occupation. The matrix in Table A1 (adapted fromGibbs & Poston) provides some intuition about how this measure changeswith the distribution of individuals within occupations and industries.
To further establish the suitability of the d -score as measure of the di-vision of labor we consider it in well-established theoretical contexts. A re-gression of GDP on d provides evidence that the division of labor is, in fact,associated with the wealth of nations (p < 0.01). Industries with the highestobserved d -score include “public administration” (judiciary and police force,etc.) and “specialized construction activities”. Industries that receive thelowest d -scores include fishing and ore mining. The mean country-industryd -score we observe in the sample is 0.72 with a standard deviation of 0.24.
35

Table A1: Simulated d -scores
Ind 1 Ind 2 Ind 3 Ind 4 Ind 5 Ind 6 Ind 7 Ind 8
occup.x1 0 1 20 20 1 1 20 1x2 0 1 5 0 3 0 20 1x3 0 1 0 0 2 1 20 1x4 0 1 0 0 0 1 20 1x5 200 1 50 20 3 1 20 1x6 0 1 0 20 0 1 20 1x7 0 1 40 0 2 1 20 1x8 0 1 60 20 2 1 20 1x9 0 1 0 0 2 1 20 1x10 0 191 25 20 2 1 20 1
d 0 0.09 0.78 0.8 0.87 0.89 0.9 0.9
36
B Experimental Instructions
Instructions for ParticipantsWelcome and thank you for participating in our economic decision-
making study. If you read and follow these instructions carefully, you can,depending on your decisions and the decisions made by other participants,earn a considerable amount of money. It is therefore important that youtake the time to understand the instructions. IMPORTANTLY: All the in-formation provided here is correct, and all the payments will be made aspromised. So there is NO DECEPTION involved. Also, all participantsread the exact same instructions for each treatment.
After the experiment your earnings will be paid to you privately, in-cluding your show up fee of $5 and any additional money you have earned.Overview of the experiment
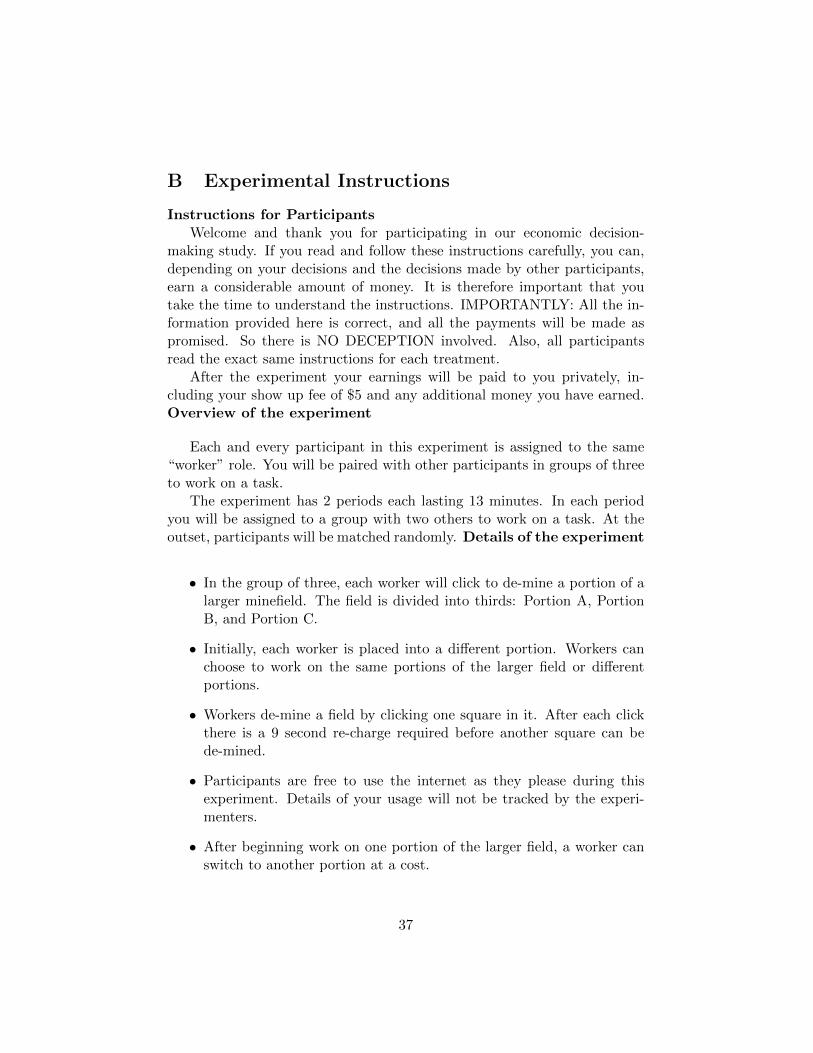
Each and every participant in this experiment is assigned to the same“worker” role. You will be paired with other participants in groups of threeto work on a task.
The experiment has 2 periods each lasting 13 minutes. In each periodyou will be assigned to a group with two others to work on a task. At theoutset, participants will be matched randomly. Details of the experiment
• In the group of three, each worker will click to de-mine a portion of alarger minefield. The field is divided into thirds: Portion A, PortionB, and Portion C.
• Initially, each worker is placed into a different portion. Workers canchoose to work on the same portions of the larger field or differentportions.
• Workers de-mine a field by clicking one square in it. After each clickthere is a 9 second re-charge required before another square can bede-mined.
• Participants are free to use the internet as they please during thisexperiment. Details of your usage will not be tracked by the experi-menters.
• After beginning work on one portion of the larger field, a worker canswitch to another portion at a cost.
37
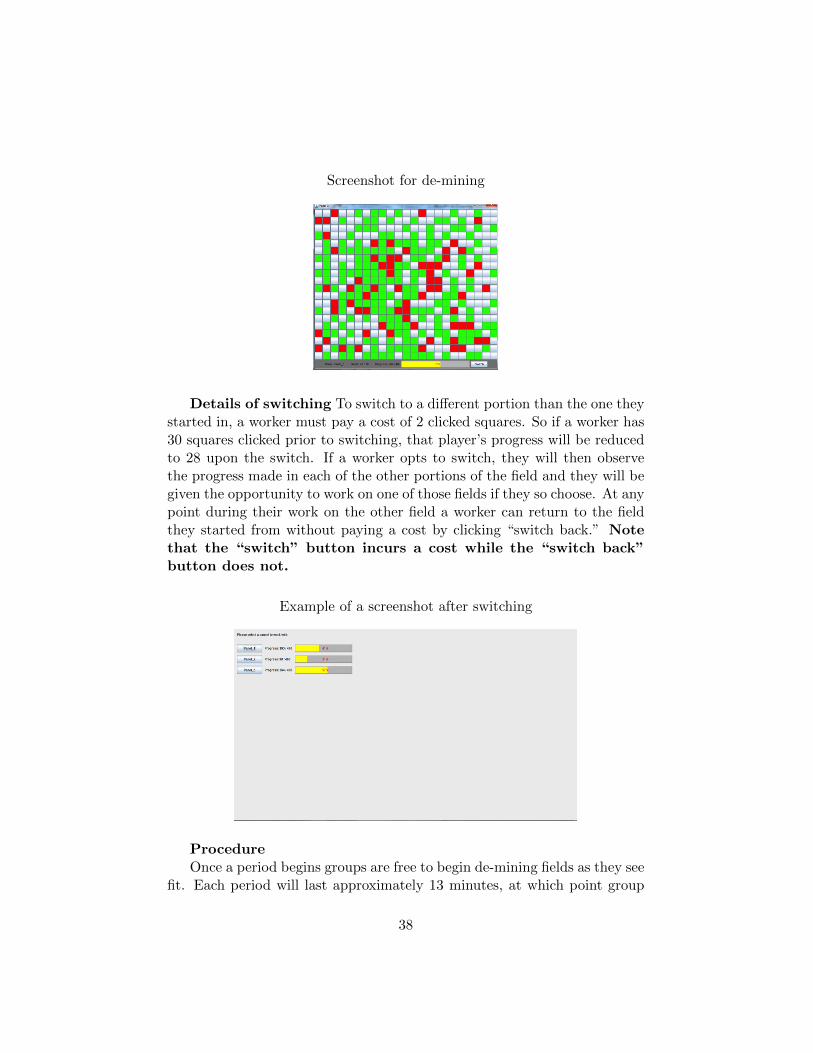
Screenshot for de-mining
Details of switching To switch to a different portion than the one theystarted in, a worker must pay a cost of 2 clicked squares. So if a worker has30 squares clicked prior to switching, that player’s progress will be reducedto 28 upon the switch. If a worker opts to switch, they will then observethe progress made in each of the other portions of the field and they will begiven the opportunity to work on one of those fields if they so choose. At anypoint during their work on the other field a worker can return to the fieldthey started from without paying a cost by clicking “switch back.” Notethat the “switch” button incurs a cost while the “switch back”button does not.
Example of a screenshot after switching
ProcedureOnce a period begins groups are free to begin de-mining fields as they see
fit. Each period will last approximately 13 minutes, at which point group
38

and individual payoffs will be computed for that period. Players will be ableto observe their group’s output and then the second round will begin, withthe rules remaining the exact same as in the first period.
The calculation of payoffs will be as follows: each group will be paidaccording to the progress made in the least complete portion only. Theamount completed in the least-complete portion will be multiplied against$20 (the value of a 100% completed field.) This amount will then be dividedequally among the group members. The experiment consists of two suchperiods, with payments made for both.
At the end of the experiment, after both periods are over, you will beasked to complete a short survey. After a short time we will call you up toreceive your payments.
Here are some examples:
• At the end of a period a group has de-mined portions as follows: Por-tion A 40% complete, Portion B 40% complete and Portion C 30%complete. In this case, the group will receive $20 times .30, the amountcompleted of the least-complete field. Each participant will receive onethird of this amount for this period.
• At the end of a period a group has de-mined portions as follows: Por-tion A 60% complete, Portion B 50% complete and Portion C 0%complete. In this case the group (and each participant) will receive 0for this period.
• At the end of a period a group has de-mined portions as follows: Por-tion A 50% complete, Portion B 50% complete and Portion C 50%complete. In this case, the group will receive $20 times .50, the amountcompleted of the least-complete field(s). Each participant will receiveone third of this amount for this period.
Once you have completed reading the instructions please click continuein order to proceed.
39

C Supplementary experimental analysis
In the main text we exclude “monitoring switches” from our analysis becausewe believe they are less relevant to the functional division of labor in groups.These are switches in which individuals click “switch” but then do not workon another’s field, and thus there is no actual task overlap. Neverthelesswe include these switches in table A2 to show that our results are robust tothem.
Table A2: Including “Monitoring Switches”
(1)Dependent Variable # of ALL Switches
High Trust (=1) 1.08**(0.478)
Round -0.766**(0.434)
High Trust × Round 0.342(0.323)
Constant 1.9***(0.381)
R-squared 0.190N 126
Note: Results from an OLS regression, robust er-rors clustered at the group level and reported inparentheses. ∗ ∗ ∗p < 0.01, ∗ ∗ p < 0.05, ∗p < 0.1
40

D Extensions of the Trust and Division of Labormodel
Our assumption about constant effort from types is fairly strong since weare implicitly assuming that an agent’s incentive problem is either satisfiedor not satisfied at all regardless of organizational form. Our conclusionsare not impacted substantially when relaxing this assumption. Suppose ∃θ=[0,1), with θ+θ+(1-θ-θ)=1. θ is the portion of the population for whichthe participation constraint is only met under full specialization and notunder generalization. If no specializing equilibrium exists then this type isindistinguishable from θ as they simply set effort to zero in all cases. Thistype also has no incentive to unilaterally deviate from generalization so thatequilibrium still exists. However, where specialization is an equilibrium,including this type does allow specialization to payoff dominate at a lowerlevel of trust, since (θ+θ)e>θe.
We also have ignored the task-coordination problem inherent in the spe-cializing equilibrium. That is, we have assumed that if both workers spe-cialize then they specialize in different tasks. Note that the generalizingequilibrium has no such task-coordination problem. Assuming that no taskcoordinating device exists then the conditions on the existence of the special-izing equilibrium become more stringent, θe
2 ≥e2α , and trust and/or gains
from specialization must be higher than in the baseline to ensure the equilib-rium. The same is true for the conditions on payoff dominance and risk dom-inance. See Figure A1 for the model’s results including task-coordinationproblems.
Figure A1: Specialization under Task Miscoordination
41