cultural difference and china’s cross-border m&as ......2019/08/11 · cultural difference...
TRANSCRIPT

Cultural Difference and China’s Cross-Border M&As:Language Matters
Zeng Lian∗ Wenli Sun† Dan Xie‡ Jie Zheng§
August 11, 2019
ABSTRACT
This paper studies the effect of language and culture on China’s cross-border mergers and acqui-sitions during 1997-2017 in 126 host countries. We use the gravity model and adopt common officiallanguage, common spoken language and common native language between China and host countries tomeasure the level of official support, ease of communication and mutual trust, respectively. We find thatlanguage proximity boosts China’s cross-border M&As significantly in terms of aggregate value, totalnumber and deal success rate. Cross-sample comparisons show heterogeneous effects of language andculture in developing host countries versus developed host countries as well as manufacturing industriesversus service industries.
KEYWORDS: Common language; Cultural proximity; China’s cross-border M&AsJEL Codes: F20; Z10; Z13
∗Zeng Lian: International Business School, Beijing Foreign Studies University, 933 International Building, No.19 XisanhuanNorth Road, Haidian District, Beijing, China, 100089 (email: [email protected]).†Wenli Sun: International Business School, Beijing Foreign Studies University, 931 International Building, No.19 Xisanhuan
North Road, Haidian District, Beijing, China, 100089 (email: [email protected]).‡Dan Xie (corresponding author): School of Economics and Finance, Queen Mary University of London, Mile End Road,
London, England, E1 4NS (email: [email protected]).§Jie Zheng: Department of Economics, School of Economics and Management, Tsinghua University, 561 Weilun Building,
No.1 Zhongguancun East Road, Haidian District, Beijing, China, 100084 (e-mail: [email protected]).
1
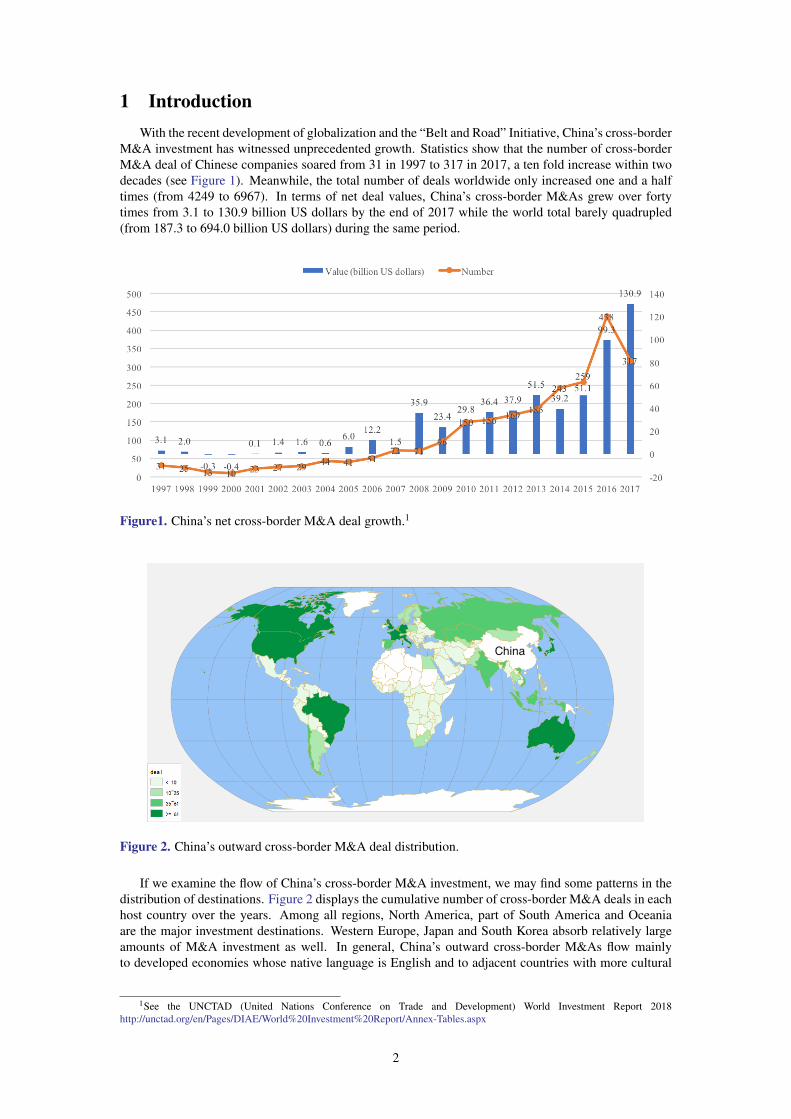
1 IntroductionWith the recent development of globalization and the “Belt and Road” Initiative, China’s cross-border
M&A investment has witnessed unprecedented growth. Statistics show that the number of cross-borderM&A deal of Chinese companies soared from 31 in 1997 to 317 in 2017, a ten fold increase within twodecades (see Figure 1). Meanwhile, the total number of deals worldwide only increased one and a halftimes (from 4249 to 6967). In terms of net deal values, China’s cross-border M&As grew over fortytimes from 3.1 to 130.9 billion US dollars by the end of 2017 while the world total barely quadrupled(from 187.3 to 694.0 billion US dollars) during the same period.
Figure1. China’s net cross-border M&A deal growth.1
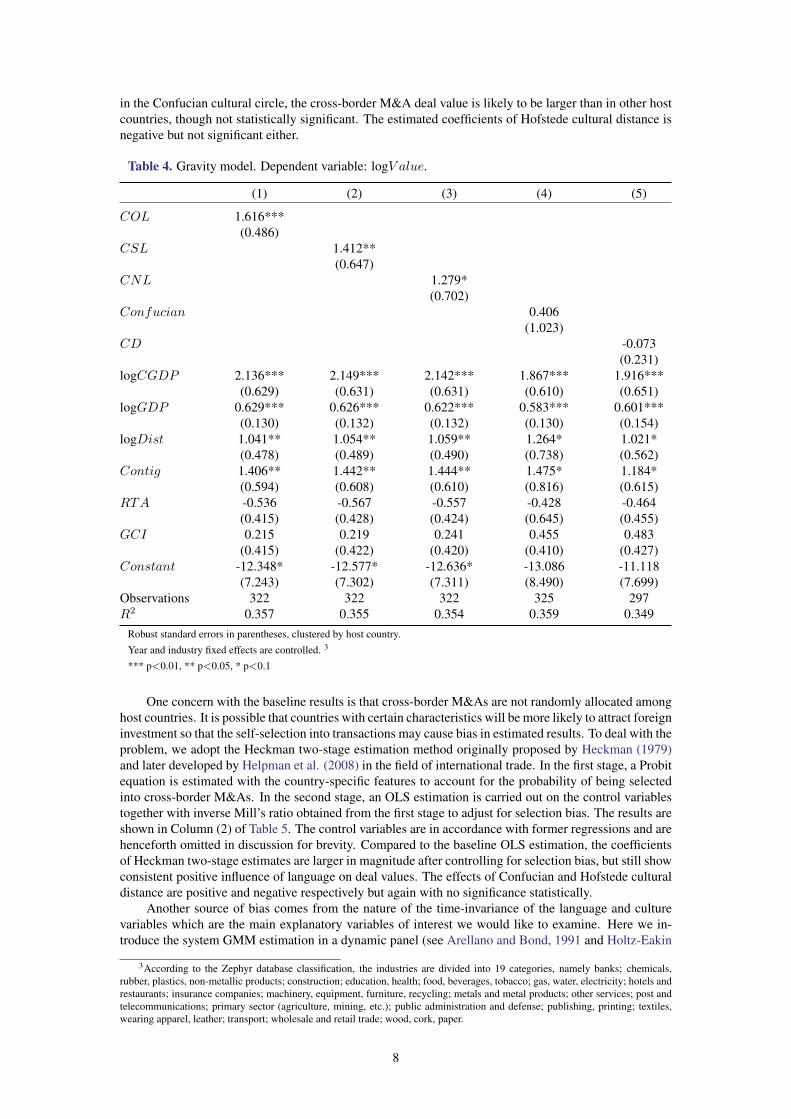
Figure 2. China’s outward cross-border M&A deal distribution.
If we examine the flow of China’s cross-border M&A investment, we may find some patterns in thedistribution of destinations. Figure 2 displays the cumulative number of cross-border M&A deals in eachhost country over the years. Among all regions, North America, part of South America and Oceaniaare the major investment destinations. Western Europe, Japan and South Korea absorb relatively largeamounts of M&A investment as well. In general, China’s outward cross-border M&As flow mainlyto developed economies whose native language is English and to adjacent countries with more cultural
1See the UNCTAD (United Nations Conference on Trade and Development) World Investment Report 2018http://unctad.org/en/Pages/DIAE/World%20Investment%20Report/Annex-Tables.aspx
2

resemblance. One may wonder about the relationship between language, culture, and international M&Ainvestment. If so, what aspects of language and culture facilitate China’s cross-border M&A transactions?
In practice, cross-border M&A deals are carried out through negotiations between stakeholders, dur-ing which process the representatives of each party gather at the table to discuss the terms of agreementin detail regarding deal values, stake acquired, method of payment and duration, etc. It can take monthsor even years to close a deal, therefore, effective communication is vital to the transaction outcome. Thelanguage proficiency of company deputies and the understanding of national culture as well as commer-cial norms of the counterparts might change the atmosphere of the conversation and turn the negotiationtowards a different direction. Cultural proximity may create a sense of closeness that boosts mutual trustand understanding, reduces potential hostility and thus leads toward a satisfactory result where each partyinvolved are able to realize their initial appeals in order to benefit from the arrangement. Former researchhas focused on various aspects of cross-border M&As such as institutional environment, financial perfor-mance and cultural proximity (e.g. Buckley et al., 2007; Zhang and Zhou, 2010; Head et al., 2010, Liu etal., 2016). In this paper, we pay special attention to language and study the effects of cultural factors onChina’s burgeoning cross-border M&A investment. We hypothesize on the importance of languages andthe impacts of various national cultural dimensions during the process of China’s massive wave of “Go-ing Out” 2 with firm-level data from the BvD Zephyr global M&A database. We adopt a gravity modelto study the influence on aggregate M&A deal volume, a poisson regression for the number of deals anda logit model for the success rate of M&A transactions. Examining cross-border M&A performancesfrom various aspects helps to provide a more comprehensive understanding on the role of language andnational culture.
The next section reviews the literature on language and cultural influences in international economicswith particular focus on cross-border M&As. It is followed by a description of the empirical modelset-up with data description. Section 5 presents and interprets estimation results in detail. Section 6provides further analysis and extensions. The last section summarizes the main findings and discussestheir implications in practice.
2 LiteratureFormer research on international trade and investment usually treated language as a control variable
and a common official language dummy was introduced to measure its influence on foreign direct invest-ment (e.g. Head and Ries, 2008; Baier and Bergstrand, 2009; Eaton and Kortum, 2010). However, theimportance of language is likely to be underestimated. Melitz and Toubal (2014) pointed out that besidesofficial language differences among countries, there are also spoken language that reflects the contribu-tion of translation and interpretation to ease of communication as well as native language that measuresethnicity and trust between nations. Together with language proximity, the effect of the multi-facetedfactors of language is at least twice as great as the conventional language dummy. Besides commonlanguage, Joshi and Lahiri (2015) established language friction index (LFI) to gauge language differ-ences in R&D alliance formation. Kroon et al. (2015) adopted lingua franca (usually English) fluencyand explored the influence of individuals’ language ability on their performance in cross-border mergers.Furthermore, Cuypers et al. (2015) took average TOEFL scores as a proxy of lingua franca proficiencyand find that linguistic distance lowers the equity stakes obtained from foreign targets in cross-borderacquisitions.
Apart from language, there are other factors related to cultural differences. One common practice inresearch related to China is to look into the influence of Confucian cultural convention. The Confuciantradition has profound influence on the lifestyle and ideology of Chinese people and serves to some extentas a religious belief. The method of measuring the influence of Confucianism ranges from a Confuciandummy (Ye et al., 2012; Zhang et al., 2010) to the number of Confucian temples (Jin et al., 2017) andConfucius Institutes (Xie et al., 2017; Lien et al., 2012). This line of literature concludes that culturalproximity, education and language learning promotes China’s foreign direct investment and trade (Lien2013; Lien et al., 2012; Lien and Co, 2013). However, the Confucian teaching tends to reduce corpo-rate risk-taking and therefore lowers rate of return (Chen et al., 2017). Another major method in culturalanalysis is Hofstede’s national cultural dimensions which entails six aspects of cultural indicators derivedfrom the serial research of Dutch psychologist Geert Hofstede dating back to the 1980s (Hofstede, 1980;Hofstede et al., 2010, etc.). Hofstede deconstructed national cultures into Power Distance (PDI), Individ-ualism versus Collectivism (IDV), Masculinity versus Femininity (MAS), Uncertainty Avoidance (UAI),
2The phrase refers to the Chinese government policy of encouraging companies to invest overseas.
3

Long-Term versus Short-Term normative Orientation (LTO) and Indulgence versus Restraint (IND) tostudy their characteristics in different dimensions.
Several studies find that national cultural proximity improves communication, increases cross-border M&A success rate and is beneficial to post-merger integrations (Kogut and Singh, 1988; Kim andHwang, 1992; Hennart and Reddy, 1997; Barkema and Vermeulen, 1998; Brouthers, 2013; Yan, 2009).Rather than the Hofstede overall index, Dikova et al. (2010) took two dimensions: Power Distance andUncertainty Avoidance to depict culture and found that both had adverse effects on cross-border M&Acompletion. Kristjnsdttir et al. (2017) explored five Hofstede dimensions and found only Masculinityhad a significant positive impact on bilateral trade flows. Buckley et al. (2007) introduced yet anothercultural variable of whether Asians exceeded 1% of total national population to represent cultural simi-larity. The empirical results revealed that cultural resemblance was positively related to China’s outwardforeign direct investment (OFDI). Ahern et al. (2012) combined language, religion, geographic distanceas well as Hofstede and Schwartz indices and studied their joint effects on method of payment and dealvolume of cross-border M&As.
Since we are studying cross-border M&As, there are various factors that affect outcomes of dealsand need to be controlled for in the analysis. We can categorize them into macroeconomic influences,industry-specific characteristics and firm-level deal heterogeneities. As is widely accepted in interna-tional trade study with the gravity model, host and home country GDP, geographic distance, commonborder (or contiguity) and regional trade agreements (RTA) are usually introduced as control variables(Bergstrand, 1985; Baier and Bergstrand, 2009; Feenstra, 2002; Anderson and Wincoop, 2003; Head andRies, 2008). One of the main incentives of cross-border M&As is to acquire cutting-edge technologiesand scarce natural resources (Mariotti and Piscitello, 1995). Yet targets in high-tech and resource in-dustries are sensitive to foreign acquisitions and deals are often restricted by host countries (Yan, 2011).Acquiring a target of the same industry will probably improve the success rate of transaction and ben-eficial to performance after the deal (Zhang and Zhou, 2010). At firm level, the acquirer’s ownershipstructure (Zhang and Zhou, 2010; Jia et al., 2015), cross-border M&A experience (Jia and Li, 2015),method of payment and percentage acquired have potential influences on the completion and transactionvalue as well (Zhao and Li, 2008; Dikova et al., 2010; Hu and Wu, 2011).
One of the most closely related literature to our work is Melitz and Toubal (2014). The data of com-mon official language, common spoken language and common native language are originally developedby them. Both our paper and their work adopt the gravity model. However, there are some main differ-ences. First, the question of interest in our paper is China’s cross-border M&As while Melitz and Toubal(2014) focused on bilateral trade. Second, we examine M&A performance from different aspects suchas deal value, number and success rate with different estimation methods, whereas Melitz and Toubal(2014) based all their analysis on the gravity model to study the effect of language on international tradevolume. Third, one of their main contributions is providing a new set of detailed language data and mucheffort was made in explaining the validity of these measurements. In our work, we take this set of indicesand introduce it into cross-border M&A studies. In terms of the results, we do find significant influenceof detailed language features on China’s cross-border M&As, which resembles their findings in trade.
3 Model setupTo obtain a comprehensive understanding of the impacts of culture and language, we examine Chi-
na’s cross-border M&As from three perspectives: the total deal values, the number of transactions andthe success rate of individual transactions.
3.1 Gravity model for deal valueBased on the Newtonian gravity equation of attractive force between two objects, Tinbergen (1962)
first proposed an analogous function that could be applied to international trade flows. Since then, ithas been widely applied to imports and exports analysis between different countries. Here we take thefollowing econometric form of the gravity model:
logV aluejt =α0 + α1COLjt + α2CSLjt + α3CNLjt
+ α4Confucianjt + α5CDjt + α6logGDPjt + α7logCGDPt
+ α8logDistjt + α9Contigjt + α10RTAjt + α11GCIjt
+ δk + µt + εkjt
(1)
4

where V aluejt is the cross-border M&A deal value from China to country j in year t. α0 is the constantterm. αi, i = 1, ..., 11 are coefficients of language, cultural and other country-level control variables. δkand µt represent industry and year fix effects. εkjt is the error term. COL, CSL and CNL are commonofficial language, common spoken language and common native language indicators respectively. COLis the binary measure of common official language between two countries. The original data is taken fromthe Central Intelligence Agency (CIA) World Factbook. CNL is the probability that a pair of peoplerandomly chosen from two countries share the same native language. CSL is the 0 to 1 probabilitythat a pair of people randomly chosen from two countries understand one another in a certain spokenlanguage. For example, the Chinese dialects include Mandarin, Cantonese, Min Nan, Wu, Yue, andHakka, etc. Due to historical reasons, migrants from China to other countries have now integrated to thelocal culture but their original Chinese dialects are reserved as part of their daily language. This is thecase with Singapore, Malaysia and some other Asian countries as well. Data on the last two indicatorscome from the Special Eurobarometer survey adjusted by population share and verified by Ethnologue.More detailed constructions of the variables are described in Melitz and Toubal (2014). Here we rescaledthe sample so that the language indicators range from 0 to 1 so that we can compare the magnitude ofimpacts across different measures.
As for culture,Confucian differentiates whether the host country is in the Confucian cultural circledefined after Ye et al. (2012) . CDj is the Hofstede cultural distance between China and the host country.Following Kought and Singh (1988),
CDj =
6∑n=1
{(Inj − Inc)2/Vn
}/6 (2)
where Inj is the index of country j in dimension n, Inc is the index of China in dimension n and Vnis the variance of all countries in dimension n. logGDP and logCGDP are host country and China’sGDP in log, respectively. We introduce these indices to control for the economic development levelsof the host and home countries. Following the standard gravity model structure, logDist represents thepopulation-weighted distance between home and host countries. Normally, we assume adjacent countriesare more likely to share some language similarity. Contig here represents the contiguity or adjacencyof home and host countries. If the country pair shares a common border, Contig equals 1, otherwise,Contig equals 0. RTA is the regional trade agreement dummy. GCI is short for Global CompetitiveIndex, which integrates the macroeconomic and the micro/business aspects of competitiveness such asinstitutions, policies and local markets into a single index to capture country-specific features as a controlvariable.
3.2 Poisson model for deal numberBesides total deal values, we would also like to learn the response of deal numbers to language and
culture. Since the dependent variable is non-negative and takes integer values, the proper estimation ofdeal numbers is the Poisson regression (Head and Ries, 2008). Therefore, the identification equation is:
E(Number|X) =exp(X′β) = exp(β1COL+ β2CSL+ β3CNL
+ β4Confucian+ β5CD + β6logGDP + β7logCGDP+ β8logDist+ β9Contig + β10RTA+ β11GCI
+ β12Industry + β13Y ear + Constant)
(3)
whereNumber is the aggregate number of cross-border M&A deals in a certain host country in a certainyear. Industry and Y ear are industry and year fixed-effect dummies. All the other explanatory variableshave the same definitions as in the gravity equation.
3.3 Logit model for deal success rateNow we examine the single transaction outcomes. Summary statistics from the Zephyr M&A
database show that among all China’s cross-border M&A deals announced, only 66.4% reach the fi-nal stage when stakeholders actually sign for transaction. Therefore, it is worthwhile to investigate thedeterminants of China’s cross-border M&A success rate. Since the dependent variable of interest here isbinary, we adopt a Logit model to examine the deal outcome effects.
5

Pd = E(Yd = 1) =1
1 + e−(θ0 + θ1Xd + θ2Zd + εd)(4)
As is shown in equation (4), Pd is the probability that a firm successfully completes the cross-borderM&A deal d, Yd denotes whether the deal is successful and takes the value of 0 or 1, Xd represents theexplanatory variables, including language and cultural indicators as mentioned before and Zd representsthe control variables, which entails deal-level features including cash payment dummy Cash, cross-border M&A experiences Exp, the acquirer ownership dummy SOE and acquired company sharesStake. εd is the error term, d = 1, 2, 3, ..., n. All variable definitions are shown in Table 1.
Table 1. Variable definition.
Dependent variablelogV alue Log of deal value (2005 constant USD) in each host country per year.Number Number of deals in each host country per year.Deal Status of deal outcome. 1=completed/completed assumed, 0=otherwise.1
Independent variableLanguageCOL Common official language index.CSL Common spoken language index.CNL Common native language index.Confucian 1=Host country is under Confucian influence, 0=otherwise.2
CD The Hofstede cultural difference index.Country-levellogGDP Log of host country GDP (2005 constant USD in billions).logCGDP Log of China’s GDP (2005 constant USD in billions).logDist Log of population weighted distance between home and host countries (kilometers).Contig 1=Contiguity between China and the host country, 0=otherwise.RTA 1=Host and home countries are within the same regional trade agreement (source:
WTO, 2015), 0=otherwise.GCI Global competitive index.Deal-levelCash 1=Cash payment, 0=non-cash payment.Exp Former cross-border M&A experiences of the acquirer.SOE 1=The acquirer is a state-owned enterprise, 0=otherwise.Stake Stake acquired of the target firm.1 The other deal status are announced, rumour, pending and withdrawn.2 The host countries under Confucian influence are Indonesia, Japan, Malaysia, Philippines, Singapore, South Korea, Thai-
land and Vietnam.
Among the variables,COL,CSL andCNL are provided by Melitz and Toubal (2014) and availablefrom CEPII (the French Centre d’Etudes Prospectives et d’Informations Internationales) website. GDPand CGDP are taken from BvD EIU Country Data, Contig and RTA are also obtained from CEPIIonline database. GCI is extracted from the Global Competitiveness Reports. PDI , IDV , MAS, UAI ,LTO, IND were extracted from the Hofstede Insights online data, where each indicator is scaled from0-100. We then calculatedCD as the cultural difference between host and home countries using equation(2). V alue, Cash, Exp, SOE, Stake were originally from BvD Zephyr global M&A database.
4 Descriptive statisticsWe combine the deal values of the same host country each year to set up host country-year panel
data. The data time span ranges from 1997 to 2017 and covers 126 host countries globally (see Ap-pendix Table A1 ). To measure the net effects on cross-border M&As, we exclude deals in Hong Kong,Macao and Taiwan. Also, investment to tax havens is typically aimed at assets transfer. Therefore, wefollow previous literature and exclude deals in Bermuda, British Virgin Islands and Cayman Islands. Thesummary statistics are shown in Table 2.
6

Table 2. Summary statistics.
Variable Mean Std. Dev. Min MaxDependent variablelogV alue 13.407 8.463 0 25.531Number 4.497 8.947 1 122Deal 0.669 0.471 0 1Independent variableLanguageCOL 0.025 0.155 0 1CSL 0.038 0.161 0 1CNL 0.036 0.166 0 1CulturalConfucian 0.156 0.363 0 1CD 2.468 1.073 0.500 4.804Country-levellogGDP 5.322 1.950 0.693 9.663logCGDP 8.316 0.398 7.048 8.791logDist 8.862 0.592 7.064 9.858Contig 0.121 0.327 0 1RTA 0.148 0.355 0 1GCI 4.729 0.673 2.890 5.860Deal-levelCash 0.455 0.498 0 1Exp 2.015 4.675 0 40SOE 0.160 0.367 0 1Stake 0.508 0.431 0 1
Before regression, we first examine the correlations between the main explanatory variables asshown in Table 3. According to Table 3, the language variables are strongly and positively correlated(above 0.9). Confucian is moderately correlated with language variables and CD has negative rela-tions with other variables. To mitigate possible collinearity problems, we introduce the main explanatoryvariables of interest one by one in the following regressions.
Table 3. Language variable correlations.
COL CSL CNL Confucian CDCOL 1CSL 0.948 1CNL 0.924 0.997 1Confucian 0.362 0.446 0.462 1CD -0.316 -0.345 -0.362 -0.580 1
All the correlations are significant at the 1% level.
5 Estimation results
5.1 Deal valueIn accordance with the model setup, we first estimate the effects of language and culture on cross-
border M&A deal values. We use OLS estimations as our baseline regressions with the panel data. We donot adopt fixed effect estimates because it will wipe out time-invariant country characters including thelanguages and national culture we would like to examine. Instead, we control a series of country-specificfeatures to pick up intrinsic factors related to a specific country.
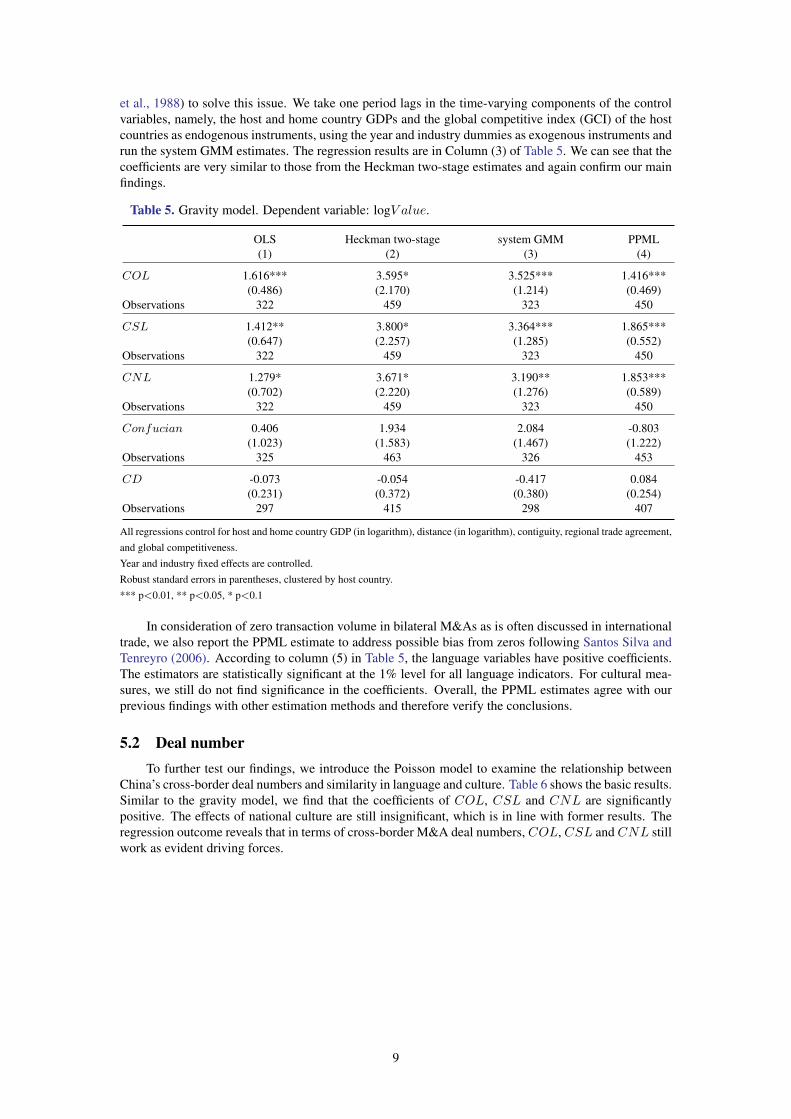
Table 4 shows the baseline results of the gravity model on cross-border M&A deal value. Columns(1) to (3) show the influence of language on cross-border M&As. We find that the language variablecoefficients are all positive and significant, showing that common languages have positive effects onChina’s cross-border M&A deal values.
Columns (4) and (5) provide estimates of cultural factors. The results show that if the host country is
7
in the Confucian cultural circle, the cross-border M&A deal value is likely to be larger than in other hostcountries, though not statistically significant. The estimated coefficients of Hofstede cultural distance isnegative but not significant either.
Table 4. Gravity model. Dependent variable: logV alue.
(1) (2) (3) (4) (5)
COL 1.616***(0.486)
CSL 1.412**(0.647)
CNL 1.279*(0.702)
Confucian 0.406(1.023)
CD -0.073(0.231)
logCGDP 2.136*** 2.149*** 2.142*** 1.867*** 1.916***(0.629) (0.631) (0.631) (0.610) (0.651)
logGDP 0.629*** 0.626*** 0.622*** 0.583*** 0.601***(0.130) (0.132) (0.132) (0.130) (0.154)
logDist 1.041** 1.054** 1.059** 1.264* 1.021*(0.478) (0.489) (0.490) (0.738) (0.562)
Contig 1.406** 1.442** 1.444** 1.475* 1.184*(0.594) (0.608) (0.610) (0.816) (0.615)
RTA -0.536 -0.567 -0.557 -0.428 -0.464(0.415) (0.428) (0.424) (0.645) (0.455)
GCI 0.215 0.219 0.241 0.455 0.483(0.415) (0.422) (0.420) (0.410) (0.427)
Constant -12.348* -12.577* -12.636* -13.086 -11.118(7.243) (7.302) (7.311) (8.490) (7.699)
Observations 322 322 322 325 297R2 0.357 0.355 0.354 0.359 0.349
Robust standard errors in parentheses, clustered by host country.Year and industry fixed effects are controlled. 3
*** p<0.01, ** p<0.05, * p<0.1
One concern with the baseline results is that cross-border M&As are not randomly allocated amonghost countries. It is possible that countries with certain characteristics will be more likely to attract foreigninvestment so that the self-selection into transactions may cause bias in estimated results. To deal with theproblem, we adopt the Heckman two-stage estimation method originally proposed by Heckman (1979)and later developed by Helpman et al. (2008) in the field of international trade. In the first stage, a Probitequation is estimated with the country-specific features to account for the probability of being selectedinto cross-border M&As. In the second stage, an OLS estimation is carried out on the control variablestogether with inverse Mill’s ratio obtained from the first stage to adjust for selection bias. The results areshown in Column (2) of Table 5. The control variables are in accordance with former regressions and arehenceforth omitted in discussion for brevity. Compared to the baseline OLS estimation, the coefficientsof Heckman two-stage estimates are larger in magnitude after controlling for selection bias, but still showconsistent positive influence of language on deal values. The effects of Confucian and Hofstede culturaldistance are positive and negative respectively but again with no significance statistically.
Another source of bias comes from the nature of the time-invariance of the language and culturevariables which are the main explanatory variables of interest we would like to examine. Here we in-troduce the system GMM estimation in a dynamic panel (see Arellano and Bond, 1991 and Holtz-Eakin
3According to the Zephyr database classification, the industries are divided into 19 categories, namely banks; chemicals,rubber, plastics, non-metallic products; construction; education, health; food, beverages, tobacco; gas, water, electricity; hotels andrestaurants; insurance companies; machinery, equipment, furniture, recycling; metals and metal products; other services; post andtelecommunications; primary sector (agriculture, mining, etc.); public administration and defense; publishing, printing; textiles,wearing apparel, leather; transport; wholesale and retail trade; wood, cork, paper.
8
et al., 1988) to solve this issue. We take one period lags in the time-varying components of the controlvariables, namely, the host and home country GDPs and the global competitive index (GCI) of the hostcountries as endogenous instruments, using the year and industry dummies as exogenous instruments andrun the system GMM estimates. The regression results are in Column (3) of Table 5. We can see that thecoefficients are very similar to those from the Heckman two-stage estimates and again confirm our mainfindings.
Table 5. Gravity model. Dependent variable: logV alue.
OLS Heckman two-stage system GMM PPML(1) (2) (3) (4)
COL 1.616*** 3.595* 3.525*** 1.416***(0.486) (2.170) (1.214) (0.469)
Observations 322 459 323 450
CSL 1.412** 3.800* 3.364*** 1.865***(0.647) (2.257) (1.285) (0.552)
Observations 322 459 323 450
CNL 1.279* 3.671* 3.190** 1.853***(0.702) (2.220) (1.276) (0.589)
Observations 322 459 323 450
Confucian 0.406 1.934 2.084 -0.803(1.023) (1.583) (1.467) (1.222)
Observations 325 463 326 453
CD -0.073 -0.054 -0.417 0.084(0.231) (0.372) (0.380) (0.254)
Observations 297 415 298 407
All regressions control for host and home country GDP (in logarithm), distance (in logarithm), contiguity, regional trade agreement,and global competitiveness.Year and industry fixed effects are controlled.Robust standard errors in parentheses, clustered by host country.*** p<0.01, ** p<0.05, * p<0.1
In consideration of zero transaction volume in bilateral M&As as is often discussed in internationaltrade, we also report the PPML estimate to address possible bias from zeros following Santos Silva andTenreyro (2006). According to column (5) in Table 5, the language variables have positive coefficients.The estimators are statistically significant at the 1% level for all language indicators. For cultural mea-sures, we still do not find significance in the coefficients. Overall, the PPML estimates agree with ourprevious findings with other estimation methods and therefore verify the conclusions.
5.2 Deal numberTo further test our findings, we introduce the Poisson model to examine the relationship between
China’s cross-border deal numbers and similarity in language and culture. Table 6 shows the basic results.Similar to the gravity model, we find that the coefficients of COL, CSL and CNL are significantlypositive. The effects of national culture are still insignificant, which is in line with former results. Theregression outcome reveals that in terms of cross-border M&A deal numbers, COL, CSL and CNL stillwork as evident driving forces.
9

Table 6. Poisson model. Dependent variable: Number.
(1) (2) (3) (4) (5)
COL 1.282***(0.144)
CSL 1.460***(0.250)
CNL 1.471***(0.279)
Confucian 0.455(0.514)
CD 0.027(0.205)
logCGDP 1.567*** 1.568*** 1.559*** 1.537*** 1.573***(0.403) (0.400) (0.397) (0.407) (0.430)
logGDP 0.373*** 0.379*** 0.379*** 0.308*** 0.370***(0.045) (0.045) (0.045) (0.061) (0.067)
logDist 0.209 0.218 0.227 0.430 0.184(0.140) (0.143) (0.144) (0.295) (0.225)
Contig 0.142 0.16 0.167 0.326 0.105(0.208) (0.214) (0.216) (0.321) (0.173)
RTA -0.283* -0.400* -0.426* -0.181 0.176(0.152) (0.207) (0.230) (0.250) (0.216)
GCI 0.375*** 0.343*** 0.351*** 0.586*** 0.517*(0.129) (0.127) (0.127) (0.191) (0.269)
Constant -18.01*** -17.97*** -18.00*** -20.43*** -18.70***(3.679) (3.641) (3.626) (3.896) (3.658)
Observations 459 459 459 462 414R2 0.401 0.404 0.405 0.383 0.387
Robust standard errors in parentheses, clustered by host country.Year and industry fixed effects are controlled.*** p<0.01, ** p<0.05, * p<0.1
Again, we adopt the negative binomial regression as an alternative of poisson regression to checkthe robustness of our findings regarding deal numbers. Table 7 shows that the results conform with thosein Table 6. We can safely conclude that in terms of deal numbers, language dimensions are significantlyassociated with the increase of China’s cross-border M&As.
10

Table 7. Negative binomial regressions. Dependent variable: Number.
(1) (2) (3) (4) (5)
COL 1.255***(0.152)
CSL 1.335***(0.197)
CNL 1.305***(0.223)
Confucian 0.524(0.357)
CD -0.002(0.139)
logCGDP 1.102*** 1.097*** 1.090*** 1.082*** 1.080***(0.120) (0.121) (0.120) (0.128) (0.156)
logGDP 0.296*** 0.300*** 0.299*** 0.238*** 0.308***(0.041) (0.041) (0.041) (0.048) (0.057)
logDist 0.100 0.111 0.117 0.344* 0.0978(0.099) (0.102) (0.103) (0.204) (0.166)
Contig 0.162 0.188 0.194 0.356 0.124(0.198) (0.207) (0.209) (0.220) (0.190)
RTA -0.373*** -0.441** -0.448** -0.369* 0.000161(0.140) (0.171) (0.177) (0.190) (0.182)
GCI 0.446*** 0.420*** 0.428*** 0.644*** 0.595***(0.135) (0.132) (0.130) (0.165) (0.198)
Constant -12.65*** -12.61*** -12.63*** -15.34*** -13.45***(1.536) (1.542) (1.546) (2.173) (2.003)
Observations 453 453 453 456 408R2 0.177 0.178 0.178 0.167 0.164
Robust standard errors in parentheses, clustered by host country.Year and industry fixed effects are controlled.*** p<0.01, ** p<0.05, * p<0.1
5.3 Success rateWe have examined the effects of language and culture on cross-border M&A deal values and deal
numbers. Next we look at their influence on the success rate of Chinese firms’ cross-border M&Atransactions. Instead of gravity variables, we introduce deal-level indicators to measure performances.The first five columns of Table 8 are Logit regression results and the last five are Probit regression results.We can tell from the table that the estimators of language indices are stably consistent with the first twomodels. All language variables are significantly positive at the 1% significance level, though Probitregression coefficients are smaller than those of Logit regressions. These results serve as strong evidencethat language plays an important role in China’s cross-border M&A investment.
Deal-level variables reveal some detailed insights during cross-border transactions. We find that thecoefficient of Cash is significantly positive. This indicates that if the cross-border M&A deal is paid incash, the deal value is significantly raised up. Compared to stock payment, cash payment is faster and therisks are reduced therefore it is often preferred as favorable terms to the seller. The coefficients of Exp2
are positive and the coefficients of Exp are negative, indicating a “U” shape relationship between expe-rience and the success rate of cross-border M&As. This means at the beginning of globalization, firmsmay witness a decreasing marginal effect of experience when they are not familiar with foreign businessenvironments. However, once they surpass a certain threshold, international experience may help firmssuccessfully close the deals when they have accumulated enough expertise to adapt to new situations. Ifthe acquirer is a state-owned enterprise, the possibility of finishing the deal with success will drop. Thismakes sense because SOEs are often equipped with abundant source of capital and backed up by strongpolitical support to carry out mega deals abroad. The acquired firms and host countries are more cautiouswhen facing SOE acquirers, taking national security and industry competition into consideration. Theinfluence of stake acquired is consistently negative though not statistically significant. Therefore, wecan only infer that the bigger stake acquired might lead to lower success rate. Finally, we do not findsignificant cultural influences on the success rate of cross-border M&A deals.
11

Table 8. Language. Dependent variable: Deal.
Logit Probit
(1) (2) (3) (4) (5) (6) (7) (8) (9) (10)
COL 0.731*** 0.422***(0.080) (0.045)
CSL 0.791*** 0.456***(0.092) (0.049)
CNL 0.787*** 0.454***(0.090) (0.048)
Confucian 0.087 0.052(0.223) (0.132)
CD 0.023 0.013(0.080) (0.048)
Cash 0.400*** 0.393*** 0.392*** 0.428*** 0.389*** 0.245*** 0.241*** 0.240*** 0.264*** 0.240***(0.106) (0.106) (0.106) (0.107) (0.098) (0.064) (0.064) (0.064) (0.064) (0.058)
Exp -0.038 -0.038 -0.038 -0.044 -0.039 -0.023 -0.023 -0.023 -0.027* -0.024(0.027) (0.027) (0.027) (0.027) (0.028) (0.016) (0.016) (0.016) (0.016) (0.017)
Exp2 0.001 0.001 0.001 0.002 0.001 0.001 0.001 0.001 0.001 0.001(0.001) (0.001) (0.001) (0.001) (0.001) (0.001) (0.001) (0.001) (0.001) (0.001)
SOE -0.281 -0.28 -0.281 -0.275 -0.323 -0.174 -0.173 -0.174 -0.17 -0.198(0.197) (0.197) (0.197) (0.197) (0.207) (0.118) (0.118) (0.118) (0.118) (0.124)
Stake -0.019 -0.017 -0.017 -0.017 -0.045 -0.019 -0.018 -0.019 -0.017 -0.035(0.182) (0.181) (0.181) (0.182) (0.191) (0.107) (0.107) (0.106) (0.107) (0.112)
Constant -0.749** -0.755** -0.751** -0.735** -0.634 -0.448** -0.451** -0.449** -0.440** -0.38(0.356) (0.355) (0.355) (0.356) (0.421) (0.211) (0.211) (0.210) (0.211) (0.251)
Observations 2837 2837 2837 2867 2702 2837 2837 2837 2867 2702χ2 - 1012 1143 598 844 - 1086 1211 644 918p value - 0.000 0.000 0.000 0.000 - 0.000 0.000 0.000 0.000R2 0.0580 0.0585 0.0586 0.0549 0.0544 0.0584 0.0590 0.0591 0.0555 0.0549
Robust standard errors in parentheses, clustered by host country.Year and industry fixed effects are controlled.*** p<0.01, ** p<0.05, * p<0.1
6 Additional analysisCross-border M&As are driven by different motives such as market expansion, technology upgrad-
ing and resource searching. Therefore, we expect heterogeneities across destination countries and in-dustries as well. First, we explore the differences between developing and developed M&A investmentdestinations. According to Table 9, the first two columns show the estimations of OLS regressions,the next two columns report the results of Poisson regressions and the last two columns display Log-it regression outcomes. Unfortunately, in the developing countries sample, the estimators of COL areautomatically omitted because of missing values. Therefore, we are not able to estimate the differencebetween country groups. However, when we examine the coefficients of CSL and CNL, we find moresignificant impacts of language in the sample for developed countries than in the sample for developingcountries. The discovery holds consistent with deal value and deal number while for success rate, lan-guage seems to exert a slightly larger positive effect on developing countries. Yet we cannot draw thesame conclusions regarding national culture.
To understand the variation, we may refer to the fact that developed countries have stricter and moretransparent institutional environments for business transactions. In contrast, in developing countries thereare more likely to be local conventions that interfere with deal processes. Regulations might not be ob-served strictly while corruptions and bribery are more likely to take place which sabotage the proceduresof commercial activities. While in developed countries with better institutional background, languagesimilarity provides better understanding between buyers and sellers. Common spoken language helpswith mutual understanding that smooths the deals and common native language boosts trust betweendifferent parties which is also beneficial to transactions.
12

Table 9. Destination heterogeneities.
OLS Poisson Logit
Developed Developing Developed Developing Developed Developing(1) (2) (3) (4) (5) (6)
COL 2.496* 2.279*** 0.755***(1.257) (0.217) (0.080)
Observations 152 193 1959
CSL 2.651** 8.705 2.612*** -0.596 0.794*** 1.017***(1.279) (6.032) (0.394) (0.531) (0.085) (0.383)
Observations 152 257 193 257 1959 861
CNL 2.653** 6.552 2.681*** -0.620 0.797*** 0.818***(1.262) (4.689) (0.469) (0.434) (0.089) (0.297)
Observations 152 257 193 257 1959 861
Confucian 1.789 2.721 2.078** 0.499* 0.280 -0.140(2.407) (2.543) (0.833) (0.265) (0.288) (0.231)
Observations 152 260 193 260 1959 891
CD -0.152 -0.515 0.024 -0.110 -0.095 0.175*(0.300) (0.935) (0.198) (0.107) (0.084) (0.090)
Observations 149 216 189 216 1949 741
All regressions control year and industry fixed effects.Columns (1) to (4) control host and home country GDP (in logarithm), distance (in logarithm), contiguity, regional trade agreement,and global competitiveness.Columns (5) and (6) control cash payment, experience, dummy for state-owned enterprise and stake acquired.Robust standard errors in parentheses, clustered by host country.*** p<0.01, ** p<0.05, * p<0.1
Next, we turn to look at the outcomes of different industries. We look at the manufacturing industries4 and the service industries 5 respectively. More detailed industries are not examined because of limitedsample size. For deal values, common languages have significant positive effects in the manufacturingindustries but no significant effect in the service industry. In the aspect of deal number, the importanceof languages is significant for both manufacturing and service industries but the effects are still larger inthe manufacturing sectors. Here the Confucian cultural tradition is significant in explaining the numberof deals, too. For the success rate, however, the situation reverts that only in the service sectors do weobserve significant effects in the outcome while there is no evident effect in the manufacturing sectors.All through these estimations, the influences of Hofstede cultural distance are mostly negative but notstrong enough to draw robust conclusions.
4NAICS2017 two-digit industry classification codes 31-33.5NAICS2017 two-digit industry classification codes 22 and 42-81.
13

Table 10. Industry heterogeneities.
OLS Poisson Logit
Manufacturing Service Manufacturing Service Manufacturing Service(1) (2) (3) (4) (5) (6)
COL 1.446*** 0.795 1.563*** 1.277*** 0.184 0.926***(0.509) (1.000) (0.236) (0.213) (0.117) (0.076)
Observations 126 115 165 168 1066 1197
CSL 1.863** 1.303 1.588*** 1.358*** 0.177 0.955***(0.722) (1.081) (0.343) (0.219) (0.132) (0.080)
Observations 126 115 165 168 1066 1197
CNL 1.848** 1.347 1.461*** 1.351*** 0.146 0.943***(0.745) (1.085) (0.387) (0.215) (0.139) (0.078)
Observations 126 115 165 168 1066 1197
Confucian 1.021 0.332 1.148** 1.043*** -0.189 0.362(1.804) (1.536) (0.458) (0.382) (0.228) (0.275)
Observations 126 116 165 169 1072 1213
CD 0.116 -0.198 -0.143 -0.083 0.130** -0.119(0.304) (0.271) (0.092) (0.126) (0.061) (0.094)
Observations 123 108 197 154 1031 1160
All regressions control year and industry fixed effects.Columns (1) to (4) control host and home country GDP (in logarithm), distance (in logarithm), contiguity, regional trade agreement,and global competitiveness.Columns (5) and (6) control cash payment, experience, dummy for state-owned enterprise and stake acquired.Robust standard errors in parentheses, clustered by host country.*** p<0.01, ** p<0.05, * p<0.1
7 Conclusions and discussionsThis paper analyses the impacts of common language and cultural background on China’s cross-
border M&As. We examine their influence from three aspects: the total deal value, the number ofdeals and the success rate of individual transactions. We borrow the widely-accepted gravity model ininternational trade and conduct a series of alternative estimates to support our findings.
Instead of a simplistic common language dummy, we take different perspectives of language in-cluding common official language, common spoken language and common native language to capturedifferent channels through which national language may affect cross-border M&As. We find significantpositive effects of aggregate linguistic factors on China’s outward M&A investment. Besides officialsupport, ease of communication through translation and interpreters, together with ethnicity and trustcontribute to cross-border M&As substantially.
More broadly speaking, national culture plays a fundamental role in international commerce. TheHofstede cultural dimensions are chosen to capture national culture differences. Particular to the cir-cumstance of China, we introduce the Confucian indicator to learn how religion and conventional beliefsaffect overseas investment. Yet we find very weak evidence of cultural influence on China’s cross-borderM&A investments. Subsample comparisons show that common spoken language and common nativelanguage are more important in developed countries than in developing countries in terms of deal valueand number while success rate is higher in developing countries instead. As for industry heterogeneities,a similar pattern is found that language similarities have bigger influence in the manufacturing industriesrather than in the service industries in terms of deal value and number. But the service industries enjoy ahigher success rate relative to the manufacturing industries.
Our conclusions may offer useful implications to cross-border M&A practitioners. Various evi-dences have shown the importance of language in international transactions, especially in M&A dealswhen negotiation and communication are vital to the outcome. Language and cultural similarities mayhelp with the deal process greatly based on mutual understanding and alleviated hostility. Also, peopleparticipating in the business should bear in mind that mutual understanding and trust boost understandingand cooperation that lead to rational and wise investment decisions in cross-border M&As. For policymakers, the importance of language education and training should be emphasized. The proficiency oflingua franca not only improves communication and mutual understanding, but also brings economicbenefits at least through cross-border investments.
14

In terms of future research, extensions may be stretched to broader geographic regions that involvemultilateral investments and more variance in languages and national cultures. Other macroeconom-ic features could also be taken into consideration to improve the explanation power of the dependentvariables.
15

Appendix
Table A1. Host countries.
Albania French Polynesia PakistanAngola Gabon PanamaArgentina Georgia Papua New GuineaArmenia Germany PeruAustralia Ghana PhilippinesAustria Greece PolandAzerbaijan Guinea PortugalBangladesh Guyana Republic of KoreaBarbados Honduras RomaniaBelarus Hungary Russian FederationBelgium Iceland SamoaBolivia India Saudi ArabiaBosnia and Herzegovina Indonesia SerbiaBrazil Iran SeychellesBrunei Darussalam Iraq Sierra LeoneBulgaria Ireland SingaporeBurma Israel SlovakiaCambodia Italy SloveniaCameroon Jamaica South AfricaCanada Japan SpainCape Verde Jordan Sri LankaCentral African Republic Kazakhstan SwedenChad Kenya SwitzerlandChile Kyrgyzstan Syrian Arab RepublicColombia Lao People’s Republic TajikistanCongo Liberia TanzaniaCook Islands Lithuania ThailandCosta Rica Luxembourg Trinidad and TobagoCroatia Macedonia TurkeyCuba Malaysia TurkmenistanCyprus Maldives UgandaCzech Republic Malta UkraineDemocratic Republic of Congo Mauritius United Arab EmiratesDenmark Mexico United KingdomEcuador Mongolia United States of AmericaEgypt Mozambique UruguayEl Salvador Namibia UzbekistanEritrea Netherlands VanuatuEstonia New Zealand VenezuelaEthiopia Nigeria Viet NamFinland Norway ZambiaFrance Oman Zimbabwe
16

Table A2. The language data
Rank Index Country No. of deals
COL
1 1 Singapore 170
CSL
1 1 Singapore 170
2 0.3532 Malaysia 41
3 0.0548 Australia 273
4 0.0151 UK 1620.0151 Barbados 2
5 0.0150 Thailand 29New Zealand 22Ireland 8Jamaica 6
6 0.0147 US 516
7 0.0139 Guyana 2
8 0.0136 Sweden 26Norway 13Iceland 2
9 0.0135 Malta 1Trinidad and Tobago 1
10 0.0133 Netherlands 66
CNL
1 1 Singapore 170
2 0.4318 Malaysia 41
3 0.0682 Australia 273
Notes: For COL, only Singapore has the same official language with China. For CSL and CNL, the original dataset recordspercentage of population who use the language≥ 4%. Here we list the countries with the highest 10 values of CSL index and3 countries with positive CNL.
Acknowledgement: The authors gratefully acknowledge research funding support from Tsinghua Uni-versity (No.20151080397), Beijing Foreign Studies University, the National Natural Science Foundationof China (No.61661136002 and No.71873074), the National Social Science Fund of China (No.17GBQY026),the Fundamental Research Funds for the Central Universities (No.2016QD012), Research Project of Chi-na’s Ministry of Education (No.17GBQY026).
References[1] Ahern, K. R., Daminelli, D., & Fracassi,C. (2012). Lost in translation? The effect of cultur-
al values on mergers around the world. Journal of Financial Economics, 117(1), 165-189. http-s://doi.org/10.1016/j.jfineco.2012.08.006.
[2] Anderson, J. E., & Wincoop, E. V. (2003). Gravity with gravitas: A solution to the border puzzle.American Economic Review, 93(1), 170-192. https://doi.org/10.1257/000282803321455214.
[3] Arellano, M., & Bond, S. (1991). Some tests of specification for panel data: Monte Carlo evidenceand an application to employment equations. The Review of Economic Studies, 58(2), 277-297. http-s://doi.org/10.2307/2297968.
[4] Barkema, H. G., & Vermeulen, F. (1998). International expansion through start up or acquisition: Alearning perspective. Academy of Management Journal, 41(1), 7-26. https://doi.org/10.5465/256894.
17

[5] Baier, S. L., & Bergstrand, J. H. (2009). Estimating the effects of free trade agreements on inter-national trade flows using matching econometrics. Journal of International Economics, 77(1), 63-76.https://doi.org/10.1016/j.jinteco.2008.09.006.
[6] Bergstrand, J. H. (1985). The gravity equation in international trade: Some microeconomicfoundations and empirical evidence. The Review of Economics and Statistics, 67, 474-481. http-s://doi.org/10.2307/1925976.
[7] Brouthers, K. D. (2013). Institutional, cultural and transaction cost influences on entry mod-e choice and performance. Journal of International Business Studies, 44(1), 14-22. http-s://doi.org/10.1057/jibs.2012.22.
[8] Buckley, P. J. , Clegg, L. J. , Cross, A. R. , Liu, X. , & Zheng, P. (2007). The determinants ofChinese outward foreign direct investment. Journal of International Business Studies, 40(2), 353-354.https://doi.org/10.1057/palgrave.jibs.8400277.
[9] Chen, S. , Cronqvist, H. , Ni, S. , & Zhang, F. (2017). Languages and corporate savings behavior.Journal of Corporate Finance, 46: 320-341. https://doi.org/10.1016/j.jcorpfin.2017.07.009.
[10] Coogan, M. D. (2005). Eastern religions: Hinduism, Buddhism, Taoism, Confucianism, Shinto.Oxford, UK: Oxford University press.
[11] Cuypers, I. R. P., Ertug, G., & Hennart, J. F. (2015) The effects of linguistic distance and linguafranca proficiency on the stake taken by acquirers in cross-border acquisitions. Journal of InternationalBusiness Studies, 46(4), 429-442. https://doi.org/10.1057/jibs.2014.71.
[12] Dikova, D. , & Witteloostuijn, S. A. V. (2010). Cross-border acquisition abandonment and com-pletion: The effect of institutional differences and organizational learning in the international busi-ness service industry 1981-2001. Journal of International Business Studies, 41(2), 223-245. http-s://doi.org/10.1057/jibs.2009.10.
[13] Eaton, J., & Kortum, S. (2010). Technology, geography, and trade. Econometrica, 70(5), 1741-1779. https://doi.org/10.2307/3082019.
[14] Feenstra, R. C. (2002). Border effects and the gravity equation: Consistent methods for estimation.Scottish Journal of Political Economy, 49(5), 491-506. https://doi.org/10.1111/1467-9485.00244.
[15] Head, K., & Ries, J. (2008). FDI as an outcome of the market for corporate control: Theory andevidence. Journal of International Economics, 74(1), 2-20. https://doi.org/10.2139/ssrn.926133.
[16] Head, K., Mayer, T., & Ries, J. (2010). The erosion of colonial trade linkages after independence.Journal of International Economics, 81(1), 1-14. https://doi.org/10.1016/j.jinteco.2010.01.002.
[17] Heckman, J. J. (1997). Sample selection bias as a specification error. Econometrica, 47(1), 153-161.https://doi.org/10.2307/1912352.
[18] Helpman, E. , Melitz, M. , & Rubinstein, Y. (2007). Estimating trade flows: Trad-ing partners and trading volumes. Quarterly Journal of Economics, 123(2), 441-487. http-s://doi.org/10.1162/qjec.2008.123.2.441.
[19] Hennart, J., & Reddy, S. (1997). The choice between mergers/acquisitions and joint ventures: Thecase of Japanese investors in the United States. Strategic Management Journal, 18(1), 1-12. http-s://doi.org/10.2307/3088192.
[20] Hofstede, G. (1980). Culture’s consequences. New York, NY: Sage.
[21] Hofstede, G., Hofstede, G. J. & Minkov, M. (2010). Cultures and organizations, software of themind intercultural cooperation and its importance for survival. New York, NY: McGraw-Hill.
[22] Holtzeakin, D., Newey, N. & Rosen, H. S. (1988). Estimating vector autoregressions with paneldata. Econometrica, 56(6), 1371-1395. http://doi.org/10.2307/1913103.
[23] Hu, Y., & Wu, Z. (2011). A study on influencing factors of Chinese enterprises’ overseasM&A:Empirical analysis from the angle of new institutional economics. Journal of finance and e-conomics, 8, 91-102. http://doi.org/10.16538/j.cnki.jfe.2011.08.008.
18

[24] Jia, J., & Li, W. (2015). Experience and success of Chinese cross-border acquisitions: Moderat-ing role of non-related experience and government factors. Journal of International Trade, 8, 48-58.http://doi.org/10.13516/j.cnki.wes.2015.08.006.
[25] Jia, J., Li, W., & Guo, B. (2015). Influence of prior experience on Chinese firms’ cross-borderacquisition: A study from perspective of geographic distance and government’s role. Journal of Inter-national Trade, 10, 87-97. http://doi.org/10.13510/j.cnki.jit.2015.10.009.
[26] Jin, Z., Xu, H.,& Ma, Y. (2017). Confucianism and corporate’s risk taking. The Journal of WorldEconomy, 11, 170-192.
[27] Joshi, A. M., & Lahiri, N. (2015) Language friction and partner selection in cross-border R&D alliance formation. Journal of International Business Studies, 46(2): 123-152.http://doi.org/10.1057/jibs.2014.56.
[28] Kim, W. C., & Hwang, P. (1992). Global strategy and multinational entry mode choice. Journal ofInternational Business Studies, 23(1), 29-53. http://doi.org/10.1057/palgrave.jibs.8490258.
[29] Kought, B., & Singh, H. (1998). The effect of national culture on the choice of entry mode. Journalof International Business Studies, 19(3), 411-432. http://doi.org/10.1057/palgrave.jibs.8490394.
[30] Kristjansdottir, H., Guklaugsson, Þ. O., Gukmundsdottir, S., & Akalsteinsson, G. D. (2017).Hofstede national culture and international trade. Applied Economics, 49(57), 5792-5801.http://doi.org/10.1080/00036846.2017.1343446.
[31] Kroon, D. P., Cornelissen, J. P., & Vaara, E. (2015). Explaining employees reactions towards across-border merger: The role of English language fluency. Management International Review, 55(6),775-800. http://doi.org/10.1007/s11575-015-0259-2.
[32] Lien, D. (2013). Financial effects of the Confucius Institute on Chinese language acquisition: Isn’tit delightful that friends come from afar to teach you Hanyu?. North American Journal of Economicsand Finance, 24, 87 - 100. http://doi.org/10.1016/j.najef.2012.04.001.
[33] Lien, D. & Co, C. Y. (2013). The effect of Confucius Institutes on US Exports to China: A statelevel analysis. International Review of Economics and Finance, 27, 566-571.http://doi.org/10.1016/j.iref.2013.01.011.
[34] Lien, D., Oh, C. H., & Selmier, W. T. (2012). Confucius institute effects on China’s trade and FDI:Isn’t it delightful when folks afar study Hanyu?. International Review of Economics and Finance,21(1), 147-155. http://doi.org/10.1016/j.iref.2011.05.010.
[35] Liu, L., He, Y., & Yang, J. (2016). Productivity and mergers & acquisitions: A macro-level empiri-cal investigation of China. Economic Research Journal, 3, 123-136.
[36] Mariotti, S., & Piscitello, L. (1995). Information costs and location of FDIs within the hostcountry: Empirical evidence from Italy. Journal of International Business Studies, 26(4), 815-841.http://doi.org/10.1057/palgrave.jibs.8490821.
[37] Melitz, J., & Toubal, F. (2014). Native language, spoken language, translation and trade. Journal ofInternational Economics, 93(2), 351-363. http://doi.org/10.1016/j.jinteco.2014.04.004.
[38] Silva, J. M., & Tenreyro, S. (2006). The log of gravity. Review of Economics & Statistics, 88 (4):641658. http://doi.org/10.1162/rest.88.4.641.
[39] Tinbergen, J. (1962). Shaping the world economy: Suggestions for an international economic poli-cy. Twentieth Century Fund, New York.
[40] Xie, M., Wang, T. & Cui, R. (2017). Does China’s cultural output promote outward foreign di-rect investment?An empirical test based on the development of Confucius Institute. China EconomicQuarterly, 4, 1399-1420. http://doi.org/10.13821/j.cnki.ceq.2017.03.07.
[41] Yan, D. (2009). International experience, cultural distance and Chinese firms’ cross-border M&Aperformances. Economic Review, 1, 83-92. http://doi.org/10.19361/j.er.2009.01.012.
19

[42] Yan, D. (2011). A research on the institutional distance, international experience and Chinese over-seas acquisitions. Nankai Economic Studies, 2011(5): 75-97.http://doi.org/10.14116/j.nkes.2011.05.006.
[43] Ye, D., Lian, Y., Huang, Y., Yew-Kwangc, N., & Li, D. (2012). Consumption culture, cognitive biasand consumption anomalies. Economic Research Journal, 2, 80-92.
[44] Zhang, J., Wei, X. & Ebbers, H. (2010). Analysis on the influencing factors of Chi-nese firms’ success in overseas mergers and acquisitions. Management World, 2, 97-107.http://doi.org/10.19744/j.cnki.11-1235/f.2010.03.011
[45] Zhang, J., & Zhou, C. (2010). A study on institutional barriers of Chinese companies going global.Economic Research Journal, 6, 80-91.
[46] Zhao, B. & Li, W. (2008). Analysis of financial risk with the cases of Chinese overseas M&A .Journal of Central University of Finance & Economics, 1, 75-79. http://doi.org/10.3969/j.issn.1000-1549.2008.01.015.
20