cultivating ecosystems: microbial communities in
TRANSCRIPT

University of Wisconsin MilwaukeeUWM Digital Commons
Theses and Dissertations
August 2018
Cultivating Ecosystems: Microbial Communities inRecirculating Aquaculture SystemsRyan BartelmeUniversity of Wisconsin-Milwaukee
Follow this and additional works at: https://dc.uwm.edu/etdPart of the Bioresource and Agricultural Engineering Commons, Ecology and Evolutionary
Biology Commons, and the Microbiology Commons
This Dissertation is brought to you for free and open access by UWM Digital Commons. It has been accepted for inclusion in Theses and Dissertationsby an authorized administrator of UWM Digital Commons. For more information, please contact [email protected].
Recommended CitationBartelme, Ryan, "Cultivating Ecosystems: Microbial Communities in Recirculating Aquaculture Systems" (2018). Theses andDissertations. 1745.https://dc.uwm.edu/etd/1745

CULTIVATING ECOSYSTEMS: MICROBIAL COMMUNITIES IN RECIRCULATING
AQUACULTURE SYSTEMS
by
Ryan P. Bartelme
A Dissertation Submitted in
Partial Fulfillment of the
Requirements for the Degree of
Doctor of Philosophy
in Freshwater Sciences
at
The University of Wisconsin – Milwaukee
August 2018
ii
ABSTRACT
CULTIVATING ECOSYSTEMS: MICROBIAL COMMUNITIES IN RECIRCULATING AQUACULTURE SYSTEMS
by
Ryan P. Bartelme
The University of Wisconsin-Milwaukee, 2018 Under the Supervision of Professor Ryan J. Newton
Intensive cultivation of fish is necessary to meet future global market demands.
Recirculating aquaculture systems (RAS) enable dense growth of fish, while occupying less
space than traditional aquaculture farms. However, RAS often experience complications and
high fish mortalities due to disease and improper waste management. In properly functioning
systems, the microorganisms associated with fish (gut, scales) as well as those found in the
system environment (water, component surfaces) remove waste and maintain fish health by
discouraging growth of opportunistic pathogens. Previous RAS microbiome studies are small in
scope, utilize coarse methods, and contain limited long-term spatial or temporal data. With
advances in computation, microbial ecology, and RAS technology it is possible to test the
relationship between RAS operational management practices and microbial community
composition. Using the RAS at the UW-Milwaukee School of Freshwater Sciences, I used
massively parallel DNA sequencing platforms, cutting-edge fluorescent microscopy, and
classical molecular and microbiological methods to rigorously examine microbial community
structures. Results from this dissertation advance our knowledge of aquaculture by analyzing
RAS microbiota throughout the system over time; evaluate waste removal function, and track
system condition correlations to pathogen blooms. These analyses will provide insight as to how
environmental changes during rearing cycles affect system function and fish health. To

iii
investigate the connection of waste componentry failure to pathogen blooms, this dissertation
uses Flavobacterium columnare as a model organism, since F. columnare infects fish across a
myriad of freshwater systems. Genome sequencing of pathogenic F. columnare strains gives
insight into the metabolic connections between fish waste and persistence of opportunistic
pathogens. By better understanding the role of the microbiome in RAS, we can improve fish
health, optimize waste removal, and increase yields and profits for aquaculturalists.

iv
© Copyright by Ryan Bartelme, 2018 All Rights Reserved

v
TABLE OF CONTENTS
ABSTRACT .............................................................................................................................................. ii
LIST OF FIGURES .............................................................................................................................. vii
LIST OF TABLES ................................................................................................................................. ix
DEDICATION AND ACKNOWLEDGEMENTS ........................................................................... x
1 Introduction ....................................................................................................................................... 1 1.1 Background ................................................................................................................................................ 1 1.2 Literature Review ..................................................................................................................................... 1
2 UW-Milwaukee Recirculating Aquaculture System ................................................................ 7 2.1 Microenvironments within a Recirculating Aquaculture System and Biogeography Across
Recirculating Aquaculture/Aquaponic System Components and Facilities ......................................... 7 Introduction ....................................................................................................................................................................... 8 Materials & Methods ................................................................................................................................................... 11 Results & Discussion ................................................................................................................................................... 18
3 The Nitrogen Cycle in Recirculating Aquaculture ................................................................. 29 3.1 The Importance of Nitrogen Management in RAS ....................................................................... 29 3.2 Freshwater Recirculating Aquaculture System Operations Drive Biofilter Bacterial
Community Shifts Around a Stable Nitrifying Consortium of Ammonia-oxidizing Archaea and
Comammox Nitrospira .................................................................................................................................... 31 Introduction ..................................................................................................................................................................... 34 Materials and Methods ................................................................................................................................................ 37 Results .............................................................................................................................................................................. 48 Discussion ....................................................................................................................................................................... 60
3.3 Loss of Comammox Nitrospira Genotypic Diversity from Recirculating Aquaculture System
Biofilter Inoculum After Fallow Period ..................................................................................................... 68 Introduction ..................................................................................................................................................................... 68 Materials and Methods ................................................................................................................................................ 70 Results and Discussion ................................................................................................................................................ 75
3.4 Enrichment of a Complete Ammonia-Oxidizing Nitrospira From the UW-Milwaukee
Biofilter ............................................................................................................................................................... 82 Introduction ..................................................................................................................................................................... 82 Materials & Methods ................................................................................................................................................... 83 Results & Discussion ................................................................................................................................................... 88
4 Flavobacterium columnare – A Model Freshwater Fish Pathogen ...................................... 93 4.1 Review of F. columnare as an opportunistic fish pathogen in aquaculture ............................. 93 4.2 Strain selection for Transgenic F. columnare Experiments ........................................................ 95 4.3 Construction of a Model GFP Transgenic F. columnare strain to Study Columnaris
Infection ............................................................................................................................................................. 96 4.4 The Cryptic Ecology of F. columnare ............................................................................................. 101
5 Future of Targeted Microbiological Approaches in Aquaculture .................................... 102 5.1 Beyond Basic Recirculating Aquaculture ...................................................................................... 102 5.2 Stripping Away the Soil: Plant Growth Promoting Microbiology Opportunities in
Aquaponics ...................................................................................................................................................... 103

vi
Aquaponics - Stripping Away the Soil ................................................................................................................ 106 The Challenges of Integrated System Design in Aquaponics ...................................................................... 109 Iron Limitation: A Case Study for PGPM Research in Aquaponic Plant Production .......................... 110 The Microbial Future of Aquaponics .................................................................................................................. 113
5.3 Conclusions ........................................................................................................................................... 115
REFERENCES ................................................................................................................................... 118
APPENDICES ..................................................................................................................................... 147 Appendix A – Complete Genome Sequence of the Fish Pathogen Flavobacterium columnare
Strain C#2 ........................................................................................................................................................ 147 Appendix B – Draft Genome Sequence of the Fish Pathogen Flavobacterium columnare Strain
MS-FC-4 ........................................................................................................................................................... 151
CURRICULUM VITAE ................................................................................................................... 155
vii
LIST OF FIGURES Figure 1.1 Diagram of Fish Interaction with RAS Microbiota (Modified from De Schryver and
Vadstein, 2014) .............................................................................................................................................. 2
Figure 1.2 Illustration of UWM RAS Layout and Flow Path .................................................................... 5
Figure 2.1 - Generalized System Diagram of All Components Sampled ............................................ 12 Figure 2.2 Dendrogram of Bray-Curtis Dissimilarity Between UWM RAS Components. Maroon
nodes indicate sludge samples, green nodes indicate biofilter biofilm samples, and blue nodes indicate all planktonic samples. ................................................................................................. 20
Figure 2.3 Cross-System Bray-Curtis Dissimilarity nMDS. Panel A – by Site, Panel B – by Source Water ............................................................................................................................................... 21
Figure 2.4 Heatmap of Top 10 Taxa Across Biofilters (Green columns), Rearing Tanks (Blue columns), and Solids Clarifiers (Maroon columns). ........................................................................ 22
Figure 2.5 Distributions of Bray-Curtis Dissimilarity by Component and Site ................................ 24
Figure 2.6 Distribution of Unique nxrB Genotypes in Aquaponic Systems & RAS ....................... 27
Figure 3.1 Illustration of UWM Biofilter Cross-Section.......................................................................... 38
Figure 3.2 Dendrogram illustrating the bacterial community composition relationships among biofilter water samples .............................................................................................................................. 48
Figure 3.3 nMDS of Bray-Curtis Dissimilarity of Bacterial V6 Sequences at Biofilter Surface Procession Through Ordinate Space in Response to Perch Diet Change .................................. 51
Figure 3.4 Depth Comparison of Bacterial Biofilter Community Composition................................ 52
Figure 3.5 Ammonia-oxidizing Archaea Consensus Tree ....................................................................... 53
Figure 3.6 Ammonia-oxidizing Bacteria Consensus Tree ....................................................................... 55
Figure 3.7 Consensus Trees for Nitrospira-like nxrB (A) and amoA (B) genes ............................... 56
Figure 3.8 Nitrification Marker Gene Concentration Over Time (A) amoA (B) nxrB .................... 57
Figure 3.9 Heatmap of Abundance Pattern Correlations for Nitrifier Genotypes ............................ 59
Figure 3.10 Model Output of Ammonia-oxidizer Cell Concentration as a Function of Biofilter Mean Cell Residence Time (MCRT) .................................................................................................... 60
Figure 3.11 Lab-Scale Biofilter Diagram ..................................................................................................... 70 Figure 3.12 - nMDS plots of Lab-scale Biofilter Bacterial Amplicon Beta-diversity. Panel A
represents Bray-Curtis Dissimilarity from the Proof of Concept Filters, where Green Squares indicate: 100% UWM RAS sand, Blue: 10% UWM RAS sand, Brown: inoculum samples, and Red: no inoculum control. Panel B represents the second experiment filters’ Bray-Curtis Dissimilarity with the commercial starter culture competing against the UWM RAS sand. Orange: 10% UWM RAS sand + starter culture, Brown: inoculum samples, Yellow: Starter Culture + Null sand, and Purple: 10% UWM Sand. .......................................... 76
Figure 3.13 Bray-Curtis Dissimilarity + Average Linkage Dendrogram Across Lab-Scale Biofilter Experiments 1 and 2. Experiment 1 sample colors are as follows, Green: 100% UWM RAS sand, Blue: 10% UWM RAS sand, Brown: inoculum samples, and Red: no inoculum control Experiment 2 sample colors are as follows, Orange: 10% UWM RAS sand + starter culture, Brown: inoculum samples, Yellow: Starter Culture + Null sand, and Purple: 10% UWM Sand. The color codes also correspond to those used in Figure 3.12. .. 77
viii
Figure 3.14 Disribution of Betadispersion Distance to Centroid by Treatment. a) 0% NULL b) 10% UWM c) 100% UWM d) 10% UWM-2 e) 10% UWM+Starter Culture f) Starter Culture+0% NULL z) Inoculum ............................................................................................................ 78
Figure 3.15 Betaproteobacterial amoA Presence-Absence Heatmap. Sample names are indicated on the y-axis labels, and operational taxonomic units (Otu’s) are labeled on the x-axis. Red indicates the prescence of an amoA genotype, while white indicates an absence of the genotype in that particular sample. ....................................................................................................... 80
Figure 3.16 Comammox amoA Genotype Presence-Absence Heatmap. The y-axis labels denote the sample name, and the x-axis denotes the operational taxonomic unit (otu) of the amoA
amplicon. Red indicates the presence of the otu sequence in a sample, while white indicates the absence of the otu. ............................................................................................................................... 80
Figure 3.17 Concatenated Nitrospira Core Pangenome Maximum Likelihood Phylogenomic Tree ................................................................................................................................................................. 89
Figure 3.18 AOB & Comammox Bayesian Coalescent Species Tree .................................................. 90
Figure 3.19 Heatmap of AOB and comammox Metabolic Pathway Completeness ........................ 92
Figure 4.1 Dot Plot: Genome of F. columnare MS-FC-4 vs. C#2 ......................................................... 95
Figure 4.2 - F. columnare MS-FC-4 Expressing GFP from plasmid. 630X Magnification, GFP filter ................................................................................................................................................................ 97
Figure 4.3 Columnar Aggregates of MS-FC-4+gfp on Perca flavescens Gill Epithelia, 400x magnification, GFP filter, wet mounted in DI water in ~2cm welled glass slide. ................... 99
Figure 4.4 Juvenile Perca flavescens GI Tract after exposure to MS-FC-4+gfp. Post-mortem image taken at 400x magnification on an epifluorescent microscope with a gfp filter cube without fixative, mounted in DI water on a slide with a single ~2cm well. ............................ 100

ix
LIST OF TABLES
Table 2.1 High-Throughput Sequencing Primer Sets ........................................................................... 13 Table 2.2 Mean Alpha-Diversity (Shannon-Weaver) & Evenness (Pielou's) within UWM RAS
by Site & Sample category ...................................................................................................................... 18
Table 3.1 Primer Sets Used to Survey UWM Biofilter ............................................................................ 41
Table 3.2 EnvFit - Eigenvector Correlations ............................................................................................... 50
Table 3.3 Nitrification Marker Gene Concentrations in Biofilter Sand ............................................... 58
Table 3.4 Lab-Scale Biofilter List of Materials .......................................................................................... 71
Table 3.5 Ammonia and Nitrite Oxidizing Bacterial Genomes ............................................................. 86 Table 4.1 Primer Sets Used to Construct Suicide Vector with Artificial gfp operon for Double
Recombination in F. columnare MS-FC-4 ......................................................................................... 97
x
DEDICATION AND ACKNOWLEDGEMENTS
First and foremost, I would like to thank Ryan J. Newton and Sandra L. McLellan for
advising me over the course of my doctoral work and taking a chance on a non-traditional
graduate student. If it weren’t for their patience, guidance, and support, this dissertation could
not have turned out as I had hoped. Their expertise in community microbial ecology,
computational biology, and their network of collaborators accelerated my learning and fostered a
nurturing intellectual environment. I would also like to thank my other committee members Jin
Li, Matthew Smith, and Mark McBride for their suggestions and support over the course of this
work. Without access to the aquaculture systems in the Sepulveda-Villet and Binkowski labs,
none of this work would have been possible, and I am grateful for allowing me to sample their
systems. Patricia Bower, Jenny Fisher, Melinda Bootsma, Patrick Anderson, and Deb Dila were
integral in discussing my work and instructing me in laboratory methods. Additionally, I would
be remiss to not mention Paul Barbier, Yongtao Zhu, Tony Garcia, Chris Suchocki, Julia
Zimmer, Katie Halmo, and Steve Binter all aided my laboratory work to complete this
dissertation. I particularly thank Mark Haase, from Sweetwater Organics, for introducing me to
the School of Freshwater Sciences at the University of Wisconsin – Milwaukee. Furthermore,
without the work scheduling support of Wayne Wallner and Matthew Ungermann, I could not
have made the decision to attend my first semester of graduate school.
I would like to dedicate this work to the memory of Robert Biersack, as well as to my
parents, family, friends, and partner Caroline. Without their love and support this work would
not have been possible.

1
1 Introduction
1.1 Background
The original practice of aquaculture dates back approximately 4000 years ago in
ancient China, where the first text was written about pond-based cultivation of Koi
(Cyprinus carpio) (Rabanal, 1988). The practice of cultivating aquatic species in ponds
remained largely unchanged until the development of flow-through and raceway
cultivation methods. All of these cultivation methods for aquatic species are subject to
large external costs (i.e. water use, system footprint). These systems are also susceptible
to environmental perturbations similar to those found in ponds or lakes, for example diel
oxygen dynamics (Timmons and Ebeling, 2013). In the 1970’s, indoor high-density
cultivation of aquatic species was explored using recirculating aquacultural system (RAS)
technology (Timmons and Ebeling, 2013). These systems borrowed technology from the
wastewater and drinking water treatment industries, to allow high-density cultivation of
fish or shellfish with minimal water use. Contemporaneously, experiments were
conducted using supplementary plants to scavenge toxic nitrogenous compounds from
these systems (Lewis et al., 1978; Naegel, 1977; Sneed et al., 1975). These hybrid
aquaculture-hydroponic systems are often called aquaponic systems, a portmanteau of
aquaculture and hydroponics. In the 21st Century, we are only beginning to explore the
potential of RAS or aquaponic systems.
1.2 Literature Review
Increased research and development in integrated aquaculture may help meet global
fisheries demand, while reducing commercial overfishing (Diana et al., 2013). However,
the United States lags behind the world in aquacultural technologies and production. In

2
2013 the United States imported edible fisheries products at a $12.42 billion deficit, even
though overall fisheries productivity in the US increased (NOAA, 2013). Only 11.6% of
United States aquaculture farms that participated in the 2013 USDA Agricultural Census
were utilizing recirculating aquaculture, while the majority of aquaculture products were
from pond and raceway systems (Vilsack and Reilly, 2013). The design and componentry
required by recirculating aquaculture systems (RAS) relies on a consortium of
microorganisms and mechanical devices to process the fish waste. The various parts of
the system allow for minimal wastewater discharge from RAS, while reducing
environmental variance (Tucker and Hargreaves, 2008). In 2050 it is projected that
aquaculture will service the majority of product demand (Diana et al., 2013), therefore
research to better facilitate RAS implementation should play a vital roll in this.
Figure 1.1 Diagram of Fish Interaction with RAS Microbiota (Modified from De Schryver and
Vadstein, 2014)
Despite the farmed fish frequently interacting with three classes of microbiota
(Figure 1.1), applied microbial ecology is underutilized in RAS (De Schryver and
Vadstein, 2014). Whole bacterial and archaeal community analyses of aquaculture
systems are lacking, but the application of these studies to aquaculture management are
broad (De Schryver and Vadstein, 2014). Gut microbiome research is a steadily growing
field of research in aquaculture. For example, the gut microbiomes of traditionally

3
cultivated Rainbow Trout were surveyed using fluorescence in situ hybridization and 16S
Sanger sequences (Huber et al., 2004). While in another study, wild Stickleback gut
microbiomes were sequenced from ten sites near Vancouver, British Columbia, but the
study made little mention of taxonomic assignments or the relative abundances of taxa
(Smith et al., 2015). Recently it was demonstrated that probiotic manipulation of Atlantic
Salmon (Salmo salar) microbiomes had a positive effect on host health after prophylactic
antibiotic exposure. In another S. salar study, the results suggest a fish meal free diet
correlated to changes in gut microbiome composition (Schmidt et al., 2016). While in that
same study, the feed change had no effect on the nitrifying microorganisms inside the
RAS’s biological filters (biofilters).
Nitrogen inputs into RAS consist of undigested feed and the catabolic byproducts
of fish protein metabolism (Timmons and Ebeling, 2013). This is quite different than the
nitrogen cycle redox observed in lakes and oceans, where nitrogen is input from the
atmospheric nitrogen gas fixation (Wetzel, 1983). Commonly, nitrogen budgets in RAS
are calculated relative to feed rate and protein content (Timmons and Ebeling, 2013).
This is often modeled using the following equation where production of total ammonia
nitrogen is relative to: the feeding rate (F) in kg fish feed/day, the protein concentration
of feed (PC), and t is the time period of ammonia production in days (Timmons and
Ebeling, 2013). The equation for estimating TAN production is as follows (Timmons and
Ebeling, 2013):
Production of TAN = � × �� × 0.092�
The constant 0.092 is derived from protein catalysis by the fish reared. Within the
constant calculation, the authors cited 90% of the byproducts from fish protein
catabolism are ammonia (Timmons and Ebeling, 2013). Since ammonia is an inherently

4
toxic compound to fish, nitrifying biofiltration is critical to the success of RAS (Timmons
and Ebeling, 2013). Ammonia oxidation is considered the rate limiting step of
nitrification in the environment and biofiltration (Kowalchuk and Stephen, 2001).
Currently, aquacultural nitrification rates are based on easily cultivated organisms, with
Nitrosomonas spp. performing ammonia oxidation, and Nitrobacter spp. carrying out
nitrite oxidation (Ebeling et al., 2006; Timmons and Ebeling, 2013). The estimation of
ammonia production and assumption of rates based upon easily cultured microorganisms
may lead to inefficient process design, since non-canonical nitrifiers persist in intensive
aquaculture and aquaria (Bagchi et al., 2014; Brown et al., 2013; Kruse et al., 2013;
Sauder et al., 2011).
The mitigation of pathogens is another challenge faced by aquaculture system
managers and operators. Various bacteria, viruses, fungi, and parasites may have
detrimental health consequences for fish in RAS (AFS-FHS, 2014). It is beyond the
scope of any dissertation to broadly focus on pathogens in aquaculture, therefore
Flavobacterium columnare will be used as a model opportunistic pathogen, since F.
columnare infects most freshwater fish (Lafrentz et al., 2012). Suboptimal rearing
conditions, such as low dissolved oxygen, high ammonia levels, elevated nitrite levels, or
overstocking are often associated with outbreaks of F. columnare in aquaculture
(Lafrentz et al., 2012). Little is known about the ecological niche of F. columnare,
though it has been shown to cause yearly die-offs in wild fish (McBride, 2014). Currently
there are limited molecular methods to detect F. columnare before lesions become visible
on the tank stock (Panangala et al., 2007). With few published genomes, many incidences
of infection around the world, and little insight into the ecological role of F. columnare,
this organism was used as a model for both developing detection methodologies and

5
applying microbial ecology to RAS (McBride, 2014; De Schryver and Vadstein, 2014;
Tekedar et al., 2012).
Figure 1.2 Illustration of UWM RAS Layout and Flow Path
This dissertation utilizes the UWM School of Freshwater Sciences RAS as a model
system (Figure 1.2). RAS consist of a rearing tank coupled to devices designed to
maintain optimal water conditions. Buffer tanks may be used to maintain optimum
system pH and amend nutrient deficiencies in multi-trophic systems. Waste management
components that remediate solids and nitrogenous waste are the most critical and
misunderstood devices of RAS (Badiola et al., 2012; Martins et al., 2010). Solid wastes
are composed of undigested feed and feces, which, results in suboptimal water chemistry
when collected outside specific componentry. The UWM SFS RAS uses a modified bead
filter for solid waste capture and settling, these require frequent backwashing to remove
the build up of solids (Pfeiffer and Malone, 2006). Large scale commercial systems, such
as those found at Bell Aquaculture (IN, USA), or the Cold Water Institute (WV, USA),
utilize drum filters and settling tanks appropriated from wastewater treatment technology.
Many systems utilizing solids drum filtration often lack redundant componentry, and
6
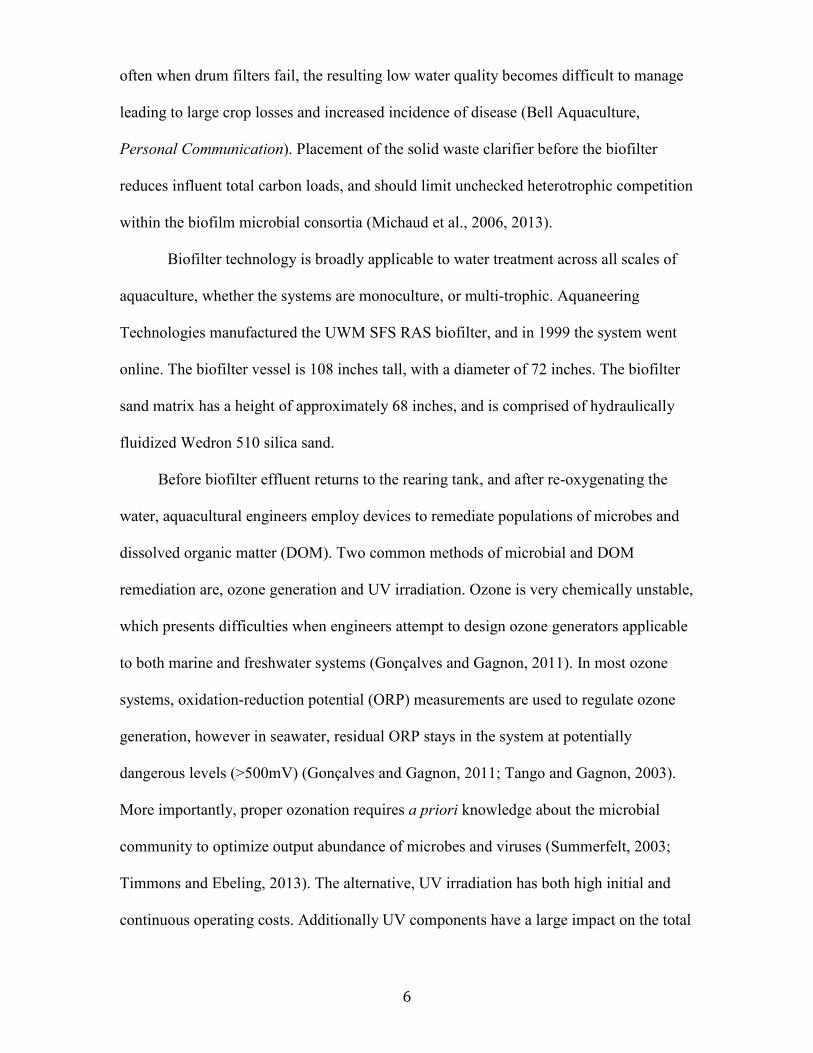
often when drum filters fail, the resulting low water quality becomes difficult to manage
leading to large crop losses and increased incidence of disease (Bell Aquaculture,
Personal Communication). Placement of the solid waste clarifier before the biofilter
reduces influent total carbon loads, and should limit unchecked heterotrophic competition
within the biofilm microbial consortia (Michaud et al., 2006, 2013).
Biofilter technology is broadly applicable to water treatment across all scales of
aquaculture, whether the systems are monoculture, or multi-trophic. Aquaneering
Technologies manufactured the UWM SFS RAS biofilter, and in 1999 the system went
online. The biofilter vessel is 108 inches tall, with a diameter of 72 inches. The biofilter
sand matrix has a height of approximately 68 inches, and is comprised of hydraulically
fluidized Wedron 510 silica sand.
Before biofilter effluent returns to the rearing tank, and after re-oxygenating the
water, aquacultural engineers employ devices to remediate populations of microbes and
dissolved organic matter (DOM). Two common methods of microbial and DOM
remediation are, ozone generation and UV irradiation. Ozone is very chemically unstable,
which presents difficulties when engineers attempt to design ozone generators applicable
to both marine and freshwater systems (Gonçalves and Gagnon, 2011). In most ozone
systems, oxidation-reduction potential (ORP) measurements are used to regulate ozone
generation, however in seawater, residual ORP stays in the system at potentially
dangerous levels (>500mV) (Gonçalves and Gagnon, 2011; Tango and Gagnon, 2003).
More importantly, proper ozonation requires a priori knowledge about the microbial
community to optimize output abundance of microbes and viruses (Summerfelt, 2003;
Timmons and Ebeling, 2013). The alternative, UV irradiation has both high initial and
continuous operating costs. Additionally UV components have a large impact on the total

7
microbial community, including the reduction of potential probiotic organisms from the
system (Summerfelt, 2003; Timmons and Ebeling, 2013). The UWM SFS RAS utilizes
an ozone generator below the degasser tower before degasser effluent is redistributed to
the rearing tank (Figure 1.2). Both UV and ozone generators directly impact the
microbiome of RAS, and add selective pressure to the microbial community unique to
these engineered environments. This dissertation will focus on three levels of inquiry,
ecological context, an in depth analysis of RAS process microbial communities, and
developing new methods to study fish pathogens. Specifically the topics researched are:
comparing the UWM SFS RAS to itself and other systems in the Upper Midwest,
characterizing the biological filter and enriching nitrifiers from the filter substrate, and
using genomics to create a transgenic strain of F. columnare to study infection in larval
and adult fish.
2 UW-Milwaukee Recirculating Aquaculture System
2.1 Microenvironments within a Recirculating Aquaculture System and
Biogeography Across Recirculating Aquaculture/Aquaponic System
Components and Facilities
Ryan P. Bartelme1, Matthew C. Smith1, Osvaldo J Sepulveda-Villet1, & Ryan J. Newton1
1School of Freshwater Sciences, University of Wisconsin-Milwaukee, Milwaukee, WI,
USA
Abstract
Flow-through and pond aquaculture system microbiome management practices mitigate
fish disease and stress. However, recirculating aquaculture system (RAS) operational
success depends directly on system microbial community composition. Each component

8
environment is engineered to a specific microbial niche for waste management, as the
water continually flowing through the system must be processed before returning into the
rearing tank. In this study, we compared waste management component microbiomes
(rearing tank water, pH correction tank, solid waste clarifier, biofilter, and degassing
tower) within a commercial scale freshwater RAS, by high-throughput 16S rRNA gene
sequencing. We found a planktonic bacterial assemblage circulates continuously through
the system, but distinct microbial communities assemble in the nitrifying biofilter and
solids clarifier, reflecting their intended engineered processes. To assess consistency
among freshwater RAS microbiomes, we compared the microbial community
composition among six aquaculture and aquaponic farms. Community assemblages
reflected site and source water relationships, but some sequence variants classified to
Flavobacterium, Cetobacterium, and the family Sphingomonadaceae, were common
across all facilities. The presence of a hydroponic subsystem was a major community
determinant. Nitrifying guilds of ammonia-oxidizing archaea and Nitrospira were also
consistent across systems. The findings of this study suggest core taxa exist across RAS,
independent of system design; but system design appears to inform the individual aquatic
microbiome assemblages.
Introduction
Aquaculture is the cultivation of fisheries products for human use or consumption.
Early system designs consisted of ponds, pens, and continuous water flow-through setups
for cultivating finfish or other products. Now practices also include highly engineered
recirculating aquaculture systems (RAS). These systems are constructed to optimize
water use often achieving a 90-99% reduction in water consumption compared to more
9
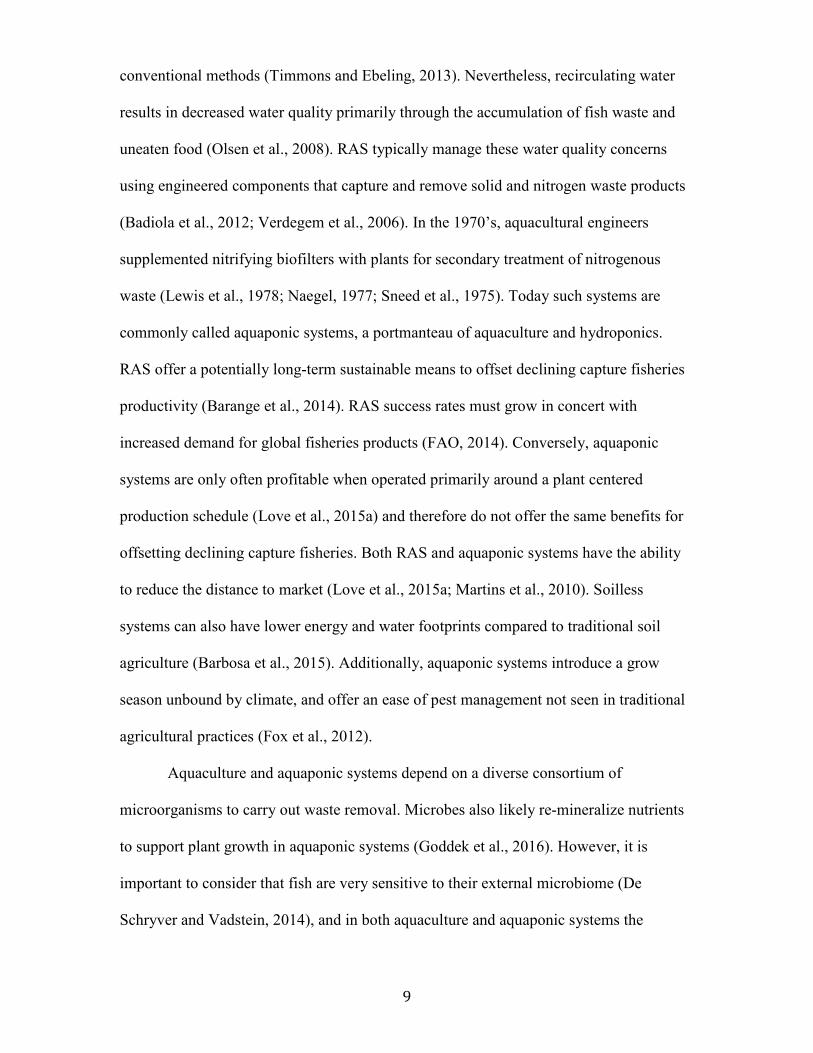
conventional methods (Timmons and Ebeling, 2013). Nevertheless, recirculating water
results in decreased water quality primarily through the accumulation of fish waste and
uneaten food (Olsen et al., 2008). RAS typically manage these water quality concerns
using engineered components that capture and remove solid and nitrogen waste products
(Badiola et al., 2012; Verdegem et al., 2006). In the 1970’s, aquacultural engineers
supplemented nitrifying biofilters with plants for secondary treatment of nitrogenous
waste (Lewis et al., 1978; Naegel, 1977; Sneed et al., 1975). Today such systems are
commonly called aquaponic systems, a portmanteau of aquaculture and hydroponics.
RAS offer a potentially long-term sustainable means to offset declining capture fisheries
productivity (Barange et al., 2014). RAS success rates must grow in concert with
increased demand for global fisheries products (FAO, 2014). Conversely, aquaponic
systems are only often profitable when operated primarily around a plant centered
production schedule (Love et al., 2015a) and therefore do not offer the same benefits for
offsetting declining capture fisheries. Both RAS and aquaponic systems have the ability
to reduce the distance to market (Love et al., 2015a; Martins et al., 2010). Soilless
systems can also have lower energy and water footprints compared to traditional soil
agriculture (Barbosa et al., 2015). Additionally, aquaponic systems introduce a grow
season unbound by climate, and offer an ease of pest management not seen in traditional
agricultural practices (Fox et al., 2012).
Aquaculture and aquaponic systems depend on a diverse consortium of
microorganisms to carry out waste removal. Microbes also likely re-mineralize nutrients
to support plant growth in aquaponic systems (Goddek et al., 2016). However, it is
important to consider that fish are very sensitive to their external microbiome (De
Schryver and Vadstein, 2014), and in both aquaculture and aquaponic systems the

10
individual component microbiomes are connected and can influence fish and/or plant
health (Bartelme et al., 2018; De Schryver and Vadstein, 2014). For example, tank water
microbiota composition was correlated with improved larval fish survival in RAS
(Attramadal et al., 2014) and large taxonomic overlap was observed between the fish gut
microbiota and the rhizosphere of plant roots (Hacquard et al., 2015). These results
suggest microbial community assembly in one component could influence host health in
a separate component. Also, the engineered nature of RAS may alter typical relationships
between hosts and their microbiome, as significant taxonomic differences in gut
microbiome composition between farm raised and wild fish have been noted (Dehler et
al., 2016).
Despite the multifaceted importance of microorganisms to RAS success, RAS
microbiomes are poorly defined. It is not well understood whether one RAS component
influences the community assembly in separate components, how engineered conditions
select for RAS microbiomes, or whether community assemblages are consistent across
many facilities. The connection between fish and plant production microbial communities
is also minimally defined. Ultimately, deciphering the role the microbiome has in both
fish and plant growth may increase system yields.
This study investigated microbiome compositional correlation within a RAS’s
components over a short time-course, and among seven geographically separate
freshwater RAS. To compare bacterial communities within a system, we examined the
RAS at the University of Wisconsin – Milwaukee (UWM) School of Freshwater Sciences
(SFS), which is equivalent to a medium scale commercial system. The microbial
communities in this system were then compared to two other RAS (Marinette and Bell
Aquaculture), three aquaponic systems (Marinette, PortFish, and the Urban Farm

11
Project), and recirculating freshwater aquaria from Discovery World, Milwaukee, WI.
The systems were divided categorically by RAS and aquaponic system, source water,
system scale (small, medium, or large), and species reared. From these comparisons, we
sought to identify microbes that are common across systems and those that distinguish
system component communities. Additionally, we investigated the influences of plant
presence (i.e. aquaponic system) and source water on bacterial community composition.
Since nitrifying guilds are critical to both RAS and aquaponic system success, we
examined nitrifier assemblages in detail across all systems studied.
Materials & Methods
Sample Collection, Processing, & DNA Extraction
We collected samples from the UWM SFS RAS components (rearing tank, pH
tank, solids clarifier, biofilter, and degasser) over a period of 7 months. A generalized
diagram of components sampled across all systems is shown in Figure 2.1 All samples
were collected using autoclaved 500mL plastic bottles. All water samples were filtered
onto 0.22 μm filters (47 mm mixed cellulose esters, EMD Millipore, Darmstadt,
Germany) and frozen at −80°C until further processing. The filtered volume for each
sample is listed in Supplementary Table 1
(https://www.dropbox.com/s/g9lni7p2lb4s8u0/Supplementary_Table1.xlsx?dl=0). If
applicable, biofilter pore water samples were collected and decanted from the biofilter
solid medium substrate, and ~1 gram (wet weight) of remaining substrate was frozen at
−80°C until extracted. Sample sites, available operator data, and weights or volumes of
samples extracted are found in Supplementary Table 1
(https://www.dropbox.com/s/g9lni7p2lb4s8u0/Supplementary_Table1.xlsx?dl=0).

12
Figure 2.1 - Generalized System Diagram of All Components Sampled
Prior to DNA extraction, sample filters were removed from the freezer and
macerated with a sterilized spatula. DNA was then extracted using the MP Bio
FastDNA® SPIN Kit for Soil (MP Bio, Solon, OH, USA) according to the manufacturer's
instructions except that each sample underwent 2 min of bead beating with the MP Bio
FastDNA® SPIN kit's included beads using a Mini-BeadBeater-16 at the units’ fixed
speed (Biospec Products, Inc., Bartlesville, OK, USA). Initial quality of extracts was
assessed using a NanoDrop® Lite (Thermo Fisher Scientific Inc., Waltham, MA, USA).
High-throughput Sequencing Reactions
Two different illumina platforms were utilized for massively parallel paired-end
sequencing of bacterial 16S rRNA gene amplicons. For the within-system component
comparison, we targeted the V6 region of the 16S rRNA gene (Eren et al., 2013)). We
used 5-20 ng of the UWM SFS RAS component DNA extracts in a reaction consisting of
4 units Invitrogen Platinum HiFi Taq polymerase, 2 mM MgSO4, 0.2 mM Invitrogen
dNTPs, and 0.2 µM combined primers (Table 1) at a volume of 100 µl. These master mix
reactions were split in triplicate, amplified with PCR, cleaned, etc. as described in (Eren

13
et al., 2013). Barcoded amplicon libraries were generated and sequenced on an illumina
HiSeq at the Marine Biological Laboratory (MBL) in Woods Hole, MA. For the cross-
site comparisons, the V4-V5 region of the 16S rRNA gene was targeted. Each sample
was PCR amplified in triplicate using three separate Eppendorf Mastercycler Pro
thermocyclers (Eppendorf, Mt Laurel, NJ, USA) with previously published primers
(Table 2.1) purchased from IDT (Integrated DNA Technologies, Coralville, IA, USA).
Prior to library preparation, all PCR products were cleaned using Ampure Beads
(Beckman Coulter, Inc., Brea, CA, USA) and the resultant DNA quality and
concentration of all samples was checked using the BroadRange Qubit 2.0
Spectrophotometric assay (Thermo Fisher Scientific Inc., Waltham, MA, USA). MiSeq
sequencing was carried out at either the Great Lakes Genomic Center (Milwaukee, WI,
USA) or at MBL (Woods Hole, MA, USA).
Table 2.1 High-Throughput Sequencing Primer Sets
Gene
Target Forward Primer(s) (5'-3') Reverse Primer(s) (5'-3')
Component
Surveyed
Sample
Site(s) Citation
Bacterial 16S rRNA gene V6 region
CTAACCGANGAACCTYACC, CNACGCGAAGAACCTTANC, CAACGCGMARAACCTTACC, ATACGCGARGAACCTTACC
CGACRRCCATGCANCACCT All UWM RAS
Eren, et al. 2013
Bacterial 16S rRNA gene V4-V5 region
CCAGCAGCYGCGGTAAN CCGTCAATTCNTTTRAGT, CCGTCAATTTCTTTGAGT, CCGTCTATTCCTTTGANT
All All Nelson, et al. 2014
Archaeal 16S rRNA gene V4-V5 region
GCCTAAAGCATCCGTAGC, GCCTAAARCGTYCGTAGC, GTCTAAAGGGTCYGTAGC, GCTTAAAGNGTYCGTAGC, GTCTAAARCGYYCGTAGC
CCGGCGTTGANTCCAATT Biofilters All Biofilter Samples
Topçuoğlu, et al. 2016
Betaproteobacterial amoA
GGGGHTTYTACTGGTGGT CCCCTCKGSAAAGCCTTCTTC Biofilters All Biofilter Samples
Christman, et al. 2011; Rotthauwe, et al. 1997
Comammox amoA
GGAYTTYTGGNTNGATTGGA WRKTNNGACCACCASKACCA Biofilters All Biofilter Samples
Modified from Fowler, et al. 2018
Nitrospira
nxrB TACATGTGGTGGAACA CGGTTCTGGTCRATCA Biofilters
All Biofilter Samples
Pester, et al. 2013

14
Bacterial rRNA Gene Sequence Data Processing
All bacterial 16S rRNA gene sequences were trimmed of their respective primers
using the Great Lakes Genomic Center GNU parallel implementation of CutAdapt
(Martin, 2011). After primer trimming, reads were merged with PEAR (Zhang et al.,
2014), and the PEAR output was converted from FASTQ format to FASTA using the
FASTX Toolkit. The V6 and V4-V5 16S rRNA gene datasets were decomposed into
representative MED nodes (equivalent to OTU’s/Amplicon Sequence Variants [ASV’s])
with default settings except that the respective minimum substantive abundance cutoffs
were set to 330 and 398, respectively. Chimera checking was carried out against the
SILVA gold reference database with the implementations of Chimera Slayer and Uchime
in mothur (Schloss et al., 2009). Chimeric node sequences were removed from the
FASTA and absolute abundance tables generated by MED before taxonomy or statistical
calculation. Taxonomy was assigned to non-chimeric MED nodes using the SILVA 128
SSU database and SINA online (Pruesse et al., 2012). FASTA files of representative
nodes exceeding the SINA sequence number limit were split using the Great Lakes
Genomic Center’s SplitFA program. MED nodes not matching known bacterial
taxonomies were removed from the MED node absolute counts table and eliminated from
downstream statistical analyses.
Within System Diversity Calculations and Statistical Tests
Alpha- and beta-diversity comparisons were used to test influences on component
bacterial community composition pertaining to the RAS environment and resultant
environmental influences on bacterial taxonomic abundance. Alpha-diversity was
15
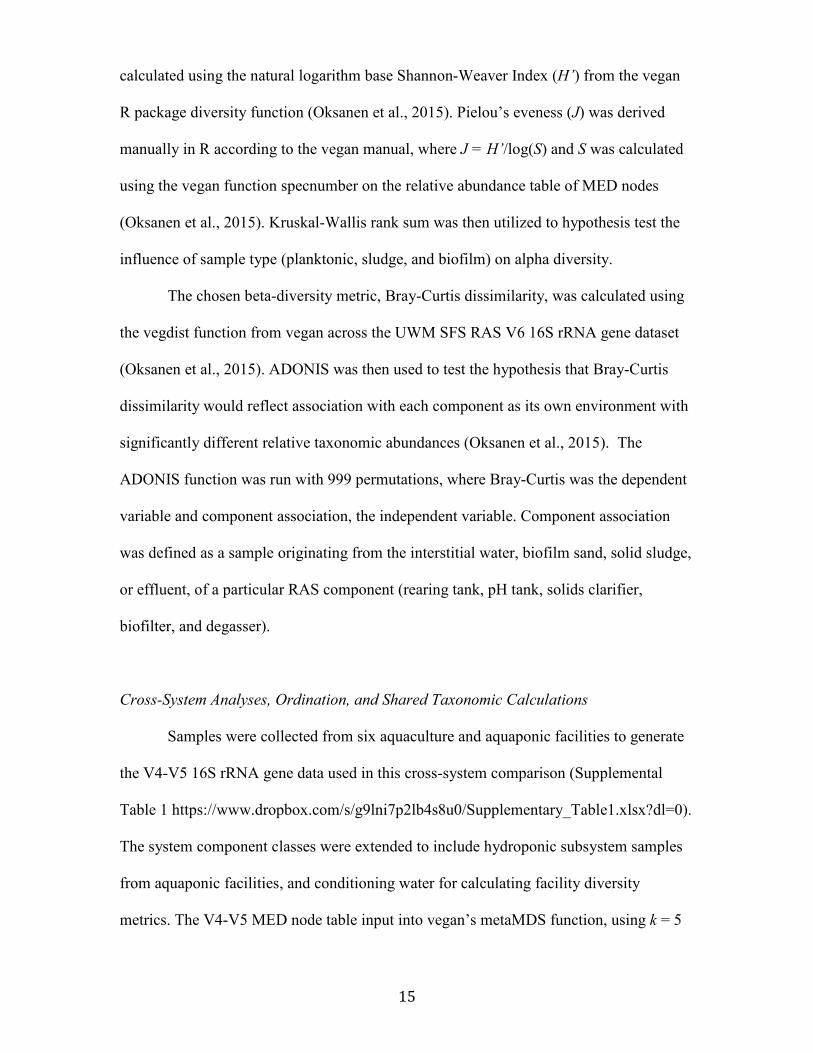
calculated using the natural logarithm base Shannon-Weaver Index (H’) from the vegan
R package diversity function (Oksanen et al., 2015). Pielou’s eveness (J) was derived
manually in R according to the vegan manual, where J = H’/log(S) and S was calculated
using the vegan function specnumber on the relative abundance table of MED nodes
(Oksanen et al., 2015). Kruskal-Wallis rank sum was then utilized to hypothesis test the
influence of sample type (planktonic, sludge, and biofilm) on alpha diversity.
The chosen beta-diversity metric, Bray-Curtis dissimilarity, was calculated using
the vegdist function from vegan across the UWM SFS RAS V6 16S rRNA gene dataset
(Oksanen et al., 2015). ADONIS was then used to test the hypothesis that Bray-Curtis
dissimilarity would reflect association with each component as its own environment with
significantly different relative taxonomic abundances (Oksanen et al., 2015). The
ADONIS function was run with 999 permutations, where Bray-Curtis was the dependent
variable and component association, the independent variable. Component association
was defined as a sample originating from the interstitial water, biofilm sand, solid sludge,
or effluent, of a particular RAS component (rearing tank, pH tank, solids clarifier,
biofilter, and degasser).
Cross-System Analyses, Ordination, and Shared Taxonomic Calculations
Samples were collected from six aquaculture and aquaponic facilities to generate
the V4-V5 16S rRNA gene data used in this cross-system comparison (Supplemental
Table 1 https://www.dropbox.com/s/g9lni7p2lb4s8u0/Supplementary_Table1.xlsx?dl=0).
The system component classes were extended to include hydroponic subsystem samples
from aquaponic facilities, and conditioning water for calculating facility diversity
metrics. The V4-V5 MED node table input into vegan’s metaMDS function, using k = 5

16
dimensions and Bray-Curtis Dissimilarity between samples to calculate nMDS (Oksanen
et al., 2015).
Nitrification Marker Gene Amplification, Multiplex Reaction, and Analysis
A multiplex MiSeq assay was constructed targeting nitrification marker genes:
amoA from Betaproteobacteria, amoA of complete ammonia-oxidizing Nitrospira, nxrB
from Nitrospira, and the V4-V5 region of the Archaea 16S rRNA gene was used to detect
ammonia-oxidizing archaea (Table 2.1). Only samples associated with biological
filtration were used as templates for the multiplex assay. Briefly, copies of the primers
from Table 1 were ordered with illumina TruSeq adapter sequences from IDT (Integrated
DNA Technologies, Coralville, IA, USA). Each 20 µl reaction consisted of Kapa
Biosystems HiFi 2x master mix 10 µl, 200 nM final concentration of forward and reverse
primer, with 10-100 ng of sample gDNA. PCR products were amplified in triplicate
across three separate Eppendorf Mastercycler Pro thermocyclers at the Great Lakes
Genomics Center. Triplicate products were pooled by gene target, and cleaned with
Ampure XP beads according to manufacturers instructions. Concentrations of template
were quantified with QuantIT PicoGreen (ThermoFisher) before pooling the 4-amplicon
types (Supplemental Table 2
https://www.dropbox.com/s/sjhbivsi367g8t7/Supplemental_Table2.xlsx?dl=0). After
quantification amplicons from the four PCR assays were pooled in a volume of 40 µl at
an approximate concentration of 1.8 ng/µl (Betaproteobacterial amoA, Nitrospira nxrB, &
Archaea 16S V4-V5), while 0.9 ng/µl of Comammox amoA products were used to
account for the shorter product length. After pooling, each well was barcoded by sample
using Nextera Adapter sequences.

17
Amplicons were demultiplexed off the MiSeq by their Nextera tags, then merged
and further demultiplexed by target genes using mothur (Schloss et al., 2009). Sequences
were decomposed into unique ASV’s using MED (Eren et al., 2015b). To further de-
noise the amplicon data, 95% clustering of MED node ASV’s was done within mothur
for: Betaproteobacterial amoA, Nitrospira nxrB, and complete-ammonia oxidizing
Nitrospira (comammox) amoA. After representative sequences were denoised, taxonomy
was assigned via two methods. Archaea V4-V5 16S rRNA gene identity was assigned
using SINA and version 128 of the SILVA database (Pruesse et al., 2012). Any unknown
sequences were removed before further analysis. For betaproteobacterial amoA,
comammox amoA, and Nitrospira nxrB, reads were aligned to the ARB databases from
Bartelme et al., 2017. Sequences falling outside (i.e. basal to) the known marker gene
diversity in phylogenetic reconstructions were compared against the NCBI nucleotide
database using blastn on default settings. Those nitrification marker sequences that
matched a small portion of a known corresponding gene were assumed to be chimeras
and removed from downstream analyses.
In order to avoid operating within the error range of our illumina MiSeq
sequencer, remaining ASV’s of the four genes with absolute abundances <10 were
assumed to be noise, lane drift, or chimeras. These abundances were converted to zero
within R before further analysis. Non-amplification of a gene in a sample was also
assumed to be equivalent to an absolute abundance of zero. After the data tables were
cleaned in R, binary Jaccard dissimilarities were calculated for each gene using vegan
(Oksanen et al., 2015). To test correlations between the binary dissimilarity matrices,
Spearman’s ρ Mantel tests were conducted for 999 iterations for all possible pairwise
combinations of the four Jaccard dissimilarities.
18
Results & Discussion
RAS Microenvironments Harbor Distinct Microbial Communities
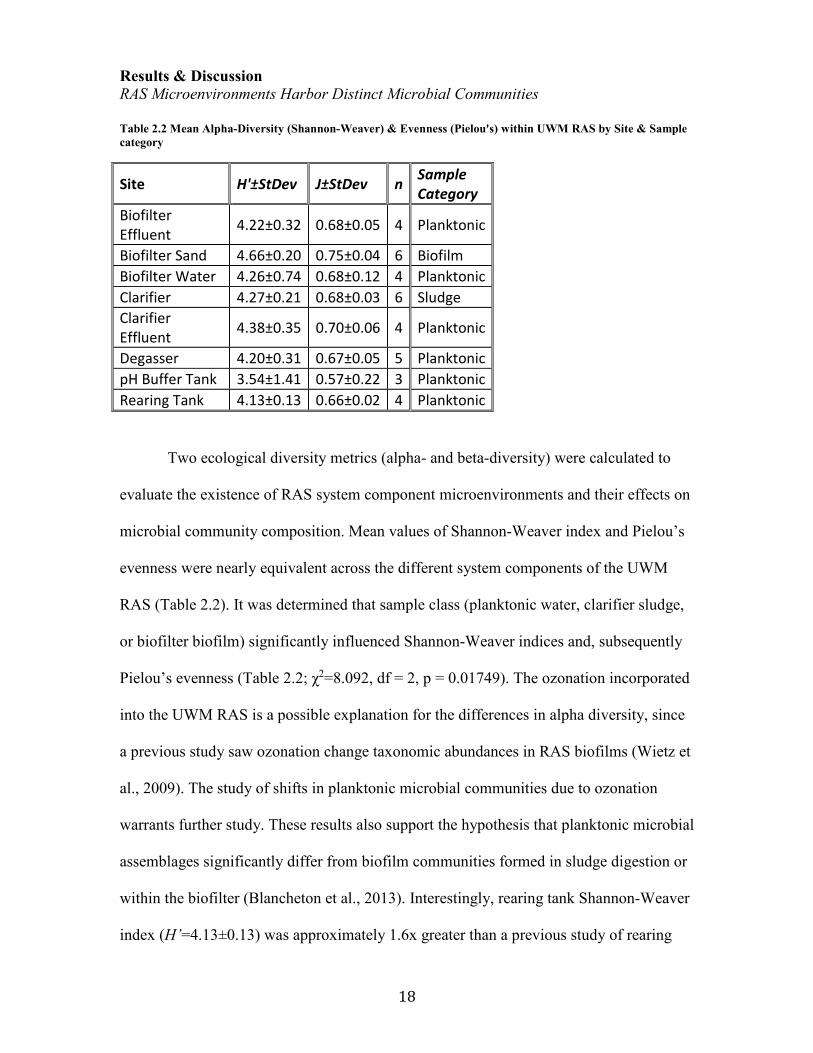
Table 2.2 Mean Alpha-Diversity (Shannon-Weaver) & Evenness (Pielou's) within UWM RAS by Site & Sample
category
Site H'±StDev J±StDev n Sample
Category
Biofilter
Effluent 4.22±0.32 0.68±0.05 4 Planktonic
Biofilter Sand 4.66±0.20 0.75±0.04 6 Biofilm
Biofilter Water 4.26±0.74 0.68±0.12 4 Planktonic
Clarifier 4.27±0.21 0.68±0.03 6 Sludge
Clarifier
Effluent 4.38±0.35 0.70±0.06 4 Planktonic
Degasser 4.20±0.31 0.67±0.05 5 Planktonic
pH Buffer Tank 3.54±1.41 0.57±0.22 3 Planktonic
Rearing Tank 4.13±0.13 0.66±0.02 4 Planktonic
Two ecological diversity metrics (alpha- and beta-diversity) were calculated to
evaluate the existence of RAS system component microenvironments and their effects on
microbial community composition. Mean values of Shannon-Weaver index and Pielou’s
evenness were nearly equivalent across the different system components of the UWM
RAS (Table 2.2). It was determined that sample class (planktonic water, clarifier sludge,
or biofilter biofilm) significantly influenced Shannon-Weaver indices and, subsequently
Pielou’s evenness (Table 2.2; χ2=8.092, df = 2, p = 0.01749). The ozonation incorporated
into the UWM RAS is a possible explanation for the differences in alpha diversity, since
a previous study saw ozonation change taxonomic abundances in RAS biofilms (Wietz et
al., 2009). The study of shifts in planktonic microbial communities due to ozonation
warrants further study. These results also support the hypothesis that planktonic microbial
assemblages significantly differ from biofilm communities formed in sludge digestion or
within the biofilter (Blancheton et al., 2013). Interestingly, rearing tank Shannon-Weaver
index (H’=4.13±0.13) was approximately 1.6x greater than a previous study of rearing

19
tank alpha diversity assessed by DGGE (H’=2.6±0.09), while maintaining similar levels
of Pielou’s evenness, where, respectively, J=0.66±0.02 and J=0.64±0.09 (Attramadal et
al., 2014). In Attramadal et al., the authors postulate that the RAS system selects for K
strategist bacterial assemblages, resulting in increased larval fish survival compared to a
flow through system. However, given the Attamadal et al., 2014 samples, and low
Shannon diversity relative to our results using the illumina HiSeq, it is difficult to
associate K strategist niche occupation as explaining their overall results. Our higher
alpha diversity values indicate massively parallel sequencing may better capture co-
occurring populations in recirculating aquaculture systems than molecular finger printing
methods such as DGGE.

20
Figure 2.2 Dendrogram of Bray-Curtis Dissimilarity Between UWM RAS Components. Maroon nodes indicate
sludge samples, green nodes indicate biofilter biofilm samples, and blue nodes indicate all planktonic samples.
Beta diversity was used to test whether each component was a unique
microenvironment within the UWM SFS RAS. Bray-Curtis dissimilarity results, like the
alpha-diversity measures, cluster approximately by sample class (Figure 2.2), with 27.6%
of the beta-diversity (Bray-Curtis) explained by component association alone (ADONIS,
df = 4, p = 0.001). This clustering pattern and relatively high variance residuals indicates
there is not a complete separation between the microenvironments and is indicative of
interactions between our defined independent variable (component association) and other
system parameters. Most discordant environment linkages resulted from samples

21
classified as sludge that are chronologically linked to non-sludge samples and a division
in linkage patterns between water samples and the sand biofilm samples (Figure 2.2).
Since all RAS components are connected by water flow, any single sampling period
could reflect a relatively high release of microbes from one component (e.g. tank,
biofilter, or digester) into the others. This action would act to homogenize the community
composition across components and explain some of our observed patterns. Additionally,
changes in operator conditions during a rearing cycle can influence RAS microbial
communities (Bartelme et al., 2017). These temporally punctuated whole system changes
also may be acting to homogenize briefly communities across system components.
Figure 2.3 Cross-System Bray-Curtis Dissimilarity nMDS. Panel A – by Site, Panel B – by Source Water
Cross-System Comparison
To assess taxonomic differences in system component microbiomes, community
composition comparisons were made in ordinate space. We found both system site (i.e.
individual facility) (envfit, vegan; R2 0.6491, p=0.001) and water source (envfit, vegan;
R2 0.2179, p=0.001) correlated with beta diversity (nMDS from Bray-Curtis dissimilarity
with k=5 dimensions and stress equal to 0.078; Figure 2.3). System site, as the

22
dominating factor related to community composition, indicates the conditions in each
facility dictate strongly the resultant community assemblages. Although the facilities all
operate differently and have unique community compositions, it was clear source water
shapes the outcome of RAS/aquaponic system microbiomes. This is particularly apparent
when one considers how closely related the system microbiomes are within the
Milwaukee Water Works distribution area. While beta diversity correlated less strongly
with categorical factors such as: system scale (envfit, vegan; R2 0.2016, p=0.001),
component type (envfit, vegan; R2 0.1935, p=0.001), and aquaponics system (binary
TRUE/FALSE; envfit, vegan; R2 0.1510, p=0.001), these factors appear to also inform
microbiome composition. Since all facilities, except Discovery World, rear Yellow Perch
(Perca flavescens), our system comparison results also reflect previously reported tank
effects (Schmidt et al., 2016) on the scale of system operations and source water.
Figure 2.4 Heatmap of Top 10 Taxa Across Biofilters (Green columns), Rearing Tanks (Blue columns), and
Solids Clarifiers (Maroon columns).

23
In contrast to the significant microbial community differences among facilities, some
taxa (represented by unique ASVs) were abundant in all samples (Figure 2.4), showing
that some taxa were maintained across all of the systems investigated. For example, a
high abundance sequence was identified as a potential Cetobacterium spp (>1-5%, in all
but 5 of the rearing tank and solids clarifier samples). Cetobacterium taxa are present in
freshwater fish intestinal tracts (Tsuchiya et al., 2008) and, in one study, occupied >75%
of the fish fecal microbiome (Schmautz et al., 2017). Furthermore, two different
sequences of an unclassified Flavobacterium spp. were respectively represented in either
the solids and rearing tank samples, while a third Flavobacterium spp. sequence was
present in both. Polynucleobacter spp. and Aurantimicrobium spp. were most abundant in
the aquaponic system samples. In the case of the Marinette facility, one tank was
converted from an aquaponic system to a RAS, and the aquaponic taxa were maintained
at the same abundance after conversion. This suggests the potential to maintain
microbiome composition even in response to changes in overall system design. As such,
this highlights the need to better understand the processes that drive and define the onset
of microbial community in RAS and aquaponics, as subtle differences in microbial
assemblages may possibly impart significantly different health, production, and
operations outcomes beyond what is traditionally known. A number of species
associating with the order Rhizobales were present in high abundance across RAS rearing
tanks and biofilters, but could not be taxonomically classified deeper than the order level.
A Sphingomonadaceae sequence (closest cultured relative Sphingorhabdus sp. WM51;
BLASTN: 100% query coverage, e=0.0, 100% identity) was present at relative
abundances >0.001% in all but 12 of the 74 samples. These results were consistent with
what was reported previously in the UWM SFS RAS (Bartelme et al., 2017).

24
Interestingly, these sphingomonads could be a boon for aquaculturalists as some actively
and cooperatively degrade geosmin (Hoefel et al., 2006), which produces off flavors in
fish (Houle et al., 2011). Additionally, when grown in co-culture with a species of
Pseudomonas, a sphingomonad was also shown to degrade 2-methylisoborneol (MEB)
(Eaton, 2012). MEB is another off flavor producing compound in aquaculture systems
(Klausen et al., 2005). It is likely that the high abundance taxa present across
components represent a planktonic community that continuously recirculates through a
given system.
Figure 2.5 Distributions of Bray-Curtis Dissimilarity by Component and Site
Most research on solids clarification in RAS and aquaponics focuses on a reduction
of dissolved organic matter (Wold et al., 2014) and a capture of solids to maintain
nitrification rates in the biological filter (Michaud et al., 2006, 2013). According to recent
reviews, solids management is critical to controlling populations of heterotrophic
bacteria, some of whom may be opportunistic pathogens (Blancheton et al., 2013;
Rurangwa and Verdegem, 2015). Our data suggest that these opportunistic pathogens,
many of which are Flavobacterium spp. may proliferate in the solids capture systems
(Figure 2.4). The heterotrophic bacterial communities and nitrifying guilds recovered
from the biological filters studied resemble those found previously (Bartelme et al., 2017;
Sugita et al., 2005). Examples of top taxonomic assignments shared with these previous
biofilter studies are: uncultured Acidobacteria, uncultured Rhizobiales, as well as

25
Flavobacterium spp. Compared to the rearing tank and solids clarifier samples, the
biofilter heterotrophic community appears to have the least number of taxa shared across
systems (Green columns; Figure 2.4). The filter substrate or operational conditions may
account for the dissimilarity in biofilter taxa recovered. The distinct system biogeography
is probably most apparent in the bacterial V4-V5 biofilter communities, and is also
reflected in the mean Bray-Curtis dissimilarity for biological filters (Figure 2.5). Though
the bacterial communities within and across systems are very dissimilar, they seem to
share the most common taxa in the solids clarifiers and rearing tanks. Whereas, at the
core of each biofilter the nitrifying guilds appear quite conserved, the heterotrophic
community surrounding appears more informed by factors such as system source water.
Nitrifier Guilds Across Biological Filters
Despite biogeographical differences in bacterial community composition, certain
nitrifying consortia were consistent across the systems surveyed. All sites had ASV’s of
ammonia-oxidizing archaea (AOA) (based on 16S rRNA gene sequence) and Nitrospira
(based on nxrB gene sequence). The occurrence patterns of the AOA and Nitrospira
genotypes were correlated across sites (Spearman’s rho Mantel Test: ρ= 0.5212,
p=0.001). Previously we noted that AOA and Nitrospira genotype abundance patterns in
a RAS biological filter were correlated across a fish rearing cycle (Bartelme et al., 2017).
AOA are favored over AOB due to the low in situ concentrations of ammonia in RAS
(Hatzenpichler, 2012). Since ammonia oligotrophy is a design constraint in RAS and
aquaponic systems – this makes sense.
Based on current kinetic experiments (Kits et al., 2017), complete ammonia-
oxidizing Nitrospira (comammox) species should be competitive with AOA in RAS and

26
aquaponic systems. We saw potential for this niche competition as some facility biofilters
contained both AOA and comammox, where the binary beta diversity of the amplicons
was significantly correlated (Spearman’s rho Mantel Test: ρ=0.3871, p=0.001). Although
comammox were previously found in RAS (Bartelme et al., 2017; van Kessel et al.,
2015), we found their appearance in this study’s surveyed samples to be informed by
system water source. Predominantly, the comammox amoA amplicons were recovered
from samples inside the Lake Michigan water basin (there were three outlier samples: 2
with groundwater fed system water and 1 from the Mississippi River). It is also possible,
given how recently discovered comammox were, that the primers developed at the time
of this writing do not fully capture the diversity of comammox amoA.
In this study, we found a diverse number of comammox Nitrospira amoA
genotypes in systems with source water from the Lake Michigan area (PortFish, UWM
RAS, and Discovery World; Marinette did not). The Urban Farm Project samples lacked
comammox, and comammox was detectable in only three of the five samples from Bell
Aquaculture. This association may originate in the drinking water treatment plant
(DWTP), as DWTP’s often contain comammox in rapid sand filters (Fowler et al., 2018;
Palomo et al., 2016; Pinto et al., 2015) and have been enriched from point of use (Wang
et al., 2017). These results indicate a potential for ammonia-oxidizer seeding based upon
system source water. Unsurprisingly, in samples containing comammox amoA amplicons,
we found them to correlate with nxrB genotype occurrence patterns (Spearman’s rho
Mantel Test: ρ=0.4411, p=0.001).

27
Figure 2.6 Distribution of Unique nxrB Genotypes in Aquaponic Systems & RAS
When examining nxrB genotypes, as a proxy for nitrite-oxidation potential,
aquaponic facilities harbored significantly more genotypes of Nitrospira nxrB than RAS
(Figure 2.6; Kruskal Wallis Rank Sum χ2= 5.2134, df=1, p=0.02241). Some of the
differences could be accounted for by the presence of nxrB genotypes from comammox,
since nxrB does not often distinguish comammox from NOB Nitrospira (Daims et al.,
2016). To the best of our knowledge we believe this is the first such comparison of the
recovery of Nitrospira nxrB genotypes from aquaponic and RAS facilities. It is unknown
whether or not this is a consequence from increased trophic levels in an aquaponic
system, driven by source water, or simply a stochastic event. Regardless, the mechanism
of this selection merits further study, since these results suggest the potential for nitrogen
cycle niche partitioning in aquaponic systems and may thusly increase system wide
nitrifier diversity.
28
Conclusions
Despite differences in operations and beta-diversity all facilities retained some
common (i.e. core) taxa associated with each of the major components (Rearing Tank,
Solids Clarifier, and Biofilter). Although dominant taxa occur across all systems, it is
apparent that source water and components shape overall community composition.
While, within each facility, each component appears to drive overall community
structure, but due to water recycling these component communities may be more similar
on short time-scales. The results of this study offer some support for the decoupled
aquaponic system model (Goddek et al., 2016), since the beta diversity within a single
system, and across systems is coupled to component class. By decoupling components, in
RAS or aquaponics, we can avoid unwittingly designing a system’s “Achilles Heel”. One
of the systems surveyed had continual issues with solids clarifier failure, which in turn
led to a suppression of nitrification, spike in nitrite levels, and subsequent die off of fish
due to Flavobacterium columnare outbreaks. Since each component could, based on the
results of this study, be considered its own microenvironment, decoupling components
would allow aquaculturalists and aquaponics practitioners a greater level of system
control.
The nitrogen cycle marker work in this study presented a novel schema for
surveying nitrification using massively parallel sequencing technologies. After
conducting our survey of nitrogen cycle amplicon markers, it is apparent that the
AOA+NOB nitrifiying guild seems to be the most common across freshwater aquaria and
RAS (Bagchi et al., 2014; Bartelme et al., 2017; Sauder et al., 2011). It is still unclear as
to why comammox Nitrospira appear in these systems; however, the most oligotrophic
systems that contained fluidized sand filters harbored comammox. Rapid sand filters

29
(RSF) used in drinking water treatment have been shown to harbor comammox (Palomo
et al., 2016; Pinto et al., 2015), and have even been found in RSF’s processing
groundwater (Fowler et al., 2018). But the commonality across DWTP’s RSF and
freshwater RAS biofilters merit further study as the trends we saw reflected those
previously found in DWTP’s, but are inconclusive. It is also worth noting that, although
the aquaculture practitioners from our survey were knowledgeable about nitrification as a
system process, many believed that Nitrosomonas and Nitrobacter species were the sole
nitrifying taxa present. The results from this study and others (Hovanec and DeLong,
1996) indicate this is not the nitrification schema we see in operational RAS, and it is our
recommendation that aquacultural organizations incorporate new nitrogen cycle findings
into stakeholder outreach plans to better inform system operators when they select starter
cultures or substrate for a biological filter. Furthermore, our work suggests, like these
reviews (Bartelme et al., 2018; Munguia-Fragozo et al., 2015; De Schryver and Vadstein,
2014), more “-omics” studies would benefit both aquaculture and aquaponic system
development.
Acknowledgments – The authors thank all facilities that allowed us to sample their
systems for this study. This project used the University of Wisconsin—Milwaukee Great
Lakes Genomics Center DNA sequencing and bioinformatics services. R.P.B. was
supported by a fellowship from the University of Wisconsin—Milwaukee Graduate
School.
3 The Nitrogen Cycle in Recirculating Aquaculture
3.1 The Importance of Nitrogen Management in RAS

30
In recirculating aquaculture systems, nitrogen management is critical to
operational success. The total ammonia nitrogen production (PTAN) is estimated by the
following equation: ���� = �∗��∗ . !"# , where F is the feeding rate in kg/day, PC is the
protein concentration of the feed, and t is a time period in days (Timmons and Ebeling,
2013). The 0.092 constant accounts for fish protein catabolism producing an approximate
ratio of 90% ammonia to 10% urea (Timmons and Ebeling, 2013). Unionized ammonia is
toxic to fish, while at a neutral pH, the concentration of unionized ammonia is minimal
(~0.7%), as pH increases the concentration goes up exponentially (Timmons and Ebeling,
2013). Nitrite, which is produced as a nitrification intermediate, is also toxic to fish.
Nitrite will react with the heme of fish hemoglobin, changing the oxidative state of iron,
thereby inducing methemoglobinemia and oxidative stress in the fish (Timmons and
Ebeling, 2013). The toxicity of either nitrogen species is fish dependent, but independent
of aquatic species reared, all systems rely on guilds of nitrogen cycling organisms to
facilitate waste remediation. Since, nitrate accumulation in freshwater RAS is assumed
to be benign due to its low toxicity (Lee et al., 2000). For example, Atlantic Salmon
(Salmo salar), during the post-smolt transition from freshwater to saltwater, there were
no adverse reproductive or physiological effects at nitrate levels of ~100mg/L (Davidson
et al., 2017; Good et al., 2017). Largely, denitrification processes have been utilized in
aquaculture systems to mitigate nitrate levels in waste discharge (Klas et al., 2006),
where the processes closely resemble a traditional waste water treatment plant. There is
little information on the effects of nitrate in Perca flavescens reared in RAS. The
experiments in this dissertation focus on aerobic nitrification in the UW-Milwaukee RAS
and investigated chemolithoautotrophic nitrifier community assemblies.

31
Nitrification in the UWM SFS RAS was interrogated in 3 separate ways, apart
from the amplicon survey in Chapter 2 of this dissertation. First, an in-depth
characterization of nitrifier and heterotrophic bacterial genotypes were assessed in the
biological filter over time (Bartelme, et al. Frontiers in Microbiology, 2017). The
Archaeal community was also investigated and consisted of multiple 16S rRNA
genotypes associated with ammonia-oxidizing archaea. Second, scaled down biological
filters were constructed to manipulate nitrifier inocula in the laboratory and measure the
response of nitrifiers from a period of system dormancy. In these experiments, the
dormant nitrifying consortia were challenged with a commercially available aquarium
biofilter starter culture. Last, a complete ammonia-oxidizing Nitrospira (comammox)
species was enriched from the biological filter within the UWM SFS RAS, analyzed by
shotgun metagenomic sequencing, and characterized versus other known comammox
assemblies.
3.2 Freshwater Recirculating Aquaculture System Operations Drive
Biofilter Bacterial Community Shifts Around a Stable Nitrifying
Consortium of Ammonia-oxidizing Archaea and Comammox Nitrospira
Modified from the published form in Frontiers in Microbiology, Please See the Published
Work for Supplemental Materials (doi: 10.3389/FMICB.2017.00101)
Authors: Ryan P. Bartelme1, Sandra L. McLellan1, and Ryan J. Newton1*
1School of Freshwater Sciences, University of Wisconsin-Milwaukee, Milwaukee, WI
USA.

32
Running title: Recirculating aquaculture biofilter microorganisms
Keywords: recirculating aquaculture system, biofilter, nitrifiers, ammonia-oxidizing
archaea, comammox, microbial communities, Nitrospira
*Correspondence: Ryan J. Newton University of Wisconsin-Milwaukee School of Freshwater Sciences Great Lakes Research Facility 600 E. Greenfield Ave. Milwaukee, WI 53204 USA. [email protected]
33
Abstract: Recirculating aquaculture systems (RAS) are unique engineered ecosystems
that minimize environmental perturbation by reducing nutrient pollution discharge. RAS
typically employ a biofilter to control ammonia levels produced as a byproduct of fish
protein catabolism. Nitrosomonas (ammonia-oxidizing), Nitrospira and Nitrobacter
(nitrite-oxidizing) species are thought to be the primary nitrifiers present in RAS
biofilters. We explored this assertion by characterizing the biofilter bacterial and archaeal
community of a commercial scale freshwater RAS that has been in operation for >15
years. We found the biofilter community harbored a diverse array of bacterial taxa
(>1000 genus-level taxon assignments) dominated by Chitinophagaceae (~12%) and
Acidobacteria (~9%). The bacterial community exhibited significant composition shifts
with changes in biofilter depth and in conjunction with operational changes across a fish
rearing cycle. Archaea also were abundant, and were comprised solely of a low diversity
assemblage of Thaumarchaeota (>95%), thought to be ammonia-oxidizing archaea
(AOA) from the presence of AOA ammonia monooxygenase genes. Nitrosomonas were
present at all depths and time points. However, their abundance was >3 orders of
magnitude less than AOA and exhibited significant depth-time variability not observed
for AOA. Phylogenetic analysis of the nitrite oxidoreductase beta subunit (nxrB) gene
indicated two distinct Nitrospira populations were present, while Nitrobacter were not
detected. Subsequent identification of Nitrospira ammonia monooxygenase alpha subunit
genes in conjunction with the phylogenetic placement and quantification of the nxrB
genotypes suggests complete ammonia-oxidizing (comammox) and nitrite-oxidizing
Nitrospira populations co-exist with relatively equivalent and stable abundances in this
system. It appears RAS biofilters harbor complex microbial communities whose

34
composition can be affected directly by typical system operations while supporting
multiple ammonia oxidation lifestyles within the nitrifying consortium.
Introduction
The development of aquacultural technology allows societies to reduce
dependency on capture fisheries and offset the effects of declining fish numbers (Barange
et al., 2014). Aquaculture production now accounts for nearly 50% of fish produced for
consumption, and estimates indicate a 5-fold increase in production will be required in
the next two decades to meet societal protein demands (FAO, 2014). However,
expanding production will increase the environmental impact of aquaculture facilities and
raises important concerns regarding the sustainability of aquaculture practices.
Recirculating aquaculture systems (RAS) have been developed to overcome pollution
concerns and stocking capacity limits of conventional terrestrial aquaculture facilities
(Chen et al., 2006a; Martins et al., 2010). RAS offer several advantages over traditional
flow-through systems including: 90-99% reduced water consumption (Badiola et al.,
2012; Verdegem et al., 2006), more efficient waste management (Piedrahita, 2003), and
potential for implementation at locations that decrease distance to market (Martins et al.,
2010). RAS components are similar to those used in wastewater treatment, including
solids capture and removal of nitrogenous waste from excess animal waste and
undigested feed. The advancement of RAS technology and advantages over flow-through
systems has led to increasing RAS use, especially among countries that place high value
on minimizing environmental impacts (Badiola et al., 2012) and in urban areas where
space is limiting (Klinger and Naylor, 2012).
Nitrifying biofilters are a critical component of most RAS and an important
determinant of operational success. These biofilters are also cited as the biggest hurdle

35
for RAS start-up and the most difficult component to manage once the RAS is in
operation (Badiola et al., 2012). RAS biofilters act to remove nitrogenous waste
byproducts generated by fish protein catabolism and oxidation processes. Ammonia and
nitrite are of most concern to freshwater aquaculturalists, with the toxic dose of both
nitrogen species depending on pH and the aquatic organism being reared (Lewis and
Morris, 1986; Randall and Tsui, 2002). In RAS process engineering, designers typically
cite the principle nitrifying taxa as Nitrosomonas spp. (ammonia-oxidizers) and
Nitrobacter spp. (nitrite-oxidizers) (Kuhn et al., 2010) and model system capacity from
these organisms’ physiologies (cite Ebeling & Timmons book). It is now clear
Nitrosomonas and Nitrobacter are typically absent or in low abundance in freshwater
nitrifying biofilters (Hovanec and DeLong, 1996) while Nitrospira spp. are common
(Hovanec et al., 1998). More recent studies of freshwater aquaculture biofilters have
expanded the nitrifying taxa present in these systems to include ammonia-oxidizing
archaea (AOA), a variety of Nitrospira spp., and Nitrotoga (Bagchi et al., 2014; Hüpeden
et al., 2016; Sauder et al., 2011). Further studies are needed to understand whether other
nitrifying consortia co-inhabit RAS biofilters with Nitrosomonas and Nitrobacter spp., or
if diverse assemblages of nitrifying organisms are characteristic of high-functioning
systems. A more refined understanding of RAS biofilter nitrifying consortia physiology
would inform system design optimization and could alter parameters that are now
considered design constraints.
The non-nitrifying component of RAS biofilter communities also impact biofilter
function. Heterotrophic biofilm overgrowth can limit oxygen availability to the
autotrophic nitrifying community resulting in reduced ammonia-oxidation rates (Okabe et
al., 1995). Conversely, optimal heterotrophic biofilm formation protects the slower-
36
growing autotrophs from biofilm shear stress and recycles autotrophic biomass
(Kindaichi et al., 2004). Previous studies have suggested the diversity of non-nitrifying
microorganisms in RAS biofilters could be large and sometimes contain opportunistic
pathogens and other commercially detrimental organisms (Schreier et al., 2010).
However, most of these studies used low-coverage characterization methods (e.g. DGGE,
clone libraries) to describe the taxa present, so the extent of this diversity and similarity
among systems is relatively unknown. Recently, the bacterial community of a set of
seawater RAS biofilters run with different salinity and temperature combinations was
characterized with massively parallel sequencing technology (Lee, et. al., 2016). This
study provided the first deeper examination of a RAS biofilter microbial community, and
revealed a highly diverse bacterial community that shifted in response to environmental
conditions but more consistent nitrifying assemblage typically dominated by Nitrospira-
classified microorganisms.
In this study, we aimed to deeply characterize the bacterial and archaeal
community structure of a commercial-scale freshwater RAS raising Perca flavescens
(Yellow perch) employing a fluidized sand biofilter that has been in operation for more
than 15 years. We hypothesized that the biofilter sand biofilm community would exhibit
temporal variability linked to environmental changes associated with the animal rearing
process and a diverse nitrifying assemblage. To address these questions, we used
massively parallel sequencing to characterize the bacterial and archaeal biofilter
community across depth and time gradients. We also identified and phylogenetically
classified nitrification marker genes for the ammonia monooxygenase alpha subunit
(amoA; Rotthauwe et al., 1997; Pester et al., 2012; van Kessel et al., 2015) and nitrite
oxidoreductase alpha (nxrA; Poly et al., 2008; Wertz et al., 2008) and beta (nxrB; Pester

37
et al., 2013) subunits present in the biofilter, and then tracked their abundance with
biofilter depth and over the course of a fish rearing cycle.
Materials and Methods
UWM Biofilter Description
All samples were collected from the University of Wisconsin-Milwaukee Great
Lakes Aquaculture Facility RAS biofilter (UWM biofilter). Measured from the base, the
biofilter stands ~2.74 meters tall, with a diameter of ~1.83 meters. The water level within
the biofilter is approximately ~2.64 meters from the base, with the fluidized sand filter
matrix extending to a height of ~1.73 meters from the base. The biofilter is filled with
Wedron 510 silica sand, which is fluidized to ~200% starting sand volume by the use of
19 schedule 40 PVC probes, each with a diameter of 3.175 cm. The probes receive
influent from the solid waste clarifier, which upwells through the filter matrix. Samples
for this study were taken at three depths within the fluidized sand biofilter, defined as
surface (~1.32-1.42 m from biofilter base), middle (~0.81-0.91 m from biofilter base),
and bottom (~0.15- 0.30 m, from biofilter base). Depictions of the UWM biofilter and
sample sites are shown in Figure 3.1. The maximum flow rate of the biofilter influent is
757 liters per minute, which gives a hydraulic residence time of ~9.52 minutes. Typical
system water quality parameters are as follows (mean ± standard deviation): pH 7.01 ±
0.09, oxidation-reduction potential 540 ± 50 (mV), water temperature 21.7 ± 0.9 (°C),
and biofilter effluent dissolved oxygen (DO) 8.20 ± 0.18 mg/L. The biofilter is designed
to operate maximally at 10 kg feed per day, which is based on the predicted ammonia
production by fish protein catabolism at this feeding rate (Timmons & Ebeling, 2013).

38
Figure 3.1 Illustration of UWM Biofilter Cross-Section
Sample Collection, Processing, & DNA Extraction
Samples from the top of the biofilter matrix were collected in autoclaved 500 mL
polypropylene bottles. Two samples from the surface of the biofilter were collected
during the final two months of one Yellow perch rearing cycle and then immediately
before the initiation of a new rearing cycle in the system. After stocking the system with
fish, samples were collected approximately every week through the first half of the new
rearing cycle (the strains of Yellow perch present during this study need ~9 months to
grow to market size). Following collection, water from the biofilter matrix samples was
decanted into a second sterile 500 mL bottle for further processing. Then, approximately
one gram wet weight sand was removed from the sample bottle and frozen at -80 degrees
Celsius for storage prior to DNA extraction. Water samples were filtered onto 0.22 m
filters (47 mm mixed cellulose esters, EMD Millipore, Darmstadt, Germany), frozen at -
80°C, and macerated with a sterilized spatula prior to DNA extraction. To separately
address the spatial distribution of bacterial taxa, depth samples were taken from the filter
matrix by using 50 mL syringes with attached weighted Tygon tubing (3.2mm ID, 6.4mm
OD) (Saint-Gobain S.A., La Défense, Courbevoie, France). Samples were binned into
39
categories by approximate distance from the filter base as surface, middle and bottom.
Tubing was sterilized with 10% bleach and rinsed 3X with sterile deionized water
between sample collections. DNA was extracted separately from biofilter sand and water
samples (~1 g wet weight and 100 mL respectively) using the MP Bio FastDNA® SPIN
Kit for Soil (MP Bio, Solon, OH, USA) according to the manufacturer’s instructions
except that each sample underwent two minutes of bead beating with the MP Bio
FastDNA® SPIN kit’s included beads at the Mini-BeadBeater-16’s only operational
speed (Biospec Products, Inc., Bartlesville, OK, USA). DNA quality and concentration
was checked using a NanoDrop™ Lite (Thermo Fisher Scientific Inc., Waltham, MA,
USA). Sample details and associated environmental data and molecular analyses are
listed in Table S1.
Ammonia and Nitrite Measurements
For both the time series and depth profiles, a Seal Analytical AA3 Autoanalyzer
(Seal Analytical Inc., Mequon, WI, USA) was used to quantify ammonia and nitrite,
using the manufacturer’s supplied phenol and sulfanilamide protocols on two separate
channels. To quantify only nitrite, the cadmium reduction column was not incorporated
into the Auto Analyzer. RAS operators recorded all other chemical parameters from
submerged probes measuring temperature, pH, and oxidation-reduction potential. Per the
laboratory standard operating procedure, RAS operators used Hach colorimetric kits to
measure rearing tank concentrations of ammonia and nitrite.
16S rRNA Gene Sequencing
To maximize read depth for a temporal study of the biofilter surface communities,
we used the illumina HiSeq platform and targeted the V6 region of the 16S rRNA gene
for Archaea and Bacteria separately. In total, we obtained community data from fifteen

40
dates for the temporal analysis. To interrogate changes in the spatial distribution of taxa
across depth in the biofilter and obtain increased taxonomic resolution, we used 16S
rRNA gene V4-V5 region sequencing on an illumina MiSeq. We obtained samples from
three depths n=5 for the surface, n=5 for the middle, and n=4 for the bottom. Sample
metadata are listed in Table S1. Extracted DNA samples were sent to the Josephine Bay
Paul Center at the Marine Biological Laboratory (V6 Archaea and V6 Bacteria; V4-V5
samples from 12/8/2014 & 2/18/2015) and the Great Lakes Genomic Center (V4-V5
samples from 11/18/2014, 12/2/2014, 12/18/2014) for massively parallel 16S rRNA gene
sequencing using previously published bacterial (Eren et al., 2013) and archaeal (Meyer
et al., 2013) V6 illumina HiSeq and bacterial V4-V5 illumina MiSeq chemistries (Huse et
al., 2014b; Nelson et al., 2014). Reaction conditions and primers for all illumina runs are
detailed in the aforementioned citations, and may be accessed at:
https://vamps.mbl.edu/resources/primers.php#illumina. Sequence run processing and
quality control for the V6 dataset are described in Fisher et al., 2015, while CutAdapt was
used to trim the V4-V5 data of low quality nucleotides (phred score < 20) and primers
(Fisher et al., 2015; Martin, 2011). Trimmed reads were merged using Illumina-Utils as
described previously (Newton et al., 2015). Minimum entropy decomposition (MED) was
implemented on each dataset to group sequences (MED nodes = operational taxonomic
units, OTUs) for among sample community composition and diversity analysis (Eren et
al., 2015b). MED uses information uncertainty calculated via Shannon entropy at all
nucleotide positions of an alignment to split sequences into sequence-similar groups
(Eren et al., 2015b). The sequence datasets were decomposed with the following
minimum substantive abundance settings: bacterial V6, 377; archaeal V6, 123; bacterial
V4-V5, 21. The minimum substantive threshold sets the abundance threshold for MED

41
node (i.e. OTU) inclusion in the final dataset. Minimum substantive abundances were
calculated by dividing the sum total number of 16S rRNA gene sequences per dataset by
50,000 as suggested in the MED best practices (sequence counts are listed in Table S2).
The algorithm Global Alignment for Sequence Taxonomy (GAST) was used to assign
taxonomy to sequence reads (Huse et al., 2008), and the website Visualization and
Analysis of Microbial Population Structures (VAMPS) (Huse et al., 2014a), was used for
data visualization.
Table 3.1 Primer Sets Used to Survey UWM Biofilter
Cit
ati
on
(Chr
istm
an e
t al.,
201
1;
Rot
thau
we
et a
l., 1
997)
(Chr
istm
an e
t al.,
201
1)
(Pes
ter
et a
l., 2
012;
Tou
rna
et
al.,
2008
)
Fw
d (L
uesk
en e
t al.,
201
1) &
R
ev T
his
Stu
dy
Fw
d (P
oly
et a
l., 2
008)
& R
ev
(Wer
tz e
t al.,
200
8)
(Pes
ter
et a
l., 2
013)
Mod
ifie
d fr
om (
Gan
tner
et a
l.,
2011
)
(Øvr
eås
and
Tor
svik
, 199
8)
Thi
s S
tudy
Thi
s S
tudy
Thi
s S
tudy
Thi
s S
tudy
Thi
s S
tudy
Thi
s S
tudy

42
Th
erm
ocycle
r T
emp
era
ture
Pro
gram
s
1x 9
5˚C
5:0
0 m
in; 3
0x 9
5˚C
0:3
0 m
in, 5
3˚C
0:3
0 m
in, 7
2˚C
0:3
0 m
in; 1
x 72
˚C 7
:00
min
1x 9
5˚C
5:0
0 m
in; 3
0x 9
5˚C
0:3
0 m
in, 4
8˚C
0:3
0 m
in, 7
2˚C
0:3
0 m
in; 1
x 72
˚C 7
:00
min
1x 9
5˚C
5:0
0 m
in; 3
0x 9
5˚C
0:3
0 m
in, 5
0˚C
0:3
0 m
in, 7
2˚C
0:3
0 m
in; 1
x 72
˚C 7
:00
min
1x 9
5˚C
10:
00 m
in; 3
5x 9
5˚C
0:4
0 m
in, 5
6˚C
0:4
0 m
in, 7
2˚C
0:1
5 m
in; 1
x 72
˚C 7
:00
min
1x 9
4˚C
5:0
0 m
in; 3
5x 9
4˚C
0:3
0 m
in, 5
5˚C
0:4
5 m
in, 7
2˚C
1:0
0 m
in; 1
x 72
˚C 1
0:00
min
1x 9
5˚C
, 5:0
0 m
in; 3
5x 9
5˚C
0:4
0 m
in, 5
0˚C
0:4
0 m
in, 7
2˚C
1:3
0 m
in; 1
x 72
˚C 1
0:00
min
1x 9
5˚C
10:
00 m
in; 4
0x 9
5˚C
0:1
5 m
in, 5
8˚C
0:1
5 m
in, 7
2˚C
0:1
5 m
in
1x 9
5˚C
10:
00 m
in, 4
0x 9
5˚C
0:1
5 m
in, 5
3˚C
0:1
5 m
in, 7
2˚C
0:1
5 m
in
1x 9
5˚C
2:0
0 m
in; 4
0x 9
5˚C
0:0
5 m
in, 6
2˚C
0:4
5 m
in
1x 9
5˚C
2:0
0 m
in; 4
0x 9
5˚C
0:0
5 m
in, 6
1˚C
0:4
5 m
in
1x 9
5˚C
2:0
0 m
in; 4
0x 9
5˚C
0:0
5 m
in, 6
0˚C
0:4
5 m
in
1x 9
5˚C
2:0
0 m
in; 4
0x 9
5˚C
0:0
5 m
in, 6
7˚C
0:4
5 m
in
1x 9
5˚C
2:0
0 m
in; 4
0x 9
5˚C
0:0
5 m
in, 6
5˚C
0:4
5 m
in
1x 9
5˚C
2:0
0 m
in; 4
0x 9
5˚C
0:0
5 m
in, 5
9˚C
0:4
5 m
in
Prim
er
Co
nc.
300
nM
300
nM
300
nM
300
nM
300
nM
300
nM
500
nM
100
nM
200
nM
200
nM
200
nM
200
nM
200
nM
200
nM
Rev
erse
Pri
mer
2R 5
'-CC
C C
TC
KG
S A
AA
GC
C T
TC
T
TC
-3'
4R 5
'-GC
T A
GC
CA
C T
TT
CT
G-3
'
616R
5'-G
CC
AT
C C
AB
CK
R T
AN
GT
C
CA
-3'
Com
_am
oA_1
_R 5
'-C
GA
GA
TC
AT
GG
TG
CT
GT
GA
C-3
'
R2n
xrA
5'-
TC
CA
CA
AG
GA
AC
GG
AA
GG
TC
-3'
nxrB
638r
5'-C
GG
TT
C T
GG
TC
R A
TC
A-
3'
1000
R-m
5'-G
GC
CA
T G
YA
CY
W C
CT
C
TC
-3'
Eub
513R
5'-
AT
T A
CC
GC
G G
CT
GC
T
GG
-3'
Arc
h-am
oAR
5'-C
CC
AA
T G
CA
AA
C
CA
T G
CA
CC
-3'
Bet
a-am
oA-m
2-R
5'-A
CA
AA
C G
CT
GA
G
AA
G A
AC
GC
-3'
Bet
a-am
oA-O
2-R
5'-T
AT
GA
C C
AC
CA
A
AC
G T
AC
GC
-3'
Nit
rosp
iraG
1-a-
R 5
'-AT
G T
TC
AC
G A
AG
C
GC
CA
T T
C-3
'
Nit
rosp
iraG
2-a-
R 5
'-CG
G C
AT
CG
A A
AA
T
GG
TC
A T
CC
-3'
UW
M_c
omam
mox
_am
oA_R
1 5'
-G
AG
CC
CA
CT
TC
GA
TC
AT
CC
-3'
Fo
rw
ard
Pri
mer
1F 5
'-GG
G G
HT
TY
T A
CT
GG
T G
GT
-3'
3F 5
'-GG
T G
AG
TG
G G
YT
AA
C M
G-3
'
19F
5'-A
TG
GT
C T
GG
YT
W A
GA
CG
-3'
pmoA
-189
b-F
5'-
GG
NG
AC
TG
GG
AC
TT
YT
GG
-3'
F1n
xrA
5'-
CA
GA
CC
GA
CG
TG
TG
CG
AA
AG
-3'
nxrB
169f
5'-T
AC
AT
GT
GG
TG
GA
AC
A-
3'
958F
-m 5
'-AA
T T
GG
AN
T C
AA
CG
C
CR
G-3
'
Eub
337F
5'-
AC
T C
CT
AC
G G
GA
GG
C
AG
C A
G -
3'
Arc
h-am
oAF
5'-C
TG
AC
T G
GG
CG
T
GG
A C
AT
CA
-3'
Bet
a-am
oA-m
1-F
5'-T
CG
AA
C A
AG
G
TT
CA
C T
CC
GT
A C
-3'
Bet
a-am
oA-O
2-F
5'-A
TT
TG
G A
CC
G
AC
CC
A C
TT
AC
C-3
'
Nit
rosp
iraG
1-a-
F 5
'-TA
T G
GG
GT
G
TT
C G
AA
GG
G A
TG
-3'
Nit
rosp
iraG
2-a-
F 5
'-AC
G T
CA
AA
A
TC
A C
GC
AG
C T
G-3
'
UW
M_c
omam
mox
_am
oA_F
1 5'
-C
GG
AC
TA
CA
TG
GG
CT
TT
GC
-3'
Ass
ay
Ty
pe
Qia
gen
End
poin
t
Qia
gen
End
poin
t
Qia
gen
End
poin
t
Qia
gen
End
poin
t
Qia
gen
End
poin
t
Qia
gen
End
poin
t
SY
BR
G
reen
SY
BR
G
reen
Eva
Gre
en
Eva
Gre
en
Eva
Gre
en
Eva
Gre
en
Eva
Gre
en
Eva
Gre
en
Gen
e
Target
amoA
amoA
amoA
amoA
nxrA
nxrB
16s
16s
amoA
amoA
amoA
nxrB
nxrB
amoA

43
Target
Org
an
ism
s
Bet
apro
teob
acte
ria
AO
B
Gam
map
rote
obac
teri
a A
OB
Am
mon
ia O
xidi
zing
A
rcha
ea
Com
amm
ox a
moA
Nit
roba
cter
spp
.
Non
-Nit
roba
cter
N
OB
Arc
haea
Bac
teri
a
UW
M A
OA
- T
otal
UW
M N
itro
so -
1
UW
M N
itro
so -
2
Nit
rosp
ira
nxrB
uw
m-1
Nit
rosp
ira
nxrB
uw
m-2
Com
amm
ox
Nit
rosp
ira
amoA
Comammox amoA PCR
To target comammox Nitrospira amoA for PCR and subsequent cloning and
sequencing, amoA nucleotide sequences from van Kessel et al, 2015 and Daims et al.,
2015 were aligned using MUSCLE (Edgar, 2004). The alignment was imported into
EMBOSS to generate an amoA consensus sequence (Rice et al., 2000). Primer sequences
were identified from the consensus using Primer3Plus (Untergasser et al., 2012), and the
candidates along with the methane monooxygenase subunit A (pmoA) primers suggested
by van Kessel et al., 2015, were evaluated against the consensus sequence in SeqMan Pro
(DNAStar), using MUSCLE (Edgar, 2004). The pmoA forward primer (Luesken et al.,
2011) and candidate primer COM_amoA_1R (this study; Table 3.1) offered the best
combination of read length and specificity, and subsequently were used to amplify amoA
genes from our samples.
Clone Library Construction and Phylogenetic Analysis
Multiple endpoint PCR approaches were used to investigate the nitrifying
community composition of the RAS fluidized sand biofilter for amoA
(Gammaproteobacteria, Betaproteobacteria, Archaea, and comammox Nitrospira), nxrA
(Nitrobacter spp.), and nxrB (non-Nitrobacter NOB). The primer sets and reaction
conditions used are listed in Table 3.1. All endpoint PCR reactions were carried out at a
volume of 25 μl: 12.5 μl 2x Qiagen PCR master mix (Qiagen, Hilden, Germany), 1.5 μl
appropriate primer mix (F&R), 0.5 μl bovine serum albumin (BSA), 0.75 μl 50 mM
MgCl2, and 1 μl DNA extract.

44
DNA samples of biofilter water and sand from four different rearing cycle time-
points were used to construct clone libraries of archaeal amoA and Nitrospira sp. nxrB.
One sample from the center of the sand biofilter was used to construct clone libraries for
betaproteobacterial amoA and comammox amoA. The center biofilter sample was chosen
as it produced well-defined amplicons suitable for cloning target amoA genes. All PCR
reactions for clone libraries were constructed using a TOPO PCR 2.1 TA cloning kit
plasmid (Invitrogen, Life Technologies, Carlsbad, CA). Libraries were sequenced on an
ABI 3730 Sanger-Sequencer with M13 Forward primers. Vector plasmid sequence
contamination was removed using DNAStar (Lasergene Software, Madison, WI).
Cloned sequences of Betaproteobacteria amoA, Archaea amoA and Nitrospira sp.
nxrB from this study were added to ARB alignment databases from previous studies
(Abell et al., 2012; Pester et al., 2012, 2013). Neighbor-Joining Jukes-Cantor (NJ-JC)
corrected trees were created in ARB (Ludwig et al., 2004). Comammox amoA sequences
from this study were aligned with those from van Kessel et al., 2015, Pinto et al., 2015,
and Daims et al., 2015 using MUSCLE and imported into a new ARB database where the
alignment was heuristically corrected before calculating an initial NJ-JC tree. A
Maximum-Likelihood (ML) phylogenetic tree was calculated using RAxML on the
Cipres Science Gateway (Miller et al., 2010; Stamatakis, 2014). Bayesian inference (BI)
of phylogeny was carried out with instances of MrBayes on the Cipres Gateway, with the
NJ-JC tree from ARB incorporated into a tree block within the input nexus file to reduce
calculation time (Miller et al., 2010; Ronquist et al., 2012), using a significant posterior
probability of <0.01. Consensus majority trees based on all three phylogenetic methods
(NJ-JC, ML, and BI) were constructed using ARB’s consensus tree algorithm (Ludwig et
45
al., 2004). Consensus trees were visualized with the Interactive Tree of Life (Letunic and
Bork, 2011).
qPCR Assays for Target Marker Genes
Quantitative PCR assays were designed to differentiate two Nitrospira nxrB
genotypes and two Nitrosomonas amoA genotypes in our system. Potential qPCR primer
sequences were identified using Primer3Plus (Untergasser et al., 2012) on MUSCLE
(Edgar, 2004) generated alignments in DNAStar (Lasergene Software, Madison, WI).
Primer concentrations and annealing temperatures were optimized for specificity to each
reaction target. Primers were checked using Primer-BLAST on NCBI to ensure the
assays matched their target genes. The newly designed primers were tested for between
genotype cross-reactivity using the non-target genotype sequence in both endpoint and
real time PCR dilution series. After optimization, all assays amplified only the target
genotype. Due to high sequence similarity between the two archaeal amoA genotypes
(>90% identity) in our system, a single qPCR assay to target both genotypes was
developed using the steps described above. The two closely related sequence types were
pooled in equimolar amounts for reaction standards. A comammox amoA qPCR primer
set was developed using the same methods as the other assays presented in this study. All
assay conditions are listed in Table 3.1. All qPCR assays were run on an Applied
Biosystems StepOne Plus thermocycler (Applied Biosystems, Foster City, CA). Cloned
target genes were used to generate standard curves from 1.5 x 10⁶ to 15 copies per
reaction. All reactions were carried out in triplicate, with melt curve and endpoint
confirmation of assays (qPCR standard curve parameters and efficiency are listed in
Table S3).

46
Statistics and Data Analysis
Taxonomy-based data were visualized with heatmaps constructed in the R
statistical language (R Core Team, 2014), by implementing functions from the libraries
gplots, Heatplus from Bioconductor Lite, VEGAN, and RColorBrewer. MED nodes were
used in all sample diversity metrics. The EnvFit function in the VEGAN (Oksanen et al.,
2015) R package was used to test the relationship between RAS observational data and
changes in the biofilter bacterial community composition. Pearson’s correlations were
calculated using the Hmisc package in R (Harrell, Jr. and Dupont, 2015) to test whether
16S rRNA, amoA, and nxrB gene copies correlated over time. Kruskal-Wallis rank sum
tests were performed in the R base statistics package (R Core Team, 2014) to test whether
the populations of the aforementioned genes were stratified by depth. The ADONIS
function from VEGAN was used on the V4-V5 depth dataset to test the significance of
the observed Bray-Curtis dissimilarity as a function of depth categorical factors, with
strata=NULL since the same biofilter was sampled multiple times.
Biomass Model
To determine whether the observed ammonia removal could provide the energy needed to
support the number of potential ammonia-oxidizing microorganisms (AOM) in the
biofilter as quantified via qPCR, we modeled steady-state biomass concentration from
measured ammonia oxidation with the following equation:
$%& = '(' ) *+,
-.0%&∗'(/ ∗ 01234
XAO is defined as the biomass concentration of ammonia oxidizers in milligrams per liter
in previous models (Mußmann et al., 2011), however, in this study we converted to cells
per wet gram of sand by identifying the mean grams of sand per liter water in the
biofilter. Θx is the mean cell residence time (MCRT) in days and was unknown for the

47
system. Θ is the hydraulic retention time in days, which, is ~9.52 min, or 0.0066 days in
this system. YAO is the growth yield of ammonia oxidizers, and bAO is the endogenous
respiration constant of ammonia oxidizers, which were estimated as 0.34 kg volatile
suspended solids (VSS)/kg NH4+−N and 0.15 d−1 from (Mußmann et al., 2011). ΔSNH3 is
the change in substrate ammonia concentration between influent and effluent in mg/L. To
calculate XAO, or biomass concentration, we used the mean cell diameter (0.96 µm) for
Candidatus Nitrosocosmicus franklandus (Lehtovirta-Morley et al., 2016) to calculate the
biovolume of a single cell, and used the conversion factor of 310 fg*C/µm3 (Mußmann et
al., 2011) to relate biovolume to endogenous respiration. The modeled biomass
concentration was plotted vs. a range of potential MCRT for a RAS fluidized sand filter
(Summerfelt, Personal communication). The results of all amoA qPCR assays were
combined to estimate total ammonia-oxidizing microorganism biomass in copy numbers
per gram wet weight sand. Modeled biomass was then compared to our AOM qPCR
assay results. A commented R-script for the model is available on GitHub
(https://github.com/rbartelme/BFprojectCode.git).
NCBI Sequence Accession Numbers
Bacterial V6, V4-V5, and Archaeal V6 16S rRNA gene sequences generated in this study
are available from the NCBI SRA (SRP076497; SRP076495; SRP076492). Partial gene
sequences for amoA and nxrB are available through NCBI Genbank and have accession
numbers KX024777-KX024822.
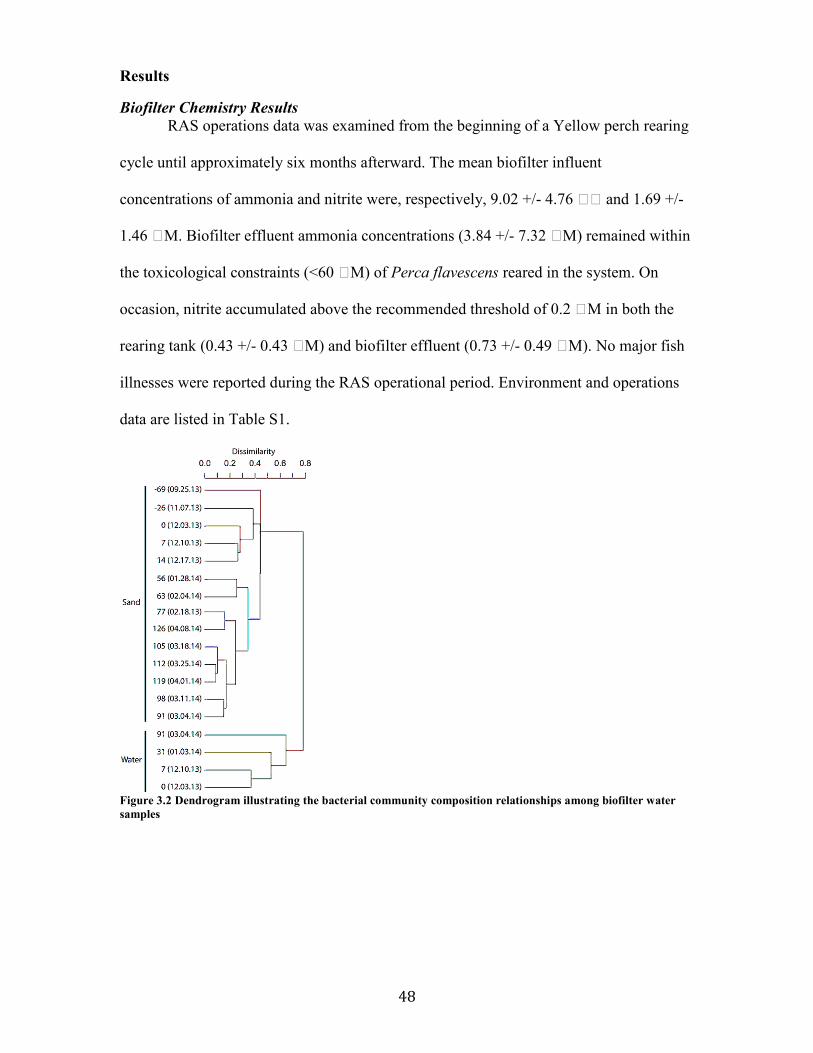
48
Results
Biofilter Chemistry Results
RAS operations data was examined from the beginning of a Yellow perch rearing
cycle until approximately six months afterward. The mean biofilter influent
concentrations of ammonia and nitrite were, respectively, 9.02 +/- 4.76 and 1.69 +/-
1.46 M. Biofilter effluent ammonia concentrations (3.84 +/- 7.32 M) remained within
the toxicological constraints (<60 M) of Perca flavescens reared in the system. On
occasion, nitrite accumulated above the recommended threshold of 0.2 M in both the
rearing tank (0.43 +/- 0.43 M) and biofilter effluent (0.73 +/- 0.49 M). No major fish
illnesses were reported during the RAS operational period. Environment and operations
data are listed in Table S1.
Figure 3.2 Dendrogram illustrating the bacterial community composition relationships among biofilter water
samples

49
Bacterial and Archaeal Assemblages Within the Biofilter
The characterization of the RAS biofilter bacterial community revealed that both
the sand-associated and water communities were diverse at a broad taxonomic level; 17
phyla averaged >0.1% in each of the biofilter sand and water bacterial communities (See
Table S2 for complete sample taxonomic characterization). Proteobacteria (on average,
40% of biofilter sand community sequences and 40% of water sequences) and
Bacteroidetes (18% in sand, 33% in water) dominated both water and sand bacterial
communities. At family-level taxonomic classification, the biofilter sand-associated
community was distinct from the water community. The greatest proportion of sequences
in the sand samples were classified to the bacterial groups, Chitinophagaceae (mean
relative abundance, 12%), Acidobacteria family unknown (9%), Rhizobiales family
unknown (6%), Nocardioidaceae (4%), Spartobacteria family unknown (4%), and
Xanthomonadales family unknown (4%), while the water samples were dominated by
sequences classified to Chitinophagaceae (14%), Cytophagaceae (8%), Neisseriaceae
(8%), and Flavobacteriaceae (7%). Using Minimum Entropy Decomposition (MED) to
obtain highly discriminatory sequence binning, we identified 1261 nodes (OTUs) across
the bacterial dataset. A MED-based bacterial community composition comparison
(Figure 3.2) supported the patterns observed using broader taxonomic classification
indicating that the biofilter sand-associated community was distinct from the assemblage
present in the biofilter water.
In contrast to the large diversity in the bacterial community, we found the
archaeal community to be dominated by a single taxonomic group, affiliated with the
genus Nitrososphaera. This taxon made up >99.9% of the Archaea-classified sequences
identified in the biofilter samples (Table S2). This taxon also was represented almost
completely by a single sequence (>95% of Archaea-classified sequences) that was
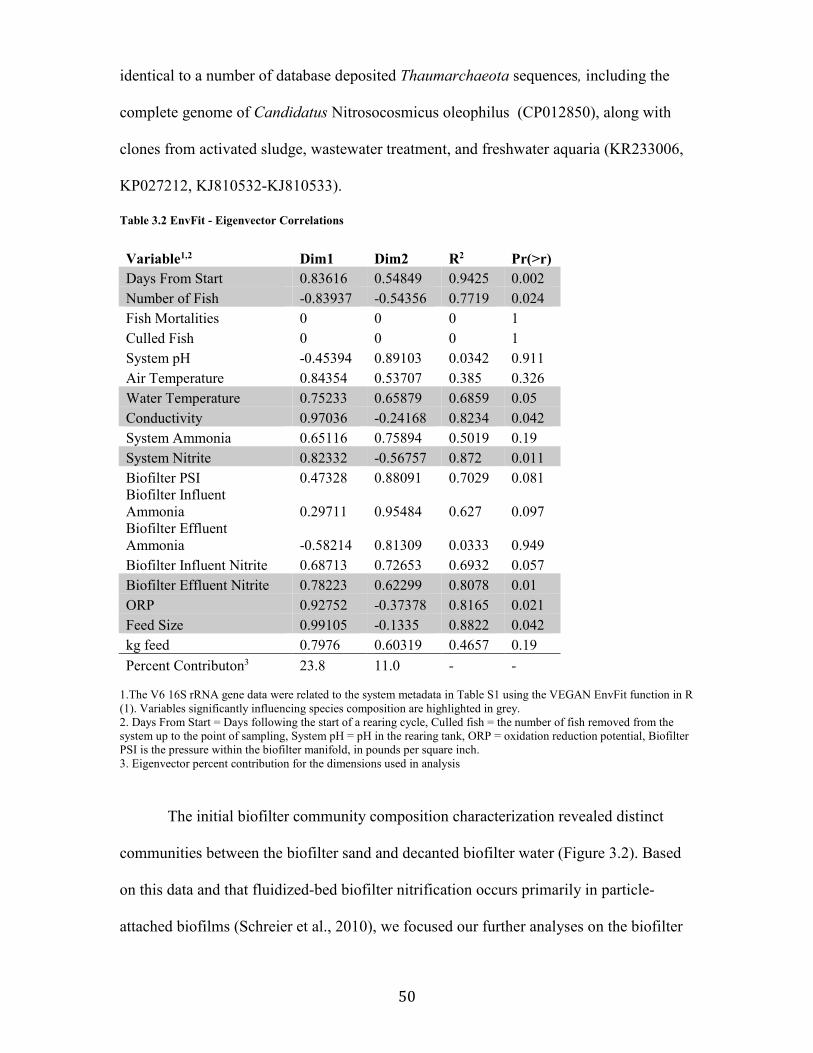
50
identical to a number of database deposited Thaumarchaeota sequences, including the
complete genome of Candidatus Nitrosocosmicus oleophilus (CP012850), along with
clones from activated sludge, wastewater treatment, and freshwater aquaria (KR233006,
KP027212, KJ810532-KJ810533).
Table 3.2 EnvFit - Eigenvector Correlations
Variable1,2 Dim1 Dim2 R2 Pr(>r)
Days From Start 0.83616 0.54849 0.9425 0.002 Number of Fish -0.83937 -0.54356 0.7719 0.024 Fish Mortalities 0 0 0 1 Culled Fish 0 0 0 1 System pH -0.45394 0.89103 0.0342 0.911 Air Temperature 0.84354 0.53707 0.385 0.326 Water Temperature 0.75233 0.65879 0.6859 0.05 Conductivity 0.97036 -0.24168 0.8234 0.042 System Ammonia 0.65116 0.75894 0.5019 0.19 System Nitrite 0.82332 -0.56757 0.872 0.011 Biofilter PSI 0.47328 0.88091 0.7029 0.081 Biofilter Influent Ammonia 0.29711 0.95484 0.627 0.097 Biofilter Effluent Ammonia -0.58214 0.81309 0.0333 0.949 Biofilter Influent Nitrite 0.68713 0.72653 0.6932 0.057 Biofilter Effluent Nitrite 0.78223 0.62299 0.8078 0.01 ORP 0.92752 -0.37378 0.8165 0.021 Feed Size 0.99105 -0.1335 0.8822 0.042 kg feed 0.7976 0.60319 0.4657 0.19
Percent Contributon3 23.8 11.0 - - 1.The V6 16S rRNA gene data were related to the system metadata in Table S1 using the VEGAN EnvFit function in R (1). Variables significantly influencing species composition are highlighted in grey. 2. Days From Start = Days following the start of a rearing cycle, Culled fish = the number of fish removed from the system up to the point of sampling, System pH = pH in the rearing tank, ORP = oxidation reduction potential, Biofilter PSI is the pressure within the biofilter manifold, in pounds per square inch. 3. Eigenvector percent contribution for the dimensions used in analysis
The initial biofilter community composition characterization revealed distinct
communities between the biofilter sand and decanted biofilter water (Figure 3.2). Based
on this data and that fluidized-bed biofilter nitrification occurs primarily in particle-
attached biofilms (Schreier et al., 2010), we focused our further analyses on the biofilter
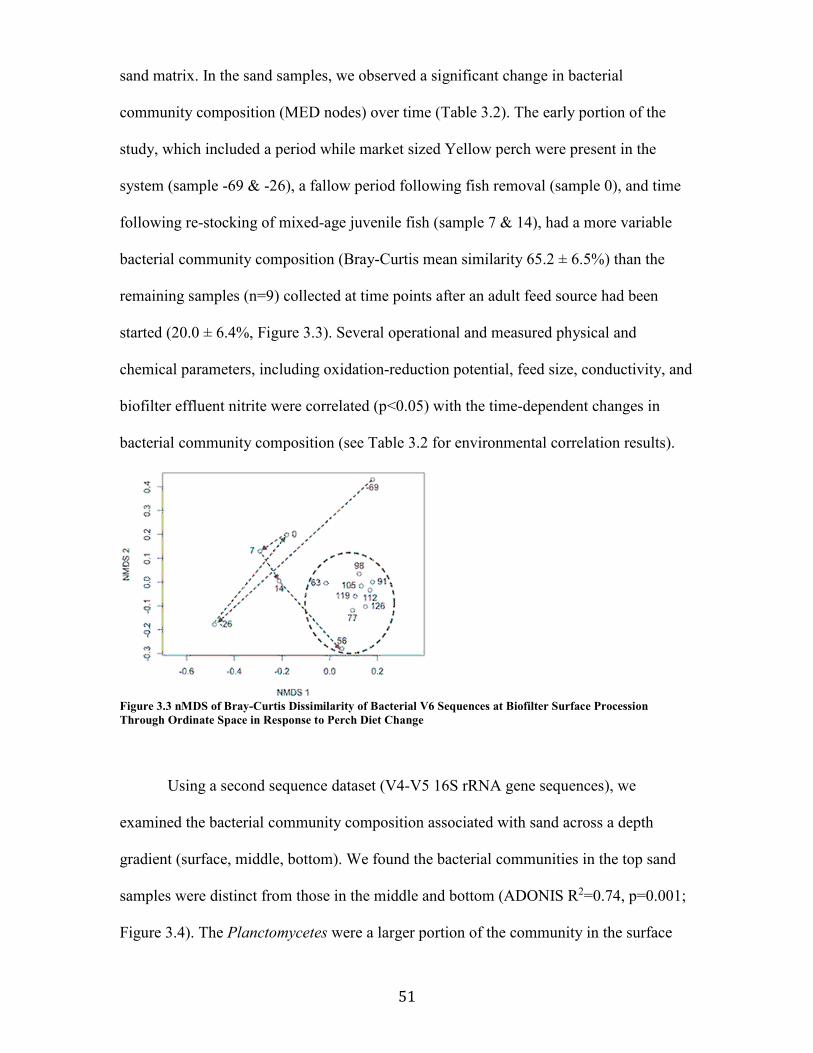
51
sand matrix. In the sand samples, we observed a significant change in bacterial
community composition (MED nodes) over time (Table 3.2). The early portion of the
study, which included a period while market sized Yellow perch were present in the
system (sample -69 & -26), a fallow period following fish removal (sample 0), and time
following re-stocking of mixed-age juvenile fish (sample 7 & 14), had a more variable
bacterial community composition (Bray-Curtis mean similarity 65.2 ± 6.5%) than the
remaining samples (n=9) collected at time points after an adult feed source had been
started (20.0 ± 6.4%, Figure 3.3). Several operational and measured physical and
chemical parameters, including oxidation-reduction potential, feed size, conductivity, and
biofilter effluent nitrite were correlated (p<0.05) with the time-dependent changes in
bacterial community composition (see Table 3.2 for environmental correlation results).
Figure 3.3 nMDS of Bray-Curtis Dissimilarity of Bacterial V6 Sequences at Biofilter Surface Procession
Through Ordinate Space in Response to Perch Diet Change
Using a second sequence dataset (V4-V5 16S rRNA gene sequences), we
examined the bacterial community composition associated with sand across a depth
gradient (surface, middle, bottom). We found the bacterial communities in the top sand
samples were distinct from those in the middle and bottom (ADONIS R2=0.74, p=0.001;
Figure 3.4). The Planctomycetes were a larger portion of the community in the surface
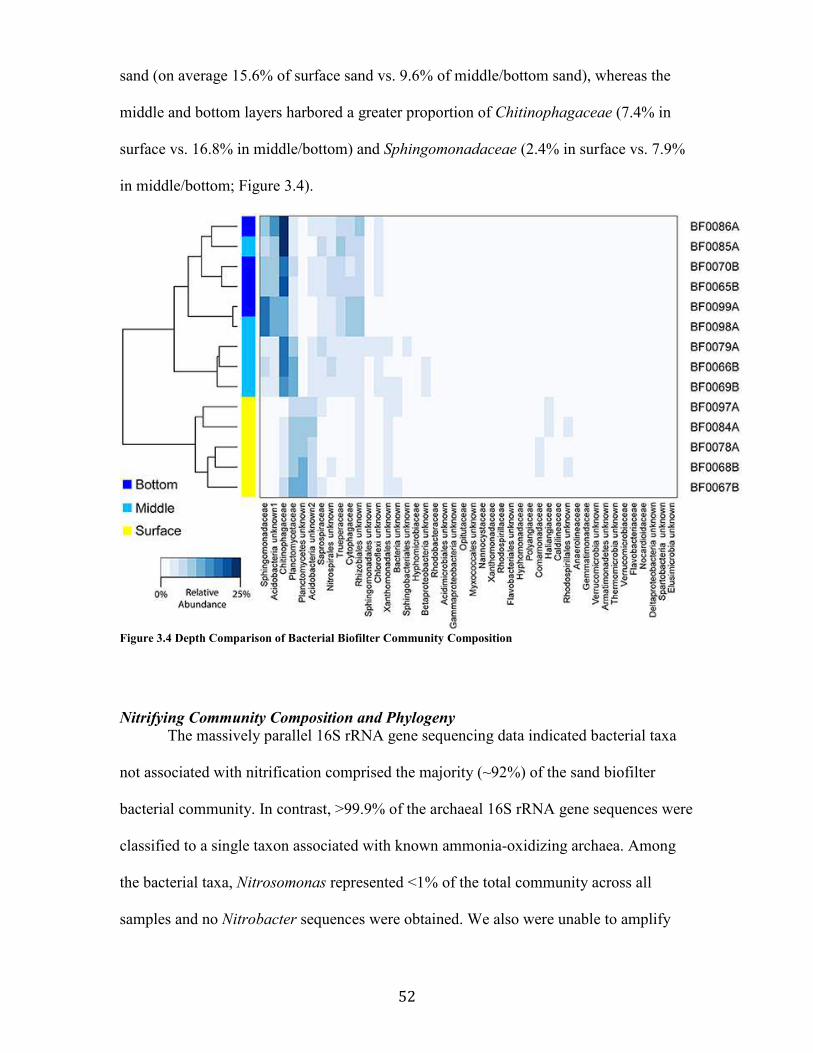
52
sand (on average 15.6% of surface sand vs. 9.6% of middle/bottom sand), whereas the
middle and bottom layers harbored a greater proportion of Chitinophagaceae (7.4% in
surface vs. 16.8% in middle/bottom) and Sphingomonadaceae (2.4% in surface vs. 7.9%
in middle/bottom; Figure 3.4).
Figure 3.4 Depth Comparison of Bacterial Biofilter Community Composition
Nitrifying Community Composition and Phylogeny
The massively parallel 16S rRNA gene sequencing data indicated bacterial taxa
not associated with nitrification comprised the majority (~92%) of the sand biofilter
bacterial community. In contrast, >99.9% of the archaeal 16S rRNA gene sequences were
classified to a single taxon associated with known ammonia-oxidizing archaea. Among
the bacterial taxa, Nitrosomonas represented <1% of the total community across all
samples and no Nitrobacter sequences were obtained. We also were unable to amplify

53
Nitrobacter nxrA genes (Figure S5) with a commonly used primer set (Poly et al., 2008;
Wertz et al., 2008). In contrast, Nitrospira was fairly abundant, comprising 2-5% of the
total bacterial community (Table S2).
Figure 3.5 Ammonia-oxidizing Archaea Consensus Tree
In addition to the 16S rRNA gene community data, we amplified, cloned, and
sequenced nitrifying marker genes representing the dominant nitrifying taxa in the UWM
biofilter. The archaeal amoA sequences (KX024777-KX024795) clustered into two
distinct genotypes, with an average nucleotide identity ranging from 97-99%. Both
genotypes placed phylogenetically in the Nitrososphaera sister cluster (Figure 3.5),
which includes the candidate genus, Nitrosocosmicus (Lehtovirta-Morley et al., 2016),

54
but the sequences were most closely related to the amoA genes from Archaeon G61 (97%
nucleotide identity; KR233005). Sequenced amplicons for betaproteobacterial amoA
(KX024803-KX024810) also revealed the presence of two AOB genotypes affiliated with
Nitrosomonas. These Nitrosomonas genotypes were most closely related (99% identity)
to environmental sequences obtained from freshwater aquaria and activated sludge
(Figure 3.6).

55
Figure 3.6 Ammonia-oxidizing Bacteria Consensus Tree

56
Figure 3.7 Consensus Trees for Nitrospira-like nxrB (A) and amoA (B) genes
The UWM biofilter sand also harbored two phylogenetically distinct and
divergent clades of nxrB sequences (85-86% nucleotide identity between genotypes;
KX024811-KX024822) affiliated with the genus Nitrospira. Nitrospira nxrB uwm-1
formed a clade distinct from cultivated Nitrospira spp. (~92% nucleotide identity to
Nitrospira bockiana). Nitrospira nxrB uwm-2 clustered phylogenetically with Nitrospira
spp., which have been implicated in complete nitrification (i.e. comammox) (Daims et al.,

57
2015; van Kessel et al., 2015) (Figure 3.7A). Because of the association of Nitrospira
nxrB uwm–2 with comammox nxrB sequences, we further examined the biofilter for the
presence of Nitrospira-like amoA genes. We subsequently amplified a single Nitrospira-
like amoA out of the biofilter samples, and phylogenetic inference placed this amoA on a
monophyletic branch with currently known Nitrospira amoA sequences, but in a distinct
cluster (Figure 3.7B) with a drinking water metagenome contig (Pinto et al., 2015) and a
“Crenothrix pmoA/amoA” Paddy Soil Clone (KP218998; (van Kessel et al., 2016)). A
link to ARB databases containing these data may be found at
https://github.com/rbartelme/ARB_dbs.
Figure 3.8 Nitrification Marker Gene Concentration Over Time (A) amoA (B) nxrB
Temporal and Spatial Quantification of Nitrification Marker Genes
We investigated the temporal and spatial stability of the nitrifying organisms in
the UWM biofilter by developing qPCR assays specific to identified amoA and nxrB
genes. Within the ammonia-oxidizing community, the AOA and comammox-Nitrospira
(amoA assay) had space-time abundance patterns distinct from that of the Nitrosomonas
genotypes. For example, the AOA and comammox-Nitrospira were numerically

58
dominant (range = 450-6500:1) to Nitrosomonas (combined UWM nitroso-1 & nitroso-2
genotypes) across all samples (Figure 3.8; Table 3). The AOA and comammox-
Nitrospira also had more stable abundances over time (Coefficient of variation (CV) =
0.38 & 0.55 vs. 1.33 & 1.32 for nitroso-1 and nitroso-2; Figure 8), copy number
concentrations that were less impacted by biofilter depth (Table 3), and comammox-
Nitrospira were approximately 1.9x more abundant than AOA throughout the biofilter.
Lastly, the two Nitrosomonas amoA genotypes exhibited a strong temporal abundance
correlation (Pearson’s R=0.90, pseudo p=0.0002) that was not shared with AOA or the
comammox-Nitrospira (Pearson’s R =0.65 & 0.69, and pseudo p=0.031 and 0.019,
respectively).
Table 3.3 Nitrification Marker Gene Concentrations in Biofilter Sand
1. Mean and standard deviation are listed.
2. Bottom, middle, and surface depth categories are defined as: surface (~1.32-1.42 m from biofilter base), middle
(~0.81-0.91 m from biofilter base), and bottom (~0.15- 0.30 m, from biofilter base).
3. For nxrB, n=4, and for amoA n=3. Corresponding samples are listed in Table S1.
4. χ2 and P-values from Kruskal-Wallis Rank Sum assessment of depth as a significant factor in nitrification marker
gene distribution.
qPCR Assay1 Bottom (CN/g)2 Middle (CN/g) Surface (CN/g) Significance4
UWM AOA-Total (amoA)3
2.1x10⁸ +/- 0.2x10⁸ 2.6x10⁸ +/- 0.8x10⁸ 1.0x10⁸+/- 0.06x10⁸ χ2=5.4 & p=0.07
UWM Nitroso–1 (amoA) 4.6x10⁵ +/- 0.3x10⁵ 3.6x10⁴ +/- 1.3x10⁴ 4.5x10⁴+/- 2.9x10⁴ χ2=5.6 & p=0.06
UWM Nitroso–2 (amoA) 2.0x10⁴+/- 0.4x10⁴ 4.0x10³+/- 1.7x10³ 3.5x10³+/- 1.9x10³ χ2=5.4 & p=0.07
Nitrospira nxrB uwm-1 5.8x10⁸ +/- 1.0x10⁸ 7.4x10⁸ +/- 3.9x10⁸ 4.6x10⁸ +/- 1.3x10⁸ χ2=2.3 & p=0.32
Nitrospira nxrB uwm-2 4.9x10⁸ +/- 1.8x10⁸ 4.6x10⁸ +/- 2.1x10⁸ 4.2x10⁸ +/- 1.4x10⁸ χ2=0.35 & p=0.84
Comammox (amoA) 3.5x10⁸ +/- 0.7x10⁸ 3.9x10⁸ +/- 1.0x10⁸ 2.5x10⁸ +/- 0.9x10⁸ χ2=1.7 & p=0.43
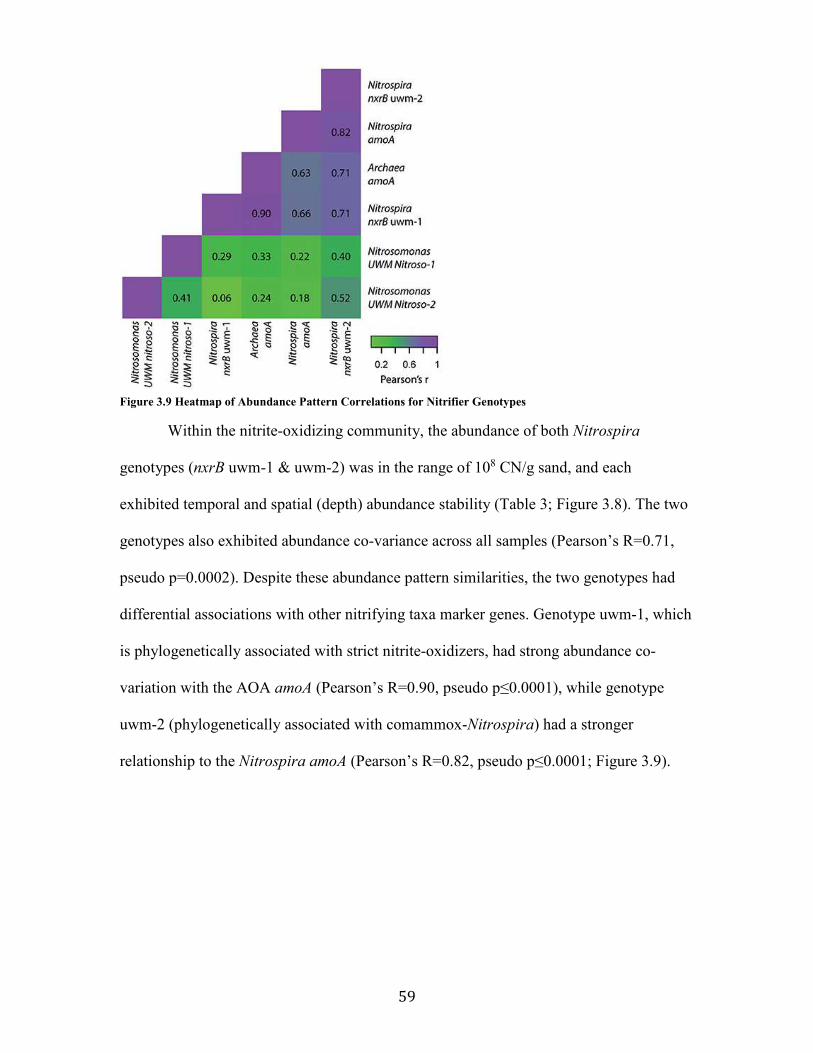
59
Figure 3.9 Heatmap of Abundance Pattern Correlations for Nitrifier Genotypes
Within the nitrite-oxidizing community, the abundance of both Nitrospira
genotypes (nxrB uwm-1 & uwm-2) was in the range of 108 CN/g sand, and each
exhibited temporal and spatial (depth) abundance stability (Table 3; Figure 3.8). The two
genotypes also exhibited abundance co-variance across all samples (Pearson’s R=0.71,
pseudo p=0.0002). Despite these abundance pattern similarities, the two genotypes had
differential associations with other nitrifying taxa marker genes. Genotype uwm-1, which
is phylogenetically associated with strict nitrite-oxidizers, had strong abundance co-
variation with the AOA amoA (Pearson’s R=0.90, pseudo p≤0.0001), while genotype
uwm-2 (phylogenetically associated with comammox-Nitrospira) had a stronger
relationship to the Nitrospira amoA (Pearson’s R=0.82, pseudo p≤0.0001; Figure 3.9).

60
Figure 3.10 Model Output of Ammonia-oxidizer Cell Concentration as a Function of Biofilter Mean Cell
Residence Time (MCRT)
Ammonia-oxidizing Microorganism Biomass Model
The estimated cell densities for ammonia oxidizers in the biofilter were modeled
as a function of mean cell residence time (MCRT). Since the biofilter MCRT was
unknown, a range of values (1-30 days) was used in the model. The model suggests the
combined estimated ammonia oxidizer cell densities (Nitrosomonas + AOA +
commamox-Nitrospira) could be supported by the ammonia oxidation observed, and in
fact over-estimated these densities. For example, the model indicates ammonia oxidizer
biomass reaches near maximum by a mean cell residence time (MCRT) of 20 days
(Figure 3.10). At this 20-day MCRT, the model indicates the ammonia removal rate
measured could support ~6.2X more cells than we observed (Figure 3.10).
Discussion
Biofilter Microbial Community Composition
In this study, we generated data that deeply explored the microbial community
composition for a production-scale freshwater RAS nitrifying biofilter, expanding our
understanding of the complexity of these systems beyond previous reports (Blancheton et
al., 2013; Sauder et al., 2011; Sugita et al., 2005). This deeper coverage gave us the
61
power to examine temporal and depth distributions for both total bacterial and archaeal
communities and the potential nitrifying member consortia therein. In previous studies of
freshwater RAS biofilters, Actinobacteria, Gammaproteobacteria, Plantomycetes, and
Sphingobacteria were identified as dominant taxa, while at more refined taxonomic
levels Acinetobacteria, Cetobacterium, Comamonas, Flectobacillus, Flavobacterium and
Hyphomicrobium were common (Sugita et al., 2005). All of these genera were present
and relatively abundant (>0.5% total community; genus level taxonomic breakdown in
Table S2) in our biofilter sand samples, suggesting there may be selection pressures for
heterotrophs that act universally across systems. Some researchers have hypothesized that
each RAS biofilter should have a unique microbial community composition shaped by
operational controls and components implemented in the RAS (Sugita & Sugata 2005;
Blancheton 2013). In support of this idea, many of the most abundant bacterial genera in
our system (e.g. Kribbella, Niabella, Chitinophaga, Byssovorax, Hyphomicrobium) had
not been reported as abundant in other systems. While it is likely true that each microbial
community assemblage will be unique among RAS biofilters, i.e. each biofilter has a
unique “microbial fingerprint”, the low number of RAS biofilters with community
composition information to date and the low sequencing depth within existing studies,
prohibits making robust comparisons across systems and identifying underlying
community composition trends that relate to system operations.
Different components of RAS are expected to have unique environmental
selective pressures, and thus multiple distinct microbial communities should be present
within a single RAS. Our community data indicates there are consistent and significant
differences in the biofilter sand and water communities. These differences included
community members that were ubiquitous in, but nearly exclusive to the water samples.
62
These taxa could be remnant members derived from previous components in the system
(e.g. rearing tank, clarifier), but the high shear force in a fluidized sand bed may make for
inconsistent passage of these inflow microorganisms. The water samples also had
decreased representation of prominent sand-associated taxa, including most known
nitrifiers, so studies sampling biofilter outflow water would not represent accurately the
microbial assemblages associated with nitrification. These observations support previous
observations to the same effect, further lending support to the idea that a transient
planktonic microbial assemblage is constantly moving through RAS components while
an independent community develops on the biofilter media (Blancheton et al., 2013).
Our time series indicates RAS biofilter bacterial community composition change
correlates with environmental parameter shifts related to fish growth (i.e. number of fish,
water temperature, conductivity, oxidation-reduction potential, and feed size). This result
is consistent with the hypothesis that biofilter bacterial community variation follows feed
and fish growth driven shifts in the C/N ratio (Michaud et al., 2006, 2013). The
community variability is seemingly confined to the non-nitrifying members of the
biofilter, as the dominant nitrifying organisms changed little in composition or abundance
over time. Sampling different depths in the biofilter revealed distinct microbial
communities in each sand stratum, suggesting a potential partitioning across physical and
chemical gradients within the biofilter. In contrast to the observed temporal variation,
these differences were present both in the heterotrophic assemblages, and in the
abundance of nitrifiers. It appears this biofilter maintains a stable, but depth partitioned
nitrifying community in the midst of a shifting bacterial community, whose composition
is linked to variation in nutrient inputs, ultimately stemming from the output of fish
growth.

63
Generally, the RAS biofilter heterotrophic microbial community is viewed only as
competing with nitrifiers for resources, and system design guidelines recommend
operations based on this premise (Okabe et al., 1995). However, this view may confine
further development of biofilter technology, as it is becoming apparent that the
heterotrophic community context can play a broader role in nitrification. Our data clearly
indicates the heterotroph community varies substantially during “typical” fish rearing
cycles. It is possible under some scenarios that these changes could impact nitrification.
For example, certain heterotrophs are known to enhance nitrification rates in
Nitrosomonas and Nitrobacter bioreactors (Sedlacek et al., 2016). It is unknown whether
these interactions extend to other ammonia and nitrite-oxidizing taxa or other systems,
but the interplay between heterotrophs and nitrifiers as a means to enhance nitrification
rates in RAS should be investigated. Further data across systems and over longer periods
in a single system are also needed to bound “normal” vs. stochastic system variability and
identify key taxa or community assembly principles governing RAS.
Nitrifying Consortia
Prior to metagenomic studies, members of a few bacterial clades were believed to
be responsible for ammonia oxidation. The isolation of the first ammonia-oxidizing
archaeon, Nitrosopumilus maritimus, altered global nitrification models (Könneke et al.,
2005). Ammonia-oxidizing archaea (AOA) are ubiquitous in both natural and engineered
environments and are seemingly differentiated by niche from ammonia-oxidizing bacteria
(AOB) based on ammonia concentration, where AOA outcompete AOB at relatively low
concentrations (Hatzenpichler, 2012). This relationship appears to extend to freshwater
biofilters, as it was shown recently that AOA dominate in freshwater aquaria biofilters

64
when ammonia concentrations are low (<30 µM; (Pester et al., 2011)). Our data support
these previous findings, as AOA were 6x10⁵ times more abundant than both
Nitrosomonas genotypes in the UWM biofilter, which maintains similarly low influent
ammonia concentrations (mean = 9 µM). AOA showed little abundance variation with
depth or over time (<3X change) while Nitrosomonas exhibited an order of magnitude
greater abundance during later periods in the fish rearing cycle and deeper in the biofilter
(Table 3). System ammonia is highest late in the rearing cycle (Table S1) and presumably
deeper in the biofilter, which is nearest to the influent ports.
Although AOA were numerically dominant over AOB, a presumed third
ammonia-oxidizer was also present in the biofilter sand matrix. Identification of
Nitrospira-like amoA (Figure 3.7B) in the biofilter and the strong correlation between the
abundance of the Nitrospira nxrB uwm-2 gene and this Nitrospira amoA, suggests a
complete ammonia-oxidizing Nitrospira spp. resides in the UWM biofilter. In fact, we
found that the comammox amoA was the most abundant ammonia-oxidizing gene in the
biofilter (on average 1.9X that of AOA amoA). Similar to the AOA, the comammox
Nitrospira exhibited little abundance variation with depth or over time, which suggests
the AOA and comammox Nitrospira stably co-exist throughout this system. The
comammox reaction is predicted to be competitive in systems with limited substrate
influx, and comammox Nitrospira have proven to be common in drinking water systems
(Pinto et al., 2015). Part of the initial discovery of comammox included a comammox
Nitrospira from a RAS (van Kessel et al., 2015), but in the anoxic portion of a trickling
biofilter. Thus, RAS biofilters, which often have a municipal water source and relatively
low nutrient influx may be a common reservoir of comammox Nitrospira colonization.
65
The physiology of the UWM RAS biofilter AOA cannot be interpreted from our
dataset, but both the AOA genotypes cluster phylogenetically within the Nitrososphaera
sister cluster, which is represented mainly by cloned amoA sequences from soil,
sediment, and some AOA associated with freshwater aquaria. Recently an organism
given the name Candidatus Nitrosocosmicus franklandus (Lehtovirta-Morley et al., 2016)
was isolated from the Nitrososphaera sister cluster. Ca. Nitrosocosmicus spp. appear to
be suited to tolerate higher concentrations of ammonia and nitrite than other AOA, and
are capable of ureolytic growth (Lehtovirta-Morley et al., 2016), both of which could be
beneficial traits in RAS environments. AOA, now have been detected in freshwater,
brackish, and saline RAS that also span a variety of cultured species, ranging from finfish
to crustaceans (Sakami et al., 2012; Sauder et al., 2011; Urakawa et al., 2008). Given the
common AOA dominance over Nitrosomonas in RAS nitrifying biofilters, including in
our study system, a greater understanding of AOA ecophysiology is needed to understand
how system designs could be used to maximize AOA capabilities.
Although AOA appear widespread in RAS biofilters, the presence of AOA with
comammox Nitrospira in our system suggests understanding AOA physiology may be
only a part of understanding RAS biofilter nitrification. It is clear this environment
generally favors the proliferation of organisms thought to be high affinity, low substrate
specialists and can support a complex nitrifying consortium. However, further work is
needed to understand how ammonia-oxidation partitions between the various ammonia-
oxidizers competing for substrate and how system operations can take advantage of
potentially flexible ammonia-oxidizer physiologies.
In our system, we did not detect Nitrobacter, whose physiological constraints are
often used when calculating RAS biofiltration capacity. Instead we identified Nitrospira
66
as the dominant nitrite-oxidizing bacteria (NOB). Nitrospira are generally considered K-
strategist NOB favoring oligotrophic environments, while Nitrobacter are r-strategist
copiotrophs (Nowka et al., 2015). Nitrospira uwm-1 exhibited a strong abundance pattern
correlation with AOA, had abundances roughly equal (~108 nxrB CN/g sand) to that of
the AOA, and clustered phylogenetically with known nitrite-oxidizing Nitrospira.
Together, this suggests Nitrospira uwm-1 is the primary strict nitrite-oxidizing bacterium
in this biofilter. The dominance of Nitrospira in this system and several other RAS
(Auffret et al., 2013; Brown et al., 2013; van Kessel et al., 2010; Kruse et al., 2013;
Schreier et al., 2010) indicates there is a versatile metabolic network driving RAS
biofilter nitrification. For example, nitrite-oxidizing Nitrospira spp. possess a diverse
array of metabolic pathways, and have been shown experimentally to hydrolyze urea and
cyanate to ammonia, thereby initiating nitrification through cross-feeding with
AOA/AOB. This process is counter to the supposed role of nitrite oxidizers solely as
converters of nitrite to nitrate (Daims et al., 2016). Whether or not Nitrospira in RAS
move nitrogen pools through these alternate pathways is not yet known.
Given the diversity of nitrifiers and burgeoning understanding of nitrifier
metabolic flexibility, it is possible that some of the identified ammonia-oxidizing
organisms in our system were not carrying out ammonia oxidation, as this scenario has
been observed in municipal wastewater treatment systems (Mußmann et al., 2011). Our
model indicates the measured ammonia removal could support the predicted ammonia-
oxidizer biomass, and in fact overestimated the number of ammonia oxidizing cells
present. This overestimation could be the result of the model’s reliance on biomass
production from traditional AOM metabolisms, which many not represent accurately
biomass production from ammonia oxidation for metabolically flexible ammonia-

67
oxidizers or comammox Nitrospira (Costa et al., 2006). Also, the cell volume used in the
model is based on measurements of Candidatus Nitrosocosmicus franklandus, a
relatively small microorganism; thus differences in cell size across ammonia-oxidizing
taxa also may be contributing to the overestimation of biomass. In order to accurately
predict ammonia consumption to biomass production ratios, which are used to used to
constrain biofilter design, future models will need to account for the substrate kinetic
differences between ammonia oxidizer metabolic pathways, differences in cell size
among taxa, and include an updated understanding of cross-feeding between AOM and
NOB (Daims et al., 2016; De Schryver and Vadstein, 2014).
This study builds upon the accumulating body of evidence that biofilter microbial
communities in freshwater recirculating aquaculture systems are dynamic, diverse, and
more distributed by resource availability than is often considered in the design process.
Our results along with others (Brown et al., 2013; Sakami et al., 2012) indicate the
microorganisms carrying out nitrification in RAS are different than those used
traditionally to model RAS nitrifying capacity. This disconnect suggests there is potential
to further fine-tune biofilter design to take advantage of these newly discovered
physiologies and alter start-up procedures so that animal production objectives are
matched to the nitrifying microorganisms most capable of meeting those demands.
Incorporating this knowledge would provide opportunities to develop new system
operations, such as operating at a lower pH (Hüpeden et al., 2016), and could move
system optimization beyond that bound by current nitrification models. Yet, many
unknowns remain, including how differences in system scale, water properties, and
system initiation with subsequent founder effects influence biofilter community
composition, stability, and ultimately performance. Further use of microbial ecological

68
theory in aquaculture has the potential to extend RAS capabilities, identify currently
unrecognized interactions between microorganisms and system design, and facilitate
replicable zero discharge systems (De Schryver and Vadstein, 2014).
3.3 Loss of Comammox Nitrospira Genotypic Diversity from Recirculating
Aquaculture System Biofilter Inoculum After Fallow Period
Introduction
Recirculating aquaculture systems (RAS) are on-land systems for cultivating fisheries
products. Highly engineered componentry in RAS allow for waste remediation while
maintaining lower water footprint than traditional methods (Timmons and Ebeling,
2013). One such apparatus in RAS is the biological filter, or biofilter, which is used to
reduce accumulated nitrogen waste. Biofilters oxidize, ammonia—a major catabolic
byproduct of fish protein catabolism, to nitrate. The nitrification process is essential to
reducing ammonia and nitrite concentrations in RAS, as both nitrogen species are toxic to
fish (Timmons and Ebeling, 2013).
Initiation and continuous operation of biofilters remains difficult (Badiola et al.,
2012). Standard recommendation for biofilter initiation relies on one or two approaches:
seeding the filter with an ammonia source and/or progressively adding fish to the system
to gradually increase the ammonia loading rate (Delong and Losordo, 2012). Delong and
Losordo hypothesized new media is too slick to form biofilms during initiation (Delong
and Losordo, 2012). However, Delong and Losordo’s postulation seems simplified when
one considers media turbulence and sheer stress (Chen et al., 2006a). Additionally, at all
stages of operation, biofilters are sensitive to organic carbon fluxes (Michaud et al., 2006,

69
2013). Organic carbon loading leads to an increase in heterotrophic bacterial growth,
reducing nitrification rates and process efficiency (Michaud et al., 2013).
The difficulty of initiating RAS biofilters is further confounded by nitrification rate
kinetic calculations. Biofilter design often considers the Monod kinetics of Nitrosomonas
and Nitrobacter (Chen et al., 2006a). However, ammonia-oxidizing archaea (AOA) and
complete ammonia-oxidizing Nitrospira may also play roles in ammonia-oxidation in
biofilters (Bagchi et al., 2014; Bartelme et al., 2017; Brown et al., 2013; Sakami et al.,
2012; Sauder et al., 2011). This is problematic given the half saturation constants (Km) of
AOA, comammox, and nitrite oxidizing Nitrospira are 0.5-2 orders of magnitude lower
than those of Nitrosomonas or Nitrobacter (Kits et al., 2017).
Biofilter microbiome studies have been critical to understanding both
heterotrophic bacterial association and nitrifying community composition. To investigate
community assembly dynamics in biofilters, we used volumetric portions of biofilter
material from a previously studied RAS biofilter containing a consortia of comammox,
AOA, Nitrosomonas, and nitrite-oxidizing Nitrospira (Bartelme et al., 2017). Knowing a
priori what the biofilter community should consist of, we were interested in whether
reducing the scale of the filters would retain the genotypes of nitrifiers we previously
observed along with the accompany concomitant heterotrophic bacteria. Additionally, we
were interested in how commercial biofilter starter cultures compare in initiation time to
using an inoculum from an active biofilter. Furthermore, a competition dynamic was
tested using both the commercially available starter culture and an inoculum of biofilter
material from the UWM RAS biofilter. This study seeks to address the applicability of
scaled nitrifying reactors to maintain nitrifier populations, so in the event of RAS filter
failure an appropriate inoculum may be used to restart the biofilter.

70
Materials and Methods
Lab-scale Fluidized-bed Biological Filter Set-up
Six lab-scale fluidized sand biological filters were designed, constructed, and
operated at the University of Wisconsin-Milwaukee’s School of Freshwater Sciences
(UWM SFS). The UWM SFS RAS facility biofilter characterized in Bartelme, et al. 2017
was used as a reference system. For UWM RAS biofilter dimensions see section 3.1 of
Chapter 3, or Bartelme, et al. 2017. Hydraulic analysis was used to design our lab-scale
filters and reservoir to proportions representative of a small RAS (Summerfelt &
Cleasby, 1996).
Figure 3.11 Lab-Scale Biofilter Diagram
The experimental system consisted of six separate 37 L biofilter vessels (Figure
3.11; dashed arrows represent direction of water flow), with water continuously pumped
via a submersible pump. Each biofilter was connected to a 150 L tank representing the
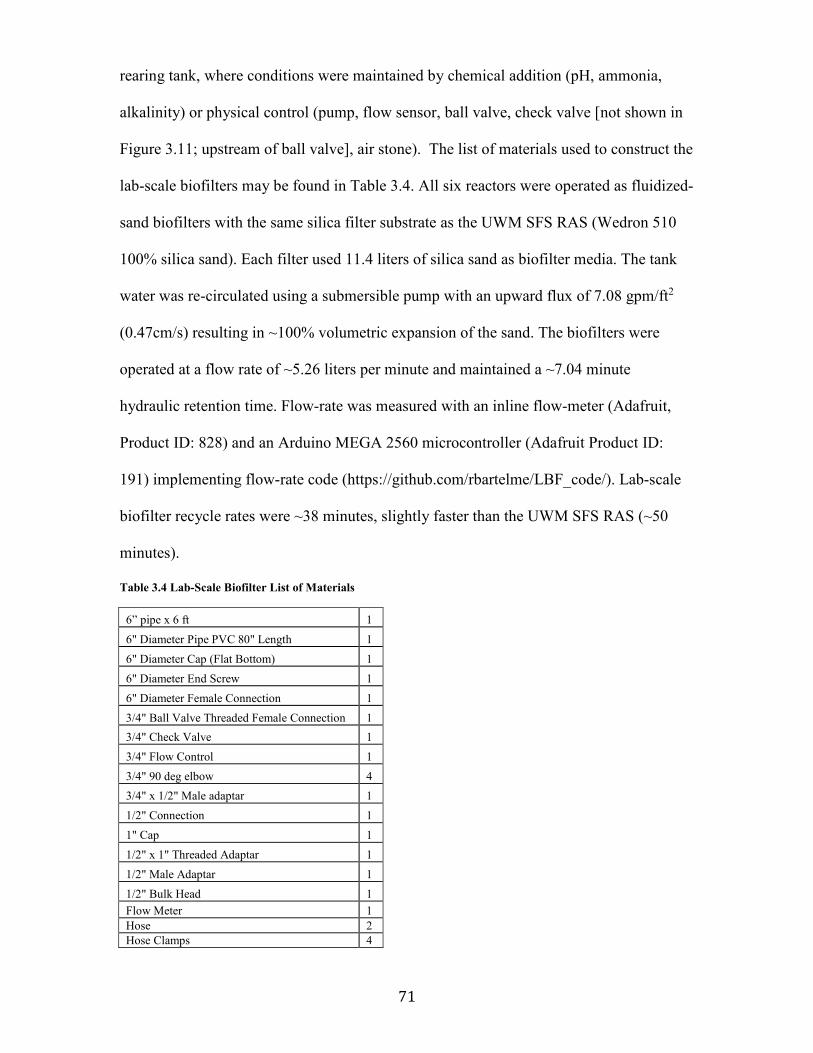
71
rearing tank, where conditions were maintained by chemical addition (pH, ammonia,
alkalinity) or physical control (pump, flow sensor, ball valve, check valve [not shown in
Figure 3.11; upstream of ball valve], air stone). The list of materials used to construct the
lab-scale biofilters may be found in Table 3.4. All six reactors were operated as fluidized-
sand biofilters with the same silica filter substrate as the UWM SFS RAS (Wedron 510
100% silica sand). Each filter used 11.4 liters of silica sand as biofilter media. The tank
water was re-circulated using a submersible pump with an upward flux of 7.08 gpm/ft2
(0.47cm/s) resulting in ~100% volumetric expansion of the sand. The biofilters were
operated at a flow rate of ~5.26 liters per minute and maintained a ~7.04 minute
hydraulic retention time. Flow-rate was measured with an inline flow-meter (Adafruit,
Product ID: 828) and an Arduino MEGA 2560 microcontroller (Adafruit Product ID:
191) implementing flow-rate code (https://github.com/rbartelme/LBF_code/). Lab-scale
biofilter recycle rates were ~38 minutes, slightly faster than the UWM SFS RAS (~50
minutes).
Table 3.4 Lab-Scale Biofilter List of Materials
6” pipe x 6 ft 1
6" Diameter Pipe PVC 80" Length 1
6" Diameter Cap (Flat Bottom) 1
6" Diameter End Screw 1
6" Diameter Female Connection 1
3/4" Ball Valve Threaded Female Connection 1
3/4" Check Valve 1
3/4" Flow Control 1
3/4" 90 deg elbow 4
3/4" x 1/2" Male adaptar 1
1/2" Connection 1
1" Cap 1
1/2" x 1" Threaded Adaptar 1
1/2" Male Adaptar 1
1/2" Bulk Head 1
Flow Meter 1 Hose 2 Hose Clamps 4
72
Proof of Concept Experiments
After initial scaling of our laboratory biofilters, we conducted proof of concept
experiments with varying inocula from the UWM SFS RAS biofilter. The three
treatments were, by percent volume of silica sand, 100% UWM SFS RAS biofilter sand,
10% sand, un-inoculated sand. All treatments were run in duplicate biological replicate.
Over the duration of these a continuous flow autoanalyzer, Seal AA3 (Seal Analytical,
Mequon, Wisconsin, USA), was used to measure Ammonia and Nitrite concentrations,
using manufacturer protocols G-102-93 and G-109-94 respectively. To only measure free
nitrite concentrations, an in-line cadmium column was not used. A handheld probe, YSI
6-Series Sonde, was used to measure conductivity, pH, temperature, and dissolved
oxygen at sampling times. Starting concentrations of 140 µM ammonium chloride and
140 µM sodium bicarbonate were respectively used as nitrification substrate and
alkalinity.
Second Experiment Design and Sampling Regime
The results from the proof of concept experiments informed our decision to use a
10% (by volume sand) inoculum. In these experiments, treatments were again performed
in biological duplicate with 10% UWM biofilter sand, 10% UWM biofilter sand plus
starter culture, and fresh silica sand with the commercial nitrifying starter culture.
Ammonia concentrations were measured using a Lamotte ammonia kit (Lamotte,
Chesterpark, Maryland, USA) on ThermoFisher Scientific spectrophotometer, with a 1
cm path length cuvette. Nitrite was again measured using AA3 (Seal Analytical, Mequon,
Wisconsin, USA) and the 6 series sonde was used to measure conductivity, pH, and
dissolved oxygen.
73
Sequencing PCR and Illumina MiSeq Protocols
Bacteria V4-V5 16S rRNA gene PCR reactions were carried out in triplicate 33 µl
reactions, with Platinum HiFi taq polymerase as described previously (Huse et al.,
2014b). These PCR reactions were pooled together, cleaned with AMPure XP beads
(ThermoFisher, CITY, CA), and purified product concentrations quantified with Qubit
(ThermoFisher, CITY, CA). Separate barcoding step was performed using Kapa
Biosystems Hifi taq polymerase as described in the illumina MiSeq SOP. These
sequences were clustered into amplicon sequence variants (ASV’s) using minimum
entropy decomposition with a minimum substantive abundance (-M) of 187 (Eren et al.,
2015b).
A multiplexed illumina MiSeq assay surveyed the nitrification markers present in
the biofilters across both experiments. Four gene targets were used in this assay, with
primers modified to include illumina adapter sequences (Table 2.1). The V4-V5 region of
the Archaea 16S rRNA gene, Betaproteobacterial amoA, and comammox amoA were
used to identify genotypes of ammonia-oxidizing microorganisms (Table 2.1). There was
no evidence of Nitrobacter spp. in the UWM RAS (Bartelme, et al. 2017); therefore the
only Nitrospira nxrB nitrite-oxidation marker was used. Archaea V4-V5 16S rRNA genes
were amplified in triplicate using previously described primers (Topçuoglu et al., 2016),
2X Kapa Hifi Master Mix, in triplicate 20µl reactions, with 10-100ng template. The other
three genes were amplified using the same reaction scheme. The triplicate reactions were
pooled, and cleaned using AMPure beads according to manufacturers instructions. After
pooling and clean-up, amplicons concentrations were quantified using QuantIT
PicoGreen assay (ThermoFisher). Amplicon pooling prior to barcoding used template

74
concentrations of: 1.8 ng/µl Archaea 16S, Betaproteobacterial amoA, and nxrB, while
comammox amoA was added at 0.9 ng/µl to account for the shorter amplicon size.
Barcoding was performed according to the standard illumina MiSeq protocol.
Since the number of unique of amplicon sequence variants (ASV’s) in Bartelme,
et al. 2017 was low, fastq files were not only demultiplexed to their respective amplicon
targets, but also underwent two rounds of sequence clustering. First, the multiplexed
amplicon sequences were demultiplexed by sample name and primer set into their
respective gene targets using mothur (Schloss et al., 2009). These fastq files were then
processed using anvio 2.2’s anvi-script-reformat-fasta –simplify-names before
concatenating all samples into a single fasta file for each gene target. Initial clustering
was conducted for each gene target using minimum entropy decomposition (MED) (Eren
et al., 2015b). Resulting MED nodes (ASV’s) were then clustered at 95% similarity in
mothur to reduce noise. After 95% clustering, representative sequences were aligned to
ARB databases from Bartelme, et al., 2017. Sequences not falling into a previously
defined clade of a particular gene were BLAST against the NCBI nucleotide database on
default settings. All negative hits for gene targets were removed before downstream
analysis and ASV’s with an absolute abundance <100 were assumed to be effectively 0.
Statistical Analyses of Recovered Sequences
Statistical analyses were done in R using the VEGAN package (Oksanen et al.,
2015). Overall similarity of Bacterial V4-V5 relative abundances across was determined
using Bray-Curtis dissimilarity to construct a beta-diversity dendrogram. For each
experiment’s Bacterial V4-V5 dataset, nMDS were calculated using the vegan function
metaMDS with k=4 dimensions, seed=444, 999 permutations, and Bray-Curtis
dissimilarity. Additionally, each nMDS was linked to the measured environmental
75
paramters using the vegan environmental fit function with choices=1:4, na.rm=TRUE,
and seed=444. vegan’s permutative ANOVA function, ADONIS, was used to determine
the contibution of treatment effects to the recovered Bray-Curtis dissimilarity. Beta-
dispersion was implemented to determine the likelihood two treatments share a
homogenous beta-diversity pattern. If the beta-dispersion is not dissimilar, then one
cannot reject the hypothesis the two communities share a beta-diversity centroid in
ordinate space (Anderson, 2006; Anderson et al., 2006).
Results and Discussion
Hydraulic Analysis Results and Physiochemical Measurements
Conditions in experiment 1 were maintained at levels approximately those of the
UWM RAS (water temperature 20.40±0.77˚C, pH 7.5±0.4, dissolved oxygen 7.63±3.53
mg/L, specific conductivity 1.45±0.51 mS/cm). In the proof of concept experiments the
100% biofilter sand treatment removed all ammonia within 72 hours. The 10% sand
condition filters oxidized ammonia at two different rates, one consumed all ammonia at
the same rate as the 100% treatment, while the other took ~1.5 weeks. Whereas the null
controls took ~1 month to consume all of the ammonia provided at the beginning of the
experiment. In experiment 2 conditions were maintained similar to those of experiment 1,
with the exception of a lower mean specific conductivity (water temperature
22.16±0.46˚C, pH 7.17±0.19, dissolved oxygen 8.25±1.48 mg/L, specific conductivity
0.10±0.06 mS/cm).
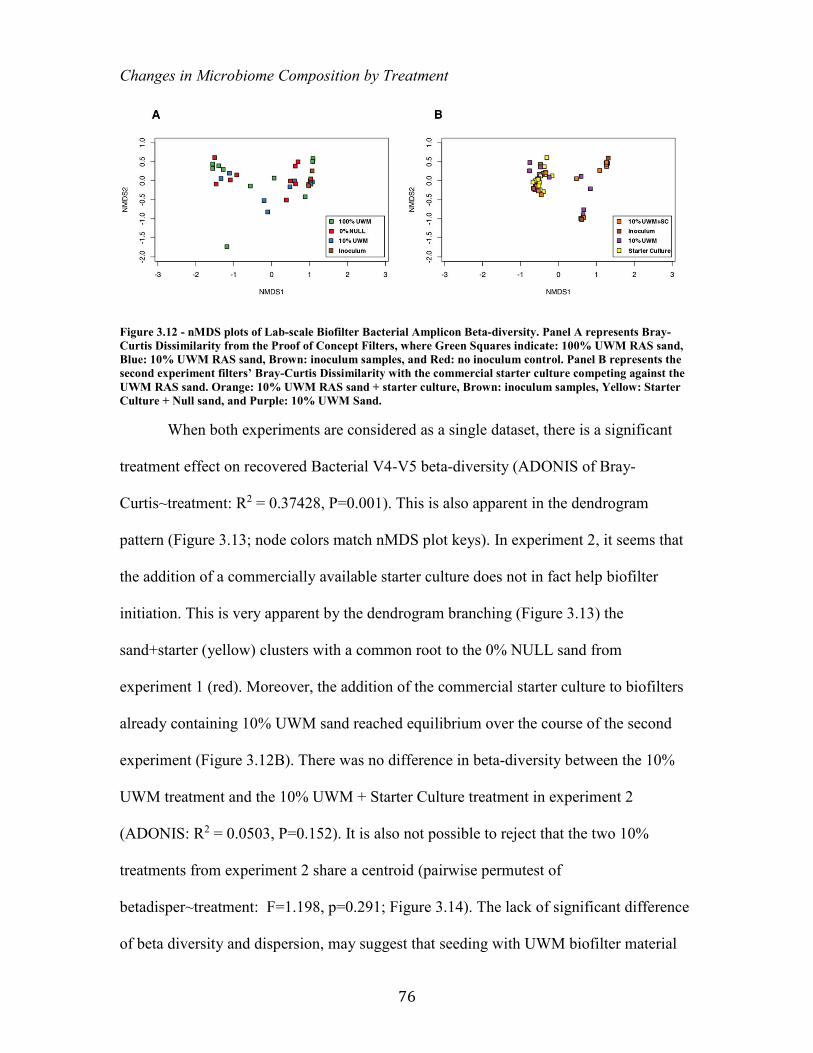
76
Changes in Microbiome Composition by Treatment
Figure 3.12 - nMDS plots of Lab-scale Biofilter Bacterial Amplicon Beta-diversity. Panel A represents Bray-
Curtis Dissimilarity from the Proof of Concept Filters, where Green Squares indicate: 100% UWM RAS sand,
Blue: 10% UWM RAS sand, Brown: inoculum samples, and Red: no inoculum control. Panel B represents the
second experiment filters’ Bray-Curtis Dissimilarity with the commercial starter culture competing against the
UWM RAS sand. Orange: 10% UWM RAS sand + starter culture, Brown: inoculum samples, Yellow: Starter
Culture + Null sand, and Purple: 10% UWM Sand.
When both experiments are considered as a single dataset, there is a significant
treatment effect on recovered Bacterial V4-V5 beta-diversity (ADONIS of Bray-
Curtis~treatment: R2 = 0.37428, P=0.001). This is also apparent in the dendrogram
pattern (Figure 3.13; node colors match nMDS plot keys). In experiment 2, it seems that
the addition of a commercially available starter culture does not in fact help biofilter
initiation. This is very apparent by the dendrogram branching (Figure 3.13) the
sand+starter (yellow) clusters with a common root to the 0% NULL sand from
experiment 1 (red). Moreover, the addition of the commercial starter culture to biofilters
already containing 10% UWM sand reached equilibrium over the course of the second
experiment (Figure 3.12B). There was no difference in beta-diversity between the 10%
UWM treatment and the 10% UWM + Starter Culture treatment in experiment 2
(ADONIS: R2 = 0.0503, P=0.152). It is also not possible to reject that the two 10%
treatments from experiment 2 share a centroid (pairwise permutest of
betadisper~treatment: F=1.198, p=0.291; Figure 3.14). The lack of significant difference
of beta diversity and dispersion, may suggest that seeding with UWM biofilter material

77
leads to a priority effect governing community assembly (Fukami et al., 2010; Jiang and
Patel, 2008). This is likely the first study to observe a priority effect while modeling RAS
biofilter initiation.
Figure 3.13 Bray-Curtis Dissimilarity + Average Linkage Dendrogram Across Lab-Scale Biofilter Experiments
1 and 2. Experiment 1 sample colors are as follows, Green: 100% UWM RAS sand, Blue: 10% UWM RAS sand,
Brown: inoculum samples, and Red: no inoculum control Experiment 2 sample colors are as follows, Orange:
10% UWM RAS sand + starter culture, Brown: inoculum samples, Yellow: Starter Culture + Null sand, and
Purple: 10% UWM Sand. The color codes also correspond to those used in Figure 3.12.

78
Figure 3.14 Disribution of Betadispersion Distance to Centroid by Treatment. a) 0% NULL b) 10% UWM c)
100% UWM d) 10% UWM-2 e) 10% UWM+Starter Culture f) Starter Culture+0% NULL z) Inoculum
Adding biofilter community to start the biofilters lowers the variability of change
over time. This effect is independent of the experiment. When testing the dispersion of
Bray-Curtis diversity around a centroid, there was no significant difference between the
two experiments 10% UWM treatments (pairwise permutest of betadisper~treatment:
F=1.6692, p=0.225; Figure 3.14) Therefore, the hypothesis that the two experiments’
10% inocula share similar dispersion patterns in ordinate space cannot be rejected,
although overall there appears to be significant differences in community composition
between experiments. The overall changes in dispersion (Figure 3.14) are most likely
based upon the differences in starting conditions of the system, i.e. fish vs. no fish.
Varied Nitrification Genotype Recovery
79
Taking into account all experimental data, there is no correlation between
AOA+nxrB presence/absence dissimilarities (Binary Jaccard). The null controls were too
different to include in the analysis. When examining just the samples containing UWM
SFS RAS biofilter material, the AOA+nxrB are strongly correlated (Mantel test,
permutations = 999, spearman’s rho = 0.455, p = 0.001). These results support previous
work suggesting that AOA and Nitrospira dominate freshwater biofilters (Bagchi et al.,
2014; Bartelme et al., 2017; Sauder et al., 2011). The comammox amoA sequences were
difficult to recover from all biofilters with a UWM inoculum in the second set of
experiments. However, all comammox amoA that were recovered (Figure 3.16) matched
the clone sequences from Bartelme, et al. 2017. Betaproteobacterial amoA sequences
were also difficult to acquire from the lab-scale biofilters, and those that were present
more closely matched sequences from wastewater treatment plants than those found in
Bartelme, et al. 2017.
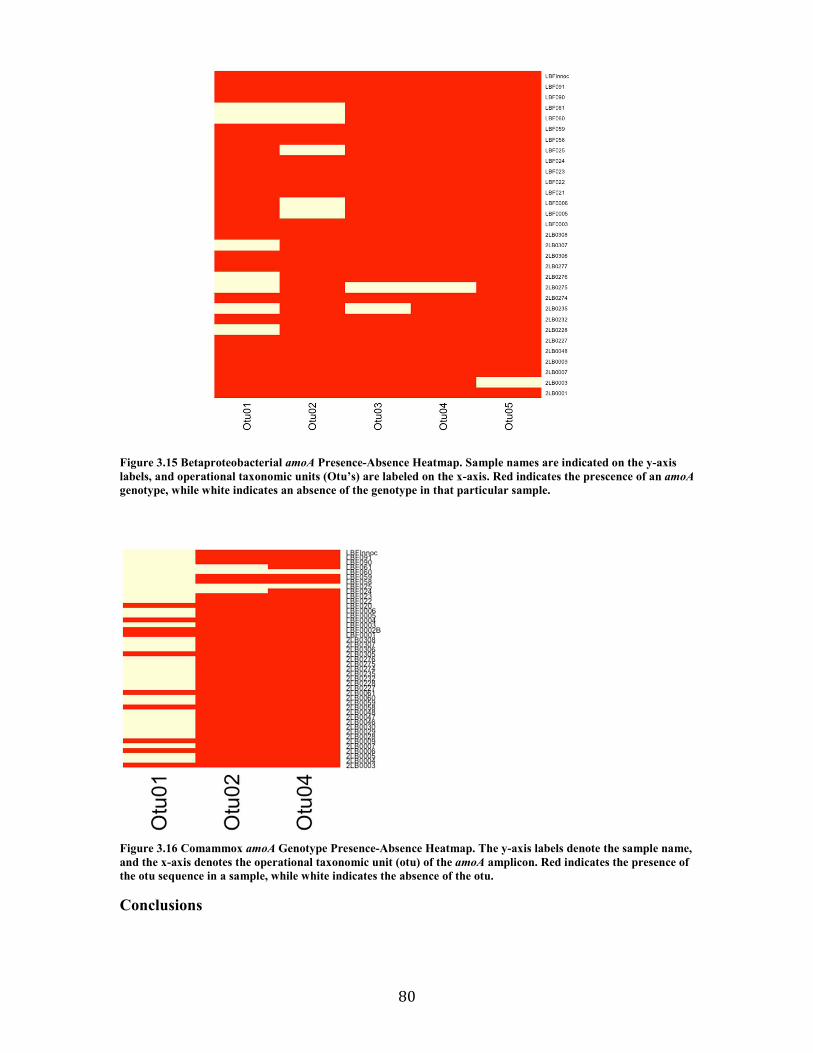
80
Figure 3.15 Betaproteobacterial amoA Presence-Absence Heatmap. Sample names are indicated on the y-axis
labels, and operational taxonomic units (Otu’s) are labeled on the x-axis. Red indicates the prescence of an amoA
genotype, while white indicates an absence of the genotype in that particular sample.
Figure 3.16 Comammox amoA Genotype Presence-Absence Heatmap. The y-axis labels denote the sample name,
and the x-axis denotes the operational taxonomic unit (otu) of the amoA amplicon. Red indicates the presence of
the otu sequence in a sample, while white indicates the absence of the otu.
Conclusions

81
In both the proof of concept experiments and the competition experiments, we see
evidence of an inoculum priority effect on the trajectory of the lab scale biofilter
community. In the proof of concept experiments we see a procession in time with the
10% inoculum filters resembling the 100% inoculum filters by the end of the experiment.
And, although we saw populations of comammox Nitrospira disappear from the
inoculum during the fallow period inoculation, we see the priority effect again in the
competition experiment. The 10% inoculum community, and 10%+ starter culture reach
an equilibrium and the dispersion of beta-diversity is also equivalent. This was also
reflected in the ammonia-oxidation rate. These results indicate that if an idealized
biofilter community is grown, in a bioreactor mimicking the turbulence and
physiochemical constrains of design, the community may be maintained in some
capacity. These results reflect the previous factors identified influencing nitrifier
community assembly (Chen et al., 2006b). Furthermore, the standardized suggestions for
biofilter initiation (Delong and Losordo, 2012), may not be directly applicable to
restarting filters after failure. This is particularly evident in how stochastic the 0% NULL
community assembly was in experiment 1. Specifically applied to recirculating
aquaculture, we recommend that facilities maintain a scaled bioreactor where 10% by
volume of the original filter substrate may be withdrawn to restart the biofilter after a
catastrophic failure. These recommendations are in line with the new decoupled
aquaponic system proposed (Goddek et al., 2016), which could in turn be a system design
worth exploring in RAS.

82
3.4 Enrichment of a Complete Ammonia-Oxidizing Nitrospira From the
UW-Milwaukee Biofilter
Introduction
Canonical aerobic nitrification is facilitated as a two-step biogeochemical process
facilitated by ammonia-oxidizing bacteria (AOB) or archaea (AOA), which oxidize
ammonia to nitrite, and nitrite-oxidizing bacteria (NOB) that oxidize nitrite to nitrate
(Hatzenpichler, 2012; Klotz and Stein, 2008; Leininger et al., 2006; Sorokin et al., 2012).
The classical two-step aerobic nitrification paradigm established by Winogradsky in the
19th Century was forever altered with the discovery of complete ammonia-oxidizing
(comammox) bacteria (Bartelme et al., 2017; Costa et al., 2006; Daims et al., 2015; van
Kessel et al., 2015; Kits et al., 2017; Pinto et al., 2015; Wang et al., 2017). The
facilitation of nitrification by a single microorganism is predicted to come with certain
caveats, such as a lower growth rate but a higher growth yield from ammonia-oxidation
(Costa et al., 2006), but such attenuation would be advantageous in engineered
applications, particularly those that rely on biofilm-based processes (Kreft, 2004).
By catalyzing complete nitrification, COMAMMOX bacteria add a new dimension to
aerobic nitrification, presenting both challenges and opportunities for managing nitrogen
biotransformation in engineered systems and in biogeochemical modeling.
The greatest nitrogen removal energy cost associated with wastewater treatment
plants is oxygen supply for nitrification and supplementation of electron donors for
denitrification. Developing shortcut nitrogen removal processes for wastewater treatment
such as utilizing anaerobic ammonia oxidation (ANAMMOX) by bacteria or
heterotrophic denitritation downstream of ammonia-oxidizing bacteria can reduce
aeration and electron donor requirements by 25-60% and 60-100%, respectively.

83
Complete ammonia-oxidizers have already been found in ANAMMOX reactors (van
Kessel et al., 2015), so the future of applications of comammox bacteria represent a
fundamental challenge to the theoretical underpinnings and operational benefits of
shortcut nitrogen removal processes in WWTP.
These applications may be extended to other industries where nitrogen removal
and/or management is important, such as recirculating aquaculture, or drinking water
filtration systems (Bartelme et al., 2017; Pinto et al., 2015; Wang et al., 2017). Managing
the impacts of complete ammonia oxidation to maximize the benefits in some systems
while minimizing the deleterious impacts in others will require a detailed understanding
of the ecology and physiology of COMAMMOX bacteria. To appropriately utilize
comammox in engineered application and understand their ecology, it is necessary to
combine studies of different environmental conditions, such as under oxic oligotrophic
(Kits et al., 2017) or hypoxic conditions (van Kessel et al., 2015), with comparative
genomic, evolutionary models, and bioreactor studies (Camejo et al., 2017; Palomo et al.,
2016, 2017). What follows is a brief description of how the UWM comammox organism
was enriched, sequenced via shotgun metagenomics, and placed in context with previous
comammox assemblies.
Materials & Methods
UWM Comammox Nitrospira Enrichment
Enrichments were started from 3x500mL slurries of sand and water pooled
together from a previously described recirculating aquaculture system’s fluidized sand
biofilter (Bartelme et al., 2017). Mean in situ conditions of the biofilter water were
22.2±0.1°C, 8.2±0.2 mg/L O2, specific conductivity of 0.33±0.0 mS/cm, and pH
7.92±0.01. Water was decanted from the pooled sand/water slurries, and 1%

84
weight/volume of sand was inoculated into NOB media with differing concentrations of
nitrite (Nowka et al., 2015; Spieck et al., 2006). Originally, the enrichments targeting
canonical Nitrospira were performed with two treatment conditions, however,
comammox Nitrospira were abundant in both enrichments. One set of enrichments was
grown with 100 µM NaNO2 for 12 days, after which 200 µM NaNO2 was used the
duration of this enrichment. The second set of enrichments was incubated with 500 µM
NaNO2. After an approximately 4 month enrichment period, ~160 mL of the 100/200 µM
enrichment and ~35 mL of the 500 µM Enrichment were filtered onto 0.22 µM (47 mm
mixed cellulose esters, EMD Millipore, Darmstadt, Germany), and frozen at -80°C prior
to DNA extraction. Subsequently, the filters were sterilely macerated with a spatula,
DNA was extracted using the MP Bio FastDNA® SPIN Kit for Soil (MP Bio, Solon, OH,
USA) according to the manufacturer’s instructions, with the exception of extending the
bead beating step to two minutes. The DNA from the two enrichment conditions and two
samples from Bartelme et al., 2017 were sent to the Marine Biological Laboratory for
shotgun metagenomic sequencing on an illumina NextSeq and use in downstream
metagenome assemblies and analyses.
UWM Comammox MAG Sequencing, Assembly, Binning, ANVI’O processing, and Bin
Extension
The extracted biofilter and enrichment DNA were sequenced on an illumina
NextSeq 500 with 2x150 ungapped paired end reads. The UWM comammox bin was co-
assembled from all UWM biofilter metagenome datasets in anvi’o (Eren et al., 2015a)
using MegaHIT (Li et al., 2015a). The MegaHIT assembly was run with varying kmers
from 21 to 99 selected in intervals of 5-mers, with a minimum assembly length of 1-2 kb.

85
Bowtie2 (Langmead and Salzberg, 2012) was used to map the reads to the assembled
contigs, after which anvi’o was utilized for manual bin curation.
BLAST analyses of COMAMMOX amoA revealed that the amoA gene was
truncated and therefore the metagenomic bin required refinement. The bin was enhanced
in silico with PriceTI (Ruby et al., 2013) and the enrichment metagenome dataset with
the most reads contributing to the comammox MAG (the 200 µM NaNO2 enrichment).
amoA gene length was assessed before and after PriceTI enhancement with default
Discontinuous MEGA-BLAST settings against a database of comammox clones from
Bartelme, et al. 2017. PriceTI was run for fifteen cycles with a 600 bp target amplicon
size, 98% identity, –repmask 1 s 10 10 160 98 was employed to ignore all data
constituting the first metagenome bin assembly, -dbmax 160, and -lenf 600 0 -target
98 0, and 30 processor cores. PriceTI reduced the number of contigs in the
assembly by ~1/3; reducing the contigs count from 95 to 31 contigs.
Pangenomic Workflow:
Genomic content and open reading frames of complete ammonia-oxidizing
Nitrospira, nitrite-oxidizing Nitrospira, and Betaproteobacterial ammonia-oxidizers were
compared using the pangenomic workflow of anvi’o versions 2.2.2 through 4,
(http://merenlab.org/2016/11/08/pangenomics-v2/). All open reading frame calls were
made in anvi’o, and all protein annotation was done with anvi’o’s blastp algorithm which
matched translated ORF’s to clusters of orthologous groups (COGS). Genomes were
included from the aforementioned groups of bacteria if they were publicly available and
were 80-100% complete by assessment with CheckM (Parks et al., 2015) and anvi’o
(Table 3.5 values). The anvi’o analyses of genome completeness, size, GC content, and

86
redundancy are summarized in Table 3.5. A list of other genomes analyzed in this study
may also be found in Table 3.5.
Table 3.5 Ammonia and Nitrite Oxidizing Bacterial Genomes
Genome
Assembly
Genom
e Size
(Mb)
Percent
Complete
Percent
Redundancy GC%
Number
of Genes
Average
Gene
Length
Genes
per Kb Environment Citation
Candidatus
Nitrospira
defluvii 4.32 96.40 0.0 59.03% 4119 932 0.95 WWTP
Lücker et al.,
2010
Candidatus
Nitrospira
inopinata 3.30 96.40 1.4 59.23% 3191 921 0.97 Warm Pipe
Daims, et al.,
2015
Candidatus
Nitrospira
nitrificans 4.12 94.96 0.7 56.59% 4035 886 0.98 Aquaculture
van Kessel, et
al., 2015
Candidatus
Nitrospira
nitrosa 4.42 97.12 0.7 54.80% 4234 911 0.96 Aquaculture
van Kessel, et
al., 2015
Nitrospira
CMX UWM 4.76 82.01 19.4 54.65% 4863 854 1.02 Aquaculture
Bartelme, et
al., 2017
Nitrospira SG
bin1 4.42 94.24 2.2 56.08% 4480 861 1.01 DWTP
Wang et al.,
2017
Nitrospira SG
bin2 3.66 97.12 1.4 56.77% 3796 849 1.04 DWTP
Wang et al.,
2017
Nitrospira ST
bin4 2.94 94.96 2.2 57.02% 2983 865 1.02 DWTP
Wang et al.,
2017
Nitrospira ST
bin5 4.01 96.40 0.7 58.02% 4016 894 1.00 DWTP
Wang et al.,
2017
Nitrospira sp
CG24A 3.56 95.68 2.2 55.69% 3612 841 1.02 DWTP
Palomo et al.,
2017
Nitrospira sp
CG24E 3.48 97.12 0.0 55.84% 3560 841 1.02 DWTP
Palomo et al.,
2017
Nitrospira sp
CG24C 3.00 94.24 0.0 56.12% 2989 865 1.00 DWTP
Palomo et
al., 2017
Nitrospira sp
CG24B 3.24 93.53 2.9 55.28% 3363 849 1.04 DWTP
Palomo et al.,
2017
Nitrospira sp
CG24D 3.39 95.68 1.4 57.84% 3469 880 1.02 DWTP
Palomo et
al., 2017
Nitrospira
comammox2
A2 4.18 94.96 8.6 58.13% 4697 781 1.12 DWTP
Pinto, et al.,
2015
Nitrospira
japonica 4.08 97.12 1.4 58.96% 3894 942 0.95 WWTP
Ushiki et al.,
2013
Nitrospira
marina NB295 4.69 94.24 0.0 50.04% 4129 941 0.88 Marine
Dupont, et
al.,
unpublished
Nitrospira
moscoviensis
strain NSP M
1 4.59 97.84 5.0 61.99% 4452 918 0.97 Warm Pipe
Spieck, et al.,
1998
Nitrospira sp
Ga0074138 4.11 94.24 0.7 55.07% 4242 840 1.03 DWTP
Pinto, et al.,
2015
Nitrospira sp
ND1 4.45 97.12 0.7 58.87% 4274 928 0.96 WWTP
Fujitani et al.,
2014
Nitrospira sp 3.75 91.37 1.4 60.36% 3747 913 1.00 WWTP Speth et al.,

87
OLB3 UZ03 2016
Nitrosomonas
communis
strain Nm2 4.07 97.84 1.4 44.73% 3697 870 0.91 Soil
Kozlowski et
al., 2016b
Nitrosomonas
cryotolerans
ATCC 49181 2.87 96.40 0.0 43.41% 2511 947 0.87 Marine
Rice et al.,
2017
Nitrosomonas
europaea
ATCC 19718 2.81 99.28 1.4 50.72% 2623 948 0.93 Multiple
Chain et al.,
2003
Nitrosomonas
europaea
isolate OLB2
UZ02 2.61 99.28 2.9 50.53% 2618 880 1.00 Multiple
Speth et al.,
2016
Nitrosomonas
eutropha C91 2.66 97.84 1.4 48.49% 2551 909 0.96 WWTP
Stein et al.,
2007
Nitrosomonas
sp AL212 3.18 97.84 0.0 44.84% 3009 914 0.95 WWTP
Yuichi et al.,
2011
Nitrosomonas
sp Is79A3 3.78 97.84 1.4 45.44% 3492 931 0.92
Freshwater
Sediment
Bollmann et
al., 2013
Nitrosomonas
ureae strain
Nm10 3.31 97.12 3.6 44.48% 3057 927 0.92 Soil
Kozlowski et
al., 2016a
Nitrosospira
briensis C 128 3.21 99.28 1.4 53.25% 2830 947 0.88 Soil
Rice et al.,
2016
Nitrosospira
multiformis
ATCC 25196 3.18 99.28 1.4 53.94% 2889 949 0.91 Soil
Norton et al.,
2008
Nitrosospira
sp APG3 3.11 97.12 0.7 53.58% 2821 941 0.91
Freshwater
Sediment
Garcia, et al.,
2013
Nitrosospira
sp NpAV 3.45 99.28 2.2 53.14% 3308 891 0.96 Soil
Norton et al.,
1996
Phylogenomic Analysis and Metabolic Pathway Prediction
To assess phylogenomic relationships between members of the genus Nitrospira,
the Nitrospira core genome was identified in the anvi’o interactive view and exported
using the anvi-export-pc-alignment function, skipping multiple gene calls, to generate an
aligned concatenated amino acid fasta file. IQ-TREE (Nguyen et al., 2014) was then used
to construct a maximum-likelihood phylogenomic tree from the exported 190 aligned
proteins. To place these comammox MAGs in context with Beta-AOB, open reading
frames matching genes from a bacterial single copy gene hidden markov model (HMM;
n=78) (Campbell et al., 2013) were aligned for phylogenetic analysis. Individual
phylogenetic trees were calculated using amino acid sequences with MrBayes 3.2

88
(Ronquist et al., 2012) on the CIPRES gateway (Miller et al., 2010). Members of
Verrucomicrobia encoding a particulate methane monooxygenase, Methylacidophilum
fumariolicum and Methylacidophilum infernorum, were used as outgroups in all AOB-
comammox tree calculations. MrBayes tree quality was assessed with Tracer (Rambaut
and Drummond, 2007) and RWTY (Warren et al., 2017). A species tree was then
calculated from the individual HMM MrBayes gene trees using a Bayesian Coalescent
model, BUCKy (Larget et al., 2010). To predict potential metabolic pathways, function,
and completeness, individual anvi’o databases were constructed for all the genomes listed
in Table 1. The ORF amino acid sequences from all AOB, comammox, and NOB
Nitrospira were iteratively exported using a bash script within the anvi’o 4 virtual
environment. These amino acid FASTA files were then annotated using GhostKOALA ,
which output a table of KEGG functions and metabolic pathway annotations. The
GhostKOALA table was then translated into a heatmap of metabolic pathway
completeness using Dr. Ben J. Tully’s KEGGDecoder version 0.4
(https://github.com/bjtully/BioData).
Results & Discussion
Assembly Validation
The assembly of the UWM comammox MAG was validated using the anvi’o
SOP, Sanger sequences from enrichment starting material, as well as NCBI BLAST
against nitrification marker genes from previous studies (Daims et al. 2015, van Kessel,
et al., 2015, Pinto et al., 2016, Bartelme et al., 2017). After enhancing the bin using
PriceTI the UWM COMAMMOX MAG was ~85% complete according to the ANVI’O
completeness algorithm. Bowtie2 was then used to remap reads to the UWM
COMAMMOX MAG assembly. Redundant contigs were manually removed using
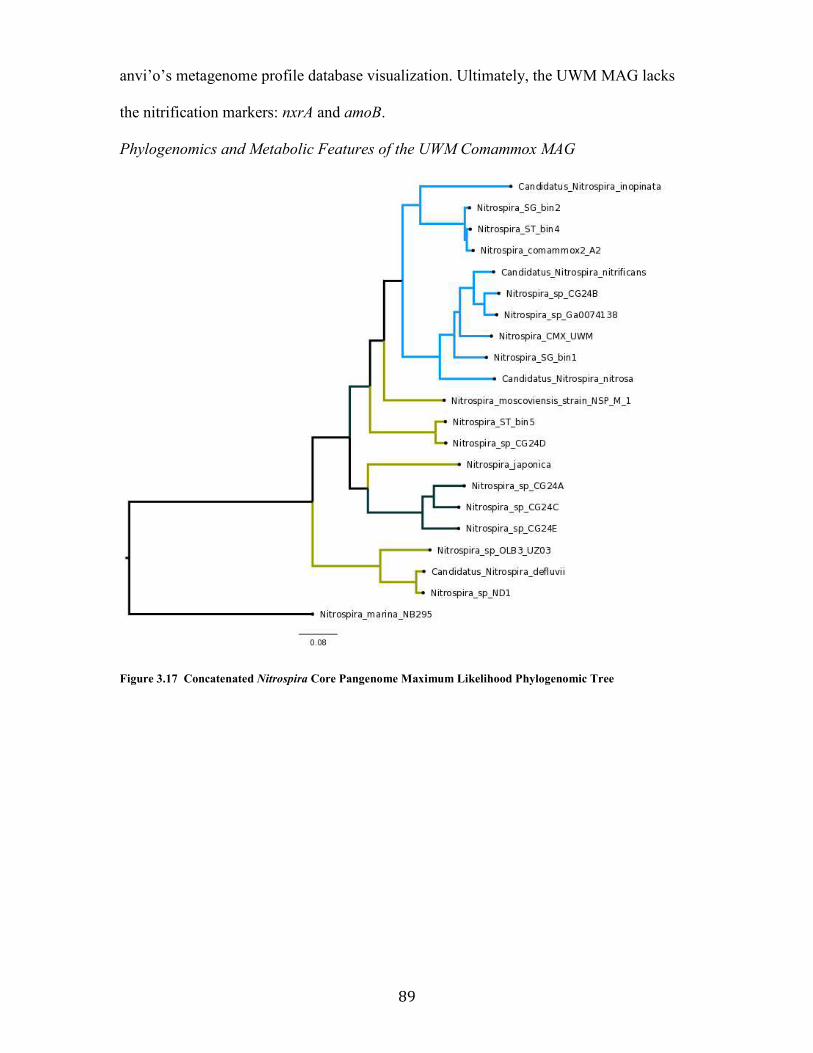
89
anvi’o’s metagenome profile database visualization. Ultimately, the UWM MAG lacks
the nitrification markers: nxrA and amoB.
Phylogenomics and Metabolic Features of the UWM Comammox MAG
Figure 3.17 Concatenated Nitrospira Core Pangenome Maximum Likelihood Phylogenomic Tree

90
Figure 3.18 AOB & Comammox Bayesian Coalescent Species Tree
It is interesting that the UWM comammox MAG was assembled from a nitrite-
oxidation enrichment. The coassembled MAG appears to be a Clade A comammox
Nitrospira (Figures 3.17 & 3.18). This is the third Clade A comammox assembly from a
recirculating aquaculture system, however, it is the first enrichment from the oxic portion
of a biological filter. Interestingly, when we strictly compare the UWM comammox
MAG to the other assemblies from aquaculture systems, Ca. N. nitrosa and Ca. N.
nitrificans, one important metabolic pathway stands out. The UWM MAG encodes
RuBisCo and a nearly complete Calvin-Benson-Bassham (CBB) cycle (Figure 3.19).
Previous Nitrosomonas europaea work indicated the cbb operon is upregulated in
response to low levels of CO2, depending on cellular energy status (Wei et al., 2004). It is
entirely possible that this same regulatory mechanism exists within the in situ UWM
biofilter population of comammox. This may offer some explanation to the low diversity
of commamox genotypes during the fallow period inoculum from Chapter 3, Section 3.2

91
compared to Section 3.1. However, the RuBisCo encoded by another Nitrospira was
found to be a form IV molecule, and not involved in the CBB cycle due to a lack of key
functional residues (Lücker et al., 2010). Regardless, little is known about comammox
gene regulation mechanisms, so the gene regulation hypothesis and RuBisCo form IV
function in commamox merit further study.
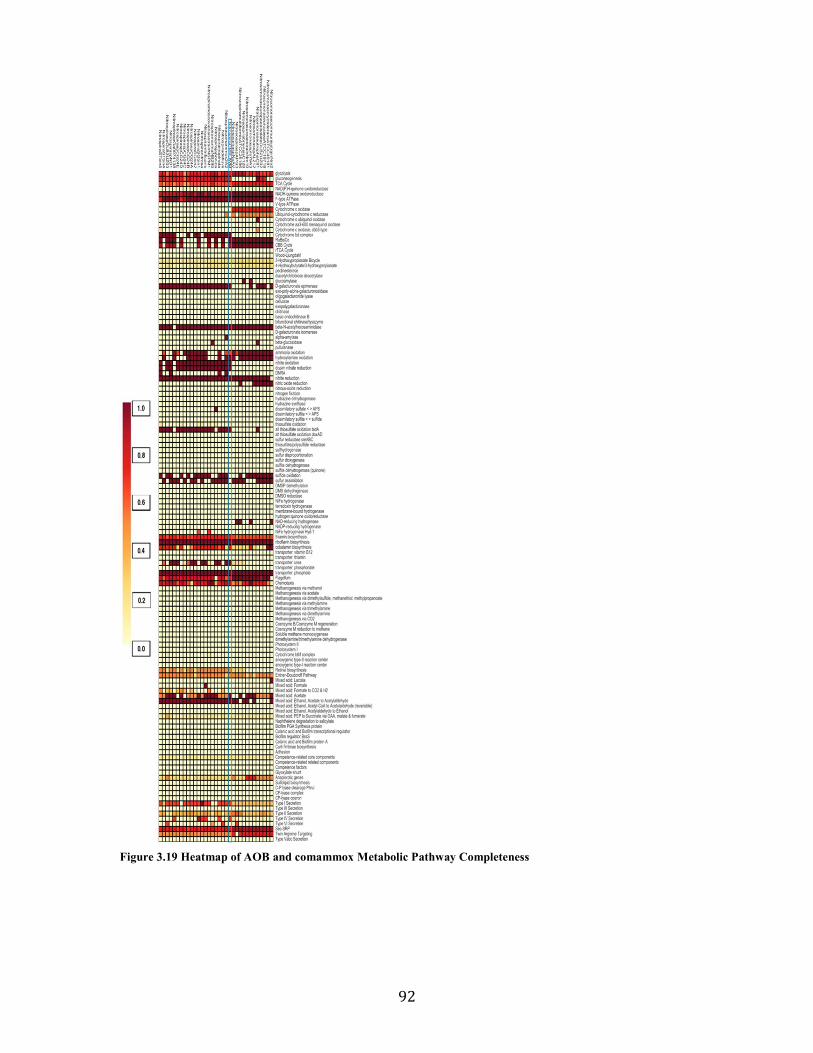
92
Figure 3.19 Heatmap of AOB and comammox Metabolic Pathway Completeness
93
4 Flavobacterium columnare – A Model Freshwater Fish
Pathogen
4.1 Review of F. columnare as an opportunistic fish pathogen in aquaculture
As of 2014, there are 51 fish diseases and pathologies recognized in the American
Fisheries Society’s (AFS) Blue Book of Fish Health. Bacteria cause approximately 30%
of the diseases recognized by the AFS (AFS-FHS, 2014).
A gram-negative bacterial pathogen from the phylum Bacteroidetes,
Flavobacterium columnare, is the causative agent of columnaris, or “fin rot”, in fish. In
both wild ecosystems and intensive aquaculture systems, columnaris is a disease that
infects a multitude of fish species causing deformation of gills and fins; and often results
in death (Declercq et al., 2013; Durborow et al., 1998; Pulkkinen et al., 2010; Scott and
Bollinger, 2014). Columnaris is of concern to aquaculturalists independent of system
design and the persistence of these organisms majorly hinders crop yields. However, little
is known about what causes this pathogen to bloom within aquaculture systems and even
less is known about the ecological role F. columnare plays in the environment (McBride,
2014). Dead fish shed F. columnare at a high rate, after which, viable F. columnare cells
persist for several months (Kunttu et al., 2009). To compound matters of microbial
persistence, it is likely that F. columnare is not an obligate pathogen, and thus must have
other means of surviving within an aquaculture system. Some Flavobacteria have been
demonstrated to degrade dissolved organic matter (DOM), with an affinity for protein
degradation (Cottrell and Kirchman, 2000). After cyanobacterial blooms die off in
eutrophic lakes, the dead bloom enters the DOM cycle, where the recycling of proteins
from the bloom detritus elicits an increased growth response within the Flavobacteria

94
community (Eiler and Bertilsson, 2007). It has been demonstrated previously that
proteases, responsible for degrading the protein fraction of DOM, remain active after the
death of bacterial populations (Kiersztyn et al., 2012).
Within closed loop agricultural systems, such as those found in recirculating
aquaculture, undigested feed and feces likely become the primary source of DOM for
organisms like F. columnare. It is unknown where opportunistic pathogens, like F.
columnare reside in these systems, but they have been shown to persist for months
(Kunttu et al., 2009). In Chapter 2 of this dissertation, there was evidence that
Flavobacterium species are majority members of the planktonic community across
multiple RAS. In F. columnare, we found the variable 6 region of the 16S rRNA gene to
be a unique identifying sequence. Currently there are limited methods to specifically
interrogate reservoirs of F. columnare, or observe population dynamics in response to
elevated dissolved organic matter levels.
There are few methods that do not rely on traditional microbial culture methods to
track the proliferation of F. columnare beyond an active outbreak. By relying on culture-
based methods of detection, aquaculturalists are taking a reactive approach to pathogen
management, rather than proactively managing their systems. Furthermore, these
methods do not provide any means of tracking F. columnare back to the reservoir within
an aquacultural system.
Strains of F. columnare are sub-classified into genomovars, which are analogous to
“ecotypes” of other bacterial species. Genomovars are classified based upon 16S
restriction fragment length polymorphism (RFLP) (Darwish and Ismaiel, 2005; Lafrentz
et al., 2013; LaFrentz et al., 2018). Classification problems arise since, RFLP is highly
variable and depends on agarose quality (Lafrentz et al., 2013). Recently 16S-RFLP was
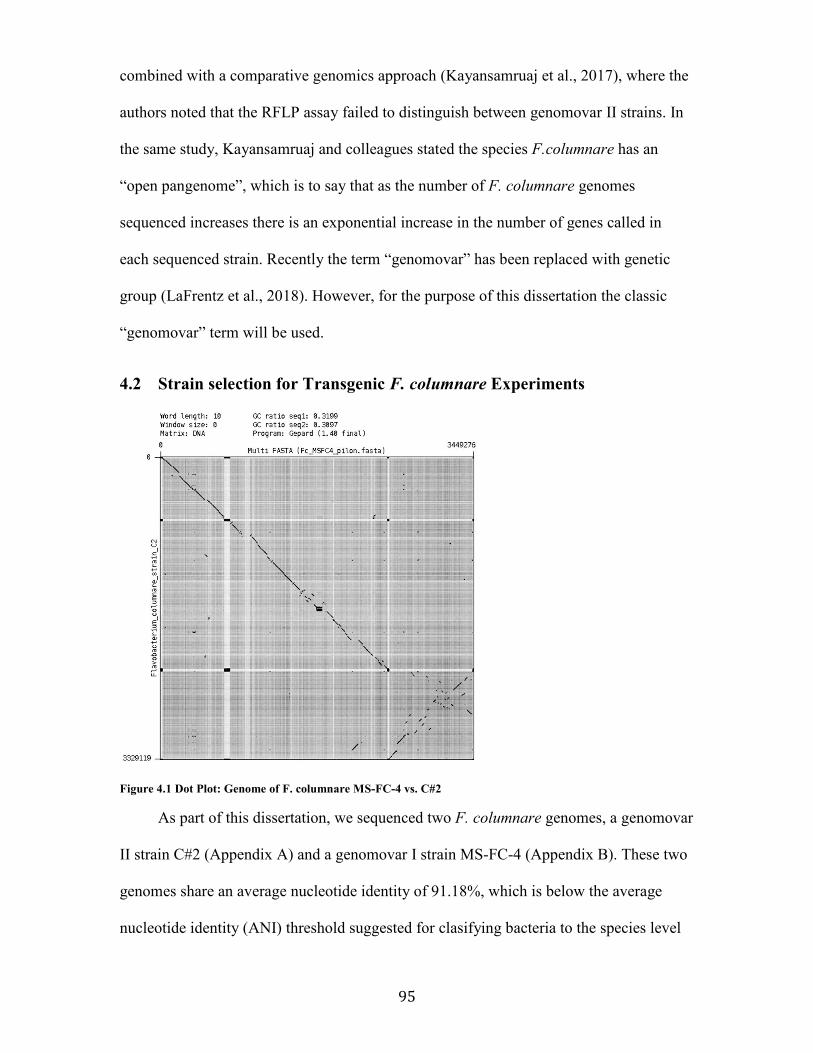
95
combined with a comparative genomics approach (Kayansamruaj et al., 2017), where the
authors noted that the RFLP assay failed to distinguish between genomovar II strains. In
the same study, Kayansamruaj and colleagues stated the species F.columnare has an
“open pangenome”, which is to say that as the number of F. columnare genomes
sequenced increases there is an exponential increase in the number of genes called in
each sequenced strain. Recently the term “genomovar” has been replaced with genetic
group (LaFrentz et al., 2018). However, for the purpose of this dissertation the classic
“genomovar” term will be used.
4.2 Strain selection for Transgenic F. columnare Experiments
Figure 4.1 Dot Plot: Genome of F. columnare MS-FC-4 vs. C#2
As part of this dissertation, we sequenced two F. columnare genomes, a genomovar
II strain C#2 (Appendix A) and a genomovar I strain MS-FC-4 (Appendix B). These two
genomes share an average nucleotide identity of 91.18%, which is below the average
nucleotide identity (ANI) threshold suggested for clasifying bacteria to the species level

96
(Goris et al., 2007; Yoon et al., 2017). The two genomes share some amount of synteny
(Figure 4.1). However, as mentioned in Appendix A, large chromosomal inversions occur
within Flavobacteria as evidenced by the synteny fracturing in the lower right hand
corner of Figure 4.1. Interestingly, despite syntenic differences, both C#2 and MS-FC-4
may be genetically manipulated (Appendices A & B, Li et al., 2015b). MS-FC-4 was
chosen for further study, since it was isolated from rainbow trout (Oncorhynchus mykiss)
(Evenhuis et al., 2016) and the preferred temperature range of trout (7-18˚C) overlaps
with that of yellow perch (17.5-25˚C).
4.3 Construction of a Model GFP Transgenic F. columnare strain to Study
Columnaris Infection F. columnare MS-FC-4 was selected for its genetic malleability to develop a
transgenic strain with green fluorescence protein (GFP). The integration of a functional
GFP operon in MS-FC-4 would allow for rapid microscopy studies of infection
localization. This transgenic strain may also develop a finer scale growth curve than those
derived from turbidity or optical density, for use in growth substrate preference studies.
To find an insertion site for the operon, it was determined that remnant bacteriophage
regions of the genome would serve as the least metabolically disruptive site. Careful
artificial operon construction would also ensure no frame-shift mutations were introduced
into the genome. Conjugation between E coli and F. columnare MS-FC-4 was used to
test the ability of MS-FC-4 to express GFP on a self-replicating plasmid according to
previously published methods (Staroscik et al., 2008). The plasmid was selected for after
conjugation using cefoxitin-resistance. MS-FC-4 colonies that grew on TYES media plus
10-µg/mL cefoxitin were tested for GFP expression using fluorescent microscopy (Figure
4.2).
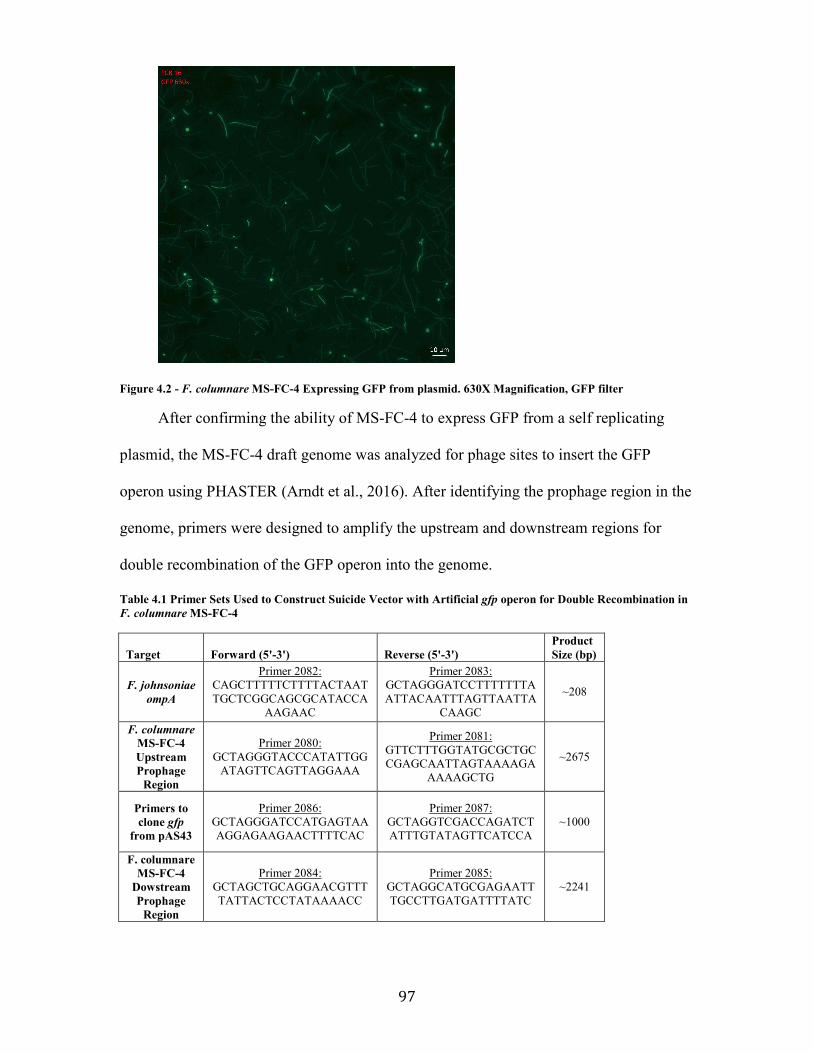
97
Figure 4.2 - F. columnare MS-FC-4 Expressing GFP from plasmid. 630X Magnification, GFP filter
After confirming the ability of MS-FC-4 to express GFP from a self replicating
plasmid, the MS-FC-4 draft genome was analyzed for phage sites to insert the GFP
operon using PHASTER (Arndt et al., 2016). After identifying the prophage region in the
genome, primers were designed to amplify the upstream and downstream regions for
double recombination of the GFP operon into the genome.
Table 4.1 Primer Sets Used to Construct Suicide Vector with Artificial gfp operon for Double Recombination in
F. columnare MS-FC-4
Target Forward (5'-3') Reverse (5'-3')
Product
Size (bp)
F. johnsoniae
ompA
Primer 2082: CAGCTTTTTCTTTTACTAATTGCTCGGCAGCGCATACCA
AAGAAC
Primer 2083: GCTAGGGATCCTTTTTTTAATTACAATTTAGTTAATTA
CAAGC
~208
F. columnare
MS-FC-4
Upstream
Prophage
Region
Primer 2080: GCTAGGGTACCCATATTGG
ATAGTTCAGTTAGGAAA
Primer 2081: GTTCTTTGGTATGCGCTGCCGAGCAATTAGTAAAAGA
AAAAGCTG
~2675
Primers to
clone gfp
from pAS43
Primer 2086: GCTAGGGATCCATGAGTAAAGGAGAAGAACTTTTCAC
Primer 2087: GCTAGGTCGACCAGATCTATTTGTATAGTTCATCCA
~1000
F. columnare
MS-FC-4
Dowstream
Prophage
Region
Primer 2084: GCTAGCTGCAGGAACGTTTTATTACTCCTATAAAACC
Primer 2085: GCTAGGCATGCGAGAATTTGCCTTGATGATTTTATC
~2241

98
First, a 2475 bp region upstream of the identified prophage site was PCR amplified
(primers 0280 & 2081, Table 4.1). This reaction was done using 30 ng of MS-FC-4
gDNA or 200 ng gDNA as template in 25 µl volumes with final concentrations of: 1x
Phusion Master Mix, 0.2 µM F+R primer. The thermocycling conditions were as follows:
1x 30 sec 98˚C, 25x 10 sec 98˚C, 30 sec 58˚C, 1 min 20 sec 72 ˚C, 1x 5 min 72˚C. The
PCR products from this reaction were excised from the gel and purified before
downstream use. ompA, a strong promoter from F. johsoniae, was amplified as described
previously (Table 4.1, primers 2082 & 2083; Li et al., 2015b). Then the upstream region
and ompA were fused into an artificial promoter using overlap PCR (Zhu et al., 2017).
The complement of the reverse primer used to amplify the upstream prophage region was
used as the forward primer in the overlap PCR and the ompA amplicon served as an
equivalent to the reverse PCR primer. After confirming the success of the overlap PCR
on an agarose gel (using primers 2080 & 2083, Table 4.1), the newly constructed
promoter region was ligated into the restriction digested pBFc2 suicide vector plasmid.
The gfp gene was then amplified from the plasmid used in the proof of concept
experiments using previously published primers (primers 2086 & 2087, Table 4.1;
Staroscik et al., 2008), the pBFc2 plasmid was restriction digested, and GFP was ligated
into the suicide vector (now termed pBFc4, which is pBFc2+GFP). Finally, the region
downstream of the prophage region was amplified with a different primer set under the
same conditions as the upstream region. The suicide plasmid was restriction digested
downstream of the artificially constructed ompA+gfp operon. The cleaned up PCR
amplicon of the region downstream of the prophage (primers 2084 & 2085, Table 4.1)
was then ligated into the plasmid before the conjugation and double recombination
events. The double recombination methods used were identical to those from Li, et al.,
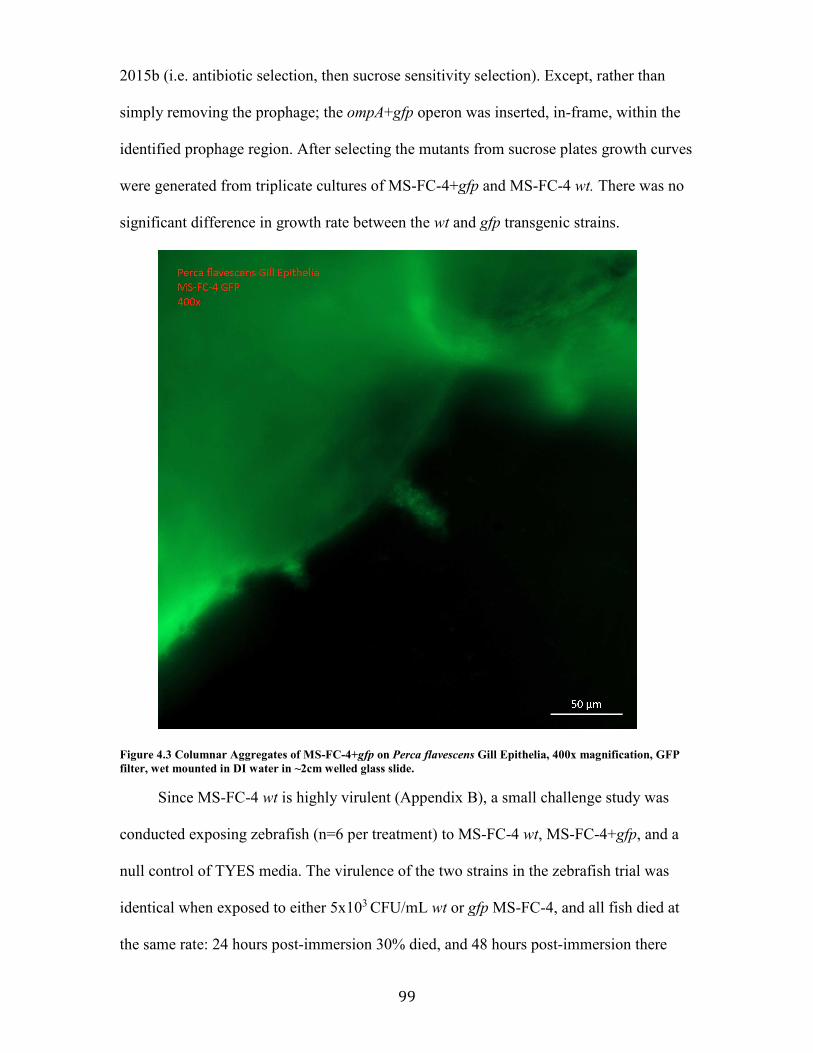
99
2015b (i.e. antibiotic selection, then sucrose sensitivity selection). Except, rather than
simply removing the prophage; the ompA+gfp operon was inserted, in-frame, within the
identified prophage region. After selecting the mutants from sucrose plates growth curves
were generated from triplicate cultures of MS-FC-4+gfp and MS-FC-4 wt. There was no
significant difference in growth rate between the wt and gfp transgenic strains.
Figure 4.3 Columnar Aggregates of MS-FC-4+gfp on Perca flavescens Gill Epithelia, 400x magnification, GFP
filter, wet mounted in DI water in ~2cm welled glass slide.
Since MS-FC-4 wt is highly virulent (Appendix B), a small challenge study was
conducted exposing zebrafish (n=6 per treatment) to MS-FC-4 wt, MS-FC-4+gfp, and a
null control of TYES media. The virulence of the two strains in the zebrafish trial was
identical when exposed to either 5x10³ CFU/mL wt or gfp MS-FC-4, and all fish died at
the same rate: 24 hours post-immersion 30% died, and 48 hours post-immersion there

100
were no surviving zebrafish. All fish in the TYES control group survived for 7 days. A
small trial was also conducted to examine the localization of MS-FC-4+gfp in Yellow
Perch, and the maintenance of GFP expression post-mortem. Use of the MS-FC-4+gfp
strain allowed for the capture of F. columnare’s namesake columnar stacks of bacteria on
the larval perch gills (Figure 4.3), as well as showing localization of the infection in the
GI tract and head kidneys (Figure 4.4). The development of this GFP expressing strain
will enable researchers to look at how gene deletion affects infection localization or
infection severity. The results of these future experiments may be extended to generate
attenuated vaccines against this common aquaculture opportunistic pathogen.
Figure 4.4 Juvenile Perca flavescens GI Tract after exposure to MS-FC-4+gfp. Post-mortem image taken at 400x
magnification on an epifluorescent microscope with a gfp filter cube without fixative, mounted in DI water on a
slide with a single ~2cm well.

101
4.4 The Cryptic Ecology of F. columnare Little is known about the ecology of F. columnare, however, it is responsible for
yearly larval fish die offs in natural ecosystems (Scott and Bollinger, 2014). During
fish kills, F. columnare is able to maintain a saprophytic lifestyle (Kunttu et al.,
2009), but loses its virulence after phage predation (Laanto et al., 2012). It is
puzzling that only some strains conduct anaerobic denitrification while others do
not (McBride, 2014). However, none of these metabolic features illustrate a clear
ecological niche or role for F. columnare in natural ecosystems.
Nutrient availability from primary producer derived detritus may influence
populations of Flavobacterium spp. For example, algal biomass was previously
shown to have growth rate effects on heterotrophic bacterial populations in marine
and freshwater environments (White et al., 1991). Furthermore, other members of
the class Flavobacteria have been shown to be critical in algal-derived dissolved
organic matter degradation in both marine and freshwater ecosystems (Eiler and
Bertilsson, 2007; Mann et al., 2013). At an ecosystem level, it is possible F.
columnare also participates in macromolecular degradation, but further
experimentation is required. One hypothesis may be that the association with fish
die offs in the spring is due to low algal substrate availability, particularly after the
winter thaw during fish spawning season. In aquaculture systems, algal biomass is
largely seen as a nuisance to fish production, and a potential source of fish kills
(Tucker and Hargreaves, 2008). If infecting fish is a secondary ecological niche for F.
columnare, given the persistence of Flavobacterium spp. in RAS outlined in Chapter
2, deciphering the ecological niche of F. columnare is a hypothesis worth exploring.
102
5 Future of Targeted Microbiological Approaches in
Aquaculture
5.1 Beyond Basic Recirculating Aquaculture RAS offers a viable means of combating declining fisheries (Barange et al., 2014),
however it cannot address the availability of produce like aquaponic systems (Love et al.,
2015a). RAS also lacks the trophic complexity of aquaponic systems without the addition
of other salable crops, such as bivalves or crustaceans that act as nutrient sinks in multi-
trophic aquaculture (Martins et al., 2010). Multi-trophic RAS may offer more salable
products to practitioners who choose to combine cultivars, such as one study that
combined white shrimp and Nile Tilapia cultivation (Muangkeow et al., 2007). However,
in an educational setting, RAS does not offer the same benefits associated with the
increased ecological complexity of aquaponic systems (Genello et al., 2015). In RAS, the
ecosystem is largely unobservable to those without access to the latest methods in
microbial ecology. Recent surveys of aquaponic systems suggest ecological gradients
exist in the componentry, which is similar to the findings in previous chapters of this
dissertation (Schmautz et al., 2017). These methods remain underutilized in both RAS
and aquaponic systems (Munguia-Fragozo et al., 2015; De Schryver and Vadstein, 2014),
which is perplexing given how the functionality of components in both classes of
agricultural systems depends on their innate microbiota. If all agricultural systems that
are dependent on their microbiota for process engineering were studied in as great of
detail as wastewater or drinking water treatment, perhaps reproducibility of systems
would be easier. What follows is a perspective on the applicability of microbial ecology
to aquaponic systems for promoting plant growth. This work is meant to address, in
hypothetical terms, the untapped potential of microorganisms to alleviate iron deficiency
in aquaponic systems.
103
5.2 Stripping Away the Soil: Plant Growth Promoting Microbiology
Opportunities in Aquaponics
Modified from the published form in Frontiers in Microbiology (doi:
10.3389/fmicb.2018.00008)
Stripping Away the Soil: Plant Growth Promoting Microbiology Opportunities in
Aquaponics
Ryan P. Bartelme1, Ben O. Oyserman2,3, Jesse E. Blom4, Osvaldo J. Sepulveda-Villet1,
Ryan J. Newton1*
1School of Freshwater Sciences, University of Wisconsin-Milwaukee, Milwaukee, WI,
USA; 2Bioinformatics Group, Wageningen University, Wageningen, the Netherlands; 3Department of Microbial Ecology, Netherlands Institute of Ecology (NIOO-KNAW),
Wageningen, The Netherlands; 4Johns Hopkins Center for a Livable Future, Dept. of Environmental Health and
Engineering, Bloomberg School of Public Health, Johns Hopkins University, Baltimore,
MD, USA.
Keywords: Aquaponics, Plant growth promoting microorganisms, Recirculating
aquaculture, Chlorosis, Rhizosphere, Microbiome
Running Title: Microbiology Research in Aquaponics

105
Abstract As the processes facilitated by plant growth promoting microorganisms (PGPMs) become
better characterized, it is evident that PGPMs may be critical for successful sustainable
agricultural practices. Microbes enrich plant growth through various mechanisms, such as
enhancing resistance to disease and drought, producing beneficial molecules, and
supplying nutrients and trace metals to the plant rhizosphere. Previous studies of PGPMs
have focused primarily on soil-based crops. In contrast, aquaponics is a water-based
agricultural system, in which production relies upon internal nutrient recycling to co-
cultivate plants with fish. This arrangement has management benefits compared to soil-
based agriculture, as system components may be designed to directly harness microbial
processes that make nutrients bioavailable to plants in downstream components.
However, aquaponic systems also present unique management challenges. Microbes may
compete with plants for certain micronutrients, such as iron, which makes exogenous
supplementation necessary, adding production cost and process complexity, and limiting
profitability and system sustainability. Research on PGPMs in aquaponic systems
currently lags behind traditional agricultural systems, however it is clear that certain
parallels in nutrient use and plant-microbe interactions are retained from soil-based
agricultural systems.

106
Aquaponics - Stripping Away the Soil
Aquaponics, the combined culture of fish and plants in recirculating water
systems was pioneered in the 1970’s (Lewis et al., 1978; Naegel, 1977; Sneed et al.,
1975) as an environmentally sustainable agricultural method based on the concepts of
minimal water use and minimal impact on environmental water quality compared to
traditional agricultural methods (Blidariu and Grozea, 2011). In addition to producing
salable crops, aquaponics is valued for its positive development of community and
economic opportunity in urban areas (Goodman, 2011), and its wide-ranging educational
benefits for students through the post-secondary level (Genello et al., 2015; Hart et al.,
2014). Despite these benefits, microbial research supporting aquaponic crop production
lags behind traditional agricultural systems. Here, we present the case that aquaponic
systems provide a relatively untapped potential for research on plant-microbe
interactions.
Aquaponics is a highly engineered agricultural system that uses fish effluent
(which comprises both particulate waste solids and dissolved nutrients) from a
recirculating aquaculture subsystem as nutrient medium to grow edible plants in attached
hydroponic subsystems. In return, nutrient removal through plant absorption and growth,
parallel to their associated microbiota, decreases dissolved solid and ionic concentrations,
which, in turn, benefits fish production by improving overall water quality parameters,
including the removal of toxic metabolites, such as ammonia and nitrite. Together, this
circular and beneficial relationship between fish, plants, and microbes reduces water
usage compared to traditional agriculture. Historically, aquaponics research was driven
by the recirculating aquaculture community; so most technological advancement was
focused on optimizing water quality for fish production purposes (Lewis et al., 1978;
Naegel, 1977; Sneed et al., 1975). However, recent energy analyses and industry surveys
of aquaponic systems concluded that profitability is greater when a plant-centric
production approach is adopted (Love et al., 2015a, 2015b). Incorporation and testing of
hydroponic method compatibility is therefore critical to integrating simultaneous fish and
plant production. For example, using a hydroponic-centered production setup, Schmautz
and colleagues found that the aquaculture-subsystem provided the necessary nutrients to
produce cherry tomatoes with nutrient content that exceeded those available at local
107
markets (Schmautz et al., 2016). However, to improve plant growth in plant-centric
aquaponic systems, micronutrient supplementation (e.g. iron, calcium, and potassium) is
often required (Bittsanszky et al., 2016; Rakocy et al., 2004; Roosta, 2014). Additionally,
chemical inputs are needed to counteract disease and other plant stressors (Nguyen et al.,
2016), which adds long-term operational expenses (Love et al., 2015a). Thus, despite the
benefits of these integrated agricultural systems, high capital expenses during system
construction (Engle, 2015), and the abovementioned chemical supplementation make
achieving economic sustainability a challenge. Continued research on micronutrient
transport and transformation between aquaponic subsystems is needed to identify
shortcomings and optimize engineering paradigms in aquaponic systems.
Plant growth promoting microorganisms (PGPMs) may be an effective alternative
to chemical inputs for dealing with plant growth requirements and stressors in aquaponic
systems. Plants recruit PGPMs from the surrounding environment to their rhizosphere
using specific chemical signaling (DeVries and Wallenstein, 2017). For example, under
phosphorus (P)-limiting conditions, the plant hormone strigalactone is released into the
rhizosphere, where it serves as a signaling molecule to initiate associations with fungi
(Akiyama et al., 2005). In soil-based environments PGPMs are known to enhance plant
growth via a number of mechanisms, including: nitrogen fixation, organic matter
mineralization, root growth promotion, protection against pathogens, and increasing the
bioavailability of nutrients, including micronutrients such as iron (Cerozi and
Fitzsimmons, 2016; Coleman-Derr and Tringe, 2014; Dias et al., 2014; Höflich et al.,
1995; Khalifa et al., 2016; Loper et al., 2012; Loper and Henkels, 1997, 1999; Malusá et
al., 2012; Marasco et al., 2012; Mendes et al., 2011; Pii et al., 2015; Rashid et al., 2012).
In soilless environments, PGPM research is limited, but existing studies suggest PGPMs
also play a significant role in plant growth and health (Cerozi and Fitzsimmons, 2016;
Gravel et al., 2006; Nguyen et al., 2016; Sheridan et al., 2016; Villarroel et al., 2011).
Regardless of the agricultural system, root health is essential to the survival of
plants; so one focus area for aquaponic PGPM research should be microbial root
colonization. Arbuscular mycorrhizal fungi are well-documented plant growth promoting
fungi that colonize plant roots. In traditional soil-based agriculture, arbuscular
108
mycorrhizal fungi promote phosphorus uptake and enhance biomass production
(Govindasamy et al., 2011). Arbuscular mycorrhizal fungi also appear to be important for
plant health in hydroponics. For example, in one hydroponic system study, arbuscular
mycorrhizal fungi inhibited Fusarium spp. from inducing root rot in tomatoes grown
under near-commercial conditions (Utkhede, 2006). While arbuscular mycorrhizal fungi
are a commonly cited PGPM, many different microorganisms are thought to be PGPMs.
One such group, rhizobia, were discovered in the 19th Century (Beijerinck, 1888), and
now these diazotrophic bacteria are recognized as essential agents in promoting growth
among crops such as legumes, rice, and wheat (Govindasamy et al., 2011; Ji et al., 2014;
Majeed et al., 2015). Interestingly, iron siderophores facilitate the formation of rhizobium
diazotrophic nodules (Barton et al., 1996; Brear et al., 2013), suggesting micronutrients
may play a role in PGPM colonization in other agricultural systems, such as
hydroponics/aquaponics. However, some PGPM benefits may come at an adaptive cost,
such as increased sensitivity to insect herbivory (Barazani and Baldwin, 2013), but
controlled environmental agriculture can account for invertebrate pest problems (Fox et
al., 2012). Ultimately, research on PGPM in aquaponic systems may alleviate costly
nutrient supplementation by properly integrating PGPM driven environmental processes
into system design.
In addition to benefitting aquaponic crop production, PGPM research in soilless
engineered environments has the potential to advance the fundamental understanding of
rhizosphere microorganism associations. It is clear plants recruit PGPMs to their
rhizosphere, but the mechanisms driving plant growth promoting rhizosphere interactions
are difficult to disinter from soil-based studies (DeVries and Wallenstein, 2017). Soil
matrices are chemically complex and heterogeneous, exhibiting immensely diverse
microbial communities. Additionally, given the large variability among soil and crop
types, (DeVries and Wallenstein, 2017), rhizosphere recruitment of PGPMs in this
environment remains mainly theoretical and often limited to a case-by-case basis. The
complexity of the soil matrix also adds technological hurdles to studying PGPMs. The
soil matrix often hinders nucleic acid extraction and, subsequently, sequence-based
analyses of microorganisms, thus inhibiting the exploration of microbial community
structure (Carini et al., 2016), genetic signatures pertaining to nutrient processing (Krsek

109
and Wellington, 1999; Martin-Laurent et al., 2001), and the identification of microbial
guilds to utilize in rhizosphere engineering (Dessaux et al., 2016; Mueller and Sachs,
2015; Pii et al., 2015; Savka et al., 2013). In contrast to soil-based agricultural systems,
aquaponic systems operate in highly monitored and controlled environments (e.g. pH,
temperature, hydraulic retention time, nutrient concentrations, etc.), and lack the
confounding variability and complexity of the soil-matrix. As a result, these systems
represent, scalable, highly reproducible, and adjustable laboratories for PGPM research,
where discoveries made in a research setting may be more directly transferred to an
industrial or practical application.
The Challenges of Integrated System Design in Aquaponics
Aquaponic systems must balance the physiological requirements of both plant and
fish in order to maintain their health. This balance makes even basic system design
challenging, such as identifying plant and fish species that are compatible. The
integration of distinct fish and plant subsystems also means operational change in any
one component inherently impacts all other components, thereby creating a fairly high
level of ecological complexity. For example, solid waste in aquaponic systems primarily
consists of fish feed and feces, which, when decomposed, act as fertilizer for the
hydroponic subsystem. Calculated fish feed rates relate to plant grow-bed size, but feed
conversion and nutrient assimilation varies with feed protein type (i.e. plant-derived vs.
teleost protein extracts) and plant crop-type (Hu et al., 2015; Medina et al., 2016; Rakocy
et al., 2006; Timmons and Ebeling, 2013). Excess solid waste increases oxygen demand
leading to hypoxic conditions in the rhizosphere, and may generate toxic concentrations
of ammonia and nitrite (Danaher et al., 2013; Rakocy, 2012). Therefore, proper solids
management is necessary to maintain the oxygen gradient around the plant roots allowing
for colonization of PGPMs and preventing phyto-pathogen growth. However, in the roots
of the hydroponic subsystem an appropriate level of solid waste re-mineralization is
essential to supply micro- and macronutrients to the plants (Rakocy et al., 2012). Basic
system design constraints influence overall microbial community structure and suggest
microbial niche differentiation within system components, but the influence of
environmental conditions has yet to be explored in aquaponic systems (Schmautz et al.,
110
2017). Food web interactions, including predation on bacteria and archaea and nutrient or
energy transfer from microbial eukaryotic activity, such as that from micro-fungi, may
also confound system designs in yet unknown ways. These food web interactions have
had little consideration in system designs to date, but deserve thorough analysis as control
points for microbial-plant interactions and in experiments aimed at optimizing aquaponic
system technology.
Iron Limitation: A Case Study for PGPM Research in Aquaponic Plant Production
Commonly, iron is supplemented in the hydroponic subsystems of aquaponics
configurations; however, little attention has been paid to exactly why this
supplementation is required. Herein we review what is known about iron requirements in
aquaponics and discuss possible iron supplementation strategies that do not require
industrially produced chelated iron. Iron is an essential molecule for a multitude of
metalloprotein structures (e.g. hemoglobin, chlorophyll, and cytochromes), and therefore,
demand is high from all biological components of an aquaponic system. Fish assimilate
low amounts of iron relative to terrestrial livestock (van Dijk et al., 1975), and often fish
iron needs are met or frequently exceeded, with commercial feeds (Watanabe et al.,
1997), so little attention is paid to this component of aquaculture operations. In contrast,
although undigested fish feed contains excess iron, plant grow beds in aquaponics are
often limited by bioavailable iron (Fe2+). This nutrient deficiency is a known cause of
chlorosis in the hydroponic subsystem crops, but may not be evident in a system until
vegetable products have been raised for multiple generations (Rakocy et al., 2004). In the
University of the Virgin Islands system, chelated iron is added at a concentration of 2
mg/L per day (Rakocy et al., 2004) to prevent chlorosis. One major factor driving iron
deficiency is that soluble ferrous iron (2+) easily crosses the rhizoplane of the roots, but
ferric iron (3+) is insoluble. Consequently, the competing chemical reactions driving Fe2+
to Fe3+ (i.e. the speciation of iron in natural water systems by hydroxyl radicals and ionic
interactions) and pH dependency complicate the mass balance of iron in aquaponic
systems (Rose and Waite, 2002; Waite, 2002). Biotic factors in aquaponic systems may
also reduce available iron for plants. Endemic microbial communities scavenge iron for
constructing metalloprotein centers (Andrews et al., 2003), but in aquaponics the extent
of this iron demand remains unknown.

111
Limitation of biologically available iron is a relatively common phenomenon
across environments containing photosynthetic organisms. One such environment is the
ocean, where primary productivity depends on soluble iron, though iron remains
sequestered in microbial amphiphilic siderophores (Boiteau et al., 2016). Published
literature on the role of siderophores in soil-based agriculture point to both an
enhancement of growth and a link to pathogenesis (Kloepper et al., 1980; Neilands and
Leong, 1986). Pseudomonas fluorescens Pf-5 is one PGPM known to increase the
bioavailability of iron through siderophore production in iron deficient soils (Loper and
Henkels, 1997). Interestingly, some pseudomonads, like Pseudomonas putida, are able to
scavenge iron from other siderophores under laboratory conditions and promote iron
uptake in experimental cucumber seedlings (Loper and Henkels, 1997). The “siderophore
theft” may be indicative of pseudomonad PGPM’s ability to remediate disease (Loper
and Buyer, 1991; Loper and Henkels, 1997). Furthermore, genomic analyses of
Pseudomonas spp. indicate a distinct ability to modulate the surrounding rhizosphere
community through antifungal and bacteriocin production, in addition to siderophore
production (Loper et al., 2012). In soil-based agriculture, other bacterial species such as,
Bacillus and Paenibacillus spp. exhibit similar PGPM characteristics (Govindasamy et
al., 2011). All of the aforementioned PGPM microbes found in soil studies may allow
aquaponics practitioners to biologically remediate regularly occurring nutrient
deficiencies. Since there is evidence PGPM ecophysiologies work to overcome
micronutrient deficiencies in engineered environments (Villarroel et al., 2011), there is
ample opportunity to research their usefulness for aquaponic system design and
management.
All nutrient rich hydroponic systems, including aquaponics, must balance the
promotion of beneficial microorganisms while minimizing the growth and rapid spread of
plant pathogens (Lee and Lee, 2015). Though the resiliency of aquaponic systems to
phytopathogen infection requires experimental study, other groups of PGPM’s (such as
Bacillus spp. and Paenibacillus spp.) may be linked to plant resilience (Govindasamy et
al., 2011; Loper et al., 2012). In hydroponics, PGPM species have been identified from
the bacterial genera Pseudomonas, Bacillus, Enterobacter, Streptomyces, Gliocladium,
and Trichoderma; many of which produce siderophores (Lee and Lee, 2015). It also has

112
been demonstrated that siderophore production by a Chryseobacterium spp. alleviates
iron starvation in tomato plants (Radzki et al., 2013). It is likely that other syntrophic or
symbiotic relationships between plants and rhizoplane microbiomes exist, but as of now
remain undiscovered or underutilized. As more PGPM’s are discovered, operators may
potentially integrate batch-culturing devices to facilitate the growth of PGPM’s
producing siderophores. Batch production could minimize industrially manufactured
chelated iron input into the system, while aiding producers in ending the dispute over
USDA organic certification for aquaponic and hydroponic produce (Biernbaum et al.,
2016). At the 2017 National Organic Standards Board meeting no decision was made as
to whether aquaponic or hydroponic crops could be certified organic under United States
law.
Microbial iron use is a complicating factor in all environments with
photosynthetic activity. In aquaponic systems, iron demand upstream of the hydroponic
subsystem could induce a nutrient sink unless microbial micronutrient acquisition is
considered in aquaponic system engineering. For example, an important design feature of
aquaponics and recirculating aquaculture is solid waste decomposition, which induces
anoxic or hypoxic conditions and facilitates methanogen growth when solid retention
times (SRT) are greater than 10 days (Suhr et al., 2015). System iron deficits may be
compounded if solids management component SRT allows for methanogenic growth,
since many methanogens and methanotrophs require iron in metallo-protein complexes to
catalyze reactions (Ettwig et al., 2016; Glass and Orphan, 2012; Speece, 1983).
Additionally, iron is closely linked to the nitrogen cycle; a critical nutrient cycle to
manage for both fish and plant growth (Glass, 2015; Klotz and Stein, 2008; Timmons and
Ebeling, 2013). In some systems, such as the ocean or recirculating aquaculture system
solids digesters, the link between iron and nitrogen is significant, as denitrification
pathways found in heterotrophic microorganisms constitute one of the largest group of
iron dependent metabolic pathways (Glass et al., 2015; van Rijn et al., 2006). Careful
consideration of solids management and microbial nitrification is essential to iron
management in aquaponics, if siderophore-producing PGPM are to successfully mitigate
chlorosis.
113
The Microbial Future of Aquaponics
Integrating PGPMs into aquaponic system design has the potential to alleviate
micronutrient fluctuations and phyto-pathogen blooms in the hydroponic subsystem of an
aquaponic system. PGPM use in aquaponic process engineering may maintain optimal
plant production with lower nutrient concentrations than those found in a typical
commercial hydroponic system, thereby reducing the incidence of disease, and abiotic
inhibition of plant nutrient uptake (Lee and Lee, 2015; Mill et al., 1996; Rakocy et al.,
1997). These operational conditions also may be maintained in a hydroponic system, but
without fish feed and feces serving as the basis of plant growth substrate, external costs
and maintenance increase (Villarroel et al., 2011). Typically, the aquaponic system
operator supplements iron, calcium, and potassium, but solid waste re-mineralization
reduces supplementation cost compared to stand alone hydroponic systems (Bittsanszky
et al., 2016; Rakocy et al., 2006). Raising Tilapia (Oreochromis niloticus L.) at low
stocking densities was found to reduce nutrient costs incurred in hydroponic strawberry
production, however, PGPM growth was not considered (Villarroel et al., 2011). These
results and those from other studies (e.g. Schmautz et al., 2016), suggest that fish effluent
could serve as primary growth media for hydroponic subsystems, but supplemental
nutrients may be needed depending on the stocking density of the fish, plant crop grown,
and presence of active PGPM.
Besides PGPM research, there are a number of additional areas where microbial-
based research could benefit aquaponic production. For example, aquaponic practitioners
must carefully balance the pH requirements of fish, nitrifying microorganisms, and plants
by identifying a mean pH that facilitates biological growth throughout all components,
even if it is not optimal for any one component. Typically this means aquaponic
operation at a pH of 7.0, whereas plants grown hydroponically prefer a lower pH, from
5.5 to 6.5 (Rakocy et al., 2006). However, pH balancing does not follow a concrete rule
for operation, as a review of aquaponic crop production (Tyson et al., 2011) suggests
normal total crop yields may be obtained at pH levels above those recommended for
traditional production. Recent research into nitrifying microorganisms suggests that
certain species of nitrite-oxidizing bacteria become more competitive at lower pH levels
(Hüpeden et al., 2016), presenting the opportunity for further research into operating
aquaponic systems at a lower pH and allowing pH to be optimized for specific plant or

114
PGPM growth. There is also evidence of overlap between fish gut microbiomes and
rhizosphere microbiomes (Hacquard et al., 2015), which could indicate microbial-based
health benefits of fish-plant co-cultivation and an opportunity to use PGPM manipulation
to benefit both plant and fish growth. Root-associated microorganisms are also known to
influence plant phenology, such as flowering time (Pérez-Jaramillo et al., 2016; Wagner
et al., 2014), and thus, in theory, could be used to manipulate desired plant biological
characteristics in controlled settings such as those found in aquaponics. Finally, a recent
model argues that a shift from continuous recirculation to decoupling aquaponic system
components could lower incidences of nutrient supplementation and allow for PGPM
growth planned into initial aquaponic system design (Goddek et al., 2016). Decoupling
aquaponic components could free greater quantities of allochthonous iron and
micronutrients from solid waste, while also sustaining crop growth during emergency or
routine maintenance, but further research in this area and all those mentioned above is
needed.
Despite the benefits of these integrated agricultural systems, achieving economic
sustainability of aquaponic systems remains a challenge, primarily due to high capital
expenses during system construction (Engle, 2015) and the need to reduce recurrent
operational expenses (Love et al., 2015a). Microbial ecological theories governing
nutrient cycling, host interactions, and community assembly underpin plant growth and
health in aquaponic/hydroponic systems (Blancheton et al., 2013). Testing,
understanding, and applying these theories to improve system design is crucial as global
protein demands are becoming ever more reliant upon aquaculture/aquaponic systems,
and many are turning to aquaponics to serve food deserts in cities and decrease
agricultural water usage (Blidariu and Grozea, 2011; FAO, 2014; Goodman, 2011). We
advocate that one “moon shot” research area for microbiologists should be enhancing
sustainable agricultural systems, as this area presents opportunities to decentralize the
food production system, simplifies agricultural logistics by decreasing distance to market,
and enables more food safety and quality controls than traditional agriculture, while
positively impacting local economies.
Author Contributions

115
RPB and JEB developed and outlined the initial concept for the perspective. RPB was
the primary author and lead on writing and editing. BOO, JEB, and OJS-V contributed
ideas and writing for particular sections relating to their expertise, and all were involved
in writing and editing of manuscript drafts. RJN contributed to the initial outline and
perspective focus, was involved in writing and editing of all manuscript stages, and was
the primary source of funding for the project.
Funding
Funding for the work was provided by start-up laboratory funds to RJN through the
School of Freshwater Sciences, University of Wisconsin-Milwaukee, and a University of
Wisconsin-Milwaukee Distinguished Dissertation Fellowship to RPB.
Acknowledgements
We thank Dave Love for providing insightful comments on previous versions of this
manuscript and to all members of the Binkowski Lab for their many years of discussing
aquaculture/aquaponic technology and providing access to a working aquaculture facility.
5.3 Conclusions
The results from this dissertation synthesize multiple approaches to elucidating
microbial communities in recirculating aquaculture. Information on RAS microbiomes is
generally lacking (De Schryver and Vadstein, 2014), so it was necessary to compare the
system at the UW-Milwaukee School of Freshwater Sciences (UWM SFS) to other
systems in the Upper Midwest (Chapter 2). The results of this study indicated that each
system appears to have it’s own microbiome structure. These differences in microbiome
structure appeared to be significantly influenced by system source water. The biofilter
microbiomes in Chapter 2 were different at a bacterial community level. However, when
examining the nitrifiers present in all the biological filters surveyed, ammonia-oxidizing
archaea (AOA) and nitrite-oxidizing Nitrospira were dominant taxa. The appearance of
116
Nitrosomonas and complete ammonia-oxidizing Nitrospira (comammox) seemed to be
driven by biogeography and was again informed by source water.
Through the UWM SFS RAS biofilter survey in Chapter 3, it was found that the
biofilter microbiome shifted in concert with feed regime changes over the Yellow Perch
rearing cycle. It is also interesting that all three known freshwater ammonia oxidizing
microorganisms were present (AOA, comammox, and Nitrosomonas). However, AOA
and comammox dominated the biofilter over the rearing cycle, but all three organisms
coexisted across a nutrient gradient within the filter. Furthermore, modeling ammonia-
oxidation rate versus biomass as a function of solids residence time suggests that both
AOA and comammox could occupy the ammonia-oxidation niche within the system.
When scaled down to autotrophic bioreactor models of the UWM SFS RAS biofilter, a
prominent priority effect was found for seeding the filters with sand from the RAS
biofilter. The presence of Yellow Perch in the UWM RAS at the time of inoculum
sampling had an effect on comammox abundance in the lab-scale filters. A strain of
comammox from the UWM biofilter was enriched from biofilter sand during a Yellow
Perch rearing cycle solely using nitrite. The enrichment was then sequenced using
shotgun metagenomics, and the metagenomic-assembled genome (MAG) was placed into
a phylogenomic context with other ammonia-oxidizers. Two other aquaculturally
associated comammox are known (van Kessel et al., 2015). The UWM MAG shares most
of the same metabolic pathways as these comammox, but contains nearly complete
metabolic pathways for Ribulose-1,5-bisphosphate carboxylase/oxygenase synthesis and
the reductive pentose phosphate cycle. These differences from the other two RAS
comammox genomes may be indicative of an adaptation to fluctuating CO2 levels in the
aerobic biofilter, since the other Nitrospira were enriched from a RAS anaerobic digester.

117
Based on the results of Chapter 2, Flavobacterium spp. appear to persist in RAS,
with no obvious connection to pathogen outbreaks in all systems studied. Based upon
personal communications with the operators whose facilities were surveyed in Chapter 2,
F. columnare infects opportunistically during times of physiological stress. For example,
at one facility, the operators noted that as their solids management component failed,
there was a cascading effect through the system. Dissolved organic matter fluxed into the
biofilter, suppressing ammonia-oxidation, eventually causing a spike in nitrite
concentration and an outbreak of F. columnare. The sequencing of F. columnare
genomes in Appendices A and B may provide some insight into potential physiological
adaptations these organisms have made to persist during normal RAS operations. The
MS-FC-4+gfp strain represents a break through in pathogenesis studies in F. columnare
allowing for rapid visualization of F. columnare without necessarily fixing the cells as
one would when using other fluorescent microscopic techniques.
So in conclusion, the work in this dissertation reflects much of what De Schryver
and Vadstein suggested in their 2014 review of ecological approaches to control
aquaculture pathogens. In particular I conducted a system comparison study, detailed
analysis of a biological filter at multiple spatial scales, shotgun metagenomics, and
developed new ways to visualize an aquaculture pathogen. This work serves as a frame of
reference for many more future hypotheses by addressing fundamental knowledge gaps
in the microbial ecology of recirculating aquaculture. By no means is this work
exhaustive, it is merely a representation of the potential microbial ecology has to change
RAS operations by conducting research from the level of a single bacterial cell, to the
larger picture of the unseen ecosystem cultivated within RAS.

118
REFERENCES Abby, S. S., Cury, J., Guglielmini, J., Neron, B., Touchon, M., and Rocha, E. P. (2015).
Identification of protein secretion systems in bacterial genomes. bioRxiv, 031039.
doi:10.1101/031039.
Abell, G. C. J., Robert, S. S., Frampton, D. M. F., Volkman, J. K., Rizwi, F., Csontos, J.,
et al. (2012). High-throughput analysis of ammonia oxidiser community
composition via a novel, amoA-based functional gene array. PLoS One 7, e51542.
doi:10.1371/journal.pone.0051542.
AFS-FHS (2014). FHS Blue Book: Suggested Procedures for the Detection and
Identification of Certain Finfish and Shellfish Pathogens.
Akiyama, K., Matsuzaki, K., and Hayashi, H. (2005). Plant sesquiterpenes induce hyphal
branching in arbuscular mycorrhizal fungi. Nature 435, 824–827.
doi:10.1038/nature03608.
Anderson, M. J. (2006). Distance-based tests for homogeneity of multivariate
dispersions. Biometrics 62, 245–253. doi:10.1111/j.1541-0420.2005.00440.x.
Anderson, M. J., Ellingsen, K. E., and McArdle, B. H. (2006). Multivariate dispersion as
a measure of beta diversity. Ecol. Lett. 9, 683–693. doi:10.1111/j.1461-
0248.2006.00926.x.
Andrews, S. C., Robinson, A. K., and Rodriguez-Quinones, F. (2003). Bacterial iron
homeostasis. FEMS Microbiol. Rev. 27, 215–237. doi:10.1016/S0168-
6445(03)00055-X.
Arndt, D., Grant, J. R., Marcu, A., Sajed, T., Pon, A., Liang, Y., et al. (2016). PHASTER:
a better, faster version of the PHAST phage search tool. Nucleic Acids Res. 44,
W16–W21.
Attramadal, K. J. K., Truong, T. M. H., Bakke, I., Skjermo, J., Olsen, Y., and Vadstein,
O. (2014). RAS and microbial maturation as tools for K-selection of microbial
communities improve survival in cod larvae. Aquaculture 432, 483–490.
doi:10.1016/j.aquaculture.2014.05.052.
Auffret, M., Yergeau, É., Pilote, A., Proulx, É., Proulx, D., Greer, C. W., et al. (2013).
Impact of water quality on the bacterial populations and off-flavours in recirculating
aquaculture systems. FEMS Microbiol. Ecol. 84, 235–47. doi:10.1111/1574-
119
6941.12053.
Badiola, M., Mendiola, D., and Bostock, J. (2012). Recirculating Aquaculture Systems
(RAS) analysis: Main issues on management and future challenges. Aquac. Eng. 51,
26–35. doi:10.1016/j.aquaeng.2012.07.004.
Bagchi, S., Vlaeminck, S. E., Sauder, L. A., Mosquera, M., Neufeld, J. D., and Boon, N.
(2014). Temporal and spatial stability of ammonia-oxidizing archaea and bacteria in
aquarium biofilters. PLoS One 9, e113515. doi:10.1371/journal.pone.0113515.
Barange, M., Merino, G., Blanchard, J. L., Scholtens, J., Harle, J., Allison, E. H., et al.
(2014). Impacts of climate change on marine ecosystem production in societies
dependent on fisheries. Nat. Clim. Chang. 4, 211–216. Available at:
http://dx.doi.org/10.1038/nclimate2119.
Barazani, O., and Baldwin, I. T. (2013). “A Mixed Bag: The Plant Growth-Promoting
Sebacina vermifera Impairs Defense Mechanisms Against Herbivores Oz,” in
Piriformospora indica, 251–261. doi:10.1007/978-3-642-33802-1.
Barbosa, G. L., Almeida Gadelha, F. D., Kublik, N., Proctor, A., Reichelm, L.,
Weissinger, E., et al. (2015). Comparison of land, water, and energy requirements of
lettuce grown using hydroponic vs. Conventional agricultural methods. Int. J.
Environ. Res. Public Health 12, 6879–6891. doi:10.3390/ijerph120606879.
Bartelme, R. P., McLellan, S. L., and Newton, R. J. (2017). Freshwater Recirculating
Aquaculture System Operations Drive Biofilter Bacterial Community Shifts Around
a Stable Nitrifying Consortium of Ammonia-oxidizing Archaea and Comammox
Nitrospira. Front. Microbiol. 8, 101. doi:10.3389/FMICB.2017.00101.
Bartelme, R. P., Oyserman, B. O., Blom, J. E., Sepulveda-villet, O. J., Newton, R. J., and
Newton, R. J. (2018). Stripping Away the Soil : Plant Growth Promoting
Microbiology Opportunities in Aquaponics. Front. Microbiol. 9, 1–7.
doi:10.3389/fmicb.2018.00008.
Barton, L. L., Johnson, G. V, and Schito, K. (1996). Siderophore-Mediated Iron
Metabolism in Growth and Nitrogen Fixation by Alfalfa Nodulated with Rhizobium
meliloti. J. Plant Nutr. 19, 1201–1210.
Beijerinck, M. (1888). Die Bacterien der Papilionaceenknoellchen. Bot. Zeitung 46, 725–
804.
Bernardet, J., Segers, P., Eyt, M. V., and Berthe, F. (1996). Cutting a Gordian Knot :
120
Emended Classification and Description of the Genus Flavobacterium , Emended
Description of the Family Flavobacteriaceae , and Proposal of Flavobacterium
hydatis. 128–148.
Biernbaum, J., Chapman, D., Lam, T., Lamendella, A., Sideman, E., and Welsch, S.
(2016). National Organic Standards Board (NOSB) Hydroponic and Aquaponic
Task Force Report. Washington, D.C. Available at:
https://www.ams.usda.gov/sites/default/files/media/2016 Hydroponic Task Force
Report.PDF.
Bittsanszky, A., Uzinger, N., Gyulai, G., Mathis, A., Junge, R., Villarroel, M., et al.
(2016). Nutrient supply of plants in aquaponic systems. Ecocycles 2, 17–20.
doi:10.19040/ecocycles.v2i2.57.
Blancheton, J. P., Attramadal, K. J. K., Michaud, L., d’Orbcastel, E. R., and Vadstein, O.
(2013). Insight into bacterial population in aquaculture systems and its implication.
Aquac. Eng. 53, 30–39. doi:10.1016/j.aquaeng.2012.11.009.
Blidariu, F., and Grozea, A. (2011). Increasing the economical efficiency and
sustainability of indoor fish farming by means of aquaponics. Anim. Sci. Biotechnol.
44, 1–8.
Boiteau, R., Hawco, N., Mende, D., McIlvin, M., Sedwick, P. N., Saito, M. A., et al.
(2016). Siderophore-based adaptations to iron scarcity across major biomes of the
eastern Pacific. Proc. Natl. Acad. Sci., In Press. doi:10.1073/pnas.1608594113.
Bollmann, A., Sedlacek, C. J., Norton, J., Laanbroek, H. J., Suwa, Y., Stein, L. Y., et al.
(2013). Complete genome sequence of Nitrosomonas sp. Is79, an ammonia
oxidizing bacterium adapted to low ammonium concentrations. Stand. Genomic Sci.
7, 469–482. doi:10.4056/sigs.3517166.
Brear, E. M., Day, D. A., and Smith, P. M. C. (2013). Iron: an essential micronutrient for
the legume-rhizobium symbiosis. Front. Plant Sci. 4, 359.
doi:10.3389/fpls.2013.00359.
Brown, M. N., Briones, A., Diana, J., and Raskin, L. (2013). Ammonia-oxidizing archaea
and nitrite-oxidizing nitrospiras in the biofilter of a shrimp recirculating aquaculture
system. FEMS Microbiol. Ecol. 83, 17–25. doi:10.1111/j.1574-6941.2012.01448.x.
Camejo, P. Y., Domingo, J. S., McMahon, K. D., and Noguera, D. R. (2017). Genome-
Enabled Insights into the Ecophysiology of the Comammox Bacterium “Candidatus

121
Nitrospira nitrosa.” mSystems 2, 1–16.
Campbell, J. H., O’Donoghue, P., Campbell, A. G., Schwientek, P., Sczyrba, A., Woyke,
T., et al. (2013). UGA is an additional glycine codon in uncultured SR1 bacteria
from the human microbiota. Proc. Natl. Acad. Sci. 110, 5540–5545.
doi:10.1073/pnas.1303090110.
Carini, P., Marsden, P. J., Leff, J. W., Morgan, E. E., Strickland, M. S., and Fierer, N.
(2016). Relic DNA is abundant in soil and obscures estimates of soil microbial
diversity. Nat. Microbiol. 2, 16242. Available at:
http://dx.doi.org/10.1038/nmicrobiol.2016.242.
Cerozi, B. da S., and Fitzsimmons, K. (2016). Use of Bacillus spp. to enhance
phosphorus availability and serve as a plant growth promoter in aquaponics systems.
Sci. Hortic. (Amsterdam). 211, 277–282. doi:10.1016/j.scienta.2016.09.005.
Chagnot, C., Zorgani, M. a, Astruc, T., and Desvaux, M. (2013). Proteinaceous
determinants of surface colonization in bacteria: bacterial adhesion and biofilm
formation from a protein secretion perspective. Front. Microbiol. 4, 303.
doi:10.3389/fmicb.2013.00303.
Chain, P., Lamerdin, J., Larimer, F., Regala, W., Lao, V., Land, M., et al. (2003).
Complete genome sequence of the ammonia-oxidizing bacterium and obligate
chemolithoautotroph Nitrosomonas europaea. J. Bacteriol. 185, 2759–73.
doi:10.1128/JB.185.9.2759-2773.2003.
Chen, S., Ling, J., and Blancheton, J.-P. (2006a). Nitrification kinetics of biofilm as
affected by water quality factors. Aquac. Eng. 34, 179–197.
doi:10.1016/j.aquaeng.2005.09.004.
Chen, S., Ling, J., and Blancheton, J. P. (2006b). Nitrification kinetics of biofilm as
affected by water quality factors. Aquac. Eng. 34, 179–197.
doi:10.1016/j.aquaeng.2005.09.004.
Chin, C.-S., Alexander, D. H., Marks, P., Klammer, A. A., Drake, J., Heiner, C., et al.
(2013). Nonhybrid, finished microbial genome assemblies from long-read SMRT
sequencing data. Nat. Methods 10, 563–569. doi:10.1038/nmeth.2474.
Coleman-Derr, D., and Tringe, S. G. (2014). Building the crops of tomorrow: Advantages
of symbiont-based approaches to improving abiotic stress tolerance. Front.
Microbiol. 5, 1–6. doi:10.3389/fmicb.2014.00283.
122
Costa, E., Pérez, J., and Kreft, J. U. (2006). Why is metabolic labour divided in
nitrification? Trends Microbiol. 14, 213–219. doi:10.1016/j.tim.2006.03.006.
Cottrell, M. T., and Kirchman, D. L. (2000). Natural assemblages of marine
proteobacteria adn members of the Cytophaga-Flavobacter clustler consuming low-
and high- molecular-weight dissolved organic matter. Appl. Environ. Microbiol. 66,
1692–1697. doi:10.1128/AEM.66.4.1692-1697.2000.Updated.
Daims, H., Lebedeva, E. V, Pjevac, P., Han, P., Herbold, C., Albertsen, M., et al. (2015).
Complete nitrification by Nitrospira bacteria. Nature 528, 504–509.
doi:10.1038/nature16461.
Daims, H., Lücker, S., and Wagner, M. (2016). A New Perspective on Microbes
Formerly Known as Nitrite-Oxidizing Bacteria. Trends Microbiol. In Press, 1–14.
doi:10.1016/j.tim.2016.05.004.
Danaher, J. J., Shultz, R. C., Rakocy, J. E., and Bailey, D. S. (2013). Alternative Solids
Removal for Warm Water Recirculating Raft Aquaponic Systems. J. World Aquac.
Soc. 44, 374–383. doi:10.1111/jwas.12040.
Darwish, A. M., and Ismaiel, A. a (2005). Genetic diversity of Flavobacterium columnare
examined by restriction fragment length polymorphism and sequencing of the 16S
ribosomal RNA gene and the 16S-23S rDNA spacer. Mol. Cell. Probes 19, 267–74.
doi:10.1016/j.mcp.2005.04.003.
Davidson, J., Good, C., Williams, C., and Summerfelt, S. T. (2017). Evaluating the
chronic effects of nitrate on the health and performance of post-smolt Atlantic
salmon Salmo salar in freshwater recirculation aquaculture systems. Aquac. Eng. 79,
1–8. doi:10.1016/J.AQUAENG.2017.08.003.
Declercq, A. M., Haesebrouck, F., Van den Broeck, W., Bossier, P., and Decostere, A.
(2013). Columnaris disease in fish: a review with emphasis on bacterium-host
interactions. Vet. Res. 44, 27. doi:10.1186/1297-9716-44-27.
Decostere, a, Haesebrouck, F., and Devriese, L. a (1997). Shieh medium supplemented
with tobramycin for selective isolation of Flavobacterium columnare (Flexibacter
columnaris) from diseased fish. J. Clin. Microbiol. 35, 322–4. Available at:
http://www.pubmedcentral.nih.gov/articlerender.fcgi?artid=229570&tool=pmcentre
z&rendertype=abstract.
Dehler, C. E., Secombes, C. J., and Martin, S. A. M. (2016). Environmental and

123
physiological factors shape the gut microbiota of Atlantic salmon parr (Salmo salar
L.). Aquaculture 467, 149–157. doi:10.1016/j.aquaculture.2016.07.017.
Delong, D. P., and Losordo, T. M. (2012). How to Start a Biofilter. South. Reg. Aquac.
Cent. 3.
Dessaux, Y., Grandclément, C., and Faure, D. (2016). Engineering the Rhizosphere.
Trends Plant Sci. 21, 266–278. doi:10.1016/j.tplants.2016.01.002.
DeVries, F., and Wallenstein, M. D. (2017). Belowground connections underlying
aboveground food production: a framework for optimising ecological connections in
the rhizosphere. J. Ecol., 913–920. doi:10.1111/1365-2745.12783.
Diana, J. S., Egna, H. S., Chopin, T., Peterson, M. S., Cao, L., Pomeroy, R., et al. (2013).
Responsible Aquaculture in 2050: Valuing Local Conditions and Human
Innovations Will Be Key to Success. Bioscience 63, 255–262.
doi:10.1525/bio.2013.63.4.5.
Dias, T., Dukes, A., and Antunes, P. M. (2014). Accounting for soil biotic effects on soil
health and crop productivity in the design of crop rotations. J. Sci. Food Agric. 95,
447–454. doi:10.1002/jsfa.6565.
van Dijk, J. P., Lagerwerf, A. J., van Eijk, H. G., and Leijnse, B. (1975). Iron metabolism
in the tench (Tinca tinca L.). J. Comp. Physiol. 99, 321–330.
doi:10.1007/BF00710372.
Durborow, R. M., Thune, R. L., Hawke, J. P., and Camus, A. C. (1998). Columnaris
Disease A Bacterial Infection Caused by Flavobacterium columnare. South. Reg.
Aquac. Cent., 2–5.
Eaton, R. W. (2012). Dehydration of the off-flavor chemical 2-methylisoborneol by the
R-limonene-degrading bacteria Pseudomonas sp. strain 19-rlim and Sphingomonas
sp. strain BIR2-rlima. Biodegradation 23, 253–261. doi:10.1007/s10532-011-9504-
y.
Ebeling, J. M., Timmons, M. B., and Bisogni, J. J. (2006). Engineering analysis of the
stoichiometry of photoautotrophic, autotrophic, and heterotrophic removal of
ammonia–nitrogen in aquaculture systems. Aquaculture 257, 346–358.
doi:10.1016/j.aquaculture.2006.03.019.
Edgar, R. C. (2004). MUSCLE: multiple sequence alignment with high accuracy and
high throughput. Nucleic Acids Res. 32, 1792–7. doi:10.1093/nar/gkh340.

124
Eiler, A., and Bertilsson, S. (2007). Flavobacteria Blooms in Four Eutrophic Lakes:
Linking Population Dynamics of Freshwater Bacterioplankton to Resource
Availability. Appl. Environ. Microbiol. 73, 3511–3518. doi:10.1128/AEM.02534-
06.
Engle, C. R. (2015). Economics of Aquaponics. South. Reg. Aquac. Cent. 5006, 1–4.
Eren, A. M., Esen, O. C., Quince, C., Vineis, J. H., Morrison, H. G., Sogin, M. L., et al.
(2015a). Anvi’o: an advanced analysis and visualization platform for ‘omics data.
PeerJ, 1–29. doi:10.7717/peerj.1319.
Eren, A. M., Morrison, H. G., Lescault, P. J., Reveillaud, J., Vineis, J. H., and Sogin, M.
L. (2015b). Minimum entropy decomposition: Unsupervised oligotyping for
sensitive partitioning of high-throughput marker gene sequences. ISME J. 9, 968–
979. doi:10.1038/ismej.2014.195.
Eren, A. M., Vineis, J. H., Morrison, H. G., and Sogin, M. L. (2013). A filtering method
to generate high quality short reads using illumina paired-end technology. PLoS One
8, e66643. doi:10.1371/journal.pone.0066643.
Ettwig, K. F., Zhu, B., Speth, D., Keltjens, J. T., Jetten, M. S. M., and Kartal, B. (2016).
Archaea catalyze iron-dependent anaerobic oxidation of methane. Proc. Natl. Acad.
Sci. 113, 12792–12796. doi:10.1073/pnas.1609534113.
Evenhuis, J. P., LaPatra, S. E., and Graf, J. (2017). Draft Genome Sequence of the Fish
Pathogen Flavobacterium columnare Strain CSF-298-10. Genome Announc. 5.
doi:10.1128/genomeA.00173-17.
Evenhuis, J. P., Mohammed, H., Lapatra, S. E., Welch, T. J., and Arias, C. R. (2016).
Virulence and molecular variation of Flavobacterium columnare affecting rainbow
trout in Idaho , USA. Aquaculture 464, 106–110.
doi:10.1016/j.aquaculture.2016.06.017.
FAO (2014). The state of world fisheries and aquaculture. doi:92-5-105177-1.
Fisher, J. C., Newton, R. J., Dila, D. K., and McLellan, S. L. (2015). Urban microbial
ecology of a freshwater estuary of Lake Michigan. Elem. Sci. Anthr. 3, 000064.
doi:10.12952/journal.elementa.000064.
Fowler, S. J., Palomo, A., Dechesne, A., Mines, P. D., and Smets, B. F. (2018).
Comammox Nitrospira are abundant ammonia oxidizers in diverse groundwater-fed
rapid sand filter communities. Environ. Microbiol. 20, 1002–1015.

125
doi:10.1111/1462-2920.14033.
Fox, B. K., Tamaru, C. S., Hollyer, J., Castro, L. F., Fonseca, J. M., Jay-russell, M., et al.
(2012). A Preliminary Study of Microbial Water Quality Related to Food Safety in
Recirculating Aquaponic Fish and Vegetable Production Systems.
Fujitani, H., Ushiki, N., Tsuneda, S., and Aoi, Y. (2014). Isolation of sublineage I
Nitrospira by a novel cultivation strategy. Environ. Microbiol. 16, 3030–3040.
doi:10.1111/1462-2920.12248.
Fukami, T., Dickie, I. A., Paula Wilkie, J., Paulus, B. C., Park, D., Roberts, A., et al.
(2010). Assembly history dictates ecosystem functioning: Evidence from wood
decomposer communities. Ecol. Lett. 13, 675–684. doi:10.1111/j.1461-
0248.2010.01465.x.
Genello, L., Fry, J. P., Frederick, J. A., Li, X., and Love, D. C. (2015). Fish in the
Classroom : A Survey of the Use of Aquaponics in Education. Eur. J. Heal. Biol.
Educ. 4, 9–20. doi:10.12973/ejhbe.2015.213p.
Glass, J. B. (2015). Microbes that Meddle with Metals. Microbe Mag. 10, 197–202.
doi:10.1128/microbe.10.197.1.
Glass, J. B., Kretz, C. B., Ganesh, S., Ranjan, P., Seston, S. L., Buck, K. N., et al. (2015).
Meta-omic signatures of microbial metal and nitrogen cycling in marine oxygen
minimum zones. Front. Microbiol. 6, 1–13. doi:10.3389/fmicb.2015.00998.
Glass, J. B., and Orphan, V. J. (2012). Trace metal requirements for microbial enzymes
involved in the production and consumption of methane and nitrous oxide. Front.
Microbiol. 3, 1–20. doi:10.3389/fmicb.2012.00061.
Goddek, S., Espinal, C., Delaide, B., Jijakli, M., Schmautz, Z., Wuertz, S., et al. (2016).
Navigating towards Decoupled Aquaponic Systems: A System Dynamics Design
Approach. Water 8, 303. doi:10.3390/w8070303.
Gonçalves, A. A., and Gagnon, G. a. (2011). Ozone Application in Recirculating
Aquaculture System: An Overview. Ozone Sci. Eng. 33, 345–367.
doi:10.1080/01919512.2011.604595.
Good, C., Davidson, J., Iwanowicz, L., Meyer, M., Dietze, J., Kolpin, D. W., et al.
(2017). Investigating the influence of nitrate nitrogen on post-smolt Atlantic salmon
Salmo salar reproductive physiology in freshwater recirculation aquaculture
systems. Aquac. Eng. 78, 2–8. doi:10.1016/J.AQUAENG.2016.09.003.

126
Goodman, E. R. (2011). Aquaponics: Community and economic development.
Goris, J., Konstantinidis, K. T., Klappenbach, J. a, Coenye, T., Vandamme, P., and
Tiedje, J. M. (2007). DNA-DNA hybridization values and their relationship to
whole-genome sequence similarities. Int. J. Syst. Evol. Microbiol. 57, 81–91.
doi:10.1099/ijs.0.64483-0.
Govindasamy, V., Senthilkumar, M., Magheshwaran, V., Kumar, U., Bose, P., Sarma, V.,
et al. (2011). Plant Growth and Health Promoting Bacteria. 18th ed. , ed. D.
Maheshwari Berlin Heidelberg: Springer doi:10.1007/978-3-642-13612-2.
Gravel, V., Martinez, C., Antoun, H., and Tweddell, R. J. (2006). Control of greenhouse
tomato root rot [Pythium ultimum] in hydroponic systems, using plant-growth-
promoting microorganisms. Can. J. Plant Pathol. 28, 475–483.
doi:10.1080/07060660609507322.
Hacquard, S., Garrido-Oter, R., Gonzalez, A., Spaepen, S., Ackermann, G., Lebeis, S., et
al. (2015). Review Microbiota and Host Nutrition across Plant and Animal
Kingdoms. Cell Host Microbe 17, 603–616. doi:10.1016/j.chom.2015.04.009.
Harrell, Jr., F. E., and Dupont, C. (2015). Hmisc: Harrell Miscellaneous.
Hart, E. R., Webb, J. B., Hollingsworth, C., and Danylchuk, A. J. (2014). Managing
Expectations for Aquaponics in the Classroom: Enhancing Academic Learning and
Teaching an Appreciation for Aquatic Resources. Fisheries 39, 525–530.
doi:10.1080/03632415.2014.966353.
Hatzenpichler, R. (2012). Diversity, physiology, and niche differentiation of ammonia-
oxidizing archaea. Appl. Environ. Microbiol. 78, 7501–10.
doi:10.1128/AEM.01960-12.
Hoefel, D., Ho, L., Aunkofer, W., Monis, P. T., Keegan, A., Newcombe, G., et al. (2006).
Cooperative biodegradation of geosmin by a consortium comprising three gram-
negative bacteria isolated from the biofilm of a sand filter column. Lett. Appl.
Microbiol. 43, 417–423. doi:10.1111/j.1472-765X.2006.01974.x.
Höflich, G., Wiehe, W., and Hecht-Buchholz, C. (1995). Rhizosphere colonization of
different crops with growth promoting Pseudomonas and Rhizobium bacteria.
Microbiol. Res. 150, 139–147. doi:10.1016/S0944-5013(11)80048-0.
Houle, S., Schrader, K. K., Le Franccois, N. R., Comeau, Y., Kharoune, M., Summerfelt,
S. T., et al. (2011). Geosmin causes off-flavour in arctic charr in recirculating
127
aquaculture systems. Aquac. Res. 42, 360–365. doi:10.1111/j.1365-
2109.2010.02630.x.
Hovanec, T. A., and DeLong, E. F. (1996). Comparative analysis of nitrifying bacteria
associated with freshwater and marine aquaria. Appl. Environ. Microbiol. 62, 2888–
2896. Available at:
http://aem.asm.org/content/62/8/2888.abstract%5Cnhttp://www.pubmedcentral.nih.g
ov/articlerender.fcgi?artid=168074&tool=pmcentrez&rendertype=abstract.
Hu, Z., Lee, J. W., Chandran, K., Kim, S., Brotto, A. C., and Khanal, S. K. (2015). Effect
of plant species on nitrogen recovery in aquaponics. Bioresour. Technol. 188, 92–
98. doi:10.1016/j.biortech.2015.01.013.
Huber, I., Spanggaard, B., Appel, K. F., Rossen, L., Nielsen, T., and Gram, L. (2004).
Phylogenetic analysis and in situ identification of the intestinal microbial
community of rainbow trout (Oncorhynchus mykiss, Walbaum). J. Appl. Microbiol.
96, 117–132. doi:10.1046/j.1365-2672.2003.02109.x.
Hupeden, J., Wegen, S., Off, S., Lucker, S., Bedarf, Y., Daims, H., et al. (2016). Relative
abundance of Nitrotoga spp. in a biofilter of a cold-freshwater aquaculture plant
appears to be stimulated by slightly acidic pH. Appl. Environ. Microbiol. 82, 1838–
1845. doi:10.1128/AEM.03163-15.
Huse, S. M., Dethlefsen, L., Huber, J. A., Welch, D. M., Relman, D. A., and Sogin, M. L.
(2008). Exploring microbial diversity and taxonomy using SSU rRNA hypervariable
tag sequencing. PLoS Genet. 4, e1000255. doi:10.1371/journal.pgen.1000255.
Huse, S. M., Mark Welch, D. B., Voorhis, A., Shipunova, A., Morrison, H. G., Eren, a
M., et al. (2014a). VAMPS: a website for visualization and analysis of microbial
population structures. BMC Bioinformatics 15, 41. doi:10.1186/1471-2105-15-41.
Huse, S. M., Young, V. B., Morrison, H. G., Antonopoulos, D. A., Kwon, J., Dalal, S., et
al. (2014b). Comparison of brush and biopsy sampling methods of the ileal pouch
for assessment of mucosa-associated microbiota of human subjects. Microbiome 2,
1–5. doi:10.1186/2049-2618-2-5.
Imai, T. (2015). SPRAI: Single Pass Read Accuracy Improver. Available at:
http://zombie.cb.k.u-tokyo.ac.jp/sprai/index.html.
Ji, S. H., Gururani, M. A., and Chun, S. (2014). Isolation and characterization of plant
growth promoting endophytic diazotrophic bacteria from Korean rice cultivars ଝ .
128
Microbiol. Res. 169, 83–98. doi:10.1016/j.micres.2013.06.003.
Jiang, L., and Patel, S. N. (2008). Community assembly in the presence of disturbance: A
microcosm experiment. Ecology 89, 1931–1940. doi:10.1890/07-1263.1.
Johnston, J. J., Shrivastava, A., and McBride, M. J. (2018). Untangling Flavobacterium
johnsoniae Gliding Motility and Protein Secretion. J. Bacteriol. 200.
doi:10.1128/JB.00362-17.
Kayansamruaj, P., Dong, H. T., Hirono, I., Kondo, H., Senapin, S., and Rodkhum, C.
(2017). Comparative genome analysis of fish pathogen Flavobacterium columnare
reveals extensive sequence diversity within the species. Infect. Genet. Evol. 54, 7–
17. doi:10.1016/J.MEEGID.2017.06.012.
van Kessel, M. a. H. J., Harhangi, H. R., van de Pas-Schoonen, K., van de Vossenberg, J.,
Flik, G., Jetten, M. S. M., et al. (2010). Biodiversity of N-cycle bacteria in nitrogen
removing moving bed biofilters for freshwater recirculating aquaculture systems.
Aquaculture 306, 177–184. doi:10.1016/j.aquaculture.2010.05.019.
van Kessel, M. A. H. J., Mesman, R. J., Arshad, A., Metz, J. R., Tom Spanings, F. A.,
van Dalen, S. C. M., et al. (2016). Branchial nitrogen cycle symbionts can remove
ammonia in fish gills. Environ. Microbiol. Rep. In Press. doi:10.1111/1758-
2229.12407.
van Kessel, M. A. H. J., Speth, D. R., Albertsen, M., Nielsen, P. H., Op den Camp, H. J.
M., Kartal, B., et al. (2015). Complete nitrification by a single microorganism.
Nature 528, 555–559. doi:10.1038/nature16459.
Khalifa, A. Y. Z., Alsyeeh, A.-M., Almalki, M. A., and Saleh, F. A. (2016).
Characterization of the plant growth promoting bacterium , Enterobacter cloacae
MSR1 , isolated from roots of non-nodulating Medicago sativa. Saudi J. Biol. Sci.
23, 79–86. doi:10.1016/j.sjbs.2015.06.008.
Kiersztyn, B., Siuda, W., and Chróst, R. J. (2012). Persistence of bacterial proteolytic
enzymes in lake ecosystems. FEMS Microbiol. Ecol. 80, 124–34.
doi:10.1111/j.1574-6941.2011.01276.x.
Kindaichi, T., Ito, T., and Okabe, S. (2004). Ecophysiological Interaction between
Nitrifying Bacteria and Heterotrophic Bacteria in Autotrophic Nitrifying Biofilms as
Determined by Microautoradiography-Fluorescence In Situ Hybridization
Ecophysiological Interaction between Nitrifying Bacteria and He. Appl. Environ.

129
Microbiol. 70. doi:10.1128/AEM.70.3.1641.
Kits, K. D., Sedlacek, C. J., Elena, V., Han, P., Bulaev, A., Pjevac, P., et al. (2017).
Kinetic analysis of a complete nitrifier reveals an oligotrophic lifestyle. Nature 549,
269–272. doi:10.1038/nature23679.
Klas, S., Mozes, N., and Lahav, O. (2006). Development of a single-sludge
denitrification method for nitrate removal from RAS effluents: Lab-scale results vs.
model prediction. Aquaculture 259, 342–353.
doi:10.1016/J.AQUACULTURE.2006.05.049.
Klausen, C., Nicolaisen, M. H., Strobel, B. W., Warnecke, F., Nielsen, J. L., and
Jørgensen, N. O. G. (2005). Abundance of actinobacteria and production of geosmin
and 2-methylisoborneol in Danish streams and fish ponds. FEMS Microbiol. Ecol.
52, 265–278. doi:10.1016/j.femsec.2004.11.015.
Klesius, P. H., Shoemaker, C. A., and Evans, J. J. (2008). Flavobacterium columnare
chemotaxis to channel catfish mucus. FEMS Microbiol. Lett. 288, 216–220.
doi:10.1111/j.1574-6968.2008.01348.x.
Klinger, D., and Naylor, R. (2012). Searching for Solutions in Aquaculture: Charting a
Sustainable Course. Annu. Rev. Environ. Resour. 37, 247–276. doi:10.1146/annurev-
environ-021111-161531.
Kloepper, J. W., Leong, J., Teintze, M., and Schroth, M. N. (1980). Enhanced plant
growth by siderophores produced by plant growth-promoting rhizobacteria. Nature
286, 885–886. doi:10.1038/286885a0.
Klotz, M. G., and Stein, L. Y. (2008). Nitrifier genomics and evolution of the nitrogen
cycle. FEMS Microbiol. Lett. 278, 146–156. doi:10.1111/j.1574-6968.2007.00970.x.
Könneke, M., Bernhard, A. E., de la Torre, J. R., Walker, C. B., Waterbury, J. B., and
Stahl, D. a (2005). Isolation of an autotrophic ammonia-oxidizing marine archaeon.
Nature 437, 543–6. doi:10.1038/nature03911.
Koren, S., Walenz, B. P., Berlin, K., Miller, J. R., Bergman, N. H., and Phillippy, A. M.
(2017). Canu : scalable and accurate long-read assembly via adaptive k -mer
weighting and repeat separation. 722–736. doi:10.1101/gr.215087.116.Freely.
Kowalchuk, G. a, and Stephen, J. R. (2001). Ammonia-oxidizing bacteria: a model for
molecular microbial ecology. Annu. Rev. Microbiol. 55, 485–529.
doi:10.1146/annurev.micro.55.1.485.

130
Kozlowski, J. A., Kits, K. D., and Stein, L. Y. (2016a). Complete Genome Sequence of
Nitrosomonas ureae Strain Nm10, an Oligotrophic Group 6a Nitrosomonad.
Genome Announc. 4, e00094-16. doi:10.1128/GENOMEA.00094-16.
Kozlowski, J. A., Kits, K. D., and Stein, L. Y. (2016b). Genome Sequence of
Nitrosomonas communis Strain Nm2, a Mesophilic Ammonia-Oxidizing Bacterium
Isolated from Mediterranean Soil. Genome Announc. 4, e01541-15.
doi:10.1128/genomeA.01541-15.
Kreft, J. (2004). Biofilms promote altruism. Microbiology 150, 2751–2760.
doi:10.1099/mic.0.26829-0.
Krsek, M., and Wellington, E. M. H. (1999). Comparison of different methods for the
isolation and purification of total community DNA from soil. J. Microbiol. Methods
39, 1–16. doi:10.1016/S0167-7012(99)00093-7.
Krumsiek, J., Arnold, R., and Rattei, T. (2007). Gepard: A rapid and sensitive tool for
creating dotplots on genome scale. Bioinformatics 23, 1026–1028.
doi:10.1093/bioinformatics/btm039.
Kruse, M., Keuter, S., Bakker, E., Spieck, E., Eggers, T., and Lipski, A. (2013).
Relevance and diversity of Nitrospira populations in biofilters of brackish RAS.
PLoS One 8, e64737. doi:10.1371/journal.pone.0064737.
Kuhn, D. D., Drahos, D. D., Marsh, L., and Flick, G. J. (2010). Evaluation of nitrifying
bacteria product to improve nitrification efficacy in recirculating aquaculture
systems. Aquac. Eng. 43, 78–82. doi:10.1016/j.aquaeng.2010.07.001.
Kunttu, H. M. T., Valtonen, E. T., Jokinen, E. I., and Suomalainen, L.-R. (2009).
Saprophytism of a fish pathogen as a transmission strategy. Epidemics 1, 96–100.
doi:10.1016/j.epidem.2009.04.003.
Laanto, E., Bamford, J. K. H., Laakso, J., and Sundberg, L.-R. (2012). Phage-driven loss
of virulence in a fish pathogenic bacterium. PLoS One 7, e53157.
doi:10.1371/journal.pone.0053157.
LaFrentz, B. R., García, J. C., Dong, H. T., Waldbieser, G. C., Rodkhum, C., Wong, F.
S., et al. (2017). Optimized reverse primer for 16S-RFLP analysis and genomovar
assignment of Flavobacterium columnare. J. Fish Dis. 40, 1103–1108.
doi:10.1111/jfd.12583.
Lafrentz, B. R., Goodwin, A. E., and Shoemaker, C. A. (2012). “Columnaris Disease,” in

131
American Fisheries Society-Fish Health Section Blue Book, 1–15.
doi:10.1111/j.1365-2109.1975.tb00157.x.
Lafrentz, B. R., Waldbieser, G. C., Welch, T. J., and Shoemaker, C. a (2013).
Intragenomic heterogeneity in the 16S rRNA genes of Flavobacterium columnare
and standard protocol for genomovar assignment. J. Fish Dis.
doi:10.1111/jfd.12166.
Langmead, B., and Salzberg, S. L. (2012). Fast gapped-read alignment with Bowtie 2.
Nat. Methods 9, 357–360. doi:10.1038/nmeth.1923.
Larget, B. R., Kotha, S. K., Dewey, C. N., and Ané, C. (2010). BUCKy: Gene
tree/species tree reconciliation with Bayesian concordance analysis. Bioinformatics
26, 2910–2911. doi:10.1007/s00285-010-0355-7.
Lee, P. ., Lea, R. ., Dohmann, E., Prebilsky, W., Turk, P. ., Ying, H., et al. (2000).
Denitrification in aquaculture systems: an example of a fuzzy logic control problem.
Aquac. Eng. 23, 37–59. doi:10.1016/S0144-8609(00)00046-7.
Lee, S., and Lee, J. (2015). Beneficial bacteria and fungi in hydroponic systems: Types
and characteristics of hydroponic food production methods. Sci. Hortic.
(Amsterdam). 195, 206–215. doi:10.1016/j.scienta.2015.09.011.
Lehtovirta-Morley, L. E., Ross, J., Hink, L., Weber, E. B., Gubry-Rangin, C., Thion, C.,
et al. (2016). Isolation of “Candidatus Nitrosocosmicus franklandus”, a novel
ureolytic soil archaeal ammonia oxidiser with tolerance to high ammonia
concentration. FEMS Microbiol. Ecol. 95, 1–10. doi:10.1093/femsec/fiw057.
Leininger, S., Urich, T., Schloter, M., Schwark, L., Qi, J., Nicol, G. W., et al. (2006).
Archaea predominate among ammonia-oxidizing prokaryotes in soils. Nature 442,
806–9. doi:10.1038/nature04983.
Letunic, I., and Bork, P. (2011). Interactive Tree Of Life v2: online annotation and
display of phylogenetic trees made easy. Nucleic Acids Res. 39, W475-8.
doi:10.1093/nar/gkr201.
Lewis, W. M., and Morris, D. P. (1986). Toxicity of Nitrite to Fish: A Reivew. Trans.
Am. Fish. Soc. 115, 183–195.
Lewis, W. M., Yopp, J. H., Schramm, H. L. J., and Brandeburg, A. M. (1978). Use of
hydroponics to maintain quality of recirculated water in a fish culture system. Trans.
Am. Fish. Soc. 107, 92–99. doi:10.1577/1548-8659(1978)107<92.
132
Li, D., Liu, C., Luo, R., Sadakane, K., and Lam, T. (2015a). Sequence analysis
MEGAHIT : an ultra-fast single-node solution for large and complex metagenomics
assembly via succinct de Bruijn graph. Bioinformatics 31, 1674–1676.
doi:10.1093/bioinformatics/btv033.
Li, H., Handsaker, B., Wysoker, A., Fennell, T., Ruan, J., Homer, N., et al. (2009). The
Sequence Alignment/Map format and SAMtools. Bioinformatics 25, 2078–2079.
doi:10.1093/bioinformatics/btp352.
Li, N., Qin, T., Zhang, X. L., Huang, B., Liu, Z. X., Xie, H. X., et al. (2015b). Gene
deletion strategy to examine the involvement of the two chondroitin lyases in
Flavobacterium columnare virulence. Appl. Environ. Microbiol. 81, 7394–7402.
doi:10.1128/AEM.01586-15.
Li, N., Zhu, Y., LaFrentz, B. R., Evenhuis, J. P., Hunnicutt, D. W., Conrad, R. A., et al.
(2017). The Type IX Secretion System Is Required for Virulence of the Fish
Pathogen Flavobacterium columnare. Appl. Environ. Microbiol. 83.
doi:10.1128/AEM.01769-17.
Liao, Y.-C., Lin, S.-H., and Lin, H.-H. (2015). Completing bacterial genome assemblies:
strategy and performance comparisons. Sci. Rep. 5, 8747. doi:10.1038/srep08747.
Loper, J. E., and Buyer, J. S. (1991). Siderophore in Microbial Interaction on Plant
Surface. Mol. plant- Microbe Interact. 4, 5–13. doi:10.1094/MPMI-4-005.
Loper, J. E., Hassan, K. A., Mavrodi, D. V., Davis, E. W., Lim, C. K., Shaffer, B. T., et
al. (2012). Comparative genomics of plant-associated pseudomonas spp.: Insights
into diversity and inheritance of traits involved in multitrophic interactions. PLoS
Genet. 8. doi:10.1371/journal.pgen.1002784.
Loper, J. E., and Henkels, M. D. (1997). Availability of iron to Pseudomonas fluorescens
in rhizosphere and bulk soil evaluated with an ice nucleation reporter gene. Appl.
Environ. Microbiol. 63, 99–105.
Loper, J. E., and Henkels, M. D. (1999). Utilization of heterologous siderophores
enhances levels of iron available to Pseudomonas putida in the rhizosphere. Appl.
Environ. Microbiol. 65, 5357–5363.
Love, D. C., Fry, J. P., Li, X., Hill, E. S., Genello, L., Semmens, K., et al. (2015a).
Commercial aquaponics production and profitability: Findings from an international
survey. Aquaculture 435, 67–74. doi:10.1016/j.aquaculture.2014.09.023.
133
Love, D. C., Uhl, M. S., and Genello, L. (2015b). Energy and water use of a small-scale
raft aquaponics system in Baltimore, Maryland, United States. Aquac. Eng. 68, 19–
27. doi:10.1016/j.aquaeng.2015.07.003.
Lücker, S., Wagner, M., Maixner, F., Pelletier, E., Koch, H., Vacherie, B., et al. (2010).
A Nitrospira metagenome illuminates the physiology and evolution of globally
important nitrite-oxidizing bacteria. Proc. Natl. Acad. Sci. U. S. A. 107, 13479–84.
doi:10.1073/pnas.1003860107.
Ludwig, W., Strunk, O., Westram, R., Richter, L., Meier, H., Yadhukumar, et al. (2004).
ARB: a software environment for sequence data. Nucleic Acids Res. 32, 1363–1371.
doi:10.1093/nar/gkh293.
Luesken, F. A., Van Alen, T. A., Van Der Biezen, E., Frijters, C., Toonen, G., Kampman,
C., et al. (2011). Diversity and enrichment of nitrite-dependent anaerobic methane
oxidizing bacteria from wastewater sludge. Appl. Microbiol. Biotechnol. 92, 845–
854. doi:10.1007/s00253-011-3361-9.
Majeed, A., Abbasi, M. K., Hameed, S., Imran, A., and Rahim, N. (2015). Isolation and
characterization of rhizobacteria from wheat rhizosphere and their effect on plant
growth promotion. Front. Microbiol. 6, 1–10. doi:10.3389/fmicb.2015.00198.
Malusá, E., Sas-Paszt, L., and Ciesielska, J. (2012). Technologies for Beneficial
Microorganisms Inocula Used as Biofertilizers. Sci. World J. 2012, 1–12.
doi:10.1100/2012/491206.
Mann, A. J., Hahnke, R. L., Huang, S., Werner, J., Xing, P., Barbeyron, T., et al. (2013).
The genome of the alga-associated marine flavobacterium Formosa agariphila KMM
3901Treveals a broad potential for degradation of algal polysaccharides. Appl.
Environ. Microbiol. 79, 6813–6822. doi:10.1128/AEM.01937-13.
Marasco, R., Rolli, E., Ettoumi, B., Vigani, G., Mapelli, F., Borin, S., et al. (2012). A
Drought Resistance-Promoting Microbiome Is Selected by Root System under
Desert Farming. PLoS One 7. doi:10.1371/journal.pone.0048479.
Martin-Laurent, F., Philippot, L., Hallet, S., Chaussod, R., Soulas, G., and Catroux, G.
(2001). DNA Extraction from Soils : Old Bias for New Microbial Diversity Analysis
Methods DNA Extraction from Soils : Old Bias for New Microbial Diversity
Analysis Methods. Appl. Environ. Microbiol. 67, 2354–2359.
doi:10.1128/AEM.67.5.2354.

134
Martin, M. (2011). Cutadapt removes adapter sequences from high-throughput
sequencing reads. EMBnet.journal 17, 10–12. doi:10.14806/ej.17.1.200.
Martins, C. I. M., Eding, E. H., Verdegem, M. C. J., Heinsbroek, L. T. N., Schneider, O.,
Blancheton, J. P., et al. (2010). New developments in recirculating aquaculture
systems in Europe: A perspective on environmental sustainability. Aquac. Eng. 43,
83–93. doi:10.1016/j.aquaeng.2010.09.002.
McBride, M. J. (2014). “The Prokaryotes,” in The Prokaryotes, eds. E. Rosenberg, E.
DeLong, S. Lory, E. Stackebrandt, and F. Thompson (Springer Berlin Heidelberg),
643–676. doi:10.1007/0-387-30741-9.
McBride, M. J., and Nakane, D. (2015). Flavobacterium gliding motility and the type IX
secretion system. Curr. Opin. Microbiol. 28, 72–77. doi:10.1016/j.mib.2015.07.016.
McBride, M. J., and Zhu, Y. (2013). Gliding motility and por secretion system genes are
widespread among members of the phylum bacteroidetes. J. Bacteriol. 195, 270–
278. doi:10.1128/JB.01962-12.
Medina, M., Jayachandran, K., Bhat, M., and Deoraj, A. (2016). Assessing plant growth,
water quality and economic effects from application of a plant-based aquafeed in a
recirculating aquaponics system. Aquac. Int. 24, 415–427.
Mendes, R., Kruijt, M., Bruijn, I. De, Dekkers, E., van der Voort, M., Schneider, J. H.
M., et al. (2011). Deciphering the Rhizosphere Microbiome for Disease-Suppressive
Bacteria. Science (80-. ). 332, 1097–1100. doi:10.1126/science.1203980.
Meyer, J. L., Akerman, N. H., Proskurowski, G., and Huber, J. a. (2013). Microbiological
characterization of post-eruption “snowblower” vents at axial seamount, juan de
fuca ridge. Front. Microbiol. 4, 1–13. doi:10.3389/fmicb.2013.00153.
Michaud, L., Blancheton, J. P., Bruni, V., and Piedrahita, R. (2006). Effect of particulate
organic carbon on heterotrophic bacterial populations and nitrification efficiency in
biological filters. Aquac. Eng. 34, 224–233. doi:10.1016/j.aquaeng.2005.07.005.
Michaud, L., Lo Giudice, A., Interdonato, F., Triplet, S., Ying, L., and Blancheton, J. P.
(2013). C/N ratio-induced structural shift of bacterial communities inside lab-scale
aquaculture biofilters. Aquac. Eng. doi:10.1016/j.aquaeng.2013.11.002.
Mill, H. A., Wolf, B., and Jones, J. B. (1996). Plant analysis handbook II. Atens, GA,
Micro-Macro Publ. Revised. Atlanta, GA: Micro Macro Publishing.
Miller, M. A., Pfeiffer, W., and Schwartz, T. (2010). Creating the CIPRES Science
135
Gateway for inference of large phylogenetic trees. in 2010 Gateway Computing
Environments Workshop, GCE 2010 doi:10.1109/GCE.2010.5676129.
Muangkeow, B., Ikejima, K., Powtongsook, S., and Yi, Y. (2007). Effects of white
shrimp, Litopenaeus vannamei (Boone), and Nile tilapia, Oreochromis niloticus L.,
stocking density on growth, nutrient conversion rate and economic return in
integrated closed recirculation system. Aquaculture 269, 363–376.
doi:10.1016/j.aquaculture.2007.04.002.
Mueller, U. G., and Sachs, J. L. (2015). Engineering Microbiomes to Improve Plant and
Animal Health. Trends Microbiol. 23, 606–617. doi:10.1016/j.tim.2015.07.009.
Munguia-Fragozo, P., Alatorre-Jacome, O., Rico-Garcia, E., Torres-Pacheco, I., Cruz-
Hernandez, A., Ocampo-Velazquez, R. V., et al. (2015). Perspective for Aquaponic
Systems: “omic” Technologies for Microbial Community Analysis. Biomed Res. Int.
2015. doi:10.1155/2015/480386.
Mußmann, M., Brito, I., Pitcher, A., Sinninghe Damsté, J. S., Hatzenpichler, R., Richter,
A., et al. (2011). Thaumarchaeotes abundant in refinery nitrifying sludges express
amoA but are not obligate autotrophic ammonia oxidizers. Proc. Natl. Acad. Sci. U.
S. A. 108, 16771–6. doi:10.1073/pnas.1106427108.
Naegel, L. C. A. (1977). Combined production of fish and plants in recirculating water.
Aquaculture 10, 17–24. doi:10.1016/0044-8486(77)90029-1.
Neilands, J., and Leong, S. A. (1986). Siderophores In Relation to Plant Growth and
Disease. Annu. Rev. Plant Physiol. 37, 187–208.
doi:10.1146/annurev.pp.37.060186.001155.
Nelson, M. C., Morrison, H. G., Benjamino, J., Grim, S. L., and Graf, J. (2014). Analysis,
optimization and verification of Illumina-generated 16S rRNA gene amplicon
surveys. PLoS One 9, e94249. doi:10.1371/journal.pone.0094249.
Newton, R. J., McLellan, S. L., Dila, D. K., Vineis, J. H., Morrison, H. G., Murat Eren,
A., et al. (2015). Sewage reflects the microbiomes of human populations. MBio 6,
e02574-14. doi:10.1128/mBio.02574-14.
Nguyen, L.-T., Schmidt, H. A., von Haeseler, A., and Minh, B. Q. (2014). IQ-TREE: A
Fast and Effective Stochastic Algorithm for Estimating Maximum-Likelihood
Phylogenies. Mol. Biol. Evol. 32, 268–274. doi:10.1093/molbev/msu300.
Nguyen, N. T., McInturf, S. A., and Mendoza-Cózatl, D. G. (2016). Hydroponics: A

136
versatile system to study nutrient allocation and plant responses to nutrient
availability and exposure to toxic elements. J. Vis. Exp. 8, 1–9. doi:10.3791/54317.
NOAA (2013). IMPORTS AND EXPORTS OF FISHERY PRODUCTS ANNUAL
SUMMARY , 2013. Available at:
http://www.st.nmfs.noaa.gov/Assets/commercial/trade/Trade2013.pdf.
Norton, J. M., Klotz, M. G., Stein, L. Y., Arp, D. J., Bottomley, P. J., Chain, P. S. G., et
al. (2008). Complete genome sequence of Nitrosospira multiformis, an ammonia-
oxidizing bacterium from the soil environment. Appl. Environ. Microbiol. 74, 3559–
3572. doi:10.1128/AEM.02722-07.
Norton, J. M., Low, J. M., and Klotz, M. G. (1996). The gene encoding ammonia
monooxygenase subunit A exists in three nearly identical copies in Nitrosospira sp.
NpAV. FEMS Microbiol. Lett. 139, 181–188. doi:10.1016/0378-1097(96)00139-5.
Nowka, B., Daims, H., and Spieck, E. (2015). Comparative oxidation kinetics of nitrite-
oxidizing bacteria: nitrite availability as key factor for niche differentiation. Appl.
Environ. Microbiol. 81, 745–753. doi:10.1128/AEM.02734-14.
Okabe, S., Hirata, K., and Watanabe, Y. (1995). Dynamic changes in spatial microbial
distribution in mixed-population biofilms: Experimental results and model
simulation. Water Sci. Technol. 32, 67–74. doi:10.1016/0273-1223(96)00009-1.
Oksanen, J., Blanchet, F. G., Kindt, R., Legendre, P., Minchin, P. R., O’Hara, R. B., et al.
(2015). vegan: Community Ecology Package. Available at: http://cran.r-
project.org/package=vegan.
Olsen, L., Holmer, M., and Olsen, Y. (2008). Perspectives of nutrient emission from fish
aquaculture in coastal waters. doi:10.13140/RG.2.1.1273.8006.
Palomo, A., Jane Fowler, S., Gülay, A., Rasmussen, S., Sicheritz-Ponten, T., and Smets,
B. F. (2016). Metagenomic analysis of rapid gravity sand filter microbial
communities suggests novel physiology of Nitrospira spp. ISME J. 10, 2569–2581.
doi:10.1038/ismej.2016.63.
Palomo, A., Pedersen, A. G., Fowler, S. J., Dechesne, A., Sicheritz-Pontén, T., and
Smets, B. F. (2017). Comparative Genomics Sheds Light On Niche Differentiation
And The Evolutionary History Of Comammox <em>Nitrospira</em>
bioRxiv. Available at: http://biorxiv.org/content/early/2017/05/16/138586.abstract.
Panangala, V. S., Shoemaker, C. A., and Klesius, P. H. (2007). TaqMan real-time

137
polymerase chain reaction assay for rapid detection of Flavobacterium columnare.
Aquac. Res. 38, 508–517. doi:DOI 10.1111/j.1365-209.2007.01695.x.
Parks, D. H., Imelfort, M., Skennerton, C. T., Hugenholtz, P., and Tyson, G. W. (2015).
CheckM : assessing the quality of microbial genomes recovered from isolates ,
single cells , and metagenomes. Genome Researc 25, 1043–1055.
doi:10.1101/gr.186072.114.Freely.
Pérez-Jaramillo, J. E., Mendes, R., and Raaijmakers, J. M. (2016). Impact of plant
domestication on rhizosphere microbiome assembly and functions. Plant Mol. Biol.
90, 635–644. doi:10.1007/s11103-015-0337-7.
Pester, M., Maixner, F., Berry, D., Rattei, T., Koch, H., Lücker, S., et al. (2013). NxrB
encoding the beta subunit of nitrite oxidoreductase as functional and phylogenetic
marker for nitrite-oxidizing Nitrospira. Environ. Microbiol. doi:10.1111/1462-
2920.12300.
Pester, M., Rattei, T., Flechl, S., Gröngröft, A., Richter, A., Overmann, J., et al. (2012).
amoA-based consensus phylogeny of ammonia-oxidizing archaea and deep
sequencing of amoA genes from soils of four different geographic regions. Environ.
Microbiol. 14, 525–39. doi:10.1111/j.1462-2920.2011.02666.x.
Pester, M., Schleper, C., and Wagner, M. (2011). The Thaumarchaeota: an emerging
view of their phylogeny and ecophysiology. Curr. Opin. Microbiol. 14, 300–6.
doi:10.1016/j.mib.2011.04.007.
Pfeiffer, T., and Malone, R. (2006). Nitrification performance of a propeller-washed bead
clarifier supporting a fluidized sand biofilter in a recirculating warmwater fish
system. Aquac. Eng., 311–321. Available at: http://ac.els-
cdn.com/S0144860905001226/1-s2.0-S0144860905001226-
main.pdf?_tid=8bcf32b4-3f97-11e5-9a4b-
00000aab0f02&acdnat=1439235762_119eab7d845a3343ba1ef75cb0cc11fd
[Accessed August 10, 2015].
Piedrahita, R. H. (2003). Reducing the potential environmental impact of tank
aquaculture effluents through intensification and recirculation. Aquaculture 226, 35–
44. doi:10.1016/S0044-8486(03)00465-4.
Pii, Y., Mimmo, T., Tomasi, N., Terzano, R., Cesco, S., and Crecchio, C. (2015).
Microbial interactions in the rhizosphere : beneficial influences of plant growth-

138
promoting rhizobacteria on nutrient acquisition process . A review. Biol. Fertil. Soils
51, 403–415. doi:10.1007/s00374-015-0996-1.
Pinto, A. J., Marcus, D. N., Ijaz, Z., Bautista-de los Santos, Q. M., Dick, G. J., and
Raskin, L. (2015). Metagenomic Evidence for the Presence of Comammox
Nitrospira-Like Bacteria in a Drinking Water System. mSphere 1, e00054-15.
doi:10.1128/mSphere.00054-15.
Poly, F., Wertz, S., Brothier, E., and Degrange, V. (2008). First exploration of
Nitrobacter diversity in soils by a PCR cloning-sequencing approach targeting
functional gene nxrA. FEMS Microbiol. Ecol. 63, 132–140. doi:10.1111/j.1574-
6941.2007.00404.x.
Pruesse, E., Peplies, J., and Glöckner, F. O. (2012). SINA : Accurate high-throughput
multiple sequence alignment of ribosomal RNA genes. Bioinformatics 28, 1823–
1829. doi:10.1093/bioinformatics/bts252.
Pulkkinen, K., Suomalainen, L.-R., Read, A. F., Ebert, D., Rintamaki, P., and Valtonen,
E. T. (2010). Intensive fish farming and the evolution of pathogen virulence: the
case of columnaris disease in Finland. Proc. R. Soc. B Biol. Sci. 277, 593–600.
doi:10.1098/rspb.2009.1659.
R. LaFrentz, B., Garcia, J., C. Waldbieser, G., P. Evenhuis, J., Loch, T., Liles, M., et al.
(2018). Identification of Four Distinct Phylogenetic Groups in Flavobacterium
columnare With Fish Host Associations. doi:10.3389/fmicb.2018.00452.
R Core Team (2014). R: A Language and Environment for Statistical Computing.
Available at: http://www.r-project.org/.
Rabanal, H. R. (1988). History of Aquaculture. Manila, Philippines Available at:
http://www.fao.org/docrep/field/009/ag158e/AG158E00.htm.
Radzki, W., Gutierrez Mañero, F. J., Algar, E., Lucas García, J. A., García-Villaraco, A.,
and Ramos Solano, B. (2013). Bacterial siderophores efficiently provide iron to
iron-starved tomato plants in hydroponics culture. Antonie Van Leeuwenhoek 104,
321–330. doi:10.1007/s10482-013-9954-9.
Rakocy, J. E. (2012). “Chapter 14: Aquaponics — Integrating Fish and Plant Culture,” in
Aquaculture Production Systems, First Edition, 343–386.
Rakocy, J. E., Bailey, D. S., Shultz, K. A., and Cole, W. M. (1997). Evaluation of a
commercial-scale aquaponic unit for the production of tilapia and lettuce. in Tilapia

139
Aquaculture: Proceedings of the Fourth International Symposium on Tilapia in
Aquaculture, Orlando, Florida, 357–372.
Rakocy, J. E., Bailey, D. S., Shultz, R. C., and Thoman, E. S. (2004). Update on tilapia
and vegetable production in the UVI aquaponic system. New dimensions on farmed
tilapia. in Proceedings from the 6th International Symposium on Tilapia in
Aquaculture (Manila, Philippines: International Symposium on Tilapia in
Aquaculture), 1–15.
Rakocy, J. E., Masser, M. P., and Losordo, T. M. (2006). Recirculating aquaculture tank
production systems: Aquaponics- integrating fish and plant culture. South. Reg.
Aquac. Cent. 454, 1–16. doi:454.
Rakocy, J. E., Masser, M. P., and Losordo, T. M. (2012). Recirculating Aquaculture Tank
Production Systems: Aquaponics — Integrating Fish and Plant Culture. South. Reg.
Aquac. Cent. 454, 1–16.
Rambaut, A., and Drummond, A. (2007). Tracer.
Randall, D. ., and Tsui, T. K. . (2002). Ammonia toxicity in fish. Mar. Pollut. Bull. 45,
17–23. doi:10.1016/S0025-326X(02)00227-8.
Rashid, S., Charles, T. C., and Glick, B. R. (2012). Isolation and characterization of new
plant growth-promoting bacterial endophytes. Appl. Soil Ecol. 61, 217–224.
doi:10.1016/j.apsoil.2011.09.011.
Rice, M. C., Norton, J. M., Stein, L. Y., Kozlowski, J., Bollmann, A., Klotz, M. G., et al.
(2017). Complete Genome Sequence of Nitrosomonas cryotolerans ATCC 49181, a
Phylogenetically Distinct Ammonia-Oxidizing Bacterium Isolated from Arctic
Waters. Genome Announc. 5, e00011-17. doi:10.1128/genomeA.00011-17.
Rice, M. C., Norton, J. M., Valois, F., Bollmann, A., Bottomley, P. J., Klotz, M. G., et al.
(2016). Complete genome of Nitrosospira briensis C-128, an ammonia-oxidizing
bacterium from agricultural soil. Stand. Genomic Sci. 11. doi:10.1186/s40793-016-
0168-4.
Rice, P., Longden, I., and Bleasby, A. (2000). EMBOSS: The European Molecular
Biology Open Software Suite. Trends Genet. 16, 276–277.
doi:10.1016/j.cocis.2008.07.002.
van Rijn, J., Tal, Y., and Schreier, H. J. (2006). Denitrification in recirculating systems:
Theory and applications. Aquac. Eng. 34, 364–376.
140
doi:10.1016/j.aquaeng.2005.04.004.
Ronquist, F., Teslenko, M., Van Der Mark, P., Ayres, D. L., Darling, A., Höhna, S., et al.
(2012). Mrbayes 3.2: Efficient bayesian phylogenetic inference and model choice
across a large model space. Syst. Biol. 61, 539–542. doi:10.1093/sysbio/sys029.
Roosta, H. R. (2014). Comparison of the Vegetative Growth, Eco-Physiological
Characteristics and Mineral Nutrient Content of Basil Plants in Different Irrigation
Ratios of Hydroponic:Aquaponic Solutions. J. Plant Nutr. 37, 1782–1803.
doi:10.1080/01904167.2014.890220.
Rose, A. L., and Waite, T. D. (2002). Kinetic model for Fe(II) oxidation in seawater in
the absence and presence of natural organic matter. Environ. Sci. Technol. 36, 433–
444. doi:10.1021/es0109242.
Ruby, J. G., Bellare, P., and Derisi, J. L. (2013). PRICE: software for the targeted
assembly of components of (Meta) genomic sequence data. G3 (Bethesda). 3, 865–
80. doi:10.1534/g3.113.005967.
Rurangwa, E., and Verdegem, M. C. J. (2015). Microorganisms in recirculating
aquaculture systems and their management. Rev. Aquac. 7, 117–130.
doi:10.1111/raq.12057.
Sakami, T., Andoh, T., Morita, T., and Yamamoto, Y. (2012). Phylogenetic diversity of
ammonia-oxidizing archaea and bacteria in biofilters of recirculating aquaculture
systems. Mar. Genomics 7, 27–31. doi:10.1016/j.margen.2012.04.006.
Sandkvist, M. (2001). Type II Secretion and Pathogenesis MINIREVIEW Type II
Secretion and Pathogenesis. 69, 3523–3535. doi:10.1128/IAI.69.6.3523.
Sato, K., Naito, M., Yukitake, H., Hirakawa, H., Shoji, M., McBride, M. J., et al. (2010).
A protein secretion system linked to bacteroidete gliding motility and pathogenesis.
Proc. Natl. Acad. Sci. U. S. A. 107, 276–281. doi:10.1073/pnas.0912010107.
Sauder, L. A., Engel, K., Stearns, J. C., Masella, A. P., Pawliszyn, R., and Neufeld, J. D.
(2011). Aquarium nitrification revisited: Thaumarchaeota are the dominant
ammonia oxidizers in freshwater aquarium biofilters. PLoS One 6, e23281.
doi:10.1371/journal.pone.0023281.
Savka, M. A., Dessaux, Y., Gardener, B. B. M., Mondy, S., Kohler, P. R. A., de Bruijn,
F. J., et al. (2013). “Engineering the Rhizosphere : The ‘ Biased Rhizosphere ’
Concept The ‘ Biased Rhizosphere ’ Concept and Advances in the Omics Era to

141
Study Bacterial Competitiveness and Persistence in the Phytosphere,” in Molecular
Microbial Ecology of the Rhizosphere, Volume 2. First Edition., 1145–1161.
Schloss, P. D., Westcott, S. L., Ryabin, T., Hall, J. R., Hartmann, M., Hollister, E. B., et
al. (2009). Introducing mothur : Open-Source , Platform-Independent , Community-
Supported Software for Describing and Comparing Microbial Communities ᰔ . Appl.
Environ. Microbiol. 75, 7537–7541. doi:10.1128/AEM.01541-09.
Schmautz, Z., Graber, A., Jaenicke, S., Goesmann, A., Junge, R., and Smits, T. H. M.
(2017). Microbial diversity in different compartments of an aquaponics system.
Arch. Microbiol. 199, 613–620. doi:10.1007/s00203-016-1334-1.
Schmautz, Z., Loeu, F., Liebisch, F., Graber, A., Mathis, A., Bulc, T. G., et al. (2016).
Tomato Productivity and Quality in Aquaponics : Comparison of Three Hydroponic
Methods. Water 8, 1–21. doi:10.3390/w8110533.
Schmidt, V., Amaral-zettler, L., Davidson, J., Summerfelt, S., and Good, C. (2016).
Influence of Fishmeal-Free Diets on Microbial Communities in Atlantic Salmon
(Salmo salar) Recirculation Aquaculture Systems. Appl. Environ. Microbiol. 82,
4470–4481. doi:10.1128/AEM.00902-16.Editor.
Schreier, H. J., Mirzoyan, N., and Saito, K. (2010). Microbial diversity of biological
filters in recirculating aquaculture systems. Curr. Opin. Biotechnol. 21, 318–25.
doi:10.1016/j.copbio.2010.03.011.
De Schryver, P., and Vadstein, O. (2014). Ecological theory as a foundation to control
pathogenic invasion in aquaculture. ISME J. 8, 2360–2368.
doi:10.1038/ismej.2014.84.
Scott, S. J., and Bollinger, T. K. (2014). Flavobacterium columnare: an important
contributing factor to fish die-offs in southern lakes of Saskatchewan, Canada. J.
Vet. Diagnostic Investig. 26, 832–836. doi:10.1177/1040638714553591.
Sedlacek, C. J., Nielsen, S., Greis, K. D., Haffey, W. D., Revsbech, N. P., Ticak, T., et al.
(2016). The effect of bacterial community members on the proteome of the
ammonia-oxidizing bacterium Nitrosomonas sp. Is79. Appl. Environ. Microbiol.,
Online Early. doi:10.1128/AEM.01171-16.
Sheridan, C., Depuydt, P., de Ro, M., Petit, C., van Gysegem, E., Delaere, P., et al.
(2016). Microbial Community Dynamics and Response to Plant Growth-Promoting
Microorganisms in the Rhizosphere of Four Common Food Crops Cultivated in

142
Hydroponics. Microb. Ecol., 1–16. doi:10.1007/s00248-016-0855-0.
Smith, C. C., Snowberg, L. K., Gregory Caporaso, J., Knight, R., and Bolnick, D. I.
(2015). Dietary input of microbes and host genetic variation shape among-
population differences in stickleback gut microbiota. ISME J., 1–12.
doi:10.1038/ismej.2015.64.
Sneed, K., Allen, K., and Ellis, J. (1975). Fish farming and hydroponics. Aquac. Fish
Farmer 2, 18–20.
Sorokin, D. Y., Lücker, S., Vejmelkova, D., Kostrikina, N. a, Kleerebezem, R., Rijpstra,
W. I. C., et al. (2012). Nitrification expanded: discovery, physiology and genomics
of a nitrite-oxidizing bacterium from the phylum Chloroflexi. ISME J. 6, 2245–56.
doi:10.1038/ismej.2012.70.
Speece, R. E. (1983). Anaerobic biotechnology for industrial wastewater treatment.
Environ. Sci. Technol. 17, 416A–427A. doi:10.1021/es00115a725.
Speth, D. R., In’T Zandt, M. H., Guerrero-Cruz, S., Dutilh, B. E., and Jetten, M. S. M.
(2016). Genome-based microbial ecology of anammox granules in a full-scale
wastewater treatment system. Nat. Commun. 7. doi:10.1038/ncomms11172.
Spieck, E., Hartwig, C., McCormack, I., Maixner, F., Wagner, M., Lipski, A., et al.
(2006). Selective enrichment and molecular characterization of a previously
uncultured Nitrospira-like bacterium from activated sludge. Environ. Microbiol. 8,
405–15. doi:10.1111/j.1462-2920.2005.00905.x.
Stamatakis, A. (2014). RAxML version 8: A tool for phylogenetic analysis and post-
analysis of large phylogenies. Bioinformatics 30, 1312–1313.
doi:10.1093/bioinformatics/btu033.
Staroscik, A. M., Hunnicutt, D. W., Archibald, K. E., and Nelson, D. R. (2008).
Development of methods for the genetic manipulation of Flavobacterium columnare.
BMC Microbiol. 8, 115. doi:10.1186/1471-2180-8-115.
Stein, L. Y., Arp, D. J., Berube, P. M., Chain, P. S. G., Hauser, L., Jetten, M. S. M., et al.
(2007). Whole-genome analysis of the ammonia-oxidizing bacterium, Nitrosomonas
eutropha C91: Implications for niche adaptation. Environ. Microbiol. 9, 2993–3007.
doi:10.1111/j.1462-2920.2007.01409.x.
Sugita, H., Nakamura, H., and Shimada, T. (2005). Microbial communities associated
with filter materials in recirculating aquaculture systems of freshwater fish.

143
Aquaculture 243, 403–409. doi:10.1016/j.aquaculture.2004.09.028.
Suhr, K. I., Letelier-Gordo, C. O., and Lund, I. (2015). Anaerobic digestion of solid
waste in RAS: Effect of reactor type on the biochemical acidogenic potential (BAP)
and assessment of the biochemical methane potential (BMP) by a batch assay.
Aquac. Eng. 65, 65–71. doi:10.1016/j.aquaeng.2014.12.005.
Summerfelt, S. T. (2003). Ozonation and UV irradiation—an introduction and examples
of current applications. Aquac. Eng. 28, 21–36. doi:10.1016/S0144-8609(02)00069-
9.
Tango, M. S., and Gagnon, G. a. (2003). Impact of ozonation on water quality in marine
recirculation systems. Aquac. Eng. 29, 125–137. doi:10.1016/S0144-
8609(03)00061-X.
Tatusova, T., Ciufo, S., Federhen, S., Fedorov, B., McVeigh, R., O’Neill, K., et al.
(2015). Update on RefSeq microbial genomes resources. Nucleic Acids Res. 43,
D599–D605. doi:10.1093/nar/gku1062.
Tatusova, T., DiCuccio, M., Badretdin, A., Chetvernin, V., Nawrocki, E. P., Zaslavsky,
L., et al. (2016). NCBI prokaryotic genome annotation pipeline. Nucleic Acids Res.
44, 6614–6624. doi:10.1093/nar/gkw569.
Tekedar, H. C., Karsi, A., Gillaspy, A. F., Dyer, D. W., Benton, N. R., Zaitshik, J., et al.
(2012). Genome sequence of the fish pathogen Flavobacterium columnare ATCC
49512. J. Bacteriol. 194, 2763–4. doi:10.1128/JB.00281-12.
Thomas-Jinu, S., and Goodwin, A. (2004). Morphological and genetic characteristics of
Flavobacterium columnare isolates: correlations with virulence in fish. J. Fish Dis.
27, 29–35. Available at: http://www.ncbi.nlm.nih.gov/pubmed/14986937.
Timmons, M. B., and Ebeling, J. M. (2013). Recirculating Aquaculture. Third Edit.
Ithaca, NY: Ithaca Publishing Company, LLC.
Topçuoglu, B. D., Stewart, L. C., Morrison, H. G., Butterfield, D. A., Huber, J. A., and
Holden, J. F. (2016). Hydrogen limitation and syntrophic growth among natural
assemblages of thermophilic methanogens at deep-sea hydrothermal vents. Front.
Microbiol. 7. doi:10.3389/fmicb.2016.01240.
Touchon, M., Barbier, P., Bernardet, J. F., Loux, V., Vacherie, B., Barbe, V., et al.
(2011). Complete genome sequence of the fish pathogen Flavobacterium
branchiophilum. Appl. Environ. Microbiol. 77, 7656–7662.

144
doi:10.1128/AEM.05625-11.
Triyanto, and Wakabayashi, H. (1999). Genotypic Diversity of Strains of Flavobacterium
columnare from Diseased Fishes. Fish Pathol. 34, 65–71. doi:10.3147/jsfp.34.65.
Tsuchiya, C., Sakata, T., and Sugita, H. (2008). Novel ecological niche of Cetobacterium
somerae , an anaerobic bacterium in the intestinal tracts of freshwater fish. Lett.
Appl. Microbiol. 46, 43–48. doi:10.1111/j.1472-765X.2007.02258.x.
Tucker, C. S., and Hargreaves, J. A. (2008). Environmental Best Management Practices
for Aquaculture. 1st ed. , eds. C. S. Tucker and J. A. Hargreaves Ames, Iowa.
Tyson, R. V., Treadwel, D. D., and Simonne, E. H. (2011). Opportunities and challenges
to sustainability in aquaponic systems. Horttechnology 21, 1–13.
Untergasser, A., Cutcutache, I., Koressaar, T., Ye, J., Faircloth, B. C., Remm, M., et al.
(2012). Primer3-new capabilities and interfaces. Nucleic Acids Res. 40, e115.
doi:10.1093/nar/gks596.
Urakawa, H., Tajima, Y., Numata, Y., and Tsuneda, S. (2008). Low temperature
decreases the phylogenetic diversity of ammonia-oxidizing archaea and bacteria in
aquarium biofiltration systems. Appl. Environ. Microbiol. 74, 894–900.
doi:10.1128/AEM.01529-07.
Ushiki, N., Fujitani, H., Aoi, Y., and Tsuneda, S. (2013). Isolation of Nitrospira
belonging to Sublineage II from a Wastewater Treatment Plant. Microbes Environ.
28, 346–353. doi:10.1264/jsme2.ME13042.
Utkhede, R. (2006). Increased growth and yield of hydroponically grown greenhouse
tomato plants inoculated with arbuscular mycorrhizal fungi and Fusarium
oxysporum f. sp. radicis-lycopersici. BioControl 51, 393–400. doi:10.1007/s10526-
005-4243-9.
Verdegem, M. C. J., Bosma, R. H., and Verreth, J. a. J. (2006). Reducing Water Use for
Animal Production through Aquaculture. Int. J. Water Resour. Dev. 22, 101–113.
doi:10.1080/07900620500405544.
Villarroel, M., Alvariño, J. M. R., and Duran, J. M. (2011). Aquaponics: integrating fish
feeding rates and ion waste production for strawberry hydroponics. Spanish J. Agric.
Res. 9, 537–545. doi:10.5424/sjar/20110902-181-10.
Vilsack, T., and Reilly, J. T. (2013). USDA Census of Agriculture: Census of
Aquaculture. Available at:
145
http://www.agcensus.usda.gov/Publications/2012/Online_Resources/Aquaculture/aq
uacen.pdf [Accessed November 19, 2014].
Wagner, M. R., Lundberg, D. S., Coleman-Derr, D., Tringe, S. G., Dangl, J. L., and
Mitchell-Olds, T. (2014). Natural soil microbes alter flowering phenology and the
intensity of selection on flowering time in a wild Arabidopsis relative. Ecol. Lett. 17,
717–726. doi:10.1111/ele.12276.
Wahli, T., and Madsen, L. (2018). Flavobacteria , a Never Ending Threat for Fish : a
Review. Curr Clin Micro Rpt 5.
Waite, T. D. (2002). Challenges and opportunities in the use of iron in water and
wastewater treatment. Rev. Environ. Sci. Biotechnol. 1, 9–15.
doi:10.1023/A:1015131528247.
Walker, B. J., Abeel, T., Shea, T., Priest, M., Abouelliel, A., Sakthikumar, S., et al.
(2014). Pilon: An Integrated Tool for Comprehensive Microbial Variant Detection
and Genome Assembly Improvement. PLoS One 9, e112963.
Wang, Y., Ma, L., Mao, Y., Jiang, X., Xia, Y., Yu, K., et al. (2017). Comammox in
drinking water systems. Water Res. 116, 332–341.
doi:10.1016/j.watres.2017.03.042.
Warren, D. L., Geneva, A. J., and Lanfear, R. (2017). RWTY (R We There Yet): An R
Package for Examining Convergence of Bayesian Phylogenetic Analyses. Mol. Biol.
Evol. 34, 1016–1020. doi:10.1093/molbev/msw279.
Watanabe, T., Kiron, V., and Satoh, S. (1997). Trace minerals in fish nutrition.
Aquaculture 151, 185–207. doi:10.1016/S0044-8486(96)01503-7.
Wei, X., Sayavedra-Soto, L. A., and Arp, D. J. (2004). The transcription of the cbb
operon in Nitrosomonas europaea. Microbiology 150, 1869–1879.
doi:10.1099/mic.0.26785-0.
Wertz, S., Poly, F., Le Roux, X., and Degrange, V. (2008). Development and application
of a PCR-denaturing gradient gel electrophoresis tool to study the diversity of
Nitrobacter-like nxrA sequences in soil. FEMS Microbiol. Ecol. 63, 261–271.
doi:10.1111/j.1574-6941.2007.00416.x.
Wetzel, R. G. (1983). Limnology. 2nd ed. , eds. M. Brown, C. Field, M. Miller, S. Fitz-
Hugh, and R. L. Moore Orlando, FL: Saunders College Publishing.
White, P. A., Kalff, J., Rasmussen, J. B., and Gasol, J. M. (1991). The effect of

146
temperature and algal biomass on bacterial production and specific growth rate in
freshwater and marine habitats. Microb. Ecol. 21, 99–118.
doi:10.1007/BF02539147.
Wietz, M., Hall, M. R., and Høj, L. (2009). Effects of seawater ozonation on biofilm
development in aquaculture tanks. Syst. Appl. Microbiol. 32, 266–277.
doi:10.1016/j.syapm.2009.04.001.
Wilson, K. (2001). “Preparation of Genomic DNA from Bacteria,” in Current Protocols
in Molecular Biology (John Wiley & Sons, Inc.).
doi:10.1002/0471142727.mb0204s56.
Wold, P.-A., Holan, A. B., Øie, G., Attramadal, K., Bakke, I., Vadstein, O., et al. (2014).
Effects of membrane filtration on bacterial number and microbial diversity in marine
recirculating aquaculture system (RAS) for Atlantic cod (Gadus morhua L.)
production. Aquaculture 422–423, 69–77.
doi:10.1016/J.AQUACULTURE.2013.11.019.
Yoon, S.-H., Ha, S., Lim, J., Kwon, S., and Chun, J. (2017). A large-scale evaluation of
algorithms to calculate average nucleotide identity. Antonie Van Leeuwenhoek 110,
1281–1286. doi:10.1007/s10482-017-0844-4.
Yuichi, S., Norton, J. M., Bollmann, A., Klotz, M. G., Stein, L. Y., Laanbroek, H. J., et
al. (2011). Genome sequence of Nitrosomonas sp. strain AL212, an ammonia-
oxidizing bacterium sensitive to high levels of ammonia. J. Bacteriol. 193, 5047–
5048. doi:10.1128/JB.05521-11.
Zhang, J., Kobert, K., Flouri, T., and Stamatakis, A. (2014). PEAR : a fast and accurate
Illumina Paired-End reAd mergeR. Bioinformatics 30, 614–620.
doi:10.1093/bioinformatics/btt593.
Zhang Yulei, Nie Pin, L. L. (2016). Complete Genome Sequence of the Fish Pathogen
Flavobacterium columnare Pf1. Genome Announc. 4, e00900-16. doi:10.1186/1944-
3277-10-3.
Zhu, Y., Thomas, F., Larocque, R., Li, N., Duffieux, D., Cladière, L., et al. (2017).
Genetic analyses unravel the crucial role of a horizontally acquired alginate lyase for
brown algal biomass degradation by Zobellia galactanivorans. Environ. Microbiol.
00. doi:10.1111/1462-2920.13699.

147
APPENDICES
Appendix A – Complete Genome Sequence of the Fish Pathogen
Flavobacterium columnare Strain C#2
Modified from the published form in Genome Announcements (doi:
10.1128/genomeA.00624-16)
Authors: Ryan P Bartelme1, Ryan J Newton1, Yongtao Zhu2, Nan Li3, Benjamin R
LaFrentz4, Mark J McBride2
Author Affiliations:
School of Freshwater Sciences, University of Wisconsin – Milwaukee, Milwaukee, WI,
USA1; Department of Biological Sciences, University of Wisconsin – Milwaukee,
Milwaukee, WI, USA2; Institute of Hydrobiology, Chinese Academy of Sciences,
Wuhan, Hubei Province, China3; United States Department of Agriculture-Agricultural
Research Service (USDA-ARS), Aquatic Animal Health Research Unit, Auburn, AL,
USA4
Abstract:
Flavobacterium columnare is a Gram-negative bacterial pathogen that causes columnaris
disease of freshwater fish. Flavobacterium columnare strain C#2 was isolated from a
diseased warm water fish and is typed as genomovar II. The genome consists of a single
3.33 Mb circular chromosome with 2,689 predicted coding genes.

148
Genome announcement:
Flavobacterium columnare is an important pathogen of freshwater fish (Darwish and
Ismaiel, 2005; Lafrentz et al., 2013; Thomas-Jinu and Goodwin, 2004). Though F.
columnare is known to result in large die-offs among wild and farmed fish, little is
known regarding its virulence mechanisms or its ecology (McBride, 2014). Strains of F.
columnare are classified into genomovars based on restriction digestion of the 16S rRNA
gene and the 16S-23S rRNA internal transcribed spacer (Darwish and Ismaiel, 2005;
Lafrentz et al., 2013), and F. columnare strain C#2 (originally referred to as F.
columnare strain #2 (Staroscik et al., 2008; Thomas-Jinu and Goodwin, 2004)) is a
genomovar II strain. The genome sequence of a genomovar I strain was previously
reported (Tekedar et al., 2012). F. columnare strain C#2 was selected for genome
sequencing because it is a virulent genomovar II strain that is amenable to genetic
manipulations (Staroscik et al., 2008), allowing detailed study of its virulence
mechanisms.
A single colony of strain C#2 was grown in 10 mL of modified Shieh Medium
(Decostere et al., 1997) with shaking overnight at 25°C. Genomic DNA was extracted
from 10 mL of the culture using the Qiagen DNeasy Blood and Tissue Kit (Qiagen,
Hilden, Germany). 20 kb PacBio RSII libraries were constructed using size selection
performed with AmPure beads in accordance with Pacific Biosciences library preparation
protocol. Two PacBio SMRTcells were mag bead loaded with 0.01 and 0.015 nM
concentrations of prepared library with Pacific Biosciences Sequencing Reagent 4.0, C4
sequencing chemistry, and P6 v2 polymerase. Sequencing produced 66,158 reads with an
149
N50 read length of 44,216 and mean read length of 20,496 representing a 296.7x
coverage of the genome. Genome assembly was carried out using the PacBio PBcR
HGAP 2.3.0 pipeline with default settings (Chin et al., 2013). The HGAP Pipeline has
been shown to provide accurate microbial genome assemblies from PacBio sequence data
(Liao et al., 2015). The assembly produced two contigs one containing 3,330,796 bases
and the other of 8 Kb. The 8 kb contig was eliminated from the assembly because
confidence scoring in the SMRT Portal assembly analysis was below the suggested
quality cut-off value (mapQV<10). Comparison for genome synteny (Gepard (Krumsiek
et al., 2007)) of the F. columnare strain C#2 genome to another genomovar II strain, 94-
081 (CP013992) revealed three large syntenic regions split by a single chromosomal
inversion and rearrangement. Similar chromosomal changes have been observed in other
members of the genus Flavobacterium (Touchon et al., 2011). The polished assembly
was trimmed using the check_circularity.pl script from SPRAI (Imai, 2015), and the
resulting single circular contig was annotated using the Prokaryotic Genome Annotation
Pipeline through NCBI (Tatusova et al., 2015).
The C#2 genome has a GC content of 30.97%, 13 rRNA operons, 93 tRNAs, 2 CRIPSR
arrays, and 93.4% of ORFs correspond to predicted coding genes. The genome was
analyzed for secretion systems and potential secreted virulence factors (Chagnot et al.,
2013; Sandkvist, 2001). F. columnare strain C#2 contains the core genes of the
Bacteroidetes-specific type IX secretion system, including gldK, gldL, gldM, gldN, sprA,
sprE, sprT, porU, and porV (Abby et al., 2015). This secretion system may deliver
virulence factors across the outer membrane. Genes encoding potential secreted virulence
factors such as chondroitinases, proteases, and adhesins were also identified. The ability

150
of cells to move over surfaces by gliding motility may also be important in the disease
process (Klesius et al., 2008). F. columnare strain C#2 exhibits gliding motility and the
annotated genome contains all of the genes known to be required for this process
(McBride and Zhu, 2013). The availability of complete genome sequence data and the
ability to genetically manipulate F. columnare strain C#2 will enable experiments to
reveal the critical virulence factors of this fish pathogen. These data also should facilitate
further work toward construction of avirulent vaccine strains to prevent outbreaks of
columnaris disease in aquaculture settings.
Nucleotide accession numbers. Flavobacterium columnare strain C#2 has been deposited
in GenBank with the accession number CP015107. This paper describes the first version
of the genome deposited.
Acknowledgments
We thank the Great Lakes Genomics Center (School of Freshwater Sciences, University
of Wisconsin – Milwaukee) for their assistance in library preparation, sequencing, and
use of the PacBio SMRT Portal. We thank Andrew Goodwin, Swapna Thomas-Jinu,
Andrew Staroscik, and David Hunnicutt for advice regarding nomenclature for strain
C#2. We thank Sandra L. McLellan for her contributions optimizing gDNA extraction
and acquiring some of the funding provided for this work.
Funding Information

151
The contributions of M. J. McBride were funded in part by Wisconsin Sea Grant
519K805, and contributions by R. J. Newton were funded through the State of
Wisconsin, grant .
Appendix B – Draft Genome Sequence of the Fish Pathogen Flavobacterium
columnare Strain MS-FC-4
Modified from the published form in Genome Announcements (doi:
10.1128/genomeA.00429-18)
Ryan P. Bartelme1, Paul Barbier2, Ryan S. Lipscomb3, Scott E. Lapatra4, Ryan J. Newton,
Jason P. Evenhuis3*, Mark J. McBride2*
1 School of Freshwater Sciences, University of Wisconsin-Milwaukee, Milwaukee, WI,
United States
2 Department of Biological Sciences, University of Wisconsin-Milwaukee, Milwaukee,
Wisconsin, USA
3 U.S. Department of Agriculture, National Center for Cool and Cold Water Aquaculture,
Agriculture Research Service, Kearneysville, West Virginia, USA
4 Clear Springs Foods Inc., Buhl, Idaho, USA
* Address correspondence to: [email protected] or [email protected]
R.P.B. and P.B. contributed equally to this work.
152
Flavobacterium columnare MS-FC-4 is a highly virulent genetic group 1 (formerly
genomovar I) strain isolated from rainbow trout (Oncorhynchus mykiss). The draft
genome consists of three contigs totaling 3,449,277 base pairs with 2,811 predicted open
reading frames. F. columnare MS-FC-4 is a model strain for functional genomic
analyses.
Flavobacterium columnare (Bernardet et al., 1996) is the etiologic agent of
columnaris disease which affects cultured, wild, and ornamental fish. This pathogen is
one of the most common species affecting farmed freshwater fish and causes major
economic losses worldwide (Declercq et al., 2013; Wahli and Madsen, 2018). F.
columnare isolates are genetically diverse and were classified historically into multiple
genomovars (LaFrentz et al., 2017; Triyanto and Wakabayashi, 1999). Recently, the
genomovars were described as four distinct genetic groups. Almost all isolates recovered
from salmonids belong to genetic group 1 corresponding to the previous genomovar 1
(LaFrentz et al., 2018). F. columnare MS-FC-4 is a highly virulent strain that was
isolated in 2013 from the head kidney of a diseased rainbow trout (Oncorhynchus mykiss)
in Idaho, USA (Evenhuis et al., 2016). Strain MS-FC-4 has proven to be easily
genetically manipulated. This manipulation capability, coupled with the available
genome sequence, make it attractive for functional genomic studies of virulence.
F. columnare MS-FC-4 was cultured for 24 hours in tryptone yeast extract salt
broth medium at 30°C and 150 rpm. Genomic DNA (gDNA) was isolated using a
CTAB/phenol-chloroform/isoamyl alcohol protocol (Wilson, 2001) optimized for F.
columnare.
For long read sequencing a gDNA library was prepared according to the standard
Pacific Biosciences RSII large insert library protocol. Two flow cells (C4 Chemistry)
were each loaded with 0.06 nM of a >10 kb BluePippin (Sage Science, Beverly, MA,
USA) size selected SMRTbell gDNA library. One μg of MS-FC-4 gDNA was also
sequenced on an Illumina HiSeq 2000 platform with 100 bp paired end reads. PacBio
reads were assembled using Canu version 1.6 with options set as: genome size = 3.3 Mb,
corrected error rate = 0.035, and corMaxEvidenceErate = 0.15 (Koren et al., 2017).
Subread coverage of the genome was ~865x. The illumina HiSeq paired end reads were
mapped to the PacBio assembly using Bowtie2 version 2.3.4 (Langmead and Salzberg,

153
2012) with the no-unaligned parameter to discard unaligned reads. HiSeq coverage of the
contigs was ~360x. The output sam file was converted to a bam file using samtools
version 1.4 (Li et al., 2009). Using the Canu assembly and the bam file as input, Pilon
version 1.22 (Walker et al., 2014) corrected two insertions, seven deletions, and one
substitution. However, the Pilon correction did not close the gaps in the input Canu
PacBio assembly, resulting in three contigs of respectively 716,735; 23,378; and
2,709,164 bp length. The Pilon corrected MS-FC-4 genome assembly was annotated
using the NCBI Prokaryotic Genome Annotation Pipeline (PGAP) (Tatusova et al.,
2016).
The draft genome has a cumulative total size of 3,449,277 bp with 31.9% G+C
content. This makes it the largest F. columnare genome sequenced to date. PGAP
annotation showed that the F. columnare MS-FC-4 genome had 2,811 coding genes, 19
complete rRNA operons, 95 tRNAs, and two clustered regularly interspaced short
palindromic repeat (CRIPSR) arrays. Two incomplete prophage regions of 12.4 and 25.9
kbp were identified using PHASTER (Arndt et al., 2016). The two-way average
nucleotide identities (ANIs) (Goris et al., 2007) between the MS-FC-4 genome sequence
and those of strains ATCC 49512 (Tekedar et al., 2012), Pf1 (Zhang Yulei, Nie Pin,
2016), and CSF 298-10 (Evenhuis et al., 2017) were >99%, confirming the F. columnare
genetic group 1 (formerly genomovar I) classification (Evenhuis et al., 2016; LaFrentz et
al., 2018).
The MS-FC-4 genome contains the core genes of the Bacteroidetes-specific type
IX secretion system (T9SS) linked to gliding motility and virulence (Johnston et al.,
2018; Li et al., 2017; McBride and Nakane, 2015; McBride and Zhu, 2013; Sato et al.,
2010). The availability of the MS-FC-4 genome sequence should facilitate construction
of targeted gene deletions to identify critical F. columnare virulence factors.
This Whole Genome Shotgun project has been deposited at DDBJ/ENA/GenBank
under the accession PVLU00000000. The version described in this paper
is version PVLU01000000.
ACKNOWLEDGMENTS
154
This project used the UW-Milwaukee Great Lakes Genomics Center (School of
Freshwater Sciences, University of Wisconsin Milwaukee, WI, USA) Pacific Biosciences
RSII DNA sequencing and bioinformatics services. Illumina HiSeq sequencing was done
by Arizona Research Labs (Tucson, AZ, USA). This research was supported by funds
from the USDA-ARS (Project Numbers 5090-31320-004-03S and 8082-32000-006), and
by funds from the University of Wisconsin Sea Grant Institute under grants from the
National Sea Grant College Program, National Oceanic and Atmospheric Administration,
U.S. Department of Commerce, and the State of Wisconsin, federal grant
NA14OAR4170092, project R/SFA-11. RPB was supported by a Distinguished
Dissertation Fellowship from the University of Wisconsin Milwaukee Graduate School.
The funders had no role in study design, data collection and interpretation, or the decision
to submit the work for publication. The USDA is an Equal Opportunity Employer.
155
CURRICULUM VITAE
Education: PhD. Freshwater Science University of Wisconsin – Milwaukee, 2018
B.S. Microbiology, University of Wisconsin, Madison, WI, 2009
Professional Experience:
Research Assistant (2013-2018)
University of Wisconsin – Milwaukee School of Freshwater Science
Aquaponics Water Chemist (2012)
Sweet Water Organics, LLC
Research Technologist I (2010-2011)
Medical College of Wisconsin Department of Biophysics
Undergraduate Research Assistant (2008-2009)
University of Wisconsin Department of Medical Microbiology and Immunology
Student Hourly (2007-2008)
University of Wisconsin Department of Medical Microbiology and Immunology
Competencies & Interests:
• Molecular Microbiology: qPCR/PCR primer design & assay development; nucleic acid extraction; aseptic culture technique; microbial media development; recombinant DNA methods; sequence library preparation (illumina, Sanger, & nanopore); classical molecular microbiology
• Chemistry & Engineering: Spectrophotometric assays; biogeochemical fieldwork; implementing Arduino microcontrollers to automate assays and observations;

156
general construction techniques; soldering; PCB design & etching; scaling designs
• Ecology: multivariate statistical experimental design; theoretical ecological principles
• Bioinformatics and statistics: programming in R, bash, and Arduino; deterministic statistics; evolutionary biology and phylogenetics; microbiome data analysis using custom scripting; metagenomic dataset analysis; comparative genomics; data analysis pipeline development
• Personal interests: cycling, rock climbing, philosophy, astronomy
Honors, Awards, Fellowships, and Involvement:
• Early Career Workshop Moderator for Nitrogen Cycle Ecology and Evolution, International Convention on Nitrification and Related Processes 5 (2017)
• University of Wisconsin – Milwaukee Distinguished Dissertation Fellowship (2017-2018)
• University of Wisconsin – Milwaukee Chancellor’s Graduate Student Award (2016-2017)
• Early Career Workshop Moderator for Nitrogen Cycling in Built Environment, International Convention on Nitrification and Related Processes 4 (2015)
• School of Freshwater Sciences Curricular Working Group, Student Representative (2014)
• Board Member/President, Student Water Council at UWM (2013-2014) • Secretary, American Society of Microbiology Student Chapter at UWM (2013-
Present) • UW-Madison Undergraduate Microbiology Club President (2008-2009) • UW-Madison Conversational English Tutor, Greater University Tutoring Service
(2006-2007) • Eagle Scout (2005)
Publications: Bartelme RP, McLellan SL, Newton RJ. Frontiers in Microbiology. 2017. Freshwater Recirculating Aquaculture System Operations Drive Biofilter Bacterial Community Shifts Around a Stable Nitrifying Consortium of Ammonia-oxidizing Archaea and Comammox Nitrospira. doi: 10.3389/FMICB.2017.00101 Bartelme RP, Oyserman BO, Blom JE, Sepulveda-Vilet OJ, Newton RJ. Frontiers in
Microbiology. 2018. Stripping Away the Soil: Plant Growth Promoting Microbiology Opportunities in Aquaponics. doi: 10.3389/fmicb.2018.00008
157
Bartelme RP, Smith MS, Newton RJ. Abstract accepted – Special Issue Frontiers in
Microbiology. Comparing the microbial community composition within and among recirculating aquaculture/aquaponic system components and facilities. Bartelme RP, Pinto AJ, Delmont TD, Eren AM, Newton RJ, Lücker S. In Prep. Evolutionary and Pangenomic Analysis of Complete Ammonia-Oxidizing Nitrospira. Bartelme RP, Garcia AL, Binter SA, McLellan SL, Newton RJ, Smith MS. In Prep. Loss of Comammox Nitrospira after Fallow Period in Lab-Scale Fluidized Sand Recirculating Aquaculture Biofilters.
Technical Briefs:
Bartelme RP, Newton RJ, Zhu Y, Li N, Lafrentz B, McBride MJ. Genome
Announcements. 2016. Complete Genome of Virulent Flavobacterium columnare Strain C#2. doi: 10.1186/1944-3277-10-3
Bartelme RP‡, Barbier P‡, Lipscomb R, LaPatra S, Newton RJ, Evenhuis J, McBride MJ. Draft Genome Sequence of the Fish Pathogen Flavobacterium columnare Strain MS-FC-4. Genome Announcements. 2018. doi: 10.1128/genomeA.00429-18
‡Shared first authorship.
Ad-Hoc Reviewer:
Journal of Clinical Microbiology, 2017-Present
International Society for Microbial Ecology, 2018-Present
Invited Talks:
Bartelme RP. Escaping Biogeography: Consistent Nitrifying Consortia and Opportunistic Pathogen Presence in Recirculating Aquaculture System Microbiomes. Madison Microbiome Meeting. April 2018. Bartelme RP. Cultivating Ecosystems: Microbial Communities in Recirculating Aquaculture. University of Vienna, Austria. April 2018. Bartelme RP. Lessons from Graduate School, The Never Bored Game. WaTA Seminar Series. January 2018.
Bartelme RP. Scaling Ecology: Nitrifying Biofiltration from Recirculating Aquaculture Systems to Laboratory Models. Milwaukee Microbiology Society – American Society for Microbiology Chapter Meeting. December 2014.

158
Presentations:
*Bartelme RP, Smith MJ, Sepulveda-Vilet OJ, Newton RJ. System Scale and Source Water Influence Recirculating Aquaculture System Microbiomes. Great Lakes Genomic Center Retreat. March 2018. Milwaukee, WI, USA.
*Bartelme RP, Pinto AJ, Delmont TD, Eren AM, Newton RJ, Lücker S. Engineering Applications of Complete Ammonia-Oxidation: A Pangenomic and Evolutionary Context. North Central Branch Meeting, American Society for Microbiology. October 2017. De Pere, WI, USA.
*Bartelme RP, Pinto AJ, Delmont TD, Eren AM, Newton RJ, Lücker S. The Comammox Trade-Off: Loss of Metabolic Diversity for Thermodynamic Advantage. International Convention on Nitrification and Related Processes 5. July 2017. Vienna, Austria.
Bartelme RP and Newton RJ. Curious Co-occurrence: Ammonia Oxidizing Archaea, COMAMMOX Nitrospira, and Nitrosomonas spp. in a Recirculating Aquaculture Biofilter. International Society for Microbial Ecology 16th Meeting. August, 2016. Montreal, Quebec, Canada.
Bartelme RP, McLellan SL, Newton RJ. Nitrifiers in the Fluidized Sand Biofilter of A Recirculating Aquaculture System. International Convention on Nitrification and Related Processes 4. June 2015, Edmonton, Alberta, Canada.
*Bartelme RP, Garcia AL, Smith MS, Newton RJ, McLellan SL. Nitrifying Biofiltration in Recirculating Aquaculture Systems. International Fluorescence in situ Hybridization Workshop. February 2015. Department of Microbial Ecology, Vienna, Austria.
Bartelme RP, Binkowski FP, McLellan SL, Newton RJ. Community Comparison of Nitrifying Microorganisms Between Aquaculture and Aquaponic Systems. American Society for Microbiology General Meeting. May 2014. Boston, MA, USA.
*Denotes oral presentation
Teaching Experience:
• Guest Lecturer (2017) – University of Wisconsin – Milwaukee, Freshwater Science 512: Sequence Analysis.
• Guest Lecturer (2017) – University of Wisconsin – Milwaukee, Freshwater Science 564: Water Quality in Aquaculture
• Lecturer (2013-2015) - Growing Power, Inc., Milwaukee, WI: From the Ground Up Aquaponic Workshop Series
Stakeholder Involvement and Educational Outreach:
• Skype-A-Scientist: Science Communications for K-12 (2018-Present)

159
• Assistant - Science Bag: Friend or Foe? The Two Faces of Microbes. (2016) University of Wisconsin - Milwaukee, Milwaukee, WI
• Aquaculture Microbiology Consultant (2015) Will Radler - Private Goldfish Pond, Hales Corners, WI
• Preliminary Microbiology Analyst; Flavobacterium columnare Outbreak (2014) Great Lakes Aquaculture Center, University of Wisconsin-Milwaukee, Milwaukee, WI
• Pro bono Aquacultural Microbiology Consultant; Flavobacterium columnare Outbreak (2013) Bell Aquaculture, Albany, Indiana
Professional Society Memberships:
• American Society for Microbiology, Student Member (2014-Present) • Aquacultural Engineering Society, Student Member (2014-Present) • American Fisheries Society, Wisconsin Chapter, Student Member (2015-Present)
Workshop Participation:
• International Fluorescence in situ Hybridization Workshop Participant (2015) • Introduction to R Workshop with Dr. Patrick Schloss (2014) • Do-It-Yourself Microbial Genome Sequence Analysis Workshop, American Society for
Microbiology General Meeting (2013)