ctcn assistance in uganda · report / technical note january 2018 deliverable 4 (activity 1.2)...
TRANSCRIPT

Report / Technical Note
January 2018
Deliverable 4 (activity 1.2) Technology specification report
Deliverable 5 (activity 1.2) Methodology for testing and demonstration
CTCN assistance in Uganda
Adaptation to climate change through improved
information and planning tools for Lake Victoria

dtie17-en0028_technologyspecsandmethodology_final / 09-01-2018
This report has been prepared under the DHI Business Management System certified by Bureau Veritas to comply with ISO 9001 (Quality Management)
Approved by
DHI • Agern Allé 5 • • DK-2970 Hørsholm • Denmark Telephone: +45 4516 9200 • Telefax: +45 4516 9292 • [email protected] • www.dhigroup.com
CTCN assistance in Uganda
Adaptation to climate change through improved
information and planning tools for Lake Victoria
Deliverable 4 (activity 1.2) Technology specification
report
Deliverable 5 (activity 1.2) Methodology for testing
and demonstration
Prepared for UNEP
Represented by Mr. Manfredi Caltagirone
Project manager Oluf Zeilund Jessen
Quality supervisor Per Bøgelund Hansen
Prepared by Sílvia Leirião, Niels Riegels and Oluf Jessen
Project number 11820007
Approval date 9th of January 2018
Revision Final version
Classification Restricted

dtie17-en0028_technologyspecsandmethodology_final / 09-01-2018

i
CONTENTS
1 Background ................................................................................................... 1
2 Selection of case studies ............................................................................ 4
3 Technical specifications .............................................................................. 7
3.1 Introduction ................................................................................................................ 7 3.2 Data and information ................................................................................................. 9 3.2.1 Rainfall related data ................................................................................................. 11 3.2.2 Seasonal forecasts .................................................................................................. 18 3.2.3 Temperature ............................................................................................................ 19 3.2.4 Vegetation related data ........................................................................................... 21 3.2.5 Soil moisture related data ........................................................................................ 27 3.2.6 Climate change data ................................................................................................ 31 3.2.7 Water body data ...................................................................................................... 32 3.3 Reporting and bulletins ............................................................................................ 33 3.4 Model refinements and planning ............................................................................. 34 3.4.1 Water resources model used for impact assessment on Lake Victoria .................. 34 3.4.2 Planning application................................................................................................. 36 3.5 Drought assessment ................................................................................................ 38 3.6 Decision making guidelines ..................................................................................... 40
4 Methodology for testing and demonstration .......................................... 42
4.1 Objectives ................................................................................................................ 42 4.2 Validation and demonstration of technical components .......................................... 42 4.3 Work plan for Activities 2 and 3 ............................................................................... 45
5 Next steps ................................................................................................... 49
5.1 Gender mainstreaming ............................................................................................ 49
6 References .................................................................................................. 50
Appendix A – Reporting and data needs survey

ii
List of Tables Table 1 List and overview of the applicant and stakeholders in Uganda. .............................. 2 Table 2 Previous experience of projects in Uganda and the region, related to climate
change in Lake Victoria as collected in the national workshop ................................. 4 Table 3 Description of case studies for demonstration of technology and tools .................... 5 Table 4 Data and information to support the activities of water and energy sector
stakeholders. ........................................................................................................... 10 Table 5 Validation process of technical assistance components ......................................... 42 Table 6 Proposed agenda for the technical training ............................................................. 46 Table 7 Proposed agenda for the final workshop ................................................................. 47
List of Figures Figure 1 Representation of the integration of technology developed within the newly
developed web portal and the existing LVBC WRIS. ................................................ 8 Figure 2 Example of a report with tags. ................................................................................. 33 Figure 3 Template report with tags and final report with input in the form of images, chart or
text replacing the tags. ............................................................................................ 34 Figure 4 Screenshot of the MIKE HYDRO BASIN model user interface for the Lake Victoria
Basin displaying water network branches in blue and subcatchment polygons in brown over a satellite background map ................................................................... 36
Figure 5 Overall concept of and key components of the planning application. ..................... 37 Figure 6 Overall concept of and key components of the drought assessment application. .. 39

iii
Acronyms and Abbreviations ASI Agricultural Stress Index CFS Climate Forecast System CGLS Copernicus Global Land Service CORDEX Coordinated Regional Climate Downscaling Experiment CTCN Climate Technology Centre & Network DHI DHI - see more at www.dhigroup.com EAC East African Community EDI Effective Drought Index GCF Green Climate Fund IUCEA Inter-University Council for East Africa JAXA Japanese Aerospace Exploration Agency LMCS Land Monitoring Core Service LVBC Lake Victoria Basin Commission LVEMP Lake Victoria Environmental Management Project MUST Mbarara University of Science Technology MWE CCD Ministry of Water and Environment Climate Change Department MWE SSD Ministry of Water and Environment Support Services Department MWE DWRM
Ministry of Water and Environment Directorate of Water Resources Management
NAPE National Association of Professional Environmentalists NASA National Aeronautics and Space Administration NBI Nile Basin Initiative NCEP National Centers for Environmental Prediction NDE National Designated Entity NDVI Normalized Difference Vegetation Index NELSAP Nile Equatorial Lakes Subsidiary Action Program NOAA National Oceanic and Atmospheric Administration MGLSD Ministry of Gender Labour and Social Development RAN Resilient Africa Network RCP Radiative Concentration Pathway SPI Standardised Precipitation Index STEPUP STEPUP Standard Limited SVI Standardised vegetation index SWI Soil Water Index TRMM Tropical Rainfall Measuring Mission UNCST Uganda National Council for Science and Technology UNEP United Nations Environment Programme UNFCCC United Nations Framework Convention on Climate Change UNMA Uganda National Meteorology Authority VCI Vegetation Condition Index WCRP World Climate Research Programme WRIS Water Resources Information System

iv
1
Technology specification & Methodology for testing and demonstration
This document contains the proposed technology implementation and a demonstration and testing plan through selected case studies. This output constitutes the deliverable under Activity 1.2 Description of outcomes and identification of case studies of the technical assistance.
The first chapter provides background to the Climate Technology Centre and Network (CTCN) technical assistance and case studies involved. The second and third chapters describe the technical specifications and methodology for demonstration and testing. The report concludes with the next steps towards the implementation stage of the assistance with a short description of Activity 2 and the expected inputs regarding gender mainstreaming within Activity 3 that is the capacity and dissemination part of the technical assistance.
1 Background
Upon a request by the Lake Victoria Basin Commission (LVBC), the CTCN funded technical assistance on “Adaptation to climate change through improved information and planning tools for Lake Victoria” was kicked off with a national workshop that was held at the Uganda National Council for Science and Technology (UNCST) in Kampala on the 15th of June 2017. The UNCST is the National Designated Entity (NDE) for Uganda. The list of attendees is available from the previously submitted deliverable “Minutes from the national workshop”.
The objective of this technical assistance is to strengthen planning in the water resources and energy sectors in Uganda, at both long-term and seasonal timescales. The specific objectives of this technical assistance are to:
Provide access to state-of-the-art ensemble climate projections, seasonal forecasts, and satellite-based historical data through a web based interface.
Refine the existing impact model used for simulating hydrology and water use in the Lake Victoria basin in order to maximize the utility of the model for estimating climate impacts on the water and energy sectors.
Provide guidelines for using ensemble projections of climate variables and other drivers in decision-making,
Demonstrate the utility of the technologies and guidelines through applications to local case studies.
Enable decision makers and stakeholders to use the transferred knowledge, practices and technologies through dissemination and outreach activities.
The technical assistance is being implemented through three main activities forming the scope of work and key deliverables: Activity 1 – Stakeholder outreach; Activity 2 – Data access, model refinement, and development of guidelines for decision support; and Activity 3 – Dissemination and outreach.
In Activity 1.1 National workshop to introduce CTCN assistance and solicit feedback, the technical assistance was presented to stakeholders involved in decision making or planning within the water or energy sector in Uganda. The stakeholders were

2
selected by LVBC and the NDE based on their knowledge of national stakeholders of relevance for the CTCN assistance and in Activity 1.1 a national workshop to introduce CTCN assistance was organized and feedback solicited. The table below provides an overview (for more information view the minutes from the first national stakeholder workshop).
Table 1 List and overview of the applicant and stakeholders in Uganda.
Stakeholder Role to support the implementation of the CTCN assistance
Lake Victoria Basin
Commission (LVBC)
Main applicant assisting the implementer in the implementation of
the CTCN supported technology. In addition, the LVBC will support
this technical assistance in:
1. Requirements for needs assessment
2. QA and review of the proposed technologies
3. Review of the validation report
Host for the national and regional workshops
Uganda National Council
of Science and
Technology (UNCST)
The Uganda National Council for Science and Technology was
established in 1990 for the purpose of inter alia advising on and
coordinating the formulation of national policy on all fields of
science and technology, and for assisting in the promotion and
development of indigenous science and technology. The Council
cooperates closely with other organizations involved in scientific
and technological activities.
As NDE, the UNCST will assist the implementer in this technical
assistance providing guidance and reviewing the relevant
documents. UNCST will also be consulted and informed of the
progress of the technical assistance.
Ministry of water and
environment, Uganda
(MWE)
Responsibility for setting national policies and standards,
managing and regulating water resources and determining
priorities for water development and management
Climate change
department (CCD), MWE
Works with implementation of the United Nations Framework
Convention on Climate Change (UNFCCC) and its Kyoto Protocol
(KP)
Uganda National
Meteorological
Authority (UNMA)
UNMA Provides meteorological information since it collects,
processs, archives and analyses meteorological data
National Environment
Management Authority
(NEMA)
NEMA's Development objective is to create, establish and maintain
an efficient mechanism for sustainable environment and natural
resources management at the national, district and community
levels.
Ministry of Energy and
Mineral development,
Uganda
The Ministry carries out policy guidance in the development and
exploitation of the energy and mineral resources.
Ministry of Gender,
Labour and Social
Development, Uganda
(MGLSD)
Responsible for coordinating Gender Issues in Uganda
Mbarara University of
Sciences and Technology
(MUST)
Carries out water related research including impacts of climate
change

3
Within Activity 1.1 the outcomes outlined in the objectives and a selection of case studies for testing have been consolidated through discussions held with stakeholders under Deliverables 2 and 3 namely, “Report on feedback and decision problems” and “Summary of identification of potential case studies for demonstration and testing of technologies”.
The next stage of the technical assistance is Activity 2 Data access, model refinement,
and development of guidelines for decision support that refers to implementation the technological deliverables, along with the methodology for testing using a selection of case studies presented in the next chapter.
Nile Basin Initiative
(NBI)
Intergovernmental partnership of the 10 Nile Basin countries, and
the highest decision and policy-making body of NBI is the Nile
Council of Ministers (Nile-COM), comprised of Ministers in charge
of Water Affairs in each NBI Member State. It is a forum for
consultation and coordination among the Basin States for the
sustainable management and development of the shared Nile
Basin water and related resources.
Resilient Africa Network
(RAN)
Partnership of 18 African universities in 13 countries led
by Makerere University. RAN is a development lab under
the Higher Education Solutions Network (HESN) in the office of
Science and Technology (OST), USAID.
National Association of
Professional
Environmentalists (NAPE)
Organization that monitors government actions, conducts
research, provides educational materials, develops science-based
strategies, organizes affected communities, makes common cause
with other civil society organisations and international
organizations, and engages government officials at all levels.

4
2 Selection of case studies
Relevant national programmes and initiatives were identified and discussed as part of the first national workshop, these are listed in Table 2. The national programmes and initiatives were used to frame the description of the case studies, to ensure the relevance of the case studies.
Table 2 Previous experience of projects in Uganda and the region, related to climate change in Lake Victoria as collected in the national workshop
Programme or project Institution
Lake Victoria Environmental Management Project I and II (LVEMP-I and II) EAC
Water Resources Information System (WRIS) LVBC
National Water Resources Strategy for Uganda (2014) MWE
VicRes project focusing on livelihood in Lake Victoria. Historical perspective
of Climate Change (CC) / Policy implementation
IUCEA
Severe Weather Project WMO (Lake Victoria safety) MNA
UK Metoffice climate model of Lake Victoria providing 24h forecast MNA
Climate Change projections 20/50/100 years provided by MNA MNA
Project for blending of satellite data with station data MNA
Baseline and situation studies by MWE, focus on dropping water levels in
Wamala/Rwizi catchments
MWE
Catchment Management Plans for Rwizi and Katonga, have some focus on
Climate Change impact
MWE
Wetland coverage dataset for monitoring purposes MWE
Project for incorporation of Climate Change into Catchment Management
Plans
MWE
Nile Water Allocation Tool Study NBI
Incorporation of Climate Change in NBI water resources model NBI
Qualitative study of resilience of community against floods, drought and
landslides; Community survey conducted
RAN
Training on gender mainstreaming emphasized within RAN activities RAN
With approval by the LVBC and the UNCST, an evaluation of the relevance and effectiveness of the case studies has been established. The following criteria accounting for relevance to the technical assistance, accessibility to sufficient information and documentation and effective engagement of the stakeholder(s) involved have been established:
A. The outcome of the issue represented by the case study has a significant environmental or socio-economic impact on a local or regional scale.

5
B. Climate change impacts are a critical factor influencing the success or failure of the case study
C. The case study addresses existing or future investments related to the energy sector or water management within Uganda
D. Possibility to evaluate the case study using the water resources model established for impact assessment will be a great benefit
E. Is in line with national climate change priority sectors or plans
The case studies include, as per the technical assistance Response Plan, one case study focusing on a long-term planning problem (see Table 3 numbers 1 and 3), and another on a seasonal planning problem (Table 3 number 4 and 5)
Table 3 Description of case studies for demonstration of technology and tools
N Title Institution Scope
1 Management and
dissemination of climate
information
Link to: Adapting to climate
change in Lake Victoria and
WRIS
LVBC Objective: Providing and testing the use of different types of climate
information of relevance for the upcoming programme.
Output: Web based portal providing access to climate information
e.g. the latest regional climate projections and satellite based near
real time and historical climate information; integration of climate
change projections in the existing WRIS.
2 Establishment of regional
water resource assessment
model for decisions related
to the water resource or
energy sector
Link to: LVEMP
LVBC
MWE DWRM
Objective: Evaluate the existing water resource model and
recommend refinements to make the model more useful for climate
change impact assessment within the Lake Victoria Basin.
Output: Refined model that can be used in the assessment of
climate change impacts within the water resource and energy
sectors in Uganda, and potentially the region. Climate change
scenarios of interest and recommendations for future work.
3 Capacity and knowledge for
decision making in a future
climate
Link to: National training
and capacity programmes
focussing on climate
change mitigation
UNCST
Stepup Standard
Limited
MUST
RAN
MGLSD
NAPE
Objective: Embedding the data, tools and guidelines into the
existing workflows and decision processes within relevant ministries
and organisations in Uganda, collaboration with selected
stakeholders supporting that the data is used actively in Uganda.
Output: Web based portal providing access to climate data and
indicators.
4
Water resource planning at
national and regional level
related to the water
resources and energy
sector
Link to: National and
regional programmes and
studies
MWE DWRM
LVBC
NBI
Ministry of
Energy and
Mineral
Development
Objective: Evaluation of future investments related to water supply,
irrigation scheme, hydropower, reservoirs and storage. Enable
decision makers to evaluate the available water resource taking
climate change projections into account and balance the
requirements for the hydropower sector with the requirements from
other sectors
Output: Technology for utilizing the established water resource
model for evaluation of plans and investments, without the
requirement of having detailed knowledge of the specific model.
Provide guidelines for improved climate resilient decisions. Support
the existing national plans for the future energy production in
Uganda with information and availability of tools supporting the
national planning process.

6
N Title Institution Scope
5
Providing data and
interpretation of climate
change data for
management of agricultural
impacts
Link to: Existing activities or
programmes
UNMA
MWE CCD
MWE DWRM
MGLSD
Objective: Interpretation of specific data related to overview and
monitoring of the current and upcoming climate for monitoring of the
current status within the agricultural sector.
Output: Application of drought indicators to monitor of the
agricultural sector, enabling the user to identify areas where the
current management practices result in impacts on the agricultural
production.
To assist in the assessment of the case study formulation and corroborate relevance to the targeted institutions/entities, we conducted a survey to find out data and reporting needs from participants to inform further the demonstration process by collecting information that is more detailed directly from the stakeholders. The survey is currently underway and presented in Appendix A.

7
3 Technical specifications
The following subchapters present the technical specifications of the data and tools developed as part of the technical assistance and thereafter tested using the case studies presented in the previous chapter (see Table 3). The deliverables build on ongoing efforts under the Global Environment Facility (GEF) funded Flood and Drought Management Tools project (for more information on the project please visit the project homepage at http://fdmt.iwlearn.org/en). These will be developed under Activity 2.1 Implementation of technical components, and the testing will be carried out under Activity 2.2 Testing, demonstration and documentation.
The introductory subchapter introduces the platforms that will be used to provide access to the deliverables: a web portal developed under this technical assistance and the existing LVBC Water Resources Information System (WRIS). It also explains which technical components will be embedded in the web portal and which will be supplied to the WRIS.
The subchapters that follow the introduction list and present the specifications of the technical components, namely:
Data and information Reporting and bulletins Model refinements and planning Drought assessment Decision making guidelines
3.1 Introduction
To strengthen adaptation to climate change in the Lake Victoria basin in Uganda, a new web portal will be deployed making the data, information, tools and guidelines produced freely accessible online to all national stakeholders. The free web portal will be maintained by DHI for a number of years (2 to 3) after the technical assistance is finalized. Discussion with the applicant should follow to determine the possibility of a long term plan.
Between 2012 and 2015, the LVBC commissioned the development and implementation of a comprehensive Water Resources Information System (WRIS), which enables the monitoring of the environmental conditions in the Lake Victoria Basin based on shared information provided by the East African Community (EAC) Partner States.
Therefore, in parallel with the deployment of the web portal, the existing WRIS accessible to the applicant, the LVBC, will be strengthened with the inclusion of climate change data and information developed under this technical assistance.
Through the web portal, operational data will be delivered to tackle multiple thematic areas and decision making problems faced by the stakeholders of the water and energy sectors in Uganda. Whilst within the WRIS of the LVBC, static data consisting of climate change projections will be included to complement its current functionality (see Figure 1). The combined roles of the web portal and the WRIS provide a cohesive and complementing means to strengthening adaptation to climate change, by benefiting the stakeholders in Uganda and the LVBC.

8
Figure 1 Representation of the integration of technology developed within the newly developed web portal and the existing LVBC WRIS.
The web portal titled Adaptation to Climate Change Lake Victoria, Uganda, constitutes the platform provided by the technical assistance used to deliver embedded applications, namely:
Data and information – application providing free access to near real time data and information of relevance for the CTCN assistance
Reporting – application to support dissemination of reports or bulletins to stakeholders
Planning – supporting basin planning through evaluation of existing and new investments, climate change and population pressure
Drought assessment – supporting the identification of areas with drought hazard and evaluating the impact on vulnerable sectors or areas
Decision making guidelines –supporting the decision process taking the uncertainty associated with climate change into consideration
The look and feel of the web portal we will deploy will be intuitive, user friendly and previous projects have been very well received according to our own experience within the Chao Phraya river basin in Thailand and the Volta river basin in Ghana.1 Our focus is on adequate customization of the design, and together with the LVBC and UNCST, we will decide on the detailed aspects such as logos, title, homepage introductory and explanatory texts and reporting templates. Timely input from stakeholders will determine the depth of customization reached by assistance-end.
The backend of the web portal contains the programs developed for each tool and the following data processing workflow:
1. Data download
a) Data is downloaded from the source server
1 DHI has been implementing a GEF funded project between 2014 and 2018, for the technical development of a web-based Decision Support System (DSS) and the methodologies and tool based on well-tested and proven technology developed by DHI. The overall objective of the web based DSS is to facilitate the inclusion of information about floods, droughts and future scenarios water resources planning.
Rainfall
Seasonal forecasts
Temperature
Vegetation
Soil moisture
Climate change
Reporting
Planning (including
water resources model)
Drought assessment
Decision-making
guidelines
Climate change
projections
Seasonal forecasts
DATA TOOLS
DATA

9
b) Data is downloaded using an empty string as start and end date c) Entire data series is downloaded the first time d) Only new data is downloaded during the operational use
2. Data processing
a) Downloaded data is converted to netcdf2 format b) Data is saved in a time varying netcdf file c) Downloaded data is cropped to the user extent
3. Data statistics
a) Statistic files for the data set are calculated b) Statistic files are updated every time the data is updated
4. Calculation of indices and indicators
a) Indices and indicators calculated based on the updated data and the calculated statistics following their defined equations.
In turn, the Water Resources Information System (WRIS) is a platform that was designed and developed in close collaboration with the LVBC Secretariat and the technical water experts from each Partner State through workshops and training/testing sessions. It was developed under the auspices of the Lake Victoria Environmental Management Project II (LVEMP II), World Bank funded project (LVBC, 2014). It carries its own technology, backend functionality and technical specifications, and is today operational at the Secretariat. The climate change projections are static datasets developed under this technical assistance and will be loaded onto the WRIS, and a more detailed description of the data is included in the next chapter 3.2. A procedure to upload and keep seasonal forecasts updated will be outlined for use by the LVBC staff. It is envisioned, the LVBC staff managing the system follow this process particularly closely to ensure successful integration of the data in the system.
3.2 Data and information
In this subchapter, we list and describe the operational data and information to be embedded in the web portal as well as the static data to be loaded in the WRIS.
In the web portal, a data and information application will ensure that any user will always have a basic data set available for monitoring and for planning activities related to water resources or drought management. The purpose is to provide spatially distributed data for the Lake Victoria Basin area, in near real time, such as climate data, seasonal forecasts and a variety of indicators.
During the national workshop and subsequent analysis of the outcomes, we identified relevant types of data and information, which drove the selection of datasets relevant to the stakeholders, see summary in Table 4.
2 NetCDF (Network Common Data Form) is a set of software libraries and self-describing, machine-independent data formats that support the creation, access, and sharing of array-oriented scientific data. For more check https://en.wikipedia.org/wiki/NetCDF

10
Table 4 Data and information to support the activities of water and energy sector stakeholders.
Activities Dataset
Long term planning Climate change projections
Short term water resources management
Near real time based on satellite or a combination of satellite and ground stations Rainfall deviation (30 days) Land surface temperature Ensemble forecast with several months lead time. Standardised Precipitation index (SPI)
Management of agricultural climate change impacts
Soil Water Index (SWI) SWI deviation SWI percentile SWI percentile change
Land degradation monitoring Normalized Difference Vegetation Index (NDVI) NDVI anomaly NDVI deviation Vegetation condition index (VCI) Standardised vegetation index (SVI)
Wetland monitoring Water body data set SWI can be used to monitor the state of wetland NDVI can be used to monitor vegetation changes related to the state of wetlands
Energy production and planning Climatology Ensemble forecast with several months lead time Climate change data
We will obtain the original datasets from a number of different data sources, all available in near real time and free. We will then process the data to generate different climate variables; climate forecast data, climate change data, drought related indices and flood related data, having in common the following:
Spatially distributed data (raster data visible on a map) Temporal resolution maintained in near real time (data is updated regularly) Short time delay (data is published with a maximum delay of 5 days) Available for download in commonly used formats (netcdf file)
The following sections contain a description of each of the datasets including origin, spatial and temporal resolution.

11
3.2.1 Rainfall related data
The Tropical Rainfall Measuring Mission (TRMM) is the first Earth Science mission dedicated to studying tropical and subtropical rainfall. It is a joint mission between the National Aeronautics and Space Administration (NASA) and Japanese Aerospace Exploration Agency (JAXA) dedicated to monitor rainfall in the tropics through microwave and visible infrared sensors, including the first space-borne rain radar. By use of a low-altitude orbit (350km), TRMM is complemented with state-of-the-art instruments providing high accurate measurements.
TRMM is especially useful in cases where consistency in precipitation data is required over many years, such as the case for hydrological design, flood risk assessment and water resources management.
Spatial extent From 50 degrees north to 50 degrees south of the equator
Spatial and temporal resolution
Spatial resolution: 0.25 degree
Temporal resolution: resampled to daily rainfall product from 2000 to present
Reference http://trmm.gsfc.nasa.gov
Data requirements and calculation
The original 3-hourly real-time rainfall data in mm/h from NASA is resampled to a daily product in mm/day, this daily product is then downloaded from the TRMM data provider and disseminated via the portal. Negative values are removed during the processing.
Update Frequency
Daily
Related indices SPI 1-month, SPI 3-month, etc
Data source TRMM_3B42RT_Daily
Based on TRMM rainfall dataset we will generate the indicators presented in the following tables.

12
Title Rainfall deviation (30 days)
Description Deviation of accumulated rainfall from the long term mean within the last 30 days. Calculated based on the TRMM rainfall where the long term mean is based on TRMM data since 2000.
INDICATOR USAGE
Index interpretation
Used to locate areas with rainfall surplus or deficit within the last 30 days.
Spatial extent As TRMM data
Spatial and
temporal resolution
Spatial resolution: 0.25 degree
Temporal resolution: Updated daily as TRMM rainfall gets updated.
Reference Processed based on TRMM data
Example of usage
Illustrates the how the accumulated rainfall deviates from the mean accumulation within a given area. Used to locate areas with rainfall surplus or deficit across the last 30 days.
INDICATOR CALCULATION
Data requirements and calculation
Based on daily TRMM rainfall and calculated as TRMM - TRMMmean for the last 30 days
Update
Frequency Daily updated in the web portal
Related indices -
Data source Based on TRMM data

13
Title Effective Drought Index (EDI)
Description The Effective Drought Index (EDI) was developed by Byun and Wilhite (1999) as a measure that considers daily water accumulation with a weighting function for time passage. More information is available via http://om.ciheam.org/om/pdf/a95/00801330.pdf
INDICATOR USAGE
Index interpretation
Used to locate areas that are very dry to very wet as a measure of drought. The "drought range" of the EDI indicates the following:
extreme drought at EDI = -2, severe drought at -2.0 < EDI = -1.5 moderate drought at -1.5 < EDI = -1.0. Near normal conditions are indicated by -1.0 < EDI = 1.0
Spatial extent As TRMM data
Spatial and temporal
resolution
Spatial resolution: 0.25 degree
Temporal resolution: Updated daily as TRMM rainfall gets updated.
Reference Hi-Ryong Byun and Donald A. Wilhite, Objective Quantification of Drought Severity and Duration, 1999. http://journals.ametsoc.org/doi/full/10.1175/1520-0442%281999%29012%3C2747%3AOQODSA%3E2.0.CO%3B2
Example of usage
Example of the EDI coverage for Ghana:
INDICATOR CALCULATION
Data requirements and calculation
Based on daily TRMM rainfall and calculated for the last 30 days as:
EDI = Deviation(PE)/Std(PE) Where PE is :

14
Update Frequency
Daily
Related indices
-
Data source Based on TRMM data

15
Title Standardised Precipitation index (SPI)
Description The SPI is based on the probability of precipitation for any time scale. The probability of observed precipitation is then transformed into an index. It is being used in research or operational mode in more than 70 countries. More information is available via http://www.wamis.org/agm/pubs/SPI/WMO_1090_EN.pdf
INDICATOR USAGE
Index interpretation
SPI is typically categorized using the following classification:
> 2 Extremely wet 1.5 to 2 Very wet 1 to 1.5 Moderately wet -1 to 1 Near normal -1.5 to -1 Moderately dry -2 to -1.5 Severely dry < -2 Extremely dry
A drought event occurs any time the SPI is continuously negative and reaches an intensity of -1.0 or less. The event ends when the SPI becomes positive. Each drought event, therefore, has a duration defined by its beginning and end, and an intensity for each month that the event continues. The positive sum of the SPI for all the months within a drought event can be termed the drought’s “magnitude”.
Because the SPI is normalized, wetter and drier climates can be represented in the same way; thus, wet periods can also be monitored using the SPI. However, it must be stressed that the SPI is not suitable for climate change analysis because temperature is not an input parameter.
Spatial extent As TRMM data
Spatial and temporal resolution
Spatial resolution: 0.25 degree
Temporal resolution: Updated daily as TRMM rainfall gets updated.
Reference http://www.wamis.org/agm/pubs/SPI/WMO_1090_EN.pdf
Example of usage The following SPI products are available:
SPI -month: the one-month SPI provides a comparison of the precipitation over a specific one month period with the precipitation totals from the same period for all the years included in the historical record. 1-month SPI reflects relatively short-term conditions, its application can be related closely with short-term soil moisture and crop stress, especially during the growing season.
SPI 3-month: the three-month SPI provides a comparison of the precipitation over a specific 3-month period with the precipitation totals from the same 3-month period for all the years included in the historical record. A 3-month SPI reflects short- and medium-term moisture conditions and provides a seasonal estimation of precipitation.

16
SPI 6-month: the 6-month SPI compares the precipitation for that period with the same 6-month period over the historical record. The 6-month SPI indicates medium-term trends in precipitation.
INDICATOR CALCULATION
Data requirements and calculation
The original 3-hourly real-time rainfall data in mm/h from NASA is resampled to daily product in mm/day. Negative values are removed during the processing.
Update Frequency Daily
Related indices SPI 1-month, SPI 3-month, etc
Data source TRMM 3B42RT

17
Title Climatology or historical ensembles
Description Climatology or historical ensembles is a way to generate ensembles based on the historical rainfall to be used as a “prediction” of how the future rainfall will evolve. Climatology is very useful if forecasted rainfall is not available or the skill of the forecasted rainfall is poor.
INDICATOR USAGE
Index interpretation
Provides ensemble input of forecasted rainfall based on the historical observations.
Spatial extent From 50 degrees north to 50 degrees south of the equator (similar to TRMM data)
Spatial and temporal resolution
Spatial resolution: 0.25 degree
Temporal resolution: daily
Reference TRMM data
Example of usage
Ensemble members used as climate input for hydrological, water resource or crop models for evaluation of a future situation. These can also be used to produce statistical monthly envelope charts as shown below.
INDICATOR CALCULATION
Data requirements
and calculation
Based on TRMM data from 2000 until today. Climatology is yearly time series of the historical TRMM rainfall.
Update Frequency
Daily
Related indices
SPI 1-month, SPI 3-month, etc. based on forecasted rainfall
Data source TRMM data

18
3.2.2 Seasonal forecasts
The Climate Forecast System (CFS) version 2 is run by the Environmental Modeling Center at National Centers for Environmental Prediction (NCEP), National Oceanic and Atmospheric Administration (NOAA) and became operational in March 2011. It is a fully coupled model representing the interaction between the Earth's atmosphere, oceans and land. The variables available include precipitation and surface temperature. The forecast data is made available in a form of an ensemble forecast with several months lead time and provides ensemble input of forecasted rainfall.
Spatial extent
Global coverage (Longitude Range: 180W to 180E, and Latitude Range: 90S to 90N)
Spatial and
temporal resolution
Spatial resolution: 1 degree
Temporal resolution: daily
Reference http://cfs.ncep.noaa.gov/
Example of usage
Ensemble members used as climate input for hydrological, water resource or crop models for evaluation of a future situation.
Data requirements and calculation
The computation consists of construction of the 20-member ensemble forecast. The original product is resampled from 6-hourly to daily.
Update Frequency
Daily
Related
indices SPI 1-month, SPI 3-month, etc. based on forecasted rainfall
Data source NCEP CFS v2
19
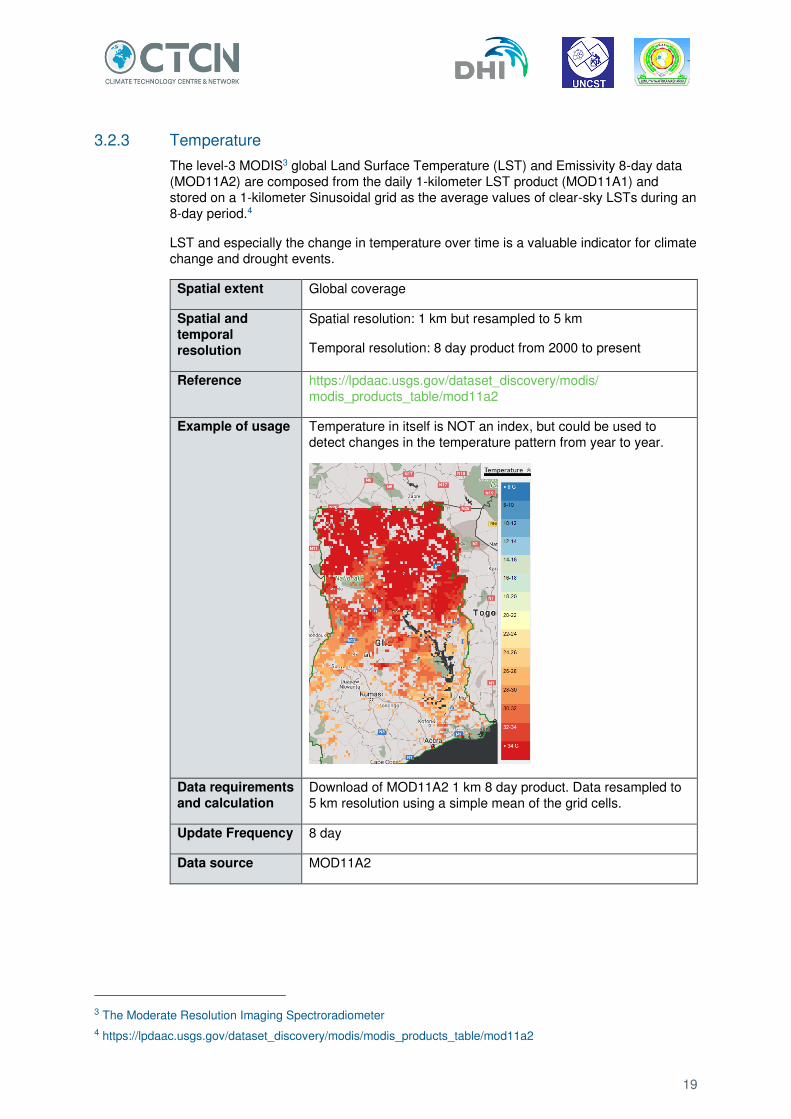
3.2.3 Temperature
The level-3 MODIS3 global Land Surface Temperature (LST) and Emissivity 8-day data (MOD11A2) are composed from the daily 1-kilometer LST product (MOD11A1) and stored on a 1-kilometer Sinusoidal grid as the average values of clear-sky LSTs during an 8-day period.4
LST and especially the change in temperature over time is a valuable indicator for climate change and drought events.
Spatial extent Global coverage
Spatial and
temporal resolution
Spatial resolution: 1 km but resampled to 5 km
Temporal resolution: 8 day product from 2000 to present
Reference https://lpdaac.usgs.gov/dataset_discovery/modis/ modis_products_table/mod11a2
Example of usage Temperature in itself is NOT an index, but could be used to detect changes in the temperature pattern from year to year.
Data requirements and calculation
Download of MOD11A2 1 km 8 day product. Data resampled to 5 km resolution using a simple mean of the grid cells.
Update Frequency 8 day
Data source MOD11A2
3 The Moderate Resolution Imaging Spectroradiometer
4 https://lpdaac.usgs.gov/dataset_discovery/modis/modis_products_table/mod11a2

20
Title Temperature condition index (TCI)
Description TCI is estimated relative to the maximum and minimum temperatures and modified to reflect different vegetation responses to temperature.
INDICATOR USAGE
Index interpretation
Used to determine stress on vegetation caused by temperatures and excessive wetness.
Spatial extent Global coverage
Spatial and
temporal
resolution
Spatial resolution: 5 km
Temporal resolution: 8 daily
Reference Daytime land surface temperature based on the 1 km MOD11C2 product.
https://lpdaac.usgs.gov/dataset_discovery/modis/modis_products_table/mod11c2
Example of usage
Example of the TCI coverage over Ghana:
INDICATOR CALCULATION
Data
requirements and calculation
TCI is calculated as:
100*(Tmax - T)/(Tmax - Tmin)
Update Frequency
8 days
Related indices
-
Data source MOD11C2

21
3.2.4 Vegetation related data
The Normalized Difference Vegetation Index (NDVI) is used as an index of vegetation health and density.
NDVI = (λNIR – λred) / (λNIR + λred)
where: λNIR and λred are the reflectance in the NIR and red bands, respectively.
MODIS vegetation indices are produced on 16-day intervals and at multiple spatial resolutions. NDVI is closely correlated to vegetation canopy greenness, a composite property of leaf area, chlorophyll and canopy structure, and could be used as a base data set for monitoring of crop and vegetation status.
It varies between -1 and +1. Strong correlation with leaf area index and biomass
NDVI in itself does not reflect drought or non-drought conditions, but could be used to detect vegetation cover.
NDVI values Vegetation condition
0.1 to 0.7 Vegetated land
> 0.5 Dense vegetation
< 0.1 Near zero vegetation such as barren area, rock, sand or snow
NDVI in itself is NOT a drought index, but could be used to detect changes in the vegetation pattern from year to year. , used as source data for a number of vegetation indices.
Spatial and temporal extent
Global coverage
Spatial and temporal resolution
Spatial resolution: from 5600 m to 250 m
Temporal resolution: Updated every 16 day based on two daily passes. The value is based on the maximum value during the 16 day period (Available from 2000 to present)
Reference http://modis-land.gsfc.nasa.gov/vi.html and http://e4ftl01.cr.usgs.gov/MOLT/
Data requirements and calculation
Converted to netcdf format
Update Frequency 16 day
Related indices Vegetation based indices
Data source Terra-MOD13C1 (5600 m)
The following tables define the indicators we will calculate based on the NDVI dataset.

22
Title NDVI deviation
Description NDVI deviation is calculated as the deviation from the long-term mean. It expresses the current vegetation growth compared to the long term mean for the same period.
INDICATOR USAGE
Index interpretation NDVI deviation could be used to define a drought as it is defined as the difference between the NDVI for the current time step and the long term mean NDVI for the same month.
DEVNDVI = NDVIi – NDVImean,m
Where: NDVIi : NDVI for the current time step and NDVImean,m : Long term mean NDVI for the same month
When DEVNDVI is negative, it indicates the below-normal vegetation condition/health and, therefore, suggests a prevailing drought situation.
The greater the negative departure the greater the magnitude of a drought.
The limitation is that the deviation from the mean does not take into account the variability in the vegetation within the region. Hence a negative DEVNDVI could be caused by a different crop type.
DEVNDVI values Condition
<= 0.2 Severe drought (extremely dry) -0.05 to -0.2 Drought (moderately dry) -0.05 to 0.1 Near normal > 0.1 Above optimal (extremely wet)
Spatial extent Global coverage
Spatial and temporal resolution
Spatial resolution: 5600 m to 250 m Temporal resolution: 16 day
Reference Processed based on the NDVI data
Example of usage Location of areas with a vegetation growth below the long term average.

23
INDICATOR CALCULATION
Data requirements and calculation
DEVNDVI = NDVIi – NDVImean,m
Where: NDVIi : NDVI for the current time step and NDVImean,m : Long term mean NDVI for the same month
Update Frequency 16 day
Related indices Vegetation based indices
Data source Based on the NDVI data
Title Vegetation condition index (VCI)
Description Vegetation condition index (VCI) shows how close the NDVI of the current month is to the minimum NDVI calculated from the long term record.
INDICATOR USAGE
Index interpretation VCI values reflects the following:
VCI values Condition
50 to 100 % Optimal or above normal conditions
35 to 50% Fair vegetation condition
0 to 35% Severe drought (local trigger values apply)
0% Extremely dry and equal to the long term minimum
Spatial extent Global coverage
Spatial and temporal resolution
Spatial resolution: 5600 m to 250 m
Temporal resolution: 16-day
Reference Kogan, F. N. F. Remote sensing of weather impacts on vegetation in non-homogeneous areas. International Journal of Remote Sensing 1990, 11, 1405–1419.
INDICATOR CALCULATION
Data requirements and calculation
VCI shows how close the NDVI of the current month is to the minimum NDVI calculated from the long term record.
� �� = � ��� − � �� �� �� �� − � �� � ∗
Where: NDVImin and NDVImax are calculated for the same month from a long term record.

24
Update Frequency 16 day
Related indices Vegetation based indices
Data source Based on the NDVI data
Title Standardised vegetation index (SVI)
Description SVI is NDVI normalized for each pixel on the basis of the maximum statistical range over the historical record.
INDICATOR USAGE
Index interpretation
SVI values Condition
0 to 0.05 Very poor conditions 0.05 to 0.25 Poor conditions 0.25 to 0.75 Average conditions 0.75 to 0.95 Good conditions 0.95 to 1 Very good conditions
Zero is the baseline condition where the NDVI is lower than all possible NDVI values for that period in other years.
Spatial extent Global coverage
Spatial and temporal resolution
Spatial resolution: 5600 m to 250 m
Temporal resolution: 16-day
Reference Processed based on the NDVI data
INDICATOR CALCULATION
Data requirements and calculation
SVI is NDVI normalized for each pixel on the basis of the maximum statistical range over the historical record.
Low SVI values indicate poor vegetation condition that could be the result of climate conditions.
The SVI is based on a z score. The z score is a deviation from the mean in units of standard deviation.
Update Frequency 16 day
Related indices Vegetation based indices
Data source Based on the NDVI data

25
Title Vegetation health index (VHI)
Description VHI is combination of vegetation condition index (VCI) and temperature condition index (TCI).
INDICATOR USAGE
Index interpretation The following classification is used for drought related vegetation stress:
< 10 Extreme drought 10 to 20 Severe drought 20 to 30 Moderate drought 30 to 40 Mild drought 40 to 100 No drought
Spatial extent Global coverage
Spatial and temporal resolution
Spatial resolution: 5600 m to 250 m
Temporal resolution: 16 day
Reference Processed based on the NDVI data
INDICATOR CALCULATION
Data requirements and calculation
Calculated as:
VHI = 0.5 * VCI + 0.5 * TCI
Update Frequency 16 day
Related indices Vegetation based indices
Data source Based on the NDVI data
26
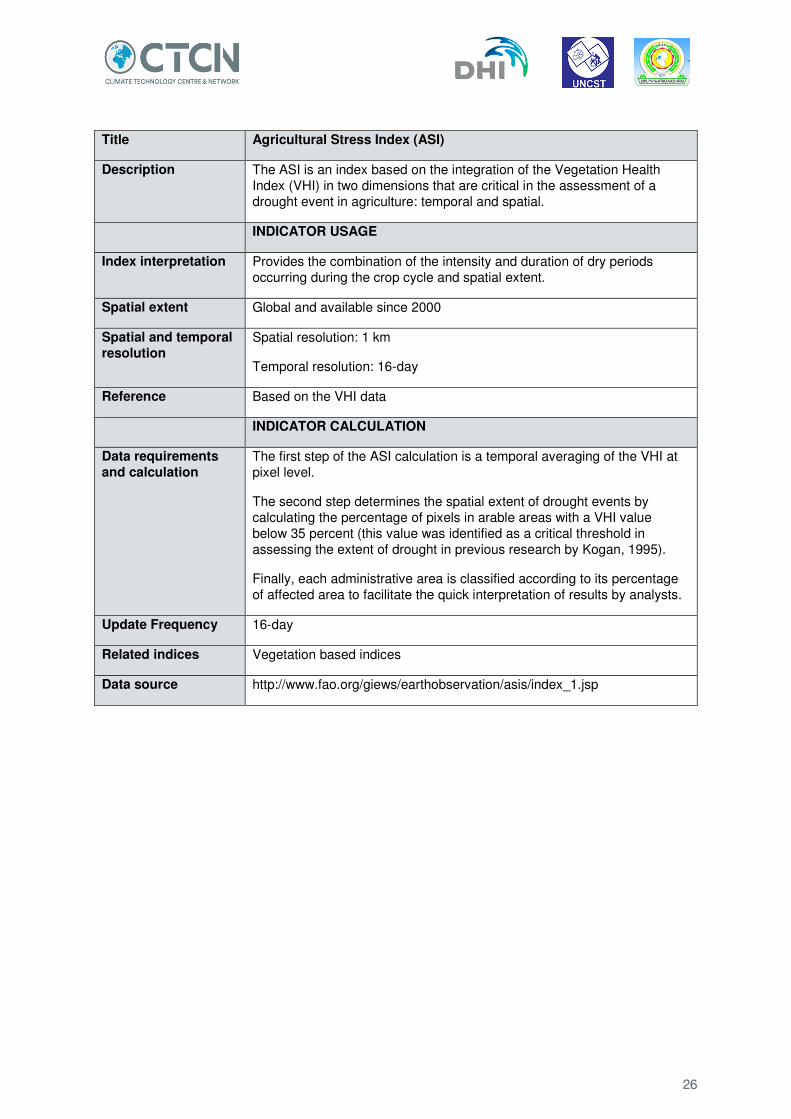
Title Agricultural Stress Index (ASI)
Description The ASI is an index based on the integration of the Vegetation Health Index (VHI) in two dimensions that are critical in the assessment of a drought event in agriculture: temporal and spatial.
INDICATOR USAGE
Index interpretation Provides the combination of the intensity and duration of dry periods occurring during the crop cycle and spatial extent.
Spatial extent Global and available since 2000
Spatial and temporal
resolution Spatial resolution: 1 km
Temporal resolution: 16-day
Reference Based on the VHI data
INDICATOR CALCULATION
Data requirements
and calculation The first step of the ASI calculation is a temporal averaging of the VHI at pixel level.
The second step determines the spatial extent of drought events by calculating the percentage of pixels in arable areas with a VHI value below 35 percent (this value was identified as a critical threshold in assessing the extent of drought in previous research by Kogan, 1995).
Finally, each administrative area is classified according to its percentage of affected area to facilitate the quick interpretation of results by analysts.
Update Frequency 16-day
Related indices Vegetation based indices
Data source http://www.fao.org/giews/earthobservation/asis/index_1.jsp

27
3.2.5 Soil moisture related data
The Soil water index (SWI) product contains daily synthesis of SWI derived from Advanced Scatterometer Surface Soil Moisture (ASCAT SSM) data at 25 km resolution (then resampled to 0.1 degree).
The SWI algorithm, originally developed at Vienna University of Technology (TU Wien) and later improved by other research groups, uses an infiltration model describing the relation between surface soil moisture and profile soil moisture as a function of time. The algorithm is based on a two-layer water balance model.
The data value used are using the largest characteristic time length giving the deepest penetration within the soil layers, and the values represent an average SWI across 0.5 to 1 meter of the topsoil.
SWI is used as an indicator for the water availability in the upper part of the root zone.
SWI in itself is NOT a drought index, but could be used to detect changes in the soil moisture pattern from year to year.
Spatial extent Global
Spatial and temporal
resolution
Spatial resolution: 0.1 degree Temporal resolution: daily
METOP-ASCAT satellite, from 2007 – present
Reference http://land.copernicus.vgt.vito.be/PDF/datapool/ and http://land.copernicus.eu/global/products/swi
Update Frequency Daily
Related indices Soil moisture based indices
The following tables define indicators based on the SWI included in the web portal.
28
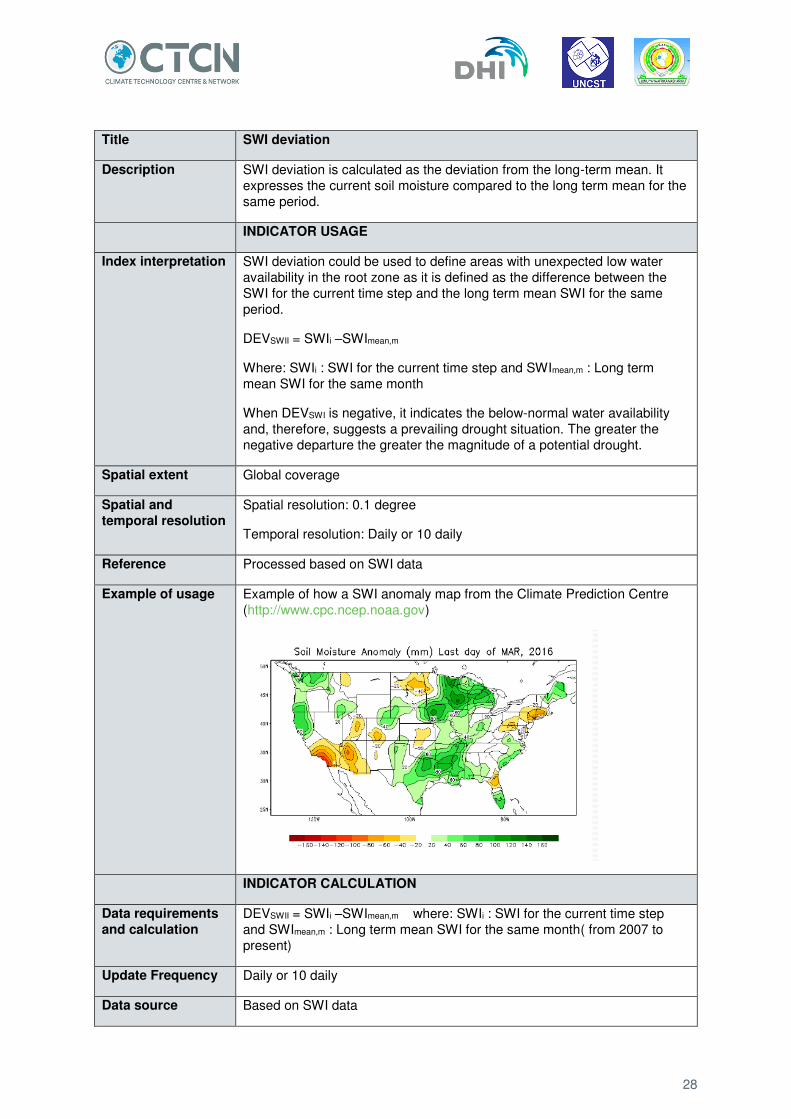
Title SWI deviation
Description SWI deviation is calculated as the deviation from the long-term mean. It expresses the current soil moisture compared to the long term mean for the same period.
INDICATOR USAGE
Index interpretation SWI deviation could be used to define areas with unexpected low water availability in the root zone as it is defined as the difference between the SWI for the current time step and the long term mean SWI for the same period.
DEVSWII = SWIi –SWImean,m
Where: SWIi : SWI for the current time step and SWImean,m : Long term mean SWI for the same month
When DEVSWI is negative, it indicates the below-normal water availability and, therefore, suggests a prevailing drought situation. The greater the negative departure the greater the magnitude of a potential drought.
Spatial extent Global coverage
Spatial and temporal resolution
Spatial resolution: 0.1 degree
Temporal resolution: Daily or 10 daily
Reference Processed based on SWI data
Example of usage Example of how a SWI anomaly map from the Climate Prediction Centre (http://www.cpc.ncep.noaa.gov)
INDICATOR CALCULATION
Data requirements
and calculation DEVSWII = SWIi –SWImean,m where: SWIi : SWI for the current time step and SWImean,m : Long term mean SWI for the same month( from 2007 to present)
Update Frequency Daily or 10 daily
Data source Based on SWI data

29
Title SWI percentile
Description SWI percentile expresses the percentage of soil moisture that is equal or below a certain amount for each year in the entire record.
INDICATOR USAGE
Index interpretation A drought or water scarcity is often defined when the soil moisture percentile drops below 30 or 20 %.
Spatial extent Global coverage
Spatial and
temporal resolution Spatial resolution: 0.1 degree
Temporal resolution: daily or 10 daily
Reference Processed based on SWI data
Example of usage Example of SWI percentile map
INDICATOR CALCULATION
Data requirements and calculation
Calculated as the percentile value for the same period as the observed data (based on data from 2007 to present).
Update Frequency Daily or 10 daily
Data source Based on SWI data
30
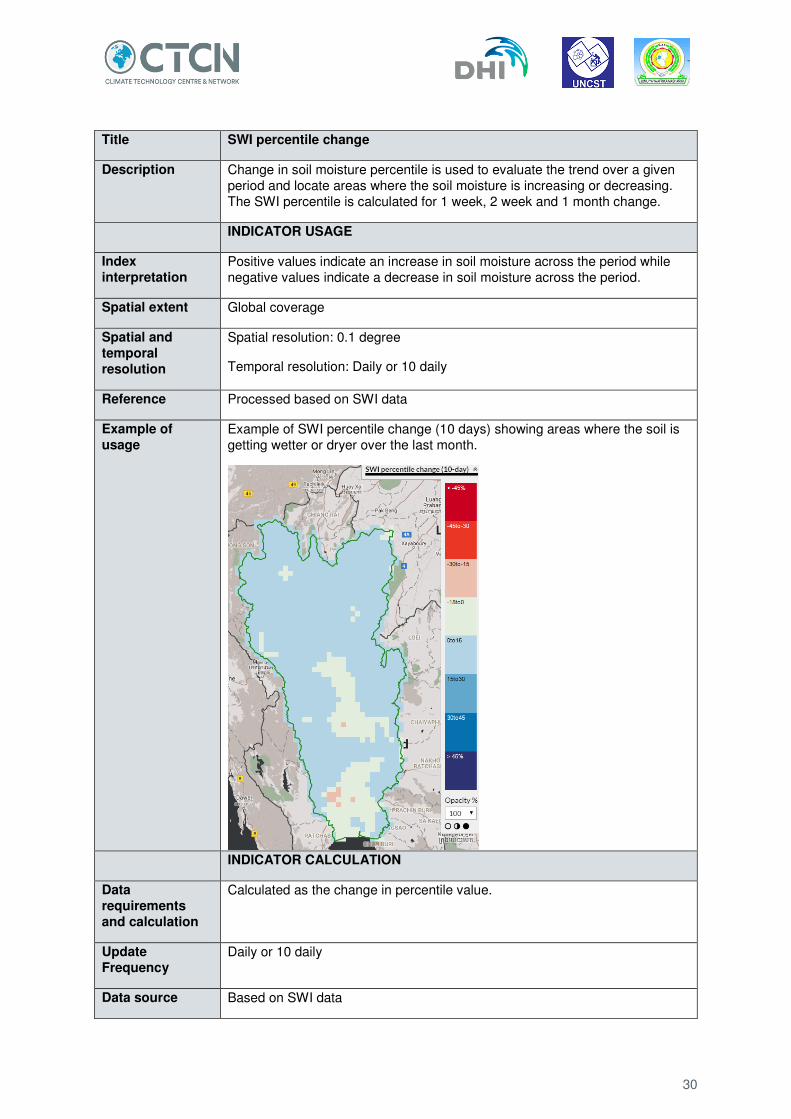
Title SWI percentile change
Description Change in soil moisture percentile is used to evaluate the trend over a given period and locate areas where the soil moisture is increasing or decreasing. The SWI percentile is calculated for 1 week, 2 week and 1 month change.
INDICATOR USAGE
Index interpretation
Positive values indicate an increase in soil moisture across the period while negative values indicate a decrease in soil moisture across the period.
Spatial extent Global coverage
Spatial and
temporal resolution
Spatial resolution: 0.1 degree
Temporal resolution: Daily or 10 daily
Reference Processed based on SWI data
Example of usage
Example of SWI percentile change (10 days) showing areas where the soil is getting wetter or dryer over the last month.
INDICATOR CALCULATION
Data
requirements and calculation
Calculated as the change in percentile value.
Update Frequency
Daily or 10 daily
Data source Based on SWI data
31
3.2.6 Climate change data
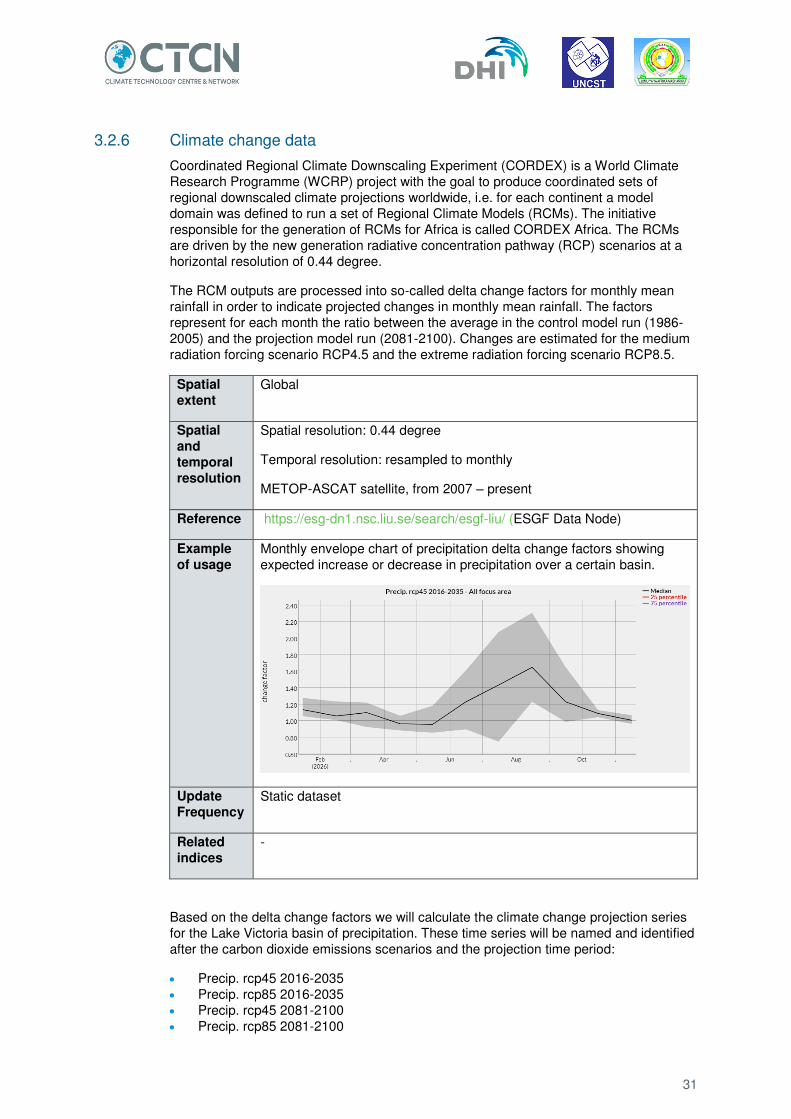
Coordinated Regional Climate Downscaling Experiment (CORDEX) is a World Climate Research Programme (WCRP) project with the goal to produce coordinated sets of regional downscaled climate projections worldwide, i.e. for each continent a model domain was defined to run a set of Regional Climate Models (RCMs). The initiative responsible for the generation of RCMs for Africa is called CORDEX Africa. The RCMs are driven by the new generation radiative concentration pathway (RCP) scenarios at a horizontal resolution of 0.44 degree.
The RCM outputs are processed into so-called delta change factors for monthly mean rainfall in order to indicate projected changes in monthly mean rainfall. The factors represent for each month the ratio between the average in the control model run (1986-2005) and the projection model run (2081-2100). Changes are estimated for the medium radiation forcing scenario RCP4.5 and the extreme radiation forcing scenario RCP8.5.
Spatial
extent Global
Spatial and temporal
resolution
Spatial resolution: 0.44 degree
Temporal resolution: resampled to monthly
METOP-ASCAT satellite, from 2007 – present
Reference https://esg-dn1.nsc.liu.se/search/esgf-liu/ (ESGF Data Node)
Example
of usage Monthly envelope chart of precipitation delta change factors showing expected increase or decrease in precipitation over a certain basin.
Update Frequency
Static dataset
Related
indices -
Based on the delta change factors we will calculate the climate change projection series for the Lake Victoria basin of precipitation. These time series will be named and identified after the carbon dioxide emissions scenarios and the projection time period:
Precip. rcp45 2016-2035 Precip. rcp85 2016-2035 Precip. rcp45 2081-2100 Precip. rcp85 2081-2100

32
Based on the precipitation datasets listed, we will generate an index expressing the number of dry days per month for each RCP scenario and projection time period. Finally, alongside precipitation, the datasets for the Lake Victoria basin of temperature and potential evapotranspiration will also be generated and named:
PET rcp45 2016-2035 PET rcp85 2016-2035 PET rcp45 2081-2100 PET rcp85 2081-2100 TEMP rcp45 2016-2035 TEMP rcp85 2016-2035 TEMP rcp85 2081-2100 TEMP rcp45 2081-2100
This dataset is static and will be made available through the web portal, applied in the water resources model (precipitation and evapotranspiration), as well as included in the WRIS for Lake Victoria basin.
3.2.7 Water body data
The Water body data produced by the Copernicus Global Land Service (CGLS) is a component of the Land Monitoring Core Service (LMCS) of Copernicus, the European Earth Observation programme. With this dataset it is possible to detect areas covered by inland water along the year providing the maximum and the minimum extent of the water surface as well as the seasonal dynamics.
Spatial extent Global
Spatial and temporal resolution
Spatial resolution: 300 m
Temporal resolution: 10 day composite product.
PROV-B sensor, from January 2014 – present
Reference http://land.copernicus.eu/global/products/wb
Update Frequency 10 days
Related indices -

33
3.3 Reporting and bulletins
In this subchapter, we describe a reporting application the stakeholders and the LVBC can use to disseminate the data and information presented in chapter 3.2. Dissemination in the form of reports or bulletins is critical in relation to planning as this enables the decision or policy makers to disseminate the actual plans or the background for the decision process to stakeholders.
Not only is it necessary for data to be freely accessible to the Lake Victoria stakeholders via the online web portal, supplementing this access to data with a tool to compile reports using templates relevant to the stakeholders will add value to the data and increase its usage and ultimately applicability.
With this reporting tool, users will be able to select between a number of default reports, or develop their own reports based on their specific requirements. The reporting application is based on reporting templates in the form of Word documents containing a number of tags, where the user is able to specify which type of content the reporting application should replace the tags with.
Figure 2 Example of a report with tags.
The tool works with template reports containing the overall framework of the report and is able to insert objects in the form of images, text, chart or tables at user specified locations and converting the template report into a final report containing for example tables with the latest climate information, drought hazards or other information from portal.

34
Figure 3 Template report with tags and final report with input in the form of images, chart or text replacing the tags.
3.4 Model refinements and planning
Water resource models are useful for the assessment of water resource management and infrastructure plans, and have gained acceptance for evaluating impacts within the hydrological setting of Lake Victoria. The CTCN assistance will evaluate the existing water resource models used at Lake Victoria and select the model that is best suited for evaluating the impact of the water resources, hydropower generation from management options, climate changes and population pressure on the lake.
Based on the available information and experience from a range of projects involving the LVBC, the NBI and national ministries in Uganda we have decided to utilize an existing MIKE HYDRO Basin model5 developed over a long period of time by multiple stakeholders and used for evaluation of climate pressure on Lake Victoria (UNEP, 2013) and for development of investment plans in Uganda (MWE DWRM, 2013).
Access to the refined water resources model will be given to the stakeholders via a planning application on the technical assistance web portal, which will make the model license independent and freely available. The following subchapters detail further our approach.
3.4.1 Water resources model used for impact assessment on Lake Victoria
The CTCN assistance is to be based on the currently available information and experience from past projects, and the approach is to evaluate the existing water resources models used within Lake Victoria and select the best model to achieve the objectives of the CTCN assistance. The selected model will be refined and updated after consultation with LVBC and other stakeholders ensuring that the assistance objectives as well as the requirements from LVBC are integrated into the model refinement. The final model would have the potential to be the central water resource model for assessment of
5 MIKE HYDRO Basin is a physical and conceptual model system for catchments, rivers and floodplains, applied to Integrated Water Resources Management, Water resources assessment, Water allocation, Reservoir operation and other types of analysis, planning and management model studies (MIKE Powered by DHI, 2017)
35
climate change impacts within the water resource and energy sectors in Uganda, and potentially the region.
Therefore, based on our experience and our assessment, it has been found that the best model for the LVBC to achieve the objectives of the CTCN assistance, is the one developed through the Nile Basin Adaptation to Water Stress project (DHI and Met Office, 2013) carried out for UNEP and the NBI. Within the context of this work, a water resources model was established of the whole Nile Basin, the NBI and the MWE DWRM were part of the stakeholders involved in the model development. This model will, as part of the CTCN assistance and in close collaboration with LVBC, be further refined and will be made available for LVBC as part of the CTCN assistance.
The water resources model was developed with the objective of having a state of the art tool being able to describe the water resources within the Lake Victoria itself (rainfall and evaporation) as well as the key components from the surrounding catchments. Refinement will entail updating with the latest information regarding hydropower production, and will be used as the key tool for evaluating the impact from water management options, investments and climate change.
The model itself will not be used directly by the LVBC, but through a planning application, conceptualized to use model based planning for decision makers who do not need prior modelling knowledge. The detailed model development is documented in DHI and Met Office (2013), UNEP (2013) and MWE DWRM (2013).
The technical workflow involved in the refinement of the model is the following:
Model domain reduced Verification of calibration due to domain reduction implemented Adding existing hydropower plants to the water resources model; Inventory of planned hydropower investments and adding these to the model; Preparation of the catchment shapefile and a spreadsheet with an inventory of
existing water users; Upload of the model into the planning application and establishment of the baseline
plan.
To assist in verifying the performance of the refined model, specific investigations regarding the lake hydrology will be carried out:
3-hourly TRMM data is now available in Lake Victoria (see chapter 3.2). We will use this data to evaluate if we are able to capture the daily rainfall variation over the lake with particular considerations on day/night variations;
CHIRPS6 data corrected with ground measurements is also available, a comparison between both datasets will be carried out;
Lake versus basin water balance will be carried out; Comparison with the most recent research regarding impact of climate change on
Lake Victoria following the findings of Thiery, W. et al. (2016), focusing on increasing hazardous weather extremes over the lake behind the thousands of accidents and deaths of fishermen due to night-time thunderstorms.
6 Climate Hazards Group InfraRed Precipitation with Station

36
Figure 4 Screenshot of the MIKE HYDRO BASIN model user interface for the Lake Victoria Basin displaying water network branches in blue and subcatchment polygons in brown over a satellite background map
3.4.2 Planning application
The planning application will be embedded in the web portal deployed within this technical assistance. It targets decision makers without any modelling expertise, and the overall concept is to utilize the refined water resources model, for evaluation of plans by stakeholders in the water and energy sectors. Use of the planning application rests on the concepts itemized below and further schematized in Figure 5:
Investments: these are investments decision makers want to implement within a specific plan; investments are limited to water supply, irrigation schemes, other types of water supply, hydropower, reservoirs and storage;. investments are described as water user nodes in the water resources model, or as hydropower or reservoir nodes.
External factors: these are climate change and population growth; the external factors influence the model in different ways as they impact either the climate or the water demand simulated.
Plans: a plan is a collection of investments and external factors combined into a plan or scenario; each plan is represented by a set of inputs to the model.
Indicators: planning results are all indicators derived from the model result files, i.e. actual model results will not be shown but only indicator values.
Strategies: weighting system attributed to indicators expressing different policy and strategic focuses.

37
Figure 5 Overall concept of and key components of the planning application.
The technical workflow for the planning application is explained using a step-by-step description as follows:
Step 0: Log on to the web portal and enter the planning application
Step 1: Upload of the Lake Victoria water resources model and describes the baseline
Step 2: The baseline condition is established in the backend and made available for the user
Step 3: User defines a number of investments to be included.
List appears with existing investments, all investments in the baseline case should be editable.
User is presented with dialog for adding new investments, added by clicking on the map followed by typing of parameters. When a new investment is added it appears on the map and in an overview list.
Step 4: User defines a number of external factors to be included.
Climate change factor will be implemented through change factor multiplication on climate files.
Population growth is implemented by choosing the percentage of annual growth within the investment horizon year.
Step 5: The user makes a new Plan with the new investments and external factors from steps 3 and 4.
The baseline model is cloned and the alterations implemented in the backend.

38
The clone is a scenario model which represents the New Plan. The scenario model is executed. All the available indicators are calculated and the indicator results are stored. The scenario model and the model results are deleted (not to be used any more) User receives an email, as the plan is available.
Step 6: User evaluates the plan, selects which indicators to use and defines strategies
When clicking on a plan the existing investments can be examined and are also shown on the map.
Indicator results are presented as tables, charts and on the map. The user is able to change the indicator configuration and the results presentation
will be updated. The user creates strategies with weighting systems to evaluate the New Plan.
Step 7: User selects reporting
Once evaluation of the plan is done, the user can prepare reports and export them. The reporting part will be done through the web portal, see chapter 3.3.
3.5 Drought assessment
Droughts are typically classified in four different categories: meteorological, agricultural, hydrological, or socioeconomic. Meteorological drought is defined as deviation of rainfall compared to normal conditions. Agriculture drought occurs when the sustainability of the crop development is affected, leading to reduced crop yields. Definitions of hydrological drought are often referring to hydrological condition of the surface hydrology, which could be a period when streamflow has fallen below a given threshold. The last category of droughts is the societal and economic impacts.
All these definitions encompass the concept of water scarcity where water availability is insufficient to meet water demand. Water availability is closely connected to rainfall, but also to changes in land use, water quality, legislation etc. However it is important to bear in mind that water shortages related to drought must be considered as relative and not as absolute conditions.
Defining a drought condition relates to identifying the beginning, length and degree of severity of the drought. One of the issues with defining a drought event is that at its beginning, the duration and severity of the drought will be unknown.
The main tools for defining a drought event are different drought indices, as they can help identifying when a drought is starting and the severity. There are many existing indices, all developed and used for different purposes. It should be noted that no drought index is perfect for all situations, and in most cases, several indices will be used to evaluate a drought event.
The objective with drought assessment implementation is to provide the Lake Victoria Basin decision makers in Uganda as well as the LVBC with information to improve the planning and managing for drought with respect to operational and long term strategic planning.
Through this technical assistance, the calculation of different indices, such as the Standardized Precipitation Index (SPI) amongst others described in chapter 3.3, will be carried out for the Lake Victoria Basin area, and access provided through the web portal. Along with the indices, we will add an assessment application to set up warning thresholds for each index and carry out a risk assessment by combining the indices with different socio-economic indicators available.

39
Figure 6 Overall concept of and key components of the drought assessment application.
The technical workflow is explained using a step-by-step description next.
Step 0: Log on to the web portal and enter the drought assessment application
Step 1: The user configures a warning, based on the data and information application, a set of index datasets will be available for choosing:
ASI latest value Number days with EDI value less than -1 (30d) Consecutive days with EDI value less -1 Days with VCI less than 20 (30d) Days with VHI less than 30 (30d)
Step 2: Select threshold values for the indices selected, thus configuring a warning.
Step 3: Based on visual analysis, the user observes how the indices perform over the Lake Victoria basin area, considering the thresholds defined.
Step 4: The user configures a risk assessment, by combining the indices with socio economic data available for the basin, constituting measures of vulnerability to the impacts of drought. The expected types of information, still being collected that will be available are:
Child under weight (percentage); Drought Mortality Risk; Flood Mortality Risk; Infant Mortality Rate (2000)
Gross Domestic Product; Population density; Urban expansion; Irrigated Area; Pasture
Step 5: The user is presented with a superposition of the hazardous areas and the vulnerability information on the web portal map, allowing the identification of locations at risk.
40
3.6 Decision making guidelines
This deliverable consists of a document providing guidance on how to use data, models, and other tools in decision-making processes. No technology will be delivered, so the document constitutes the technology deliverable in itself.
The guidelines are based on the robust decision making methodology (Bryant & Lempert, 2010; Lempert, 2013), which has been developed to assist decision making in situations characterized by considerable uncertainty about future conditions. In this methodology, technical specialists work together with stakeholders to develop plausible scenarios of future conditions in which proposed policy, infrastructure, or other alternatives are likely to fail. These scenarios are then used to develop planning alternatives that are less likely to fail, with the goal of identifying a so-called “robust” alternative.
The robust decision making methodology develops a scenario in which proposed alternatives may fail through the following steps:
A simulation model is developed for each policy or infrastructure alternative. Each simulation is run many times using an ensemble of model inputs.
o The ensemble of model inputs is used to characterize the full range of uncertainty associated with important drivers affecting the performance of alternatives.
o Examples may include climate projections, demographic projections, or projections of economic factors. This creates a database of model runs where each run represents a particular set of assumptions about future conditions.
A statistical analysis of the resulting database of indicators is then used to identify a subset of the input ensemble that results in unacceptable indicator values.
This subset is then used to define a scenario (which may be a single scenario or a subset of the original ensemble) that is used to test and refine alternatives.
For example, a robust decision making analysis for a hydropower planning authority would begin by developing a simulation for each planning alternative under consideration (new facilities, new operating rules, new energy contracts, etc.). Then, the analysis would run an ensemble simulation for each alternative with different assumptions about climate, energy demand, and other water demands incorporated in each ensemble member. The analysis would then compute indicators of interest from each model run, such as the economic benefit of hydropower or the extent to which other water demands are met. The subset of ensemble members in which each alternative fails would then be used to develop one or more “failure” scenarios. The “failure” scenarios would then be used to define an alternative that is “robust” to uncertainty, either by selecting one of the original alternatives that performs best across the failure scenarios, or by developing a new alternative.
The robust methodology is useful for engaging stakeholders in a decision making process. Implementation requires thresholds defining acceptable performance for each indicator, which are identified in consultation with stakeholders. The focus on identifying conditions in which an alternative is likely to fail provides an opportunity to engage stakeholders with future scenarios that they might not consider otherwise. Finally, the methodology does not weight different future scenarios but simply asks stakeholders to consider all possible futures that may result in unacceptable outcomes. For this reason, it does not rely on probabilistic estimates of future conditions that may be controversial with stakeholder groups having different expectations of the future.
The robust decision making methodology makes use of ensemble climate information and impact modelling, both of which are components of the CTCN assistance. Therefore, at the conclusion of this technical assistance, many of the technical tools and data

41
needed to implement the methodology will be in place. Furthermore, the planning application being implemented as part of the current assistance provides a resource for creating and testing infrastructure alternatives that could also be incorporated into a robust decision making workflow. A small case study application will be developed in consultation with local stakeholders and will be used to demonstrate the methodology in the guidelines.

42
4 Methodology for testing and demonstration
In this chapter we present the methodology for testing of the deliverables described in chapter 3 Technical Specifications. This activity will test developments taking place in Activity 2.1 on case studies related to long-term and seasonal time scale planning.
4.1 Objectives
The purpose of the testing will be to ensure that the outcomes of the technical assistance are relevant and their utility demonstrated for decision-making processes of the participating stakeholders.
The steps in the testing and demonstration phase will be as follows:
Identify outcomes to be validated;
Meetings with the stakeholders to allow the institutions to further assess and nominate participants in validation outlined in the work plan;
Collect information to be used for the validation e.g. planned interventions, scenarios, observed data or historical information, reporting templates;
Validation of data and information, remotely and via working sessions outlined in the work plan;
Demonstration using case studies, for an assessment of how the outcomes from the CTCN assistance correlates with the actual processes and reporting of stakeholders;
Adjustment of the CTCN outcomes aiming at refining the data, tools and guidelines provided.
4.2 Validation and demonstration of technical components
This process will ensure that the developed technology provides outcomes that can represent the actual conditions in the basin, and therefore be used for decisions aiming at increasing the adaptation capacity towards climate change.
Validation of the outcomes will mainly be done on historical data, hence evaluating how the system is able to reproduce events which have already occurred. It will depend on the successful collection of information from the stakeholders. The following table presents how each of the technical components will be validated and with what purpose.
Table 5 Validation process of technical assistance components
Outcome Means of validation Purpose
Data and
information
Compare climate variable values with
historic information in the form of
records of precipitation, evaporation
and temperature. Main focus on the
Lake Victoria itself and the basin.
Sending weekly infosheets containing
descriptions of selected data types
Ensure that the most appropriate
datasets are included as part of
the CTCN assistance and assess
different datasets deviation.
Ensure stakeholders are exposed
to the data and start using it early
on, and maintaining regular
communication as a way to

43
Outcome Means of validation Purpose
with attached spreadsheets with time
series produced.
encourage further stakeholder
engagement and use of the
datasets.
Reporting and
bulletins
Setup of reports by stakeholders using
their own reporting templates.
Ensure the dissemination of the
data and information provided by
the technical assistance is done in
the most useful format.
Model
refinements
and planning
Evaluate performance of the planning
application with the refined model by
the LVBC and potentially other
relevant stakeholders.
Uploading of climate change
projections to the WRIS.
Ensure that relevant scenarios
are tested and verify applicability
and ease of use of the planning
application developed.
Ensure extended functionality of
the current WRIS by including
climate change datasets for the
basin.
Drought
assessment
Compare indicator values with
occurrence of drought for impacted
areas or recorded droughts. Evaluate
the need for adjustment of the
selected indices.
Ensure that the most appropriate
indices are used for drought
hazard identification.
Decision
making
guidelines
Work with stakeholders to identify
appropriate decision making problem.
Test decision making methodology in
consultation with stakeholders using
small case study.
Ensure that decision making
guidelines are useful for real-
world applications.
In parallel with the validation of the outcomes, demonstration of their application will be done through the case studies introduced in chapter 2. Next, we present how each case study (CS) will be used in the demonstration of the components described under the Technical Specifications as well as the requirements needed in each case to allow demonstration to succeed.
CS1 Management and dissemination of climate information
Link to: Adapting to climate change in Lake Victoria and WRIS
Platform: web portal and WRIS
Technology/Tool: Data and information and Reporting application
Requirements: Response to data and reporting needs questionnaire; Supplying data reporting examples and establishment of reports; Collaboration with current WRIS operators at LVBC.
Outcomes of demonstration:
User experience of the web portal Understanding and applicability of climate data types Adequacy of indicators

44
Verification of data format Download of seasonal forecasts from the web portal and integrate into the WRIS Outline a procedure to keep the seasonal forecasts up to date Integration of climate change projections in the existing WRIS
CS2 Establishment of regional water resources assessment model for decisions related to the water resource or energy sector
Link to: LVEMP
Platform: web portal and WRIS
Technology/Tool: Lake Victoria basin Model and climate change projections
Requirements: Response to data and reporting needs questionnaire; Discussion of baseline model and climate change scenarios of interest described; Collaboration with current WRIS operators at LVBC.
Outcomes of demonstration:
Refined model reviewed by LVBC; Climate change scenarios of interest selected.
CS3 Capacity and knowledge for decision making in a future climate
Link to: National training and capacity programmes focussing on climate change mitigation
Platform: web portal
Technology/Tool: Data and information and Reporting application
Requirements: Response to data and reporting needs questionnaire; Decision making processes identified; key trainees identified, supplying reporting examples and establishment of reports.
Outcomes of demonstration:
User experience of the web portal Understanding and applicability of climate data types Adequacy of climate data and indicators made available for usage; Verification of data format Potential synergy with existing programmes and ongoing activities at MNA and MWE
DRWM, namely climate change projection project, catchment management plans and baseline and situation assessment studies.
CS4 Water resource planning at national and regional level related to the water
resources and energy sector
Link to: National and regional programmes and studies
Platform: web portal
Technology/Tool: Planning application and Decision making guidelines
Requirements: Response to data and reporting needs questionnaire; List of water use investments with detailed information for different planning parameters required; Planning scenarios that need to be tested.
Outcomes of demonstration:

45
Relevant implementation of planning alternatives via the planning application, assess potential for further usage within organization.
Linkage with the National Water Resources Strategy for Uganda Applicability of guidelines produced.
CS5 Providing data and interpretation of climate change data for management of agricultural impacts
Link to: Existing activities or programmes from MNA and MWE namely
Platform: web portal
Technology/Tool: Data application and Drought assessment application
Requirements: Response to data and reporting needs questionnaire; Study areas and detailed description of specific drought hazard; identification of most appropriate indicators and establishment of reports.
Outcomes of Demonstration:
Application of drought indicators to monitor the agricultural sector Identification of areas and setup monitoring strategy using the web portal.
4.3 Work plan for Activities 2 and 3
The following actions for engagement and preparation leading up to and including the technical training and workshop activities are planned:
Meetings with targeted institutions in Uganda – end of January/February 2018 – meetings in preparation for testing and demonstration as well as training in the end of April/May. These will be done by us at stakeholders’ offices, and does not require attendance by LVBC. The selection of meetings will depend on the availability of specific organisations and the available resources within the CTCN assistance.
Working session at UNCST – mid March 2018 – with LVBC staff, UNCST and potentially relevant stakeholders focusing on testing and demonstration.
Technical training and national workshop in Uganda – end of April 2018 / mid May 2018 – 2 days with selected trainees followed by 3rd day (mostly morning session) with stakeholders to share outcomes from the technical assistance. Duration to be programmed based on findings of previous sessions.
A proposed technical training plan is introduced next revolving around working sessions with different interest groups to be conducted by our team. It is envisioned that with the UNCST collaboration, we will be able to find a suitable venue where participants can work together and focus on the training at hand.
A tentative agenda for the training and workshop activities is presented in Table 6 and Table 7.

46
Table 6 Proposed agenda for the technical training
DAY 1
Time WORK SESSION 1
LVBC MWE NBI
WORK SESSION 2 UNCST NAPE MUST RAN
UNMA MWE
09.00 – 09.30 Registration
09.30 – 10.40 Welcome and presentation of the work sessions
09.40 – 10.00 Presentation of participants
10.00 – 10.45 Overview of key features and capabilities of the web portal. This includes what type of outputs is produced and how to be interpreted.
10.45 – 11.00 Break & Away into sessions
11.00 – 11.45 DATA & INFORMATION DATA & INFORMATION
11:45 – 12:30 Exercises Exercises
12:30 – 13:30 Lunch
13:30 – 14:30 DATA & INFORMATION REPORTING
14:30 – 14:45 Break
14:45 – 15:30 Intro to PLANNING Exercises
15.30 – 16.00 Discussion and wrap up
DAY 2
Time WORK SESSION 1
LVBC MWE NBI
WORK SESSION 2
UNCST NAPE MUST RAN UNMA MWE
09.00 – 09.45 Re-cap Day 1 Re-cap Day 1
09.45 – 11.00 PLANNING DATA & INFORMATION
11:00 – 11.15 Break
11.15 – 11.45 Exercises Exercises
11:45 – 12:30 Exercises DROUGHT
12:30 – 13:30 Lunch
13:30 – 14:30 DECISION Exercises
14:30 – 14:45 Break
14:45 – 15:30 Exercises Exercises
15.30 – 16.00 Discussion and wrap up

47
Table 7 Proposed agenda for the final workshop
Time Title Responsible
09.00 – 09.15 Welcome and presentation of the objective with the workshop
Host
09.15 – 09.45 Presentation of decision case by one of the local stakeholders. The decision case will be used throughout the day as an example
Type of decision to be made Objectives, constrains and uncertainties Current decision workflow Types of data and output used in the
decision case
Local stakeholder
09.45 – 10.00 Q&A
10.00 – 10.45 Overview of key features and capabilities of the web portal. This includes what type of outputs are produced and how these need to be interpreted.
DHI
10.45 – 11.00 Q&A
11:00 – 11.15 Break
11.15 – 11.45 Exercise 1: use of web portal functionality in relation to the decision case
Local stakeholder / DHI
11:45 – 12:30 Exercise 2: use of web portal functionality in relation to the decision case
Local stakeholder / DHI
12:30 – 13:30 Lunch
13:30 – 14:30 Assisted role-play focusing on use of tools for decision making. The exercise shall attempt to portray a real-life situation, based on the presented case, where participants will be able to identify a number of management and/or development options. Pre-made output from will be used in the exercise.
DHI
14:30 – 14:45 Q&A
14:45 – 15:30 Discussion on how the web portal could be used in the decision process focusing on the operational use and sustainability of the portal.
All
15:30 – 15:45 Break
15:45 – 16:30 Wrap up Host
All workshop material and developed content will be compiled and disseminated to all participants.
In the following page, we present the proposed scheduling for the work plan above, currently under discussion with LVBC and UNCST.

48
IMPORTANT DATES
JANUARY FEBRUARY FEBRUARY 5 - 9
S M T W T F S S M T W T F S Meetings at stakeholders offices in preparation of testing
1 2 3 4 5 6 1 2 3
7 8 9 10 11 12 13 4 5 6 7 8 9 10 FEBRUARY 15
14 15 16 17 18 19 20 11 12 13 14 15 16 17 First version of the tools for testing Deliverable 2.1
21 22 23 24 25 26 27 18 19 20 21 22 23 24
28 29 30 31 25 26 27 28 Mid-MARCH ?
Testing working session at UNCST
MARCH APRIL MARCH 31
S M T W T F S S M T W T F S Review and comments from LVBC
1 2 3 1 2 3 4 5 6 7
4 5 6 7 8 9 10 8 9 10 11 12 13 14 End APRIL OR Mid MAY ?
11 12 13 14 15 16 17 15 16 17 18 19 20 21 Technical training & National workshop
18 19 20 21 22 23 24 22 23 24 25 26 27 28
25 26 27 28 29 30 31 29 30 APRIL 30
Testing and demonstration report & user guide Del iverable 2.2
MAY JUNE
S M T W T F S S M T W T F S MAY 31
1 2 3 4 5 1 2 Summary report of tra ining and workshop Del iverables 3.1 & 3.2
6 7 8 9 10 11 12 3 4 5 6 7 8 9
13 14 15 16 17 18 19 10 11 12 13 14 15 16
20 21 22 23 24 25 26 17 18 19 20 21 22 23 National Holidays in UG / KN / DK
27 28 29 30 31 24 25 26 27 28 29 30
2018

49
5 Next steps
This deliverable brings Activity 1 to completion, next lies Activity 2 which encompasses the delivery of technical outputs and validation on specific use cases:
Activity 2.1 refers to the implementation of technical components, including setting up the web portal, data access, Impact assessment model refinements, and guidelines for decision-making.
Activity 2.2 will test developments taking place in Activity 2.1 on relevant case studies. After testing, the new developments will be documented in order to support dissemination activities, including the elaboration of a summary of feedbacks from LVBC on Activity 2.1, and a user guide.
The next deliverables of the above activities following this report are: the first draft version of the technical components by 15th of February 2018, the Technology testing and demonstration report, the final version of the technical components, and Documentation and user guide report by the end of April 2018.
Activity 3 Dissemination and outreach, will help stakeholders make use of the different components through a second national workshop and technical training. Summary reports of the events and all training materials will be delivered and disseminated, and a Roadmap elaborated with recommendations for regional transfer of the technology and scaling up within future projects.
The input by our gender expert is programmed within the scope of Activity 3, the next subchapter provides details on the expected scope of work.
5.1 Gender mainstreaming
Gender considerations will be taken as part of the national workshop and subsequent training events to ensure gender equality within the capacity and dissemination part of the technical assistance. In order to fulfil this, our team integrates a gender expert whose scope of work is:
1. Participate in the workshop of Activity 3.1 and training of Activity 3.2 by reporting on/tracking the gender mainstreaming relevant indicators of the Monitoring and Evaluation Plan within Activity 3.4 and briefly assessing the performance in light of gender mainstreaming.
2. Contribute to the CTCN Impact description in light of gender mainstreaming within a climate change adaptation technical assistance
The team’s gender expert will participate in the above activities, and during the first day observe, follow the activities and apply gender gap assessment of the working sessions with participants.
Following the first day’s work sessions, the team’s gender expert will then relay on the other team members the findings and discuss the necessary tools to be implemented directly over the course of the second and third days of the training and workshop activities.
Finally, reporting and lessons learned will be integrated into the dissemination and reporting tasks of the technical assistance following 3.1 and 3.2 deliverables.

50
6 References
DHI and Met Office (2013), Nile Basin Adaptation to Water Stress. Prepared for UNEP and NBI.
Hi-Ryong Byun and Donald A. Wilhite, (1999) Objective Quantification of Drought Severity and Duration. http://journals.ametsoc.org/doi/full/10.1175/1520-0442%281999%29012%3C2747%3AOQODSA%3E2.0.CO%3B2
Kogan, F. N. F. (1990) Remote sensing of weather impacts on vegetation in non-homogeneous areas. International Journal of Remote Sensing, 11, 1405–1419.
Lempert, R. (2013), Scenarios that illuminate vulnerabilities and robust responses. Climatic Change, 117(4), 627-646.
LVBC, EAC, Development of a Water Resources Monitoring Information System (WRMIS) for Monitoring Surface Water, Groundwater and Water Quality including a GIS-based Database for Land-use, Hydrology and Biodiversity in the Lake Victoria Basin, Final Report, 2014.
LVBC (2007), Regional Transboundary Diagnostic Analysis of the Lake Victoria Basin.
LVBC (2007), Strategic Action Plan (SAP) for the Lake Victoria Basin.
LVBC (2009), Lake Victoria Environmental Management Project Phase II (LVEMP-II), link: http://lvemp.eac.int/
MIKE Powered by DHI (2017) MIKE HYDRO Basin User guide. https://www.mikepoweredbydhi.com/products/mike-hydro-basin
MWE DWRM (2013), National Water Resources Strategy.
MWE DWRM (2013), National Water Resources Assessment.
The Republic of Uganda (2007), Technology need assessment report.
The Republic of Uganda (2007), Climate Change Uganda national adaptation programmes of action.
The Republic of Uganda (2010), National Development Plan 2010 to 2015.
Thiery, W. et al. (2016) Hazardous thunderstorm intensification over Lake Victoria. Nat. Commun. 7:12786 doi: 10.1038/ncomms12786.
UNEP (2013), Nile Basin Adaptation to Water Stress, Comprehensive assessment of Flood & Drought Prone Areas, by DHI and UK MetOffice for UNEP.
UN WOMEN (2016), Leveraging Co-Benefits between Gender Equality and Climate Action for Sustainable Development. Mainstreaming Gender Considerations in Climate Change Projects.
WMO Standardized Precipitation Index User Guide, http://www.wamis.org/agm/pubs/SPI/WMO_1090_EN.pdf
APPENDIX A
Reporting and data needs survey


A-i

A-ii

A-iii

A-iv