ctc q3 2017 investor deck final
TRANSCRIPT

Canadian Tire Corporation Investor Presentation | November 2017

Forward Looking Information This document contains forward-looking statements that reflect management’s current expectations related to matters such as future financial performance and operating results of the Company. Forward-looking statements provide information about Management’s current expectations and plans and allow investors and others to better understand the Company’s anticipated financial position, results of operations and operating environment. Readers are cautioned that such information may not be appropriate for other purposes.
All statements other than statements of historical facts included in this document may constitute forward-looking statements, including, but not limited to, statements concerning Management’s current expectations relating to possible or assumed future prospects and results, the Company’s strategic goals and priorities, its actions and the results of those actions and the economic and business outlook for the Company. Often, but not always, forward-looking statements can be identified by the use of forward-looking terminology such as “may”, “will”, “expect”, “intend”, “believe”, “estimate”, “plan”, “can”, “could”, “should”, “would”, “outlook”, “forecast”, “anticipate”, “aspire”, “foresee”, “continue”, “ongoing” or the negative of these terms or variations of them or similar terminology. Forward-looking statements are based on the reasonable assumptions, estimates, analyses, beliefs and opinions of Management, made in light of its experience and perception of trends, current conditions and expected developments, as well as other factors that Management believes to be relevant and reasonable at the date that such statements are made.
By their very nature, forward-looking statements require Management to make assumptions and are subject to inherent risks and uncertainties, which give rise to the possibility that the Company’s assumptions, estimates, analyses, beliefs and opinions may not be correct and that the Company’s expectations and plans will not be achieved. Examples of material assumptions and Management’s beliefs, which may prove to be incorrect, include, but are not limited to, the effectiveness of certain performance measures, current and future competitive conditions and the Company’s position in the competitive environment, the Company’s core capabilities, and expectations around the availability of sufficient liquidity to meet the Company’s contractual obligations. Although the Company believes that the forward-looking information in this document is based on information, assumptions and beliefs that are current, reasonable and complete, such information is necessarily subject to a number of factors that could cause actual results to differ materially from Management’s expectations and plans as set forth in such forward-looking statements. Some of the factors, many of which are beyond the Company’s control and the effects of which can be difficult to predict, include: (a) credit, market, currency, operational, liquidity and funding risks, including changes in economic conditions, interest rates or tax rates; (b) the ability of the Company to attract and retain high-quality employees for all of its businesses, Dealers, Canadian Tire Petroleum retailers, and Mark’s and FGL Sports franchisees, as well as the Company’s financial arrangements with such parties; (c) the growth of certain business categories and market segments and the willingness of customers to shop at its stores or acquire its financial products and services; (d) the Company’s margins and sales and those of its competitors; (e) the changing consumer preferences toward eCommerce, online retailing and the introduction of new technologies; (f) the possible effects on our business from international conflicts, political conditions, and developments including changes relating to or affecting economic or trade matters; (g) risks and uncertainties relating to information management, technology, cyber threats, property management and development, environmental liabilities, supply chain management, product safety, changes in law, regulation, competition, seasonality, weather patterns, commodity prices and business disruption, the Company’s relationships with suppliers, manufacturers, partners and other third parties, changes to existing accounting pronouncements, the risk of damage to the reputation of brands promoted by the Company and the cost of store network expansion and retrofits; (h) the Company’s capital structure, funding strategy, cost management programs, and share price and (i) the Company’s ability to obtain all necessary regulatory approvals. Management cautions that the foregoing list of important factors and assumptions is not exhaustive and other factors could also adversely affect the Company’s results. Investors and other readers are urged to consider the foregoing risks, uncertainties, factors and assumptions carefully in evaluating the forward-looking statements and are cautioned not to place undue reliance on such forward-looking statements.
For more information on the risks, uncertainties and assumptions that could cause the Company's actual results to differ from current expectations, please refer to sections 7.2.4 (Retail segment business risks), 7.3.2 (CT REIT segment business risks), 7.4.3 (Financial Services segment business risks) and 12.0 (Enterprise risk management) and all subsections thereunder of the MD&A contained in the Company’s 2016 Report to Shareholders. Please also refer to section 2.10 (Risk Factors) of the Company’s Annual Information Form for fiscal 2016, as well as the Company’s other public filings, available on the SEDAR (System for Electronic Document Analysis and Retrieval) website at www.sedar.com and at investors.canadiantire.ca
Forward-looking statements do not take into account the effect that transactions or non-recurring or other special items announced or occurring after the statements are made have on the Company’s business. For example, they do not include the effect of any dispositions, acquisitions, asset write downs or other charges announced or occurring after such statements are made.
The forward-looking statements and information contained herein are based on certain factors and assumptions as of the date hereof The Company does not undertake to update any forward-looking statements, whether written or oral, that may be made from time to time by it or on its behalf, to reflect new information, future events or otherwise, except as required by applicable securities laws.
NOVEMBER 2017 INVESTOR PRESENTATION | FORWARD LOOKING INFORMATION 2
Shaping Retail in Canada For almost a century, Canadian Tire Corporation (CTC) has proudly offered products and services to help Canadians from coast-to-coast navigate the landscape we know and love so well.
NOVEMBER 2017 INVESTOR PRESENTATION | SHAPING RETAIL IN CANADA 3
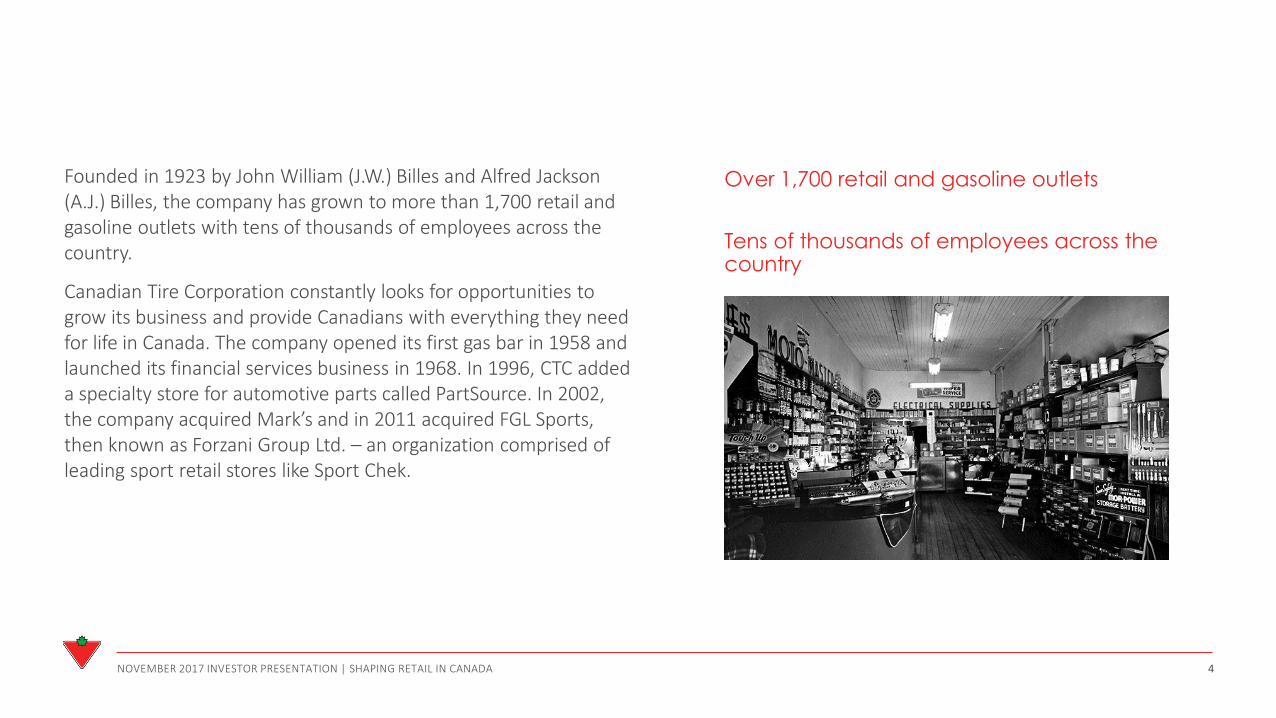
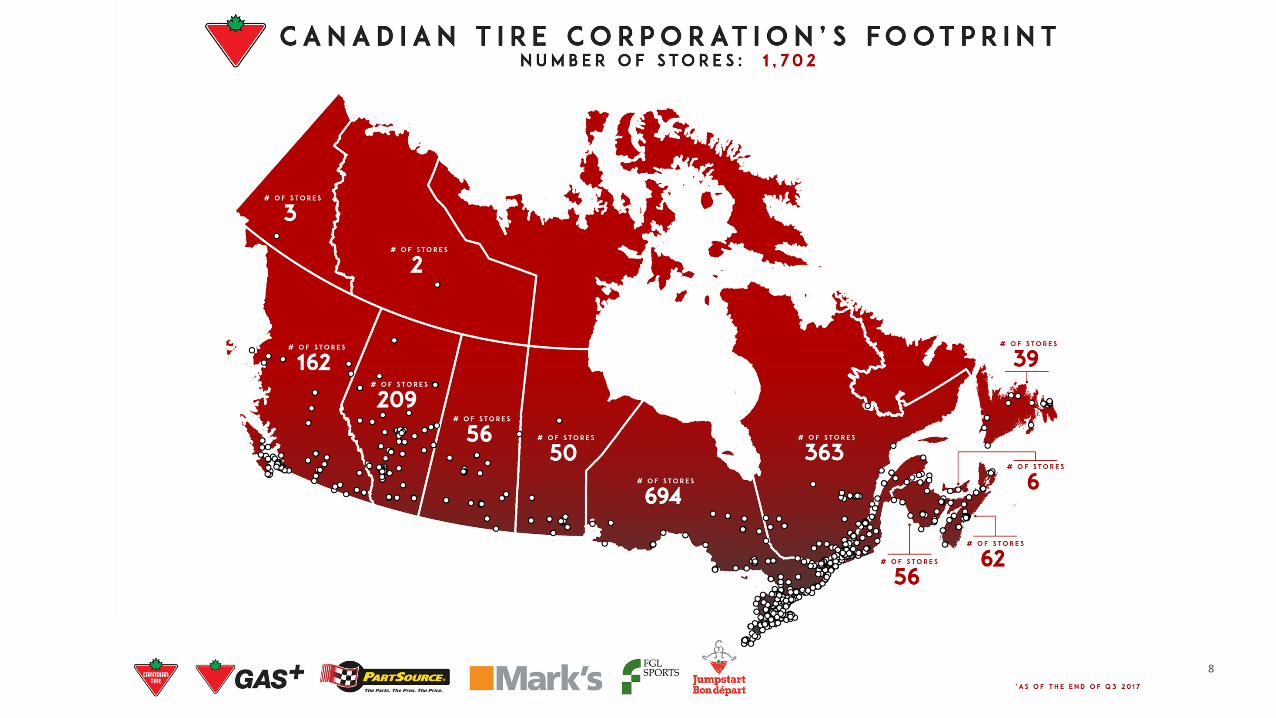
Founded in 1923 by John William (J.W.) Billes and Alfred Jackson (A.J.) Billes, the company has grown to more than 1,700 retail and gasoline outlets with tens of thousands of employees across the country.
Canadian Tire Corporation constantly looks for opportunities to grow its business and provide Canadians with everything they need for life in Canada. The company opened its first gas bar in 1958 and launched its financial services business in 1968. In 1996, CTC added a specialty store for automotive parts called PartSource. In 2002, the company acquired Mark’s and in 2011 acquired FGL Sports, then known as Forzani Group Ltd. – an organization comprised of leading sport retail stores like Sport Chek.
NOVEMBER 2017 INVESTOR PRESENTATION | SHAPING RETAIL IN CANADA 4
Over 1,700 retail and gasoline outlets
Tens of thousands of employees across the country

Canadian Tire Corporation Today With over 1,700 locations and a portfolio of world-class products, CTC is one of Canada’s most recognized and trusted brands and the place that Canadians turn to everyday to enable the Jobs and Joys of Life in Canada.
NOVEMBER 2017 INVESTOR PRESENTATION | SHAPING RETAIL IN CANADA 5
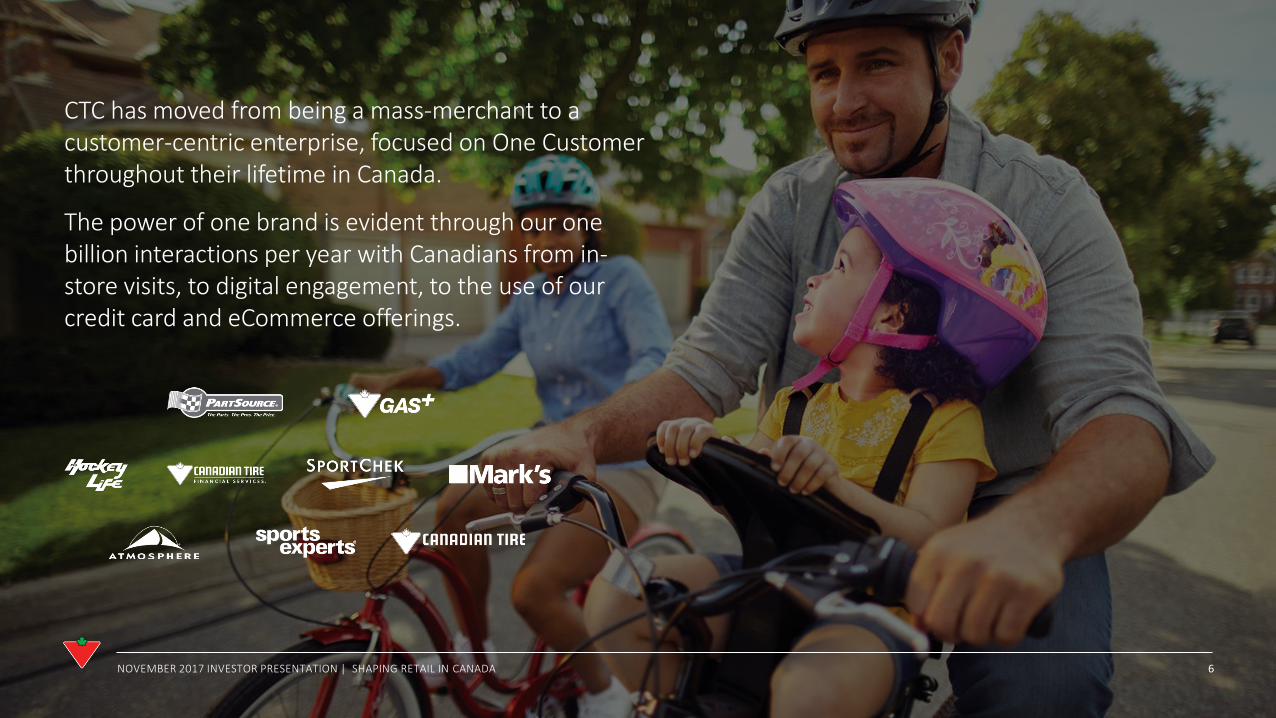
CTC has moved from being a mass-merchant to a customer-centric enterprise, focused on One Customer throughout their lifetime in Canada.
The power of one brand is evident through our one billion interactions per year with Canadians from in- store visits, to digital engagement, to the use of our credit card and eCommerce offerings.
NOVEMBER 2017 INVESTOR PRESENTATION | SHAPING RETAIL IN CANADA 6
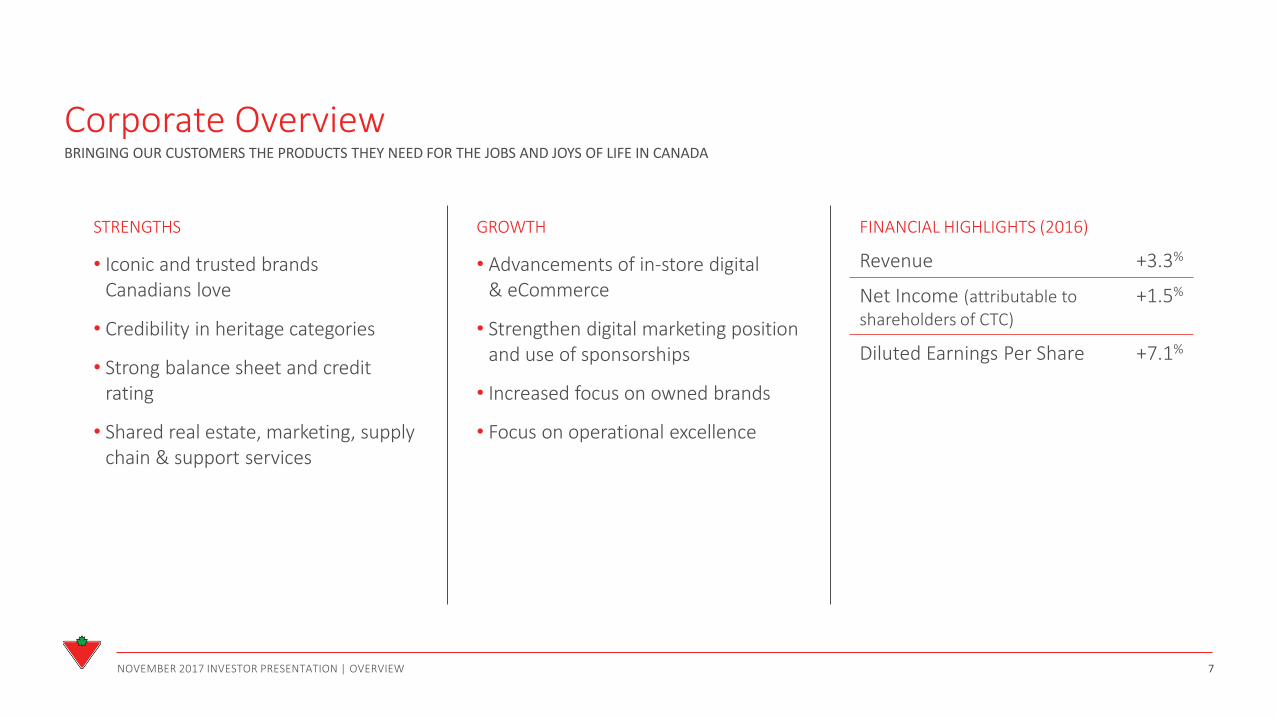
Corporate Overview
STRENGTHS
• Iconic and trusted brands Canadians love
• Credibility in heritage categories
• Strong balance sheet and credit rating
• Shared real estate, marketing, supply chain & support services
NOVEMBER 2017 INVESTOR PRESENTATION | OVERVIEW 7
GROWTH
• Advancements of in-store digital & eCommerce
• Strengthen digital marketing position and use of sponsorships
• Increased focus on owned brands
• Focus on operational excellence
FINANCIAL HIGHLIGHTS (2016)
Revenue +3.3%
Net Income (attributable to shareholders of CTC)
+1.5%
Diluted Earnings Per Share +7.1%
BRINGING OUR CUSTOMERS THE PRODUCTS THEY NEED FOR THE JOBS AND JOYS OF LIFE IN CANADA
8 NOVEMBER 2017 INVESTOR PRESENTATION | OVERVIEW
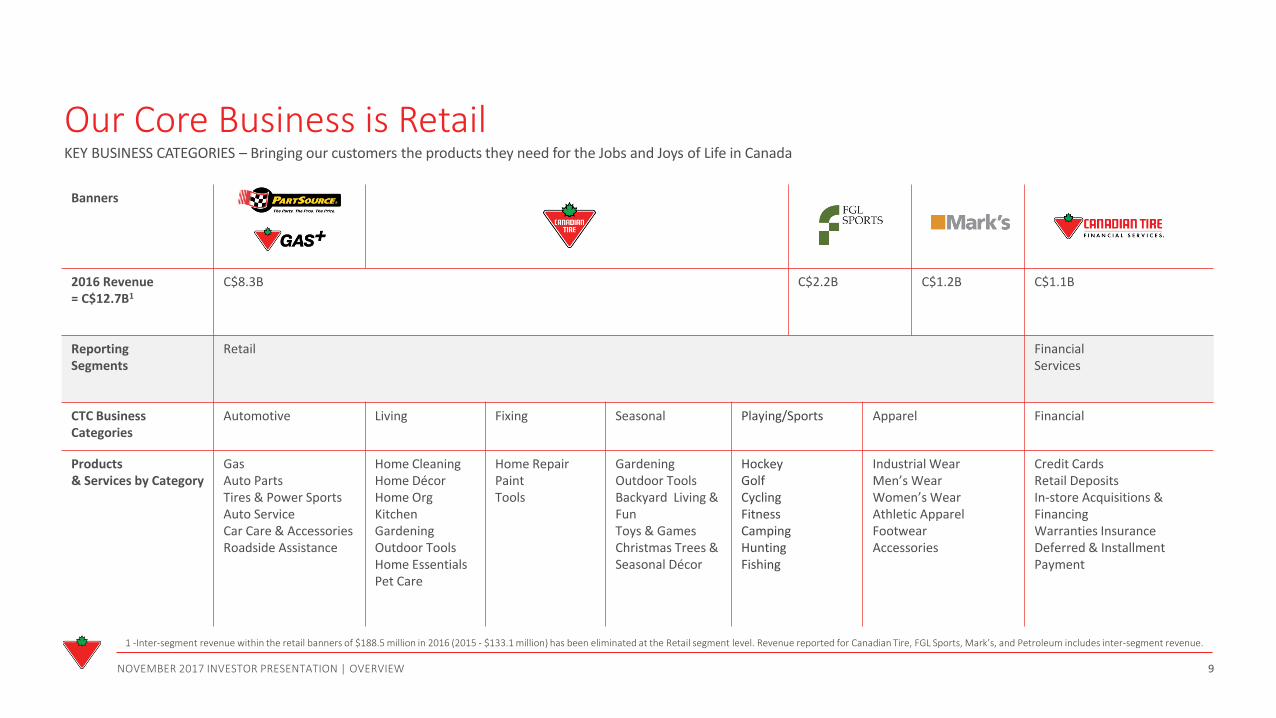
Our Core Business is Retail
Banners
2016 Revenue = C$12.7B1
C$8.3B C$2.2B C$1.2B C$1.1B
Reporting Segments
Retail Financial Services
CTC Business Categories
Automotive Living Fixing Seasonal Playing/Sports Apparel Financial
Products & Services by Category
Gas Auto Parts Tires & Power Sports Auto Service Car Care & Accessories Roadside Assistance
Home Cleaning Home Décor Home Org Kitchen Gardening Outdoor Tools Home Essentials Pet Care
Home Repair Paint Tools
Gardening Outdoor Tools Backyard Living & Fun Toys & Games Christmas Trees & Seasonal Décor
Hockey Golf Cycling Fitness Camping Hunting Fishing
Industrial Wear Men’s Wear Women’s Wear Athletic Apparel Footwear Accessories
Credit Cards Retail Deposits In-store Acquisitions & Financing Warranties Insurance Deferred & Installment Payment
NOVEMBER 2017 INVESTOR PRESENTATION | OVERVIEW 9
KEY BUSINESS CATEGORIES – Bringing our customers the products they need for the Jobs and Joys of Life in Canada
1 -Inter-segment revenue within the retail banners of $188.5 million in 2016 (2015 - $133.1 million) has been eliminated at the Retail segment level. Revenue reported for Canadian Tire, FGL Sports, Mark’s, and Petroleum includes inter-segment revenue.
Canadian Tire Retail Leading the way in Automotive, Playing, Fixing, Seasonal and Living categories, we are Canada’s Store. As one of the most trusted and iconic Canadian brands, customers have been shopping with Canadian Tire for 95 years because we provide them with the most relevant assortment and exclusive products they need for the Jobs and Joys of Life in Canada.
NOVEMBER 2017 INVESTOR PRESENTATION | CTR 10
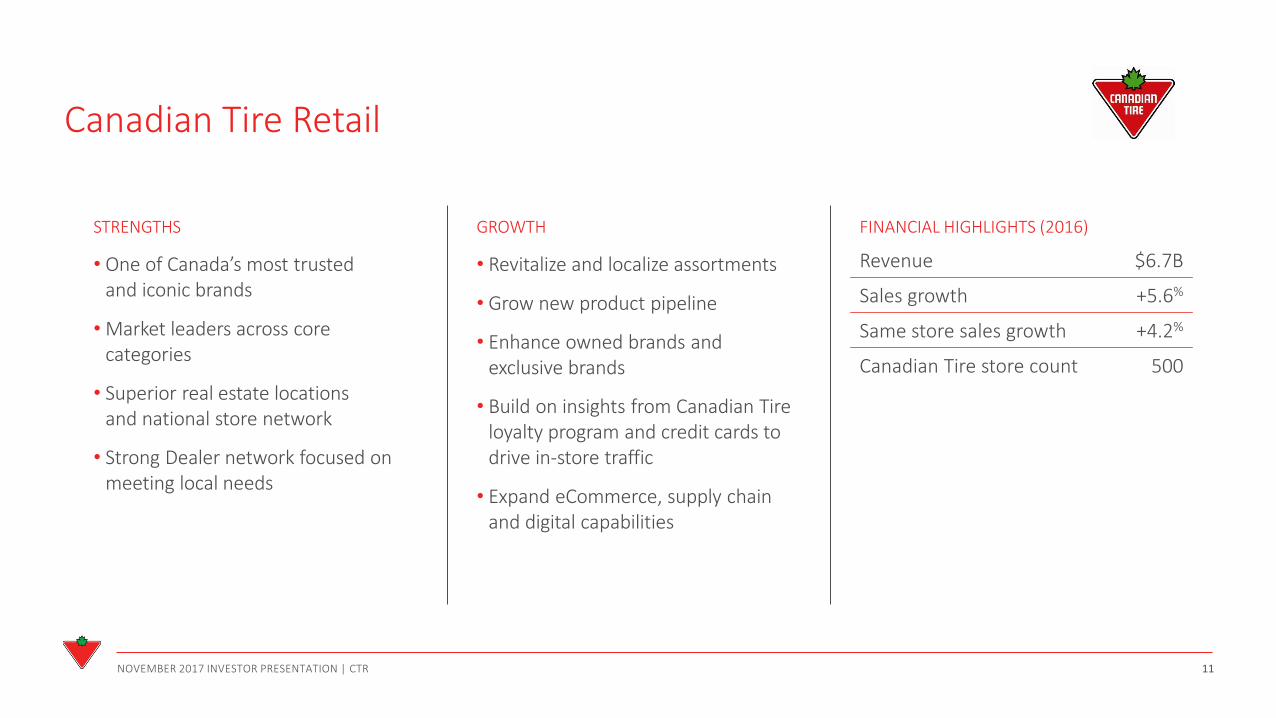
Canadian Tire Retail
STRENGTHS
• One of Canada’s most trusted and iconic brands
• Market leaders across core categories
• Superior real estate locations and national store network
• Strong Dealer network focused on meeting local needs
NOVEMBER 2017 INVESTOR PRESENTATION | CTR 11
GROWTH
• Revitalize and localize assortments
• Grow new product pipeline
• Enhance owned brands and exclusive brands
• Build on insights from Canadian Tire loyalty program and credit cards to drive in-store traffic
• Expand eCommerce, supply chain and digital capabilities
FINANCIAL HIGHLIGHTS (2016)
Revenue $6.7B
Sales growth +5.6%
Same store sales growth +4.2%
Canadian Tire store count 500

FGL Sports FGL Sports is Canada’s largest sporting goods retailer with over 430 locations across the country.
FGL and its retail banners (Sport Chek, Hockey Experts, Sports Experts, National Sports, Intersport, Pro Hockey Life and Atmosphere) sell a vast assortment of sports-related products – from athletic footwear, to athletic and leisure apparel, to sports equipment.
NOVEMBER 2017 INVESTOR PRESENTATION | FGL SPORTS 12
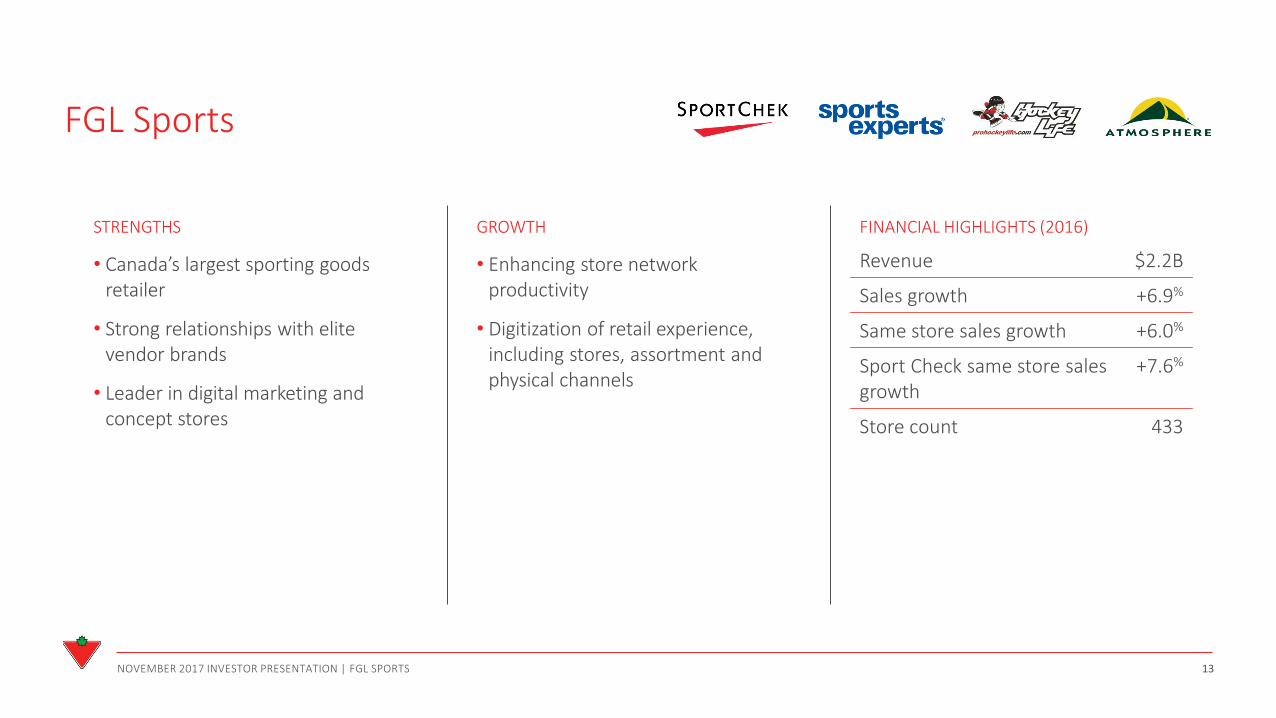
FGL Sports
STRENGTHS
• Canada’s largest sporting goods retailer
• Strong relationships with elite vendor brands
• Leader in digital marketing and concept stores
NOVEMBER 2017 INVESTOR PRESENTATION | FGL SPORTS 13
GROWTH
• Enhancing store network productivity
• Digitization of retail experience, including stores, assortment and physical channels
FINANCIAL HIGHLIGHTS (2016)
Revenue $2.2B
Sales growth +6.9%
Same store sales growth +6.0%
Sport Check same store sales growth
+7.6%
Store count 433

Mark’s Whether on the job or out on the town, Mark’s has provided Canadians with a wide selection of products known for comfort, durability, value and innovation since 1977. From its roots as Canada’s leading industrial apparel retailer, Mark’s has expanded into one of the top stores for casual apparel and footwear. With over 380 stores, including L’Equipeur in Quebec, Mark’s is here to give you the confidence to look and feel your best for everyday life in Canada.
NOVEMBER 2017 INVESTOR PRESENTATION | MARK‘S 14
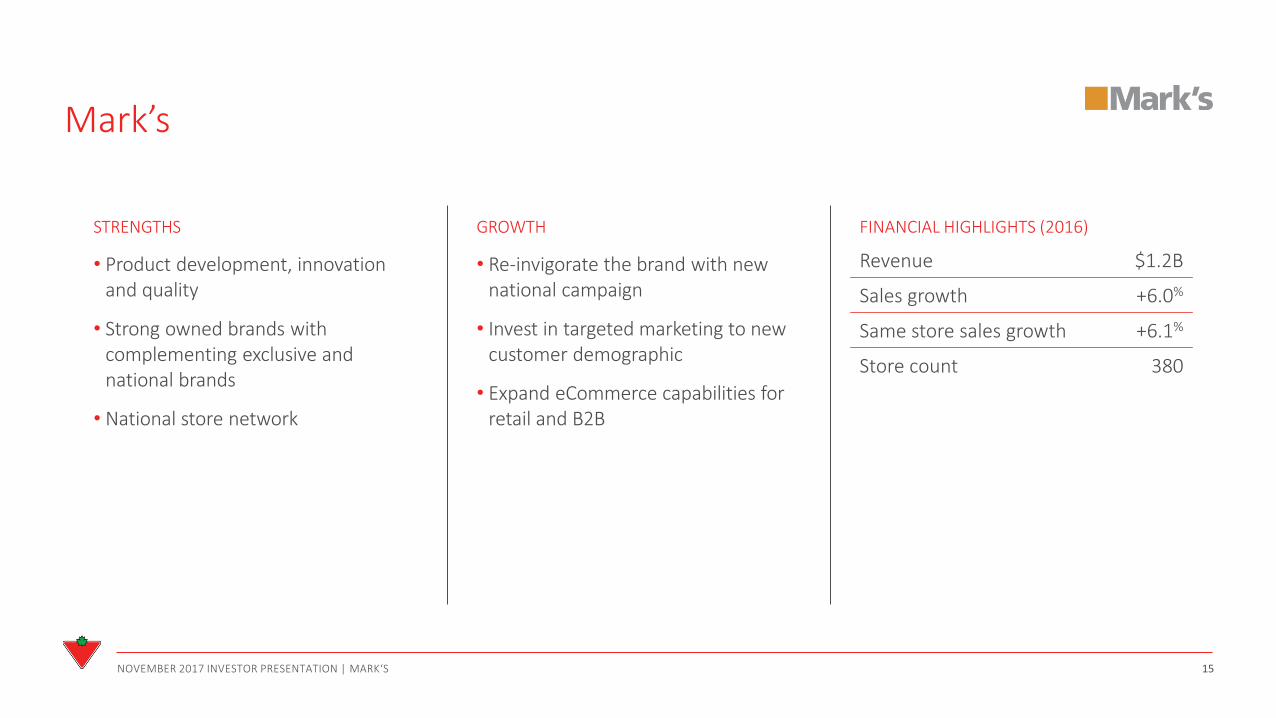
Mark’s
STRENGTHS
• Product development, innovation and quality
• Strong owned brands with complementing exclusive and national brands
• National store network
NOVEMBER 2017 INVESTOR PRESENTATION | MARK‘S 15
GROWTH
• Re-invigorate the brand with new national campaign
• Invest in targeted marketing to new customer demographic
• Expand eCommerce capabilities for retail and B2B
FINANCIAL HIGHLIGHTS (2016)
Revenue $1.2B
Sales growth +6.0%
Same store sales growth +6.1%
Store count 380

Canadian Tire Financial Services Our financial services division (CTFS) offers a host of products and services to provide our customers with solutions to meet their everyday financial needs. From CTFS’s Canadian Tire MasterCard to equal payment plan options, our award winning customer service team is here to help Canadians enjoy everything our country has to offer.
NOVEMBER 2017 INVESTOR PRESENTATION | FINANCIAL SERVICES 16
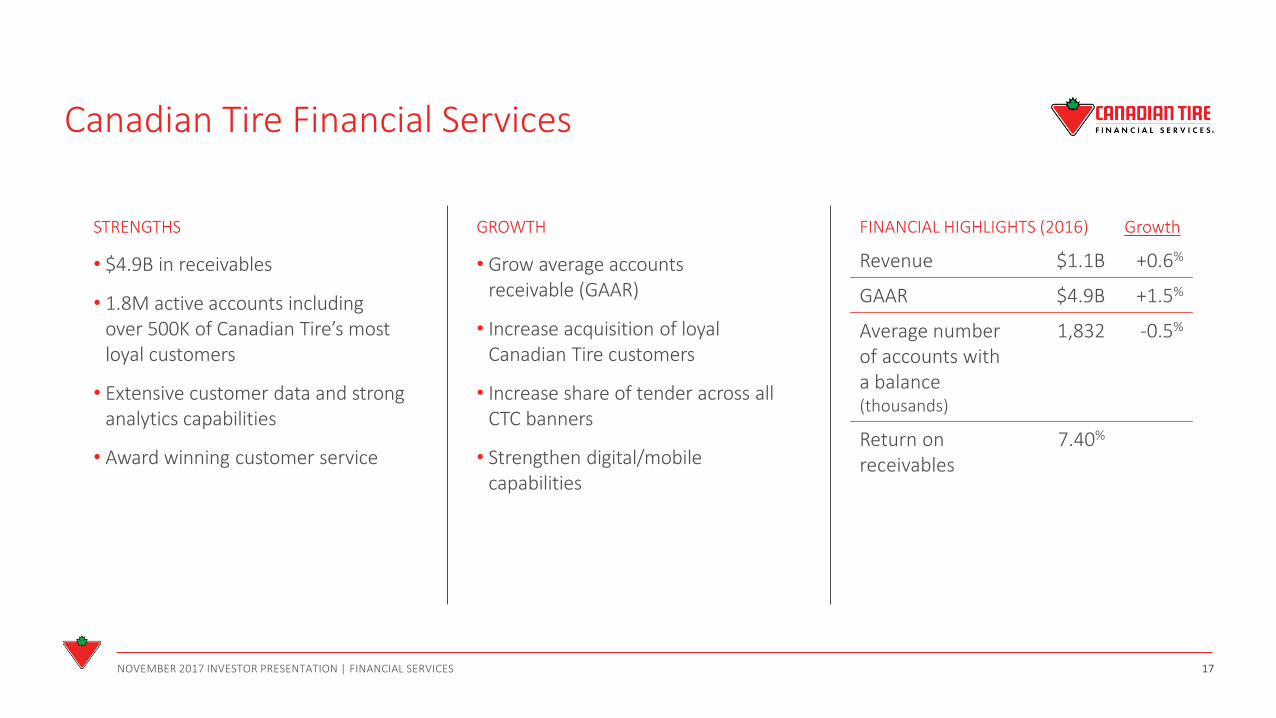
Canadian Tire Financial Services
STRENGTHS
• $4.9B in receivables
• 1.8M active accounts including over 500K of Canadian Tire’s most loyal customers
• Extensive customer data and strong analytics capabilities
• Award winning customer service
NOVEMBER 2017 INVESTOR PRESENTATION | FINANCIAL SERVICES 17
GROWTH
• Grow average accounts receivable (GAAR)
• Increase acquisition of loyal Canadian Tire customers
• Increase share of tender across all CTC banners
• Strengthen digital/mobile capabilities
FINANCIAL HIGHLIGHTS (2016) Growth
Revenue $1.1B +0.6%
GAAR $4.9B +1.5%
Average number of accounts with a balance (thousands)
1,832 -0.5%
Return on receivables
7.40%

CT REIT CT Real Estate Investment Trust (CT REIT) is an unincorporated, closed end real estate investment trust formed to own income-producing commercial properties primarily located in Canada.
Its highly diversified portfolio is comprised of over 300 properties totaling approximately 25 million square feet of gross leasable area (GLA), consisting primarily of retail properties across Canada.
NOVEMBER 2017 INVESTOR PRESENTATION | CT REIT 18
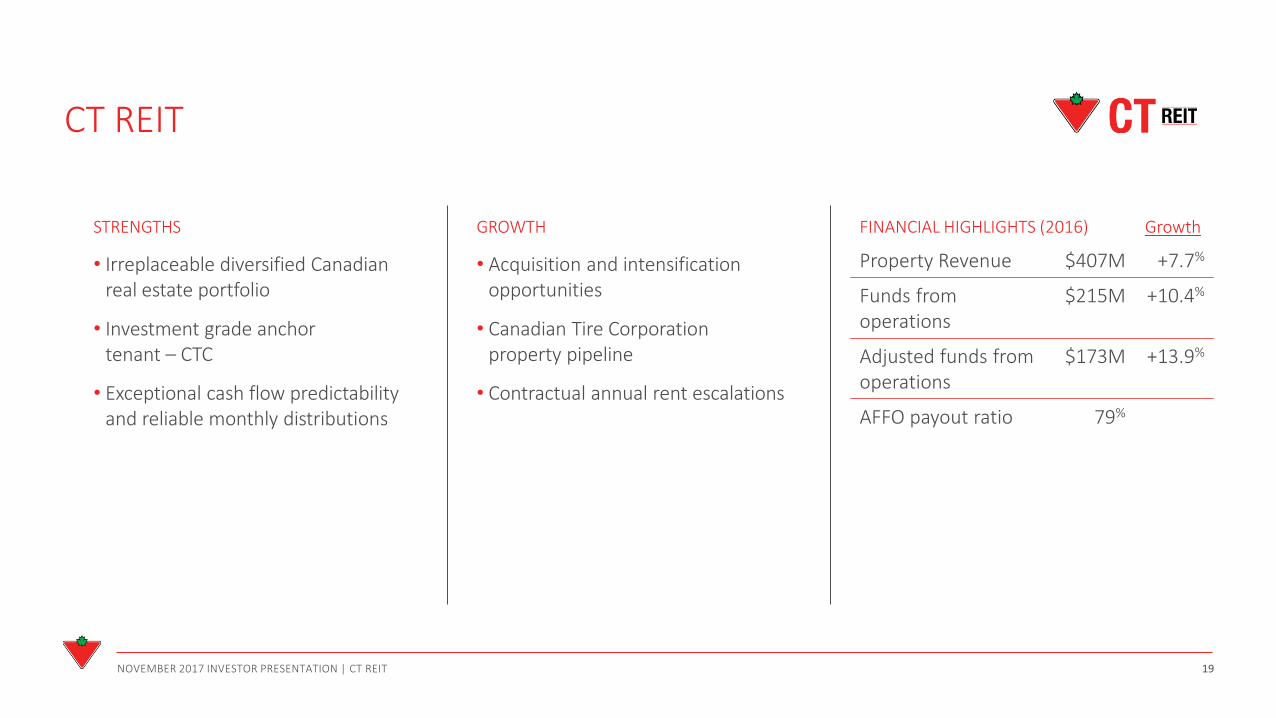
CT REIT
STRENGTHS
• Irreplaceable diversified Canadian real estate portfolio
• Investment grade anchor tenant – CTC
• Exceptional cash flow predictability and reliable monthly distributions
NOVEMBER 2017 INVESTOR PRESENTATION | CT REIT 19
GROWTH
• Acquisition and intensification opportunities
• Canadian Tire Corporation property pipeline
• Contractual annual rent escalations
FINANCIAL HIGHLIGHTS (2016) Growth
Property Revenue $407M +7.7%
Funds from operations
$215M +10.4%
Adjusted funds from operations
$173M +13.9%
AFFO payout ratio 79%
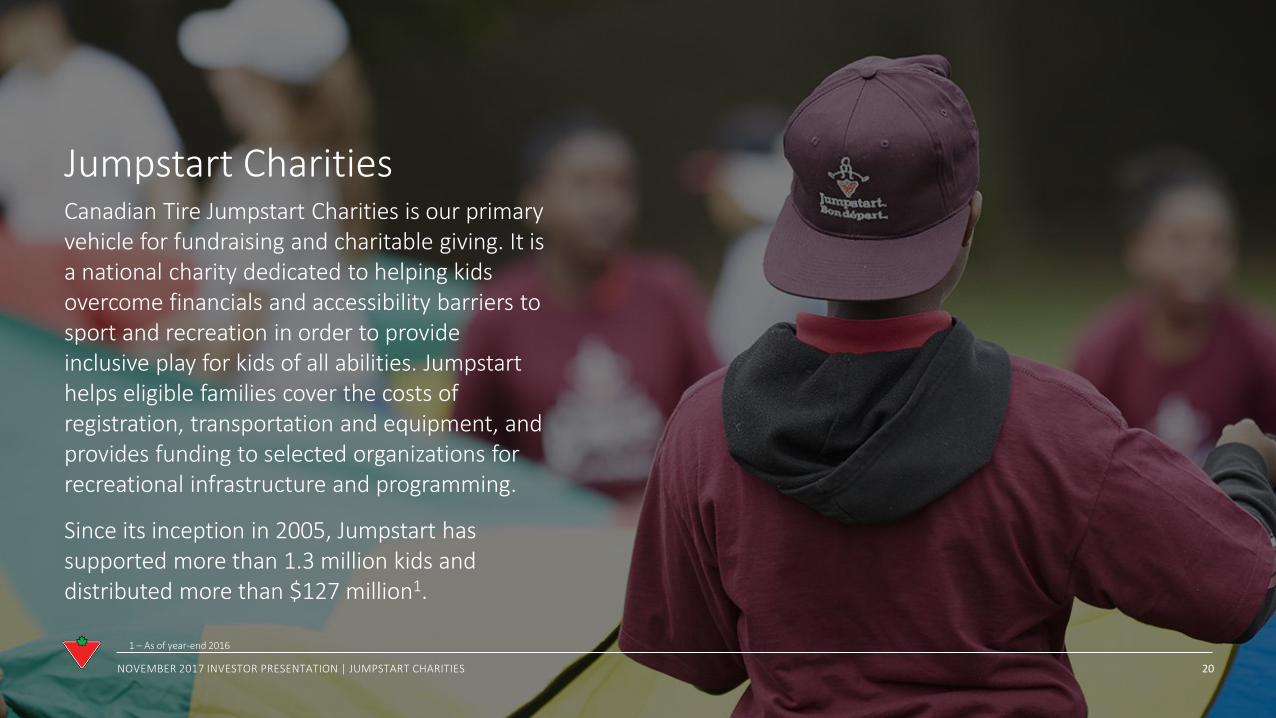
Jumpstart Charities Canadian Tire Jumpstart Charities is our primary vehicle for fundraising and charitable giving. It is a national charity dedicated to helping kids overcome financials and accessibility barriers to sport and recreation in order to provide inclusive play for kids of all abilities. Jumpstart helps eligible families cover the costs of registration, transportation and equipment, and provides funding to selected organizations for recreational infrastructure and programming.
Since its inception in 2005, Jumpstart has supported more than 1.3 million kids and distributed more than $127 million1.
NOVEMBER 2017 INVESTOR PRESENTATION | JUMPSTART CHARITIES 20
1 – As of year-end 2016

Our Owned Brands CTC’s billions of dollars in private brand sales gives a competitive advantage, made possible with our experience in products, quality management and direct sourcing. In order to create more focus on our private brand portfolio, CTC’s new Brand divisions are taking our owned brands such as CANVAS, WOODS, MAXIMUM, MotoMaster, Dakota, WindRiver and PADERNO to the next level.
NOVEMBER 2017 INVESTOR PRESENTATION | OWNED BRANDS 21
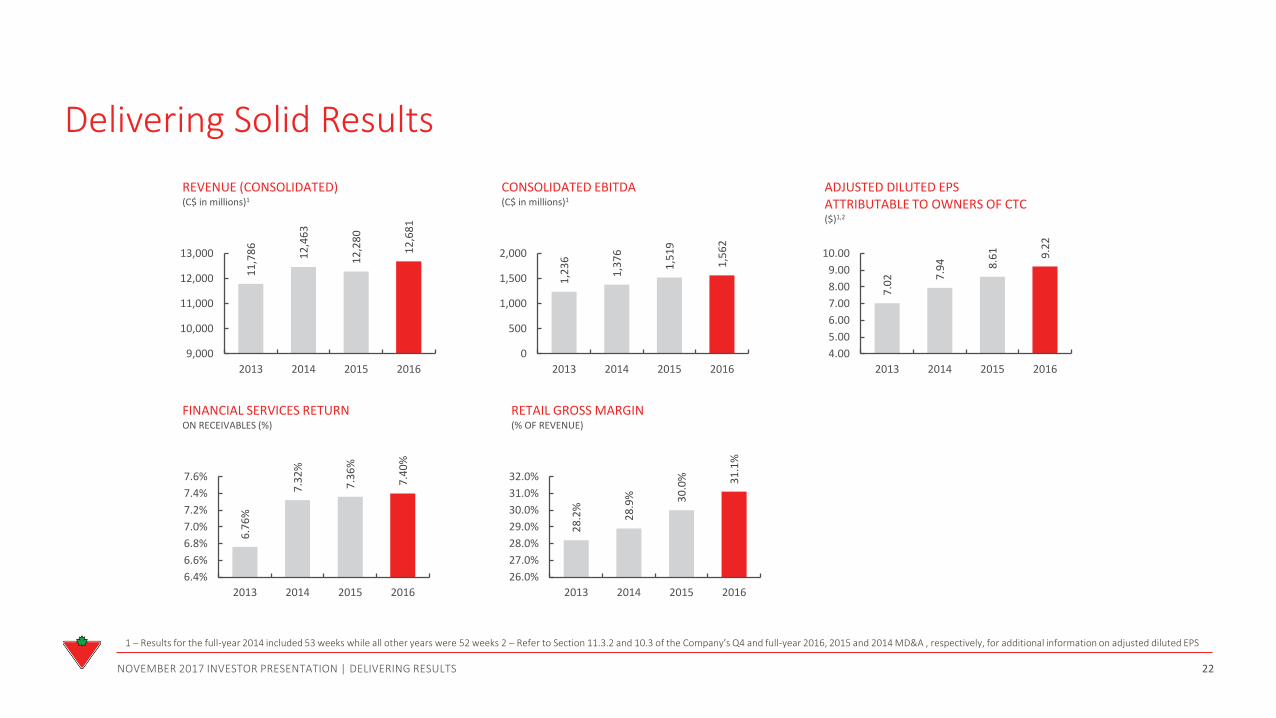
Delivering Solid Results
11
,78
6
12
,46
3
12
,28
0
12
,68
1
9,000
10,000
11,000
12,000
13,000
2013 2014 2015 2016
REVENUE (CONSOLIDATED) (C$ in millions)1
NOVEMBER 2017 INVESTOR PRESENTATION | DELIVERING RESULTS 22
7.0
2 7.9
4
8.6
1
9.2
2
4.00
5.00
6.00
7.00
8.00
9.00
10.00
2013 2014 2015 2016
ADJUSTED DILUTED EPS ATTRIBUTABLE TO OWNERS OF CTC ($)1,2
1,2
36
1,3
76
1,5
19
1,5
62
0
500
1,000
1,500
2,000
2013 2014 2015 2016
CONSOLIDATED EBITDA (C$ in millions)1
6.7
6%
7.3
2%
7.3
6%
7.4
0%
6.4%
6.6%
6.8%
7.0%
7.2%
7.4%
7.6%
2013 2014 2015 2016
FINANCIAL SERVICES RETURN ON RECEIVABLES (%)
28
.2%
28
.9%
30
.0%
31
.1%
26.0%
27.0%
28.0%
29.0%
30.0%
31.0%
32.0%
2013 2014 2015 2016
Hu
nd
red
s
RETAIL GROSS MARGIN (% OF REVENUE)
1 – Results for the full-year 2014 included 53 weeks while all other years were 52 weeks 2 – Refer to Section 11.3.2 and 10.3 of the Company’s Q4 and full-year 2016, 2015 and 2014 MD&A , respectively, for additional information on adjusted diluted EPS
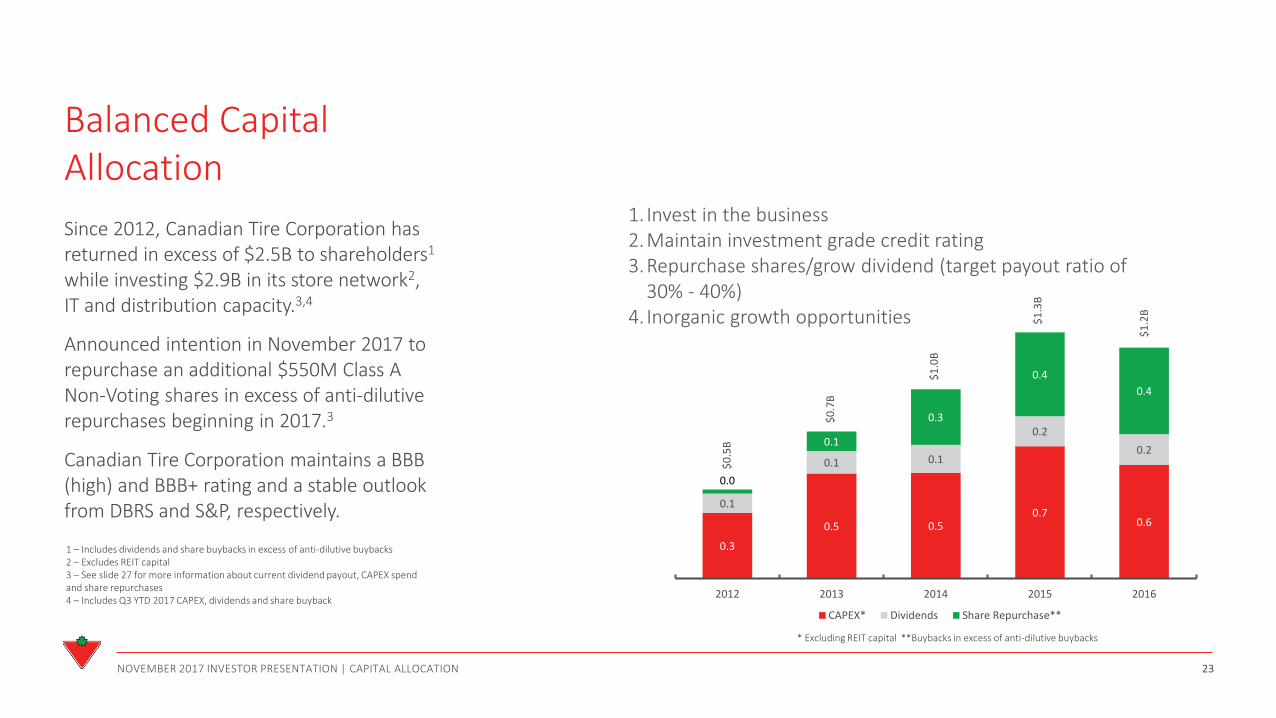
Balanced Capital Allocation
Since 2012, Canadian Tire Corporation has returned in excess of $2.5B to shareholders1 while investing $2.9B in its store network2, IT and distribution capacity.3,4
Announced intention in November 2017 to repurchase an additional $550M Class A Non-Voting shares in excess of anti-dilutive repurchases beginning in 2017.3
Canadian Tire Corporation maintains a BBB (high) and BBB+ rating and a stable outlook from DBRS and S&P, respectively.
NOVEMBER 2017 INVESTOR PRESENTATION | CAPITAL ALLOCATION 23
0.3
0.5 0.5 0.7
0.6
0.1
0.1 0.1
0.2
0.2
0.0
0.1
0.3
0.4
0.4
0.0
0.0
0.0
0.0
0.0
0.0
0.0
0.0
2012 2013 2014 2015 2016
CAPEX* Dividends Share Repurchase**
$0
.5B
$0
.7B
$1
.0B
$1
.3B
$1
.2B
1. Invest in the business 2.Maintain investment grade credit rating 3.Repurchase shares/grow dividend (target payout ratio of
30% - 40%) 4. Inorganic growth opportunities
1 – Includes dividends and share buybacks in excess of anti-dilutive buybacks 2 – Excludes REIT capital 3 – See slide 27 for more information about current dividend payout, CAPEX spend and share repurchases 4 – Includes Q3 YTD 2017 CAPEX, dividends and share buyback
* Excluding REIT capital **Buybacks in excess of anti-dilutive buybacks

Returning Value to Shareholders
Policy to maintain dividend payments equal to 30% to 40% of the prior year’s normalized basic net earnings1.
Member of S&P/TSX Canadian Dividend Aristocrats index.
0.7
2
0.8
2
0.8
4
0.8
4
1.1
0
1.2
0 1
.40
1.8
8 2
.10
2.3
0
2.6
0
2007 2008 2009 2010 2011 2012 2013 2014 2015 2016 2017
ANNUAL DIVIDENDS (C$)
NOVEMBER 2017 INVESTOR PRESENTATION | CAPITAL ALLOCATION 24
13.7% CAGR
1 – Payout range increased from 25% to 30% to 30% to 40% in November 2017, increasing the expected 2018 annual dividend by 38% to $3.60
1
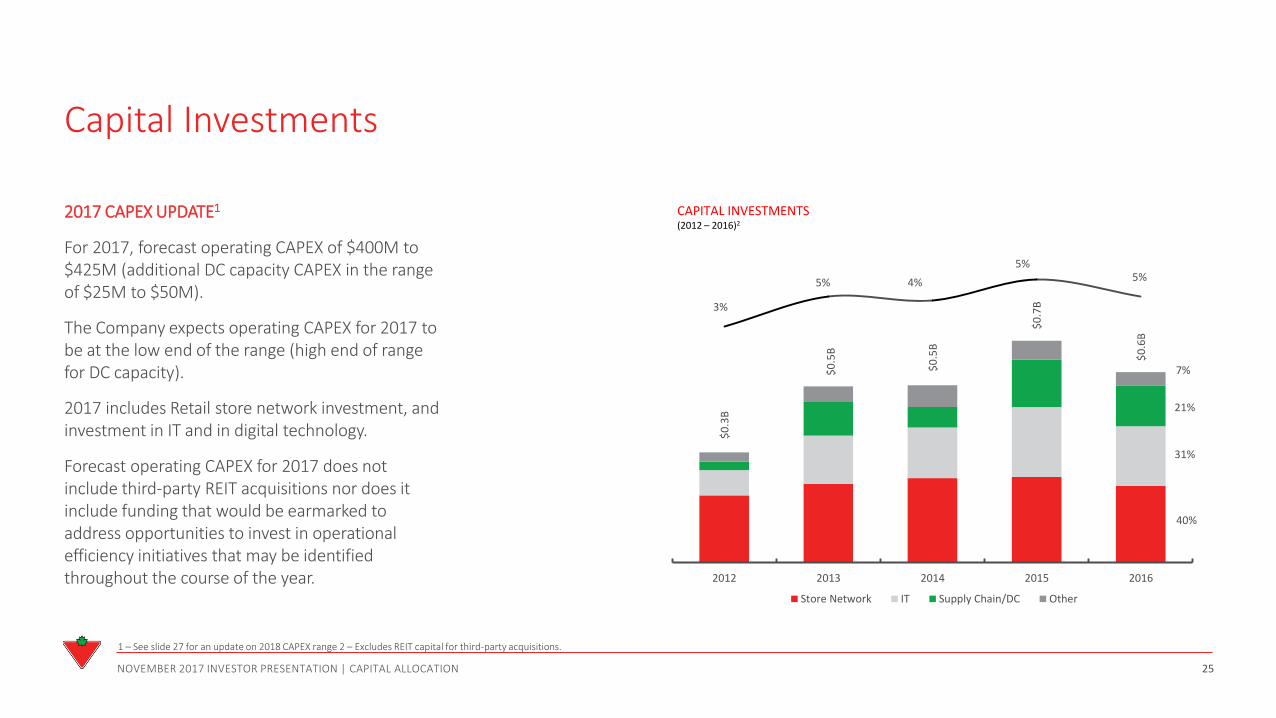
Capital Investments
2017 CAPEX UPDATE1
For 2017, forecast operating CAPEX of $400M to $425M (additional DC capacity CAPEX in the range of $25M to $50M).
The Company expects operating CAPEX for 2017 to be at the low end of the range (high end of range for DC capacity).
2017 includes Retail store network investment, and investment in IT and in digital technology.
Forecast operating CAPEX for 2017 does not include third-party REIT acquisitions nor does it include funding that would be earmarked to address opportunities to invest in operational efficiency initiatives that may be identified throughout the course of the year.
NOVEMBER 2017 INVESTOR PRESENTATION | CAPITAL ALLOCATION 25
40%
31%
$0
.3B
$0
.5B
$0
.5B
21%
$0
.7B
7%
$0
.6B
3%
5% 4%
5% 5%
-10%
-8%
-6%
-4%
-2%
0%
2%
4%
6%
8%
0
100
200
300
400
500
600
700
800
900
1,000
2012 2013 2014 2015 2016
Store Network IT Supply Chain/DC Other
CAPITAL INVESTMENTS (2012 – 2016)2
1 – See slide 27 for an update on 2018 CAPEX range 2 – Excludes REIT capital for third-party acquisitions.
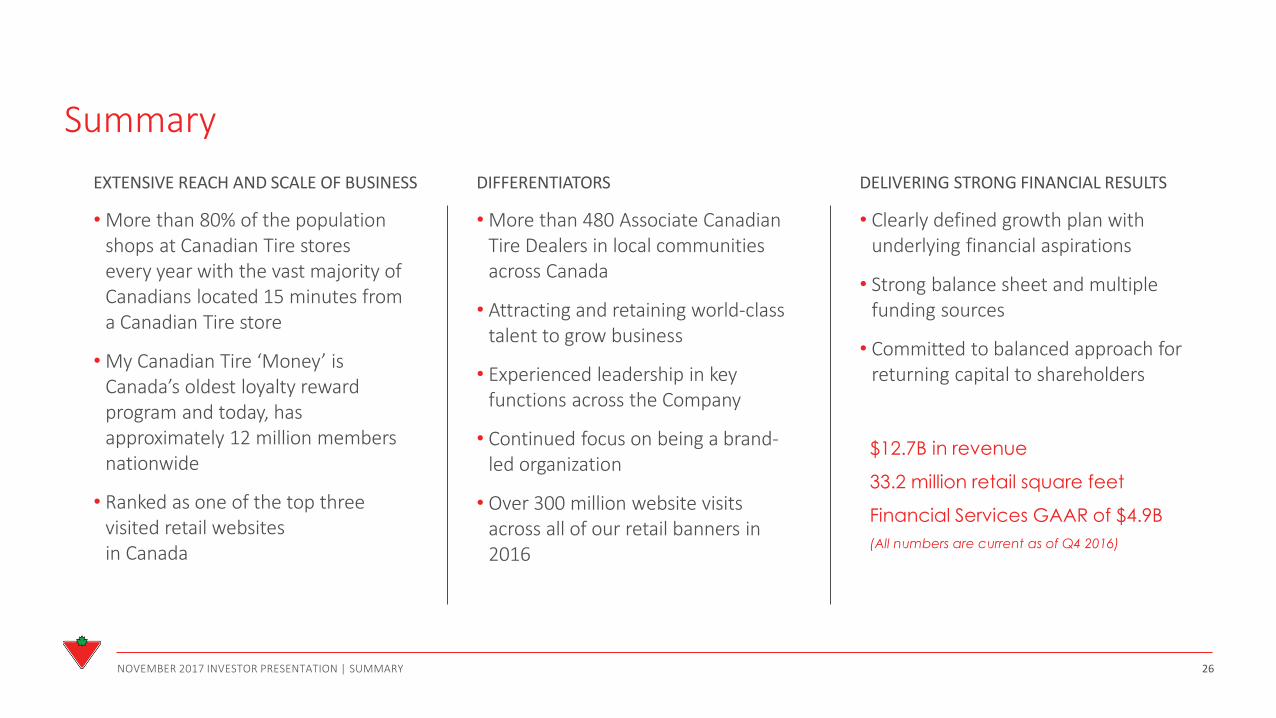
Summary
EXTENSIVE REACH AND SCALE OF BUSINESS
• More than 80% of the population shops at Canadian Tire stores every year with the vast majority of Canadians located 15 minutes from a Canadian Tire store
• My Canadian Tire ‘Money’ is Canada’s oldest loyalty reward program and today, has approximately 12 million members nationwide
• Ranked as one of the top three visited retail websites in Canada
NOVEMBER 2017 INVESTOR PRESENTATION | SUMMARY 26
DIFFERENTIATORS
• More than 480 Associate Canadian Tire Dealers in local communities across Canada
• Attracting and retaining world-class talent to grow business
• Experienced leadership in key functions across the Company
• Continued focus on being a brand-led organization
• Over 300 million website visits across all of our retail banners in 2016
DELIVERING STRONG FINANCIAL RESULTS
• Clearly defined growth plan with underlying financial aspirations
• Strong balance sheet and multiple funding sources
• Committed to balanced approach for returning capital to shareholders
$12.7B in revenue
33.2 million retail square feet
Financial Services GAAR of $4.9B
(All numbers are current as of Q4 2016)
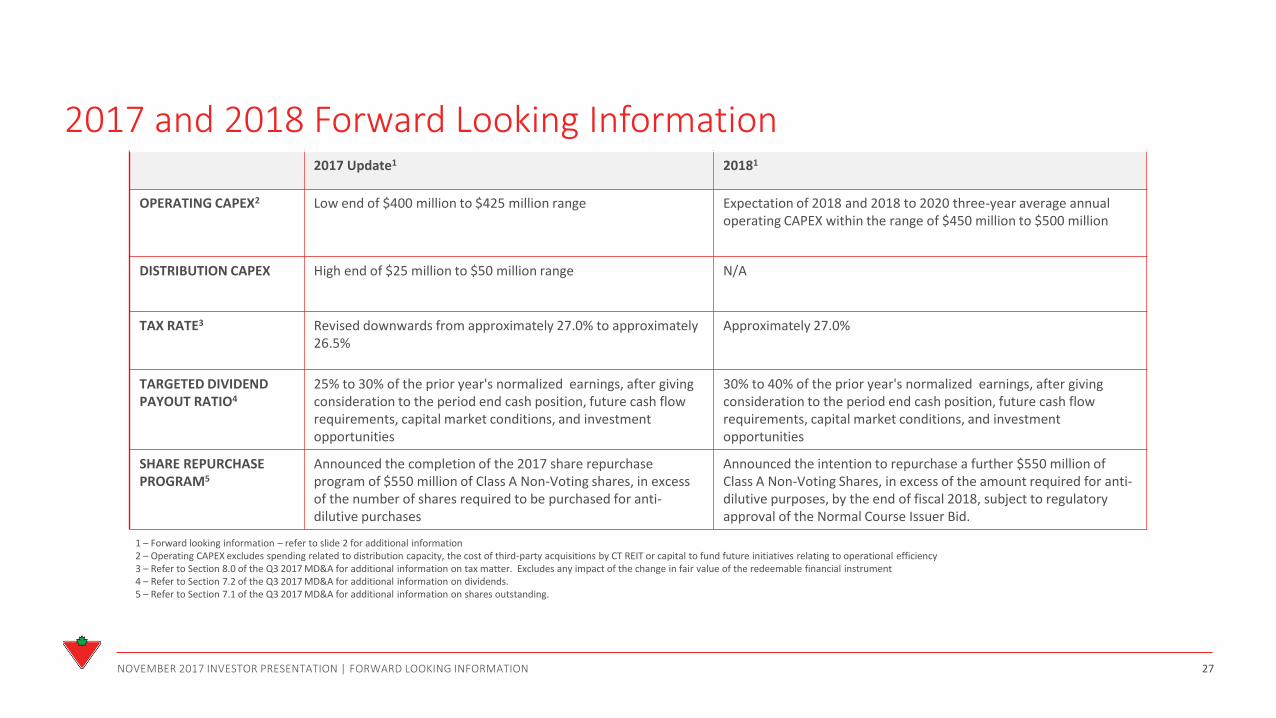
2017 and 2018 Forward Looking Information 2017 Update1 20181
OPERATING CAPEX2 Low end of $400 million to $425 million range Expectation of 2018 and 2018 to 2020 three-year average annual operating CAPEX within the range of $450 million to $500 million
DISTRIBUTION CAPEX High end of $25 million to $50 million range N/A
TAX RATE3 Revised downwards from approximately 27.0% to approximately 26.5%
Approximately 27.0%
TARGETED DIVIDEND PAYOUT RATIO4
25% to 30% of the prior year's normalized earnings, after giving consideration to the period end cash position, future cash flow requirements, capital market conditions, and investment opportunities
30% to 40% of the prior year's normalized earnings, after giving consideration to the period end cash position, future cash flow requirements, capital market conditions, and investment opportunities
SHARE REPURCHASE PROGRAM5
Announced the completion of the 2017 share repurchase program of $550 million of Class A Non-Voting shares, in excess of the number of shares required to be purchased for anti-dilutive purchases
Announced the intention to repurchase a further $550 million of Class A Non-Voting Shares, in excess of the amount required for anti-dilutive purposes, by the end of fiscal 2018, subject to regulatory approval of the Normal Course Issuer Bid.
NOVEMBER 2017 INVESTOR PRESENTATION | FORWARD LOOKING INFORMATION 27
1 – Forward looking information – refer to slide 2 for additional information 2 – Operating CAPEX excludes spending related to distribution capacity, the cost of third-party acquisitions by CT REIT or capital to fund future initiatives relating to operational efficiency 3 – Refer to Section 8.0 of the Q3 2017 MD&A for additional information on tax matter. Excludes any impact of the change in fair value of the redeemable financial instrument 4 – Refer to Section 7.2 of the Q3 2017 MD&A for additional information on dividends. 5 – Refer to Section 7.1 of the Q3 2017 MD&A for additional information on shares outstanding.
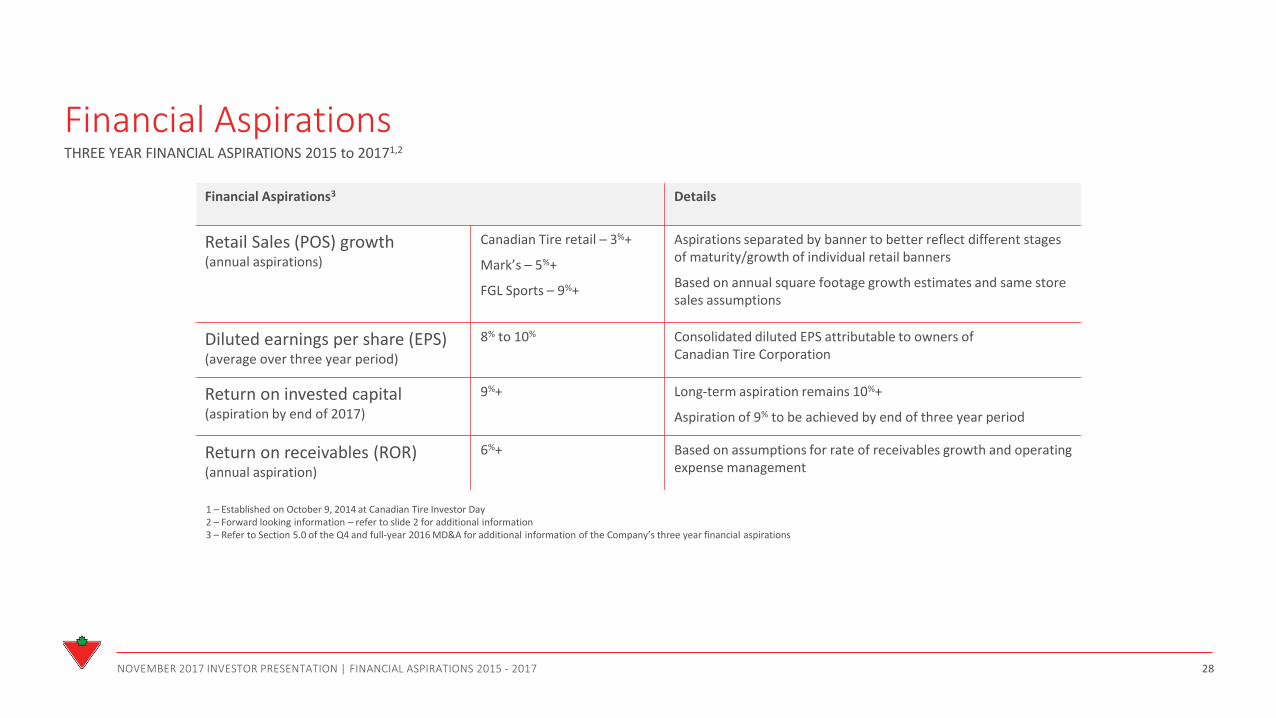
Financial Aspirations
Financial Aspirations3 Details
Retail Sales (POS) growth (annual aspirations)
Canadian Tire retail – 3%+
Mark’s – 5%+
FGL Sports – 9%+
Aspirations separated by banner to better reflect different stages of maturity/growth of individual retail banners
Based on annual square footage growth estimates and same store sales assumptions
Diluted earnings per share (EPS) (average over three year period)
8% to 10% Consolidated diluted EPS attributable to owners of Canadian Tire Corporation
Return on invested capital (aspiration by end of 2017)
9%+ Long-term aspiration remains 10%+
Aspiration of 9% to be achieved by end of three year period
Return on receivables (ROR) (annual aspiration)
6%+ Based on assumptions for rate of receivables growth and operating expense management
NOVEMBER 2017 INVESTOR PRESENTATION | FINANCIAL ASPIRATIONS 2015 - 2017 28
THREE YEAR FINANCIAL ASPIRATIONS 2015 to 20171,2
1 – Established on October 9, 2014 at Canadian Tire Investor Day 2 – Forward looking information – refer to slide 2 for additional information 3 – Refer to Section 5.0 of the Q4 and full-year 2016 MD&A for additional information of the Company’s three year financial aspirations

Financial Aspirations
Financial Aspirations3 Select Material Assumptions3
Consolidated Same Store Sales Growth (excluding Petroleum) (annual aspirations)
3%+ Customer base will grow across all banners utilizing a One Company for One Customer strategy
Each individual business unit expected to contribute positively to aspiration
Diluted earnings per share (EPS) (average annual increase over three year period)
10%+ Successful rollout of operational efficiency programs and initiatives
No major changes to the Company’s financial leverage and capital allocation approach
Return on invested capital (aspiration by end of 2020)
10%+ Realization of Consolidated Same Store Sales Growth and Average Annual Diluted EPS Growth aspirations
NOVEMBER 2017 INVESTOR PRESENTATION | FINANCIAL ASPIRATIONS 2018 – 2020 29
THREE YEAR FINANCIAL ASPIRATIONS 2018 - 20201,2
1 – Established on November 9th, 2017 2 – Forward looking information – refer to slide 2 for additional information 3 – Refer to Section 13.0 of the Q3 2017 MD&A for additional information of the Company’s three year financial aspirations
Thank You