csr activities and internal capital markets: evidence from ... · internal capital markets in...
TRANSCRIPT
1
CSR Activities and Internal Capital Markets: Evidence from Korean
Business Groups
Abstract
This study examines the effect of business group structure on corporate
social responsibility (CSR) performance in Korean firms. We find that
chaebol affiliation is on average positively related to CSR performance. We
attribute this phenomenon to two main elements: CSR corporate foundations
(or headquarters) and a spillover effect within the chaebol business group.
By contrast, family control is found to be negatively associated with CSR
performance. Furthermore, we find a positive relation between CSR
performance and firm value measured by Tobin’s Q. Our results suggest that
CSR headquarters seem to play an important role in improving CSR
performance through the efficient allocation of internal resources. Finally,
group-level financial donations, an important CSR activity, seem to have a
spillover effect on CSR performance within the business group. This result is
consistent with internal capital markets being efficiently utilized by Korean
business groups.
Keywords: business group, financial donations, internal capital market, corporate
social responsibility
JEL Classification Codes: G32, G34, M14

2
1. Introduction
Business groups have attracted much attention in the literature because of their
prevalence globally (Almeida et al., 2011; Campopiano and De Massis, 2015; Manikandan
and Ramachandran, 2015) and the dominant role they play in the economy (Khanna and
Yafeh, 2007). In emerging countries in particular, business groups contribute to the public by
investing in a range of financial and technological public investments in communities or
regions (Matten and Moon, 2008). Extending the efficient internal capital market hypothesis
in Stein (1997), it is argued that group headquarters may play a critical role in allocating
internal resources efficiently in internal capital markets based on group-level initiatives (Ray
and Chaudhuri, 2018).
Through diversified and well-coordinated investments orchestrated by the corporate
headquarters, Korean business groups called chaebols are well known to dominate the market
share in various industries in Korea. The significant involvement of their headquarters in the
area of corporate social responsibility (CSR) is no exception. Four major business groups
(Samsung, Hyundai Motors, LG, and SK) have led CSR activities in Korea. According to a
report by the Community Chest of Korea,1 which is the largest specialized fundraising and
allocation institution, these four major business groups were responsible for approximately 35%
of corporate donations in 2017.2 Furthermore, unlike conventional investments, CSR
investments are known to increase reputation or social capital by building investor trust.
Wang et al. (2011) use the 2008 melamine contamination incident to show that institutional
1 The Community Chest of Korea is a law-based (The Community Chest of Korea Act, 1997) and
specialized fundraising and allocation institution. It fosters a society without poverty, illness, and
discrimination. It is a national organization with a federation and branches across 17 cities and
provinces. 2 Total corporate donations to the Community Chest of Korea at the end of 2017 amounted to 285.5
billion Korean won, with large donations from the Samsung group (50 billion Korean won), Hyundai
Motors group (25 billion Korean won), SK group (12 billion Korean won), and LG group (12 billion
3
investors prefer high CSR firms to low CSR firms after negative events. Similarly, Lins et al.
(2017) show that during a financial crisis, stock prices fall significantly less for firms with
high CSR performance than for firms with a low CSR index because of the presence of
investor trust in the former.
The literature has focused on the CSR activities of individual firms and their impact
on the firm’s financial performance and social value. For instance, when several independent
firms (e.g., business groups) can coordinate and reallocate the aggregate CSR resources of all
these firms more efficiently, can these firms as a group generate better overall CSR
performance? We answer this question by extending the analysis from firm-level to group-
level CSR performance from the perspective of internal capital markets. As argued by Choi et
al. (2018a), CSR behavior and its impact in a business group would be quite different from
those in independent and unaffiliated firms.3 Thus, we contribute to the CSR literature on the
relation between business group structures and CSR performance, using unique Korean
business group data.
We focus on three important mechanisms unique to Korean business groups: a
powerful CSR headquarters and family control. First, CSR headquarters can improve a
business group’s efficiency in resource allocation, including CSR investment, through
“winner-picking” (Stein, 1997), cost-effective and efficient investments (Almeida et al., 2011;
Masulis et al., 2011), and a co-insurance effect that reduces the cost of external financing
(Byun et al., 2013) utilizing the internal capital market.4
Korean won). 3 Choi et al. (2018a) focus on the effect of ownership disparities and negative externalities among
member firms in a business group. Instead, we focus on the positive externality in business groups
and consider the impact of the dark side of the internal capital market on CSR activities, namely the
effect of family control. 4 Previous studies have confirmed that internal capital markets have both bright and dark sides. For
example, Scharfstein and Stein (2000) discuss the negative effects of internal capital markets caused

4
Second, we examine the spillover effect of CSR activities throughout a business
group. Through the internal capital market in business groups, a firm can improve its social
capital not only from its own CSR activities but also from other affiliates’ activities.
Specifically, we employ financial donations as one of the most important and verifiable CSR
activities because they can be measured relatively easily from financial statements compared
with other CSR components such as the environment or human rights. Card et al. (2010)
show that the allocation and recordkeeping of non-cash donations cannot be tracked clearly.
Importantly, Pyo and Lee (2013) argue that financial donations are a good proxy for
managerial willingness to engage in CSR activities.5
Third we explore the relation between family control and CSR performance in
business groups. El Ghoul et al. (2016) argue that the relation between family control and
CSR performance is an empirical question based on the contradictory theories of the
expropriation view and the reputation and long-term horizon view, in that firm structure,
managerial objectives, and other serious managerial issues reflect family owners’ various
interests that might determine CSR performance.
In this study, we use the KEJI (Korea Economic Justice Institute) index as a proxy for
Korean firms’ CSR performances following Oh et al. (2011) and Chang et al. (2017). By
by divisional rent-seeking and inefficient investments and Joh (2003) shows the inefficiency of
internal capital markets in Korean business groups. In addition, Kim (2016) illustrates the negative
effects of group leverage as a sign of the lack of internal capital market resources. On the contrary,
Billett and Mauer (2003) find that the internal capital market provides capital for good investment
opportunities in segments with financial constraints and Shin and Park (1999) show that internal
capital markets reduce chaebols’ financial constraints. Khanna and Palepu (2000) argue that business
groups in emerging markets facilitate efficient internal labor markets through their intermediary role
in exchanging labor forces across the diversified groups. 5 Pyo and Lee (2013) find a positive correlation between the donation amount and earnings quality,
implying a positive relation between donation expenses and CSR performance, as earnings quality
depends on corporate integrity. Margolis and Walsh (2003) also show a positive association between
firms’ social performance and their financial performance, using 127 empirical studies published from
1972 to 2002.
5
using a sample of firms listed in a KEJI index from 2005 to 2011, we find that business group
affiliates have significantly higher KEJI indices than other independent firms after controlling
for other firm-specific characteristics. Furthermore, by using corporate foundation data from
the Federation of Korean Industries’ (FKI) CSR white papers, we find that the CSR
performance of firms with a corporate CSR headquarters is greater than those without a
corporate headquarters (or foundations). We also find that a firm’s CSR performance is
positively related to its own as well as other affiliates’ financial donations within the same
business group, which indicates a spillover effect in the internal capital market. We also find
that family control has a negative association with CSR performance, indicating the potential
expropriation of minority shareholders. We further find a positive relation between CSR
performance and Tobin’s Q, which is consistent with the literature that CSR activities are
generally positively related to firm value (Choi et al., 2018a; Deng et al., 2013; El Ghoul et
al., 2011). Lastly, we conduct a robustness test by using other CSR ranking variables, the
ESG (environmental, social, and governance) ranking, and different periods from 2011 to
2016. We also use two-stage least squares (2SLS) and propensity score matching (PSM) to
address potential endogeneity issues. The results of these robustness tests are consistent with
our hypotheses that CSR activities including financial donations build social capital, which
may improve firm value.
The remainder of this paper is structured as follows. Section 2 provides a literature
review, discusses CSR activities in Korea, and develops the hypotheses. Section 3 describes
the samples and descriptive statistics. Section 4 reports the empirical findings. Section 5
discusses the robustness test results and Section 6 concludes the paper.
6
2. Literature Review and Hypotheses Development
In our study, CSR headquarters are defined as the CSR departments in the
headquarters of a business group that manage group-level CSR activities. We hypothesize
that the existence of a corporate foundation increases the efficiency of CSR activities in a
business group. Recently, demand for professional CSR expertise to conduct CSR activities
has increased (Saeidi et al., 2015; Yoon et al., 2006) because CSR-related activities have
become diverse and complex. For example, the guidance for CSR published by the
International Organization for Standardization (ISO) contains seven core subjects, namely
organizational governance; human rights; labor practices; the environment; fair operating
practices; consumer issues, and community involvement and development, with 37 issues and
282 related actions and expectations. Stein (1997) and Hovakimian (2011) argue that an
informed top person or headquarters must allocate internal resources through internal capital
markets. Likewise, the existence of a CSR headquarters also can increase the efficiency of the
CSR investments of each group-affiliated firm through their specialty and experiences.
It is not surprising that most business groups’ corporate foundations are controlled by
their headquarters. For example, the Samsung group has an organization named Samsung
Corporate Citizenship, which controls the entire group’s CSR activities and expenditures
systematically through 103 volunteer centers and 5,320 voluntary teams within the group.
Accordingly, if a business group’s CSR is efficiently orchestrated by a specialized CSR
organization, the effect is expected to be correlated positively with the CSR performance of
the group-affiliated firms. However, few studies have examined the business group-wide
functioning of CSR activities as an efficient tool for firms’ CSR performance and the need for
a professional and strategic approach to CSR activities. Thus, we propose the following
7
hypotheses:
H1-1: The CSR performance of chaebol-affiliated firms is greater than that of
unaffiliated firms.
H1-2: The CSR performance of chaebol-affiliated firms with corporate foundations in
the business group is greater than that of firms without such corporate foundations.
Next, we analyze the effect of financial donations on CSR performance in business
groups. As mentioned in the Introduction, financial donations are an important measure of
CSR activities because they are related directly to firms’ cash flows. Furthermore, Chen et al.
(2015) suggest that high philanthropic expenditure enhances reputations among stakeholders.
Gao et al. (2012) also find that donor firms showed high abnormal returns around the May 12,
2008 Wenchuan earthquake in China.
Furthermore, it has been argued that business groups have active internal capital
markets, especially in Korea. For example, Lee et al. (2009) and Choi et al. (2018b) show
that other affiliated firms’ cash flows (other cash flow) within the business group affect a
firm’s investment sensitivity significantly, implying the existence of internal capital markets.
Consistent with this finding, Khanna and Yafeh (2007) argue that business groups can use
internal product and labor markets in addition to capital markets. One major advantage of the
internal market is that social investment at the level of the individual firm or group can affect
all other affiliated member firms. Specifically, Sung et al. (2016) suggest that business group-
affiliated firms collaborate with each other closely to enhance the group-level brand. Choi et
al. (2018a) also argue that CSR activities enhance reputation or social capital, which benefits
the business group. Similarly, we argue that a firm’s own donations as well as those of other
affiliated firms increase its CSR performance. That is, we suggest that the reputation or social
8
capital accumulated by the CSR activities of all group-affiliated firms is shared. Therefore,
we propose the following research hypotheses:
H2-1: There is a positive relation between a firm’s donations and its CSR
performance.
H2-2: There is a positive relation between a firm’s CSR performance and the
donations of other affiliated firms within the same business group.
H2-3: Chaebol-affiliated firms moderate the relation between a firm’s donations and
its CSR performance.
Third, Choi et al. (2018a) and Campopiano and De Massis (2015) argue that
controlling family owners of these business groups have been known to expropriate minority
shareholders’ wealth through CSR investments. In Korea, in particular, although business
groups are well diversified across various industries, the controlling shareholders have a
significant influence over all member firms compared with the family firms in other countries
(Bae et al., 2008; Khanna and Yafeh, 2007; Moskalev and Park, 2010). As a result, for some
business groups, internal CSR resources are systematically orchestrated by the headquarters’
CSR policies and strategies, yet these activities may also reflect the interests of controlling
shareholders who are related to founding families. In this regard, Choi et al. (2018a) suggest
that the CSR activities of group-affiliated firms are motivated by group-level as well as firm-
specific considerations. In addition, McWilliams and Siegel (2001) argue that managerial
discretion is likely to influence social investments more significantly than other essential
investments. Therefore, CSR investments are an appropriate experimental setting for testing
the strategic intentions and consequences of a business group’s headquarters and controlling
shareholders.
Currently, the literature shows mixed evidence on the relation between family control
9
and CSR performance (Bingham et al., 2011; Déniz and Suárez, 2005).6 Lamb and Butler
(2016) show that family ownership and a family CEO have a positive effect on CSR strength
based on stewardship theory and the socioemotional wealth perspective.7 Block and Wagner
(2014) subcategorize the CSR score into several dimensions and show that family ownership
has a positive effect on the diversity-, employee-, environment-, and product-related CSR
sub-scores, whereas it has a negative influence on the community-related CSR sub-scores. El
Ghoul et al. (2016) find a negative relation between CSR performance and family-controlled
firms, which is consistent with the expropriation hypothesis. Oh et al. (2011) and Choi et al.
(2018a) also support the expropriation hypothesis in that the ownership of top managers and
ownership disparity of Korean business groups have a negative impact on CSR performance.8
As discussed previously, we contribute to the literature by focusing on the effect of
family control through the family members involved in management (e.g., CEO, board of
directors). First, we examine the effect of family control on Korean firms in general without
considering chaebol affiliation. Second, we consider how family control affects CSR
performance in chaebol compared with in non-chaebol firms. Family business groups consist
of the affiliates owned directly by an individual family owner and those owned by the
affiliates of the same business group.9 In addition to family control, many Korean business
6 Kao et al. (2018) show that the difference in the CSR effect between state-owned enterprises and
non-state-owned enterprises is caused by managers’ various motivations. 7 Lamb and Butler (2016) state, “Socioemotional wealth is defined as the amount of affect and value
family owners receive from their investment in the firm. Socioemotional wealth comes in different
shapes and forms, such as prestige, family dynasty and belongings” (p. 3). 8 Almeida et al. (2011) suggest that the pyramidal ownership structure allows family members to
control the group and expropriate minority shareholders even though they have few cash flow rights
compared with control rights. Thus, this conflict of interest between family owners (controlling
shareholders) and minority shareholders may cause expropriation by family members, which may also
affect CSR policy and performance. 9 The largest shareholders in a non-family business group include financial institutions, governments,
state-owned firms, non-profit organizations, and foreign firms, such as in the POSCO (Pohang Iron
and Steel Company) and KEPCO (Korea Electric Power Corporation) groups.
10
groups are controlled by single representative individual owners who have strong power over
the entire group of firms.10
Although Claessens et al. (2000) find that more than two-thirds of
2,980 public firms in nine East Asian countries are controlled by a single individual owner,
the previous literature has not investigated individual group owners’ influence on CSR
activities. Therefore, we examine the following hypotheses on the effect of family control,
family-controlled business groups, and individual family owners, respectively:
H3-1: Family firms have lower CSR performance than do non-family firms.
H3-2: Family-controlled business groups have lower CSR performance than do non-
family-controlled business groups.
H3-3: Firms with individual family owners have lower CSR performance than firms
without individual family owners.
Lastly, we examine the relationship between CSR score and firm performance. This
test is useful because some CSR activities may be intended to increase managerial private
benefits instead of enhancing overall firm value (or shareholders’ wealth). The prior literature
has shown that CSR performance is positively associated with firm performance (Cochran
and Wood, 1984; Deng et al., 2013; El Ghoul et al., 2011). Recently, studies have shown that
high CSR firms have higher profitability, growth, and sales per employee (Lins et al., 2017)
and Tobin’s Q (Choi et al., 2018a) compared with low CSR firms. Thus, we hypothesize that
the CSR performance of Korean firms is positively associated with firm performance
measured by Tobin’s Q:
10
For example, the Samsung group has an individual family owner, Kunhee Lee. He directly owns
stocks of Samsung Electronics, making it an affiliate with an individual family owner. By contrast,
Samsung SDI is owned by Samsung Electronics, meaning Samsung SDI is an affiliate without an
individual family owner. Lastly, the POSCO group is not owned by a specific individual owner and is
thus a non-family business group.
11
H4: There is a positive relation between a firm’s CSR performance and overall
performance.
3. Data and Descriptive Statistics
To test our research hypotheses, we use public firms listed on the Korea Composite
Stock Price Index (KOSPI) from 2005 to 2011. In particular, we collect KOSPI firms that are
part of the KEJI CSR index and have financial and ownership data. We also conduct a
robustness test on our hypotheses by using ESG research data for a different sample period,
2011 to 2016. We exclude firms that do not have financial data available and those classified
as financial institutions such as banks and securities, insurance, and credit card companies. In
addition, we collect chaebol and board data from the Korea Fair Trade Commission (KFTC).
Our final sample consists of 1,190 firm-year observations: 367 for chaebol affiliates and 823
for non-chaebol firms. We collect the sample firms’ financial and ownership data from the
TS2000 and FN DataGuide.11
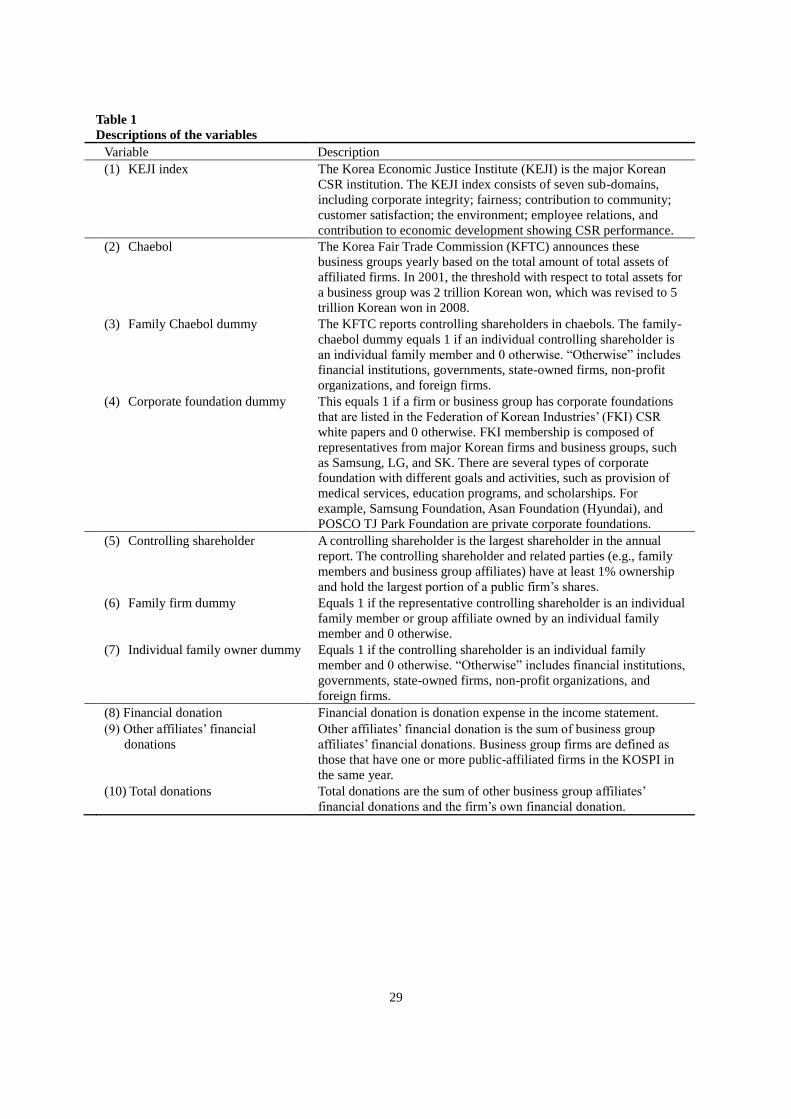
Table 1 reports the main variables of the study. Variable (1) describes the KEJI index,
which is a measurement of the CSR scores in Korea. The KEJI index consists of seven sub-
domains: corporate integrity, fairness, contribution to community, customer satisfaction, the
environment, employee relations, and contribution to economic development. Variables (2)–
(4) are business group structures. Variable (2), the chaebol dummy, shows the KFTC’s
classification for business groups in Korea. In 2001, the KFTC classified groups of firms with
total assets of more than two trillion Korean won as chaebols. (In 2008, the KFTC revised the
11
Several previous studies have used the TS2000 and FN DataGuide to collect financial and
ownership data. For example, Black et al. (2006) and Kang and Kim (2006) used the TS2000. The FN
DataGuide is a useful database similar to Thomson Reuters DataStream. Recent financial studies have
often used this database to collect annual financial data and stock prices in Korea. Examples include
Lee et al. (2009), Choe and Yang (2010), Joh and Jung (2012), Han and Kwon (2015), and Kwon et al.
(2016) used this database for studies in Korea.
12
asset limit to five trillion Korean won.) In particular, family chaebols, variable (3), are those
with individual family-controlled shareholders. Thus, chaebols include both family and non-
family chaebols. Non-family chaebol firms’ controlling shareholders include financial
institutions, governments, state-owned firms, non-profit organizations, and foreign firms.
Similarly, as shown in variable (4), some business groups have corporate foundations that
provide social and education programs. By using the Federation of Korean Industries’ (FKI)
CSR annual report, we distinguish firms with corporate foundations from other firms without
those foundations.
Variables (5)–(7) describe the family-related factors used in this study. As variable (5)
indicates, firms that trade publicly in Korea announce a single representative controlling
shareholder officially in their annual reports. Representative controlling shareholders include
family and non-family shareholders. Variable (6) is a dummy that indicates whether a firm’s
representative controlling shareholder is an individual family or a group affiliate owned by an
individual family member. Variable (7) indicates whether the controlling shareholder is an
individual family member. Lastly, by using variables (8)–(10), we measure the financial
donations reported in income statements. Variable (8) is each firm’s financial donations and
variable (9) is the sum of other business group affiliates’ financial donations. Finally, variable
(10) is the sum of other business group affiliates’ financial donations and the firm’s own
financial donations.
[Insert Table 1 here]
Table 2 reports the annual distribution of the sample firms by different characteristics.
Panel A shows the annual distribution of the number of firm observations sub-categorized by

13
chaebol and non-chaebol firms. The average annual number of firms is around 198. Panel B
reports the industry distribution, indicating that both chaebol and non-chaebol firms are
diversified well across all industries. The industry classification is based on the Korea
Securities Computing Corporation’s (KOSCOM) industry classification provided by the
Korea Exchange (KRX).
[Insert Table 2 here]
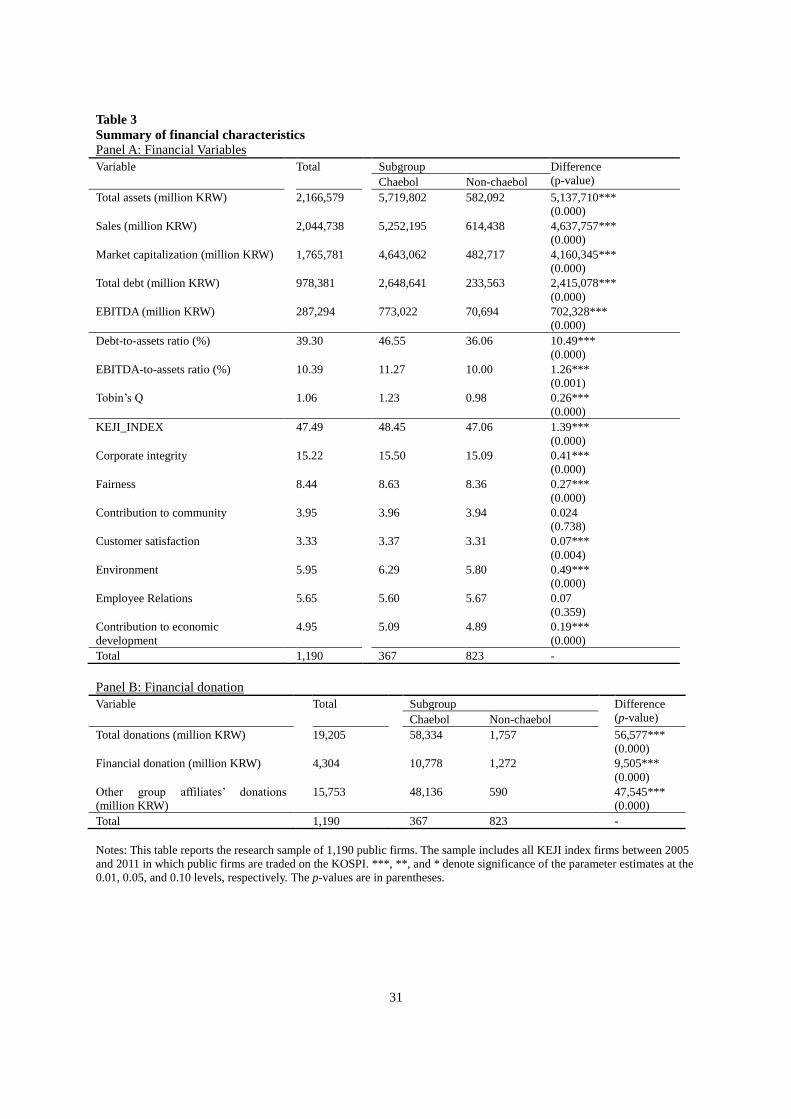
Table 3 reports the financial variables sub-categorized according to chaebol and non-
chaebol firms. Panel A shows that chaebol affiliates’ size is significantly larger than that of
non-chaebol firms in terms of total assets, sales, total market capitalization, total debt, and
higher earnings before interest, tax, and depreciation, and amortization (EBITDA). Chaebol
affiliates demonstrate a higher debt-to-total-assets ratio, EBITDA-to-total-assets ratio, and
investment opportunities (Tobin’s Q). Chaebol affiliates have a higher KEJI index than do
non-chaebols. However, some sub-indices do not differ statistically significantly, such as the
contributions of community and employee relations. Lastly, in Panel B, we show the
difference in the financial donations between chaebol and non-chaebol firms. The average
financial donation by chaebol affiliates is approximately 11 billion Korean won, whereas that
for other group affiliates is 48 billion Korean won. Further, a chaebol firm’s donation is
approximately nine times larger, on average, than that of non-chaebol firms (10.8 billion vs.
1.3 billion Korean won).
[Insert Table 3 here]
14
4. Empirical Results
We use the KEJI index as a proxy for the CSR ratings of Korean firms following Oh
et al. (2011) and Chang et al. (2017). Our empirical analyses are divided into four parts: the
first investigates the way in which business group structure and corporate foundations affect
group-affiliated firms’ CSR performance; the second examines the effect of donation amount
on a firm’s CSR rating; the third shows the way in which family control affects the CSR
ratings in the interaction with chaebol affiliation; and the fourth examines the impact of CSR
performance on firm value.
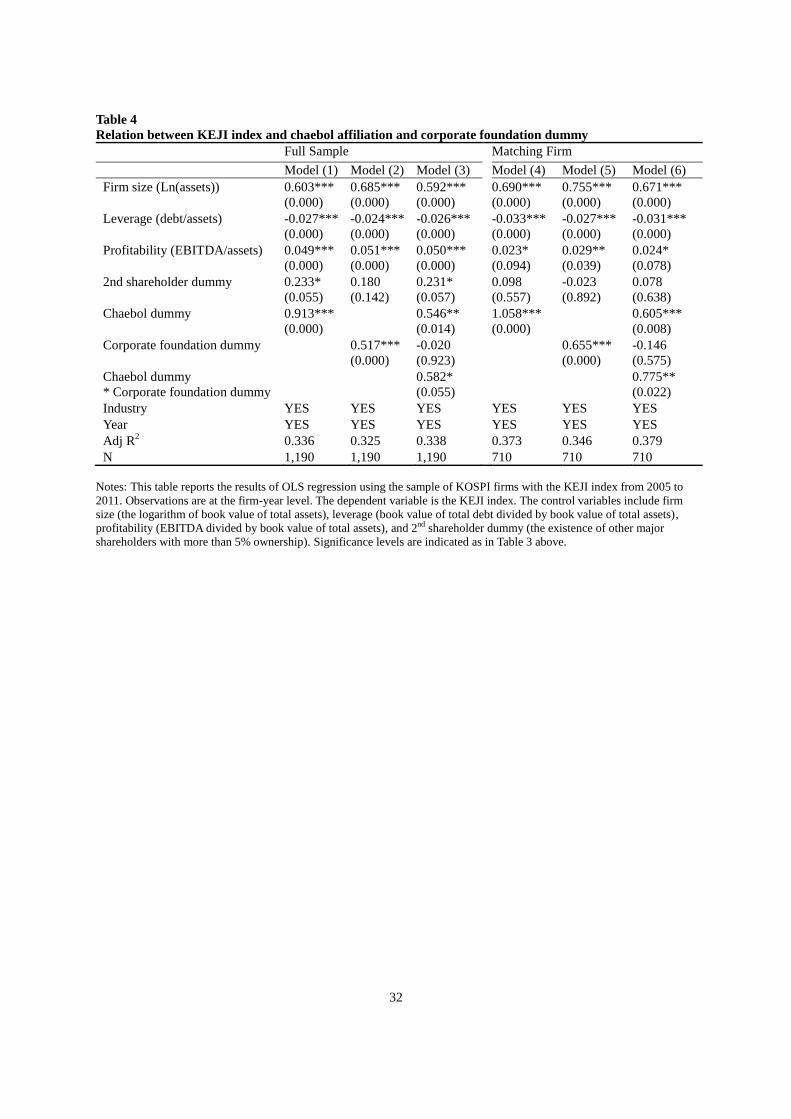
As shown in Model (1) in Table 4, chaebol-affiliated firms have significantly higher
CSR scores compared with those of non-chaebol-affiliated firms, as indicated by the positive
significant coefficient of the chaebol dummy at the 1% level. This finding is consistent with
Hypothesis H1-1 that firms affiliated with business groups have higher CSR scores because
of their group-level coordination of CSR activities. This result also supports Stein’s (1997)
efficient internal capital market hypothesis: a group’s headquarters can allocate internal
resources efficiently because of its information advantage. Another possible explanation is
that chaebol-affiliated firms share accumulated reputation capital through the CSR activities
of all group-affiliated firms. From this perspective, because the effect of the CSR activities of
one firm spills over to other affiliated firms’ CSR activities, chaebol-affiliated firms generally
have higher CSR performance than non-chaebol firms.
Next, we examine the role of CSR headquarters that coordinate CSR activities in
business groups. Corporate foundations with CSR experts can increase the efficiency of
diverse CSR investments. To save costs, group-affiliated firms may share expertise rather
than having experts in each firm. The results of Model (2) in Table 4 show that firms with

15
corporate foundations have a 0.517-point higher CSR score than those without foundations.
Moreover, as shown in Model (3), the interaction term between chaebol affiliation and the
corporate foundation dummy has a significantly positive relation with CSR ratings at the 10%
significance level. These empirical results suggest that corporate foundations comprising a
group of CSR experts play an important role in improving the effectiveness of CSR
performance in business groups, which supports Hypothesis H1-2.
Some may argue that the results for chaebol-affiliated firms may be caused by other
characteristics rather than chaebol affiliation itself. Therefore, we select matching non-
chaebol firms that have characteristics similar to the chaebol-affiliated firms in the sample.
Specifically, we use three factors—year, industry classification, and total assets—to select
control firms that match chaebol firms. Thus, matched firms are selected from among non-
chaebol firms that have CSR scores in the same year and industry classification as well as
total assets that are the closest to those of the matching chaebol firms. Next, we perform the
same regression used in Models (1)–(3) with the chaebol-affiliated firms and corresponding
matching firms from the sample of non-chaebol firms. Models (4)–(6) report the empirical
findings of these matching firms, showing that the results are similar to those in Models (1)–
(3). Therefore, we suggest that chaebol affiliation itself, not firm characteristics, has
significant effects on CSR performance.
[Insert Table 4 here]
Table 5 shows the effect of financial donations on CSR scores. Pyo and Lee (2013)
argue that the amount of a firm’s donation is a good proxy for CSR performance because it
shows a firm’s CSR intentions directly and objectively compared with other CSR components
16
such as the environment and corporate governance. Therefore, we explore whether a firm’s
CSR score is affected not only by its own financial donation, but also by the financial
donations from other affiliated firms within the same business group. We expect to observe
this spillover effect when the headquarters allocates internal resources, including financial
donations, actively within its business groups. The results of Model (1) in Table 5 show that a
firm’s donation ratio affects its CSR score positively at the 1% significance level. This result
is consistent with Hypothesis H2-1 that financial donations are a good proxy for social
investment and positively related to CSR performance. More importantly, although the result
of Model (2) is insignificant, that of Model (3) shows that the group-level donation ratio also
has a significant and positive relation with firms’ CSR performance at the 1% level.
Additionally, in Models (4)–(6), we analyze the chaebol dummy’s moderating effect
on CSR scores for each financial donation variable. We find that the interaction between the
group-level donation ratio and chaebol dummy has a positive and significant relation with
CSR scores at the 1% level, as shown in Model (4), and that the interaction terms in Models
(5) and (6) are also significant at the 1% level. In particular, the significant interaction
coefficient on a chaebol’s other affiliates’ donations captures the positive effect of the internal
capital market that chaebol groups utilize. That is, financial donations from other affiliates
positively contribute to higher CSR performance only in chaebol-affiliated firms. Overall, it
seems that the CSR financial investments of chaebol-affiliated firms at the group level may
influence (or spill over to) all firms’ CSR performance within the same business group,
supporting Hypothesis H2-2.
[Insert Table 5 here]
17
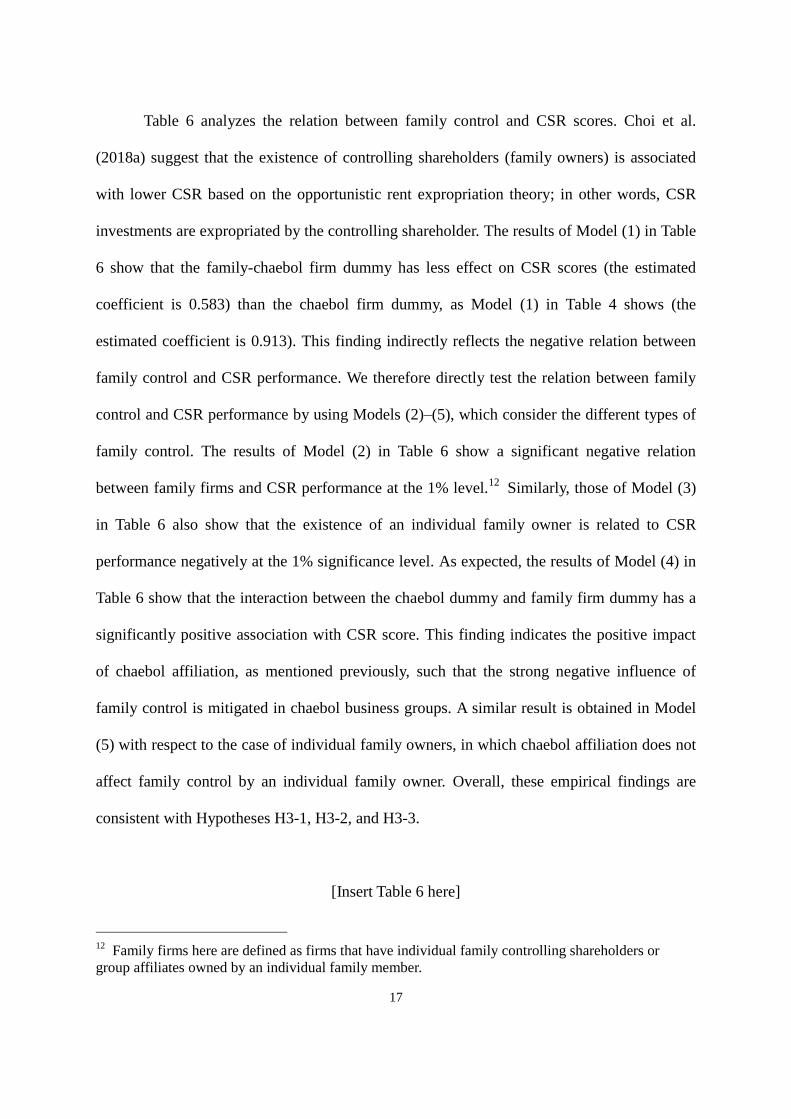
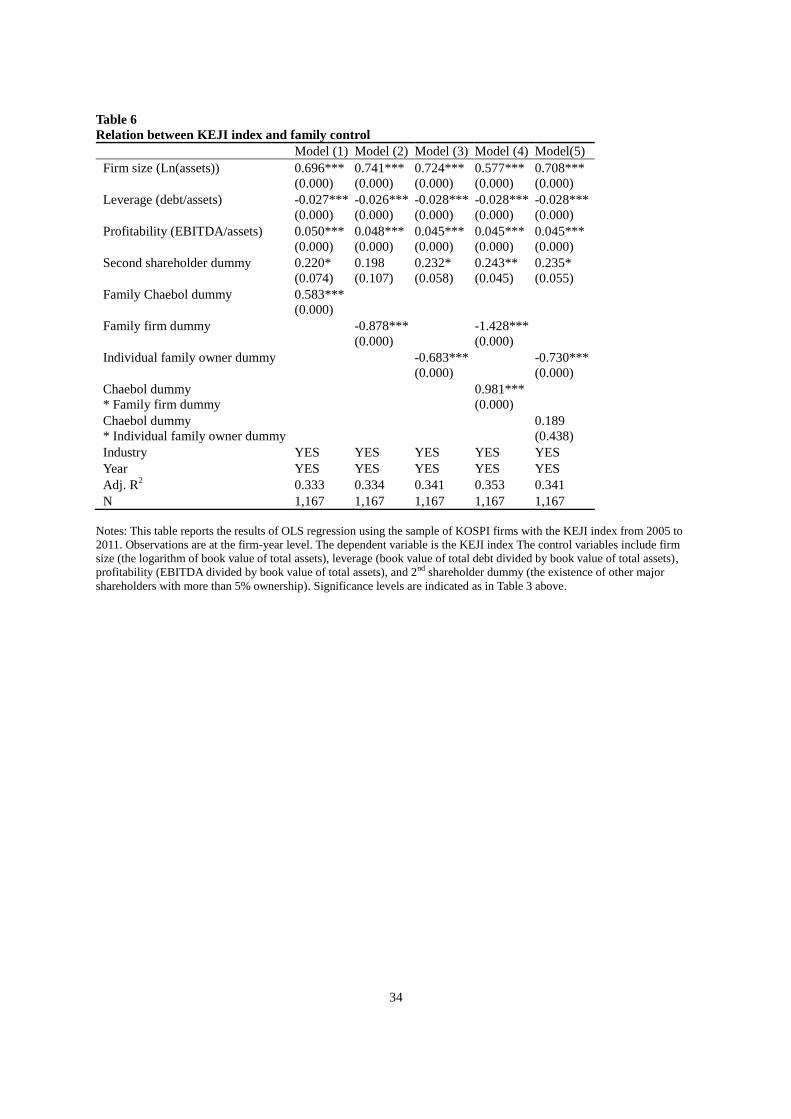
Table 6 analyzes the relation between family control and CSR scores. Choi et al.
(2018a) suggest that the existence of controlling shareholders (family owners) is associated
with lower CSR based on the opportunistic rent expropriation theory; in other words, CSR
investments are expropriated by the controlling shareholder. The results of Model (1) in Table
6 show that the family-chaebol firm dummy has less effect on CSR scores (the estimated
coefficient is 0.583) than the chaebol firm dummy, as Model (1) in Table 4 shows (the
estimated coefficient is 0.913). This finding indirectly reflects the negative relation between
family control and CSR performance. We therefore directly test the relation between family
control and CSR performance by using Models (2)–(5), which consider the different types of
family control. The results of Model (2) in Table 6 show a significant negative relation
between family firms and CSR performance at the 1% level.12
Similarly, those of Model (3)
in Table 6 also show that the existence of an individual family owner is related to CSR
performance negatively at the 1% significance level. As expected, the results of Model (4) in
Table 6 show that the interaction between the chaebol dummy and family firm dummy has a
significantly positive association with CSR score. This finding indicates the positive impact
of chaebol affiliation, as mentioned previously, such that the strong negative influence of
family control is mitigated in chaebol business groups. A similar result is obtained in Model
(5) with respect to the case of individual family owners, in which chaebol affiliation does not
affect family control by an individual family owner. Overall, these empirical findings are
consistent with Hypotheses H3-1, H3-2, and H3-3.
[Insert Table 6 here]
12
Family firms here are defined as firms that have individual family controlling shareholders or
group affiliates owned by an individual family member.
18
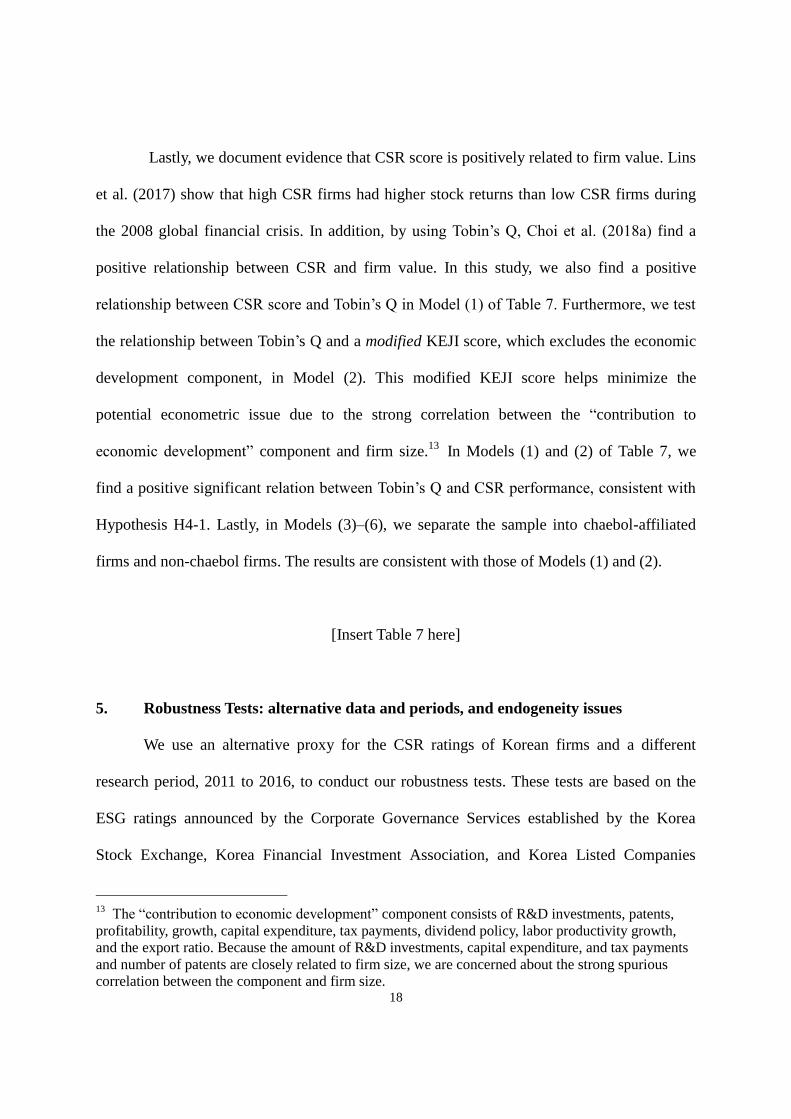
Lastly, we document evidence that CSR score is positively related to firm value. Lins
et al. (2017) show that high CSR firms had higher stock returns than low CSR firms during
the 2008 global financial crisis. In addition, by using Tobin’s Q, Choi et al. (2018a) find a
positive relationship between CSR and firm value. In this study, we also find a positive
relationship between CSR score and Tobin’s Q in Model (1) of Table 7. Furthermore, we test
the relationship between Tobin’s Q and a modified KEJI score, which excludes the economic
development component, in Model (2). This modified KEJI score helps minimize the
potential econometric issue due to the strong correlation between the “contribution to
economic development” component and firm size.13
In Models (1) and (2) of Table 7, we
find a positive significant relation between Tobin’s Q and CSR performance, consistent with
Hypothesis H4-1. Lastly, in Models (3)–(6), we separate the sample into chaebol-affiliated
firms and non-chaebol firms. The results are consistent with those of Models (1) and (2).
[Insert Table 7 here]
5. Robustness Tests: alternative data and periods, and endogeneity issues
We use an alternative proxy for the CSR ratings of Korean firms and a different
research period, 2011 to 2016, to conduct our robustness tests. These tests are based on the
ESG ratings announced by the Corporate Governance Services established by the Korea
Stock Exchange, Korea Financial Investment Association, and Korea Listed Companies
13
The “contribution to economic development” component consists of R&D investments, patents,
profitability, growth, capital expenditure, tax payments, dividend policy, labor productivity growth,
and the export ratio. Because the amount of R&D investments, capital expenditure, and tax payments
and number of patents are closely related to firm size, we are concerned about the strong spurious
correlation between the component and firm size.

19
Association. Hence, even though KEJI CSR ratings are only available up to 2011, we can still
explore CSR behavior by using ESG ratings over the more recent period of 2011–2016;
moreover, the sample size more than triples from 1,190 to 3,710. The industry distribution in
the ESG ranking is similar to that in the KEJI index. On average, total assets, sales, and debts
increased to 3.3 million, 2.8 million, and 1.9 million Korean won, respectively, whereas
market capitalization and profitability (profit/assets) decreased to 1.5 million Korean won and
6.7%, respectively. Whereas the KEJI index has seven sub-components, the ESG
classification has only three categories (i.e., environment, social, and governance).14,15
Furthermore, unlike the KEJI index, ESG ratings are qualitative, grading at A+, A, B+, and B
or below. Therefore, we use a logit model in which we define the ESG rating as 1 when it
belongs to category A+, A, or B+ and 0 otherwise.
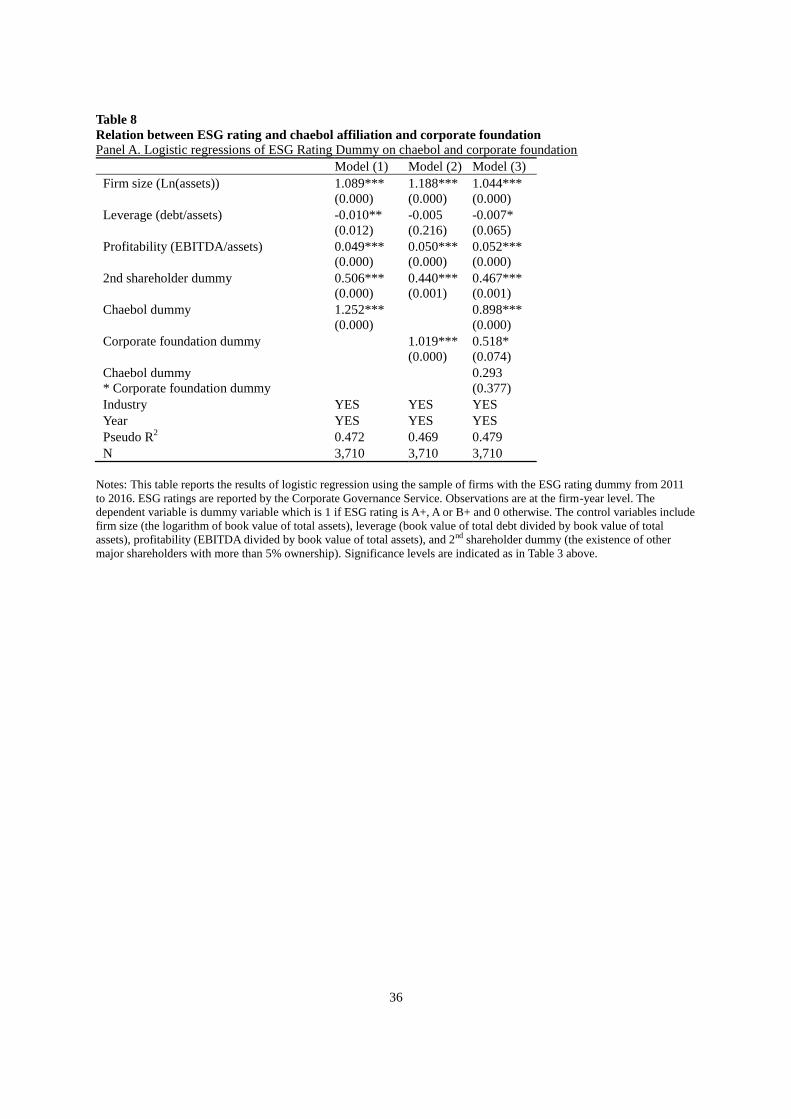
Table 8 presents the robustness test results. Panel A shows that chaebol affiliation and
corporate foundation positively influence the probability of having higher ESG ratings, as
shown in Models (1) and (2). Further, the corporate foundation effect remains regardless of
chaebol affiliation, as evidenced by the insignificant coefficient of the interaction between
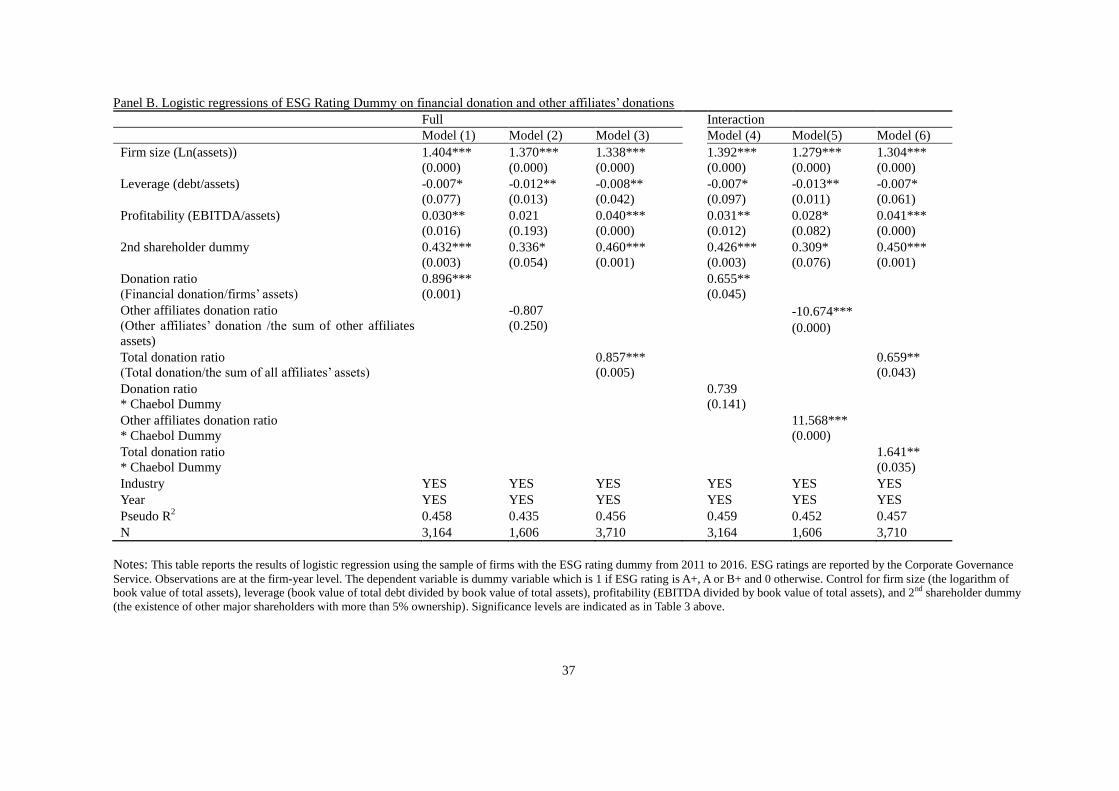
chaebol and foundation. Panel B shows the effect of financial donations and their interaction
with the chaebol dummy. First, consistent with the case of the KEJI CSR index in Table 5,
financial donations and chaebol-affiliated firms show positive effects on ESG scores.
Furthermore, the result of Model (6) in Panel B shows that a firm’s CSR benefits from other
affiliates’ donations only for chaebol groups, supporting the spillover effect that business
14
The environment sub-component consists of five environment-related measurements: strategy,
organization, management, performance, and stakeholder relations. The social sub-component
consists of employee relations, business partner relations and fairness, customer relations, and
contribution to community. The governance sub-component consists of stockholder protection, board
of directors, audit committee, and disclosure. 15
Because of space limitations, detailed summary tables on ESG ranking and firm statistics are
omitted.
20
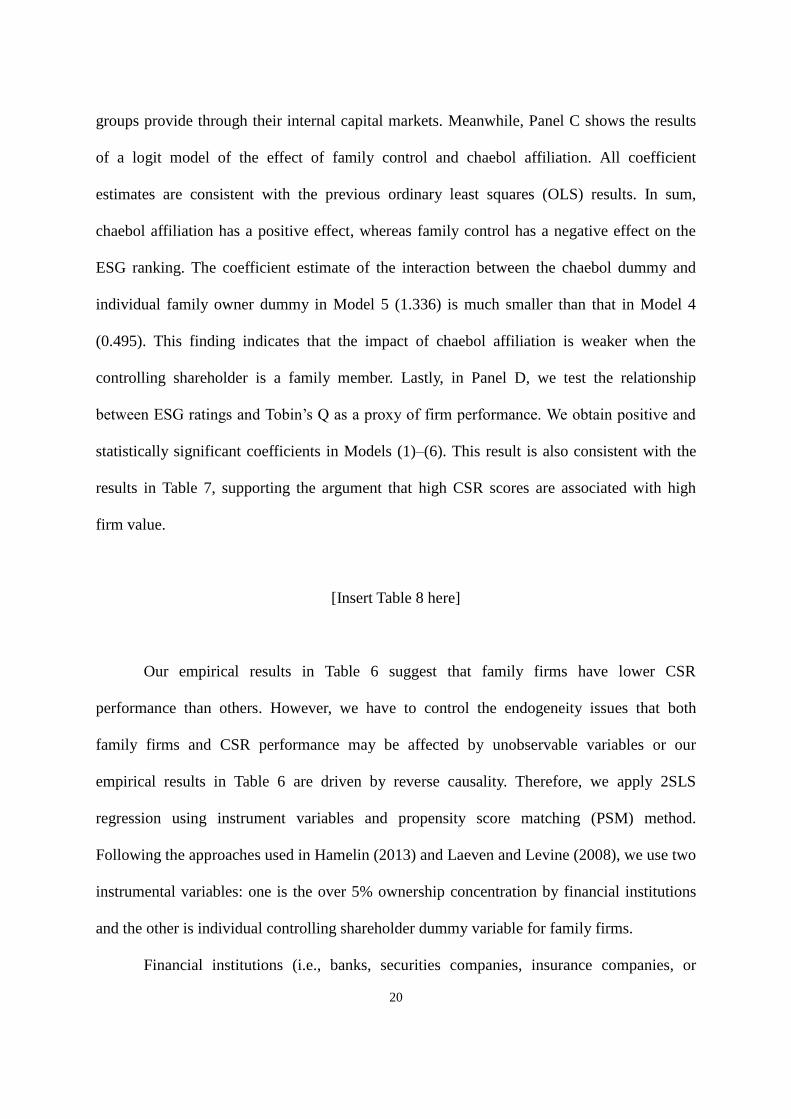
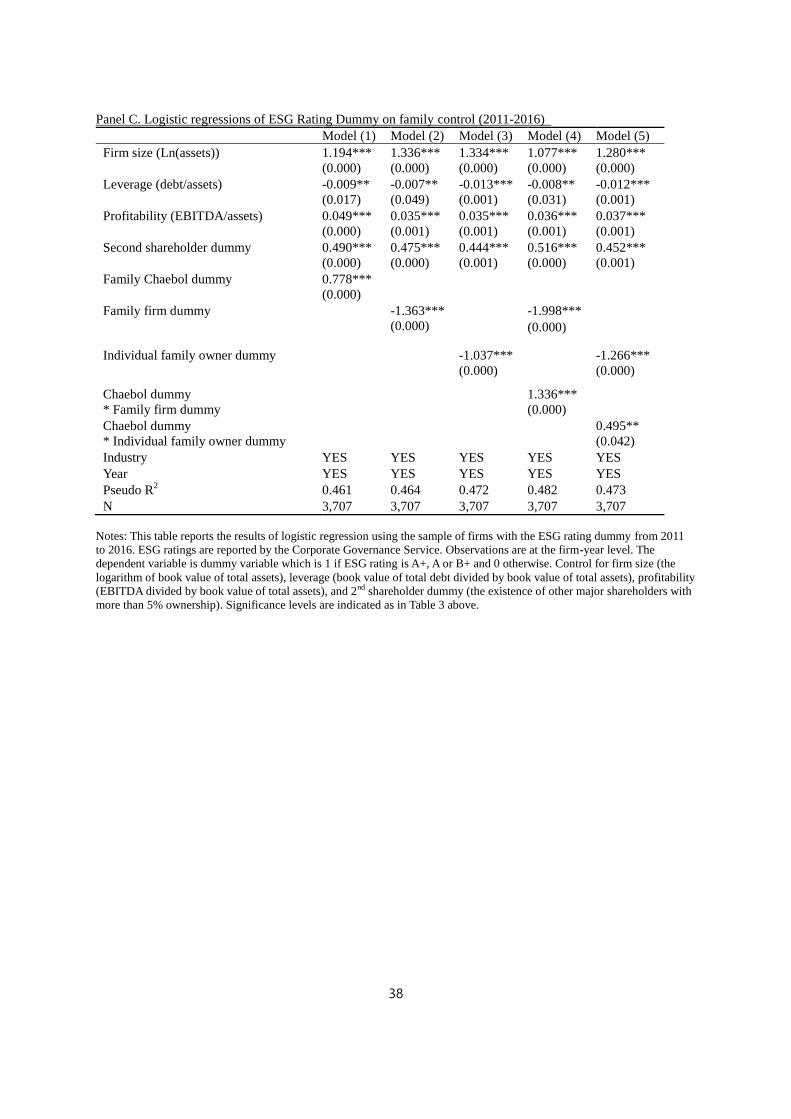
groups provide through their internal capital markets. Meanwhile, Panel C shows the results
of a logit model of the effect of family control and chaebol affiliation. All coefficient
estimates are consistent with the previous ordinary least squares (OLS) results. In sum,
chaebol affiliation has a positive effect, whereas family control has a negative effect on the
ESG ranking. The coefficient estimate of the interaction between the chaebol dummy and
individual family owner dummy in Model 5 (1.336) is much smaller than that in Model 4
(0.495). This finding indicates that the impact of chaebol affiliation is weaker when the
controlling shareholder is a family member. Lastly, in Panel D, we test the relationship
between ESG ratings and Tobin’s Q as a proxy of firm performance. We obtain positive and
statistically significant coefficients in Models (1)–(6). This result is also consistent with the
results in Table 7, supporting the argument that high CSR scores are associated with high
firm value.
[Insert Table 8 here]
Our empirical results in Table 6 suggest that family firms have lower CSR
performance than others. However, we have to control the endogeneity issues that both
family firms and CSR performance may be affected by unobservable variables or our
empirical results in Table 6 are driven by reverse causality. Therefore, we apply 2SLS
regression using instrument variables and propensity score matching (PSM) method.
Following the approaches used in Hamelin (2013) and Laeven and Levine (2008), we use two
instrumental variables: one is the over 5% ownership concentration by financial institutions
and the other is individual controlling shareholder dummy variable for family firms.
Financial institutions (i.e., banks, securities companies, insurance companies, or
21
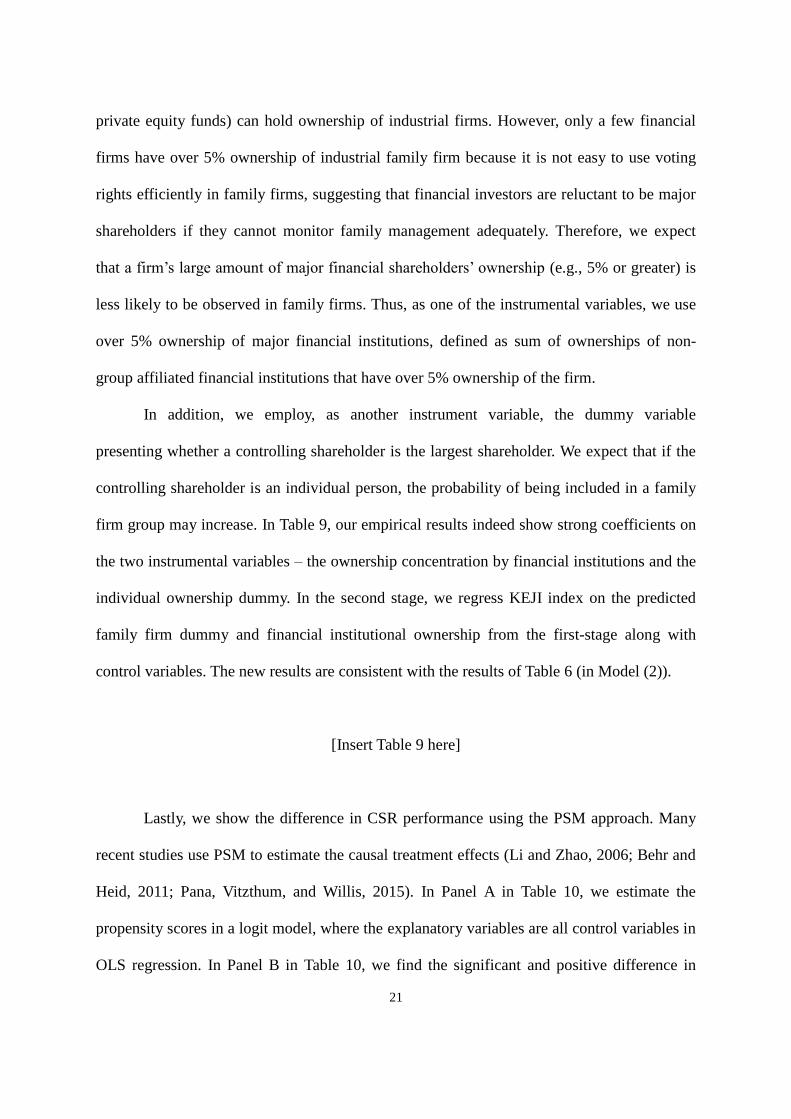
private equity funds) can hold ownership of industrial firms. However, only a few financial
firms have over 5% ownership of industrial family firm because it is not easy to use voting
rights efficiently in family firms, suggesting that financial investors are reluctant to be major
shareholders if they cannot monitor family management adequately. Therefore, we expect
that a firm’s large amount of major financial shareholders’ ownership (e.g., 5% or greater) is
less likely to be observed in family firms. Thus, as one of the instrumental variables, we use
over 5% ownership of major financial institutions, defined as sum of ownerships of non-
group affiliated financial institutions that have over 5% ownership of the firm.
In addition, we employ, as another instrument variable, the dummy variable
presenting whether a controlling shareholder is the largest shareholder. We expect that if the
controlling shareholder is an individual person, the probability of being included in a family
firm group may increase. In Table 9, our empirical results indeed show strong coefficients on
the two instrumental variables – the ownership concentration by financial institutions and the
individual ownership dummy. In the second stage, we regress KEJI index on the predicted
family firm dummy and financial institutional ownership from the first-stage along with
control variables. The new results are consistent with the results of Table 6 (in Model (2)).
[Insert Table 9 here]
Lastly, we show the difference in CSR performance using the PSM approach. Many
recent studies use PSM to estimate the causal treatment effects (Li and Zhao, 2006; Behr and
Heid, 2011; Pana, Vitzthum, and Willis, 2015). In Panel A in Table 10, we estimate the
propensity scores in a logit model, where the explanatory variables are all control variables in
OLS regression. In Panel B in Table 10, we find the significant and positive difference in
22
KEJI index at the 1% significance level in Model (1) and (2). Also, in Model (4) we show the
significant difference on KEJI index at the 5% significance level.16
These empirical results
are consistent with those of Table 4 (in Model (1) and (2)) and Table 6 (in Model (3)).
[Insert Table 10 here]
6. Summary and Conclusion
Business groups are prevalent globally and contribute to economic development,
especially in emerging markets. The investment behavior of business groups is characterized
by an efficient allocation of internal resources among member firms through internal capital
markets. At the same time, the expropriation of minority shareholders’ wealth through the
pyramid ownership structure is a potential problem for business groups. Recently, CSR
activities have received much attention in the literature, as they are believed to enhance firm
value because of their impact on investor trust (or social capital).
This study analyzes the CSR performance of Korean firms and business groups.
Matten and Moon (2008) argue that business groups have invested in a range of financial and
technological public goods (i.e., CSR activities) for society. Chaebols are well known to have
an active internal capital market in which corporate headquarters play critical roles in internal
resource allocations, often controlled by family members. In particular, we explore the effects
on CSR performance of corporate headquarters (or foundations), the spillover of financial
donations, and family control.
First, we find that business group affiliation affects CSR performance positively. This
16 We presume the reason why empirical result of Model (3) in Table 10 is insignificant because the
number of non-family firm is much smaller than that of family firm.
23
result is consistent with the benefit of increasing efficiency in allocating CSR investments, in
which Stein (1997) argues that corporate headquarters, which have an information advantage,
can allocate internal resources within the internal capital market effectively. Specifically, we
provide evidence of the positive role of corporate headquarters. We also find a negative
relation between family involvement and CSR performance, which is consistent with El
Ghoul et al.’s (2016) expropriation hypothesis. Specifically, family firms have lower average
CSR performance than do non-family firms and the existence of an individual family owner
affects CSR scores negatively. Finally, we find that a firm’s financial donations and those of
other affiliated firms affect the firm’s CSR ratings significantly and positively. This finding
supports the argument that financial donations are a good proxy for CSR activities and have a
spillover effect within the same business group. Lastly, we provide evidence that high CSR
scores enhance firm value, implying that, on average, CSR activities increase firm value. In
addition, we extend our analyses to the most recent period covering 2011–2016, using the
ESG index instead of the KEJI index to measure CSR performance. Most of the results are
consistent with the previous ones based on the KEJI index.
Examining the structures of business groups, including family control, and the
structure of internal capital markets such as CSR headquarters and spillovers is necessary to
understand business groups’ CSR activities and their influence on the value of public goods.
Future research is thus warranted to explore the channels through which CSR activities are
transformed into desirable social goods (e.g., trust-building social capital) and undesirable
social goods (e.g., private benefits, political involvements) in business groups.
24
References
Almeida, H., Park, S. Y., Subrahmanyam, M. G., & Wolfenzon, D. (2011). The structure and
formation of business groups: Evidence from Korean chaebols. Journal of Financial
Economics, 99(2), 447-475.
Bae, G. S., Cheon, Y. S., & Kang, J. K. (2008). Intragroup propping: Evidence from the
stock-price effects of earnings announcements by Korean business groups. Review of
Financial Studies, 21(5), 2015-2060.
Behr, A., & Heid, F. (2011). The success of bank mergers revisited. An assessment based on a
matching strategy. Journal of Empirical Finance, 18(1), 117-135.
Billett, M. T., & Mauer, D. C. (2003). Cross-subsidies, external financing constraints, and the
contribution of the internal capital market to firm value. Review of Financial Studies,
16(4), 1167-1201.
Bingham, J. B., Dyer Jr., W. G., Smith, I., & Adams, G. L. (2011). A stakeholder identity
orientation approach to corporate social performance in family firms. Journal of
Business Ethics, 99(4), 565-585.
Black, B. S., Jang, H., & Kim, W. (2006). Does corporate governance predict firms’ market
values? Evidence from Korea. Journal of Law, Economics, and Organization, 22(2),
366-413.
Block, J. H., & Wagner, M. (2014). The effect of family ownership on different dimensions of
corporate social responsibility: Evidence from large US firms. Business Strategy and
the Environment, 23(7), 475-492.
Byun, H. Y., Choi, S., Hwang, L. S., & Kim, R. G. (2013). Business group affiliation,
ownership structure, and the cost of debt. Journal of Corporate Finance, 23, 311-331.
Campopiano, G., & De Massis, A. (2015). Corporate social responsibility reporting: A
content analysis in family and non-family firms. Journal of Business Ethics, 129(3),
511-534.
Card, D., Hallock, K. F., & Moretti, E. (2010). The geography of giving: The effect of
corporate headquarters on local charities. Journal of Public Economics, 94(3), 222-
234.
Chang, Y. K., Oh, W. Y., Park, J. H., & Jang, M. G. (2017). Exploring the relationship
between board characteristics and CSR: Empirical evidence from Korea. Journal of
Business Ethics, 140(2), 225-242.
Chen, D., Jiang, D., & Yu, X. (2015). Corporate philanthropy and bank loans in
China. Pacific-Basin Finance Journal, 35, 402-424.
25
Choe, H., & Yang, C. W. (2010). Liquidity commonality and its causes: Evidence from the
Korean stock market. Asia‐Pacific Journal of Financial Studies, 39(5), 626-658.
Choi, J. J., Jo, H., Kim, J., & Kim, M. S. (2018a). Business Groups and Corporate Social
Responsibility. Journal of Business Ethics, forthcoming.
Choi, Y. K., Han, S. H., & Lee, S. (2018b). “Ownership, Control, and Investment Behavior:
Evidence from Korean Business Groups,” Multinational Finance Journal,
forthcoming.
Claessens, S., Djankov, S., & Lang, L. H. (2000). The separation of ownership and control in
East Asian corporations. Journal of Financial Economics, 58(1), 81-112.
Cochran, P. L., & Wood, R. A. (1984). Corporate social responsibility and financial
performance. Academy of management Journal, 27(1), 42-56.
Deng, X., Kang, J. K., & Low, B. S. (2013). Corporate social responsibility and stakeholder
value maximization: Evidence from mergers. Journal of financial Economics, 110(1),
87-109.
Déniz, M. D. L. C. D., & Suárez, M. K. C. (2005). Corporate social responsibility and family
business in Spain. Journal of Business Ethics, 56(1), 27-41.
El Ghoul, S., Guedhami, O., Kwok, C. C., & Mishra, D. R. (2011). Does corporate social
responsibility affect the cost of capital?. Journal of Banking & Finance, 35(9), 2388-
2406.
Gao, F., Faff, R., & Navissi, F. (2012). Corporate philanthropy: Insights from the 2008
Wenchuan earthquake in China. Pacific-Basin Finance Journal, 20(3), 363-377.
Ghoul, S. E., Guedhami, O., Wang, H., & Kwok, C. Y. C. (2016). Family control and
corporate social responsibility. Journal of Banking & Finance, 73, 131-146.
Hamelin, A. (2013). Influence of family ownership on small business growth. Evidence from
French SMEs. Small Business Economics, 41(3), 563-579.
Han, S. H., & Kwon, Y. (2015). Ownership Structure and the Survival of Listed Firms:
Evidence from Korean Reverse Mergers. Asia‐Pacific Journal of Financial Studies,
44(3), 387-420.
Hovakimian, G. (2011). Financial constraints and investment efficiency: Internal capital
allocation across the business cycle. Journal of Financial Intermediation, 20(2), 264-
283.
Joh, S. W. (2003). Corporate governance and firm profitability: evidence from Korea before
the economic crisis. Journal of financial Economics, 68(2), 287-322.
26
Joh, S. W., & Jung, J. Y. (2012). The effects of outside board on firm value in the emerging
market from the perspective of information transaction costs. Asia‐Pacific Journal of
Financial Studies, 41(2), 175-193.
Kang, J., & Kim, J. S. (2006). Private benefits of control and firm leverage: An analysis of
Korean firms. Review of Quantitative Finance and Accounting, 27(4), 439-463.
Kao, E. H., Yeh, C. C., Wang, L. H., & Fung, H. G. (2018). The relationship between CSR
and performance: Evidence in China. Pacific-Basin Finance Journal. forthcoming.
Khanna, T., & Palepu, K. (2000). Is group affiliation profitable in emerging markets? An
analysis of diversified Indian business groups. Journal of Finance, 55(2), 867-891.
Khanna, T., & Yafeh, Y. (2007). Business groups in emerging markets: Paragons or parasites?
Journal of Economic Literature, 45(2), 331-372.
Kim, R. (2016). Financial weakness and product market performance: Internal capital market
evidence. Journal of Financial and Quantitative Analysis, 51(01), 307-332.
Kwon, Y., Han, S. H., & Lee, B. S. (2016). Financial constraints and negative spillovers in
business groups: Evidence from Korea. Pacific-Basin Finance Journal, 39, 84-100.
Laeven, L., & Levine, R. (2008). Complex ownership structures and corporate valuations.
The Review of Financial Studies, 21(2), 579-604.
Lamb, N. H., & Butler, F. C. (2016). The influence of family firms and institutional owners
on corporate social responsibility performance. Business & Society, forthcoming.
Lee, S., Park, K., & Shin, H. H. (2009). Disappearing internal capital markets: Evidence from
diversified business groups in Korea. Journal of Banking & Finance, 33(2), 326-334.
Li, X., & Zhao, X. (2006). Propensity score matching and abnormal returns after seasoned
equity offerings. Journal of Empirical Finance, 13(3), 351-370.
Lins, K. V., Servaes, H., & Tamayo, A. (2017). Social capital, trust, and firm performance:
The value of corporate social responsibility during the financial crisis. The Journal of
Finance, 72(4), 1785-1824.
Manikandan, K. S., & Ramachandran, J. (2015). Beyond institutional voids: Business groups,
incomplete markets, and organizational form. Strategic Management Journal, 36(4),
598-617.
Margolis, J. D., & Walsh, J. P. (2003). Misery loves companies: Rethinking social initiatives
by business. Administrative Science Quarterly, 48(2), 268-305.
Masulis, R. W., Pham, P. K., & Zein, J. (2011). Family business groups around the world:
Financing advantages, control motivations, and organizational choices. Review of
Financial Studies, 24(11), 3556-3600.

27
Matten, D., & Moon, J. (2008). “Implicit” and “explicit” CSR: A conceptual framework for a
comparative understanding of corporate social responsibility. Academy of
Management Review, 33(2), 404-424.
McWilliams, A., & Siegel, D. (2001). Corporate social responsibility: A theory of the firm
perspective. Academy of Management Review, 26(1), 117-127.
Moskalev, S., & Park, S. C. (2010). South Korean chaebols and value-based management.
Journal of Business Ethics, 92(1), 49-62.
Oh, W. Y., Chang, Y. K., & Martynov, A. (2011). The effect of ownership structure on
corporate social responsibility: Empirical evidence from Korea. Journal of Business
Ethics, 104(2), 283-297.
Pana, E., Vitzthum, S., & Willis, D. (2015). The impact of internet-based services on credit
unions: a propensity score matching approach. Review of Quantitative Finance and
Accounting, 44(2), 329-352.
Pyo, G., & Lee, H. Y. (2013). The association between corporate social responsibility
activities and earnings quality: Evidence from donations and voluntary issuance of
CSR reports. Journal of Applied Business Research, 29(3), 945-962.
Ray, S., & Chaudhuri, B. R. (2018). Business Group Affiliation and Corporate Sustainability
Strategies of Firms: An Investigation of Firms in India. Journal of Business Ethics, 1-
22.
Saeidi, S. P., Sofian, S., Saeidi, P., Saeidi, S. P., & Saaeidi, S. A. (2015). How does corporate
social responsibility contribute to firm financial performance? The mediating role of
competitive advantage, reputation, and customer satisfaction. Journal of Business
Research, 68(2), 341-350.
Scharfstein, D. S., & Stein, J. C. (2000). The dark side of internal capital markets: Divisional
rent‐seeking and inefficient investment. Journal of Finance, 55(6), 2537-2564.
Shin, H. H., & Park, Y. S. (1999). Financing constraints and internal capital markets:
Evidence from Korean chaebols. Journal of Corporate Finance, 5(2), 169-191.
Stein, J. C. (1997). Internal capital markets and the competition for corporate resources.
Journal of Finance, 52(1), 111-133.
Sung, H., Nam, C., Kim, M., & Han, S. H. (2016). Spillover effect of sport team performance
on the value of corporate sponsors and affiliated firms. International Journal of Sport
Finance, 11(1), 79.
Wang, M., Qiu, C., & Kong, D. (2011). Corporate social responsibility, investor behaviors,
and stock market returns: Evidence from a natural experiment in China. Journal of
28
business ethics, 101(1), 127-141.
Yoon, Y., Gürhan-Canli, Z., & Schwarz, N. (2006). The effect of corporate social
responsibility (CSR) activities on companies with bad reputations. Journal of
Consumer Psychology, 16(4), 377-390.
29
Table 1
Descriptions of the variables
Variable Description
1 (1) KEJI index The Korea Economic Justice Institute (KEJI) is the major Korean
CSR institution. The KEJI index consists of seven sub-domains,
including corporate integrity; fairness; contribution to community;
customer satisfaction; the environment; employee relations, and
contribution to economic development showing CSR performance.
( (2) Chaebol The Korea Fair Trade Commission (KFTC) announces these
business groups yearly based on the total amount of total assets of
affiliated firms. In 2001, the threshold with respect to total assets for
a business group was 2 trillion Korean won, which was revised to 5
trillion Korean won in 2008.
3 (3) Family Chaebol dummy The KFTC reports controlling shareholders in chaebols. The family-
chaebol dummy equals 1 if an individual controlling shareholder is
an individual family member and 0 otherwise. “Otherwise” includes
financial institutions, governments, state-owned firms, non-profit
organizations, and foreign firms.
4 (4) Corporate foundation dummy This equals 1 if a firm or business group has corporate foundations
that are listed in the Federation of Korean Industries’ (FKI) CSR
white papers and 0 otherwise. FKI membership is composed of
representatives from major Korean firms and business groups, such
as Samsung, LG, and SK. There are several types of corporate
foundation with different goals and activities, such as provision of
medical services, education programs, and scholarships. For
example, Samsung Foundation, Asan Foundation (Hyundai), and
POSCO TJ Park Foundation are private corporate foundations.
5 (5) Controlling shareholder A controlling shareholder is the largest shareholder in the annual
report. The controlling shareholder and related parties (e.g., family
members and business group affiliates) have at least 1% ownership
and hold the largest portion of a public firm’s shares.
6 (6) Family firm dummy Equals 1 if the representative controlling shareholder is an individual
family member or group affiliate owned by an individual family
member and 0 otherwise.
7 (7) Individual family owner dummy Equals 1 if the controlling shareholder is an individual family
member and 0 otherwise. “Otherwise” includes financial institutions,
governments, state-owned firms, non-profit organizations, and
foreign firms.
8 (8) Financial donation Financial donation is donation expense in the income statement.
9 (9) Other affiliates’ financial
donations
Other affiliates’ financial donation is the sum of business group
affiliates’ financial donations. Business group firms are defined as
those that have one or more public-affiliated firms in the KOSPI in
the same year.
(10) Total donations Total donations are the sum of other business group affiliates’
financial donations and the firm’s own financial donation.

30
Table 2
Annual distribution of the sample by business structures and industry
Panel A: Annual distribution of sample firms by chaebol affiliation
Number of observations
Total Chaebol Non-chaebol
2005 199 63 136
2006 199 62 137
2007 198 65 133
2009 198 58 140
2010 198 58 140
2011 198 61 137
Total 1,190 367 823
Panel B: Industry distribution
Industry Classification Number of observations
Chaebol Non-chaebol
Number Percentage Number Percentage
Construction 40 10.9% 46 5.6%
Machinery 19 5.2% 67 8.1%
Non-metallic mineral products 2 0.5% 37 4.5%
Services 25 6.8% 28 3.4%
Textiles & apparel 4 1.1% 26 3.2%
Transportation equipment 27 7.4% 49 6.0%
Transportation & storage 10 2.7% 15 1.8%
Distribution 43 11.7% 29 3.5%
Food & beverages 24 6.5% 66 8.0%
Medical supplies 4 1.1% 6 0.7%
Medical & precision machinery 7 1.9% 141 17.1%
IT 30 8.2% 86 10.4%
Electricity & gas 19 5.2% 16 1.9%
Manufacturing 4 1.1% 21 2.6%
Paper & wood 3 0.8% 23 2.8%
Iron & metal products 28 7.6% 35 4.3%
Telecommunications & broadcasting 11 3.0% 0 0.0%
Chemicals 67 18.3% 132 16.0%
Total 367 100.00% 823 100.00%
Notes: This table reports the research sample of 1,190 public firms. The sample includes all KEJI index firms between 2005
and 2011 in which public firms are traded on the KOSPI.
31
Table 3
Summary of financial characteristics
Panel A: Financial Variables
Variable Total Subgroup Difference
(p-value) Chaebol Non-chaebol
Total assets (million KRW) 2,166,579 5,719,802 582,092 5,137,710***
(0.000)
Sales (million KRW) 2,044,738 5,252,195 614,438 4,637,757***
(0.000)
Market capitalization (million KRW) 1,765,781 4,643,062 482,717 4,160,345***
(0.000)
Total debt (million KRW) 978,381 2,648,641 233,563 2,415,078***
(0.000)
EBITDA (million KRW) 287,294 773,022 70,694 702,328***
(0.000)
Debt-to-assets ratio (%) 39.30 46.55 36.06 10.49***
(0.000)
EBITDA-to-assets ratio (%) 10.39 11.27 10.00 1.26***
(0.001)
Tobin’s Q 1.06 1.23 0.98 0.26***
(0.000)
KEJI_INDEX 47.49 48.45 47.06 1.39***
(0.000)
Corporate integrity 15.22 15.50 15.09 0.41***
(0.000)
Fairness 8.44 8.63 8.36 0.27***
(0.000)
Contribution to community 3.95 3.96 3.94 0.024
(0.738)
Customer satisfaction 3.33 3.37 3.31 0.07***
(0.004)
Environment 5.95 6.29 5.80 0.49***
(0.000)
Employee Relations 5.65 5.60 5.67 0.07
(0.359)
Contribution to economic
development
4.95 5.09 4.89 0.19***
(0.000)
Total 1,190 367 823 -
Panel B: Financial donation
Variable Total Subgroup Difference
(p-value) Chaebol Non-chaebol
Total donations (million KRW) 19,205 58,334 1,757 56,577***
(0.000)
Financial donation (million KRW) 4,304 10,778 1,272 9,505***
(0.000)
Other group affiliates’ donations
(million KRW)
15,753 48,136 590 47,545***
(0.000)
Total 1,190 367 823 -
Notes: This table reports the research sample of 1,190 public firms. The sample includes all KEJI index firms between 2005
and 2011 in which public firms are traded on the KOSPI. ***, **, and * denote significance of the parameter estimates at the
0.01, 0.05, and 0.10 levels, respectively. The p-values are in parentheses.
32
Table 4
Relation between KEJI index and chaebol affiliation and corporate foundation dummy
Full Sample Matching Firm
Model (1) Model (2) Model (3) Model (4) Model (5) Model (6)
Firm size (Ln(assets)) 0.603***
(0.000)
0.685***
(0.000)
0.592***
(0.000)
0.690***
(0.000)
0.755***
(0.000)
0.671***
(0.000)
Leverage (debt/assets) -0.027***
(0.000)
-0.024***
(0.000)
-0.026***
(0.000)
-0.033***
(0.000)
-0.027***
(0.000)
-0.031***
(0.000)
Profitability (EBITDA/assets) 0.049***
(0.000)
0.051***
(0.000)
0.050***
(0.000)
0.023*
(0.094)
0.029**
(0.039)
0.024*
(0.078)
2nd shareholder dummy 0.233*
(0.055)
0.180
(0.142)
0.231*
(0.057)
0.098
(0.557)
-0.023
(0.892)
0.078
(0.638)
Chaebol dummy 0.913***
(0.000)
0.546**
(0.014)
1.058***
(0.000)
0.605***
(0.008)
Corporate foundation dummy 0.517***
(0.000)
-0.020
(0.923)
0.655***
(0.000)
-0.146
(0.575)
Chaebol dummy
* Corporate foundation dummy
0.582*
(0.055)
0.775**
(0.022)
Industry YES YES YES YES YES YES
Year YES YES YES YES YES YES
Adj R2 0.336 0.325 0.338 0.373 0.346 0.379
N 1,190 1,190 1,190 710 710 710
Notes: This table reports the results of OLS regression using the sample of KOSPI firms with the KEJI index from 2005 to
2011. Observations are at the firm-year level. The dependent variable is the KEJI index. The control variables include firm
size (the logarithm of book value of total assets), leverage (book value of total debt divided by book value of total assets),
profitability (EBITDA divided by book value of total assets), and 2nd shareholder dummy (the existence of other major
shareholders with more than 5% ownership). Significance levels are indicated as in Table 3 above.

33
Table 5
Relation between KEJI index and financial donation and other affiliates’ donation
Full Interaction Model (1) Model (2) Model (3) Model (4) Model(5) Model (6)
Firm size (Ln(assets)) 0.759***
(0.000)
0.766***
(0.000)
0.750***
(0.000)
0.677***
(0.000)
0.705***
(0.000)
0.657***
(0.000)
Leverage (debt/assets) -0.023***
(0.000)
-0.036***
(0.000)
-0.023***
(0.000)
-0.022***
(0.000)
-0.037***
(0.000)
-0.022***
(0.000)
Profitability (EBITDA/assets) 0.034***
(0.003)
0.036**
(0.039)
0.040***
(0.000)
0.032***
(0.005)
0.038**
(0.031)
0.039***
(0.000)
2nd shareholder dummy 0.214*
(0.09)
0.166
(0.366)
0.189
(0.121)
0.234*
(0.059)
0.156
(0.391)
0.193
(0.108)
Donation ratio
(Financial donation/firms’ assets)
1.216***
(0.000)
0.703***
(0.003)
Other affiliates donation ratio
(Other affiliates’ donation /the sum of other affiliates
assets)
0.351
(0.484)
-0.321
(0.566)
Total donation ratio
(Total donation/the sum of all affiliates’ assets)
1.214***
(0.000)
0.714***
(0.004)
Donation ratio
* Chaebol Dummy
2.435***
(0.000)
Other affiliates donation ratio
* Chaebol Dummy
2.517***
(0.008)
Total donation ratio
* Chaebol Dummy
2.923***
(0.000)
Industry YES YES YES YES YES YES
Year YES YES YES YES YES YES
Adj. R2 0.330 0.374 0.333 0.347 0.381 0.352
N 1,132 583 1,190 1,132 583 1,190
Notes: This table reports the results of OLS regression using the sample of KOSPI firms with the KEJI index from 2005 to 2011. Observations are at the firm-year level. The dependent
variable is the KEJI index. The control variables include firm size (the logarithm of book value of total assets), leverage (book value of total debt divided by book value of total assets),
profitability (EBITDA divided by book value of total assets), and 2nd shareholder dummy (the existence of other major shareholders with more than 5% ownership). Significance levels are
indicated as in Table 3 above.
34
Table 6
Relation between KEJI index and family control
Model (1) Model (2) Model (3) Model (4) Model(5)
Firm size (Ln(assets)) 0.696***
(0.000)
0.741***
(0.000)
0.724***
(0.000)
0.577***
(0.000)
0.708***
(0.000)
Leverage (debt/assets) -0.027***
(0.000)
-0.026***
(0.000)
-0.028***
(0.000)
-0.028***
(0.000)
-0.028***
(0.000)
Profitability (EBITDA/assets) 0.050***
(0.000)
0.048***
(0.000)
0.045***
(0.000)
0.045***
(0.000)
0.045***
(0.000)
Second shareholder dummy 0.220*
(0.074)
0.198
(0.107)
0.232*
(0.058)
0.243**
(0.045)
0.235*
(0.055)
Family Chaebol dummy 0.583***
(0.000)
Family firm dummy -0.878***
(0.000)
-1.428***
(0.000)
Individual family owner dummy -0.683***
(0.000)
-0.730***
(0.000)
Chaebol dummy
* Family firm dummy
0.981***
(0.000)
Chaebol dummy
* Individual family owner dummy
0.189
(0.438)
Industry YES YES YES YES YES
Year YES YES YES YES YES
Adj. R2 0.333 0.334 0.341 0.353 0.341
N 1,167 1,167 1,167 1,167 1,167
Notes: This table reports the results of OLS regression using the sample of KOSPI firms with the KEJI index from 2005 to
2011. Observations are at the firm-year level. The dependent variable is the KEJI index The control variables include firm
size (the logarithm of book value of total assets), leverage (book value of total debt divided by book value of total assets),
profitability (EBITDA divided by book value of total assets), and 2nd shareholder dummy (the existence of other major
shareholders with more than 5% ownership). Significance levels are indicated as in Table 3 above.

35
Table 7
Relation between Tobin’s Q and KEJI index
Full Chaebol Non-chaebol
Model (1) Model (2) Model (3) Model (4) Model (5) Model (6)
Firm size (Ln(assets)) 0.055***
(0.000)
0.068***
(0.000)
0.007
(0.748)
0.016
(0.422)
0.108***
(0.000)
0.119***
(0.000)
Leverage (debt/assets) 0.005***
(0.000)
0.005***
(0.000)
0.008***
(0.000)
0.007***
(0.000)
0.004***
(0.000)
0.004***
(0.000)
Profitability (EBITDA/assets) 0.032***
(0.000)
0.034***
(0.000)
0.044***
(0.000)
0.046***
(0.000)
0.028***
(0.000)
0.028***
(0.000)
2nd shareholder dummy -0.021
(0.390)
-0.019
(0.453)
-0.031
(0.535)
-0.031
(0.545)
-0.033
(0.244)
-0.031
(0.286)
KEJI Index 0.039***
(0.000)
0.044***
(0.000)
0.034***
(0.000)
KEJI Index (except
contribution to economic
development)
0.030***
(0.000)
0.040***
(0.001)
0.020***
(0.008)
Industry YES YES YES YES YES YES
Year YES YES YES YES YES YES
Adj R2 0.422 0.412 0.481 0.475 0.389 0.379
N 1,190 1,190 367 367 823 823
Notes: This table reports the results of OLS regression using the sample of KOSPI firms with the KEJI index from 2005 to
2011. Observations are at the firm-year level. The dependent variable is Tobin’s Q (equities’ market value plus liabilities’
book value divided by equities’ book value plus liabilities’ book value). The control variables include firm size (the
logarithm of book value of total assets), leverage (book value of total debt divided by book value of total assets), profitability
(EBITDA divided by book value of total assets), and 2nd shareholder dummy (the existence of other major shareholders with
more than 5% ownership). Significance levels are indicated as in Table 3 above.
36
Table 8
Relation between ESG rating and chaebol affiliation and corporate foundation
Panel A. Logistic regressions of ESG Rating Dummy on chaebol and corporate foundation
Model (1) Model (2) Model (3)
Firm size (Ln(assets)) 1.089***
(0.000)
1.188***
(0.000)
1.044***
(0.000)
Leverage (debt/assets) -0.010**
(0.012)
-0.005
(0.216)
-0.007*
(0.065)
Profitability (EBITDA/assets) 0.049***
(0.000)
0.050***
(0.000)
0.052***
(0.000)
2nd shareholder dummy 0.506***
(0.000)
0.440***
(0.001)
0.467***
(0.001)
Chaebol dummy 1.252***
(0.000)
0.898***
(0.000)
Corporate foundation dummy 1.019***
(0.000)
0.518*
(0.074)
Chaebol dummy
* Corporate foundation dummy
0.293
(0.377)
Industry YES YES YES
Year YES YES YES
Pseudo R2 0.472 0.469 0.479
N 3,710 3,710 3,710
Notes: This table reports the results of logistic regression using the sample of firms with the ESG rating dummy from 2011
to 2016. ESG ratings are reported by the Corporate Governance Service. Observations are at the firm-year level. The
dependent variable is dummy variable which is 1 if ESG rating is A+, A or B+ and 0 otherwise. The control variables include
firm size (the logarithm of book value of total assets), leverage (book value of total debt divided by book value of total
assets), profitability (EBITDA divided by book value of total assets), and 2nd shareholder dummy (the existence of other
major shareholders with more than 5% ownership). Significance levels are indicated as in Table 3 above.
37
Panel B. Logistic regressions of ESG Rating Dummy on financial donation and other affiliates’ donations
Full Interaction Model (1) Model (2) Model (3) Model (4) Model(5) Model (6)
Firm size (Ln(assets)) 1.404***
(0.000)
1.370***
(0.000)
1.338***
(0.000)
1.392***
(0.000)
1.279***
(0.000)
1.304***
(0.000)
Leverage (debt/assets) -0.007*
(0.077)
-0.012**
(0.013)
-0.008**
(0.042)
-0.007*
(0.097)
-0.013**
(0.011)
-0.007*
(0.061)
Profitability (EBITDA/assets) 0.030**
(0.016)
0.021
(0.193)
0.040***
(0.000)
0.031**
(0.012)
0.028*
(0.082)
0.041***
(0.000)
2nd shareholder dummy 0.432***
(0.003)
0.336*
(0.054)
0.460***
(0.001)
0.426***
(0.003)
0.309*
(0.076)
0.450***
(0.001)
Donation ratio
(Financial donation/firms’ assets)
0.896***
(0.001)
0.655**
(0.045)
Other affiliates donation ratio
(Other affiliates’ donation /the sum of other affiliates
assets)
-0.807
(0.250)
-10.674***
(0.000)
Total donation ratio
(Total donation/the sum of all affiliates’ assets)
0.857***
(0.005)
0.659**
(0.043)
Donation ratio
* Chaebol Dummy
0.739
(0.141)
Other affiliates donation ratio
* Chaebol Dummy
11.568***
(0.000)
Total donation ratio
* Chaebol Dummy
1.641**
(0.035)
Industry YES YES YES YES YES YES
Year YES YES YES YES YES YES
Pseudo R2 0.458 0.435 0.456 0.459 0.452 0.457
N 3,164 1,606 3,710 3,164 1,606 3,710
Notes: This table reports the results of logistic regression using the sample of firms with the ESG rating dummy from 2011 to 2016. ESG ratings are reported by the Corporate Governance
Service. Observations are at the firm-year level. The dependent variable is dummy variable which is 1 if ESG rating is A+, A or B+ and 0 otherwise. Control for firm size (the logarithm of
book value of total assets), leverage (book value of total debt divided by book value of total assets), profitability (EBITDA divided by book value of total assets), and 2nd shareholder dummy
(the existence of other major shareholders with more than 5% ownership). Significance levels are indicated as in Table 3 above.
38
Panel C. Logistic regressions of ESG Rating Dummy on family control (2011-2016)
Model (1) Model (2) Model (3) Model (4) Model (5)
Firm size (Ln(assets)) 1.194***
(0.000)
1.336***
(0.000)
1.334***
(0.000)
1.077***
(0.000)
1.280***
(0.000)
Leverage (debt/assets) -0.009**
(0.017)
-0.007**
(0.049)
-0.013***
(0.001)
-0.008**
(0.031)
-0.012***
(0.001)
Profitability (EBITDA/assets) 0.049***
(0.000)
0.035***
(0.001)
0.035***
(0.001)
0.036***
(0.001)
0.037***
(0.001)
Second shareholder dummy 0.490***
(0.000)
0.475***
(0.000)
0.444***
(0.001)
0.516***
(0.000)
0.452***
(0.001)
Family Chaebol dummy 0.778***
(0.000)
Family firm dummy -1.363***
(0.000)
-1.998***
(0.000)
Individual family owner dummy -1.037***
(0.000) -1.266***
(0.000)
Chaebol dummy
* Family firm dummy
1.336***
(0.000)
Chaebol dummy
* Individual family owner dummy
0.495**
(0.042)
Industry YES YES YES YES YES
Year YES YES YES YES YES
Pseudo R2 0.461 0.464 0.472 0.482 0.473
N 3,707 3,707 3,707 3,707 3,707
Notes: This table reports the results of logistic regression using the sample of firms with the ESG rating dummy from 2011
to 2016. ESG ratings are reported by the Corporate Governance Service. Observations are at the firm-year level. The
dependent variable is dummy variable which is 1 if ESG rating is A+, A or B+ and 0 otherwise. Control for firm size (the
logarithm of book value of total assets), leverage (book value of total debt divided by book value of total assets), profitability
(EBITDA divided by book value of total assets), and 2nd shareholder dummy (the existence of other major shareholders with
more than 5% ownership). Significance levels are indicated as in Table 3 above.
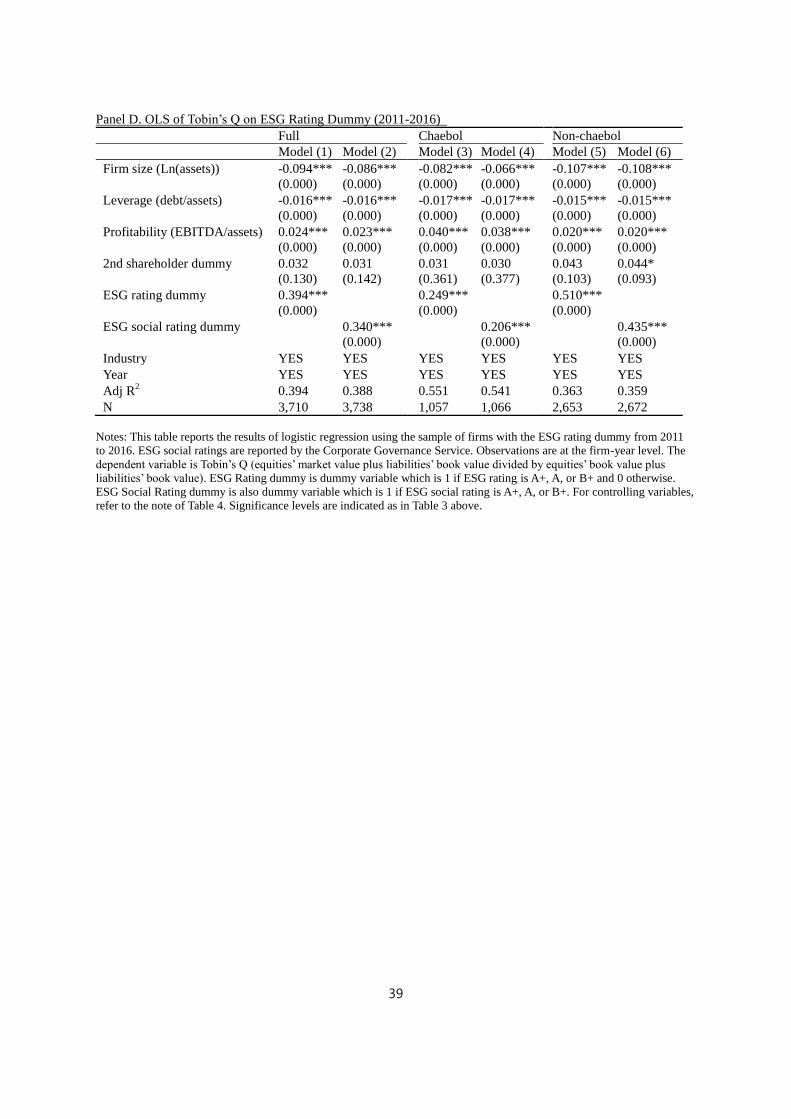
39
Panel D. OLS of Tobin’s Q on ESG Rating Dummy (2011-2016)
Full Chaebol Non-chaebol
Model (1) Model (2) Model (3) Model (4) Model (5) Model (6)
Firm size (Ln(assets)) -0.094***
(0.000)
-0.086***
(0.000)
-0.082***
(0.000)
-0.066***
(0.000)
-0.107***
(0.000)
-0.108***
(0.000)
Leverage (debt/assets) -0.016***
(0.000)
-0.016***
(0.000)
-0.017***
(0.000)
-0.017***
(0.000)
-0.015***
(0.000)
-0.015***
(0.000)
Profitability (EBITDA/assets) 0.024***
(0.000)
0.023***
(0.000)
0.040***
(0.000)
0.038***
(0.000)
0.020***
(0.000)
0.020***
(0.000)
2nd shareholder dummy 0.032
(0.130)
0.031
(0.142)
0.031
(0.361)
0.030
(0.377)
0.043
(0.103)
0.044*
(0.093)
ESG rating dummy 0.394***
(0.000)
0.249***
(0.000)
0.510***
(0.000)
ESG social rating dummy 0.340***
(0.000)
0.206***
(0.000)
0.435***
(0.000)
Industry YES YES YES YES YES YES
Year YES YES YES YES YES YES
Adj R2 0.394 0.388 0.551 0.541 0.363 0.359
N 3,710 3,738 1,057 1,066 2,653 2,672
Notes: This table reports the results of logistic regression using the sample of firms with the ESG rating dummy from 2011
to 2016. ESG social ratings are reported by the Corporate Governance Service. Observations are at the firm-year level. The
dependent variable is Tobin’s Q (equities’ market value plus liabilities’ book value divided by equities’ book value plus
liabilities’ book value). ESG Rating dummy is dummy variable which is 1 if ESG rating is A+, A, or B+ and 0 otherwise.
ESG Social Rating dummy is also dummy variable which is 1 if ESG social rating is A+, A, or B+. For controlling variables,
refer to the note of Table 4. Significance levels are indicated as in Table 3 above.
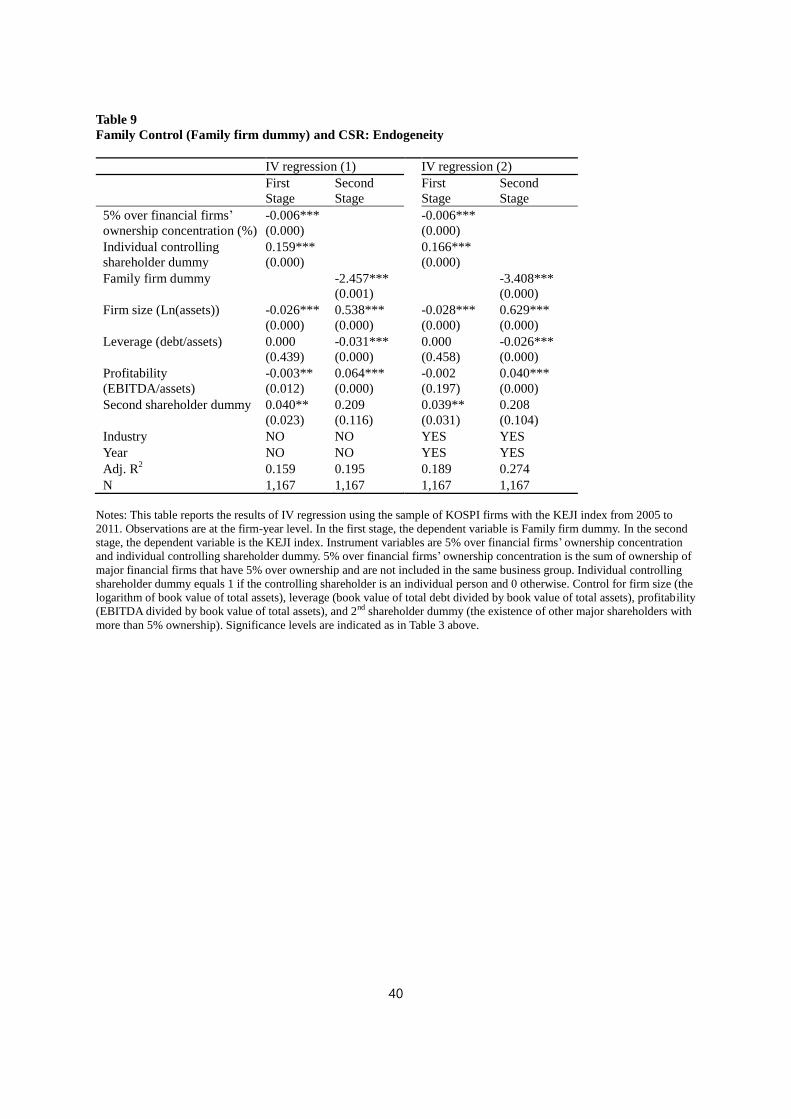
40
Table 9
Family Control (Family firm dummy) and CSR: Endogeneity
IV regression (1) IV regression (2)
First
Stage
Second
Stage
First
Stage
Second
Stage
5% over financial firms’
ownership concentration (%)
-0.006***
(0.000)
-0.006***
(0.000)
Individual controlling
shareholder dummy
0.159***
(0.000)
0.166***
(0.000)
Family firm dummy
-2.457***
(0.001)
-3.408***
(0.000)
Firm size (Ln(assets)) -0.026***
(0.000)
0.538***
(0.000)
-0.028***
(0.000)
0.629***
(0.000)
Leverage (debt/assets) 0.000
(0.439)
-0.031***
(0.000)
0.000
(0.458)
-0.026***
(0.000)
Profitability
(EBITDA/assets)
-0.003**
(0.012)
0.064***
(0.000)
-0.002
(0.197)
0.040***
(0.000)
Second shareholder dummy 0.040**
(0.023)
0.209
(0.116)
0.039**
(0.031)
0.208
(0.104)
Industry NO NO YES YES
Year NO NO YES YES
Adj. R2 0.159 0.195 0.189 0.274
N 1,167 1,167 1,167 1,167
Notes: This table reports the results of IV regression using the sample of KOSPI firms with the KEJI index from 2005 to
2011. Observations are at the firm-year level. In the first stage, the dependent variable is Family firm dummy. In the second
stage, the dependent variable is the KEJI index. Instrument variables are 5% over financial firms’ ownership concentration
and individual controlling shareholder dummy. 5% over financial firms’ ownership concentration is the sum of ownership of
major financial firms that have 5% over ownership and are not included in the same business group. Individual controlling
shareholder dummy equals 1 if the controlling shareholder is an individual person and 0 otherwise. Control for firm size (the
logarithm of book value of total assets), leverage (book value of total debt divided by book value of total assets), profitability
(EBITDA divided by book value of total assets), and 2nd shareholder dummy (the existence of other major shareholders with
more than 5% ownership). Significance levels are indicated as in Table 3 above.
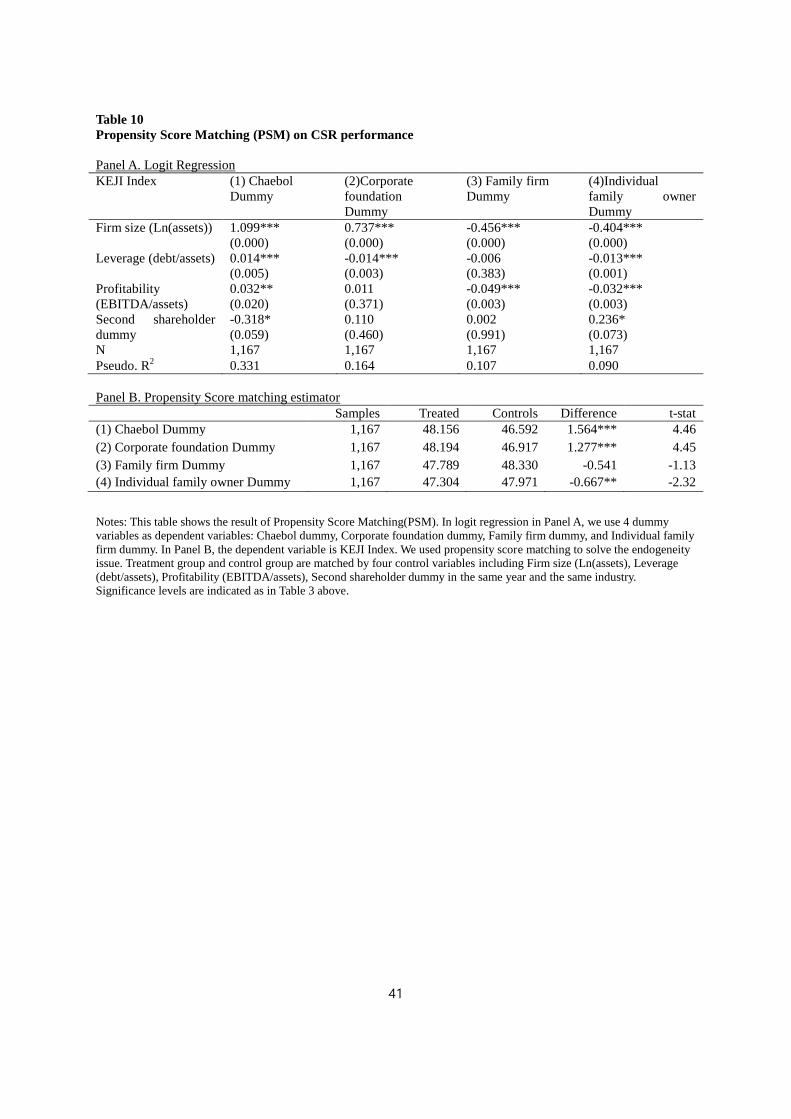
41
Table 10
Propensity Score Matching (PSM) on CSR performance
Panel A. Logit Regression
KEJI Index (1) Chaebol
Dummy (2)Corporate
foundation
Dummy
(3) Family firm
Dummy
(4)Individual
family owner
Dummy
Firm size (Ln(assets)) 1.099***
(0.000)
0.737***
(0.000)
-0.456***
(0.000)
-0.404***
(0.000)
Leverage (debt/assets) 0.014***
(0.005)
-0.014***
(0.003)
-0.006
(0.383)
-0.013***
(0.001)
Profitability
(EBITDA/assets)
0.032**
(0.020)
0.011
(0.371)
-0.049***
(0.003)
-0.032***
(0.003)
Second shareholder
dummy
-0.318*
(0.059)
0.110
(0.460)
0.002
(0.991)
0.236*
(0.073)
N 1,167 1,167 1,167 1,167
Pseudo. R2 0.331 0.164 0.107 0.090
Panel B. Propensity Score matching estimator
Samples Treated Controls Difference t-stat
(1) Chaebol Dummy 1,167 48.156 46.592 1.564*** 4.46
(2) Corporate foundation Dummy 1,167 48.194 46.917 1.277*** 4.45
(3) Family firm Dummy 1,167 47.789 48.330 -0.541 -1.13
(4) Individual family owner Dummy 1,167 47.304 47.971 -0.667** -2.32
Notes: This table shows the result of Propensity Score Matching(PSM). In logit regression in Panel A, we use 4 dummy
variables as dependent variables: Chaebol dummy, Corporate foundation dummy, Family firm dummy, and Individual family
firm dummy. In Panel B, the dependent variable is KEJI Index. We used propensity score matching to solve the endogeneity
issue. Treatment group and control group are matched by four control variables including Firm size (Ln(assets), Leverage
(debt/assets), Profitability (EBITDA/assets), Second shareholder dummy in the same year and the same industry.
Significance levels are indicated as in Table 3 above.