cse583: programming languages david notkin 29 february 2000 [email protected] david notkin...
TRANSCRIPT

CSE583: Programming CSE583: Programming LanguagesLanguagesCSE583: Programming CSE583: Programming LanguagesLanguages
David Notkin29 February [email protected]
http://www.cs.washington.edu/education/courses/583
David Notkin29 February [email protected]
http://www.cs.washington.edu/education/courses/583

University of Washington • CSE583 • D. Notkin © 2000 2
Visual programming andVisual programming andprogram visualizationprogram visualizationVisual programming andVisual programming andprogram visualizationprogram visualization
In visual programming people use non-textual representations to write programs– Left: VIPR example while statement [Citrin et al.]
In program visualization people use non-textual representations to understand programs– Right: Field example screen [Reiss]
In visual programming people use non-textual representations to write programs– Left: VIPR example while statement [Citrin et al.]
In program visualization people use non-textual representations to understand programs– Right: Field example screen [Reiss]

University of Washington • CSE583 • D. Notkin © 2000 3
VC++ and similar beastsVC++ and similar beastsVC++ and similar beastsVC++ and similar beasts
In general, many of the “visual” programming environments are not supporting visual programming
Rather, they are mostly window-based environments to support textual programming
In general, many of the “visual” programming environments are not supporting visual programming
Rather, they are mostly window-based environments to support textual programming

University of Washington • CSE583 • D. Notkin © 2000 4
Visual programmingVisual programmingVisual programmingVisual programming
People write programs almost solely using text
Rich I/O devices were rare
Technologies (e.g., parsing) were developed to support textual input
“A picture is worth 1000 words”
People write programs almost solely using text
Rich I/O devices were rare
Technologies (e.g., parsing) were developed to support textual input
“A picture is worth 1000 words”
“Would we not be more productive and would the power of modern computers not be accessible to a wider range of people if we were able to instruct a computer by simply drawing for it the images we see in our mind's eye when we consider the solutions to particular problems?” —M. Boshernitsan
“Would we not be more productive and would the power of modern computers not be accessible to a wider range of people if we were able to instruct a computer by simply drawing for it the images we see in our mind's eye when we consider the solutions to particular problems?” —M. Boshernitsan

University of Washington • CSE583 • D. Notkin © 2000 5
To VP or not to VP?To VP or not to VP?To VP or not to VP?To VP or not to VP?
In small groups, take about 5-10 minutes to list the top three reasons that– visual programming should (in the long term)
dominate textual programming
– textual programming should (in the long term) dominate visual programming
– textual programming does (now) dominate visual programming
In small groups, take about 5-10 minutes to list the top three reasons that– visual programming should (in the long term)
dominate textual programming
– textual programming should (in the long term) dominate visual programming
– textual programming does (now) dominate visual programming

University of Washington • CSE583 • D. Notkin © 2000 6
Does anybody in 584 use VP?Does anybody in 584 use VP?Does anybody in 584 use VP?Does anybody in 584 use VP?
If so, how? If so, how?

University of Washington • CSE583 • D. Notkin © 2000 7
FlowchartsFlowchartsFlowchartsFlowcharts
A very early visual notation for program– Goldstein and von
Neumann [1947] Well-defined icons Supported in
– physical templates– general drawing tools– specific flowchart tools
(including layout and “generate from code”)
A very early visual notation for program– Goldstein and von
Neumann [1947] Well-defined icons Supported in
– physical templates– general drawing tools– specific flowchart tools
(including layout and “generate from code”)
Ainsworth & Partners, Inc.

University of Washington • CSE583 • D. Notkin © 2000 8
A little more historyA little more historyA little more historyA little more history
Haibt developed a system that could take Fortran or assembly language programs and generate [1959]
Knuth developed a system integrating documentation with source code, also automatically generating flowcharts [1963]
Haibt developed a system that could take Fortran or assembly language programs and generate [1959]
Knuth developed a system integrating documentation with source code, also automatically generating flowcharts [1963]

University of Washington • CSE583 • D. Notkin © 2000 9
ExampleExampleiconsiconsExampleExampleiconsicons
P rocess D ecis ion D ocum ent
D ataP redefined
P rocessS toredD ate
In terna lS torage
S eq.D ata
D irectD ata
M anualInput
C ard P aperTape
D isp lay M anualO per.
O ffpageC onnector
P rocess D ecis ion D ocum ent
D ataP redefined
P rocessS toredD ate
In terna lS torage
S eq.D ata
D irectD ata
M anualInput
C ard P aperTape
D isp lay M anualO per.
O ffpageC onnector

University of Washington • CSE583 • D. Notkin © 2000 10
Robert Luttman & AssociatesRobert Luttman & AssociatesRobert Luttman & AssociatesRobert Luttman & Associates

University of Washington • CSE583 • D. Notkin © 2000 11
RFG Quality ConsultantsRFG Quality ConsultantsRFG Quality ConsultantsRFG Quality Consultants
In part an ISO 9000 consultancy “You can use flowcharts to make your quality
system more user-friendly: they say a picture is worth a thousand words! A flowchart has a major advantage over written procedures, because it is gives an immediate overview of the method required to the person reading it. It is also usually better to look at and often takes up less pages than its written equivalent.”

University of Washington • CSE583 • D. Notkin © 2000 12
FlowLynx, Inc. FlowLynx, Inc. [1998-99][1998-99]FlowLynx, Inc. FlowLynx, Inc. [1998-99][1998-99]
“Visual FlowCoder (VFC) provides a high performance flowchart browser and editor that frees you from the drudgery of working directly within a text code editor. Flowchart enhanced source code makes any code (yours or someone else's) significantly faster to understand, navigate, learn, reuse, re-engineer and edit. You'll find that Visual FlowCoder delivers the most intense visual programming experience that you've ever seen!”
“Visual FlowCoder (VFC) provides a high performance flowchart browser and editor that frees you from the drudgery of working directly within a text code editor. Flowchart enhanced source code makes any code (yours or someone else's) significantly faster to understand, navigate, learn, reuse, re-engineer and edit. You'll find that Visual FlowCoder delivers the most intense visual programming experience that you've ever seen!”

University of Washington • CSE583 • D. Notkin © 2000 13
““Key benefits” includeKey benefits” include““Key benefits” includeKey benefits” include
Visually documents code so anyone can understand it
Allows concurrent work on the flow and the code ...
Makes it easy to understand and optimize machine generated code
Flowchart any code using only eleven symbols - short learning curve
Flowcode thousands of lines of code in seconds
Designed for optimal speed when working with thousand object flowcharts
Helps the entire programming team understand and share code
Places all programming languages on an equal visual footing making itjust as easy to learn many languages
Helps engineers optimize their code by highlighting iteration and logicalprocessing
Visually enhances mining and retrieval of information from legacy code

University of Washington • CSE583 • D. Notkin © 2000 14
Nassi-Shneiderman diagrams Nassi-Shneiderman diagrams (1973)(1973)Nassi-Shneiderman diagrams Nassi-Shneiderman diagrams (1973)(1973)
Intended to assist in defining procedures that capture algorithms
A graphical representation of a structured flowchart– Essentially,
flowcharts meet structured programming
Also called program structure diagrams
Intended to assist in defining procedures that capture algorithms
A graphical representation of a structured flowchart– Essentially,
flowcharts meet structured programming
Also called program structure diagrams
In itia lize
T rue Fa lse
C ontinue processing
Input is em pty
A sk fo r add itiona linput
W hile there is still input
P rocess the input
C om pute increm enta l resu lts
S tore increm enta l resu lts
T rue Fa lseC lose enough?
E xit w ith approxim ate resu lt C ontinue
In itia lize
T rue Fa lse
C ontinue processing
Input is em pty
A sk fo r add itiona linput
W hile there is still input
P rocess the input
C om pute increm enta l resu lts
S tore increm enta l resu lts
T rue Fa lseC lose enough?
E xit w ith approxim ate resu lt C ontinue

University of Washington • CSE583 • D. Notkin © 2000 15
Potential benefitsPotential benefitsPotential benefitsPotential benefits
Debugging, self-documentation and maintenance The scope of iteration and of conditionals is well-defined
and visible The conditions embedded within compound conditions
can be seen easily The scope of local and global variables is obvious Arbitrary transfers of control are impossible
– Based on Böhm & Jacopini Complete structures should fit on one page (with no off-
page connectors) Recursion has a trivial representation

University of Washington • CSE583 • D. Notkin © 2000 16
A larger exampleA larger exampleA larger exampleA larger example
http://wwwis.cs.utwente.nl:8080/dmrg/MEE/misop013/index.html

University of Washington • CSE583 • D. Notkin © 2000 17
Flowcharts reduxFlowcharts reduxFlowcharts reduxFlowcharts redux
Flowcharts surely do not satisfy most of the claims in the previous slides
At the same time, they are surely useful in some situations– We do find them scrawled on whiteboards now
and then But it’s not clear at all that they can be used
in any direct way to actually effectively write software
Flowcharts surely do not satisfy most of the claims in the previous slides
At the same time, they are surely useful in some situations– We do find them scrawled on whiteboards now
and then But it’s not clear at all that they can be used
in any direct way to actually effectively write software

University of Washington • CSE583 • D. Notkin © 2000 18
Related diagramsRelated diagramsRelated diagramsRelated diagrams
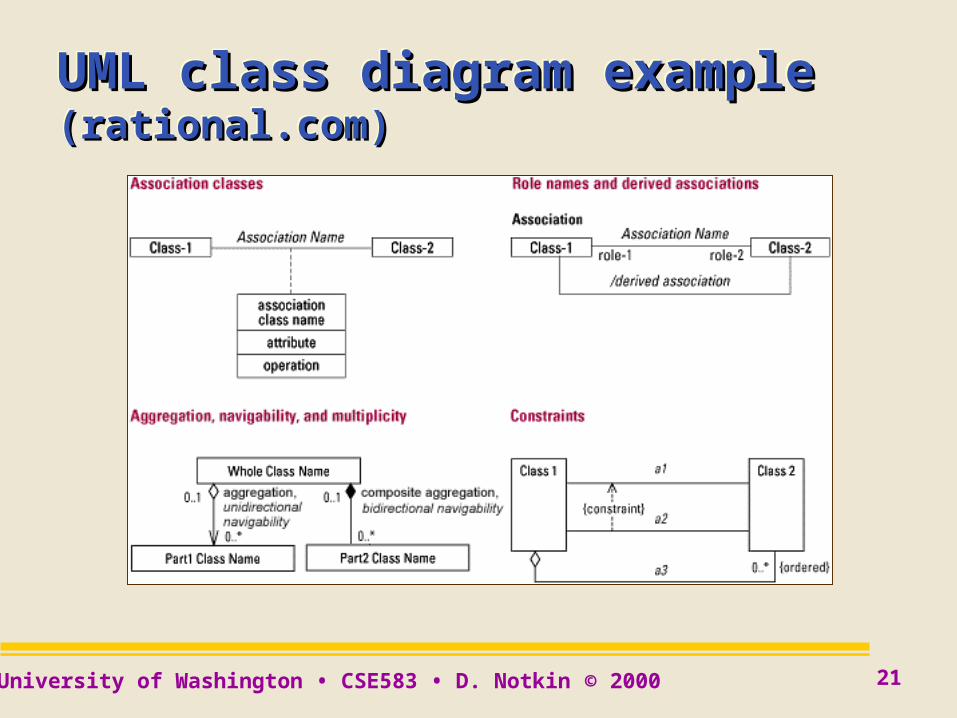
Dataflow diagrams UML diagrams
– General purpose concepts/use-case diagram – Class diagram- types of classes, relationships,
visibility & properties – State-transition diagram- states & transitions,
nested states – Sequence diagram – Collaboration diagram – Component/deployment diagrams
Dataflow diagrams UML diagrams
– General purpose concepts/use-case diagram – Class diagram- types of classes, relationships,
visibility & properties – State-transition diagram- states & transitions,
nested states – Sequence diagram – Collaboration diagram – Component/deployment diagrams
Other diagrams?

University of Washington • CSE583 • D. Notkin © 2000 19
Dataflow diagramsDataflow diagramsDataflow diagramsDataflow diagrams
Gangolly,U. Albany

University of Washington • CSE583 • D. Notkin © 2000 20
Dataflow diagramDataflow diagramDataflow diagramDataflow diagram
University of Pisa
University of Washington • CSE583 • D. Notkin © 2000 21
UML class diagram example UML class diagram example (rational.com)(rational.com)UML class diagram example UML class diagram example (rational.com)(rational.com)

University of Washington • CSE583 • D. Notkin © 2000 22
UML sequence diagramUML sequence diagramUML sequence diagramUML sequence diagram

University of Washington • CSE583 • D. Notkin © 2000 23
A little VP historyA little VP historyA little VP historyA little VP history
Sketchpad [Sutherland 63] – A simple constraint-based graphics system – Followup work by W. Sutherland
• Visual creation, debugging, execution of dataflow diagrams
Pygmalion [D.Smith 75] – Attempt to allow programming that corresponded to
the creative thought processes– Icon-based programming paradigm – Essentially “programming-by-example” to generate
text programs

University of Washington • CSE583 • D. Notkin © 2000 24
vs. conventional languagesvs. conventional languagesvs. conventional languagesvs. conventional languages
In conventional languages, tokens are concatenated to form a program
In VPLs, icons correspond to tokens– But construction rules are explicit
• horizontal concatenation • vertical concatenation • spatial overlay
Analyze these programs– Using picture grammars, graph grammars, … – The result is parse/abstract syntax trees– The compiler works symbolically, not with icons

University of Washington • CSE583 • D. Notkin © 2000 25
Taxonomy Taxonomy [Chang, Shu, Burnett][Chang, Shu, Burnett]Taxonomy Taxonomy [Chang, Shu, Burnett][Chang, Shu, Burnett]
Pure visual language systems– Graphical representations only for creation,
manipulation, execution, debugging– VIPR, Prograph, PICT/D, Cube, …
Hybrid languages– Create programs visually and then manipulate
textually– Or add graphical elements to a textual language – Rehearsal World, C2, work by Erwig, …

University of Washington • CSE583 • D. Notkin © 2000 26
More taxonomyMore taxonomyMore taxonomyMore taxonomy
Programming by example systems – Rehearsal World, Pygmalion, …
Constraint-oriented and physical simulation systems – ThingLab, ARK, …
Form-based languages– Use a spreadsheet metaphor – Forms/3, …
Programming by example systems – Rehearsal World, Pygmalion, …
Constraint-oriented and physical simulation systems – ThingLab, ARK, …
Form-based languages– Use a spreadsheet metaphor – Forms/3, …

University of Washington • CSE583 • D. Notkin © 2000 27
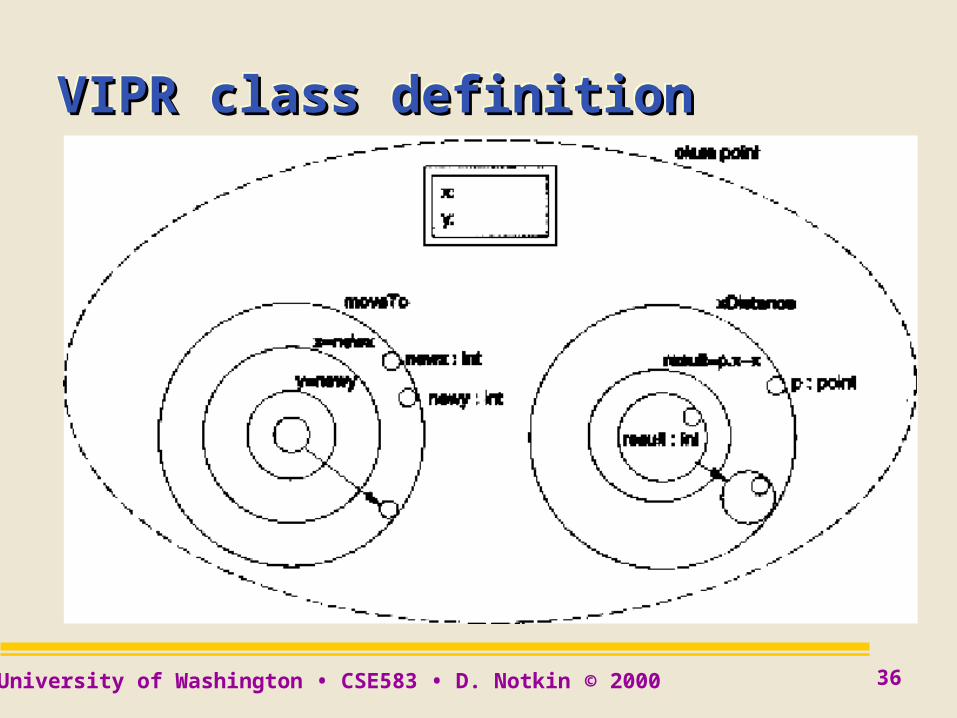
VIPRVIPRVIPRVIPR
Visual Imperative Programming– Citrin et. al at the U. Colorado
Intended for completely visual general purpose programming
Uses nested series of concentric rings to visualize programs– Instead of icons, forms or other traditional
graphical representations
Visual Imperative Programming– Citrin et. al at the U. Colorado
Intended for completely visual general purpose programming
Uses nested series of concentric rings to visualize programs– Instead of icons, forms or other traditional
graphical representations

University of Washington • CSE583 • D. Notkin © 2000 28
Network of pipesNetwork of pipesNetwork of pipesNetwork of pipes
Each step in a computation merges two rings in the presence of a state object that is connected to the outermost ring
Walk down a network of pipes that branches off in different directions, changing the state based on actions written on the inside of the pipes
Each step in a computation merges two rings in the presence of a state object that is connected to the outermost ring
Walk down a network of pipes that branches off in different directions, changing the state based on actions written on the inside of the pipes

University of Washington • CSE583 • D. Notkin © 2000 29
VIPR programVIPR programVIPR programVIPR program

University of Washington • CSE583 • D. Notkin © 2000 30
Motivation and semanticsMotivation and semanticsMotivation and semanticsMotivation and semantics
Create an OO language that is relatively easy to learn and use
VIPR includes most of OO constructs, including inheritance, polymorphism and dynamic dispatch
Has relationship both to C++ semantics and also to simple (-calculus based rewriting rules)
Create an OO language that is relatively easy to learn and use
VIPR includes most of OO constructs, including inheritance, polymorphism and dynamic dispatch
Has relationship both to C++ semantics and also to simple (-calculus based rewriting rules)

University of Washington • CSE583 • D. Notkin © 2000 31
VIPR if-then-elseVIPR if-then-elseVIPR if-then-elseVIPR if-then-else

University of Washington • CSE583 • D. Notkin © 2000 32
VIPR case statementVIPR case statementVIPR case statementVIPR case statement

University of Washington • CSE583 • D. Notkin © 2000 33
VIPR whileVIPR whileVIPR whileVIPR while

University of Washington • CSE583 • D. Notkin © 2000 34
VIPR function call and returnVIPR function call and returnVIPR function call and returnVIPR function call and return

University of Washington • CSE583 • D. Notkin © 2000 35
VIPR recursive callVIPR recursive callVIPR recursive callVIPR recursive call
University of Washington • CSE583 • D. Notkin © 2000 36
VIPR class definitionVIPR class definitionVIPR class definitionVIPR class definition

University of Washington • CSE583 • D. Notkin © 2000 37
ARK (Alternate Reality Kit)ARK (Alternate Reality Kit)[R. Smith 86-92][R. Smith 86-92]ARK (Alternate Reality Kit)ARK (Alternate Reality Kit)[R. Smith 86-92][R. Smith 86-92]
A 2D animated environment for creating interactive simulations
The goals were– to teach users about fundamental laws of physics – to allow non-expert programmers to develop interactive
simulations Objects have visual representation, mass and
velocity Laws of nature are objects that can be manipulated
and changed – Very much like the meta-object protocol

University of Washington • CSE583 • D. Notkin © 2000 38
Prograph Prograph [Pietryzkowski & Cox/ Pictorius][Pietryzkowski & Cox/ Pictorius] Prograph Prograph [Pietryzkowski & Cox/ Pictorius][Pietryzkowski & Cox/ Pictorius]
OO pictorial programming environment Describe procedures as control-flow diagrams
and method invocation as pattern-matching – low-level programming using method definitions
– high-level programming by combining methods into classes and then hierarchies of classes (libraries)
Each ADT encapsulated in a class – objects instantiated from classes

University of Washington • CSE583 • D. Notkin © 2000 39
Prograph examplesPrograph examplesPrograph examplesPrograph examples
Topological sort(method definition on right)

University of Washington • CSE583 • D. Notkin © 2000 40
ARK: planetary orbit simulationARK: planetary orbit simulationARK: planetary orbit simulationARK: planetary orbit simulation

University of Washington • CSE583 • D. Notkin © 2000 41
Cube [Najork]Cube [Najork]Cube [Najork]Cube [Najork]
First 3D VPL, using dataflow 3D allows more information in an
environment to be displayed in given screen size
Cube programs are composed of holder cubes, predicate cubes, definition cubes, ports, pipes and planes
First 3D VPL, using dataflow 3D allows more information in an
environment to be displayed in given screen size
Cube programs are composed of holder cubes, predicate cubes, definition cubes, ports, pipes and planes

University of Washington • CSE583 • D. Notkin © 2000 42
Cube exampleCube exampleCube exampleCube example

University of Washington • CSE583 • D. Notkin © 2000 43
Example explanation (factorial)Example explanation (factorial)Example explanation (factorial)Example explanation (factorial)
Ports represent input/output– Left-hand is “input”; right-hand is “output”
– Ports are bidirectional for constraint-like computations
Holder cubes contain data Ports connected through pipes to holder cubes Each plane is a dataflow diagram
– The bottom plane represents the recursive base case, with default values for ports and indications of type

University of Washington • CSE583 • D. Notkin © 2000 44
More explanationMore explanationMore explanationMore explanation
If the value at the input port is 0, then the bottom plane is active and the value 1 flows to the output port
If the input > 0, then 1 is subtracted from the input by the bottom branch of the upper dataflow diagram
This result is fed to the recursive call to factorial, multiplying the original input by the result
The product flows to the output port

University of Washington • CSE583 • D. Notkin © 2000 45
Program visualizationProgram visualizationProgram visualizationProgram visualization
Use visualization to understand (as opposed to manipulate) programs
"The purpose of computing is insight, not numbers" [Hamming 62]
Use visualization to understand (as opposed to manipulate) programs
"The purpose of computing is insight, not numbers" [Hamming 62]

University of Washington • CSE583 • D. Notkin © 2000 46
Why use visualization Why use visualization [cs.arizona.edu][cs.arizona.edu]Why use visualization Why use visualization [cs.arizona.edu][cs.arizona.edu]
Physical size needs scaling for comprehension Time scale needs changing for comprehension Features need to be emphasized or de-
emphasized Interpretation is needed for comprehension Subject hidden from view Subject not in visible spectrum Subject is not physical in nature Subject is imaginary
Physical size needs scaling for comprehension Time scale needs changing for comprehension Features need to be emphasized or de-
emphasized Interpretation is needed for comprehension Subject hidden from view Subject not in visible spectrum Subject is not physical in nature Subject is imaginary

University of Washington • CSE583 • D. Notkin © 2000 47
Program visualizationProgram visualizationProgram visualizationProgram visualization
Scientific and engineering visualizations
Algorithm animation– Algorithms in action
Software visualization– Focus on the structure of software
Scientific and engineering visualizations
Algorithm animation– Algorithms in action
Software visualization– Focus on the structure of software

University of Washington • CSE583 • D. Notkin © 2000 48
Algorithm animationAlgorithm animationAlgorithm animationAlgorithm animation
1966 Knowlton, Bell Labs, Animation of linked-list language
1981 "Sorting our Sorting" Baecker, U. Toronto 1984 Balsa, M. Brown, Brown U., full-fledged algorithm
animation system 1988 UW Illustrating Compiler R. Henry, UW, automatic
insertion of animation code during compilation 1990 Tango, John Stasko, Brown U., full-fledged algorithm
animation system 1991 Zeus (successor to Balsa) 1993 Polka, J. Stasko, Georgia Tech (extension of Tango to
parallel computation)
University of Washington • CSE583 • D. Notkin © 2000 49
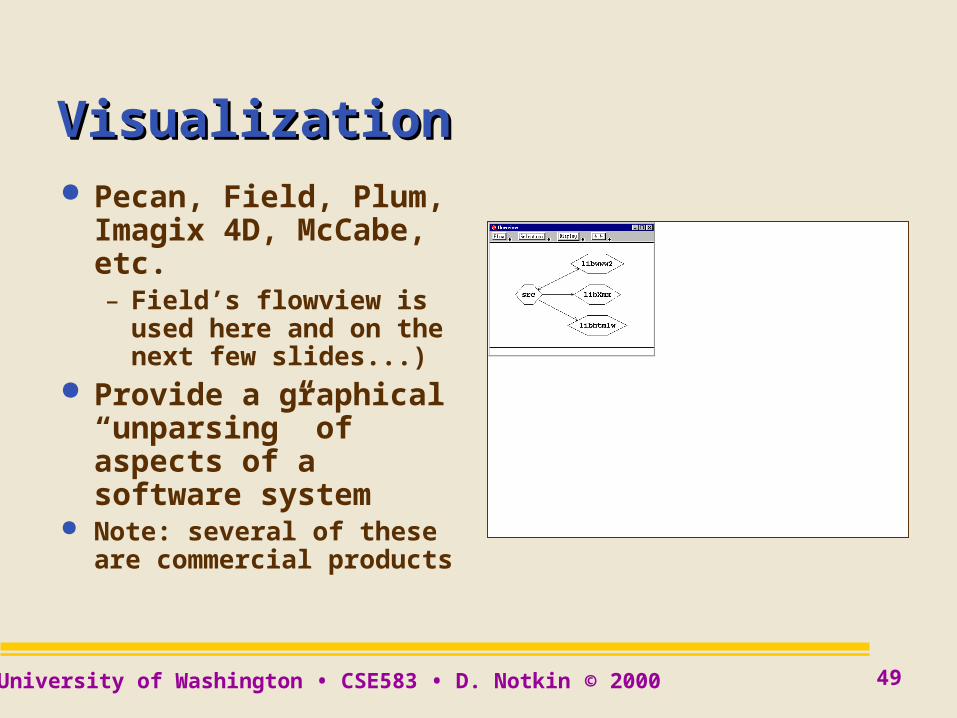
VisualizationVisualization Pecan, Field, Plum,
Imagix 4D, McCabe, etc.– Field’s flowview is used
here and on thenext few slides...)
Provide a graphical “unparsing” of aspects of a software system
Note: several of these are commercial products

University of Washington • CSE583 • D. Notkin © 2000 50
Visualization...Visualization...

University of Washington • CSE583 • D. Notkin © 2000 51
Visualization...Visualization...

University of Washington • CSE583 • D. Notkin © 2000 52
Visualization...Visualization...Visualization...Visualization...
Provides a “direct” view of the source code– Or of an extracted model of the source code
View often contains too much information– So, use elision– With elision you usually describe what you are
not interested in, as opposed to what you are interested in
• Some work in fish-eye views helps reduce this problem

University of Washington • CSE583 • D. Notkin © 2000 53
Reverse engineeringReverse engineering
Rigi, various clustering algorithms(Rigi is used above)– http://www.rigi.csc.uvic.ca/rigi/rigiframe1.shtml

University of Washington • CSE583 • D. Notkin © 2000 54
Reverse engineering...Reverse engineering...

University of Washington • CSE583 • D. Notkin © 2000 55
ClusteringClusteringClusteringClustering
The basic idea is to take one or more models of the code and find appropriate clusters that might indicate “good” modules– Coupling and cohesion are at the heart
of most clustering approaches Many different algorithms
The basic idea is to take one or more models of the code and find appropriate clusters that might indicate “good” modules– Coupling and cohesion are at the heart
of most clustering approaches Many different algorithms

University of Washington • CSE583 • D. Notkin © 2000 56
Mathematical concept analysisMathematical concept analysisMathematical concept analysisMathematical concept analysis
Define relationships between (for instance) functions and global variables [Snelting et al.]
Compute a concept lattice capturing the structure– “Clean” lattices = nice structure– “ugly” ones = bad structure
Define relationships between (for instance) functions and global variables [Snelting et al.]
Compute a concept lattice capturing the structure– “Clean” lattices = nice structure– “ugly” ones = bad structure

University of Washington • CSE583 • D. Notkin © 2000 57
An aerodynamics programAn aerodynamics programAn aerodynamics programAn aerodynamics program
106KLOC Fortran 20 years old 317 subroutines 492 global
variables 46 COMMON
blocks
106KLOC Fortran 20 years old 317 subroutines 492 global
variables 46 COMMON
blocks

University of Washington • CSE583 • D. Notkin © 2000 58
Dominator clusteringDominator clustering[Girard & Koschke][Girard & Koschke]Dominator clusteringDominator clustering[Girard & Koschke][Girard & Koschke] Rigid body simulation; 31KLOC of C code; 36 files; 57
user-defined types; 480 global variables; 488 user-defined routines
Rigid body simulation; 31KLOC of C code; 36 files; 57 user-defined types; 480 global variables; 488 user-defined routines

University of Washington • CSE583 • D. Notkin © 2000 59
Automatic clusteringAutomatic clusteringAutomatic clusteringAutomatic clustering
Automatic clustering approaches must try to produce “the” design– One design fits all
User-driven clustering may get a good result– May take significant work (which may be unavoidable)– Replaying this effort may be hard
Tunable clustering approaches may be hard to tune
Unclear how well automatic tuning works

University of Washington • CSE583 • D. Notkin © 2000 60
SummarizationSummarization
e.g., software reflexion models

University of Washington • CSE583 • D. Notkin © 2000 61
Summarization...Summarization... A map file specifies the correspondence
between parts of the source model and parts of the high-level model
[ file=HTTCP mapTo=TCPIP ][ file=^SGML mapTo=HTML ][ function=socket mapTo=TCPIP ][ file=accept mapTo=TCPIP ][ file=cci mapTo=TCPIP ][ function=connect mapTo=TCPIP ][ file=Xm mapTo=Window ][ file=^HT mapTo=HTML ][ function=.* mapTo=GUI ]

University of Washington • CSE583 • D. Notkin © 2000 62
Summarization...Summarization...
University of Washington • CSE583 • D. Notkin © 2000 63
Summarization...Summarization...Summarization...Summarization...
Condense (some or all) information in terms of a high-level view quickly
Use a high-level view selected by the programmer
Some evidence that it scales effectively
Condense (some or all) information in terms of a high-level view quickly
Use a high-level view selected by the programmer
Some evidence that it scales effectively

University of Washington • CSE583 • D. Notkin © 2000 64
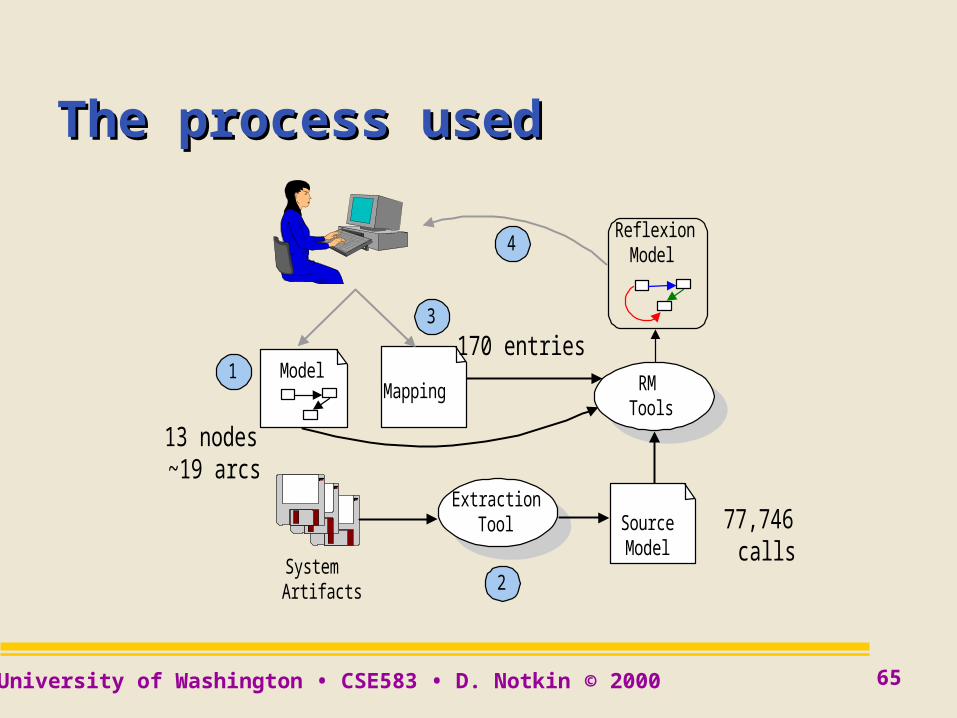
Case study: A task on ExcelCase study: A task on Excel A series of approximate tools were used
by a Microsoft engineer to perform an experimental reengineering task on Excel
The task involved the identification and extraction of components from Excel
Excel comprises about 1.2 million lines of C source– About 15,000 functions spread over ~400 files
University of Washington • CSE583 • D. Notkin © 2000 65
The process usedThe process used
ModelMapping
ExtractionTool
1
2
3
4
RMTools
ReflexionModel
SystemArtifacts
SourceModel
77,746calls
170 entries
13 nodes~19 arcs

University of Washington • CSE583 • D. Notkin © 2000 66
An initial Reflexion ModelAn initial Reflexion Model The initial
Reflexion Model computed had 15 convergences, 83, divergences, and 4 absences
It summarized 61% of calls in source model
Graph
Sheet
File
0
36734
912
1210
...
...

University of Washington • CSE583 • D. Notkin © 2000 67
An iterative processAn iterative process Over a 4+ week period Investigate an arc Refine the map
– Eventually over 1000 entries Document exceptions Augment the source model
– Eventually, 119,637 interactions
ModelMapping
ExtractionTool
1
2
3
4
RMTools
ReflexionModel
SystemArtifacts
SourceModel

University of Washington • CSE583 • D. Notkin © 2000 68
Graph
Sheet
File
0
36734
912
1210
......
A refined Reflexion ModelA refined Reflexion ModelA refined Reflexion ModelA refined Reflexion Model
Sheet
File
Wks_File
4975
1242
2207
88
69
1160
87
713
...
...
...
Sheet
File
Wks_File
4975
1242
2207
88
69
1160
87
713
...
...
... A later Reflexion
Model summarized 99% of 131,042 call and data interactions
This information was used to reason about, plan and automate portions of the task
A later Reflexion Model summarized 99% of 131,042 call and data interactions
This information was used to reason about, plan and automate portions of the task

University of Washington • CSE583 • D. Notkin © 2000 69
ResultsResultsResultsResults
Microsoft engineer judged the use of the Reflexion Model technique successful in helping to understand the system structure and source code
“Definitely confirmed suspicions about the structure of Excel. Further, it allowed me to pinpoint the deviations. It is very easy to ignore stuff that is not interesting and thereby focus on the part of Excel that I want to know more about.” — Microsoft A.B.C. (anonymous by choice) engineer

University of Washington • CSE583 • D. Notkin © 2000 70
Learning stylesLearning stylesLearning stylesLearning styles
An apparent aside An apparent aside

University of Washington • CSE583 • D. Notkin © 2000 71
Learning styles Learning styles [Felder & Solomon][Felder & Solomon]Learning styles Learning styles [Felder & Solomon][Felder & Solomon]
Different people learn in different ways– At least four identifiable dimensions– http://www2.ncsu.edu/unity/lockers/users/f/felder/
public/ILSdir/styles.htm
Significant research has been done on these styles
It isn’t that one style is better or worse– It may be that technical and engineering fields
are somewhat self-selective in terms of learning styles

University of Washington • CSE583 • D. Notkin © 2000 72
Active vs. reflective learnersActive vs. reflective learnersActive vs. reflective learnersActive vs. reflective learners
“Active learners tend to retain and understand information best by doing something active with it--discussing or applying it or explaining it to others”– [Electrifying program representations]
“Reflective learners prefer to think about it quietly first”
“Active learners tend to retain and understand information best by doing something active with it--discussing or applying it or explaining it to others”– [Electrifying program representations]
“Reflective learners prefer to think about it quietly first”

University of Washington • CSE583 • D. Notkin © 2000 73
Sensing vs. intuitive learnersSensing vs. intuitive learnersSensing vs. intuitive learnersSensing vs. intuitive learners
“Sensing learners tend to like learning facts”
“Intuitive learners often prefer discovering possibilities and relationships”
“Sensing learners tend to like learning facts”
“Intuitive learners often prefer discovering possibilities and relationships”

University of Washington • CSE583 • D. Notkin © 2000 74
Sequential vs. global learnersSequential vs. global learnersSequential vs. global learnersSequential vs. global learners
“Sequential learners tend to gain understanding in linear steps, with each step following logically from the previous one”
“Global learners tend to learn in large jumps, absorbing material almost randomly without seeing connections, and then suddenly `getting it’”
“Sequential learners tend to gain understanding in linear steps, with each step following logically from the previous one”
“Global learners tend to learn in large jumps, absorbing material almost randomly without seeing connections, and then suddenly `getting it’”

University of Washington • CSE583 • D. Notkin © 2000 75
Visual vs. verbal learnersVisual vs. verbal learnersVisual vs. verbal learnersVisual vs. verbal learners
“Visual learners remember best what they see--pictures, diagrams, flow charts, time lines, films, and demonstrations”
“Verbal learners get more out of words--written and spoken explanations”
“Visual learners remember best what they see--pictures, diagrams, flow charts, time lines, films, and demonstrations”
“Verbal learners get more out of words--written and spoken explanations”

University of Washington • CSE583 • D. Notkin © 2000 76
Results for: David NotkinResults for: David NotkinResults for: David NotkinResults for: David Notkin
ACT X REF
11 9 7 5 3 1 1 3 5 7 9 11
SEN X INT
11 9 7 5 3 1 1 3 5 7 9 11
VIS X VRB
11 9 7 5 3 1 1 3 5 7 9 11
SEQ X GLO
11 9 7 5 3 1 1 3 5 7 9 11
ACT X REF
11 9 7 5 3 1 1 3 5 7 9 11
SEN X INT
11 9 7 5 3 1 1 3 5 7 9 11
VIS X VRB
11 9 7 5 3 1 1 3 5 7 9 11
SEQ X GLO
11 9 7 5 3 1 1 3 5 7 9 11

University of Washington • CSE583 • D. Notkin © 2000 77
What’s my point?What’s my point?What’s my point?What’s my point?
It is not a priori obvious (in a cognitive sense) whether either a textual or a visual approach should in fact dominate
That is we don’t know that– “A picture is worth 1000 words”
nor that
– textual programming is inherently superior
It is not a priori obvious (in a cognitive sense) whether either a textual or a visual approach should in fact dominate
That is we don’t know that– “A picture is worth 1000 words”
nor that
– textual programming is inherently superior

University of Washington • CSE583 • D. Notkin © 2000 78
SynopsisSynopsisSynopsisSynopsis
This was a quick, high-level overview of two very large areas– Visual programming
– Program visualization We haven’t covered many of the systems
that exist– We haven’t covered any of the systems in
detail
This was a quick, high-level overview of two very large areas– Visual programming
– Program visualization We haven’t covered many of the systems
that exist– We haven’t covered any of the systems in
detail

University of Washington • CSE583 • D. Notkin © 2000 79
Key questionKey questionKey questionKey question
What domains (of computation and of users) would especially benefit from visualization?– This requires, I believe, some
understanding of learning styles, some empirical HCI studies, some understanding of the computational domain, etc.
What domains (of computation and of users) would especially benefit from visualization?– This requires, I believe, some
understanding of learning styles, some empirical HCI studies, some understanding of the computational domain, etc.

University of Washington • CSE583 • D. Notkin © 2000 80
Next weekNext weekNext weekNext week
Domain-specific languages– How can we leverage particular
domains in which we’ll be doing a set of related computations?• CLP(R) is one example we’ve seen of a
DSL
Domain-specific languages– How can we leverage particular
domains in which we’ll be doing a set of related computations?• CLP(R) is one example we’ve seen of a
DSL