csci411 march 11, 2015 project scheduling - time copyright © 2010 by the mcgraw-hill companies,...
TRANSCRIPT
CSCI411
March 11, 2015
Project Scheduling - time
Copyright © 2010 by the McGraw-Hill Companies, Inc. All rights reserved.McGraw-Hill/Irwin

Box 7.1
Project Scheduling: Two Real Life Scenarios
Scenario 1: Schedule Goals Make a Difference in Landscaping
Peter Roberts operates a successful landscaping company in the southeastern United States. As his company grew, Peter noted an increasing tendency for major landscaping jobs to run beyond scheduled due dates. He knew it was possible to complete the work within the time frames he had promised his customers, but he was less and less able to spend time on every job site now that he had more employees and several projects running simultaneously.
After taking a course on project management, Peter decided to try posting, at each job site, a simple horizontal bar chart (see Exhibit 7.3). Peter also reviewed the schedule with each crew chief at the beginning and middle of each project. As time went by, he involved the crew chiefs and team members in decisions about the schedule.
Within just a few weeks, projects began to come in on time, consistently.
7-2

Exhibit 7.3
Gantt Chart for Installing a Garden Irrigation System
7-3
Box 7.1
Project Scheduling: Two Real Life Scenarios
Scenario 2: Schedule Leads to Cooperation in Tool Design
Brad Clemson, an industrial engineering manager at a Fortune 500 company, was experiencing schedule delays in the large machine-tool design process he managed. Designers produced tool drawings, which were then passed to industrial engineers who created the shop drawings used in fabrication and assembly. Both sets of drawings were critical. Schedules were chaotic, and there was considerable finger-pointing between the two groups. Designers were unable to give time estimates for their work, and often produced drawings out of sequence for the needs of the industrial engineering group.
continued
7-4
Box 7.1
Project Scheduling: Two Real Life Scenarios
Scenario 2: Schedule Leads to Cooperation in Tool Design
Brad’s solution was to get both groups to cooperate in developing a network-type schedule that incorporated (and made visible) the necessary precedence relationships among the various drawing tasks. He also assisted both groups in establishing standard methods for estimating realistic drawing development times; these factored in drawing complexity, tool type, and other relevant attributes. Team members created the schedules by hand on large sheets of paper and posted them on the wall in a common area. The most time-critical activities were highlighted in red. A simplified version of one of these schedules is shown in Exhibit 7.4.
7-5

Exhibit 7.4
Scenario 2: Time-Based Network for Tool Design Project (Simplified Version)
Within four months of implementing this new system, schedule performance had improved dramatically, the quality of work had increased, cross-functional conflict was diminished, and people were generally more satisfied with their work.
7-6
Schedule Display Formats
Activity-on-arrow (AOA): A type of network schedule display used to show when activities will occur during a project and also to make clear the sequential relationships between activities.
• Activity information (including a description of the activity and its estimated duration) appears on connecting arrows or arcs
• Nodes (represented by boxes, circles, or other two-dimensional shapes) indicate the beginning and ending points of activities.
• AOA networks in some configurations require what are known as dummy activities – dummy activities are used to show precedence, but have no time associated with them. 7-7
Schedule Display Formats
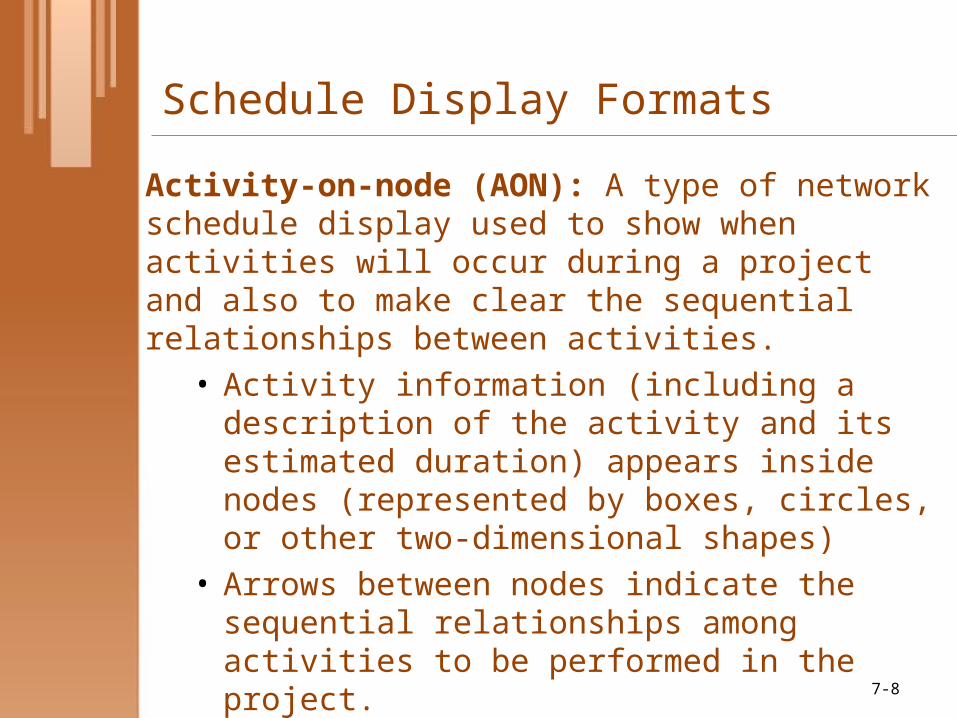
Activity-on-node (AON): A type of network schedule display used to show when activities will occur during a project and also to make clear the sequential relationships between activities.
• Activity information (including a description of the activity and its estimated duration) appears inside nodes (represented by boxes, circles, or other two-dimensional shapes)
• Arrows between nodes indicate the sequential relationships among activities to be performed in the project.
7-8
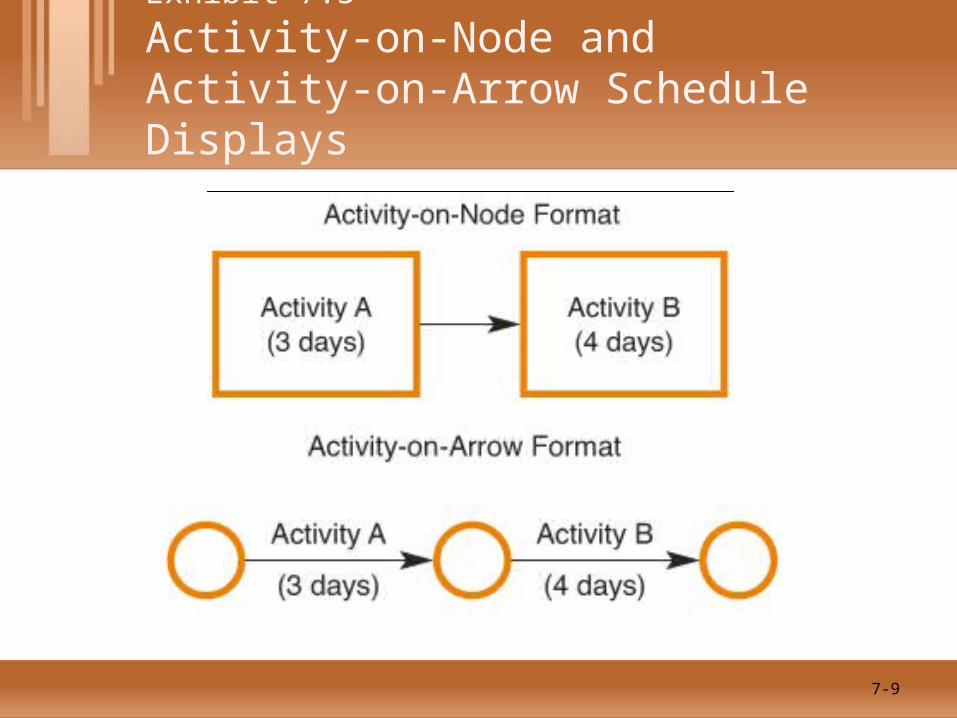
Exhibit 7.5
Activity-on-Node and Activity-on-Arrow Schedule Displays
7-9

Concepts for Project Scheduling
• Schedule Display Formats• Activity-on-node• Activity-on-arrow
• Level of Detail• A high-level milestone schedule is used for big-
picture thinking about project plans & progress.• Milestone: An event in a project designating the point
at which a related set of activities has been completed, or at which a set of activities may begin.
• A highly detailed schedule will depict the sequence and timing of individual tasks.
• Types of Network Logic• Types of Precedence Relationships
7-10
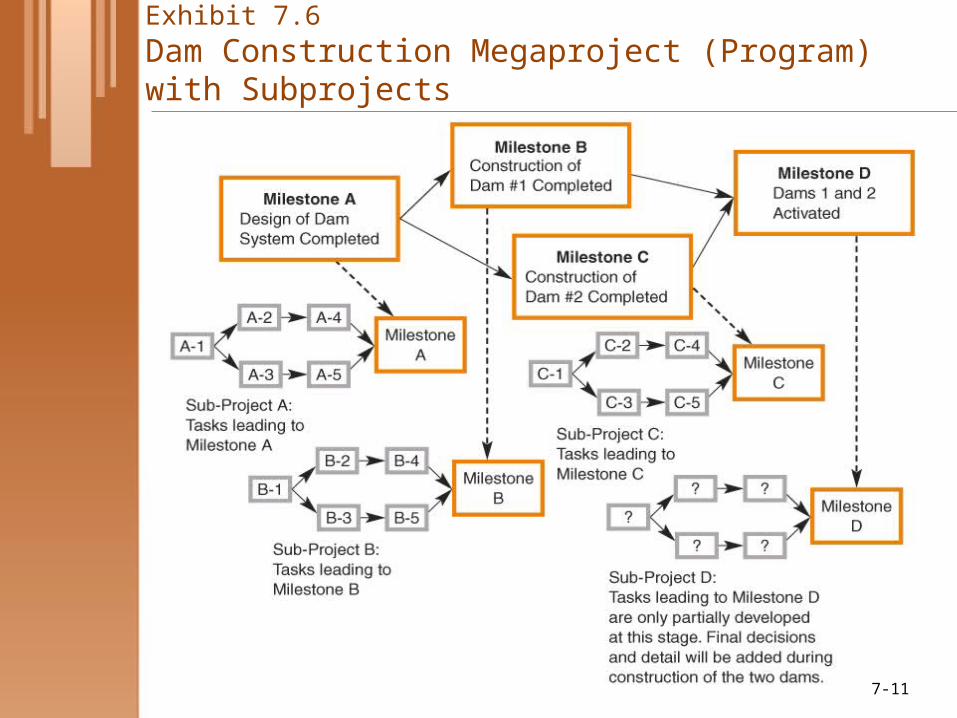
Exhibit 7.6
Dam Construction Megaproject (Program) with Subprojects
7-11
Types of Network Logic
Soft logic: A sequential relationship between activities that can be arranged in a number of ways, depending on the project manager or team’s preferences, resources available, or other circumstances.
Hard logic: A mandatory sequential relationship in which an activity must absolutely be completed before a successor activity may begin.
• In creating the initial schedule, adhere to hard logic first to avoid building false dependencies based on initial assumptions about resource availability of other circumstances that later may prove to be incorrect.
7-12

Types of Precedence RelationshipsFinish-to-start: A sequential relationship between tasks whereby the second task in the sequence cannot start until the first task in the sequence has finished, either immediately after the first task has finished or after a specified lag.•Lag or Delay: A specified amount of waiting time designated between sequential activities in a finish-to-start relationship.
Finish-to-finish: A sequential relationship between tasks whereby the second task in the sequence cannot finish until a specified time after the first task in the sequence has finished.
Start-to-finish: A sequential relationship between tasks whereby the second task in the sequence cannot finish until a specified time after the first task has started.
Start-to-start: A sequential relationship between tasks whereby the second task in the sequence cannot start until a specified time after the first task has started. This type of sequential relationship is often used for fast-tracking schedules. 7-13
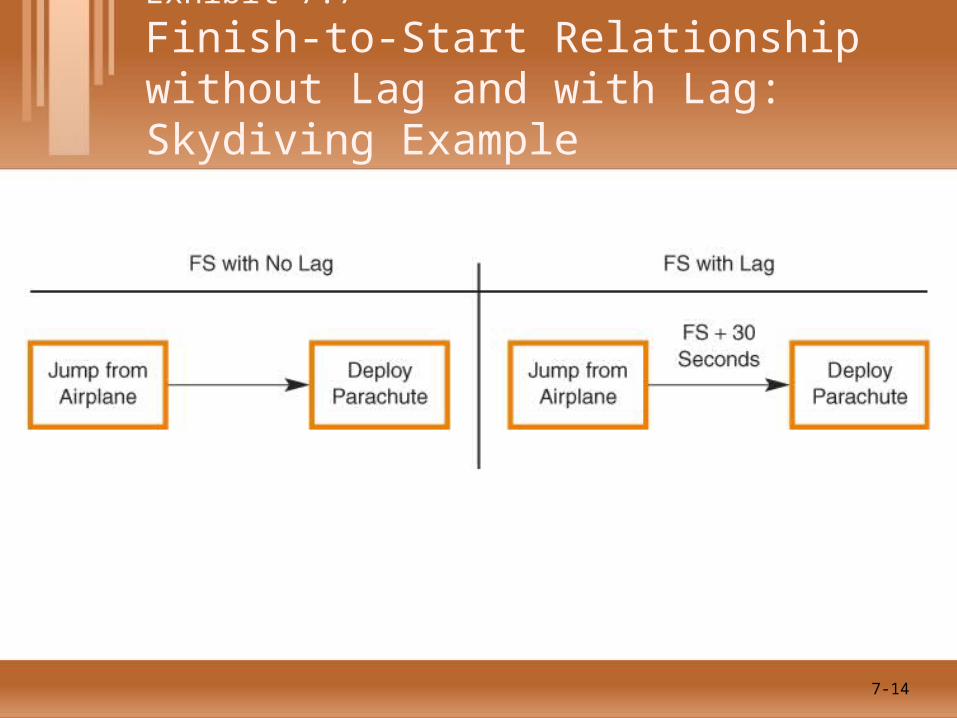
Exhibit 7.7
Finish-to-Start Relationship without Lag and with Lag: Skydiving Example
7-14

Exhibit 7.8Start-to-Start Relationship with Overlapping Tasks: Party Invitation Example
7-15

Displaying and Interpreting Project Schedules
• Activity-on-Node Diagram
• Activity-on-Arrow Diagram
• Gantt Chart
• Schedule Graph (Time-Based Network)
The diagrams on the next several frames illustrate the application of these project schedule displays for a project to create a call center in India.
7-16
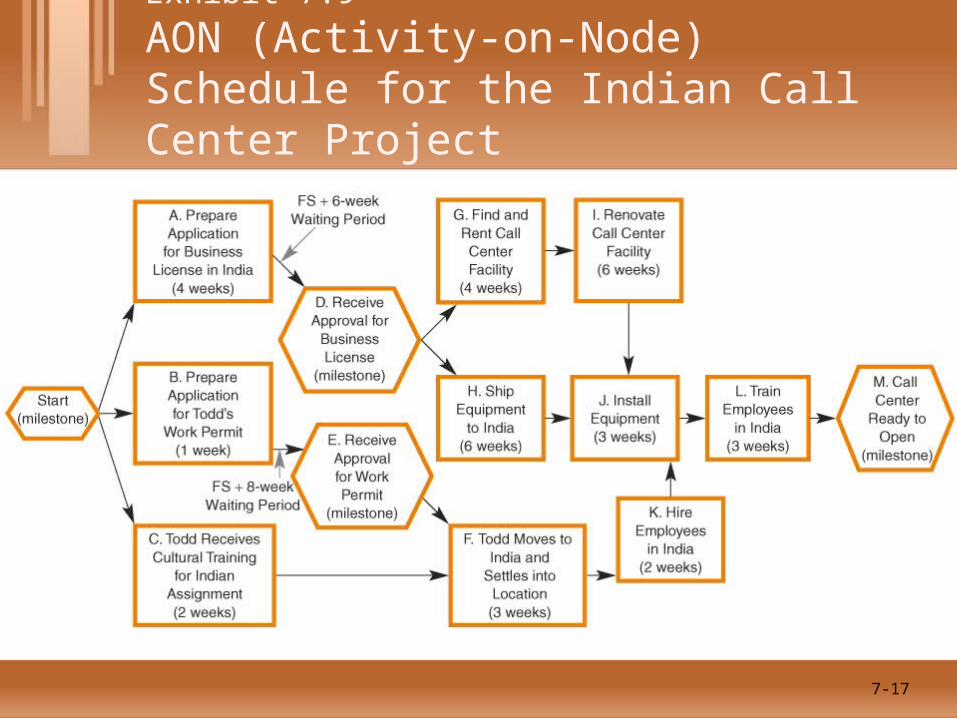
Exhibit 7.9
AON (Activity-on-Node) Schedule for the Indian Call Center Project
7-17
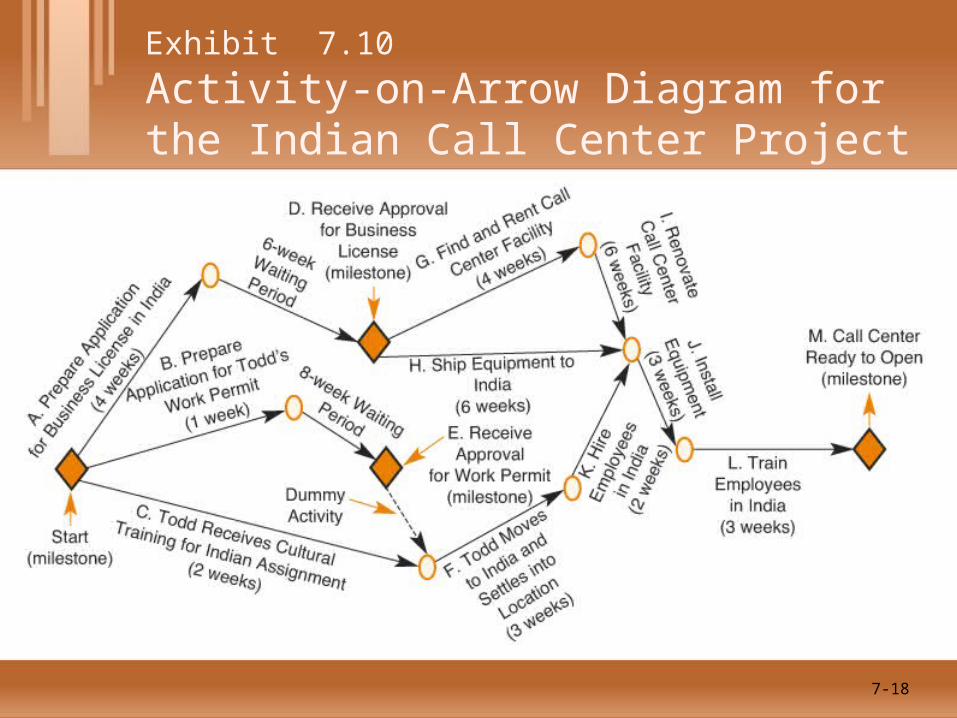
Exhibit 7.10
Activity-on-Arrow Diagram for the Indian Call Center Project
7-18
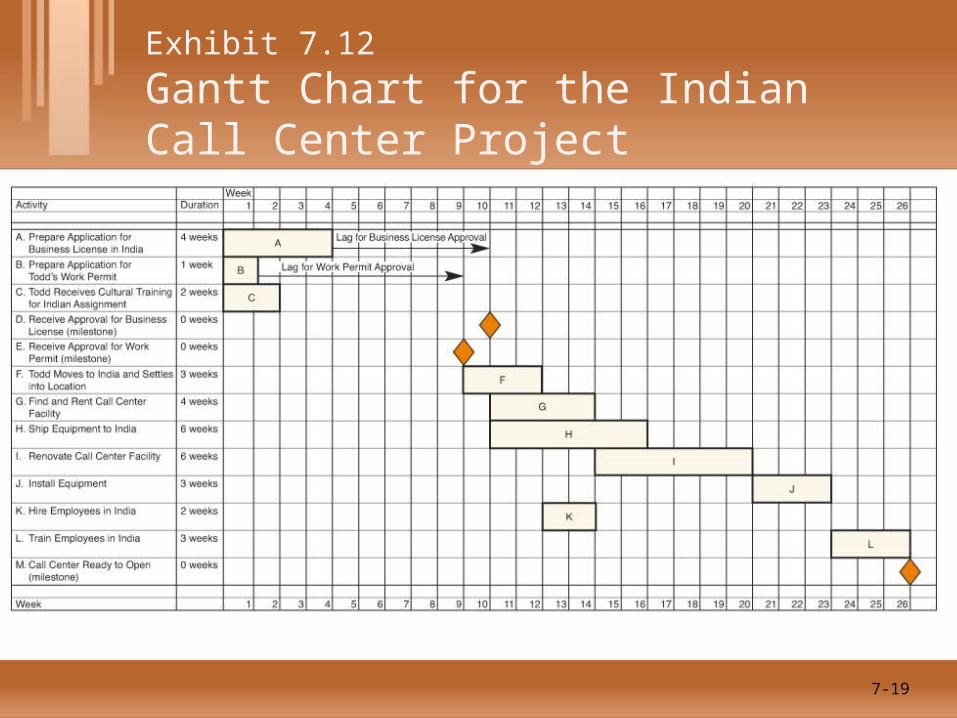
Exhibit 7.12
Gantt Chart for the Indian Call Center Project
7-19

Critical Path and Float
• Critical path: The longest duration path of activities in a network schedule, which determines the anticipated total amount of calendar time a project will consume.
• Float or Slack: A metric used in project scheduling to indicate the length of time that a task not on the critical path can be delayed without jeopardizing the schedule.
7-20
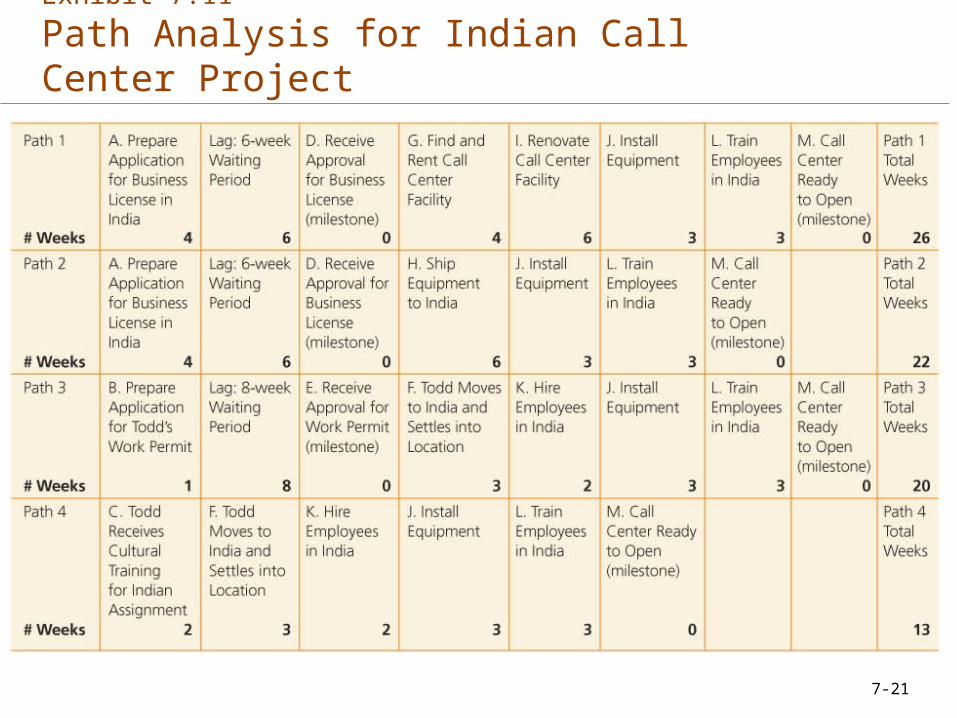
Exhibit 7.11
Path Analysis for Indian Call Center Project
7-21
Early-Start, Late-Start and Float• Early start schedule: A network schedule in
which every activity is set to begin at its earliest possible start time.
• Late-start schedule: A schedule in which all project activities are delayed to their latest possible start times.
• Float or slack: The length of time that a task not on the critical path can be delayed without jeopardizing the schedule.
• Free float: The amount of time an activity can be delayed from its early start time without delaying the early start of any activity that immediately follows it.
• Total float: The amount of time by which an activity can be delayed from its early start time without delaying the project beyond its anticipated end date.
7-22

Exhibit 7.13
Early-Start Schedule Graph (Time-Based Network) for the Indian Call Center Project
7-23
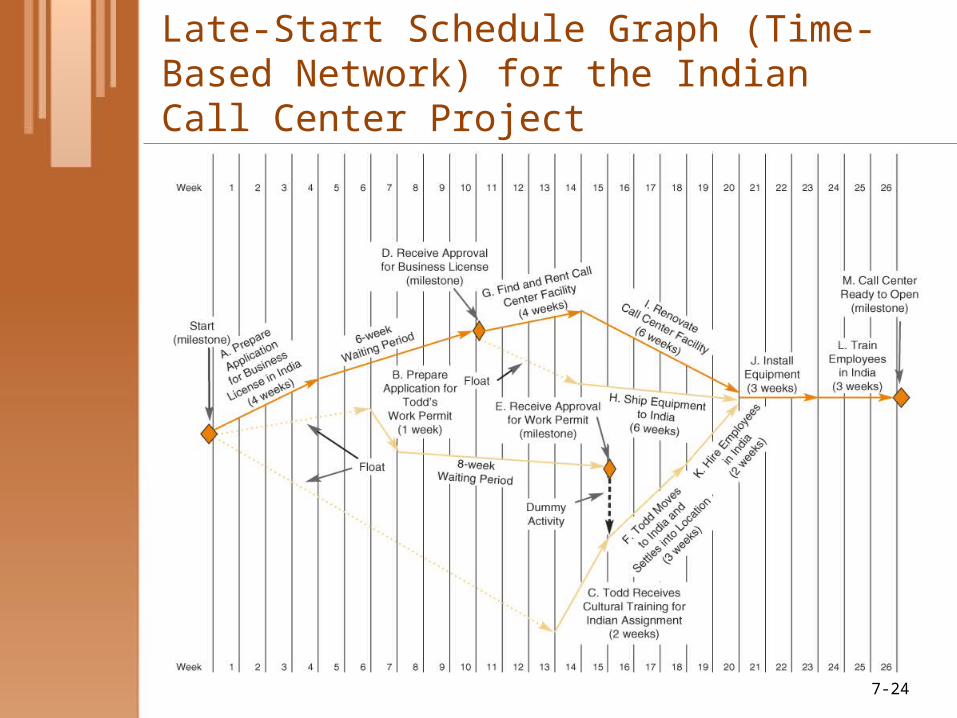
Exhibit 7.14
Late-Start Schedule Graph (Time-Based Network) for the Indian Call Center Project
7-24

Exhibit 7.15
MS Project Output for the Indian Call Center Project: Network View
7-25
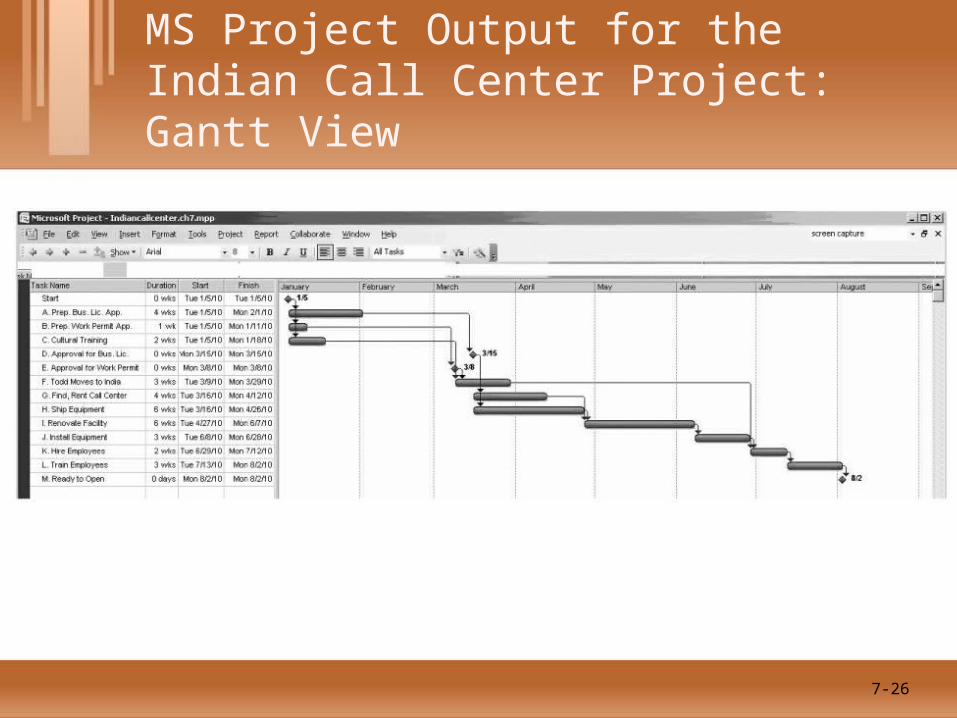
Exhibit 7.16
MS Project Output for the Indian Call Center Project: Gantt View
7-26
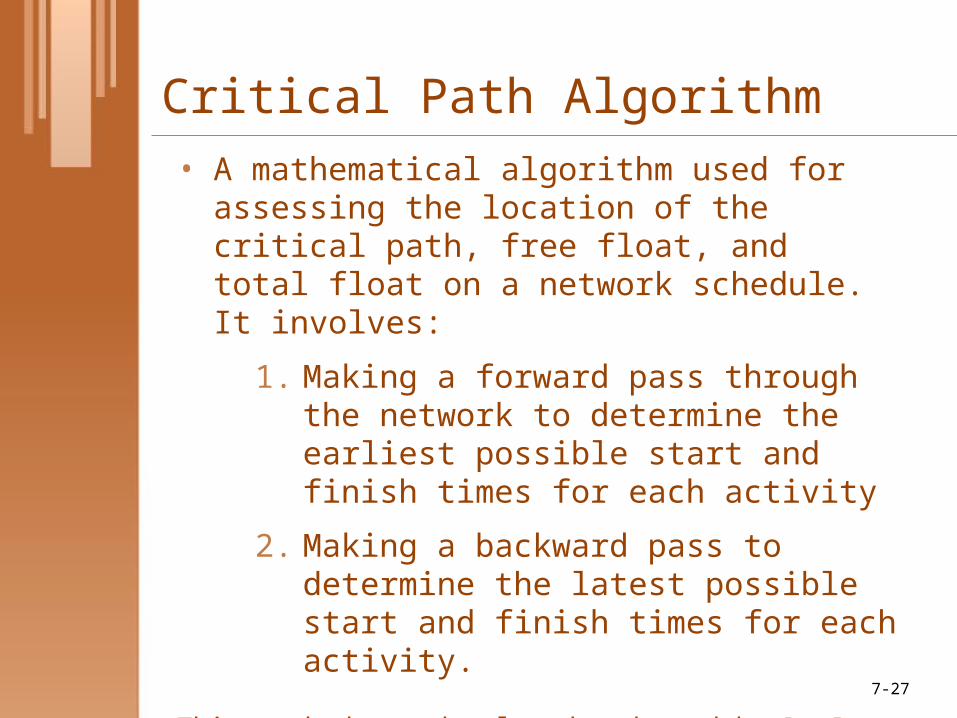
Critical Path Algorithm• A mathematical algorithm used for assessing
the location of the critical path, free float, and total float on a network schedule. It involves:
1. Making a forward pass through the network to determine the earliest possible start and finish times for each activity
2. Making a backward pass to determine the latest possible start and finish times for each activity.
This method was developed and used by Du Pont in the 1950s to bring order and substantial time compression to projects involving the closure of chemical plants during routine maintenance procedures.
7-27

Exhibit 7.17
Critical Path Algorithm
7-28

Exhibit 7.17
Critical Path Algorithm
continued
7-29

Exhibit 7.17
Critical Path Algorithm
continued
7-30
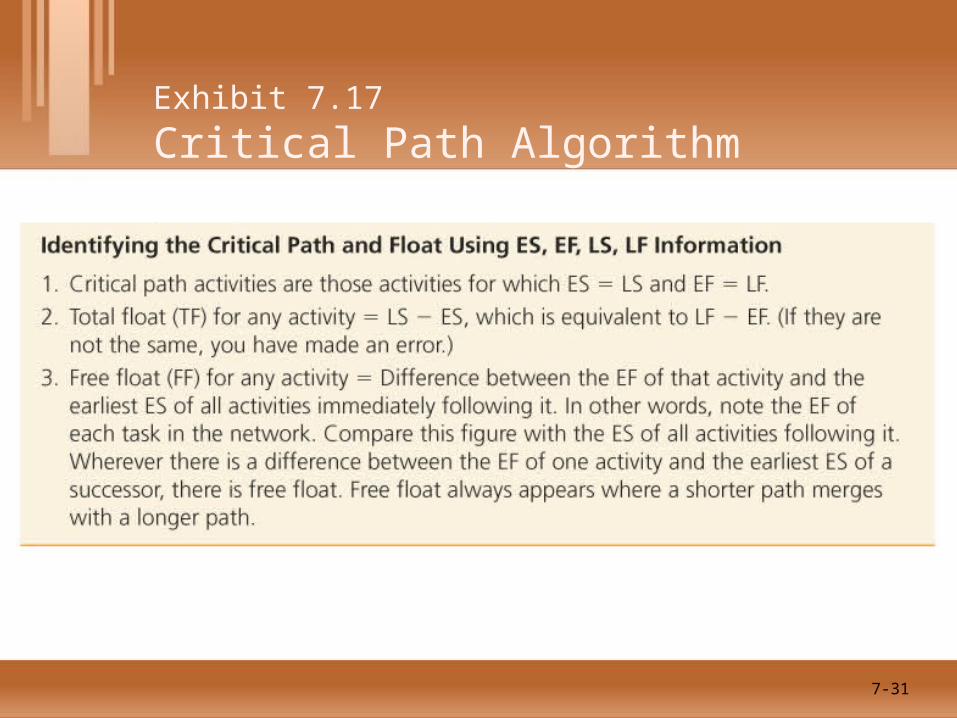
Exhibit 7.17
Critical Path Algorithm
7-31

Exhibit 7.18
Critical Path Algorithm Calculations for the Indian Call Center Project
7-32

Exhibit 7.19
Team-Based Process for Creating the Project Schedule
continued7-33
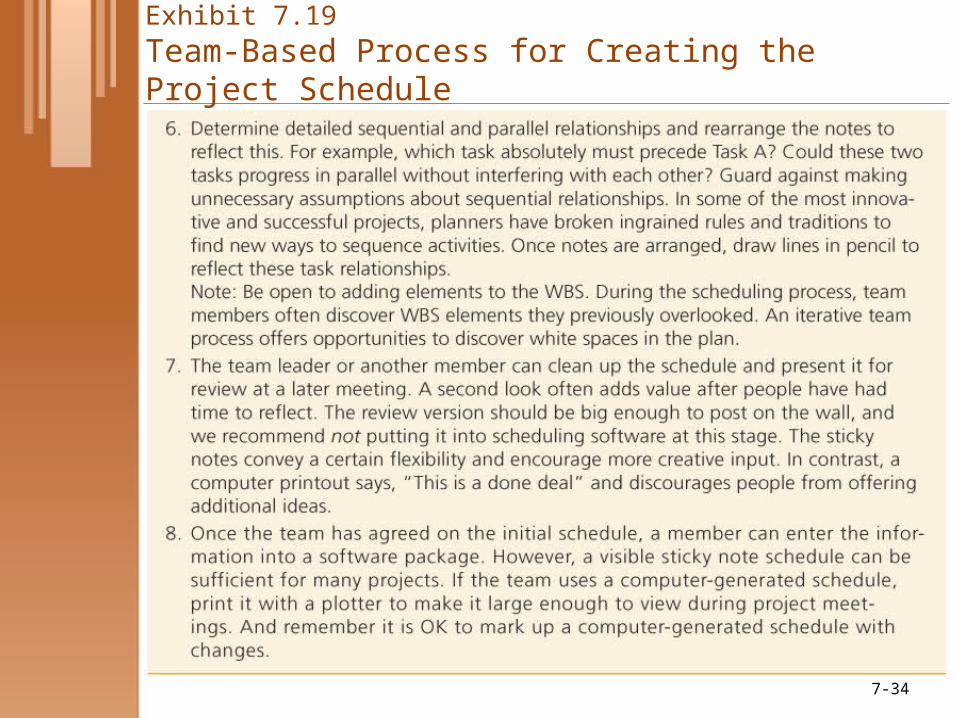
Exhibit 7.19
Team-Based Process for Creating the Project Schedule
7-34

Exhibit 7.19
Team-Based Process for Creating the Project Schedule
7-35
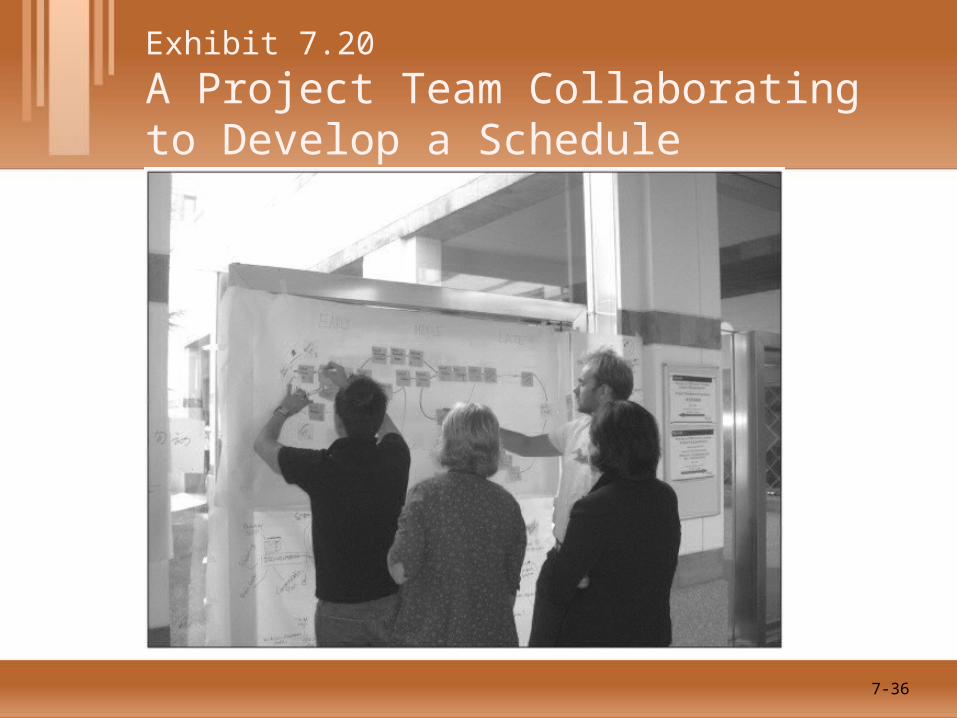
Exhibit 7.20
A Project Team Collaborating to Develop a Schedule
7-36
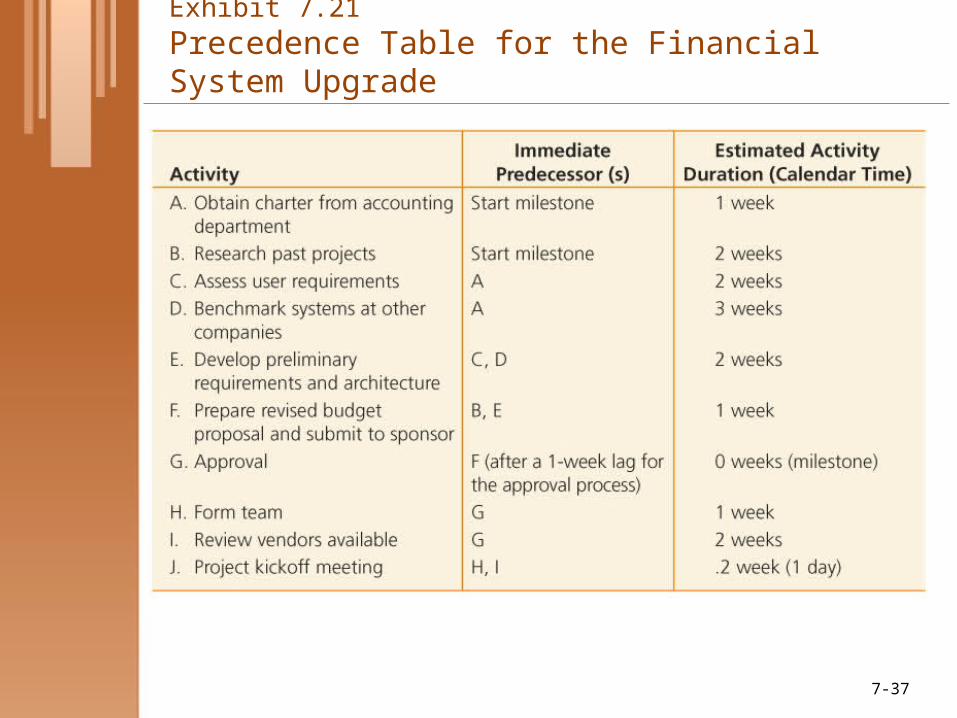
Exhibit 7.21
Precedence Table for the Financial System Upgrade
7-37

Exhibit 7.21
Network Diagram for the Financial System Upgrade Built from the Precedence Table
7-38
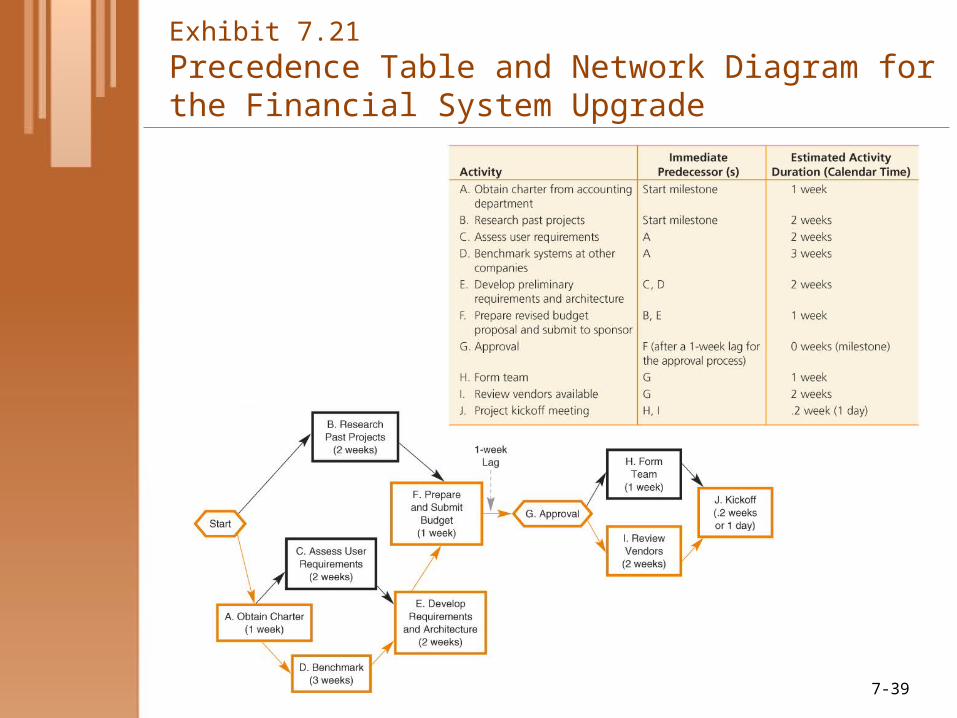
Exhibit 7.21
Precedence Table and Network Diagram for the Financial System Upgrade
7-39

Exhibit 7.22
Tips for Developing Network Schedules
Use Beginning and Ending Milestone Nodes If There is More Than One Activity at the Start or End of the Network. Begin every project with a single starting node and end every project with a single finish node. In some networks, there is a single beginning and a single ending task. If there is not, the team should create start and finish milestones to tie things together in the beginning and end.
Incorrect Form Correct Form
7-40
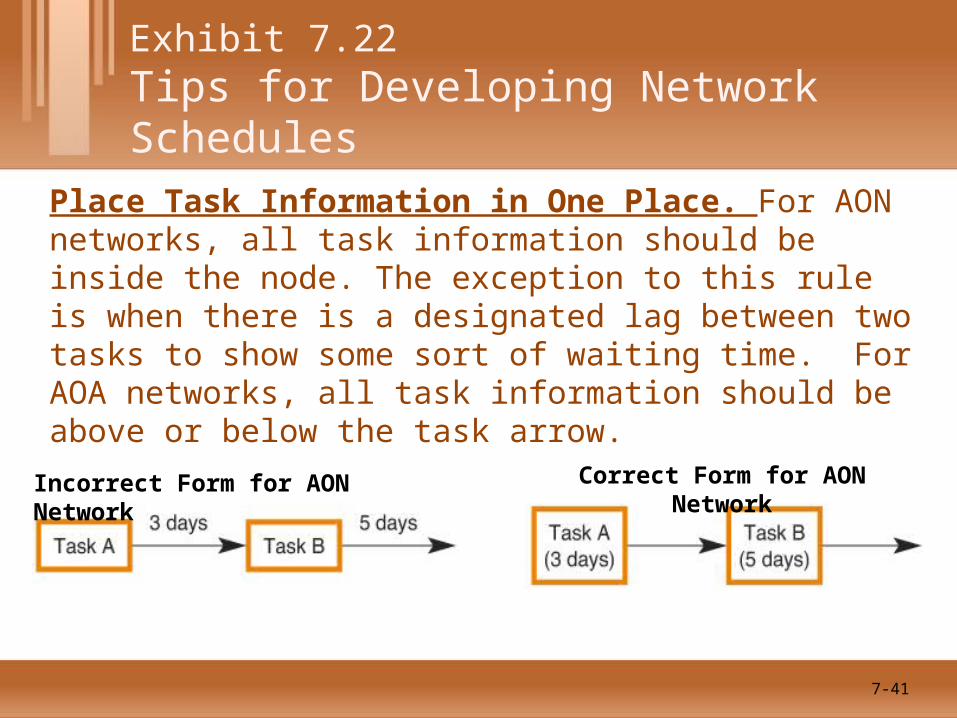
Place Task Information in One Place. For AON networks, all task information should be inside the node. The exception to this rule is when there is a designated lag between two tasks to show some sort of waiting time. For AOA networks, all task information should be above or below the task arrow.
Exhibit 7.22Tips for Developing Network Schedules
Incorrect Form for AON Network Correct Form for AON Network
7-41
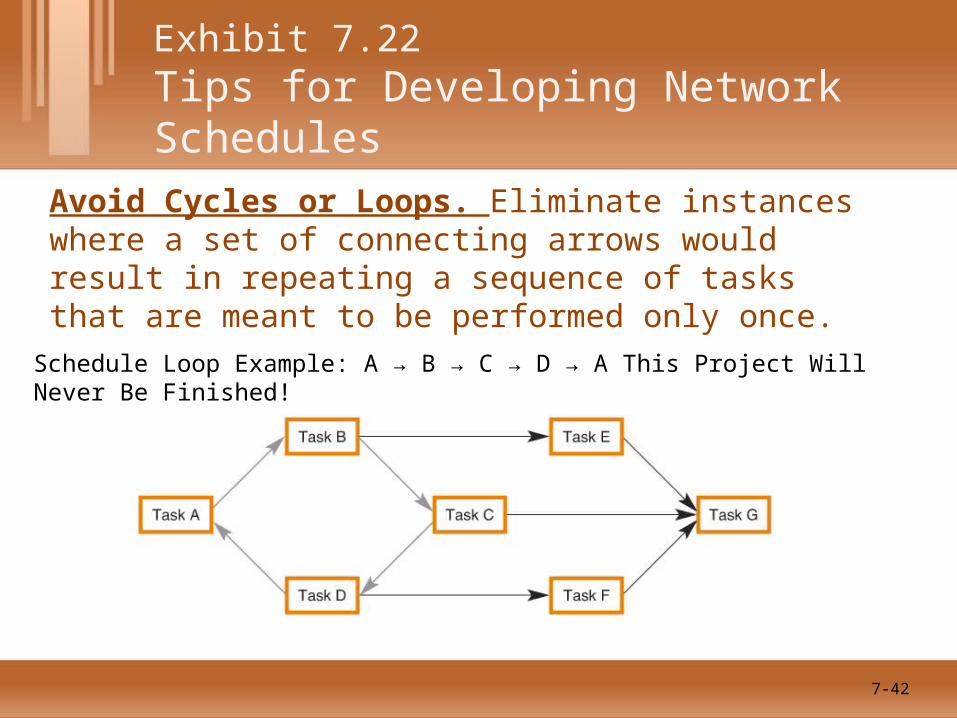
Exhibit 7.22Tips for Developing Network Schedules
Avoid Cycles or Loops. Eliminate instances where a set of connecting arrows would result in repeating a sequence of tasks that are meant to be performed only once.
Schedule Loop Example: A → B → C → D → A This Project Will Never Be Finished!
7-42

Exhibit 7.22Tips for Developing Network Schedules
Be Sure All Tasks Lead to the End. Every activity should connect with others leading to the end of the project. Nothing should be hanging without a place to go.
Task C Does Not Lead to Any Other Activity or to the End of the Project.
7-43

Exhibit 7.22
Tips for Developing Network Schedules
Be Consistent with Line Styles. Lines in an AON network should all be the same type, generally solid and not dashed. Dashed lines are reserved for use in specifying dummy activities in AOA networks and showing float in time-based networks.
Recognize that Some Tasks are Ongoing. A task that occurs during the entire life of a project and ends when the project is complete (e.g., monitoring performance or regular reporting to the sponsor) can be shown as a single task connected to the start node on one end and the finish node at the other end. These are known as hammock tasks.
7-44
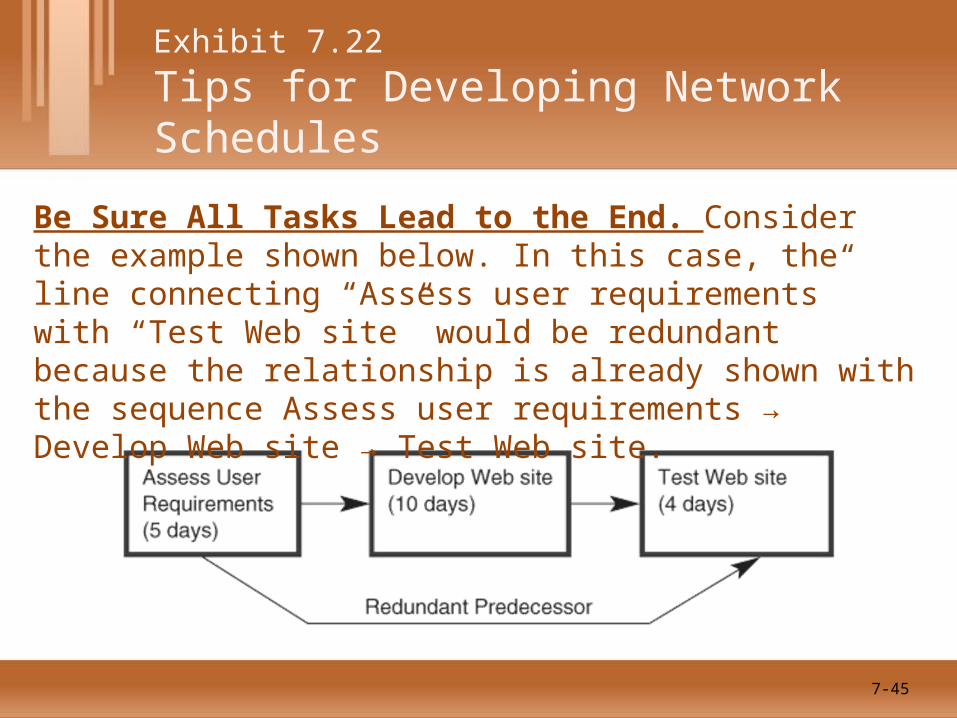
Exhibit 7.22
Tips for Developing Network Schedules
Be Sure All Tasks Lead to the End. Consider the example shown below. In this case, the line connecting “Assess user requirements” with “Test Web site” would be redundant because the relationship is already shown with the sequence Assess user requirements → Develop Web site → Test Web site.
7-45