csa 2011 section 1 summary report - open objects software ltd · report 2011. summary. report csa...
TRANSCRIPT

Redbridge Childcare
Sufficiency AssessmentReport 2011
SummaryReport
CSA 2011 - Section 1 Summary Report 1In partnership with CSK research

CSA 2011 - Section 1 Summary Report 2
Contents Section 1 Summary Report 1.1 Context 4 1.2 Objectives 4 1.3 Data used in the assessment 4 1.4 Definitions 6 1.5 Calculating sufficient childcare 7 1.6 The Policy Context 8 1.7 Outcomes and actions following the CSA in 2008 17 1.8 Summary of key messages - Is there enough childcare in Redbridge? 21 1.9 Gap analysis 24 1.10 Conclusion / Next steps 57 The full report is available by following the link below : http://www.redbridge.gov.uk/cms/education_and_young_people/pre_school/families_information_direct/is_there_enough_childcare_in_r.aspx
CSA 2011 - Section 1 Summary Report 3

Section 1 Summary Report 1.1 Context
The Childcare Sufficiency Assessment (CSA) is a legal duty, introduced by the Childcare Act 2006 that requires local authorities to review the supply of and demand for affordable and high quality childcare in their area every three years and to take steps to secure sufficient childcare for children and young people whose parents/carers are working or undertaking training that will lead to paid work. Each Local Authority must also ensure that there is access to free early learning for all eligible children aged 3 or 4 years and access to childcare for disabled children. Redbridge published its first Childcare Sufficiency Assessment report and Action Plan in March 2008. This summary forms part of Redbridge’s second Childcare Sufficiency Assessment.
1.2 Objectives
The assessment process aims to identify where there are gaps in the childcare market in Redbridge. The following types of gaps were investigated: • Income gaps: where there is a shortage of affordable childcare for the income groups
in the local area • Time gaps: where there is a shortage of childcare at a time that parents/carers wish
to use childcare. These could be at certain times of the day or days of the week, or might be seasonal, for example during school holidays
• Age gaps: where there is a shortage of childcare suitable to the needs and requirements of a certain age group
• Type gaps: where there is a shortage of childcare for which parents/carers may be expressing a preference
• Quality gaps: where there is a shortage of high quality childcare provision in Redbridge, particularly in areas of high deprivation
• Specific need gaps: where there is a shortage of suitable places for children with a disability, or children with other specific needs or requirements, including those from particular faiths or community groups
• Geographical gaps: where a geographical area has a general shortage of supply 1.3 Data used in the assessment
A wide range of data has been used to inform the assessment process. They include: • Socio-economic and demographic data: A range of factors may influence the
demand and the ability to pay for childcare. Existing data was used on: the child population, its location and how it is expected to change over time; family composition; children with disabilities; ethnicity; deprivation and risk factors relating to child poverty; labour market and economic activity data, to build a profile for Redbridge.
• Parent/carer demand surveys: Two surveys were carried out: the Childcare Survey and the Listening to Parents survey. The Childcare Survey is a continuous postal survey carried out by Families Information Direct (FiND) with parents and carers seeking childcare asking about their experiences of finding and using it, as well as suggestions for improvement. The Listening to Parents survey is a similar but one-off
CSA 2011 - Section 1 Summary Report 4
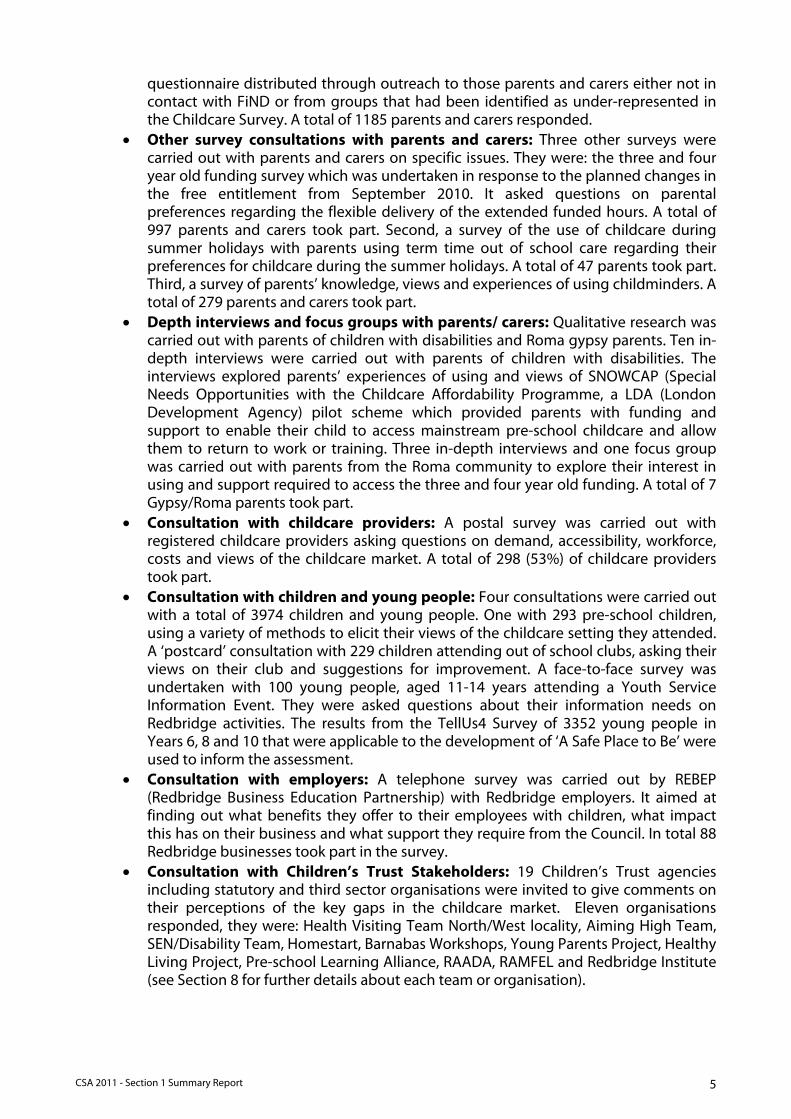
questionnaire distributed through outreach to those parents and carers either not in contact with FiND or from groups that had been identified as under-represented in the Childcare Survey. A total of 1185 parents and carers responded.
• Other survey consultations with parents and carers: Three other surveys were carried out with parents and carers on specific issues. They were: the three and four year old funding survey which was undertaken in response to the planned changes in the free entitlement from September 2010. It asked questions on parental preferences regarding the flexible delivery of the extended funded hours. A total of 997 parents and carers took part. Second, a survey of the use of childcare during summer holidays with parents using term time out of school care regarding their preferences for childcare during the summer holidays. A total of 47 parents took part. Third, a survey of parents’ knowledge, views and experiences of using childminders. A total of 279 parents and carers took part.
• Depth interviews and focus groups with parents/ carers: Qualitative research was carried out with parents of children with disabilities and Roma gypsy parents. Ten in-depth interviews were carried out with parents of children with disabilities. The interviews explored parents’ experiences of using and views of SNOWCAP (Special Needs Opportunities with the Childcare Affordability Programme, a LDA (London Development Agency) pilot scheme which provided parents with funding and support to enable their child to access mainstream pre-school childcare and allow them to return to work or training. Three in-depth interviews and one focus group was carried out with parents from the Roma community to explore their interest in using and support required to access the three and four year old funding. A total of 7 Gypsy/Roma parents took part.
• Consultation with childcare providers: A postal survey was carried out with registered childcare providers asking questions on demand, accessibility, workforce, costs and views of the childcare market. A total of 298 (53%) of childcare providers took part.
• Consultation with children and young people: Four consultations were carried out with a total of 3974 children and young people. One with 293 pre-school children, using a variety of methods to elicit their views of the childcare setting they attended. A ‘postcard’ consultation with 229 children attending out of school clubs, asking their views on their club and suggestions for improvement. A face-to-face survey was undertaken with 100 young people, aged 11-14 years attending a Youth Service Information Event. They were asked questions about their information needs on Redbridge activities. The results from the TellUs4 Survey of 3352 young people in Years 6, 8 and 10 that were applicable to the development of ‘A Safe Place to Be’ were used to inform the assessment.
• Consultation with employers: A telephone survey was carried out by REBEP (Redbridge Business Education Partnership) with Redbridge employers. It aimed at finding out what benefits they offer to their employees with children, what impact this has on their business and what support they require from the Council. In total 88 Redbridge businesses took part in the survey.
• Consultation with Children’s Trust Stakeholders: 19 Children’s Trust agencies including statutory and third sector organisations were invited to give comments on their perceptions of the key gaps in the childcare market. Eleven organisations responded, they were: Health Visiting Team North/West locality, Aiming High Team, SEN/Disability Team, Homestart, Barnabas Workshops, Young Parents Project, Healthy Living Project, Pre-school Learning Alliance, RAADA, RAMFEL and Redbridge Institute (see Section 8 for further details about each team or organisation).
CSA 2011 - Section 1 Summary Report 5

1.4 Definitions
The following definitions of ‘childcare’ and ‘sufficient’ have been used in the assessment: 1.4.1 Definition of childcare
The widest possible definition of childcare has been used as suggested by DCSF guidance:
“Any form of childcare for child including education and any other form of supervised activity – excluding those provided within school hours unless the child has not started Key Stage 1, care provided by parents, health service, residential or custodial care”
1.4.2 Definition of sufficient
Childcare is defined as sufficient if it meets the requirements of parents in an area to enable them to: • Take up, or remain in, employment • Undertake education or training that leads to paid employment • Access free early learning for their eligible child aged 3 or 4 years • Access childcare for their disabled child This duty must be exercised “as far as reasonably practicable”. This means that the local authority must take into account: • The state of the local childcare market, including the level of demand in a particular
locality and the amount and type of supply that currently exists; • The state of the labour market and the potential for increasing the number of people
working in childcare; • The resources available to, and capabilities of, childcare providers (resources means
not just the available funding, but also staff and premises, and capabilities will include experience and expertise);
• The need to develop an effective, phased programme to meet the sufficiency duty; • The local authority’s resources, capabilities, and overall budget priorities. Importantly, the guidance goes on to stress:
…it will be for the authority to decide what is sufficient given the needs of parents in its area. A local authority may not be failing to fulfil the duty simply because an individual parent’s particular need is not being met at a particular time, as it may be judged to be not reasonably practicable to do so. However, a local authority should not assume that it is not reasonably practicable to secure childcare that meets particular needs, such as childcare for a child with a disability or at atypical hours, just because it is difficult to do so.
CSA 2011 - Section 1 Summary Report 6
1.5 Calculating sufficient childcare
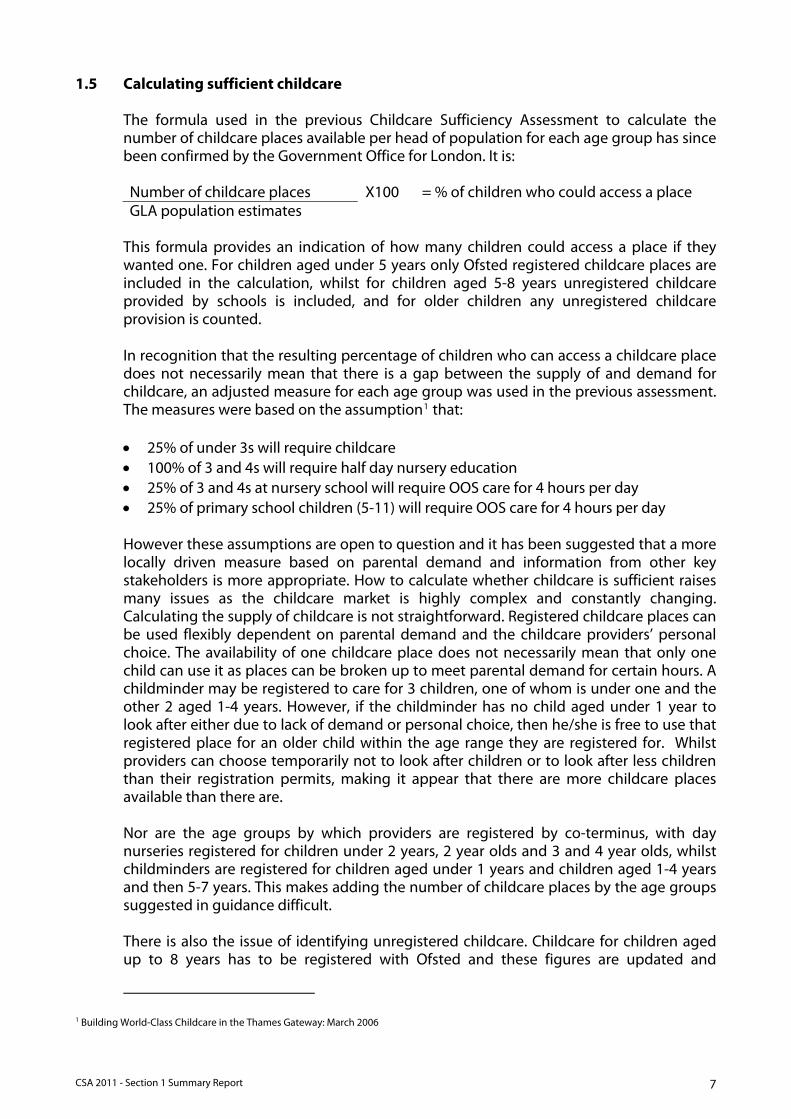
The formula used in the previous Childcare Sufficiency Assessment to calculate the number of childcare places available per head of population for each age group has since been confirmed by the Government Office for London. It is: Number of childcare places X100 = % of children who could access a place GLA population estimates
This formula provides an indication of how many children could access a place if they wanted one. For children aged under 5 years only Ofsted registered childcare places are included in the calculation, whilst for children aged 5-8 years unregistered childcare provided by schools is included, and for older children any unregistered childcare provision is counted. In recognition that the resulting percentage of children who can access a childcare place does not necessarily mean that there is a gap between the supply of and demand for childcare, an adjusted measure for each age group was used in the previous assessment. The measures were based on the assumption1 that: • 25% of under 3s will require childcare • 100% of 3 and 4s will require half day nursery education • 25% of 3 and 4s at nursery school will require OOS care for 4 hours per day • 25% of primary school children (5-11) will require OOS care for 4 hours per day However these assumptions are open to question and it has been suggested that a more locally driven measure based on parental demand and information from other key stakeholders is more appropriate. How to calculate whether childcare is sufficient raises many issues as the childcare market is highly complex and constantly changing. Calculating the supply of childcare is not straightforward. Registered childcare places can be used flexibly dependent on parental demand and the childcare providers’ personal choice. The availability of one childcare place does not necessarily mean that only one child can use it as places can be broken up to meet parental demand for certain hours. A childminder may be registered to care for 3 children, one of whom is under one and the other 2 aged 1-4 years. However, if the childminder has no child aged under 1 year to look after either due to lack of demand or personal choice, then he/she is free to use that registered place for an older child within the age range they are registered for. Whilst providers can choose temporarily not to look after children or to look after less children than their registration permits, making it appear that there are more childcare places available than there are. Nor are the age groups by which providers are registered by co-terminus, with day nurseries registered for children under 2 years, 2 year olds and 3 and 4 year olds, whilst childminders are registered for children aged under 1 years and children aged 1-4 years and then 5-7 years. This makes adding the number of childcare places by the age groups suggested in guidance difficult.
There is also the issue of identifying unregistered childcare. Childcare for children aged up to 8 years has to be registered with Ofsted and these figures are updated and
1 Building World-Class Childcare in the Thames Gateway: March 2006
CSA 2011 - Section 1 Summary Report 7

downloaded weekly to the Families Information Service (FiND). However childcare for children aged under 8 years run by and based in schools are not included in these figures since these groups do not require a separate registration with Ofsted but are inspected under the Ofsted schools inspection programme. Whilst childcare for children aged over 8 years is unregistered and registered providers may well provide care for these age groups but they don’t have to declare it in a systematic way. To identify and include these childcare places work had to be undertaken by the Extended Schools Team and the Childcare Development Team. Finally the childcare market is in constant flux, dependent on what childcare is available and the characteristics of those families looking for childcare at any given point want. The market is in a state of great flux at the moment due to changes in the economy, with more recent research uncovering evidence of decreasing parental demand and loss of childcare places due to the recession. These changes were not apparent six months ago when many of the stakeholder consultations were carried out upon which the findings of this report are based.
1.6 The Policy Context 1.6.1 National
The CSA is a statutory duty placed upon local authorities by the Childcare Act 2006. It requires that local authorities carry out an assessment on the supply of and demand for childcare in their area to enable them to strategically facilitate the local childcare market and secure sufficient childcare. The CSA builds on the Government commitment to the development of affordable, accessible and quality childcare for parents who want to remain in or return to work launched by the National Childcare Strategy in 1998. The National Childcare Strategy gave local authorities quantifiable targets to create new childcare places delivered by existing childcare providers or the development of new provision. The CSA enables local authorities to make more informed decisions on the future development of childcare. The CSA is central to government policy on children, young people and their families as high quality, accessible childcare can help tackle child poverty, improve health and academic achievement and reduce anti-social behaviour to improve outcomes in later life as set out by the Every Child Matters (ECM) agenda – Next Steps (March 2004) and Change for Children (December 2004) and supported by the Children Act 2004. The ECM agenda set out 5 clear outcomes for children and young people to be addressed and improved through the creation of Children’s Services Directorates consisting of local authority Education and Social Service - children and families departments and the local PCT Children’s Health Services. The outcomes are: • Be healthy • Stay safe • Enjoy and achieve • Make a positive contribution • Achieve economic well-being
The 10 Year Childcare Strategy – Choices for Parents – Best Start for Children (2004) brings together the National Childcare Strategy and ECM agendas. It aims to develop a childcare system fit for the 21st century, setting out a sustainable framework for childcare
CSA 2011 - Section 1 Summary Report 8
provision and support to parents to balance work and family life. Its four main principles are: • Choice: parents are better supported in the choice they make about work and family
life • Availability – childcare is available to all families and is flexible to meet their
circumstances • Quality – childcare services are among the best in the world • Affordability – all families are able to afford high quality children’s services that are
appropriate to their needs. The Childcare Act 2006 implemented through regulatory requirements across 2007- 8, re-enforced the 10 year Childcare Strategy and is the first piece of legislation specifically devoted to early years and childcare. The Act aimed to guarantee accessible, high quality childcare and other services for children under five and give parents greater choice in balancing work and family responsibilities. In addition to introducing the duty under which this report is produced the Act placed responsibility for childcare provision with local authorities, charging them with raising quality, improving delivery, and achieving better results. The Act required local authorities to have particular regard to the provision of services suitable for disabled children when assessing the sufficiency and supply of childcare in their area. It required local authorities to provide better joined up and accessible early childhood services through Sure Start Children's Centres and re-enacted the duty for local authorities to secure a free minimum amount of early learning and care for all 3 and 4 year olds whose parents want it. It extended the existing duty to provide information to parents, to ensure parents and prospective parents can access the full range of information they may need for their children right through to their 20th birthday. Local authorities were required to ensure that this service is available to all parents and that it is pro-active in reaching those parents who might otherwise have difficulty accessing the information service. The Act introduced the Early Years Foundation Stage (EYFS) bringing together and building on the existing Birth to Three Matters, Foundation Stage and national standards for under 8’s day care and childminding. It reformed and simplified the framework for the regulation of childcare and early education to reduce bureaucracy and focus on raising quality and standards. It is intended to play a key role in improving the life chances of all children, regardless of their family circumstances by setting a clear expectation of the care, learning and development they will receive, whatever the setting. Section 13 of the Act re-iterated the Local Authorities duty to secure the provision of information, advice and training to meet the needs of local childcare providers and support the sufficiency of childcare provision. The CSA is also central to the achievement of The Children’s Plan (2007) goals by 2020 in ensuring that every child is ready for success in school and has the skills for adult life and further study. By acting upon the results of the CSA, local authorities can help to ensure that high quality childcare is affordable and accessible to the whole community driving up standards to improve educational attainment in later life. Since the implementation of the CSA, the main aim of government policy on children and young people has been to target the most disadvantaged in our communities, resulting in the Child Poverty Act (March 2010). It sets four UK-wide targets to be met by 2020.
CSA 2011 - Section 1 Summary Report 9
These four targets are: • To reduce the proportion of children living on low incomes (relative poverty) to under
10% • To reduce the proportion of children living in combined low income and material
deprivation (a wider measure of people’s living standards) to under 5% • To reduce the proportion of children living on absolute low incomes to under 5% • To reduce the number of children living in persistent poverty (length of time). Target
to be set by 2015
The Act aims to establish an accountability framework for achieving the targets in which a Child Poverty Strategy is produced, refreshed every three years, which will set out actions needed to meet targets. The Act places a duty on all local authorities and their partners to co-operate and tackle child poverty locally. They are required to prepare and publish local needs assessment and prepare a joint local Child Poverty Strategy. Given the importance of childcare in tackling child poverty, the childcare sufficiency assessment is integral to the child poverty strategy locally. Aiming High for Young People In 2007, as part of on-going education and youth service reforms, the Government launched a 10-year plan for young people called ‘Aiming High for Young People: A Ten Year Strategy for Positive Activities’. It set out a strategy to transform leisure-time opportunities, activities and support services for young people in England. The strategy was supported by strong evidence which showed how getting involved can help teenagers to develop important social and communication skills, build their self-esteem and self-confidence, improve their attitudes to school and help them avoid taking risks such as experimenting with drugs, or being involved in crime or anti-social behaviour. Aiming High for Disabled Children (AHDC) Launched in May 2007, AHDC is a government transformation programme for services for disabled children, young people and their families. All Local Authorities received funding across 2008-11 to deliver the programme which aims to increase the numbers of disabled children accessing services and to: • Provide disabled children and families with the opportunity to have a say in
designing and developing the services they use • Ensure that services are responsive to the needs of children and their families and
that they offer support when needed, not just in a crisis • Improve service quality and capacity Changes to child benefit In October 2010 the government announced plans to change the child benefit system. It plans to end the current universal system in which all taxpayers are eligible to receive it if they have a child aged less than 16 years or aged 16-19 years if in relevant full-time education or training. Instead, from January 2013 child benefit would be withdrawn from households that have a higher rate tax payer. The current threshold for the higher rate is earnings of more than £43,875 per year, although this is set to drop to approximately £42,000.
CSA 2011 - Section 1 Summary Report 10

Lone parent target 2010 In 2007 the government announced plans to increase employment amongst lone parents from its (then current) rate of 57% to 70% by 2010. Additional funding was made available through Job Centre Plus to help lone parents find work, whilst their ability to claim Income Support was curtailed. Previously lone parents could claim Income Support up until their youngest child was 16 years old. However, from November 2008 lone parents could no longer claim Income Support on the sole basis that they were a one parent family once their youngest child was aged 12 years or older. In October 2009, the age of the youngest child was reduced again to 10 years old. Since October 2010 lone parents are no longer able to claim Income Support solely on the basis that they are a one parent family once their youngest child is aged 7 years or older. Changes to the Tax Credit System In 2010 the government announced a series of changes to Working Tax Credit (WTC) and Child Tax Credit (CTC). They are: • From April 2011 only 70% of childcare costs (rather than the 80% at present) will be
covered by the childcare element of the WTC. • From April 2011, both basic and 30 hour elements of the WTC will be frozen. It is
estimated that the overall loss to a family entitled to both elements would be £391 a year by 2013.
• From April 2012, for couples with children to be eligible to receive WTC, they will have to work at least 24 hours per week (rather than the current 16) between them, and one must work at least 16 hours per week. This means families where only one person works part time (for less than 24 hours) will no longer be eligible to receive WTC. In practice, the maximum loss of entitlement to WTC will be £73 a week; changes to the CTC would mitigate this loss slightly, increasing CTC by £5.60 per child per week.
The changes are likely to impact on low-income families although it is too soon to quantify precisely what they will be. Initial estimates suggest that the 1,200 families in Redbridge benefiting from the childcare element of the WTC in August 2008, whom may have to cover an additional 10% of their childcare costs. In addition there were 7,600 families receiving both the WTC and CTC and 800 families receiving WTC only. These 8,400 families could all potentially be impacted by the changes to the WTC.
1.6.2 Local
The CSA is central to Government policy on reducing child poverty and improving outcomes in later life and as such is integral to Redbridge Children’s Services policy developments and initiatives. The Children and Young People’s Plan (CYPP) provides the strategic framework within which the local authority and its partners work together to achieve the five outcomes of the ECM agenda and the Redbridge Childcare Strategy provides the framework for how Redbridge will deliver the objectives of the 10 Year Childcare Strategy. As the CSA pulls together consultations and work from across Redbridge Children’s Services it is important that its outcomes are fed into the development of the CYPP and Redbridge Childcare Strategy.
CSA 2011 - Section 1 Summary Report 11

Redbridge Sure Start Children’s Centres programme Children’s Centres were developed as part of the Every Child Matters agenda. They are open to local families with children aged less than 5 years and aim to improve outcomes for all children, particularly those in most need or at risk of exclusion. The core services offered by Children’s Centres are:
• Child and family health services, ranging from health visitors to breastfeeding support
• Most centres offer high quality childcare and early learning • Information and advice on local childcare options and services available in the
community to support parents , as well as healthy eating advice or help with managing money
• Help for parents to find work or training opportunities, using links to local Jobcentre Plus offices and training providers
There are currently 22 children’s centres in Redbridge. Children’s centres were developed in three phases (with the final phase due for completion on March 31 2011). Phase 1 centres are in the most disadvantaged areas of the borough; Phase 2 centres are in areas with pockets of deprivation or lower levels of overall deprivation and Phase 3 centres are in the remaining areas of the borough. Redbridge has: • 4 Phase one children’s centres • 10 Phase two children’s centres • 8 Phase three children’s centres While activities take place in all centres Phase 3 centres are not yet fully operational. The Coalition government has set out in it’s DFE Business Plan (November 2010) its intention to ‘retain a national network of Sure Start Children’s Centres with a core universal offer, while also ensuring that they deliver proven early intervention programmes to support families in the greatest need’ . Extended Schools Programme The Extended Schools programme aims to ensure that all children are able to access extended services through schools. The services offered through an extended school are: • Access to high quality ‘Wrap around’ childcare, available between 8am and 6pm all
year round. • Access to a varied menu of activities to be offered, including homework clubs, study
support and sport. • Support to parents, including information sessions for parents at key transition points
such as primary to secondary transfer. • Swift and easy referral to a wide range of specialist support services. • Providing wider community access to ICT, sports and arts facilities, including Adult
Learning.
CSA 2011 - Section 1 Summary Report 12

Safe Place to be ‘Safe Place to be’ is the concept that is applied to childcare as part of the Extended Services Strategy for key stage 3 – pupils aged 11-14 years. It aims to provide a menu of activity provision, alongside a central hub/chill out area for children to relax and do homework outside school hours between 8am to 6pm. Activities should be consistent and reliable, with a clear process for registration and supervision, affordable and advertised to parents.
The core offer of extended services has been in place since September 2010. Disadvantaged funding As part of the extended services subsidy, additional funding was available to schools between 2009 -11 to help them provide and commission a range of activities for children and young people who are disadvantaged by economic circumstances, and children in care. Schools consulted with parents, children and young people regarding the activities they would like prior to its implementation by April 2010. The additional funding enabled schools to commission activities from other providers without fear of passing on the charges preventing some children from accessing the activities Play Strategy The objectives of Redbridge Play Strategy are to: • Address the play needs of children and young people aged 0- 18 • Provide a clear framework for developing play provision in Redbridge between 2007-
2012 • Improve the quality of provision in Redbridge • Help everyone work together to make play better • Create a safer environment for independent play The achievement of the play strategy objectives impacts on the Childcare Sufficiency Assessment in particular for children aged 12-14, for whom access to a varied menu of enjoyable, positive activities is believed to be more appropriate than formal childcare.
Children and Young People’s Workforce Strategy The aim of the Children and Young People Workforce Strategy is to attract and develop a highly motivated, aspirational, diverse workforce, which is responsive to the needs of children, young people and their families or carers. To ensure Redbridge has sufficient level of childcare there needs to be a trained and qualified workforce, therefore the Children and Young People’s Workforce Strategy is potentially an important contributor to Childcare Sufficiency in Redbridge. Redbridge Special Educational Needs Strategy Redbridge SEN Strategy – takes account of the government 10-years strategy for Special Educational Needs “Removing Barriers to Achievement”.
CSA 2011 - Section 1 Summary Report 13

There are four key themes that the Government’s strategy covers: Early Intervention Removing Barriers to Learning Raising expectations and achievement Delivering improvements in partnership
One of the outcomes to the early identification theme is for parents to have access to good quality childcare and early year’s provision in their local community, which clearly overlaps with the aims and objectives of the Childcare Sufficiency Assessment.
Redbridge Commissioning Strategy The Childcare Sufficiency Assessment aim to make local authorities facilitators of the childcare market, will have an impact on Redbridge’s planning and commissioning role. Redbridge’s Commissioning Strategy will put in place a clear commissioning framework for children services provided to children and young people in Redbridge and this will include the review on how private, voluntary and independent providers of the free entitlement for 3 to 4 year olds are currently being commissioned. The Coalition government has set out in its DFE Business Plan (November 2010) its intention to ‘work with local authorities to develop a plan to increase the involvement of voluntary and community sector involvement with children’s centres’ . Single entry into primary schools Based on recommendations from the 2009 Independent Review of the Primary Curriculum (see below), since September 2010 all Redbridge Primary Schools have moved to a single entry intake.
The preferred pattern of entry to reception classes should be the September immediately following a child’s fourth birthday. However, this should be subject to well informed discussion with parents, taking into account their views of a child’s maturity and readiness to enter reception class. Arrangements should be such as to make entry to reception class an exciting and enjoyable experience for all children, with opportunities for flexible arrangements such as a period of part-time attendance if judged appropriate.2
This impacts upon the Childcare Sufficiency Assessment as it means that two thirds of 4 year olds are entering school earlier than at the time of the last CSA and do not require access to pre-school childcare. It increases the demand for ‘wrap around’ care. This has been taken into account when calculating the need for childcare places, particularly where early education is provided.
2 Independent Review of the Primary Curriculum: Final Report, DCFS 2009
CSA 2011 - Section 1 Summary Report 14

Extension of Early Education since 2008 Since the introduction of part-time early education for all three and four year olds in 2004, and its extension to 38 weeks per year in 2006 the scheme has been extended twice:
Disadvantaged 2 year olds pilot In September 2009, Redbridge introduced the pilot programme which extended part-time early education to some two year olds living in disadvantaged areas. Ten hours of free early education per week for 38 weeks per year were offered to 148 economically disadvantaged 2 year olds in the borough who met the eligibility criteria (See Section 3.7 for further details). The Coalition government have since indicated their intention to extend this offer in the future to all disadvantaged 2 year olds. This has implications for the demand for and availability of sessional childcare places. Extension of 3 and 4 year old funding hours In September 2010 the early education funding for 3 and 4 year olds was extended a second time to 15 hours per week, 38 weeks per year. The free entitlement was also to be offered more flexibility according to parents needs. In February 2010 a consultation was carried out with parents of pre-school children to gauge their preferences for its delivery. (See Section 4.3.3 for further details on the consultation findings). Redbridge Child Poverty Strategy 2011-2014 Redbridge’s Child Poverty Strategy was developed by the Child Poverty Working Group in 2011 and is currently out for consultation. The vision of this strategy is to work in partnership to reduce and lessen the effects of child poverty in the borough. Its findings are based on the Redbridge Child Poverty Needs Assessment - a comprehensive over view of child poverty in the borough – published in November 2010. Six priorities were identified they are to: • Join up working to better address child poverty • Support parents to move into work • Reduce burdens for low-income working parents • Address social inequalities • Improve educational outcomes and reduce achievement gaps • Mitigate future challenges An action plan has been developed for the first year of the strategy and further action plans will be developed for the remaining years in the future. Aiming High for Disabled Children (AHDC) Redbridge When AHDC commenced in Redbridge the Aiming High team undertook extensive consultation with parents/carers and children and young people. It became apparent that there was considerable dissatisfaction with the provision of short breaks and that holiday periods were particularly difficult, especially the six weeks during the summer. Children and young people were upset about the lack of choice available to them and felt that the services were all very similar. Younger children often wanted to be able to
CSA 2011 - Section 1 Summary Report 15

do things with their parents and siblings and teenagers wanted to be able to stay out later and take part in more adventurous activities. They also wanted ‘befrienders’ of a similar age, rather than older adults. As a result of AHDC funding, there are now a total of forty projects running within Redbridge, including family schemes, overnight stays, outdoor adventure activities, holiday clubs, befriending and after school clubs. Disabled Children’s Access to Childcare Initiative (DCATCH) In 2007, the Aiming High for Disabled Children (AHDC) programme announced an additional investment of £35 million to support service development by testing out ways of achieving better access to childcare for disabled children and young people. Ten pilot areas were then identified to work with the Disabled Children’s Access to Childcare (DCATCH) initiative. The Government provided all local authorities with additional funding in 2010-11, to support the implementation of new working practices developed under the Disabled Children’s Access to Childcare (DCATCH) pilots. The funding was to enable all authorities to learn from the pilots and seek to embed changes to practice locally to improve the services offered to disabled children and their parents in a sustainable way. DCATCH work in Redbridge is recorded within this report. (See Section 3.4.4) Redbridge Employment, Skills and Enterprise Plan 2011 (Draft) Redbridge Employment, Skills and Enterprise Plan sets out an analysis of Redbridge’s economic position and how the Enterprise Redbridge Partnership plans to both help more people into work and to develop a more skilled work force. Enterprise Redbridge includes a well represented providers forum, WorkREDBRIDGE, where providers of employment, skills and business support services share information, best practice and seek to work together to tackle worklessness and improve public service results at lower cost. They have developed a programme of initiatives to help disadvantaged people into work and will use any available funding to develop and catalyse new programmes over the next year. The WorkREDBRIDGE partnership is developing a co-ordinated ‘branded’ service, an umbrella under which a range of employment and skills providers deliver their services. This aims to provide a more joined up service to job-seekers and businesses, to provide both job-seekers and providers with better information about available support and develop appropriate referral routes and joined up pathways to employment. The WorkREDBRIDGE outreach programme takes place on a weekly basis at various locations around the borough. The sessions are designed to provide residents with basic information, advice and signposting to appropriate support, and enable providers to target people in different locations across the borough, recruit to their own services and where appropriate refer onto other relevant local providers.
CSA 2011 - Section 1 Summary Report 16
1.7 Outcomes and actions following the CSA in 2008 1.7.1 Introduction The following section outlines actions and initiatives that have been introduced since the
last CSA responding to some of the changes that parents wanted to see. Parents wanted Action taken More affordable childcare
A Working group was established to create strategy to improve the take up of tax credits. As a result of the strategy: The ‘Quids for Kids’ guide providing parents with information about the range of financial support available to families was updated and re- launched along with a new ‘Help with the costs of childcare’ guide that was made available to families through Families Information Direct; Schools; Children’s Centres; Childcare providers; Health centres; Libraries and on line as part of the Family Services Directory. ‘Advice shops’‘ were piloted in a Children’s centre in the South of the borough bringing together staff from Families Information Direct and Welfare benefits to advise parents about childcare and funding and guide them through applications for Tax credits . Children’s centre childcare settings ran a series of information workshops for parents in conjunction with HMRC (Her Majesty’s Revenue and Customs). HMRC also ran a training session for Children’s Centre Development workers ensuring that they had an understanding of the tax credits system and how it works to enable them to provide parents with basic information and advice. A referral system between Families Information Direct and the Welfare Benefits team was established so that families that needed additional support with benefits claims could be provided with individual help. A Welfare benefits advisor undertook a programme of visits to Children’s centre play sessions to provide parents with the opportunity to seek advice or support regarding claims. Loxford Children’s Centre successfully engaged with the local Roma community attracting more than 150 families to regular play and learn sessions. This allowed the team to build trust within the community and gain a better understanding of barriers to the use of education and early education/childcare. The borough became part of the government’s Two year old learning pilot and from September 2009 funding was in place to create access 10 free hours of early learning for up to 148 two year olds. By targeting disadvantaged families this project has improved access to early learning and childcare for children across the borough.
More information on help with childcare costs
Free early education makes a significant contribution to the costs of childcare for eligible children (3 and 4 year olds).There was an increase in the promotion of free early education places across the borough and a specific programme of outreach in the South of the borough commenced in October 2010 promoting free early education and tax credits. In 2008 the borough set up a childcare voucher scheme for its employees. Childcare Vouchers is a government scheme to encourage employers to support parents at work. Childcare voucher schemes are usually run on a salary sacrifice basis. Money goes into an account with a childcare voucher company, who then make payments directly to childcare providers. The amount deducted from an employee's salary is
CSA 2011 - Section 1 Summary Report 17

Parents wanted Action taken More information on help with childcare costs (cont)
free from tax and National Insurance (NI) contributions. This means each week employees using childcare vouchers save the tax and NI on that part of their salary. Employers also make savings on their employee NI contributions. It is proposed that this experience can be used to inform other local employers of the scheme and encourage their participation.
More inclusive mainstream childcare and children’s activities
A successful bid to the London Development Agency under the Childcare Affordability Programme resulted in funding for the borough to develop a scheme providing supported childcare places for children with disabilities. This allowed parents to explore work and training opportunities and childcare providers to develop their knowledge and skills of working with disabled children. The Special Needs Opportunities with the Childcare Affordability programme (SNOWCAP) provided places for 26 children. When the scheme came to an end Inclusion Funding was provided to continue support for children through to their admission to school. Further information on the scheme and its outcomes is available in section 4.4.2 of this report.
A workforce development programme was established under the Redbridge Aiming High programme targeting children’s activity providers. Funding enabled the commissioning of a variety of training that has been offered to all service providers, including domiciliary care agencies and universal services, as well as parents. The training has covered a wide variety of topics including play, working with different behaviours, epilepsy training including the administration of emergency medication and communication. The training has been very popular and feedback from the courses has been extremely positive. As a result of the AHDC training the SEN/Disability team will now be running a rolling training programme to continue to offer support for both parents and providers.
A similar programme targeting childcare providers is in process in 2010/11 under the DCATCH (Disabled Children’s Access to Childcare) programme. This encompasses a number of initiatives including a workforce development programme; consultation with parents regarding their experience of using childcare and seeking their input into the design of childcare; the recruitment and training of a network of specialist childminders across the borough; an audit of provision in Out of school care to allow further development of services.
The role of the Early Years Pedagogy Advisory Team (EYPA) was expanded to ensure that childcare providers have timely access to people with more specialist experience and knowledge who can give advice and develop inclusive practice in the setting; to support access to any specialist equipment required; to provide clear and concise information about the particular additional support needs a child has and the support and training available to help the setting make appropriate provision. Along with colleagues in the EYPA team the co-ordinator has an overview of children with specific needs in all settings and maintains links with other specialist services.
PSLA (Pre-school Learning Alliance) were commissioned to continue their ‘Equal Chances’ project providing enhanced childcare ratios to support the inclusion of children with SEN/disabilities in childcare settings providing early education for 3 and 4 year olds. Aiming High funded a Buddying Scheme run by the Youth Service, who trained up young volunteers to support a disabled young person to enable them to access Summer Uni courses. (Summer Uni sessions encompassed Arts and Music; Films, Media and Digital Arts; Information technology; Sports and ‘Study and Explore’).
CSA 2011 - Section 1 Summary Report 18

Parents wanted Action taken
More specialist provision for children with disabilities
A range of activity and parent support sessions have been established through the Children’s centre programme in partnership with colleagues from the Pre-school Home visiting team; Speech and language team and the voluntary sector. Three children’s centres have sensory rooms that can be used with parents and children. Further sessions are in development. Through the borough’s Play Builder project funds (further information below) ELHAP were able to build a water feature, tree house and underground tunnel play features which were designed in consultation with disabled young people.
Central information point for families of disabled children and young people
Following a successful Information Fair in 2008 our Families Information Direct Service (FiND) commenced the development of information about services for disabled children and young people. FiND worked with practitioners across the council and the voluntary sector and with parents to bring together a range of information and advice for families under the title ‘Informed Families’. This information is available to families who call the FiND help line or through a dedicated area of the online Family Services Directory. FiND are currently developing the borough’s register of disability to support the planning and development of services and to enable them actively promote services to individual families.
More children’s activities, including holiday sports activities and creative workshops for children and young people with disabilities
As a result of Aiming High for Disabled Children’s funding, we now have a total of forty projects running within Redbridge, including family schemes, overnight stays, outdoor adventure activities, holiday clubs, befriending and after school clubs. The new projects cover all age groups and disabilities. Families can access schemes directly and do not need to be known to the Children with Disabilities Team or wait for funding to be agreed. We have also focused on having a variety of services including specialist schemes, integrated schemes and universal services. With BIG Lottery funding Hatton Special School were able to provide play ranger schemes in the school holidays for families with autistic children – enabling siblings to attend activities together.
Specific children’s activities for young parents
Children’s Centres have sought to engage with young parents to provide activity sessions for them and their children. Sessions have been established in Hainault and Ray Lodge Children centres. The Young People’s Project, a well-established centre in central Ilford continues to provide access to a wide range of services for young parents including childcare; child/parent activities and training opportunities.
More out of school care particularly based in schools
11 new of out of school care providers have set up since 2008. Under the Extended schools programme – 6 schools have set up on site out of school provision either directly under the management of the school or commissioning a service from a private provider.
More resources for out of school clubs
In 2010 funding was allocated for the Childcare Development to assemble resource/ themed boxes to enhance out of school provision. The resources are either lent to out of school groups or used as part of in house training to demonstrate new ideas for play and learning. The loan scheme includes a wide range of resources to stimulate imaginative play ranging from a builders to a post office, garage to pirates; hairdressers, airports and
CSA 2011 - Section 1 Summary Report 19

Parents wanted Action taken More resources for out of school clubs continued
super heroes. These resources contribute to children meaningfully engaging and being involved in play and learning. In addition project boxes have been created – for example: • Weather – which includes rain gauges, weather charts , thermometers etc • Light and sound – sound boxes, sound experiments , torches etc • Photography – cameras, printers, photographic paper The team deliver a range of supporting training including ‘Involving older children’ which has been an issue raised by settings. They use their examples of resources to ensure providers are considering the needs of this group. As part of the scheme providers supply the Childcare Development Team with a plan showing how they intend to use the resources and how these will benefit the children, prior to borrowing them. They are also required to undertake a follow up evaluation of how children responded to and benefited from the activities and how they will be followed through as part of their on-going planning.
Children centres to be available borough wide.
Children’s centres have been established as part of a national programme with centres being developed in three phases. The final phase is due for completion by 31 March 2011 by which time there will be 22 centres across Redbridge providing a range of services for parents of children under 5 and their children .Parents have been consulted about the range of services offered in centres and Advisory boards in each Children’s trust locality include parent representatives.
More activities for young people
There have been a number of new initiatives providing activities for young people – the youth service developed a ‘Summer Uni’ programme that expanded across all holiday periods and provided a variety of free courses/activity sessions for young people. The sessions took place in locations across the borough and encompassed Arts and Music; Films, Media and Digital Arts; Information technology; Sports and ‘Study and Explore’. In 2010/11 1179 young people attended sessions. DCSF Playbuilder funding enabled LBR to improve play facilities for young people across the borough. At each site, consultation was carried out with young people in the area and current users to inform the design. These play areas were built, after some further consultation sessions with other users of the site, if necessary. The funding has enabled Redbridge to lead a step change in how play is provided in our borough. We have introduced ‘loose play’ features such as sand, bark and pebbles, natural features including boulders, planting and water. Each area is different, responding directly to the needs of the local community. We are encouraging greater risk taking to allow young people to assess risk for themselves and to keep their interest for a longer period. A wide range of activities for children are provided by Leisure and Library Services and providers in the voluntary sector these are promoted through a ‘Do more for Kids – Parks – Play – Sport – Nature – Arts - Learning ‘ brochure that is widely circulated in the borough and is also available on line through Redbridge I and the Family Services directory .
CSA 2011 - Section 1 Summary Report 20

1.8 Summary of key messages - Is there enough childcare in Redbridge? 1.8.1 Childcare analysis
Analysing the childcare market with all its complexities is a challenging task. As part of this analysis we have looked exhaustively at the available data and consulted widely with parents, childcare providers, people who work with parents and a range of stakeholder agencies and organisations in Redbridge. There is not an established formula that can be applied to determine sufficiency of childcare. There is rather a range of inter related indicators that can be used to help us to determine our progress in meeting the needs of parents who are working or training and in providing early education for all pre-school children in Redbridge . Consultation with parents and learning about their experiences of finding and using childcare is fundamental. But it’s complicated! Parents balance a wide range of factors when they make decisions about childcare – location; type of childcare they wish to use; affordability; availability in terms of hours and days. Alongside these practical issues are issues related to quality – what does the Ofsted report say; have my friends recommended it; how did the settings respond to my enquiry; how did I feel when I visited? All of these issues are balanced alongside the everyday ups and downs of family life and of responsibilities at work or college.
1.8.2 What does our research tell us?
In some instances we can confidently state that we have identified a gap or issue. In other areas while there maybe an indicator of unmet need it is clear that further research is necessary before we can reach firm conclusions and determine necessary future action. Priorities identified We are clear that there are five areas where we need to take action: 1 Early Education Places
Our data indicates an under supply of early education places in the South of the borough. This has been verified by an analysis of nursery class waiting lists indicating that there are children in the south of the borough aged 3 and 4 years who are on waiting lists for early education but have not been able to gain a place. Across the borough access for 2 year olds is either compromised by the high demand for places 3 and 4 year olds or where 2 year olds do access places this creates a gap in provision for 3 and 4 year olds. Further research is needed to clarify the position across Redbridge. We need to allocate further funding to ensure that the additional support a disabled child may need to be included in early education is available for all eligible children so that they can benefit from their full entitlement.
CSA 2011 - Section 1 Summary Report 21

We also need to enhance our data collection systems, monitoring the changing population in Redbridge, the provision of places and demand, so that we can be confident that we have enough places for children in early education as our population changes and grows over time. Free early education is a key factor in the affordability of childcare which is a further clear priority. 2 Affordable childcare The main barrier to parents using childcare is the cost. This was a common issue across parents in all circumstances but it is more significant for parents of disabled children whose children may need additional support in a childcare setting, lone parents who may be seeking to return to employment as well as parents who are on a low income, large families and some BME groups. It is essential that we continue to ensure that parents are fully informed about the support that is available to make childcare more affordable and that key stakeholders work in partnership to provide co-ordinated and timely support to parents actively seeking work or training to develop their skills and enable them to be ‘work ready’. 3 Childcare for disabled children We need to sustain and develop the work of the DCATCH (Disabled children’s Access to Childcare) pilot and the Families Information Direct – ‘Informed Families’ service. We need to increase the knowledge and skills of childcare providers and build parents confidence and trust in the childcare their children receive. We need to develop data collection systems to have a clear picture of the number of disabled children who are able to access childcare and to monitor progress. All of the above issues resonate with the findings of the Child Poverty Assessment. It is of particular concern that the area where we have identified a clear lack of early education places is one of the most deprived areas of the borough, while low income families are more likely to report that that free early education enables them to return to work or training. Other areas where there may not be enough provision but further research is needed are also in pockets of deprivation in Redbridge. 4 Information about childcare and childcare brokerage service It is absolutely essential that parents can find information advice and support when they are looking for childcare and early education. Our Families Information Direct is a high profile service that has strong working partnerships with practitioners who work with families such as health visitors; social workers; parent support advisors in schools and with children’s centres and a range of voluntary organisations. All of these partners provide additional means of channelling information to parents. Nevertheless it is clear that continued promotion of the service is essential and that in particular parents and practitioners may not be aware of the brokerage service3 which
3 A brokerage service is a service providing additional help and advice to parents who have been unable to find the childcare they need.
CSA 2011 - Section 1 Summary Report 22

needs further promotion not least as it is essential to our ongoing understanding of gaps in the childcare market.
A number of stakeholders talked about language barriers experienced by parents – we need to find new ways of delivering the service that can overcome these barriers. 5 Quality
While we seek to increase access to childcare it is essential that this goes hand in hand with improving quality. Early learning provision must be of high quality – evidence from the influential EPPE (Effective Provision of Pre-school Education) project shows that poor quality early learning and childcare adds no value in the long term while children who experience high quality early years provision are well placed to achieve better outcomes in school and beyond, and develop better social, emotional and cognitive abilities necessary for life-long learning. The quality ratings of day nurseries and out of school clubs in Redbridge are close to the national average, whilst our pre-schools need to achieve some outstanding inspection outcomes. Childminders in particular need the most support to improve their inspection outcomes. The target in Early Years is to reach and exceed national averages. We have too many settings across our provision who still only achieve a satisfactory outcome at inspection. If we are going to support continuous quality improvement we need to sustain and strengthen our current advisory workforce (Early Years Pedagogy Advisory team; Childcare Development Team) and ensure through joint planning that the most intensive support is targeted to settings where children are at greatest risk of poor outcomes. We need to consider how we can improve engagement with childminders by for example incentivising their participation in childminder networks or similar quality improvement programmes. Providers who are part of a quality assurance scheme are more likely to be judged good or outstanding. This is particularly the case for childminders. There is a strong correlation between participation in a quality assurance scheme and the extent to which providers embed ambition and drive improvement4. We need to establish a Quality Assurance scheme for out of school provision and encourage or incentivise the participation of all settings. The quality of the workforce is one of the most important factors in high quality early learning and childcare. It currently remains a DFE ambition that, by 2015, every full day care setting should be led by a graduate with two graduates in settings in the 30% most disadvantaged areas. We need to prioritise workforce development to ensure that we are able to achieve this in Redbridge and to improve the qualifications of the early year’s workforce across all childcare provision.
4 Ofsted Annual report 2009-10
CSA 2011 - Section 1 Summary Report 23

1.8.3 Additional research
We need to undertake further research about out of school care, in particular holiday care. There has been an increase in this area of provision since the last CSA but parents continue to report difficulties in finding out of school childcare and indicate a preference for childcare based in schools. Research undertaken as part of this CSA however shows that this issue is clearly more complex and may not be simply about places. More research is needed along with discussion about possible strategies for partnership working between schools, Youth and Leisure Services and the private and voluntary sector. We need to work with providers to support the development of flexible childcare. It is clear that we have a strong and active childcare sector in Redbridge. Our childcare businesses are primarily led by entrepreneurial women who are successfully providing childcare services and who generally respond positively and proactively to changes in demand. Increasingly more flexible work patterns are creating opportunities for parents to balance work and family responsibilities. However in a fast moving market and a recession the challenges faced by childcare providers in meeting these changes should not be underestimated. Providers may need additional support to consider the impact of changes on their ability to maintain high quality childcare and to sustain their businesses into the future.
1.9 Gap analysis
1.9.1 Income Gaps
I am a divorced single mum since last June. My son goes for a full day at X Day Nursery. I study part-time ... I asked my nursery if I could increase his time there for an extra 2 days full time. They have no spaces available till September. I have found [another nursery] who can take my son for 2 days all day but I can't find any funding to pay for this. I am at the moment on income support, CTC and CB. I called my lone parent advisor who told me it has to be with a specific college my course. I've found out from my tutor that [a different] Job Centre Plus has paid for a single parent to come to my college. There needs to be more funding available for people who are studying to pay for childcare. Lone Parent: West CT area
1.9.1.1 What is the size of the affordability gap?
Affordability is the biggest barrier to families taking up childcare and the main reason for dissatisfaction with childcare from families using it, as well as the main suggestion for improving childcare in Redbridge. • In 2007, Redbridge ranked as the 143rd most deprived local authority in England
according to the Index of Multiple Deprivation (IMD), and the 55th most deprived according to the Income Directly Affecting Children Index (IDACI). Within Redbridge approximately 27151 dependent children live in the top 30% most deprived areas nationally5. This is 49% of all dependent children.
5 Population data on children aged 0-15 years at LSOA, 2007
CSA 2011 - Section 1 Summary Report 24

• There may be 4637 families in Redbridge who do not use childcare because it is too expensive6. This equates to 15% of all families with dependent children in Redbridge. It is the biggest barrier to finding and using childcare.
• There may be 5300 families using childcare that are dissatisfied with its cost7. This equates to 17% of all families with dependent children in Redbridge. It is the most frequently mentioned reason for parental dissatisfaction with childcare.
• Among those using childcare affordability is also an issue, especially during school holidays. Parents using holiday clubs are more likely to be dissatisfied with its cost than those using term time out of school care (54% cf 28%). During term time families of an estimated 7558 children using a breakfast or after school club may be dissatisfied with its cost. During school holidays this may increase to families of 2403 children. This is equivalent to 3.9% of all children aged 5-10 years during term time and 12.6% of all children aged 5-10 years during school holidays. In a survey of parents using term time out of school care, over half (53%) said that they were not using a holiday club because it was too expensive.
• Average hourly fees are generally higher in Redbridge than in the London and England averages. Holiday schemes average hourly fees in Redbridge are higher than the London average but lower than the England average hourly fees. Day nurseries average hourly fees in Redbridge are higher than the England average but lower than the London average hourly fees. Fees in Redbridge are particularly high for childminders, breakfast clubs and after school clubs in comparison to the London and England averages. (See table below)
• Average hourly fees within Redbridge vary within each Children’s Trust (CT) area, with the fees of out of school and holiday clubs inconsistent with the relative affluence of each locality. (See table below) South is the most deprived and West the most affluent of the 3 CT areas, and it is anticipated that childcare would be cheapest in South and most expensive in West CT areas. Childcare for children aged under 5 years fits this profile, however out of school and holiday clubs do not. Instead out of school clubs are cheapest in North CT area and most expensive in West. Whilst holiday clubs are cheapest in West and most expensive in South CT areas. This suggests an affordability gap for families in South CT area wanting to use out of school and holiday clubs and for families in North CT area wanting to use holiday schemes.
Table 1: Average hourly fees
Area Childminders Day nurseries
Pre-school playgroups
Breakfast clubs
After school clubs
Holiday Schemes
NorthCentral CT £4.31 £3.88 £3.51 £3.56 £4.17 £2.25 South CT £4.12 £3.61 £2.83 £4.22 £4.30 £3.00 West CT £4.87 £4.28 £3.68 £5.00 £4.67 £2.02 Redbridge total £4.43 £3.92 £3.29 £4.26 £4.39 £2.42 London £4.14 £4.12 £3.00 £3.00 £1.93 England £3.32 £3.52
n/a £3.00 £3.00 £3.00
Source: Childcare Provider Audit 2009, FiND after school cost query Nov 2010 and Day Care Trust Costs Survey 2010 and Holiday Costs Survey 2010 • One hundred and twenty parents and carers suggested that offering more affordable
childcare would improve childcare services in Redbridge. Suggestions for making childcare more affordable included: offering funding support to workless families or
6 Figures extrapolated from Childcare Survey: childcare not found due to cost, and Listening to Parents Questionnaires: not using childcare due to cost. Based on 3.86% sample of households with dependent children. 7 Figures extrapolated from Childcare Survey and Listening to Parents questionnaire: dissatisfaction with cost of childcare 8 Figures as above, multiplied by Redbridge average family size (2.65)
CSA 2011 - Section 1 Summary Report 25

those on low incomes, lone parents and families with multiple children aged under 5 years, offering more flexible hours, waiving deposits and providing more community nurseries.
• Cost was an issue in the depth interviews with parents of children with disabilities. They specifically highlighted that without the provision of funding support from the SNOWCAP scheme their child would have been unable to access mainstream childcare. Some parents said that the funding support they received to pay deposits and initial fees as they settled their child in before starting work was important. Other parents said that they would not be able to continue working or studying without the on-going full or part-payment of childcare fees. All parents felt that they would be unable to cover the costs of a support worker for their child which was vital to their child’s inclusion.
• Children’s Trust stakeholders felt that affordability was a key issue for all families. They felt that parents are often unaware of the funding available to help them with childcare costs, particularly tax credits. They pointed out that even if parents are aware of the availability of tax credits they don’t necessarily use them because of the eligibility criteria.
• Seven percent of employers (n = 6) said that their staff had faced difficulties working due to affordability issues with childcare. It was the most frequently mentioned difficulty faced by staff.
• Twenty-four per cent of young people (n = 804) in the TellUs4 Survey said that the cost of activities, being too expensive, prevented them from doing what they would like to. This was the second biggest barrier to participation mentioned, with lack of time (25%) the main barrier.
• Childcare providers in South CT area experienced the highest rate of their business being affected by the late payment of fees by parents but expressed a middle rate of being able to deal with these situations when they occurred.
1.9.1.2 Does affordability affect some groups more than others?
The findings from consultation with parents and carers and Children’s Trust Stakeholders suggest that parents were more likely to find cost a barrier to childcare if they possessed one of the following characteristics: • Lone parent families are more likely to want childcare (92%) than two parent
families (89%), but are less likely to find it (52% cf 59%). They are more likely to attribute not finding childcare to affordability. For example, 39% of lone parents who were either not using or had been unable to find childcare said it was because it was too expensive compared to 38% of all parents. Lone parents who are using childcare are more likely to report affordability issues. For example, 39% of lone parents using childcare said that they were dissatisfied with its cost compared to 32% of two parent families.
• Parents/ carers with a disability were less likely to find childcare than all other families (37% cf 58%) and were more likely to attribute this to affordability issues. For example, 46% of parents/ carers with a disability said that they were either not using or had been unable to find childcare because it was too expensive, compared to 38% of all families – an 8% difference.
• Families of a child with a disability or special educational need (SEN) were less likely to use childcare than other families (47% cf 61%). This is a 14% difference. Childcare being too expensive was the second biggest barrier to finding childcare for families of a child with a disability (37%). Both parents/ carers and Children’s Trust Stakeholders felt that families of children with disabilities were more affected by
CSA 2011 - Section 1 Summary Report 26
affordability when they have to pay additional costs for their child to access childcare, such as to fund additional staff.
• Low income families were less likely to use childcare than other families. For example, 56% of families on an average annual household income of £15000 or less were using childcare compared to 68% of families on incomes of £25000 and above. Low income families that were looking for childcare were less likely to find it than families on higher incomes. For example, 51% of families on an average annual household income of £15000 or less found childcare compared to 66% of families on incomes of £25000 and above. They were more likely to attribute this to the affordability of childcare, with 51% of families with an average annual household income of less than £15000 reporting either not using or being unable to find childcare because it was too expensive compared to 29% of families with an average annual household income of more than £25000. Children’s Trust Stakeholders felt that families that are not eligible for tax credits such as low income families earning over the threshold or where only one parent is working would be more affected by affordability issues.
• Families with three or more children were less likely to want childcare (87%) than families with two children or less (90%) and were slightly more likely to find it (59% cf 58%). Those that either were not using or had been unable to find childcare were more likely to attribute this to affordability issues. For example, 47% of families with three or more children either not using or unable to find childcare reported that this was because it was too expensive compared to 38% of all families.
• Families from certain Black and Minority Ethnic (BME) backgrounds were less likely to find childcare. For example, 51% of Pakistani, Bangladeshi and Asian other families and 54% of Black British families found childcare compared to 59% of White British families. They were more likely to attribute not finding childcare to affordability issues. For example 47% of Pakistani, Bangladeshi and Asian other families and 38% of Black British families said that they were not using or had been unable to find childcare because it was too expensive, compared to 23% of White British families. Whilst Children’s Trust Stakeholders felt that families where English is an additional language made it difficult for them to access information on help with childcare costs.
1.9.1.3. Are parents/ carers taking up the childcare element of the Working Tax Credit (WTC)?
In the 2008 Childcare Sufficiency Assessment, Redbridge identified that it had a low take up of the childcare element of working tax credit compared to estimates of anticipated take up made by HMRC. Following the assessment a Working Tax Credit Strategy Group was set up to address the issue. A range of initiatives were developed including a refreshed information campaign by the Families Information Service (FiND). The take-up of the childcare element of working tax credit in Redbridge has risen from 13%in 2008 to 14.55% in 2010. However, Snapshot data for April 2010 shows that Redbridge still has a lower take-up of the childcare element of working tax credit than the national (18.54%), London Regional (18.38%) and Outer London East and North East (18.62%) averages. Redbridge’s low take up of tax credits despite increased promotion may be due to the specific demographic make- up of the authority. Two key characteristics impact on take up; family size and ethnicity. Families with large numbers of dependent children as well as families from Pakistani and Bangladeshi communities are less likely to have both parents in paid employment. As this is the basic eligibility criterion for receiving the childcare element of WTC it means that fewer Redbridge families are likely to be eligible for Working Tax Credit than estimates suggest. The low take up of the childcare element
CSA 2011 - Section 1 Summary Report 27
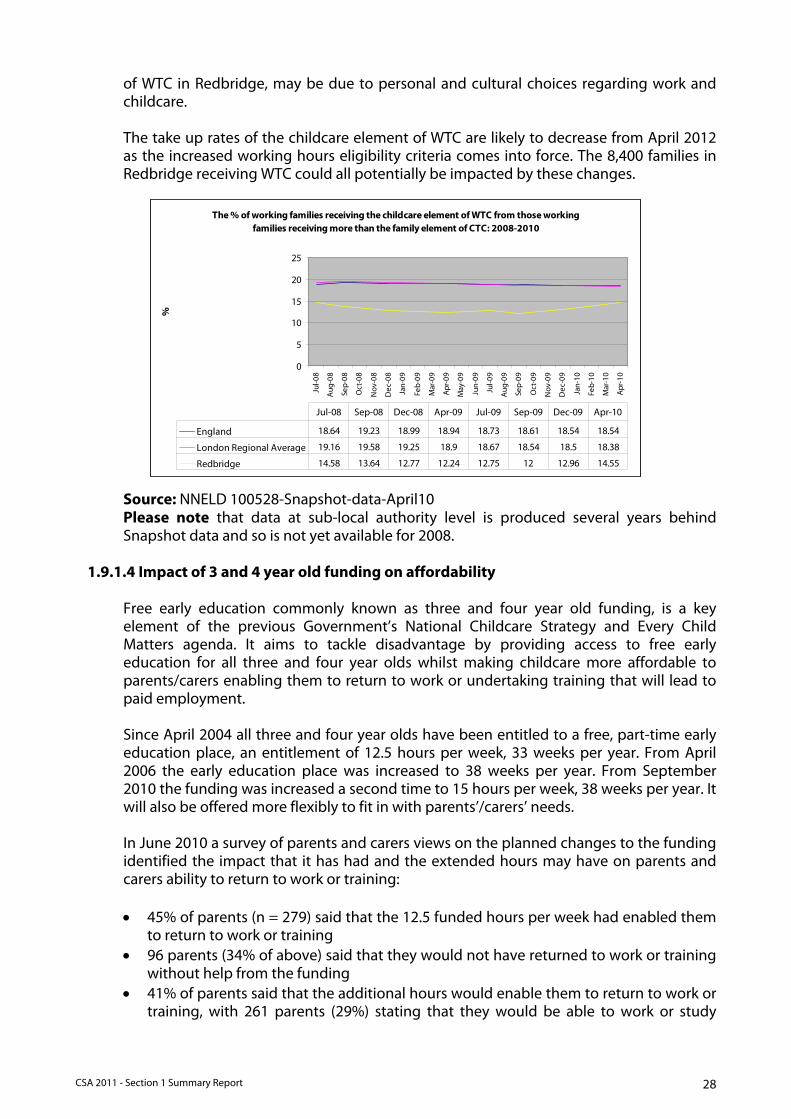
of WTC in Redbridge, may be due to personal and cultural choices regarding work and childcare. The take up rates of the childcare element of WTC are likely to decrease from April 2012 as the increased working hours eligibility criteria comes into force. The 8,400 families in Redbridge receiving WTC could all potentially be impacted by these changes.
The % of working families receiving the childcare element of WTC from those working
families receiving more than the family element of CTC: 2008-2010
0
5
10
15
20
25
Jul-0
8
Aug
-08
Sep-
08
Oct
-08
Nov
-08
Dec
-08
Jan-
09
Feb-
09
Mar
-09
Apr
-09
May
-09
Jun-
09
Jul-0
9
Aug
-09
Sep-
09
Oct
-09
Nov
-09
Dec
-09
Jan-
10
Feb-
10
Mar
-10
Apr
-10
%
England 18.64 19.23 18.99 18.94 18.73 18.61 18.54 18.54
London Regional Average 19.16 19.58 19.25 18.9 18.67 18.54 18.5 18.38
Redbridge 14.58 13.64 12.77 12.24 12.75 12 12.96 14.55
Jul-08 Sep-08 Dec-08 Apr-09 Jul-09 Sep-09 Dec-09 Apr-10
Source: NNELD 100528-Snapshot-data-April10 Please note that data at sub-local authority level is produced several years behind Snapshot data and so is not yet available for 2008.
1.9.1.4 Impact of 3 and 4 year old funding on affordability
Free early education commonly known as three and four year old funding, is a key element of the previous Government’s National Childcare Strategy and Every Child Matters agenda. It aims to tackle disadvantage by providing access to free early education for all three and four year olds whilst making childcare more affordable to parents/carers enabling them to return to work or undertaking training that will lead to paid employment. Since April 2004 all three and four year olds have been entitled to a free, part-time early education place, an entitlement of 12.5 hours per week, 33 weeks per year. From April 2006 the early education place was increased to 38 weeks per year. From September 2010 the funding was increased a second time to 15 hours per week, 38 weeks per year. It will also be offered more flexibly to fit in with parents’/carers’ needs. In June 2010 a survey of parents and carers views on the planned changes to the funding identified the impact that it has had and the extended hours may have on parents and carers ability to return to work or training: • 45% of parents (n = 279) said that the 12.5 funded hours per week had enabled them
to return to work or training • 96 parents (34% of above) said that they would not have returned to work or training
without help from the funding • 41% of parents said that the additional hours would enable them to return to work or
training, with 261 parents (29%) stating that they would be able to work or study
CSA 2011 - Section 1 Summary Report 28

during the 15 free funded hours and 109 parents (12%) stating that it would make additional childcare more affordable
• 13% (118) of parents/carers said that the additional free funding hours would not enable them to return to work/training as they were unable to afford additional childcare
1.9.2 Time gaps
I work in West London and commute to Paddington via the underground. I would therefore appreciate a nursery that could look after my children from 7am until 7pm to fit in with my husband’s and my own work schedules which is 8.30.m until 5.30/6pm Parent: South CT area I found one childminder who is ready to look after my 4 year old daughter in very early hours at 6am in the morning but ... it [was] difficult ... Childcare services in Redbridge should improve facilities for single parents who are starting work or studying in early hours. Lone Parent: North Central CT area
1.9.2.1 What is the size of the time gap?
The opening times of childcare provision can be a barrier to its use, although to a smaller extent than affordability. Findings from the parent consultation show: • There may be 2539 parents and carers9 who are not using childcare or were unable to
find childcare because the times available were inconvenient. Opening times were the fourth biggest barrier to using childcare.
• There may be 2746 parents and carers10 using childcare that are dissatisfied with the times it is available. The opening times of childcare was the second highest reason for parents and carers being dissatisfied with the provider they were using.
• Parents using day nurseries are the most dissatisfied with the times available of their childcare. For example, 21% of parents and carers are dissatisfied with the opening times of day nurseries compared to 7% of parents using childminders.
• There may be 337 parents and carers11 who are using (n = 78) or want (n = 259) childcare overnight in Redbridge.
• There may be 1217 parents and carers11 who are using (n = 233) or want (n = 984) childcare at weekends.
• Children’s Trust stakeholders generally agreed that parents experience difficulties finding childcare to fit with the working or training hours, especially if the parent is working atypical hours i.e. outside school or typical nursery hours. They pointed out that parents either have to find childcare provision that fits with their time needs which has a cost implication or they have to rearrange their working hours around providers’ availability.
9 Figures extrapolated from Childcare Survey: childcare not found due to times available, and Listening to Parents Questionnaires: not using childcare due to times available. Based on 3.86% sample of households with dependent children. 10 Figures extrapolated from Childcare Survey and Listening to Parents Questionnaires: satisfaction with times available. Based on 3.86% sample of households with dependent children. 11 Figures extrapolated from Childcare Survey and Listening to Parents Questionnaires: times childcare wanted. Based on 3.86% sample of households with dependent children.
CSA 2011 - Section 1 Summary Report 29

• One employer said that their staff had faced difficulties working due to the opening times of childcare making them late for work.
• Twenty per cent of young people (n = 670) in the TellUs4 Survey said that activities not being available at a convenient day or time prevented them from doing what they would like to. This was the fourth biggest barrier to participation mentioned.
1.9.2.2 When is the opening time gap?
The findings from the consultations suggest that the availability of childcare at atypical times for children aged under 5 years may be the biggest opening time gap. Information from open questions in the parent and carer consultations indicates what times they would like childcare available for during the day. • Among those parents and carers (n = 30) who suggested that longer opening hours
of would improve their experience of childcare in Redbridge, two thirds wanted longer hours for full day care. This means that an estimated 492 parents may want longer opening hours for full day care. Most parents wanted full day care to start earlier with suggested opening times of either 7:00 or 7:30am.
• Supply data shows that there are far fewer childcare places available between 6:00am and 8:00am and after 6pm relative to the total number of places for all age groups. For example, there are 22 childcare places for children aged 0-4 years and 23 places for children aged 5-7 years between 6am – 7am. These places are all offered by childminders as the first day nursery opens at 6:45am and the first breakfast club opens at 7:15am.
• Supply data shows that there aren’t enough childcare places available overnight or at weekends to meet either the stated or estimated needs of parents and carers. For example, there are 9 registered childminders offering one or sometimes two childcare places overnight in Redbridge. Whilst there are 46 registered childminders offering a total of 105 childcare places on Saturdays and 84 childcare places on Sundays in Redbridge.
1.9.2.3 What is the size of the flexibility gap?
We [are] dissatisfied with times (availability). My wife finishes her job at 1pm and cannot pick up the child until 1.30pm. No nurseries in Redbridge are flexible to accommodate. Morning sessions are from 7.30-1pm, afternoon from 1-6.30pm Parent: North Central CT area I'm currently using X nursery and I'm very happy with it. However I would need to use just 2 half a day sessions from January onwards and this is not allowed; they require a minimum of 3 half days. More flexibility would be nice. Parent: West CT area
Many childcare providers in Redbridge have been responsive to changing work patterns and parents’ needs for more part time hours. However more recent evidence suggests that this issue is escalating as the effects of recession are impacting on parents and subsequently the childcare market. This is an issue that will need ongoing monitoring. The findings show that parents and carers would like to use childcare more flexibly:
CSA 2011 - Section 1 Summary Report 30
• Eleven parents and carers suggested that the availability of more flexible childcare hours would improve childcare in Redbridge. This may mean that 34012 parents and carers want more flexibility. One third of parents wanting greater flexibility felt that it would make childcare more affordable. Suggestions about the type of flexibility wanted included more full day care available during term times only, greater flexibility of sessions offered during the day and offering 1 day per week.
• In June 2010 two thirds of parents were using the 3 and 4 year old funding over 5 days during term times. However from September 2010 six out of ten parents (61%) said that they would like to use the extended funding hours more flexibly. One third wanted to use the funding over 3 days per week during term times, 16% wanted the funding spread over 51 weeks, 6% wanted the funding over 4 days per week during term times, whilst 3% wanted ‘other’ hours. These included different hours each day (1.3%), over 2 days (1.1%) and dependent on work (0.6%).
• 51% of day nurseries in Redbridge, surveyed between December 2010-January 2011 asking about recent changes in the pattern of childcare, said that there had been a fall in the demand for full-time places and an increase in the demand for part-time, more flexible sessions and the funded 3 and 4 year old hours only.
1.9.2.4 Do time gaps affect some groups more than others?
There is also evidence to suggest that some parents and carers are more affected by the opening times of childcare than others. Further information needs to be collected on parents working irregular hours and their need for childcare to investigate this issue in more detail. • Lone parent families are more affected by the opening times of childcare than 2
parent families, with 23% of lone parents saying that they were not using childcare because the times available were inconvenient. Lone parents using childcare were more likely than 2 parent families to be dissatisfied with the times available (17% cf 16%).
• Families where the main carer is working part-time (27%) are less likely to be using childcare because the times available are inconvenient compared to all families (21%).
• Families where the main carer is studying are less likely to find childcare because the times available are inconvenient compared to all families (27% cf 21%). Where childcare is used then families where the main carer is studying are more likely to be dissatisfied with the times available (18%).
• Families living in West CT area are more affected by the opening times of childcare than those living in the rest of Redbridge. Families in living West CT area not using childcare are more likely to report that it was because the times available were inconvenient (25% compared to 21% in North Central and 20% in South CT areas). Families in West CT area (20%) that are using childcare are more likely to be dissatisfied with the times available than other families.
• Parents with a disability were less likely to be using childcare because the times available were inconvenient. For example, 25% of parents with a disability reported not using or finding childcare due to inconvenient times compared to 21% of all families.
12 Figures extrapolated from the Childcare Survey, based on 3.23% sample of households with dependent children
CSA 2011 - Section 1 Summary Report 31

1.9.3 Type gaps 1.9.3.1 What is the size of the type gap?
Childcare could be improved for some parents already using it by having access to a different type of childcare. Forty-four percent of parents said that they were dissatisfied with at least one aspect of the childcare they were using. There may be 8031 parents using childcare that doesn’t fully meet their needs. Three quarters of parents (77%) who were dissatisfied with at least one aspect of the childcare they were using said that they continued to use it because there was no other choice. However, under one quarter (23%) said that it was because the provider was the best choice available in terms of either quality, affordability, opening times and meeting their child’s needs. The survey of planned changes to 3 and 4 year old funding identified 204 parents who wanted to change the childcare they were using. Forty-eight percent were parents of children aged 1 or 2 years and they wanted to change their childcare once their children were eligible for the free entitlement. Over half (52%) were parents of children already aged 3 and 4 years who were dissatisfied with their current childcare. The majority of these parents (81%) wanted to move from their current provider to a school nursery. Based on the above data and suggestions for improving childcare in Redbridge there may be 481 parents whose needs could be better met by using a different type of childcare. Specific information on parental preferences for using a different type of childcare would need to be collected to confirm the size of the type gap. Eight out of ten parents (87%) made suggestions for improving childcare during term times. Six percent of parents made suggestions for improving childcare during school holidays. Six percent of parents made suggestions for improving childcare for children with disabilities or SEN.
1.9.3.2 What type of childcare is there demand for?
The different types of childcare that parents wanted were: • There may be 31 parents who want holiday schemes located on school premises • There may be 340 parents who want out of school clubs located on school premises • There may be 31 parents who want specialist pre-school childcare/ respite for
children aged under 5 years with a disability or SEN • 79 parents/ carers of children aged 3 and 4 years want to use school nurseries instead
of their current formal childcare setting 1.9.3.3 Is the type gap about the number of places?
The demand for out of school and holiday clubs on school premises may imply a lack of places. Of the 52 primary, junior and infant schools in Redbridge 32 offer on-site breakfast clubs, 16 offer on-site after school clubs and 4 offer on-site holiday clubs13. Supply data shows that there was 100% take up of breakfast clubs in West CT area and a high take up of after school club places in South (95%) and West (89%) CT areas, which suggest that more places are needed. However the greatest demand for out of school clubs on school premises came from North Central CT area which has the lowest take up rates (7 out of
13 Extended Schools Team query: December 2010
CSA 2011 - Section 1 Summary Report 32

ten places filled). The demand for holiday clubs on school premises came from West CT area in which 7 out of ten places are filled. Parents’ preferences for childcare on school premises is often due issues regarding trust and the perceived safety of their child, convenience and cost. Again more detailed information is needed regarding parental preferences for this type of out of school care to discuss this issue further.
The findings regarding demand for a specialist pre-school provision for children with disabilities does not imply a lack of available places as no such type of provision exists. It may reflect the lack of accessibility of mainstream pre-school provision for children with disabilities, particularly for parents requiring respite rather than childcare. Additional information is needed on the demand for this type of provision before any conclusions can be reached. The findings regarding parents of 3 and 4 year olds wanting to move their children from their current formal childcare to school nurseries is about lack of places. Parental demand for school nurseries is greater than the number of spaces available.
1.9.3.4 Type gaps during the year
The evidence regarding the nature and demand for type gaps in Redbridge is limited, but it is clear that there is a greater demand for different types of childcare during term times rather than school holidays.
1.9.3.5 Do type gaps affect some groups more than others?
Whilst this data on type gaps is based on a small sample of parents, two groups of parents were more likely to highlight the type of childcare as an area for improvement: • Economically active parents were more likely to suggest that their childcare needs
would be improved by using a different type of childcare. For example, all parents wanting out of school and holiday clubs to be offered in school were either working (n = 11) or seeking work (n = 1). Eight out of ten parents who wished to change their 3 or 4 year old child’s provider type were economically active, compared to two thirds of home carers (66%) who wanted to change childcare.
• Parents of children with disabilities 1.9.4 Quality gaps
Not enough good and outstanding Ofsted registered providers in this area. Parent: West CT area I think there needs to be more teacher qualified people in pre-school playgroups Parent: West CT area I think there must be more options for children with special needs. I had to go quite far to find one that I was comfortable with. Parent: North Central CT area
1.9.4.1 What is the size of the quality gap?
The Ofsted quality ratings of Redbridge childcare providers have increased since the previous CSA although they are lower than the national average. (See table on next page). The quality ratings of day nurseries and out of school clubs are very close to the
CSA 2011 - Section 1 Summary Report 33
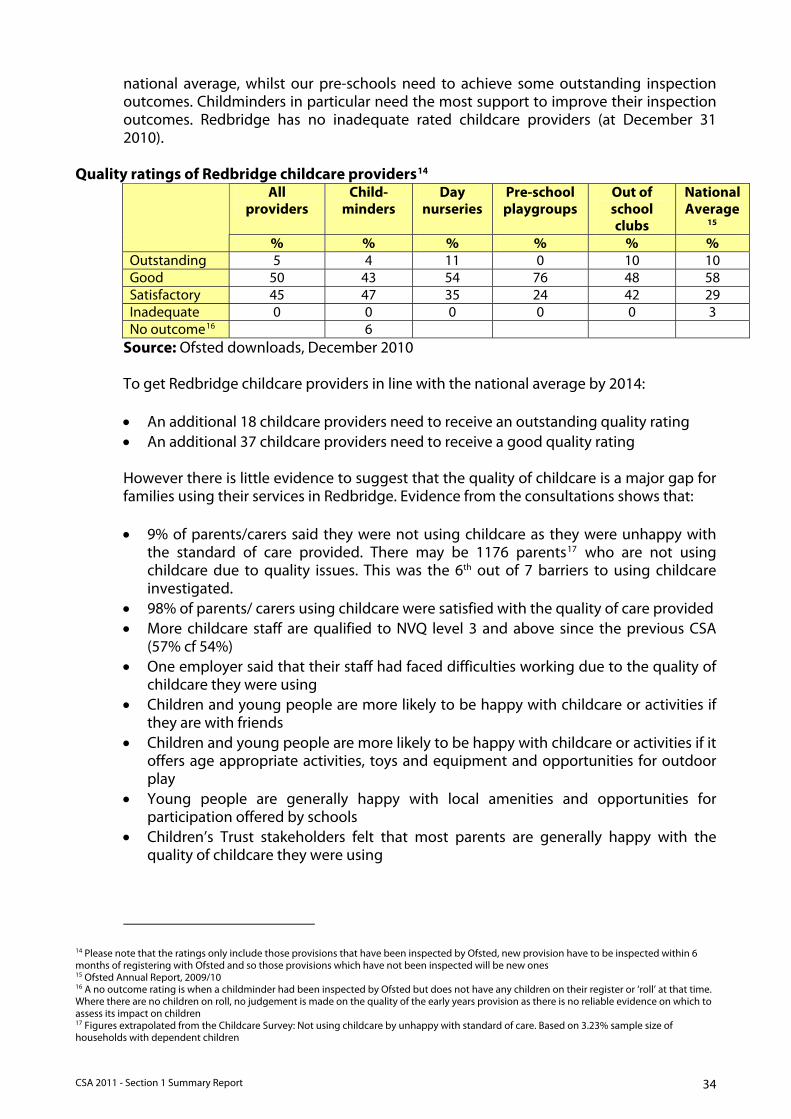
national average, whilst our pre-schools need to achieve some outstanding inspection outcomes. Childminders in particular need the most support to improve their inspection outcomes. Redbridge has no inadequate rated childcare providers (at December 31 2010).
Quality ratings of Redbridge childcare providers14 All
providers Child-
minders Day
nurseries Pre-school playgroups
Out of school clubs
National Average
15
% % % % % % Outstanding 5 4 11 0 10 10 Good 50 43 54 76 48 58 Satisfactory 45 47 35 24 42 29 Inadequate 0 0 0 0 0 3 No outcome16
6 Source: Ofsted downloads, December 2010 To get Redbridge childcare providers in line with the national average by 2014: • An additional 18 childcare providers need to receive an outstanding quality rating • An additional 37 childcare providers need to receive a good quality rating However there is little evidence to suggest that the quality of childcare is a major gap for families using their services in Redbridge. Evidence from the consultations shows that: • 9% of parents/carers said they were not using childcare as they were unhappy with
the standard of care provided. There may be 1176 parents17 who are not using childcare due to quality issues. This was the 6th out of 7 barriers to using childcare investigated.
• 98% of parents/ carers using childcare were satisfied with the quality of care provided • More childcare staff are qualified to NVQ level 3 and above since the previous CSA
(57% cf 54%) • One employer said that their staff had faced difficulties working due to the quality of
childcare they were using • Children and young people are more likely to be happy with childcare or activities if
they are with friends • Children and young people are more likely to be happy with childcare or activities if it
offers age appropriate activities, toys and equipment and opportunities for outdoor play
• Young people are generally happy with local amenities and opportunities for participation offered by schools
• Children’s Trust stakeholders felt that most parents are generally happy with the quality of childcare they were using
14 Please note that the ratings only include those provisions that have been inspected by Ofsted, new provision have to be inspected within 6 months of registering with Ofsted and so those provisions which have not been inspected will be new ones 15 Ofsted Annual Report, 2009/10 16 A no outcome rating is when a childminder had been inspected by Ofsted but does not have any children on their register or ‘roll’ at that time. Where there are no children on roll, no judgement is made on the quality of the early years provision as there is no reliable evidence on which to assess its impact on children 17 Figures extrapolated from the Childcare Survey: Not using childcare by unhappy with standard of care. Based on 3.23% sample size of households with dependent children
CSA 2011 - Section 1 Summary Report 34

1.9.4.2 Does quality affect some groups more than others?
There is evidence to suggest that some families are more affected by the quality of childcare than others. Some groups are more likely to report quality of childcare as a barrier to using it or be more dissatisfied with the childcare they are using because of the standard of care provided. They are:
• Parents who are studying or training were more likely to report not taking up childcare because they were unhappy with the standard of care provided compared to all families (13% cf 9%). Those parents that were using childcare were also more likely to report being dissatisfied with the quality of care provided than all families (13% cf 2%).
• Pakistani, Bangladeshi and Other Asian families were more likely to report not taking up childcare because they were unhappy with the standard of care provided compared to all families (12% cf 9%).
• Families with a parent with a disability using childcare were more likely to report being dissatisfied with the quality of care provided than all families (22% cf 2%).
• Parents of a child with a disability using childcare were more likely to report being dissatisfied with the quality of care provided than all families (15% cf 2%).
• Indian families using childcare were more likely to report being dissatisfied with the quality of care provided than all families (12% cf 2%)
• Lone parent families using childcare were more likely to report being dissatisfied with the quality of care provided than all families (11% cf 2%).
1.9.4.3 The impact of Redbridge childcare provision on disadvantaged groups
Research suggests that the quality of childcare provision is lower in areas of high deprivation15. It also suggests that for access to childcare, particularly early education, to improve the outcomes in later life of children living in deprived areas the setting requires an inspection outcome of good or above18. Children living in areas of high deprivation19 in Redbridge have equal if not better access to high quality childcare provision20 in their local area than children living in the rest of the borough. (See table below). For example, 62% of all Redbridge childcare providers located in the bottom 30% nationally of most deprived lower super output areas21 have an inspection outcome of good or above, compared to 53% of childcare providers in the rest of the borough. This suggests that childcare provision in Redbridge should have a positive impact on the future outcomes of children living in areas of high deprivation.
However outcomes for children are not reflecting this, as evidence shows that 49% of children living in the most deprived area of borough achieved a ‘good level of development’ at Early Years Foundation Stage compared to 59% in other areas22. This may be because recent improvements in the quality of childcare in Redbridge have not yet translated into improved outcomes. Regular monitoring of childcare provision’s inspection outcomes by deprivation and the families whom are accessing childcare in disadvantaged areas is needed to ensure that disadvantaged groups continue to have access to good quality childcare.
18 Effective Provision of Pre-School Education (EPPE) Project: Final Report - A Longitudinal Study Funded by the DfES 1997-2004 19 IDACI – bottom 30% of LSOAs nationally, ONS 2007 20 Those childcare providers with inspection outcomes of Good or above 21 A super output area (SOA) is a geographical unit used in the UK for statistical analysis. There are 3 layers of SOA, the smallest is the lower super output area (LSOA) which consists of approx 1000-1500 people. There are 34378 LSOAs in England and Wales 22 Defined as the percentage of children in each Local Authority who reside in the 30% most disadvantaged Super Output areas in England based on the 2007 Index of Multiple Deprivation – from Redbridge Child Poverty Strategy 2011-2014
CSA 2011 - Section 1 Summary Report 35

All
providers Childminders Day
nurseries Pre-school playgroups
Out of school clubs
%
30%
mo
st
dep
rive
d
70%
30%
mo
st
dep
rive
d
70%
30%
mo
st
dep
rive
d
70%
30%
mo
st
dep
rive
d
70%
30%
mo
st
dep
rive
d
70%
Outstanding 5 6 2 5 13 12 0 0 14 8 Good 57 47 47 44 61 41 81 71 57 42 Satisfactory 38 46 47 46 26 41 19 29 29 50 Inadequate 0 0 0 0 0 6 0 0 0 0 No outcome 5 5
Source: IDACI, ONS 2007 and Ofsted Downloads March 2011
1.9.5 Age gaps 1.9.5.1 What is the size of the age gap?
Findings from the parent and carer consultations show that there may be 281723 parents and carers not using childcare because of a lack of appropriate age provision. This was the fifth biggest barrier to using childcare. Population24 and supply25 data for Redbridge shows that: • 20% of children aged under 2 years have access to a full-time childcare place • 28% of children aged 2 years have access to a sessional childcare place • 33% of children aged 2 years have access to a full-time childcare place • 92% of children aged 3 and 4 years have access to a free funded early education place • 35% of children aged 3 and 4 years have access to a full-time/ wraparound childcare
place • 16% of children aged 3 and 4 years have access to a term time out-of-school care
place • 16% of children aged 5-10 years have access to a term-time out of school care place • 10% of children aged 5-10 years have access to a full-time place during school
holidays 1.9.5.2 Which ages are most affected?
Two year olds: Take up data26 shows that the above supply figures on the number of 2 year olds who can access a sessional place in a funded setting does not reflect their experience in real life. In October 2010 594 children aged 3 and 4 years accessed the free entitlement in pre-school play groups, leaving 1078 places for children aged 2 years – an access rate of 26%. During the year there may be a further 1030 2 year olds born between January and March who will turn three and require a funded place during the summer term. That would leave 48 places for children aged 2 in pre-school play groups - an access
23 Figures extrapolated from the Childcare Survey: Reasons why parents/ carers were unable to find childcare. Based on 3.23% sample of households with dependent children 24 GLA population estimates for 2011, Round Low – 22 January 2009 25 FiND database query, number of childcare providers and registered places by ward, December 2010; primary schools admissions, December 2010; take up of 3&4 year old funded places in day nurseries, EY census 2010 and Extended Schools Team out of school care query, January 2011 26 PVI Headcount data for 3 and 4 year old funding, October 2010 and School Nursery Census 2010
CSA 2011 - Section 1 Summary Report 36

rate of 1%. Findings from the disadvantaged two year old pilot confirmed that accessing 2 year old places in funded settings was very difficult as many spaces are taken by 3 and 4 year olds due to the statutory requirement to provide them with access to a free funded early education place should they want one. This suggests that the under supply of 3 and 4 year places in funded settings is causing an age gap for 2 year olds and that more places are needed. Three and four year olds: See Section 1.9.5.5 Children aged 5-10 years: Findings from the parent and carer and employers’ consultations suggest that there is an under-supply of out of school care, particularly childcare during school holidays. Parents and carers looking for out of school and holiday clubs had the lowest rates of finding them: • 35% of parents looking for an after school club found it • There may be 210527 parents who were unable to find an after school club • 33% of parents looking for a holiday club found it • There may be 201227 parents who were unable to find a holiday club • 24% of parents looking for a breakfast club found it • There may be 139327 parent who were unable to find a breakfast club • There may be 46628 parents wanting more out of school care places available in
Redbridge • There may be 34029 parents wanting more places available in holiday clubs in
Redbridge • Four employers said that their staff had faced difficulties working due to the
availability of childcare during school holidays, with 3 employers experiencing a drop in staffing levels during school holidays. This was the third biggest barrier mentioned.
• One employer said that their staff had faced difficulties working due to lack of childcare for children aged over 8 years.
Supply data shows that there are vacancies in out of school clubs, with 89% of places taken up in after school clubs, 78% in breakfast clubs and 76% in holiday schemes. Although there are areas of very high take up in Redbridge. For example, breakfast clubs have a 100% take up in West CT area and after school clubs in South have a 95% take up rate which suggests that more childcare for children aged 5-10 years is needed in these locations. However, there appears to be a discrepancy between childcare providers’ reported vacancies and parents’ rates of finding childcare.
You need more than one childminder per school and more breakfast clubs and after school clubs. Parents need to work these days but schools who refuse to have breakfast clubs are living in another century. The government is encouraging women into the workforce but the childcare backup isn't there in the system. My daughter has been at nursery since 6 months old but only now do I need to go part-time to pick her up from school Parent: North Central CT area
27 Figures extrapolated from the Childcare Survey: Childcare wanted and found by provider type. Based on 3.23% sample size of households with dependent children 28 Figures extrapolated from the Childcare Survey and the Listening to Parents Questionnaire, suggestions for improving childcare in Redbridge. Based on 3.86% sample size of households with dependent children 29 Figures extrapolated from the Childcare Survey, suggestions for improving childcare in Redbridge. Based on 3.23% sample size of households with dependent children
CSA 2011 - Section 1 Summary Report 37

The previous CSA also identified a lack of available, affordable and high quality out of school care as an issue for many parents and carers, whilst a number of holiday scheme providers reported insufficient demand to warrant them being open for the entire summer holiday. In a survey in 2010 designed to investigate this anomaly, parent not using holiday clubs said that they would be more willing to do so if they were more affordable, were available at more locations across the borough, and offered greater flexibility of hours and better quality activities appropriate for the age of their child. Young people aged 11-14: Findings from the parent and carer consultations suggest that there is a demand for childcare for older children. There may be 123 parents12 who want childcare for older children, aged 12-13 years, with half wanting childcare during school holidays.
There should be more services available for 13 year olds as they are too old for all the holiday schemes, so what are you expected to do? They're too young to be left alone. I feel there should be more dance workshops or stage school type Parent: North Central CT area My son has just started secondary school and is almost 12, I have been unemployed for quite some time after searching for the needle in a haystack of a job, i.e. any job within school hours! I would love a full time job, but this proves impossible as there appears to be NO childcare available for my son. I assume that it is expected that I leave him by himself, which would be great if he was mature enough for this……why on earth is there such a 'grey' area over childcare for this age of child, I surely cannot be the only parent whose child needs supervision at this age! Parent: South CT area
‘Safe Place to be’ is the concept that is applied to childcare for children in this age group. The Extended Services Strategy for key stage 3 – pupils aged 11-14 years expected that schools should offer ‘Safe Place to be’ provision through combining a menu of activities alongside a central hub/chill out area for children to relax and do homework outside school hours between 8am to 6pm. The activities need to be consistent and reliable, with a clear process for registration and supervision, and to be affordable and clearly advertised to parents. The Extended Schools core offer also included access to holiday provision for secondary aged children as well as children at primary school. Holiday provision is potentially an important factor in enabling parents to balance work and family life and be confident that their children are safe and able to access positive activities while they work or attend training. Parents can feel under pressure when schools are closed - particularly across the long summer holiday. They want their children to be happy and occupied and to know that they are safe and for many parents making provision for children across this long holiday can be stressful. In terms of the impact on young people good quality holiday provision can enhance skills and provide new experiences that contribute to their personal and social development. To support the development of a ‘Safe Place to be’ for young people in Redbridge secondary schools, 4Children, a national charity, undertook a pilot project/case study. This pilot aimed to explore all aspects of the development of a ‘Safe Place to be’ for young people aged 11-14 years that would provide useful insight and learning for secondary schools in the Borough and would also inform the borough’s Childcare Sufficiency Assessment.
CSA 2011 - Section 1 Summary Report 38

Two schools agreed to take part in the pilot Hainault Forest High School (HFH) and Seven Kings High School (SKH). The work commenced in September 2009 and a report of findings was made available in March 2010. There were few parent responses to the consultation and 4Children reported that a wider consultation would be needed to draw conclusions about the need for a ‘Safe Place to be’ at Hainault High School, whilst there did not appear to be a demand for a ‘Safe Place to be’ at Seven Kings High School in term times, but there may be some demand for a wider range of activities. Six Redbridge secondary schools have achieved “Quality in Study Support” status. The accreditation process for the QUISS quality mark requires each school to undertake extensive and regular consultation with students and parents on the provision of out of school hours activities. Discussions with schools by the Extended schools team indicated a number of barriers to extending the provision of a ‘Safe Place to be’ to 6 pm. Schools admit students from a wide area with students travelling across the Local Authority by bus. Students are keen to travel earlier at the end of the school day rather than stay on the school site. Parents feel that travelling later (after 6 pm) is less safe. Students wish to be independent from the school. Whilst they are willing to join after school activities such as sports, homework sessions, etc. they do not wish to stay on the school site after the activity has finished. Schools also expressed concern that supervision up to 6pm would not be financially sustainable with parents unwilling to pay towards this service. In the absence of a clear demand from students and/or parents for this service schools have not provided daily supervision to 6pm. In the standard childcare sufficiency parent consultations the greatest demand for childcare for older children came from North Central CT area. Whilst there are a large number of children aged 11 - 14 years in Barkingside and Newbury wards which coupled with other labour market characteristics suggests the need to evaluate the demand for ‘A Safe Place to be’ in these areas. During school holidays there are a wide range of activity schemes available for young people aged 11 - 14 years provided by the private and voluntary sector and council services these tend to offer day sessions based on a specific subject or sporting activity. Council services include ‘Active Camps’ and ‘Summer Uni’ run by Leisure and Youth teams respectively. Evidence from evaluation forms following the Active Camps programme showed that parents were using or wishing to use the provision as childcare while they worked. Anecdotal evidence from the Youth Service also indicated that Summer Uni sessions were being used in a similar way by some parents.
1.9.5.2 Will demand change over time?
Based on 2009 government generated population projections, the 0 -17 years population in Redbridge is expected to grow by 4.1% between 2011-2014 (see table below) from 61610 to 64166 children. South CT area has the greatest projected growth in child population, with an increase of 8% from 2011 to 2014. Specifically the estimates predict a growth in the under 5s population in South CT area, whilst North and West CT area show evidence of an ageing population with predicted decreases in the under 5 years population. This suggests that demand in North and West CT area may diminish over time whilst South CT area will continue to need more places.
CSA 2011 - Section 1 Summary Report 39

The biggest predicted growth is in the 5-10 year old population in all CT areas, particularly in South CT area. This suggests that will be a growing need for additional sessional term time out of school care and full-time holiday care places for children aged 5-10 years in the future.
Estimated population change in Redbridge: 2011-2014 (%)
Redbridge North South West 0-4 years 0.4 -1.9 5.0 -2.5 3-4 years 0.7 -1.3 4.8 -1.8
5-10 years 12.1 10.5 15.8 9.9 11-14 years 0.8 0.3 5.2 -3.9 0-17 years 4.1 2.8 8.0 1.0
Source: GLA population estimates Round Low – 22 January 2009 However the projected figures are estimates and so are subject to constant updating and revision based on local data. Redbridge will need to continue to monitor the population projections to ensure that the conclusions drawn based on the 2009 figures remain accurate. More up-to-date population data will available once findings from the 2011 Census are ready. 1.9.5.4 Do particular groups experience age gaps more than others? There was insufficient evidence from the parent and carer consultations to suggest that specific groups are more affected by these age barriers. However evidence from Children’s Trust stakeholders suggests that some groups are more affected than others. They include: • Older children with disabilities experience a greater shortage of places as they
often have to access childcare that is designed for younger children, particularly after school clubs.
• Families where English is an additional language face greater difficulties accessing 3 and 4 year old funded places
• Families of 3 and 4 year olds that move to Redbridge from another borough have difficulty accessing funded settings such as school nurseries and pre-school playgroups. Aside from the lack of places in some areas the cut-off date for the headcount at the beginning of each term means that some children who may have benefitted from an early education place in their previous authority are unable to attend provision or benefit from free hours until the following term. This can have a particularly adverse effect on a family in temporary accommodation or for a working parent who suddenly has to pay additional costs for childcare.
1.9.5.5 Free entitlement to early learning and childcare for 3 and 4 year olds
Analysis of take up data26 suggests that 95%30 of three and four year olds in Redbridge are accessing the free entitlement which is the same as the national average31. The take up rates of the free entitlement is 96.4% for three year olds and 81.8% for four year olds in Redbridge. This implies that 190 of three and 4 year olds are not taking up the free
30 This is greater than the 92% of funded places they officially have access to due to their use of 2 year old places in pre-school play groups. See section 1.9.5.2 for more detailed commentary 31Code of Practice for Local Authorities on Delivery of Free Early Years Provision for 3 and 4 year olds (September 2010) DCSF
CSA 2011 - Section 1 Summary Report 40
entitlement, 132 of which are three year olds and 58 are four year olds. A project undertaken in Autumn term 2010 in South CT area identified 270 children who were eligible for but unable to access a funded place. This suggests that population data under-estimates the number of 3 and 4 year olds in Redbridge.
There are few pre-schools in the area. All are having long waiting lists. As a result I had to choose a private nursery which is expensive for us at the moment but had no other alternative. Parent: South CT area Found it impossible to get a place at a pre-school without having to go on a waiting list. So more available places would be nice. Parent: North Central CT area
At sub authority level, take up is lowest in West CT area (93.8%) and highest in North Central CT area (96.3%). At ward level, the wards with the three highest take up rates are Church End (138.5%), Snaresbrook (123.7%) and Chadwell (123.3%), and the wards with the lowest three take up rates are Monkhams (58.1%), Bridge (72.3%) and Seven Kings (81.4%). The data suggests that nine wards in the borough have 100%+ take up of 3 and 4 year old funded places, further evidence that GLA population data is inaccurate and maybe under-estimating the current child population in Redbridge. However other factors impact upon the take up of provision which need to be taken into account in a more detailed analysis before decisions about future action are reached. For example, practical factors include, the location of childcare places in Independent schools that will not be accessible to all families; and how geographically accessible places are to families in adjoining wards. The other key factor is quality of provision. Information is a barrier to access Thirty-five percent of parents and carers of children aged 3 and 4 year olds in the Listening to Parents consultation said they found it easy to access information on the free funding entitlement and 32% found it difficult. This suggests that there may be 222232 parents who find it difficult to access information on 3 and 4 year old funding. Children’s Trust stakeholders felt that while there is enough accessible information available to parents on the free entitlement, parents who are not working, have never worked, have recently moved to the borough or are unable to understand or speak English may not be aware of the free entitlement and have difficulties in finding out information themselves. Changes during the year Demand for and access to the free entitlement varies during the year, with demand for places at its lowest during the Autumn term and highest in the Summer term. Supply data24 25 suggests that the number of 3 and 4 year olds who could potentially access the free entitlement during the Autumn term is 92%, however by the Summer term this has fallen to 77%. If places for 2 year olds in funded settings are used for 3 and 4 year olds, and take up evidence suggests that they are, then during the Summer term 95% of 3 and 4 year olds can potentially access a place. However, only at a cost of lack of sessional
32 Figures extrapolated from the Listening to Parents Questionnaire: how easy was it to find information on the free entitlement for 3 and 4 year olds. Based on 0.63% sample of households with dependent children under 5 year
CSA 2011 - Section 1 Summary Report 41

places in funded settings for children aged 2 years, suggesting that more places for 3 and 4 year olds are needed in funded settings. Access rates for specific groups Take up data26 suggests that specific groups are not accessing the free entitlement at the same rate as other groups. They are: • Children with disabilities: 65 children (1.7%) with disabilities are accessing the free
entitlement, mostly in the maintained sector (n = 61). The highest numbers of children with disabilities are accessing the free entitlement in South CT area (2%) and the lowest in West CT area (1.3%). However, data from the DCATCH pilot suggests that take-up figures in the private and voluntary sector maybe an under-estimate.
• Children from BME communities: Specifically children from Black British African and Caribbean backgrounds, Gypsy/ Roma children, Irish children, Traveller children of Irish heritage, children from Mixed Asian and Black backgrounds, children from Mixed White and Black Caribbean backgrounds, children from White European backgrounds are not accessing the free entitlement in the same proportion as children from these ethnic backgrounds attend Redbridge Primary schools.
• White British children: are not accessing the free entitlement in the same proportion as children from the same ethnic background are attending Redbridge Primary schools. However this result may be due to the declining White British child population in Redbridge.
Take up data26 suggests that children from some BME groups maybe having problems accessing the free funding entitlement in the locality where they reside. Children from some BME groups have a lower than expected uptake of funding in a locality, which is balanced by a higher uptake in another locality. They include: • Children from Bangladeshi families have a lower than expected take up of the free
entitlement in South and West CT localities, and a higher than expected take up in North Central CT area.
• Pakistani children have a lower than expected uptake of the funding in West CT area, and a higher uptake in South and North Central localities.
• Children from Other Black families have a lower than expected uptake of the funding in South and West CT areas and a higher uptake in North Central CT area.
• Children from Mixed White and Black African families have a lower than expected uptake of the funding in West CT area and a higher uptake in South and North Central localities.
Further investigation is needed to confirm these findings.
1.9.6 Specific need gaps 1.9.6.1 Low income families
There are nearly 32,220 dependent children living in either workless or low income working families33 in Redbridge. It had the 8th lowest take up of formal childcare by low income working families in 2008/9 and the fifth lowest in London34. Low income families are less likely to use childcare, with 56% of families on an average annual household
33 HMRC Child and Working Tax Credit Statistics (Finalised Annual Awards) 2008/9 34 NI 118 Take up of formal childcare by low income working families, 2008/9
CSA 2011 - Section 1 Summary Report 42

income of £15000 or less using registered childcare, compared to 67% of families with an average annual household income of more than £25000. Low income families are less likely to find childcare than families on higher incomes. For example, 51% of families on an average annual household income of £15000 or less found childcare compared to 66% of families on incomes of £25000 and above. They were more likely to attribute this to the affordability of childcare, with 51% of families with an average annual household income of less than £15000 reporting either not using or being unable to find childcare because it was too expensive compared to 29% of families with an average annual household income of more than £25000. Low income families are more likely to report that the childcare they are using does not fully meet their needs than families on higher incomes. For example, 46% of families with an average household income of £15000 or less said that they are dissatisfied with at least one aspect of the childcare they are using compared to 9% of families with an average household income of £58000 and above. Low income families were more likely to report that not finding childcare had affected their work than those on higher incomes. For example 53%, of families with an average household income of £15000 or less said that not finding childcare had impacted on their work compared to 38% of families with an average annual household income of £25000 and above. Almost one fifth (19%) of low income families had to change their working hours compared to 9% of families on higher incomes. One quarter (25%) of low income families had to give up work compared to 12% of families on higher incomes. Low income families were more likely to want childcare at atypical times than those on higher incomes. For example, 1% (n = 6) of low income families wanted over night childcare compared to 0.5% (n = 2) of families with an average annual household income of £25000 and above. 5% (n = 17) of low income families wanted childcare at weekends compared to 3% (n = 12) of families with an average annual household income of £25000 and above. Low income families were more likely to report that the extended free entitlement hours would enable them to return to work or training (49%) than families on higher incomes (34%). Over one third of families (38%) on an annual average income of less than £15000 said that they would be able to work or study during the 15 funded hours rather than it making childcare more affordable (n = 26, 11%). Under three quarters (72%) of low income families said that they were unable to afford to pay for any additional childcare hours compared to families on higher incomes (30%). Low income families were more likely to want to use the 15 free hours than previously but not as flexibly as families on higher incomes (59% cf 66%). Low income families reported greater difficulties finding information on childcare in their local area than families on higher incomes. For example, almost two thirds of families (60%) with an average household income of £25000 and above said it was easy to find local childcare information compared to one third (37%) of low income families. Interestingly, low income families were more likely to report that it was easy to find information on paying for childcare (40%) and their entitlement to 3 and 4 year old funding (44%) than families on higher incomes (33% and 34% respectively).
1.9.6.2 Lone parents/carers
There are an estimated 10,100 lone parents in Redbridge, 57% of whom are not in work33. Seven out of ten children (71%) living in out of work families live with a lone parent.
CSA 2011 - Section 1 Summary Report 43

Demand for childcare is greater in lone parent families (92%) than two parent families (89%), but they are less likely to find it (52% cf 59%). Lone parent families are more likely to want full-time childcare compared to two parent families (25% cf 21%). They are also more likely to want out of school care than two parent families. For example, data from the parent consultations found that 14% of lone parent families want childcare before school, 21% after school and 20% during school holidays, compared to 10%, 13% and 12% of two parent families respectively. Whilst Snapshot data from Job Centre Plus35 suggests that under one fifth of lone parents seeking work each wanted an after school club (24%), a breakfast club (22%) or a holiday scheme (21%). Given that population and supply data show that there are low access rates to these types of childcare and parent consultation data shows that all families have low rates of finding them, lone parents will be the most affected by gaps in out of school and holiday care.
Something that is a bit cheaper and more affordable. Being a single parent before and after school clubs cost about 1/4 of the salary approx. Lone Parent: West CT area
Lone parent families are more likely to attribute not finding childcare to affordability. For example, 39% of lone parents who were either not using or had been unable to find childcare said it was because it was too expensive compared to 38% of all parents. Lone parent families are more likely to report that the childcare they are using does not fully meet their needs than two parent families. For example, 46% of lone parent families were dissatisfied with at least one aspect of the childcare they are using compared to 43% of two parent families. Lone parents who are using childcare are more likely to report affordability issues. For example, 39% of lone parents using childcare said that they were dissatisfied with its cost compared to 32% of two parent families. Lone parent families are more affected by the opening times of childcare than 2 parent families, with 23% of lone parents not using childcare because the times available were inconvenient. Lone parents using childcare were more likely than 2 parent families to be dissatisfied with the times available (17% cf 16%). Lone parent families reported greater difficulties finding information on childcare in their local area than families on higher incomes. For example, over half of two parent families (52%) said it was easy to find local childcare information compared to one third (38%) of lone parent families. Interestingly, low income families were more likely to report that it was easy to find information on paying for childcare (24%) and their entitlement to 3 and 4 year old funding (36%) than two parent families (21% and 35% respectively).
1.9.6.3 Parents/carers who are seeking work or studying/training36
In April 2010 there were 16,200 children in Redbridge living in 7,700 workless families37. This section gives information about two types of economically active workless parent – those seeking work and those studying/training. The findings of these two groups have been presented separately. Parents who are seeking work are less likely to be using childcare than all families (38% cf 61%). Parents who are seeking work are less likely to find childcare than all families (39%
35 NNEL External Digest January 2011 36 Please note that as only a small number of parents/ carers who are seeking work (n = 119) or studying (n = 102) participated in the surveys the results may be unreliable (+/- 10% sampling error). A larger sample is needed to confirm these findings. 37 HMR&C Child and Tax Credit Statistics, April 2010
CSA 2011 - Section 1 Summary Report 44

cf 58%). Parents who were seeking work and not using childcare were more likely to attribute it to affordability issues. For example 45% of parents who were seeking work said they were not using childcare because it was too expensive compared to 38% of all families. This was their biggest barrier to finding childcare. The location of childcare was also an important factor in finding childcare. For example, 27% of parents seeking work said that they had been unable to find childcare due to its inconvenient location than all families (21%). Parents/carers using childcare who are seeking work are more likely to report that childcare doesn’t fully meet their needs. For example, 56% of parents seeking work are dissatisfied with at least one aspect of the childcare they are using compared to 44% of all families. Parents who are using childcare that are seeking work are more likely to report affordability issues than all families. For example, 44% of parents seeking work were dissatisfied with the cost of childcare compared to 38% of all families. Parents who are seeking work reported greater difficulties finding childcare information. For example, 38% of parents seeking work said it was easy to find information on local childcare compared to 49% of all parents. Over half of parents seeking work (57%) said that it was difficult to find information on the free flexible entitlement compared to all families (32%), whilst 18% found it easy to find information on help with paying for childcare compared to 22% of all families. Parents who are studying/ training are more likely to be using childcare than all families (73% cf 61%). Parents who are studying/ training were just as likely to find childcare as all families (57% each). Affordability was the biggest barrier to finding childcare (30%), although they were less likely to report not using childcare to it being too expensive than all families (38%). Parent/carers using childcare who are studying/ training are slightly more likely to report that childcare meets their needs. For example, 57% of parents who are studying or training were satisfied with all aspects of the childcare they were using compared to 56% of all parents. More parents said that they were dissatisfied with the cost of childcare (32%) than any other aspect, but again they were less likely to be dissatisfied with its affordability than all parents (38%). Parents/ carers who are studying/ training reported greater difficulties finding information on local childcare and paying for childcare than all families. For example, 33% said it was easy to find information on childcare in their local area compared to 49% of all families, whilst 17% said it was easy to find information on paying for childcare than 22% of all families. However, parents who were studying/ training found it easier to access information on the free entitlement (50%) than all families (35%).
1.9.6.4 Parents/ carers with a child with a disability or special educational need
There are a number of different sources of data available on children with disabilities living in Redbridge, although none of them are comprehensive. The 2010 School Census identified 1270 pupils with disabilities aged 2-18 years attending either a special school or a mainstream school with a statement in Redbridge. In November 2009 1380 children aged 0-17 years were claiming Disability Living Allowance in Redbridge38. Whilst in 2010 the Aiming High team identified 1733 children with disabilities aged 2-19 years in
38 DWP, Numbers claiming Disability Living Allowance by age and local authority, November 2009
CSA 2011 - Section 1 Summary Report 45

Redbridge. This suggests that children with disabilities make up between 2 – 3% of the total child population in Redbridge. There is clear evidence that families of a child with a disability have greater problems accessing childcare. Children’s Trust stakeholders reported a general lack of places available for children with disabilities in the borough. In the parent consultations, families of a child with a disability or special educational need (SEN) are less likely to use childcare than other families. For example, 47% of families with a child with a disability were using or found childcare, compared to 61% of all families. This is a 14% difference. The free entitlement take up data suggests that not all children with disabilities aged 3 and 4 years are accessing it, with 1.7% of children with a disability using the funding compared to estimated child population rates of between 2-3%. The biggest barrier to finding childcare reported by parents was that providers couldn’t cater for the child’s special needs (43%), followed by childcare being too expensive (37%). In the qualitative evaluation of the SNOWCAP pilot scheme, many parents felt that their child would have been unable to access mainstream childcare without one-to-one support. Whilst Children’s Trust stakeholders reported that older children with disabilities experience a greater shortage of places as they often have to access childcare that is designed for younger children, particularly after school clubs.
More after school clubs for special needs kids with less waiting lists. Parent of a child with a disability: West CT area
Families of a child with a disability are more likely to report that the childcare they are using does not fully meet their needs than all families. For example, half (50%) of parents of a child with a disability were dissatisfied with at least one aspect of the childcare they were using compared to 44% of all families. Families of a child with a disability that were using childcare were more likely to report affordability issues than other families. For example, 59% of families with a child with a disability were dissatisfied with the cost of childcare compared to 33% of all families. They also had lower rates of satisfaction with the quality of care provided that all families (85% cf 98%). Children’s Trust stakeholders pointed out that it can be difficult for parents to find a mainstream setting that is able to meet the child’s needs. Also it can take time for additional support to be put into place, such as a support worker or specialist equipment. Parents are often unable to send their child to a setting until support is in place, which puts children with disabilities at a greater disadvantage to their peer group. Suggestions for improving childcare for children with disabilities in Redbridge, made by 32 parents, included the provision of more appropriate childcare – whether specialist or mainstream – offered up to the age of 17 years. To enable mainstream settings to be more inclusive parents suggested training for childcare providers and ensuring that one to one support was available in a timely fashion, with settings having access to a pool or bank of CRB checked workers to call upon. Other suggestions included making childcare more affordable, a central information point and offering transport to out of school clubs and activities.
CSA 2011 - Section 1 Summary Report 46

1.9.6.5 Families with a parent/ carer with a disability
There is limited data available on people living with disabilities in Redbridge. According to the ONS Annual Population Survey (2009/10), 16.4% of working age residents (aged 16 - 64) were disabled – which equates to 28,500 people39. However these figures may be unreliable due to the small Redbridge sample population that took part in the survey. In February 2010 there were 7,330 working-age adults claiming Incapacity Benefit (IB) or Severe Disablement Allowance (SDA)40. Families with a parent/carer with a disability were less likely to use childcare than all other families (50% cf 61%) and less likely to find it than all other families (37% cf 58%). They were more likely to attribute not using childcare to affordability issues. For example, 46% of parents/carers with a disability said that they were either not using or had been unable to find childcare because it was too expensive, compared to 38% of all families – an 8% difference. Affordability is the biggest barrier to using childcare, however families with a parent/carer with a disability were also more likely to attribute not using childcare to inconvenient locations and times available than other families. For example, 32% of families with a parent/carer with a disability were unable to find childcare due to their inconvenient locations compared to 24% of all families. Whilst 25% of families with a parent/ carer with a disability were unable to find childcare due to their inconvenient times compared to 21% of all families. Families with a parent/carer with a disability who were using childcare were more likely to report that it doesn’t fully meet their needs. For example, 57% of families with a parent/ carer with a disability were dissatisfied with at least one aspect of the childcare they were using compared to 43% of all families. Families with a parent/carer with a disability who were using childcare were less satisfied with the cost and location of childcare. For example, 50% of families with a parent/carer with a disability were dissatisfied with the cost of the childcare they were using compared to 33% of all families. Whilst, 23% of families with a parent/carer with a disability were dissatisfied with the location of childcare they were using compared to 13% of all families.
1.9.6.6 Parents/carers from Black and minority ethnic groups (BME)
Among children attending maintained schools in Redbridge, 76.5% were from ethnic minorities (non-White British) in 201041. The GLA ethnic population projections show that the majority of children aged 0-14 years living in Redbridge are now Asian (46%), with White (33.4%) the next biggest ethnic group, followed by Black (17%). The number of children from black and minority ethnic backgrounds will continue to rise in the future. This section will look at particular BME groups that report poor outcomes in later life, i.e. Bangladeshi, Pakistani, Black Caribbean and African and Gypsy/Roma children42. Where numbers of respondents from BME groups are too small to produce reliable results then they have been combined together. Gypsy/ Roma families will be discussed separately in the next section.
39 ONS Annual Population Survey (April 2009-March 2010) 40 Nomis Benefits Claimants Data February 2010 41 Redbridge School Census 2010 42 How fair is Britain? The First Triennial Review 2010, Equality and Human Rights Commission, October 2010
CSA 2011 - Section 1 Summary Report 47

Parents and carers from BME families were less likely to find childcare. For example, 51% of Pakistani, Bangladeshi and Asian other families and 54% of Black families found childcare compared to 59% of White British families. They were more likely to attribute not finding childcare to affordability issues. For example 47% of Pakistani, Bangladeshi and Asian other families and 38% of Black British families said that they were not using or had been unable to find childcare because it was too expensive, compared to 23% of White British families. Whilst affordability was the biggest barrier to using childcare, families from BME communities were more likely to report other problems too. For example, the location of childcare was an issue for Asian families. For example, 34% of Pakistani, Bangladeshi and Other Asian families, and 31% of Indian families were not using childcare because it was inconveniently located compared to 16% of White British families. This was the second biggest barrier to using childcare for Asian families. Families from BME communities were more likely to report problems with lack of childcare places. For example, 33% of Black families, 31% of Indian families and 27% of Pakistani, Bangladeshi and Other Asian families said they were unable to find childcare due to no vacancies compared to 24% of White British families. This was the second biggest barrier to using childcare for Black families. BME families were more likely to report a problem with the times that childcare is available. For example, 24% of Black families and 23% of Asian families said that the inconvenient times childcare is available had prevented them from using childcare compared to 16% of White British families. Asian families were more likely to report not finding childcare due to accessibility and quality issues. For example, 10% of Indian families and 7% of Pakistani, Bangladeshi and Other Asian families said they were not using childcare because it was unable to cater for their child’s special needs compared to 5% of White British families. Whilst, 12% of Pakistani, Bangladeshi and Other Asian families said they were not using childcare because they were unhappy with the standard of care provided compared to 9% of all families. Children aged 3 and 4 years from BME families are less likely to be using the free funding entitlement. In particular children from Black British African and Caribbean backgrounds, Gypsy/ Roma children, children from Mixed Asian and Black backgrounds, and children from White European backgrounds are not accessing the free entitlement in the same proportion as children from these ethnic backgrounds attend Redbridge Primary schools. Families from BME communities that were using childcare were more likely to report affordability issues. For example, 41% of Indian families, 65% of African, Caribbean and Other Black families, Pakistani, Bangladeshi and Other Asian families said they were dissatisfied with the cost of childcare compared to 22% of White British families. This is a 43% difference. The parent consultation finding also identified some general preferences for the type of childcare wanted according to families’ ethnicity. They were: • Indian, Caribbean, and White European families had the greatest preference for day
nurseries • Pakistani , Bangladeshi, and Other Asian groups had the greatest preference for pre-
school play groups
CSA 2011 - Section 1 Summary Report 48

• White British and African families have the greatest preference for childminders • Caribbean, White British, and African families most frequently wanted before or after
school care • Caribbean families have the greatest demand for holiday schemes Children’s Trust stakeholders felt that language differences were the main barrier to accessing childcare for parents from BME groups. Parents who have English as an additional language find it harder to access relevant information on services available such as FiND and harder still to ensure that their children receive the support that they are entitled to. Other barriers included: refugee status which impacts on entitlement to public funds, cultural circumstances that can impact on the choices parents make regarding childcare and early education, isolation, unfamiliar surroundings and conflicting advice. Specific groups mentioned that have difficulties accessing childcare, particularly early education were the Somali, Roma and French speaking African communities. As one organisation pointed out parents from BME groups who have local friends find out about childcare much more easily than others.
1.9.6.7 Gypsy/Roma families
The Gypsy/Roma community in Redbridge has grown over recent years and it now consists of a sizeable minority group within the south Ilford area. The Gypsy/Roma community have been identified as being at risk of poor outcomes. Children of Gypsy/Roma background are at greater risk of receiving a fixed term (18.7%) or permanent exclusion (0.56%) from school in comparison to all children (5.4% and 0.1% respectively). In the 2009 Foundation stage profiles for Redbridge, children of Gypsy/Roma background had significantly lower average scores (65) than the general school population (85.8). Generally they possess many of the contextual factors identified as affecting pupil performance such as receiving free school meals; English as an additional language, and not being at their current school for the whole of the foundation stage. Research suggests that access to early education goes some way to improving outcomes in later life. However, statistically the Roma community are almost ‘invisible’ with few children accessing either schools or pre-school education in Redbridge. For example, 34 children (0.2%) of Gypsy/Roma ethnic background were recorded as using Redbridge primary schools, mainly in the South of the borough (n = 28, 0.4%) and none in the West. The 6 Roma children (0.1%) in schools in the North Children’s Trust area are possibly out of area and having to travel long distances (School Census 2009). No children of Gypsy/Roma ethnic background were recorded as receiving the nursery education grant (3 and 4 year old funding) in the PVI sector in Redbridge in Spring 2009 and only 6 children of Gypsy/Roma ethnic background were recorded as receiving it in the maintained school sector. Seven Gypsy/Roma families were consulted about their use of the free early education entitlement in 2010 using in-depth interviews and one focus group at a local Children’s Centre. One parent was accessing the funding through a school nursery but otherwise the families were unaware of the funding. When given information about what it entailed, they were interested in using it and saw many educational and social benefits for their children and themselves including preparing their children for school, teaching them respect and helping integrate them into society, whilst giving them as parents more time for household chores, caring for their wider family and generally relieving pressure. The families foresaw problems accessing and using the funding due to
CSA 2011 - Section 1 Summary Report 49
information and language barriers which they would require support from the borough to overcome. Since then staff from Redbridge Children’s Centres, the Early Years Pedagogy Advisory Team and FiND have worked together to address the issues raised by Gypsy/Roma parents. A weekly ‘Roma living in Redbridge’ group is being run at Albert Road Children’s Centre which offers Roma parents with little or no English information and advice on access to local resources such as health services, childcare and education and emergency services, as well as parenting support and the opportunity to gain confidence in speaking English in a supportive environment. In particular, families will be supported to access early education. One of the Children’s Trust stakeholders stated that this work is not appropriate to the needs of Roma families. There will be a future meeting to discuss their views.
1.9.7 Geographical gaps
Not enough choice in Wanstead of private nursery and childminders. Also not much provisions for parents working who want to take up school nursery places (3 hours per day) and need to arrange pick up and drop offs between sites. May be better links with the private nurseries to fill the gaps would help make things easier? Parent: West CT area Perhaps, where holiday play schemes are concerned, to advertise them more - maybe through the schools, local library and or local papers. But there is definitely a shortage of council run play schemes or privately run (at an affordable rate) for the main school holidays i.e. summer 6 wks, Easter and half terms and going up to age 11/12. Parent: South CT area There need to be more breakfast/afterschool clubs, I was amazed that there were so few (poor amount for the area and the amount of schools). I did notice that some of the primary schools actual provide this service which is great. It would benefit parents if they knew they could drop their children off at 8am and know that they're already in school and be able to pick up by 6pm as a lot of parents work full-time in the city... My child will be attending X in September and I am struggling to find any kind of childcare. We may have to consider changing my husband's working hours Parent: North CT area
1.9.7.1 Geographical gaps across Redbridge
Whilst the majority of childcare providers felt that there was a good mix of childcare available locally to meet the needs of parents and carers, there is evidence to suggest that the location of childcare is a gap in Redbridge. For example, five of the six unmet FiND brokerage contacts were related to parents being unable to find a childminder in the Wanstead area to meet their specific needs. Three employers said that their staff had faced difficulties working due to the location of childcare. Whilst, the inconvenient location of childcare was the third biggest barrier to parents using childcare, with Asian families particularly affected. The inconvenient location of childcare was also the third biggest reason for dissatisfaction with childcare that parents/ carers were using. The findings from the parent and carer demand surveys suggest that there is a varying level of demand for different types of childcare in each CT locality (see table below):
CSA 2011 - Section 1 Summary Report 50
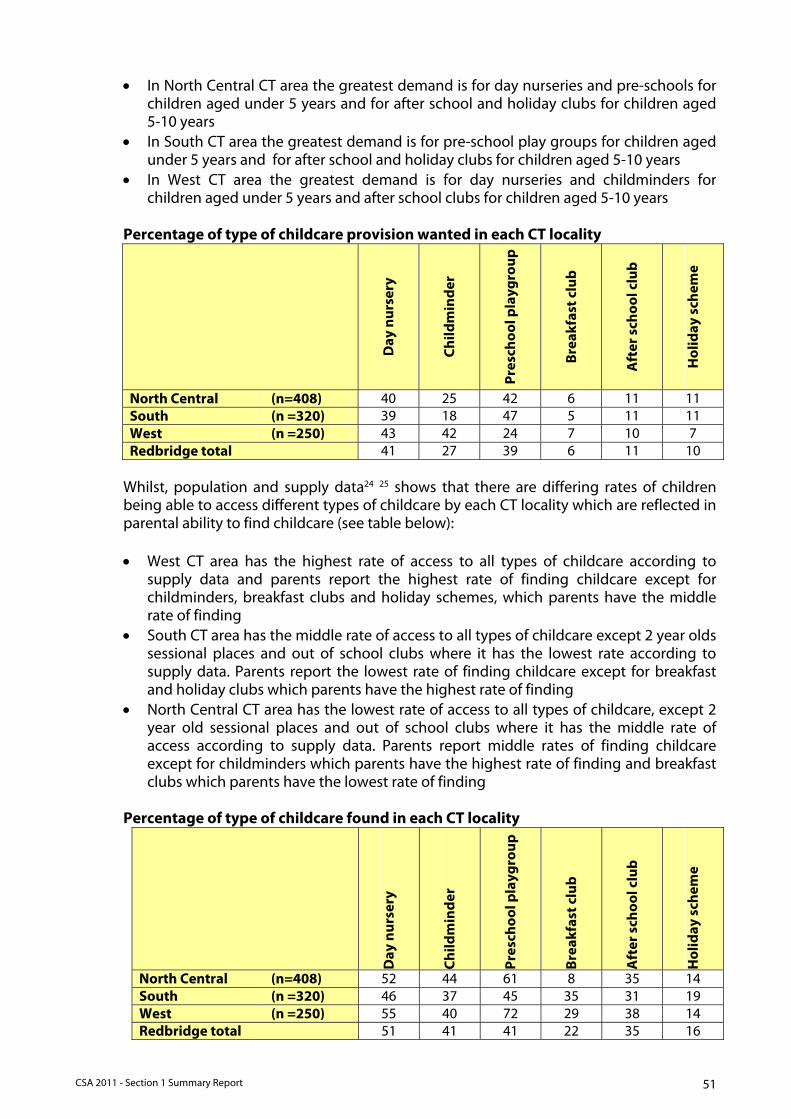
• In North Central CT area the greatest demand is for day nurseries and pre-schools for children aged under 5 years and for after school and holiday clubs for children aged 5-10 years
• In South CT area the greatest demand is for pre-school play groups for children aged under 5 years and for after school and holiday clubs for children aged 5-10 years
• In West CT area the greatest demand is for day nurseries and childminders for children aged under 5 years and after school clubs for children aged 5-10 years
Percentage of type of childcare provision wanted in each CT locality
Day
nu
rser
y
Ch
ildm
ind
er
Pre
sch
oo
l pla
ygro
up
Bre
akfa
st c
lub
Aft
er s
cho
ol c
lub
Ho
liday
sch
eme
North Central (n=408) 40 25 42 6 11 11 South (n =320) 39 18 47 5 11 11 West (n =250) 43 42 24 7 10 7 Redbridge total 41 27 39 6 11 10
Whilst, population and supply data24 25 shows that there are differing rates of children being able to access different types of childcare by each CT locality which are reflected in parental ability to find childcare (see table below): • West CT area has the highest rate of access to all types of childcare according to
supply data and parents report the highest rate of finding childcare except for childminders, breakfast clubs and holiday schemes, which parents have the middle rate of finding
• South CT area has the middle rate of access to all types of childcare except 2 year olds sessional places and out of school clubs where it has the lowest rate according to supply data. Parents report the lowest rate of finding childcare except for breakfast and holiday clubs which parents have the highest rate of finding
• North Central CT area has the lowest rate of access to all types of childcare, except 2 year old sessional places and out of school clubs where it has the middle rate of access according to supply data. Parents report middle rates of finding childcare except for childminders which parents have the highest rate of finding and breakfast clubs which parents have the lowest rate of finding
Percentage of type of childcare found in each CT locality
Day
nu
rser
y
Ch
ildm
ind
er
Pre
sch
oo
l pla
ygro
up
Bre
akfa
st c
lub
Aft
er s
cho
ol c
lub
Ho
liday
sch
eme
North Central (n=408) 52 44 61 8 35 14 South (n =320) 46 37 45 35 31 19 West (n =250) 55 40 72 29 38 14 Redbridge total 51 41 41 22 35 16
CSA 2011 - Section 1 Summary Report 51

1.9.7.2 Differences by ward
Redbridge is spilt into 21 wards and 3 Children’s Trust (CT) locality areas. These are shown in the map below. This section seeks to identify the gaps that may be experienced in each of the wards.
Please note that the results of the ward level analysis may be unreliable due to small numbers43. Locality 1: North Central CT area – Aldborough, Barkingside, Cranbrook, Fairlop, Fullwell, Hainault, Newbury, and Valentines wards. North central CT area is the most diverse locality covering the largest geographical area, with the highest number of children overall but ranges from poorer areas in the south and north to more affluent areas in the west and centre. Aldborough • Two thirds of parents (67%) were able to find childcare. Parents had difficulties
finding out of school care, particularly breakfast clubs • Affordability of childcare is an issue in this area, with almost half of parents (48%) not
finding childcare due to it being too expensive and four out of ten parents using childcare (40%) dissatisfied with its cost
• There is also evidence of time gaps, with over two thirds of parents (70%) using childcare were dissatisfied with the times available
43 There is a range of 26- 82 responses per ward. Average number of responses per ward = 55.
CSA 2011 - Section 1 Summary Report 52
Barkingside • Over half (56%) of parents were able to find childcare. Parents had difficulties finding
childminders and breakfast clubs • There is a slight affordability gap, with parents using childcare slightly less satisfied
with its cost than the Redbridge average. A gap of 1.5% Cranbrook • Almost two thirds of parents (65%) found childcare. Parents had difficulties finding
holiday schemes • Affordability of childcare is an issue in this area. It was the biggest barrier to finding
childcare, with one third (33%) of parents not finding childcare because it was too expensive and under half of parents using childcare (45%) dissatisfied with its cost
• There was also evidence of a geographical gap with parent using childcare slightly less satisfied with the location of childcare than the Redbridge average. A gap of 1.7%
Fairlop • Under half of parents (49%) found childcare. Parents were unable to find out of school
care and had difficulties finding childminders and pre-schools • There was no evidence of any particular type gap causing lack of childcare Fullwell • Over half of parents (58%) found childcare. Parents were unable to find breakfast
clubs and had difficulties finding day nurseries and pre-schools • The biggest barrier to finding childcare was lack of childcare places. For example, over
half of parents (56%) were unable to find childcare due to no vacancies. • There was also evidence of geographical and time gaps, with almost one third each of
parents not finding childcare because the location (32%) or the times (30%) were inconvenient. Whilst over half of parents using childcare were dissatisfied with the times available
Hainault • Six out of ten parents (60%) found childcare. Parents had difficulties finding pre-
school playgroups and out of school clubs, particularly breakfast clubs • Affordability was an issue in this area. It was the biggest barrier to finding childcare,
with over one third of parents (38%) unable to find childcare because it was too expensive. Whilst parents using childcare were less satisfied with its cost than the Redbridge average. A gap of 10.5%
• There was also evidence of geographical and time gaps, with parents using childcare less satisfied with its location and times available than the Redbridge average. The geographical gap was 7.3% and the time gap was 6.6%
Newbury • One third of parents (37%) found childcare. Parents were unable to find out of school
clubs and had difficulties finding childminders and day nurseries • Affordability was the biggest barrier to finding childcare, with over half of parents
(52%) not using childcare because it was too expensive • There was also evidence of time gaps as parents using childcare were less satisfied
with the times available than the Redbridge average. A gap of 6.4%
CSA 2011 - Section 1 Summary Report 53
Valentines • Over half of parents (56%) found childcare. Parents had difficulties finding holiday
clubs and out of school care, particularly after school clubs • Affordability was an issue in the area. It was the biggest barrier to finding childcare,
with four out of ten (41%) parents unable to find childcare because it was too expensive. Whilst four out of ten parents using childcare (44%) were dissatisfied with its cost
• There was also evidence of time gaps with one quarter of parents (26%) not finding childcare due to its inconvenient location and parents using childcare slightly less satisfied with the times available than the Redbridge average. A gap of 1.8%
• There was also evidence of a geographical gap, with parents using less satisfied with the location of childcare than the Redbridge average. A gap of 8.4%
Locality 2: South CT area – Chadwell, Clementswood, Goodmayes, Loxford, Mayfield, and Seven Kings wards South CT area is the most disadvantaged locality, with 80% of its lower super output areas in the bottom 30% nationally according to the Income Directly Affecting Children Index (2007) and the highest proportions of lone parent households, vulnerable children, children with disabilities and (growing) ethnic minority populations most at risk of poor outcomes in later life Chadwell • Under two thirds of parents (63%) found childcare. Parents were unable to find
holiday schemes and had difficulties finding childminders • The biggest barrier to finding childcare was lack of places. Four out of ten parents
(44%) were not using childcare due to no vacancies • Affordability was also an issue in the area, with one third of parents (33%) not using
childcare because it was too expensive and half of parents (50%) using childcare dissatisfied with the cost
• There was also evidence of small geographical and time gaps with parents using childcare less satisfied with its location and times available than the Redbridge average. There was a geographical gap of 4.2% and a time gap of 2.3%
Clementswood • Over half of parents (51%) found childcare. Parents were unable to find breakfast
clubs and had difficulties finding all types of childcare • Affordability was the biggest barrier to finding childcare, with four out of ten parents
(40%) unable to find childcare because it was too expensive. Parents using childcare were slightly less satisfied with it cost compared to the Redbridge average. A gap of 3.1%
• There was also evidence of a time gap, with parents using childcare less satisfied with the times available than the Redbridge average. A gap of 4.7%
Goodmayes • One quarter of parents (26%) found childcare. Parents were unable to find
childminders or out of school care and had difficulties finding all other types of childcare
• There was evidence of multiple gaps. Affordability was the biggest barrier to finding childcare, with over four out of ten parents (43%) not finding childcare because it was too expensive. Whilst under half of parents (47%) using childcare were dissatisfied with its cost
CSA 2011 - Section 1 Summary Report 54
• Lack of places was the second biggest barrier with four out of ten parents (40%) not finding childcare because there were no vacancies
• There was evidence of a geographical gap with over one quarter of parents (29%) unable to find childcare due to its inconvenient location and over half of parents using childcare (56%) dissatisfied with its location
• There was also evidence of a time gap, with under one third of parents (30%) unable to find childcare because its times available were inconvenient
Loxford • Six out of ten parents (61%) found childcare. Parents had difficulties finding pre-
schools and holiday schemes • Affordability was the biggest barrier to finding childcare, with 44% of parents not
finding childcare because it was too expensive • Lack of places was the second biggest barrier to finding childcare, with over one third
(36%) of parents not finding childcare because there were no vacancies Mayfield • Over half of parents (54%) found childcare. Parents were unable to find holiday
schemes and had difficulties finding pre-schools and childminders • Affordability was the biggest barrier to finding childcare, with 46% of parents unable
to find childcare because it was too expensive • There was evidence of a geographical gap as under one third of parents (32%) were
unable to use childcare because of its inconvenient location • There was also evidence of a time gap, with parents using childcare less satisfied with
its times available than the Redbridge average. A gap of 5% Seven Kings • Under half of parents (44%) found childcare. Parents had difficulties finding day
nurseries, pre-schools, out of school clubs and holiday schemes • Affordability was an issue in this area. It was the biggest barrier to finding childcare,
with over one third (37%) of parents unable to find childcare because it was too expensive. Parents using childcare were less satisfied than the Redbridge average. A gap of 8.4%
• There was also evidence of a geographical gap with under one third (32%) of parents unable to find childcare due to its inconvenient location. Parents using childcare were less satisfied with its location than the Redbridge average. A gap of 5.4%
• There was evidence of a time gap, with parents using childcare less satisfied with the times available than the Redbridge average. A gap of 14.6%
Locality 3: West CT area – Bridge, Church End, Clayhall, Monkhams, Roding, Snaresbrook, and Wanstead wards West CT area is the most affluent locality, with the highest rates of economic activity for both men and women, the lowest rates of children living in workless households and stable child population growth. It has several small ‘pockets’ of deprivation within it in Bridge and Roding wards.
CSA 2011 - Section 1 Summary Report 55
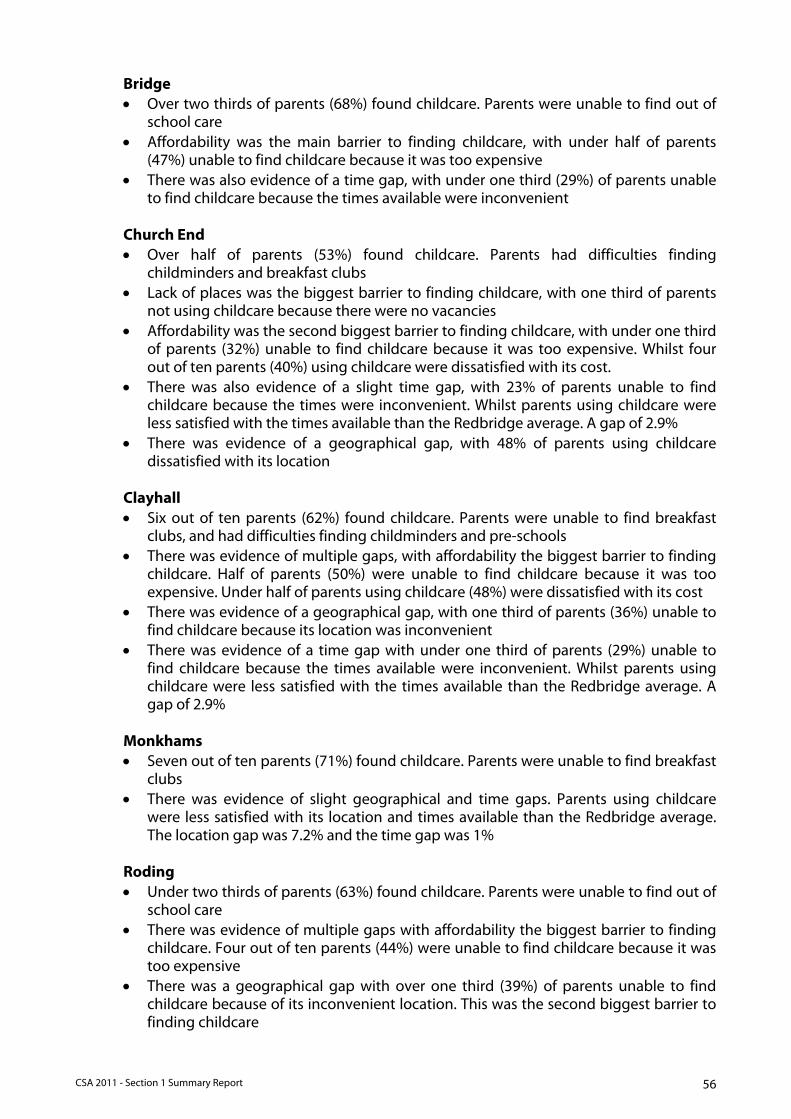
Bridge • Over two thirds of parents (68%) found childcare. Parents were unable to find out of
school care • Affordability was the main barrier to finding childcare, with under half of parents
(47%) unable to find childcare because it was too expensive • There was also evidence of a time gap, with under one third (29%) of parents unable
to find childcare because the times available were inconvenient Church End • Over half of parents (53%) found childcare. Parents had difficulties finding
childminders and breakfast clubs • Lack of places was the biggest barrier to finding childcare, with one third of parents
not using childcare because there were no vacancies • Affordability was the second biggest barrier to finding childcare, with under one third
of parents (32%) unable to find childcare because it was too expensive. Whilst four out of ten parents (40%) using childcare were dissatisfied with its cost.
• There was also evidence of a slight time gap, with 23% of parents unable to find childcare because the times were inconvenient. Whilst parents using childcare were less satisfied with the times available than the Redbridge average. A gap of 2.9%
• There was evidence of a geographical gap, with 48% of parents using childcare dissatisfied with its location
Clayhall • Six out of ten parents (62%) found childcare. Parents were unable to find breakfast
clubs, and had difficulties finding childminders and pre-schools • There was evidence of multiple gaps, with affordability the biggest barrier to finding
childcare. Half of parents (50%) were unable to find childcare because it was too expensive. Under half of parents using childcare (48%) were dissatisfied with its cost
• There was evidence of a geographical gap, with one third of parents (36%) unable to find childcare because its location was inconvenient
• There was evidence of a time gap with under one third of parents (29%) unable to find childcare because the times available were inconvenient. Whilst parents using childcare were less satisfied with the times available than the Redbridge average. A gap of 2.9%
Monkhams • Seven out of ten parents (71%) found childcare. Parents were unable to find breakfast
clubs • There was evidence of slight geographical and time gaps. Parents using childcare
were less satisfied with its location and times available than the Redbridge average. The location gap was 7.2% and the time gap was 1%
Roding • Under two thirds of parents (63%) found childcare. Parents were unable to find out of
school care • There was evidence of multiple gaps with affordability the biggest barrier to finding
childcare. Four out of ten parents (44%) were unable to find childcare because it was too expensive
• There was a geographical gap with over one third (39%) of parents unable to find childcare because of its inconvenient location. This was the second biggest barrier to finding childcare
CSA 2011 - Section 1 Summary Report 56
• There was a time gap with under one third of parents (29%) unable to find childcare because the times available were inconvenient
Snaresbrook • Under two thirds of parents (62%) found childcare. Parents had difficulties finding day
nurseries and childminders • Lack of places was the biggest barrier to finding childcare, with four out of ten
parents (43%) not finding childcare because there were no vacancies • There was evidence of a small geographical gap, with parents using childcare less
satisfied with its location than the Redbridge average. A gap of 5% Wanstead • Under three quarters of parents (74%) found childcare. Parents were unable to find
holiday schemes and had difficulties finding childminders • There was evidence of a large geographical gap, with half of parents (50%) unable to
find childcare because of its inconvenient locations. This was the biggest barrier to finding childcare
• There was also evidence of a time gap, with four out of ten parents (43%) unable to find childcare because the times available were inconvenient
• Affordability was an issue for parent using childcare, with four out of ten parents (46%) dissatisfied with its cost
1.10 Conclusion / Next steps
An Action Plan is published alongside this report.
CSA 2011 - Section 1 Summary Report 57