cs294-1 behavioral data mining - people
TRANSCRIPT

Behavioral Data Mining
Lecture 9
Intro. to Causal Analysis and Observational Studies

Outline
• Confounds
• Matching
• Mahalanobis distance matching
• Propensity Scores
• Checking Balance

A Mechanical Turk study revisited
• Please state your income:
• Please state your gender:

A Mechanical Turk study revisited
Result: On average women earn 10x what men do ??

Mechanical Turker Demographics
5

Scatter Plot
Income
Female Male

Regression
Income
Female Male

Scatter Plot
Income
Female Male
US Turkers
Indian Turkers

Matching
Income
Female Male
US Turkers
Indian Turkers

Observational Studies
Observational Study: Umbrella term for studies
conducted without randomization.
We assume there is treatment and a control group, but
that the assignment cannot be done randomly. Examples of
generalized treatments:
• Drugs already prescribed
• Smoking, Chronic Illness
• Genetic effects
• Marriage/divorce
• Nationality, Gender, Education
• Life Events
• Values

Natural Experiments
Even if the treatment assignment isn’t randomized by the
experimenter, it can still be random by “nature”, and
independent of any confound:
• Gender of human children is a good example.
An experiment designed with such a treatment is called a
“Natural Experiment”.
But the Turker example shows that natural treatment of a
population is not enough. The dataset sampling must also
be random across the treatment conditions, but here it
clearly is not.

Causal Analysis
Much of behavioral data analysis is concerned with causal or
counterfactual questions:
• Did observable A cause B ?
• What would happen if A=b (not observed) instead of A=a
(observed)?
• Will showing this ad promote a purchase?
• Does spending time on Facebook enhance job prospects?
• Does playing video games postpone cognitive decline?

Correlation Causation
Retargeting: serve ads that correlate with purchases.
Do they enhance purchases?

Causal Analysis
Non-treatment variables which correlate with either the
treatment or the outcomes are potential confounds.
Causal analysis deals with eliminating or reducing the effects
of those variables.
In the Turk study these are:
• Nationality
• Age
• Education
• Employment area
Note these only affect admission of individuals into the study,
not their gender.

Outline
• Confounds
• Matching
• Mahalanobis distance matching
• Propensity Scores
• Checking Balance

Multivariate Matching
Income
Female Male
Education Age
Employment
Nationality

Multivariate Matching
Let the two populations be 𝑃1 and 𝑃2 and take samples 𝐺1 and
𝐺2 from them.
• Find “matching” subsamples 𝐺1∗ and 𝐺2∗ that agree on all the
non-outcome (matching) variables X.
• Compare values of outcome (dependent) variables between
𝐺1∗ and 𝐺2∗.
For discrete matching variables, the matching is normally simple
agreement on those variables (e.g. Nationality).
For continuous variables, the goal is to reduce the bias in the
dependent variable estimates, EPBR or Equal Percent Bias
Reducing.

Multivariate Matching
What measure of similarity to use for matching?:
• Mahalanobis distance (covariance-corrected euclidean
distance).
• Propensity score.
• Genetic matching.

Mahalanobis Distance Matching
For a multivariate data vector 𝑋1, … , 𝑋𝑁𝑇 with means
𝜇1, … , 𝜇𝑁𝑇, the covariance matrix is
𝑆𝑖𝑗 = E 𝑋𝑖 − 𝜇𝑖𝑇(𝑋𝑗 − 𝜇𝑗)
The Mahalanobis distance between points 𝑥 and 𝑦 is
𝑑 𝑥, 𝑦 = 𝑥 − 𝑦 𝑇𝑆−1 𝑥 − 𝑦
or equivalently the euclidean distance in a projection space:
𝑝 𝑥 = 𝑆−12 𝑥 − 𝜇

Mahalanobis Distance Matching
If the original data are ellipsoidally-distributed, the Mahalanobis
projection produces independent, equal-variance coordinates:
𝑝 𝑥 = 𝑆−12 𝑥 − 𝜇
Under these conditions, Mahalanobis distance matching is EPBR

Multivariate Matching Difficulties
Multivariate matching has many difficulties.
In particular there is a “curse of dimensionality”.
As d (number of covariates) goes up, the number of cells in a d-
dimensional partition of space grows exponentially with d.
Intuitively, we care most about variables which are true
confounds, i.e. whose values differ between treatment
and control groups.
e.g. If gender were balanced between US and Indian Turker
groups, we would not see a confounding between nationality
and gender.

Outline
• Confounds
• Matching
• Mahalanobis distance matching
• Propensity Scores
• Checking Balance

Propensity Score
It may be possible to use a simpler function of the covariates
for matching. Define a balancing score 𝑏(𝑥) such that
i.e. the conditional distribution of x given b(x) is the same for
different values of z (treatments).
The balancing score removes coordinates that don’t help (that
don’t covary with the treatment).
It turns out there is a single coarsest balancing score called the
propensity score.

Propensity Score
Define
𝑒 𝑥 = Pr 𝑧 = 1 𝑥)
then 𝑒 𝑥 is the propensity score.
𝑒 𝑥 is a univariate function which succinctly predicts the
treatment condition from the covariates.
While there is no closed form in general for 𝑒 𝑥 , it is often
approximated with a logistic model.

Propensity Score Matching
After estimating 𝑒 𝑥 , the univariate values of 𝑒 𝑥 are used for
matching. Several matching strategies are possible:
• Nearest neighbor matching: from one side (e.g. treatment)
find the nearest neighbor in the other side.
• This results in a stratification of the treatment values.
= control
= treatment
Causal effects (differences) in outcomes between control and
treatment cases treatment values are computed in each
stratum.

Stratification
Break the score range into strata of some size (oblivious to the
sample values)
= control
= treatment
Propensity Score
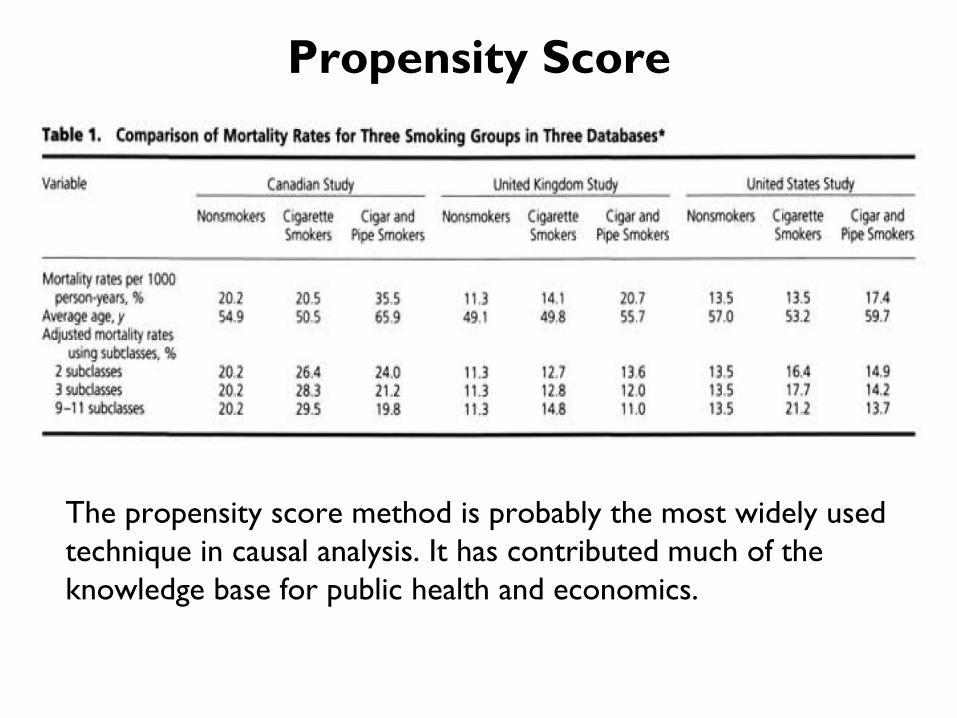
The propensity score method is probably the most widely used
technique in causal analysis. It has contributed much of the
knowledge base for public health and economics.

Outline
• Confounds
• Matching
• Mahalanobis distance matching
• Propensity Scores
• Checking Balance

Strong Ignorability
If (𝑟1, 𝑟0) are some observations, 𝑣 some covariates, then if
(𝑟1, 𝑟0) ⊥
we say the treatment assignment is strongly ignorable.
This requires that every combination of covariates and
treatments actually occur.
It also assumes that all covariates are observable.
These are strong conditions, as is the requirement to compute
an accurate 𝑒 𝑥 . So matching is still a preferable alternative in
many cases.
⊥ 𝑧 | 𝑣 0 < Pr 𝑧 = 1 𝑣 < 1

Checking Balance
If 𝑇 is the treatment variable, 𝑋 the observed covariates and 𝑈
the unobserved covariates, selection on observables gives:
And if propensity scoring using is used, it should be that:
If the propensity score balances, the distribution of covariates
in strata of should be identical between treatment and
control.

Kolmogorov-Smirnoff Test
Is a non-parametric test to determine if two distributions could
be the same.
It tests a variety of forms of difference, and is a good choice for
checking balance in a univariate matching method.
This is the basis of the “Genetic Match” algorithm from the
reading.