cryogenic fiber optic sensors for superconducting magnets ... · pdf filecryogenic fiber optic...
TRANSCRIPT

CER
N-T
HES
IS-2
015-
342
15/1
2/20
15
Cryogenic Fiber Optic Sensors for Superconducting Magnets
and Power Transmission Lines in High Energy Physics Applications
Dottorato di Ricerca in “Ingegneria dell’informazione”
XXVII Ciclo
Universita’ degli Studi del Sannio, Benevento
Dipartimento di Ingegneria
15th December 2015
Tutors Candidate
Prof. Andrea Cusano Antonella Chiuchiolo Ing. Marta Bajko
Co - tutors
Dr. Hugo Bajas Dr. Marco Consales
© Antonella Chiuchiolo


I
Abstract
In the framework of the Luminosity upgrade of the Large Hadron Collider (HL - LHC), a remarkable R&D effort is now ongoing at the European Organization for Nuclear Research (CERN) in order to develop a new generation of accelerator magnets and superconducting power transmission lines. The magnet technology will be based on Nb3Sn enabling to operate in the 11 - 13 T range. In parallel, in order to preserve the power converters from the increasing radiation level, high power transmission lines are foreseen to feed the magnets from free - radiation zones. These will be based on high temperature superconductors cooled down with helium gas in the range 5 - 30 K.
The new technologies will require advanced design and fabrication approaches as well as adapted instrumentation for monitoring both the R&D phase and operation. Resistive sensors have been used so far for voltage, temperature and strain monitoring but their integration still suffers from the number of electrical wires and the complex compensation of magnetic and thermal effects. These issues might be overcome by developing a new technology based on fiber optic sensors for their well-known advantages like the small size, the intrinsic electrical insulation, immunity to electromagnetic interferences and multiplexing capability although the environmental complexity makes the technology not well assessed yet in the field of superconductivity.
This thesis presents the progress done in the material selection and temperature characterization (in the range 300 - 4.2 K) of coated FBG sensors. Results of their implementation in the 20-m-long power transmission line for the helium gas temperature monitoring are also reported. FBG sensors in bonded and embedded configuration have been also integrated in sub-scale Nb3Sn dipole magnets for monitoring the main stages of the magnet service life. Experimental results are presented during magnet assembly and thermal cycle down to 1.9 K, when applied compressive forces reach up to 200 MPa, during energization up to 20 kA and quench monitoring under high magnetic fields (up to 13 T).
Key words: LHC, Fiber Bragg Grating, sensors, superconductivity, cryogenic temperature

II

III
Acknowledgements
This work has been achieved during three years’ experience in the CERN laboratories in the Test Facility (TF) section of the Magnet, Superconductors and Cryostat (MSC) group, Technology department (TE). Many people supported me and contributed to the accomplishment of this research and its success.
I would like to thank for this opportunity my supervisor Andrea Cusano who has proposed me to push the research in such extreme field of application giving me demanding targets, ideas and motivations. Along with his enthusiasm the support in this challenge of my CERN supervisor Marta Bajko has been fundamental for this research to take place. I am grateful to her for giving me the opportunity to take actively part in a unique cryogenic test facility and projects, to work autonomously, giving responsibilities which allowed me to grow professionally and personally.
I wish to express my thanks to Hugo Bajas for his essential contribution in the magnet test campaigns, his passionate and constructive discussions on the problematic of the Nb3Sn magnets and for his support and motivation in the most complicated moments of this work.
I am grateful also to Marco Consales and the Optoelectronic division of the University of Sannio for the technical help even from far away and Salvatore Buontempo for his encouragement in making this research advance in such singular environment.
Of course I cannot forget to thank Luca Bottura as leader of the MSC group for his wise advices and interest in this new research.
My special acknowledgments to Juan Carlos Perez and the Superconducting Magnet Design and Technology (MDT) section for giving me the chance and the technical support to integrate a new technology in advanced record magnets. To Vladimir Datskov for having guided me in the world of cryogenics with his knowledge in the field and his experienced advices. I extend my gratitude to Amalia Ballarino, Sebastiano Giannelli and the Superconductor and Devices (SCD) section for having supported the test in the SC – Link and Luca Palmieri with whom I shared these experiments exchanging ideas and problematics on the distributed sensing technology making the collaboration interesting and innovative.

IV
Thanks to all the members of the Test Facility (TF) section and their technical support in helping me for the fiber integration in the complex cryogenic test facility, without their precise and careful help I could not perform the tests reported in this thesis. I am grateful for their moral support and the team spirit I shared with them.
Lastly I wish to say Grazie to my parents and my sister, for having supported me although the distance, in the difficulties and in the joy, always ready to make me feel not alone and to understand me also in the most delicate moments of this special adventure.

V
List of publications
[1] M.Esposito, S.Buontempo, A.Petriccione, M.Zarrelli, G.Breglio, A.Saccomanno,
Z.Zillasi, A.Makovec, A.Cusano, A. Chiuchiolo, M.Bajko, M.Giordano “Fiber Bragg Grating sensors to measure the coefficient of thermal expansion of polymers at cryogenic temperatures”, Sensors and Actuators A: Physical, vol 189, no 15, pp. 195-203, (January 2013)
[2] A. Chiuchiolo, M. Bajko, J. C. Perez, H. Bajas, M. Consales, M. Giordano, G. Breglio, A. Cusano, “Fiber Bragg Grating Cryosensors for Superconducting Accelerator Magnets”, Photonics Journal, IEEE, vol.6, no.6, pp.1-10, (December 2014)
[3] A. Chiuchiolo, L. Palmieri, M. Consales, M. Giordano, A. Borriello, H. Bajas, A. Galtarossa, M. Bajko, A. Cusano, “Cryogenic Temperature Profiling of High Power Superconducting Lines using Local and Distributed Optical Fiber Sensors”, Optics Letters, vol. 40, no 19, pp. 4424-4427, (October 2015)
[4] A. Chiuchiolo, M. Bajko, J. C. Perez, H. Bajas, M. Consales, M. Giordano, G. Breglio, A. Cusano “Fiber Bragg Grating Sensors Based Monitoring System for Superconducting Accelerator Magnets”, Third Mediterranean Photonics Conference 2014, vol., no., pp.1,3, (7-9 May 2014)
[5] A. Chiuchiolo, M. Bajko, J. C. Perez, H. Bajas, P. Viret, M. Consales, M. Giordano, G. Breglio, A. Cusano “Fiber Bragg Grating Sensor as Valuable Technological Platform for New Generation of Superconducting Magnets”, Proc. SPIE 9157, 23rd International Conference on Optical Fibre Sensors, 91579I, (June 2, 2014)
[6] A. Chiuchiolo, M. Bajko, J. C. Perez, H. Bajas, M. Consales, M. Giordano, G. Breglio, L. Palmieri, A. Cusano, “Fiber Optic Cryogenic Sensors for Superconducting Magnets and Superconducting Power Transmission lines at CERN”, Invited paper - Proc. SPIE 9286, Second International Conference on Applications of Optics and Photonics, 92864B (August 22, 2014)
[7] A. Chiuchiolo, M. Bajko, J. C. Perez, H. Bajas, M. Guinchard, M. Giordano, G. Breglio, M. Consales, A. Cusano “Structural Health Monitoring of Superconducting Magnets using Fiber Bragg Grating Sensors”, Proc. of EWSHM - 7th European Workshop on Structural Health Monitoring, Nantes, France, (Jul 2014)
[8] H. Bajas, M. Bajko, A. Chiuchiolo e al. “Cold Test Results of the LARP HQ Nb3Sn quadrupole magnet at 1.9 K”, Applied Superconductivity, IEEE Transactions on, vol. 23, no. 3, (June 2013)

VI
[9] H. Bajas, M. Bajko, L. Bottura, A. Chiuchiolo et al., “Test set up for the cooling of heavy magnets by controlled way down to 77 K ”, Physics Procedia, (2014)
[10] A. Chiuchiolo, L. Palmieri, M. Consales, M. Giordano, H. Bajas, A. Galtarossa, M. Bajko, A. Cusano “Cryogenic temperature monitoring in superconducting power transmission line at CERN with hybrid multi-point and distributed fiber optic sensors”, Proc SPIE 9634 24th International Conference on Optical Fibre Sensors 96341U, (September 2015)
[11] A. Chiuchiolo , H. Bajas , M. Bajko, L. Bottura, S. Buontempo, M. Consales, A. Cusano, M. Giordano, J. C. Perez, “Advances in Fiber Optic Sensors Technology Development for temperature and strain measurements in Superconducting magnets and devices”, 24th International Conference on Magnet Technology, Seoul, Korea, (October 2015) (in press).

7
Contents
Abstract ............................................................................................................................ I
Acknowledgements ....................................................................................................... III
List of publications ........................................................................................................ V
Introduction ................................................................................................................... 11
Chapter 1 ..................................................................................................................... 15
High Energy Physics needs and requirements ......................................................... 15
The Large Hadron Collider at CERN .............................................................. 16
Superconductivity and Cryogenics .................................................................. 17
The HL – LHC upgrade: needs and requirements............................................ 22
1.4.1 Introduction ................................................................................................. 22
1.4.2 A new generation of accelerator magnets based on Nb3Sn ......................... 23
1.4.3 High Temperature Superconducting Transmission Lines ............................ 24
Typical Cryogenic Instrumentation ................................................................. 24
References ..................................................................................................................... 27
Chapter 2 ..................................................................................................................... 31
Fiber Optic Sensors technologies and applications ................................................. 31
Fiber Optic Sensors .......................................................................................... 32
FOS technology and fields of application ................................................... 32
FOS for cryogenics ...................................................................................... 34

8
Fiber Bragg Grating Sensors ............................................................................ 37
FBG working principle ................................................................................ 37
FBG for cryogenic applications. State of the art ......................................... 40
FBG sensors as a challenging technology for superconducting magnets and
cryogenic applications .................................................................................................. 47
References ..................................................................................................................... 49
Chapter 3 ..................................................................................................................... 55
Development of FBG based Thermal Cryogenic Sensor ........................................ 55
Introduction ...................................................................................................... 56
Sensors design and fabrication ......................................................................... 57
Coated FBGs design and material selection ................................................ 57
Sensors fabrication ...................................................................................... 61
Sensors characterization in the range 300 – 4.2 K .......................................... 63
Cryo - cooler experimental set up ................................................................ 63
PMMA coated FBG characterization .......................................................... 65
Epoxy coated FBG characterization ............................................................ 71
Epoxy coated FBGs optimization .................................................................... 75
Sensors selection ......................................................................................... 75
Sensors calibration in the range 300 – 4.2 K ............................................... 77
Sensitivity study .......................................................................................... 79
Conclusions ...................................................................................................... 81
References ..................................................................................................................... 83
Chapter 4 ..................................................................................................................... 85
Validation of Fiber Optic Thermal Cryogenic Sensors for Superconducting
Transmission Lines ..................................................................................................... 85
4.1 Introduction ...................................................................................................... 86

9
4.2 Sensors integration in the SC – Link ............................................................... 87
4.3 FBGs validation in real application ................................................................. 90
4.3.1 Temperature sensors set up.......................................................................... 90
4.3.2 Feasibility in the SC - Link ......................................................................... 91
4.4 Feasibility study of using Rayleigh scattering fiber optic sensors in the SC - Link
94
4.5 Optimized epoxy coated FBGs validation in real application .......................... 97
4.5.1 Temperature sensors set up.......................................................................... 97
4.5.2 Cryogenic tests ............................................................................................ 98
4.6 Conclusions .................................................................................................... 101
References ................................................................................................................... 103
Chapter 5 ................................................................................................................... 105
Embedded Fiber Bragg Grating sensors for new generation of Superconducting
Magnets ...................................................................................................................... 105
Introduction .................................................................................................... 106
Magnet structure and service life ................................................................... 107
Embedded FBG for strain and temperature measurements ............................ 110
Feasibility of strain and temperature monitoring with embedded FBG sensors
111
5.4.1 Experimental set-up of Nb3Sn cables stack instrumented with FBGs ....... 111
5.4.2 Experimental results of the impregnation monitoring ............................... 114
Sensors integration in the magnet .................................................................. 118
5.5.1 Bonded FBGs on the magnet structures .................................................... 118
5.5.2 Embedded FBGs in Nb3Sn race track coils ............................................... 119
Magnet behaviour characterization ................................................................ 123
5.6.1 Assembly at room temperature .................................................................. 123
5.6.2 Cool down to 77 K and 1.9 K .................................................................... 125

10
5.6.3 Powering and quench monitoring .............................................................. 129
Conclusions .................................................................................................... 133
References ................................................................................................................... 134
Conclusions ................................................................................................................. 137

11
Introduction
The Large Hadron Collider (LHC) situated at the European Organization for Nuclear Research (CERN), between France and Geneva, is the biggest experiment on Earth that explores new territories of the human knowledge about the fundamental interactions existing between elementary particles. In 2012, the Brout-Englert-Higgs boson, BEH-boson was discovered in the LHC detectors ATLAS and CMS. For the last 30 years, High Energy Physics performed around the world has been one of the main drivers for the development of particles accelerators and superconducting magnets. With a start in 2008, the LHC is now operating at energy of 3.5 TeV/beam with a gradual boost of the performance of the machine up to 6.8 TeV/beam for the next coming years. Since the 1st November 2011, the High Luminosity LHC project (HL-LHC) aims at study and implement the necessary changes to increase the luminosity of the LHC machine by a factor five around 2023.
The HL-LHC R&D program relies on the replacement of dipole and quadrupole magnets at some segments of the LHC ring by new generation of superconducting magnets operating in the 11-13 T range. For HL-LHC, the new dipole magnets would create a dipole magnetic field of 11 T in a 60 mm aperture allowing the insertion of extra-collimator in the LHC ring for better beam integrity. The new quadrupole magnets, to be placed before the interaction region of ATLAS and CMS experiments, would produce 150 T/m gradient in a 150 mm aperture for higher focus and luminosity of the beam. The new kind of magnets are based on Nb3Sn conductor instead of the presently used NbTi. This change of superconductor is necessary to achieve higher magnetic fields in the conductors compared with the field that can be produced by state-of-the-art magnets using NbTi.
In parallel to Nb3Sn magnet R&D, new high power transmission lines using superconductors, are foreseen in order to feed the magnets from radiation – free zones where power supplies and current leads would be displaced. The Superconducting Link project (SC Link) at CERN relies on high temperature superconducting materials (HTS),

__________________________________________________________ Introduction
12
mainly MgB2, for its conductor over around 300-m long and it is one pillar of the work done for the LHC performance optimization and HTS technology developments.
Magnet and transmission lines R&D phase implies advances in the instrumentation which are integral part of the systems. Instrumentation concerns the implementation of adapted thermometers, strain-gauges and voltage taps in the superconducting devices in order to monitor, control and characterize the conductor behaviour. It helps in the fabrication process validating the mechanical Finite Element (FEM) simulation and giving diagnostic during the devices operating conditions. The instrumentation relies on a reliable sensing system able to withstand wide temperature gradient (1.9 – 400 K), strong magnetic field (up to 13 T) and high mechanical stresses (up to 200 MPa). So far, well assessed resistive sensors are commonly used for voltage, temperature and strain monitoring in the superconducting magnets and cryogenic devices, but their integration suffers from the number of electrical wires (brining extra heat- in -leak into the cryogenic environment in which they are installed) and the complex compensation of magnetic and thermal effects.
The thesis presented here falls within an R&D framework for instrumentation improvement using Fiber Optic Sensors (FOS) instead of resistive sensors for cryogenics devices monitoring. The study takes advantage of the FOS technical advancements in many fields of application although not much experience exists for cryogenic temperatures and in superconducting magnets. The research carried out during this thesis is addressed to the design, development and testing of a new sensing, monitoring system based mainly on Fiber Bragg Grating (FBG) technology for cryogenic applications. The main scope of this thesis is to serve the needs and requirements of monitoring cryogenic temperatures over long distances inside the SC link cryostat, to monitor the thermo mechanical behaviour of magnets during their service life: coil fabrication at 125 °C, magnet assembly at room temperature, magnet cool down to 4.2 and 1.9 K and energization with current up to 20 kA. The design and the development of the sensors have been addressed to study and characterize the properties of the sensors in the range 300 – 4.2 K and to customize the samples for the specific application.
During the three years at CERN, strain and temperature FOS have been implemented in Nb3Sn short scale dipole magnets and in the first prototype of superconducting power transmission line. Important part of the work was dedicated to equip the cryogenic test facility with optical set-up that were not existing before in order to be able to follow the various tests. It has required protection solutions for the fiber handling and compatibility with harsh environment.
The multidisciplinary of the work presented involves competences in optics, material science, mechanics, superconductivity and cryogenics, thus requiring the support and the collaboration of the Optoelectronic Division - Engineering Department of University of Sannio, the CERN Magnet, Superconductors and Cryostats group of the Technology

__________________________________________________________ Introduction
13
department (TE-MSC), the Photonics and Electromagnetics Group of University of Padova and the Institute for Composite and Biomedical Materials of the Italian National Research Council (CNR).
This thesis is organized as follows.
Chapter 1 is dedicated to an overview of superconductivity and cryogenics with in depth analysis of the needs and requirements of the luminosity upgrade of the LHC and the most commonly used cryogenic instrumentation at CERN.
Chapter 2 presents the state-of-the-art fiber optic sensors with a particular interest in the technologies proposed in the literature for cryogenic temperatures. The study is then focused on the FBG sensor working principle and the state of the art of its application for monitoring cryogenic temperature and superconducting magnets.
In light of what proposed in the literature, Chapter 3 presents the design, the fabrication and the characterization of coated FBG based sensors with enhanced sensitivity up to 4.2 K relevant for cryogenic applications. A detailed study became possible thanks to a dedicated test facility for FBG characterization in a controlled environment leading to the material selection of the coating.
The validation of the proposed sensors has been carried out performing tests in the 20-m-long power transmission line as reported in Chapter 4. It also introduces the first feasibility study on the use of distributed sensors based on Rayleigh scattering implemented in a hybrid monitoring system together with the FBG sensors.
In Chapter 5, the development and the study of the thermo-mechanical behaviour of magnets is presented. A brief introduction to the complex magnet structure and service life is described followed by the illustration of the issues and the solutions proposed for the fiber integration. Two approaches have been used for strain monitoring based on glued sensors on the magnet structure and on embedded sensors in the magnet coil. Results obtained during assembly, cool down and powering of the magnet are reported. A challenging solution to separate thermal and mechanical effects in an embedded configuration is proposed and a first feasibility study carried out on a cable stack during its impregnation process in the epoxy resin.
The conclusions summarize the main achievements realized during this thesis in terms of new technological development for the use of Fiber Optic sensors in CERN cryogenic devices. The thesis ends with the open issues and possible improvements of FBG sensors for future implementations.

14

15
Chapter 1 High Energy Physics needs and requirements The field of High Energy Physics (HEP) aims to explore the elementary constituents of matter and energy, the interactions between them, and the nature of space and time by developing new accelerators and detectors that has led over the years to the emergence of cutting-edge technologies based on superconductivity. The Large Hadron Collider, built at the European Organization for Nuclear Research (CERN), represents the latest stage in this evolution being the biggest powerful instrument ever built to give a significant contribution in the sector of knowledge and technology. Applied superconductivity plays an important role in the evolution of high energy physics accelerators becoming a replacement technology which offers challenging and promising perspectives of science developments in many fields of applications.

_______________________________________ The Large Hadron Collider at CERN
16
The Large Hadron Collider at CERN The Large Hadron Collider (LHC) is the world's largest particle accelerator ever built to address some of the most fundamental questions of particle physics, to investigate the structure of the matter and to complete the prediction of the Standard Model by discovering the missing particle: the Higgs Boson. It was built starting from 1998 by the European Organization for Nuclear Research (CERN) founded in 1954 and situated in Geneva on the border between France and Switzerland. The design and realization of the LHC has required a 20-year-long remarkable technological effort in many areas of engineering thanks to the collaboration of 7000 scientists and engineers from over 60 countries, hundreds of universities and laboratories, culminated with its start up in 2008.
Figure 1. 1 Accelerators complex at CERN. The LHC is the biggest and the last element of
the chain.
The LHC consists of a 27 km ring situated 100 m underground and designed to collide counter-circulating proton beams up to 7 TeV/beam (i.e. 14 TeV centre-of-mass energy) and a luminosity of 1034 cm-2 s-1 through a system of high-field superconducting magnets, the most powerful operating at 8.3 T magnetic field at a current of around 11700 A in superfluid helium at 1.9 K temperature. Two beams travel in opposite directions in separate beam pipes kept at ultrahigh vacuum of 10-10 Torr (~3 million molecules/cm3). Traveling closed to the speed of light, the particles are injected, accelerated, and kept circulating for hours, guided around the accelerator ring by the magnetic field. They are made then collide at small crossing angle in the four experiments equipped with detectors [1] known by their acronyms: ALICE, ATLAS, CMS, and LHCb. In order to obtain the desired field level and to meet efficiency and cost targets, superconductivity plays a fundamental role: the accelerator is based on the reliable operation of magnets including 1232 main dipoles (15 m long and 30 tonnes) for bending the beam along the ring, 392
_______________________________________ The Large Hadron Collider at CERN
17
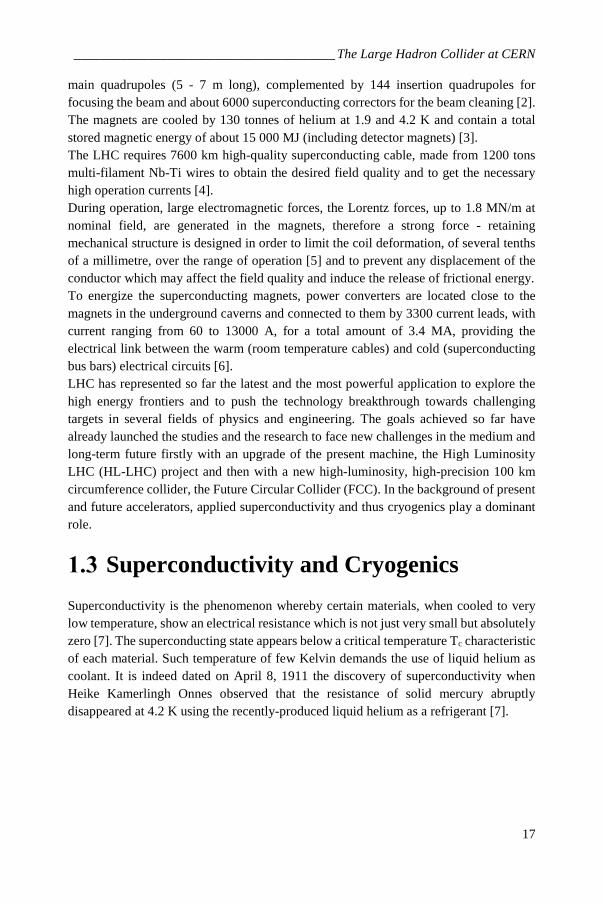
main quadrupoles (5 - 7 m long), complemented by 144 insertion quadrupoles for focusing the beam and about 6000 superconducting correctors for the beam cleaning [2]. The magnets are cooled by 130 tonnes of helium at 1.9 and 4.2 K and contain a total stored magnetic energy of about 15 000 MJ (including detector magnets) [3]. The LHC requires 7600 km high-quality superconducting cable, made from 1200 tons multi-filament Nb-Ti wires to obtain the desired field quality and to get the necessary high operation currents [4]. During operation, large electromagnetic forces, the Lorentz forces, up to 1.8 MN/m at nominal field, are generated in the magnets, therefore a strong force - retaining mechanical structure is designed in order to limit the coil deformation, of several tenths of a millimetre, over the range of operation [5] and to prevent any displacement of the conductor which may affect the field quality and induce the release of frictional energy. To energize the superconducting magnets, power converters are located close to the magnets in the underground caverns and connected to them by 3300 current leads, with current ranging from 60 to 13000 A, for a total amount of 3.4 MA, providing the electrical link between the warm (room temperature cables) and cold (superconducting bus bars) electrical circuits [6]. LHC has represented so far the latest and the most powerful application to explore the high energy frontiers and to push the technology breakthrough towards challenging targets in several fields of physics and engineering. The goals achieved so far have already launched the studies and the research to face new challenges in the medium and long-term future firstly with an upgrade of the present machine, the High Luminosity LHC (HL-LHC) project and then with a new high-luminosity, high-precision 100 km circumference collider, the Future Circular Collider (FCC). In the background of present and future accelerators, applied superconductivity and thus cryogenics play a dominant role.
Superconductivity and Cryogenics Superconductivity is the phenomenon whereby certain materials, when cooled to very low temperature, show an electrical resistance which is not just very small but absolutely zero [7]. The superconducting state appears below a critical temperature Tc characteristic of each material. Such temperature of few Kelvin demands the use of liquid helium as coolant. It is indeed dated on April 8, 1911 the discovery of superconductivity when Heike Kamerlingh Onnes observed that the resistance of solid mercury abruptly disappeared at 4.2 K using the recently-produced liquid helium as a refrigerant [7].

_________________________________________ Superconductivity and Cryogenics
18
Figure 1. 2 Historic plot of the resistance (Ohms) versus temperature (Kelvin) showing the
superconducting transition at 4.2 K for mercury from Onnes experiment in 1911.
The early superconductors, such as Pb, In and Hg are classified as Type I superconductors. The maximum fields Bc in which these superconductors can operate are usually less than 0.1 T, for higher applied magnetic field superconductivity breaks down and this limitation makes Type I superconductors impractical for magnets applications. The next great milestone occurred in 1933 when German researchers Walther Meissner and Robert Ochsenfeld discovered that superconductors expelled applied magnetic fields, a phenomenon which has become known as the Meissner effect. In subsequent decades, superconductivity was observed in several other materials like lead and niobium nitride found to be superconductor at 7 and 16 K respectively. In 1935 the discovery of Type II superconductor gave the access to useful technical application in superconducting magnets. For these materials superconductivity occurs above a certain critical field strength Bc1 and breaks down at a higher critical field Bc2. It was only after 46 years from the real first experimental observation of superconductivity, in 1957, that the first microscopic theory of superconductivity was proposed by the American physicists John Bardeen, Leon Cooper, and John Schrieffer (Nobel prize in 1972). The BCS theory represents the universally accepted theory which explains the complex mechanics of low temperature superconductors (LTS). It was in the early 1960s that the first practical applications of superconductivity lead to intense activities in the study and development of conductors for winding magnet coils and the first commercial superconducting wire, a niobium-titanium alloy, was developed by researchers at Westinghouse. The breakthrough came in 1986, when the physicists Georg Bednorz and Alex Müller, working at IBM in Zurich Switzerland, were experimenting with a particular class of metal oxide ceramics called perovskites. Bednorz and Müller surveyed hundreds of

_________________________________________ Superconductivity and Cryogenics
19
different oxide compounds. Working with ceramics of lanthanum, barium, copper, and oxygen they found indications of superconductivity at 35 K. It was shortly found that a perovskite ceramic material was superconducting at 92 K. It was the first time a material (today referred to as YBCO) had been found that would be superconducting at temperatures warmer than liquid nitrogen, a commonly available coolant (at atmospheric pressure, the boiling point of nitrogen is 77 K). Because these materials are superconductor at significantly higher temperatures they are referred to as High Temperature Superconductors (HTS) in respect to the LTS. The continuous research of materials which exhibit superconducting behaviour at higher and higher critical temperature brought to the latest discovery of materials like Magnesium Diboride (MgB2) and iron based materials in 2001 and 2008 which are superconductors at 39 K and up to 55 K respectively. Superconducting materials stay in their superconducting state below a critical surface defined by: the critical temperature (Tc), the upper critical magnetic field (Bc2), the critical current density (Jc), where Tc and Bc2 depend on the material properties while the Jc strongly depends on the producer processing. They define the boundaries of the environment within which a superconductor can operate, i.e. in temperatures up to Tc magnetic fields up to Bc and with currents up to Jc. The critical surface in three dimensional space is reported in Figure 1. 3. However, the critical surface also depends on a fundamental parameter which is the mechanical strain εc. In the early eighties a large effect of the mechanical strain on the Tc, Jc and Bc2 has been found and reported for the multi-filamentary Nb3Sn conductors [8].
Figure 1. 3 Critical surface for a superconductor, which is the boundary between superconductivity and normal resistivity in 3 dimensional space, applied field (B),
temperature (T) and current density (J).

_________________________________________ Superconductivity and Cryogenics
20
Type II family is composed by the alloy superconductors such as NbTi, and compounds like Nb3Sn, MgB2. These materials are the most promising superconductors from the engineering point of view being more suitable for several applications. NbTi is a ductile alloy with Tc ~9.2 K at 0 T, BC2 ~10.5 T at 4.2 K, Nb3Sn is an intermetallic compound having a TC ~18 K at 0 T and BC2 ~24-25 T at 4.2 K. MgB2 belongs to the family of HTS materials having a Tc= 39 K. To date NbTi is still the most popular magnet conductor, with Nb3Sn being used for special high field magnets and HTS for some prototypes. The coil windings of a superconducting magnet are made of wires of Type II superconductors. The wire itself may be made of filaments of typical diameter in the range 5 – 10 µm surrounded by a stabilizer (typically copper), it is shown in Figure 1. 4a. The copper is needed to provide a low resistance path for the large currents in case the temperature rises above Tc or the current rises above Jc and superconductivity is lost. For currents from 5 to 10 kA, the superconducting cable requires from 20 to 40 wires in parallel in a fully transposed configuration. The Rutherford cable, a flat cable composed of twisted wires, is the most common cable used for accelerator magnets. A typical cross-section of a Rutherford cable is in Figure 1. 4b.
Figure 1. 4 Multi-filament wire or strand (above), multi strand Rutherford cable (below).
As the critical surface is the boundary between the superconducting and normal resistive state, if a local increase of Tc, Bc, Jc or εc is such to cross the critical surface, it may give origin to a process known as quench. The quench is the transition from superconducting to resistive state during which the electromagnetic stored energy in the conductor is converted into heat. The quench always starts at a point and then grows in three dimensions via the combined effects of Joule heating and thermal conduction. During this process, the initiating point (hereafter called hotspot) will suffer the highest temperature rise since it is subjected to ohmic heating for the longest time. The temperature rise may be sufficient to melt the conductor [7]. The lower the temperature,

_________________________________________ Superconductivity and Cryogenics
21
the better superconductors work, the higher the currents and magnetic fields they can stand without returning to their normal state. It is for this reason that liquid helium (LHe) is used as a coolant for most superconductors, even those with critical temperatures far above its boiling point of 4.2 K. Niobium-titanium magnets are sometimes operated at temperatures below the normal boiling temperature of liquid helium (4.2 K) to achieve even higher fields. In the case of the LHC the superconducting magnets are cooled to the superfluid helium temperature 1.9 K because of its low bulk viscosity which enables to permeate the heart of the magnet windings [9]. Moreover, working at 1.9 K increases the temperature margin, the difference between the critical temperature of the material and the operating temperature, reducing the amount of energy deposition that can trigger a quench. Cryogenics plays an indispensable and enabling role in superconductivity and its applications representing an essential underpinning technology for the cooling of superconductors. Nevertheless its use presents some barriers related to the expense and engineering complexity introduced by operating at very low temperatures. The design and the construction of systems operating at cryogenic temperature, strictly depends on the material properties and the thermo-mechanical changes experienced when operating in thermal conditions far from the ones foreseen for fabrication process. A big impact on the choice of material, the design specifications and the development of these devices, is represented by the change in physical dimensions to which every material is subjected when cooled to cryogenic temperature. Although this effect is on the order of few tenths of a percent change in volume between room temperature and liquid helium temperature, one of the major concerns in building low temperature operating devices is related to the differential thermal contraction of the materials they are made of. Figure 1. 5 shows the integrated thermal expansion coefficient of several materials with the temperature variation from 300 to 4.2 K.
Figure 1. 5 Integrated linear thermal expansion coefficient as function of the temperature
for various materials [10].

_____________________________ The HL – LHC upgrade: needs and requirements
22
Most of the thermal contraction (over 90% of the total contraction from room temperature [11]) is achieved above 50 K or 77 K (boiling point of nitrogen at a pressure of 1 atm) experiencing a nonlinear behaviour approaching cryogenic temperature. In cryogenic systems, components can be submitted to large temperature differences during cool-down or warm-up transient states. Special care must then be taken with assemblies of different solid materials experiencing such temperature changes in order to limit stresses and/or their destruction [10]. This is the case of the superconducting magnets and all the auxiliary devices needed for their operation. Large thermo – mechanical effects, if not predicted from the modelling and controlled during fabrication, will affect the performance of the magnet during operation.
The HL – LHC upgrade: needs and requirements
1.4.1 Introduction
The LHC performances have delivered a remarkable contribution in the field of HEP helping in giving answers to some key questions like the existence of the Higgs Boson announced in 2012. Moreover the interest to enable the science to push the limit of the human knowledge has boosted the research to extend the potential of the machine to higher targets. From this derives the need to upgrade the LHC and to study and develop a new machine configuration named High Luminosity LHC (HL - LHC) which main goal is to achieve a peak luminosity (rate of collisions) of 5x1034 cm-2 s-1 reaching 3000 fb-1 in about a dozen years in the high luminosity experiment ATLAS and CMS. This integrated luminosity is about ten times the nominal LHC performance expected in the first twelve years of LHC lifetime [12]. A more powerful LHC would reduce the time needed to build up statistics and to increase our understanding of the energy frontier faster.
The upgrade relies on several key innovative and challenging technologies which may address the requirements to improve the collimation system, the insertion regions (ATLAS and CMS) and to move the power converters to surface or to radiation free areas. The collimation system will require substituting an LHC main dipole with dipoles of the same bending strength, but with higher magnetic field (11 T instead of the present 8.2 T) and shorter length (11 m instead of the present 15 m) [13]. On the other hand, in order to have a smaller size and more intense beam, it is necessary to replace the quadrupoles at the interaction region with larger aperture/gradients magnets. The goal is to replace the existing 70 mm aperture magnets operating at 200 T/m of the LHC with 150 mm aperture magnet operating at 140 T/m bringing necessarily the peak field in the conductors to of 13 T. Moreover, increasing the luminosity poses issues on the
_____________________________ The HL – LHC upgrade: needs and requirements
23
consequences of the significant level of radiations to which the equipment in the tunnel is exposed limiting the performance and the life time. This is the case of the power converters presently located in underground areas of the main tunnel. A solution proposed to preserve the power converters, the associated electronic devices as well as the distribution feed boxes from any radiation damage is to move them to surface or radiation-free areas feeding the magnets with 300-metre-long high-power superconducting links with zero energy dissipation. This upgrade would also simplify maintenance operations in safer environments.
The objectives to develop accelerator magnets beyond 11 T and to define a new electrical layout to feed the magnets satisfying the specification of the HL – LHC, demand a transition to alternative superconductor materials. The most practical alternative material for the new generation for superconducting magnets is Nb3Sn, while the development of high current superconducting transmission lines can be possible thanks to a novel technology based on the HTS materials [12].
1.4.2 A new generation of accelerator magnets based on Nb3Sn
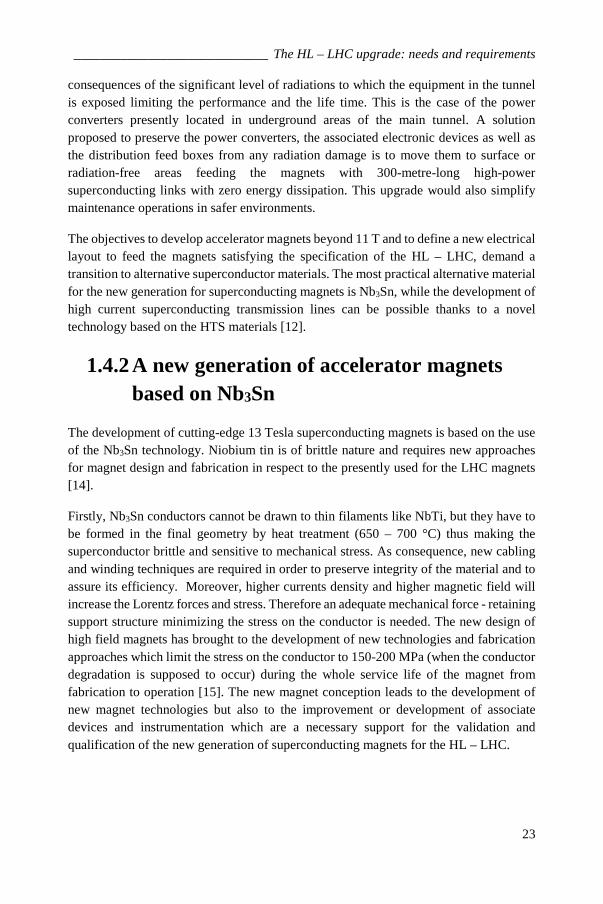
The development of cutting-edge 13 Tesla superconducting magnets is based on the use of the Nb3Sn technology. Niobium tin is of brittle nature and requires new approaches for magnet design and fabrication in respect to the presently used for the LHC magnets [14].
Firstly, Nb3Sn conductors cannot be drawn to thin filaments like NbTi, but they have to be formed in the final geometry by heat treatment (650 – 700 °C) thus making the superconductor brittle and sensitive to mechanical stress. As consequence, new cabling and winding techniques are required in order to preserve integrity of the material and to assure its efficiency. Moreover, higher currents density and higher magnetic field will increase the Lorentz forces and stress. Therefore an adequate mechanical force - retaining support structure minimizing the stress on the conductor is needed. The new design of high field magnets has brought to the development of new technologies and fabrication approaches which limit the stress on the conductor to 150-200 MPa (when the conductor degradation is supposed to occur) during the whole service life of the magnet from fabrication to operation [15]. The new magnet conception leads to the development of new magnet technologies but also to the improvement or development of associate devices and instrumentation which are a necessary support for the validation and qualification of the new generation of superconducting magnets for the HL – LHC.

_____________________________ The HL – LHC upgrade: needs and requirements
24
1.4.3 High Temperature Superconducting Transmission Lines
The design and the development of a high-current superconducting transfer lines, also called superconducting links (hereafter SC-Link), envisages the use of tens of HTS cables rated at different current from a minimum of 120 A up to a maximum of 20 kA. The SC links will have a length ranging from 300 m to 500 m and they will connect the power converters to the magnets across a distance of 80 m. The cables will be assembled in semi-flexible cryostats and cooled by helium gas entering at the temperature of 5 K and warming along the line up to a maximum of 35 K.
Among several materials investigated for this application, MgB2 has been preferred for cable production to be operated in helium gas at a maximum temperature of 25 K [16]. An intense R&D effort is on-going at CERN to develop and to characterize the cables needed for the SC - Link realization [17]. For this purpose a dedicated horizontal test facility has been developed and built at CERN used also for the characterization of the developed instrumentation.
In these applications the correct working condition of the device can be assured with a precise monitoring of the local temperature variation all along the superconducting transmission line. The localization of possible sections, where the He cooling may results insufficient, guarantees safe operation of the superconducting cable below its critical temperature (transition temperature from resistive to superconducting state).
Typical Cryogenic Instrumentation The operation of the LHC superconducting magnets requires a large number of cryogenic sensors, electronic conditioning units and actuators, most of which need to be located inside the tunnel closed to the magnets. The tight temperature margins along the magnets chain require the implementation of accurate instrumentation with long-term robustness and reliability able to operate in extreme working conditions and harsh environment.
Temperature plays a dominant role in the operation of superconducting magnets, thus temperature sensors may be considered among the essential instrumentation needed for a proper monitoring of the working condition and the safe operation of the magnets. While a large number of sensors and actuators are commercially available, specific development and qualification is required for cryogenic thermometers mainly due to the high precision required over a large temperature range 300 – 1.9 K. Different types of sensors are used for cryogenic temperature, silicon diodes, thermocouples, carbon ceramic sensors (CCS), platinum resistance (PT100) and zirconium oxy-nitride thin-film resistance (CernoxTM). For its high accuracy at ultra-low temperature, sensors of the type

_________________________________________Typical Cryogenic Instrumentation
25
CernoxTM are mainly used in the LHC dipole magnets: one per dipole cold mass is installed close to the connection side of the magnet. Each temperature sensor is equipped with four connection wires arranged in a cable [5] [18].
In Figure 1. 6 a picture of the CernoxTM sensor used at CERN is shown.
Figure 1. 6 CERNOXTM type sensors currently used at CERN with copper package
Most applications benefit from the placement of the die chip into a package which provides greater protection for the thin film/electrical contacts and facilitates mounting [19]. The package contains a cavity in which the CernoxTM die chip is soldered as shown in Figure 1. 6.
Other instrumentation considered essential for the magnets operation are the voltage taps used to detect quenches of dipole windings and to permit diagnostics and protection. The voltage taps allow the detection of a resistive voltage growth and the identification of a voltage imbalance (difference of two voltages which are supposed to be the same) in the magnet at the moment of the quench event.
The quench heaters (also protection heaters in literature) are strips which cover several cables turns and are powered when the quench is detected. The heaters then initiate enough resistive volume that the energy can be safely dissipated in the coils, keeping maximum temperatures and voltages within safe limits [20] [21].
Although the instrumentation installed in the LHC magnets is much reduced compared to the prototypes, the number of wires serving each magnets is between 36 and 40 [22] which may represent an issue in terms of heat load to superfluid helium bath. Moreover this instrumentation requires a large number of leak tight feed-through, essential for an electrical connection from inside the liquid helium bath to the outside of the cryostat [22].
With the development of new technologies for the HL - LHC it becomes essential to improve the existing instrumentation or to develop new technologies which can be useful also during the R&D phase.

_________________________________________Typical Cryogenic Instrumentation
26
The introduction of the Nb3Sn technology requires additional needs related to the mechanical measurements of the brittle coils of the new generation of accelerator magnets.
The mechanical behavior of the coil, during the fabrication process as well as the operation, is an essential feature for the magnet performance, therefore the knowledge of the stress condition of the magnets is mandatory in order to prevent the risk of conductor degradation.
Resistive strain gauges are the device mostly used for mapping the strain in the superconducting magnets. The measurement of strain assumes that strain from the structure is transferred without loss to the strain gauge. This requires a perfect bond between the sensor and the surface of the measurement. The strain transferred to the stain gauge causes a change in its electrical resistance [23].
Figure 1. 7. Resistive strain gauge glued on the Ti pole of an Nb3Sn coil built at CERN
Depending on the application, strain gauges may require from 2 to 6 electrical wires. In variable temperature conditions, when the mechanical load is zero or constant, the strain gauges’ reading may be affected by its temperature response. This response, also known in literature as thermal apparent strain, may be due to a combination of effects related to the thermal response of the grid material’s electrical resistance, the thermal response of the material where the sensor is bonded and the temperature response of the wires ‘resistance [23]. Therefore, a precise strain measurement requires temperature compensation achievable with suitable wires configurations.

27
References
[1] P. Lebrun, "Inducstrial technology for unprecented energy and luminosity: the
Large Hadron Collider," in Proceedings of EPAC 2004, Lucerne, Switzerland,
2004.
[2] L. Rossi, "The LHC superconducting Magnets," in Particle Accelerator
Conference, 2003.
[3] L. Rossi, "Superconductivity: its role, its success and its setbacks in the Large
Hadron Collider of CERN," Supercond. Sci. Technol. 23 034001, 2010.
[4] L. Rossi, "Accelerators and Superconductivity: LHC and Near Future in Europe,"
IEEE/CSC & ESAS EUROPEAN SUPERCONDUCTIVITY NEWS FORUM, vol.
No. 1. , 2007.
[5] The Large Hadron Collider conceptual design, Geneva, 1995.
[6] A. Ballarino, "Current leads for the LHC magnet system," LHC Project Report
526, 202.
[7] M. N. Wilson, Superconducting Magnets, Oxford University Press (1983).
[8] J. W. Ekin, "Strain scaling law for flux pinning in practical superconductors. Part
1: Basic relationship and application to Nb3Sn conductors," Cryogenics, vol. 20,
pp. 611-624, 1980.
[9] P. Lebrun and L. Tavian, "Cooling with Superfluid Helium," in CERN Accelerator
School : Course on Superconductivity for Accelerators, Erice, Italy, 2013.

28
[10] P. Duthil, "Material Properties at Low Temperature," CERN Yellow Report
CERN-2014-005, pp.77-95, 2014.
[11] W. F. S. Frederick J. Edeskuty, Safety in the Handling of Cryogenic Fluids, New
York: Plenum Press, 1996.
[12] G. Apollinari, O. Brüning and L. Rossi, "High Luminosity LHC Project
Description," CERN-ACC-2014-0321, 2014.
[13] L. Bottura, G. de Rijk, L. Rossi and E. Todesco, "Advanced Accelerator Magnets
for Upgrading the LHC," IEEE Trans. Appl. Supercond. , vol. 22, 2012.
[14] A. Ballarino and L. Bottura, "Targets for R&D on Nb3Sn conductor fot Hight
Energy Physics," Applied Superconductivity, IEEE Transactions on , vol. 25, no.
2015, pp. 1-6, 2015.
[15] G. Sabbi, "PROGRESS IN HIGH FIELD ACCELERATOR MAGNET
DEVELOPMENT BY THE US LHC ACCELERATOR RESEARCH
PROGRAM," in EuCARD HE-LHC10 AccNet mini-workshop on a High-Energy
LHC, 2011.
[16] A. Ballarino, "Development of Superconducting Links for the Large Hadron
Collider machine," Supercond. Sci. Technol., vol. 27, 2014.
[17] S. Giannelli, A. Ballarino, B. Bordini, J. Hurte and A. Jacquemod, "First
measurements of MgB2cables operatedin Helium Gas up to 35 K," Cern Internal
note EDMS Nr: 1476839, 2015.
[18] V. Datskov, G. Kirby, L. Bottura, J. Perez, F. Borgnolutti, B. Jenninger and P.
Ryan, "Precise Thermometry for Next Generation LHC Superconducting Magnet
Prototypes," Applied Superconductivity, IEEE Transactions on, vol. 24, no. 3, pp.
1-5, 2014.

29
[19] S. S. Courts, "Cernox™ Resistance Temperature Sensors for High Energy Physics
Applications," Lake Shore Cryotronics, Westerville, U.S.A..
[20] F. Rodriguez-Mateos and F. Sonnemann, "Quench heaters studies for the LHC
Magnets," in Particles Accelerator Conference, Chicago, 2001.
[21] T. Salmi, D. Arbelaez, S. Caspi, H. Felice and S. Prestemon, "Modeling heat
transfer from quench protection heaters to superconducting cables in Nb3Sn
magnets," in WAMSDO, CERN, Geneva, 2013.
[22] O. Brüning, P. Collier, P. Lebrun, S. Myers, R. Ostojic, J. Poole and P. Proudlock,
LHC Design Report, Vol. 1,, CERN-2004-003, 2004.
[23] K. Hoffmann, An introduction to measurements using Strain Gages, Darmstadt:
Hottinger Baldwin Messtechnik GmbH, 1989.
[24] M. Bajko, P. Fessia and D. Perini, "Statistical studies of the robustness of the LHC
main dipole mechanical structure," Applied Superconductivity, IEEE Transactions
on, vol. 10.1, pp. 77-80, 2000.
[25] E. Todesco, H. Allain, G. Ambrosio, G. Arduini, F. Cerutti, R. De Maria, L.
Esposito, S. Fartoukh, P. Ferracin, H. Felice, R. Gupta, R. Kersevan, N. Mokhov,
T. Nakamoto, I. F. J. M. Rakno, L. Rossi, G. L. Sabbi, M. Segreti, F. Toral, Q. Xu
and al, "A First Baseline for the Magnets in the High Luminosity LHC Insertion
Regions," IEEE Trans. Appl. Supercond., vol. 24, 2014.

30

31
Chapter 2 Fiber Optic Sensors technologies and applications The revolution of fiber-optic technology in the telecommunications industry, enabling high-capacity, long-distance exchange of information at speed of light and the simultaneous costs reduction of optoelectronic devices, led the research to use optical fibers in designing and developing fiber based sensing devices and components. The use of fiber optics for industrial and environmental sensing applications has become an exciting growth area for this versatile technology towards the replacement of the standard sensors. Fiber optics are used to communicate with a sensor device or use a fiber as the sensor itself to conduct continuous monitoring of physical, chemical, and biological changes due to environmental effect.

____________________________________________________ Fiber Optic Sensors
32
Fiber Optic Sensors
FOS technology and fields of application
Fiber optics for sensing applications are used as medium for transmitting signals from a remote sensor to the electronics that process the signals or use a fiber as sensor itself. The fiber optic sensor technology offers the possibility of monitoring several parameters as strain, pressure, temperature, humidity, vibrations by modulating some features of the light wave. These features are such as intensity, phase or polarization which may undergo a change after the external perturbation [1]. The principle of such devices is that light from source is sent through the optical fiber, experiences subtle changes of its parameters either in the fiber or in one or several optical sensors, and then reaches a detector arrangement which measures these changes.
a. Fiber optic structure The main structure of the optical fiber consists of: the core, the cladding and the coating as shown in Figure 2. 1.a. The core is a cylindrical rod of dielectric material and is generally made of glass. Light propagates mainly along the core of the fibre. The cladding layer is made of a dielectric material, generally glass or plastic, with an index of refraction which is less than that of the core material providing proper light guidance. The cladding executes functions as decreasing loss of light from core into the surrounding air, protecting the fiber from absorbing the surface contaminants and adding mechanical strength. The coating is a layer of material (typically acrylate, polyimide) used to protect the optical fibre from physical damage. Typical diameters of a single mode optical fiber are 125 µm and 8-10 µm for the cladding and the core respectively [2].
Figure 2. 1 (a) Optical fiber structure; (b) Basic block diagram of an optical fiber sensor system [3]
The general structure of an optical fibre sensor system is shown in Figure 2. 1.b. It consists of an optical source (Laser, LED, Laser diode etc), optical fiber, sensing or
(a) (b)
____________________________________________________ Fiber Optic Sensors
33
modulator element (which transduces the measurand to an optical signal), an optical detector and processing electronics (oscilloscope, optical spectrum analyser etc.) [3].
b. Fields of application The growing interest in fiber-based sensing relies on their ability to replace traditional sensors, finding attractive benefits in their well-known characteristics such as:
• small size ,cylindrical geometry which make them non-invasive to be integrated into a wide variety of structures, including composite materials and adaptive structures,
• inability to conduct electric current, immunity to electromagnetic interference and radio frequency interference (EMI),
• lightweight, robustness in harsh environments, • multiplexing capability to form sensing networks, • availability in long lengths, • multi parametric sensing capabilities [4].
The versatility of the technology has pushed the research to exploit these advantages in more and more fields of application: civil engineering, aerospace, marine, oil & gas, railways, bio-medical devices, smart structures, electric power industry and lately high energy applications. However the advance and the assessment of the technology in a specific area of interest is certainly led by the development and the commercial viability of the most appropriate sensor from which an adequate sensing system can be effectively implemented.
c. Fiber optic sensors classification The two basic classes in which the FOS may be grouped are referred to extrinsic and intrinsic sensors. In the former, sensing take place in a region outside of the fiber and the fiber itself serves as medium for transmitting back and forth the light beam modulated in response to the environmental effects in the region. On the contrary the classification as intrinsic sensor takes place when the environmental effect modulates the light beam while it is propagated through the fiber itself [5]. FOS may be also classified on the basis of the application (physical, chemical, bio-medical sensors) and their configuration (single-point, multi-point, distributed). More precisely in the single-point type the sensing part is typically at the end of the fiber, multi-point sensors consists of several sensing regions along the length of a fiber and the distributed fiber-optic sensing systems use the entire fiber length for sensing. The ability to make distributed measurements over distances up to several tens of kilometres is unique to FOS. A distributed sensing system may be arranged as a set of discrete (point) sensors in array configuration, with individual sensor outputs multiplexed. One of the most commonly employed techniques is the Wavelength Division Multiplexing (WDM) which is based on the reflection of each sensor in a particular spectral band that is split onto separate detectors [1]. WDM is

____________________________________________________ Fiber Optic Sensors
34
commonly used to demultiplex Fiber Bragg Grating (FBG) sensors as long as each FBG is uniquely identified by different wavelengths. Alternatively, depending on the applications, may be interesting to exploit the ability of the optical fiber to give information of the measurand at any of each point along the length, this is the characteristic on which relies the distributed sensing technique based on Raman, Brillouin or Rayleigh scattering sensors. The distributed sensing technologies represent, in many applications, an attractive solution to reduce all the issues related to electrical losses and to the use of remote electrical power supplies, offering alternatives to the standard resistive sensors especially in hazardous and harsh environments. The classification is reported in Figure 2. 2
Figure 2. 2 Fiber optic sensors configurations [6].
Despite FOS based applications have very rapidly progressed in fields where standard sensors were commonly used but also in fields where traditional sensors where not existing, the technology is yet not well assessed in the field of HEP. The extreme working conditions required by the HEP environment make the requirement particularly challenging. The development of FOS monitoring systems in this field depends on the environmental complexity which may represent a limit if the experimental conditions cannot be easily reproducible. Advanced high technology laboratories and facilities are required for leading the research. This is the case of cryogenic applications where monitoring the status and the process parameters in cryogenic environments find natural barriers in the complexity introduced by operation at low temperatures as already introduced in Chapter 1. Cryogenics is an essential underpinning technology for the cooling of superconductors, detectors, surgical and other instruments where the use of FOS based system has not been widely studied yet.
FOS for cryogenics
The assessment of advanced technologies and devices designed to operate in cryogenic environment in several fields of applications, such as aerospace vehicles, superconducting magnets and high energy physics experiments, is leading to an increasing interest in the development of accurate cryogenic sensors. Long-term

____________________________________________________ Fiber Optic Sensors
35
robustness and reliability are required to these sensors to assure good operation and safe working conditions of the equipment. Temperature and strain represent certainly the most challenging and essential domains of study for the implementation of monitoring systems which are required to operate in a wide temperature range and to assure the health of structures subjected to strong thermo - mechanical forces.
a. Main advantages of FOS technology
Standard sensors with electrical connections like resistive thermometers and strain gauges have been the devices most commonly used over the past four decades but the sensitivity of the measurements to electromagnetic interferences and the number of wires needed for their operation, remain the most significant limitations to their successful implementation. The electrical configuration requiring from 4 to 6 wires become a relevant drawback especially for complex integrations in composite material (like in superconducting magnets), for monitoring over long distances and in harsh environment. In order to reduce the cabling and the heat losses that resistive wires may introduce, it is often chosen to reduce the number of measuring points. The use of fiber optic based monitoring systems may efficiently overcome these issues related to the use of standard sensors in light of appealing advantages like their excellent dielectric constant, their non-invasive nature and their multiplexing capability.
b. Main issues with FOS technology
Despite their potentials, the use of fiber optic sensors for cryogenic applications is however not straightforward. Several studies have been reported in literature on the use of different kind of sensors, but most of them have been mainly addressed to demonstrate the proof of principle of the technique. Moreover no real development in real scale applications has been reported till today. In the specific case of superconducting and cryogenic environment the main issue in using FOS is the limited thermal response of the glass itself at low temperature: mainly drive by thermal properties and bringing the sensitivity of FOS sensor below 50 K to nearly zero.
c. Different FOS technologies for cryogenic applications Among the different FOS technologies, a very first feasibility study on the use of FOS for superconducting magnet is dated in 1994. It was based on the use of extrinsic Fabry-Perot interferometers for stain measurements down to 77 K under a maximum pressure of 45 MPa proving the viability of the use of the sensors for magnet applications [7]. Nevertheless, from that first experience nowadays the implementation of fiber optic sensors for these applications is still far to be well assessed.
The thermal response of the Long Period Grating (LPG) has been also investigated showing a decreasing sensitivity with decreasing temperature down to 20 K [8]. This technology shows higher sensitivity in respect to the FBG for example, but no further

____________________________________________________ Fiber Optic Sensors
36
studies have been carried out for low temperature applications. Moreover these gratings work in transmission, therefore, require access to both ends of the fiber. Their use would discard the multiplexing capability which may be a drawback for some applications.
Beyond point-sensor technologies, also distributed optical fiber sensors have been considered for temperature and strain monitoring in cryogenic environment, exploiting the advantage to monitor big structures using a single fiber. The technologies are based on the three different scattering processes that may take place in an optical fiber. When the fiber is probed with an optical signal, each of these scattering processes may generate a back propagating light than can be used to “read” the local properties of the fiber and hence information on the surrounding environment. Raman distributed sensors are used for temperature measurements over lengths up to 10 km. On the contrary Brillouin and Rayleigh based sensor can simultaneously perform temperature and strain measurements covering typical distance up to 30 km and below 2 km respectively. Among several applications Raman distributed sensors are mostly effective for the identification of the hot spot along the power transmission lines, while Brillouin find applications in civil structure monitoring and pipeline leakage monitoring, Rayleigh sensor are mainly used for structural load and fatigue testing and composite cure monitoring [9] [10] [4]. The first study of the Brillouin scattering for cryogenic applications has been reported for temperature monitoring down to 1.9 K of the liquid helium vessel of a dipole magnet at CERN. The first integration of 300 m long fiber in a real installation demonstrate the proof of principle of the use of this technology for cryogenic temperature though limited by a highly non-monotonic behavior in the range 300 – 1.9 K and a lack of sensitivity in the most interesting range 1.9 – 5 K [11]. Distributed FOS based on Rayleigh scattering have been successfully developed to minimize thermal loads on cryogenic cooling systems down to 5 K with a temperature accuracy of ± 5 K [12]. Despite the gradual decrease in thermal sensitivity of silica optical fiber, it has been reported recently that an appropriate coating can impact the thermo-mechanical behaviour of the fiber preserving high sensitivity and temperature resolution in the range of mK down to 77 K [13].
Rayleigh-based FOS have been also recently proposed for the quench detection in HTS magnets converting the spectral shifts in the Rayleigh scattering spectra into temperature variations profiting of the high spatial resolution achievable with this technology. The high spatial resolution, however, leads to a large amount of data to be analysed in order to determine the spectral shift from a reference scan, thus reducing the temporal sampling resolution. Therefore, for a quick and accurate quench detection, this technology requires a balance between the spatial and temporal resolutions executable on a given data acquisition and processing system [14].
Despite the important advantages deriving from a long distance distributed sensing, for these technologies long measurement time are needed and generally their development in a specific application needs a trade-off between the response time and spatial resolution exhibited coupled with economic considerations [6].

_____________________________________________ Fiber Bragg Grating Sensors
37
On the contrary, FBG based sensors offer various important and distinctive characteristics over other measurements techniques which have oriented the studies to deepen their development in the field of cryogenics. The main advantage certainly relies in the possibility to codify the measured parameter in wavelength that is an absolute parameter independent on power levels and optical losses along the optical chain. Moreover, the capability to measure several parameters, to multiplex several gratings into one fiber over long distance (WDM) serving both single point and multi point sensing requirements, coupled to their relative low cost are all features that make the FBG sensors the most promising sensors for superconducting magnets and cryogenic applications.
Fiber Bragg Grating Sensors
FBG working principle
Fiber Bragg grating sensors are sensing elements which can be photo-inscribed into a silica fiber doped with germanium by exposing the fiber to a UV laser pattern as shown in Figure 2. 3. This exposure induces a periodic modulation of the refractive index of the core of the fiber over a certain length. When broadband light is emitted to a Bragg grating, it only reflects the specific wavelength component 𝜆𝜆𝐵𝐵 [15]. The reflected Bragg is given by:
𝜆𝜆𝐵𝐵 = 2Λ𝑛𝑛𝑒𝑒𝑒𝑒𝑒𝑒 (2- 1)
where neff [-] is the effective refractive index of the core and Λ [nm] is the grating period.
Figure 2. 3 Fiber Bragg Grating sensors
The FBG is sensitive to both temperature (T) and strain (ε). A change in these parameters leads to a shift in the Bragg wavelength due to the effect they induce on both the refractive index neff (Τ,ε) and the grating period Λ(Τ,ε).

_____________________________________________ Fiber Bragg Grating Sensors
38
Figure 2. 4 Bragg reflection spectra variation with temperature and strain
The sensitivity of the Bragg wavelength with temperature and strain is the partial derivative of the eq. (2-1) with respect to temperature and strain.
∆𝜆𝜆𝐵𝐵 = ∂λ∂𝑇𝑇
∆𝑇𝑇 + ∂λ∂𝜀𝜀
∆𝜀𝜀 (2- 2)
with
∂λ∂𝑇𝑇
= 2𝑛𝑛𝑒𝑒𝑒𝑒𝑒𝑒∂Λ∂𝑇𝑇
+ 2Λ∂𝑛𝑛𝑒𝑒𝑒𝑒𝑒𝑒∂𝑇𝑇
(2- 3)
and
∂λ∂𝜀𝜀
= 2𝑛𝑛𝑒𝑒𝑒𝑒𝑒𝑒∂Λ∂𝜀𝜀
+ 2Λ∂𝑛𝑛𝑒𝑒𝑒𝑒𝑒𝑒∂𝜀𝜀
(2- 4)
Divided eq (2-2) by eq (2-1) yields to the normalized shift of the Bragg peak:
∆𝜆𝜆𝐵𝐵𝜆𝜆𝐵𝐵
=1Λ∂𝛬𝛬∂𝑇𝑇
∆𝑇𝑇 +1
𝑛𝑛𝑒𝑒𝑒𝑒𝑒𝑒∂𝑛𝑛𝑒𝑒𝑒𝑒𝑒𝑒∂𝑇𝑇
∆𝑇𝑇 +1Λ∂𝛬𝛬∂𝜀𝜀
∆𝜀𝜀 +1
𝑛𝑛𝑒𝑒𝑒𝑒𝑒𝑒∂𝑛𝑛𝑒𝑒𝑒𝑒𝑒𝑒∂𝜀𝜀
∆𝜀𝜀 (2- 5)
The Bragg wavelength shift with strain (∆ε) and in temperature (T) can be expressed as
∆𝜆𝜆𝐵𝐵𝜆𝜆𝐵𝐵
= (𝛼𝛼 + 𝜉𝜉)∆𝑇𝑇 + (1 − 𝑝𝑝𝑒𝑒)∆𝜀𝜀 (2- 6)
Where:
α = 1𝛬𝛬𝜕𝜕𝛬𝛬𝜕𝜕𝜕𝜕
is the fiber thermal expansion coefficient,

_____________________________________________ Fiber Bragg Grating Sensors
39
ξ = 1neff
∂neff∂T
is the thermo-optic coefficient,
1𝛬𝛬𝜕𝜕𝛬𝛬𝜕𝜕𝜕𝜕
, the unit
and ρe = - 1𝑛𝑛𝑒𝑒𝑒𝑒𝑒𝑒
𝜕𝜕𝑛𝑛𝑒𝑒𝑒𝑒𝑒𝑒𝜕𝜕𝜕𝜕
the photo-elastic coefficient.
The dependence of the Bragg wavelength on temperature arises from the change of the refractive index due to thermo-optic effect and the change of the period due to thermal expansion of the glass [17] therefore the (2-5) at ∆𝜀𝜀 = 0 may be written as
∆𝝀𝝀𝑩𝑩𝝀𝝀𝑩𝑩
= (𝜶𝜶 + 𝝃𝝃)∆𝑻𝑻 (2- 7)
When the FBG is subjected to an applied strain ∆𝜀𝜀 along its longitudinal axis, the FBG experiences both a change in the grating spacing ∆Λ/Λ and a variation of the index of refraction (ρe). Thus equation (2-5) at ∆T=0 reads
∆𝜆𝜆𝐵𝐵𝜆𝜆𝐵𝐵
= (1 − 𝜌𝜌𝑒𝑒)∆𝜀𝜀 (2- 8)
The issue arises when the sensor is glued, embedded or coated with another material and the applied strain to the FBG by the host material depends on the temperature. As discussed in Chapter 3, it requires a relevant description of the applied strain ∆𝜀𝜀 and good measurement of 𝛼𝛼 and 𝜉𝜉 as function of the temperature. Typical values for a germanium doped silica-core fiber are α = 0.55 x 10⁻⁶ °C-1, ξ = 8.6 x 10⁻⁶ °C-1 and ρe = 0.22. For operating wavelengths of 800 nm and 1550 nm, typical temperature sensitivity results in the range between 6.8 pm/°C and 13 pm/°C [18] [19] while the strain sensitivity at 1550 nm results to be 1.2 pm/µε [16].
d. FBG sensor fabrication
FBGs are normally inscribed in standard single-mode telecommunication optical fiber and they operate for wavelength range from 1250 to 1650 nm. A standard single-mode optical fiber (SMF 28) has typical dimensions of cladding diameter of 125 μm and core diameter of 8.2 μm thus explaining the easy integration of the fibers in composite material and they popular development in structural health monitoring of civil structures.
Most grating fabrication is carried out using UV lasers. The approaches used are several and they depend on the characteristics of the grating required. However, the most common techniques to recall are the interference and the phase mask. In the interferometric technique the UV beam is split and then recombined again at an angle designed to give the desired interference pattern in the region of the fiber where the

_____________________________________________ Fiber Bragg Grating Sensors
40
beams overlap. The phase mask consists in a diffractive grating which splits the laser beam in several diffractive orders. The fiber is in close contact with the mask and the interference between the various orders created the required pattern. This technique permits the fabrication of several gratings in a single exposure thus decreasing the cost per unit [6].
When the light is emitted to the FBG from an optical source, its spectral response is a single peak, a Gaussian shape cantered at the resonance wavelength of the sensor. After strain and temperature changes, the position of the central wavelength will vary from its original conditions, therefore an electronic apparatus able to convert this wavelength shift in an electronic signal is needed. This is the interrogator system.
e. FBG interrogation system The interrogation system of FBG sensors may be based on different techniques and configurations chosen on the base of the applications requirement as sensitivity, resolution and costs [6]. A widely-employed approach is to illuminate the FBG with a narrowband tuneable light source and to use photodiodes detectors. The scan generator tunes the light source, sweeping it back and forth across its range such that at any given instant the wavelength of light being transmitted down the fibres is known. When this wavelength coincides with the Bragg wavelength of an FBG, light is reflected back down the fibre to a photodetector. Several commercially available equipment based on this approach are available and largely used in industrial applications (as example Micron Optics modules sm125 reported in Figure 2. 5 [20])
Figure 2. 5 Micron Optics Optical Sensing interrogator, module sm125.
FBG for cryogenic applications. State of the art
a. FBG sensors for temperature monitoring The use of commercially available FBG sensors has been limited mainly to measurements performed at ambient temperatures, typically in the narrow range of 300–273 K where the temperature dependence is usually given as a linear equation [21]. However, the temperature response of the FBG becomes nonlinear as the temperature is reduced to cryogenic temperature and so does the sensitivity of the sensors. As explained

_____________________________________________ Fiber Bragg Grating Sensors
41
in section 2.2.1, for a bare FBG the thermal response is dominated by the thermo-optic effect, rather than the thermal expansion coefficient (CTE) of the fiber material, low already at room temperature. Approaching cryogenic temperatures, both the effects reduce. The temperature sensitivity of a bare FBG has been observed to decrease significantly with decreasing temperature dropping to < 0.1 pm/K below 50 K showing a fully invariant characteristic near temperatures of 4.2 K; as shown in Figure 2. 6 [22]. In order to use the FBG as temperature sensor for temperature below 50 K, it is therefore needed to improve its sensitivity. The literature suggests the use of coating materials relying on their CTE to improve the thermo mechanic response of the grating at temperature where the silica itself is characterized by a very low thermo optic and expansion coefficients.
Figure 2. 6 Temperature responses of a bare FBG and an acrylate coated FBG in the range 298 -4.2 K. The response of the bare FBG is ivariant below 50 K [22].
The effect of using a coating material to enhance the sensitivity of the FBG in response to the induced thermal apparent strain is shown in Figure 2. 6 for an acrylate recoated FBG which reached a total wavelength shift of 3.9 nm in the range 298 – 4.28 K in respect to the 1.4 nm reached by the bare FBG. The responses of the bare and the coated FBG with the temperature are reported giving a sensitivity of 4 pm/K and 15 pm/K respectively at 80 K [22].
The feasibility of the use of FBG for cryogenic temperature has been investigated down to 2.2 K confirming the need to consider additional coatings able to transduce temperature variation into measurable strain giving therefore the possibility of temperature independent strain measurement in cryogenic environments [23]. Commercially available coating materials have been investigated as Ormocer (a hybrid polymer material synthesized by a sol-gel process). It has been reported that in the range 50 – 300 K the Ormocer coating contributes to a linear temperature dependence of the

_____________________________________________ Fiber Bragg Grating Sensors
42
Bragg wavelength shift reaching a sensitivity of 2.4 pm/K reduced to 1.0 pm/K in the range 50 - 10 K [24].
Besides the commercially available coatings (acrylate, polyimide, Ormocer) used for standard applications, several studies have been addressed to select other materials able to improve the FBG temperature sensitivity in the whole range 300 – 4 K. For this reason, the effect of metal coatings and different coatings techniques have been deepened showing a good improvement of the FBG sensitivity using zinc coating up to 23 pm/K at 40 K decreasing to 4 pm/K at 15 K [25] [26] [27]. More metal coatings have been then investigated and reported in [28] where aluminum, copper, lead and indium have extended the range of operation of the FBG to 15 K reaching a total wavelength shift of 6.28 nm, 7.08 nm, 9.41 nm and 10.06 nm respectively as shown in Figure 2. 7. It was also demonstrated experimentally that the indium-recoated FBG sensor is not affected by the magnetic field of up to 8 T.
Figure 2. 7 Temperature characteristics of metal / coated FBG sensors [28]
However, besides the CTE of the materials, more parameters have been taken into account in the design of a FBG based sensor to be operating at cryogenic temperature. After chosen the material, it is important to define the thickness of the coating as this determines the magnitude of the thermal stress acting on the bare sensor and improves the sensor’s life time. Targeting a high quality of the signal also the length of the grating plays a relevant role since it can ensure reduced birefringence effects (phenomenon for which there is a double reflection of the light due to changes induced in the refractive index). Large birefringence caused by non-uniform longitudinal strain may cause the distortion of the spectrum (resulting in a split of the normally Gaussian-shaped reflected spectrum as shown in Figure 2. 8) consequently inducing problematic signal detection and reducing the wavelength demodulation accuracy [29]. The fabrication and the
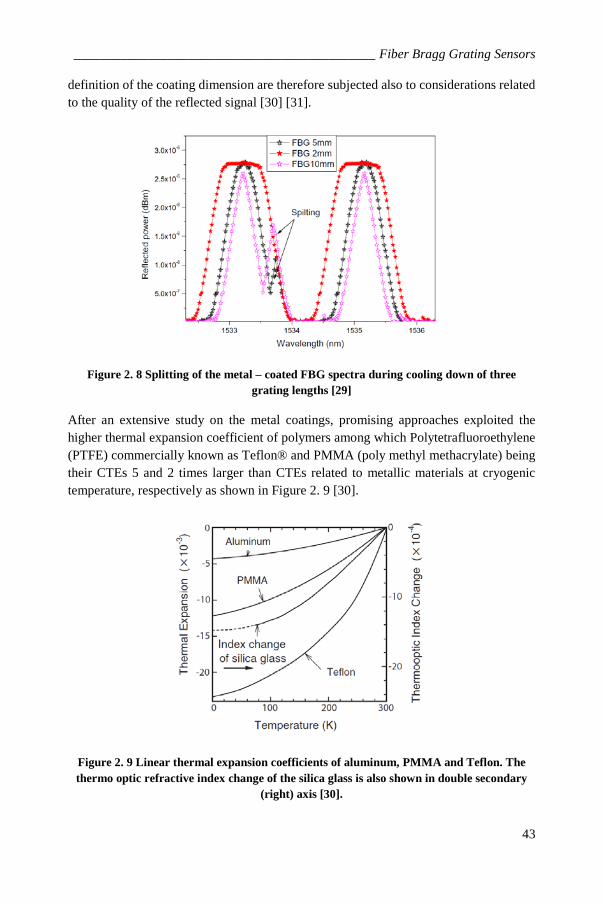
_____________________________________________ Fiber Bragg Grating Sensors
43
definition of the coating dimension are therefore subjected also to considerations related to the quality of the reflected signal [30] [31].
Figure 2. 8 Splitting of the metal – coated FBG spectra during cooling down of three grating lengths [29]
After an extensive study on the metal coatings, promising approaches exploited the higher thermal expansion coefficient of polymers among which Polytetrafluoroethylene (PTFE) commercially known as Teflon® and PMMA (poly methyl methacrylate) being their CTEs 5 and 2 times larger than CTEs related to metallic materials at cryogenic temperature, respectively as shown in Figure 2. 9 [30].
Figure 2. 9 Linear thermal expansion coefficients of aluminum, PMMA and Teflon. The thermo optic refractive index change of the silica glass is also shown in double secondary
(right) axis [30].

_____________________________________________ Fiber Bragg Grating Sensors
44
Few works on the use of Teflon report the highest sensitivity achievable inducing a wavelength shift of 21 nm at 77 K reaching a sensitivity of 39 pm/K. However the main inconvenience in using it for coating relies on the difficulties in increasing the adhesion between the substrate and the fiber which may affect the temperature dependence of the reflection wavelength.
Despite the promising result given by the use of Teflon, the PMMA results to be one of the most effective materials among the polymers investigated so far providing a shift of the reflected wavelength of 11.7 nm at 30 K as shown in Figure 2. 10 but a rather easier manufacturing in [32] [33].
Figure 2. 10 Bragg wavelength shift with temperature during cool down of sensors glued on PMMA substrates [32].
Although the feasibility of the use of FBG sensors for monitoring cryogenic temperature has been proved, the characterization and the development as cryogenic sensor still require further study. Table 1 summaries the explored coating materials and the wavelength shift obtained at the minimum temperatures tested.
Table 1 FBG coating material selection for cryogenic temperature
Aluminum Copper Lead Indium PMMA Teflon Temperature [K] 15 15 15 15 30 77 Wavelength shift [nm] 6.28 7.08 9.41 10.06 11.7 21
Further studies, as proposed in this thesis, will aim to extend the temperature range where the PMMA can enhance the FBG sensitivity in parallel to research other polymers as suitable coating for cryogenic temperatures.

_____________________________________________ Fiber Bragg Grating Sensors
45
b. FBG sensors for strain monitoring The state of the art so far reported has been mainly focused on the development of cryogenic sensors based on FBG for temperature monitoring. However, owing on the FBGs versatile characteristic to sense both temperature and strain, the research is addressed also to investigate the sensor behaviour at cryogenic temperature when it is demanded its use as strain sensor. Among the fields of applications, the challenging domain is represented by the strain monitoring of superconducting magnets.
Above all, the implementation of the FBG as strain sensor for superconducting magnets introduces, issues related to the integration in complex structures. Indeed, the FBG embedding in composite materials such a superconducting coil, operating at cryogenic temperature and affected by high mechanical stresses is a domain not well explored yet. Studies on the integration of FBG arrays in NbTi sample coils have been mainly focused on the integration of FBG arrays gluing them to the supporting structure of solenoid [34].
Figure 2. 11 Wavelength shift of 10 FBG glued on the magnet supporting structure for applied current up to 900 A [34].
Figure 2. 10 shows the results on multipoint strain measurements obtained using 10 FBG sensors in WDM scheme glued with StycastTM on a single layered NbTi sample coil. During tests at 4.2 K the coil strain distribution has been reported for the applied current of 900 A [35] [34] showing the feasibility of the measurements
Encouraging results demonstrate that the strain behaviour in the superconducting coils can be well monitored and the quench detection is in principle possible in the small solenoid magnets embedding FBG sensors arrays in the epoxy used to mechanically stabilize the coil as reported in [36].

_____________________________________________ Fiber Bragg Grating Sensors
46
The use of a high number of sensors to be embedded in the coil enables a good spatial resolution for the quench localization and it can be also used for the coil strain distribution during operation.
Despite the encouraging results proving the reliability of the FBG sensors for strain measurements in superconducting coils, their installation may introduce issues related to the birefringence due to the glue cracking at low temperature (DW3 epoxy adhesive) [37]. To overcome issues related to the change in the reflection spectrum caused by the multi component strain induced in the magnet by the Lorentz forces, Chehura et al. in proposed to use FBG fabricated in highly linearly birefringent (HiBi) fiber (it exhibits two refractive indices along two orthogonal axes such that light coupled into the fiber propagates in two orthogonally polarized eigenmodes). The experiment was carried out for the first time embedding the FBG within glass fibre cloth which is attached to the surface of the magnet [38]. These sensors exhibit two peaks centered in wavelengths that differ by typically 0.35 nm, each one shifting with the orthogonal components of strain in the same location. The sensors have been embedded in vacuum resin impregnated coil of solenoid prototypes energized at 4.2 K up to maximum current of 250 A. The work demonstrates the suitability of HiBi FBG in measuring the strain in both the transverse and axial directions during the operation of the magnets.
Presently a consistent effort is undertaken by the International Thermonuclear Experimental Reactor (ITER) to develop thermo-mechanical diagnostic fiber optic sensors for temperature, strain and displacement monitoring in the Tokamak’s magnet structure. Over 1000 measuring point, 80% will be represented by fiber optic sensors of different type: FBG, Fabry-Perot, Distributed Raman Scattering and Laser Distance meter. In line with the literature so far reported, the development of the FBG as cryogenic temperature sensor has been addressed to the implementation of prototypes based on different coating materials. The results do not match yet with the challenging specifications of a required accuracy of 0.2 K at 4 K being satisfactory, so far, only for temperature above 20 K. On the other hand, the characterization of the FBGs as strain sensors is still affected by a gluing process which has not yet been completely defined and standardized for cryogenic applications [39]. Further studies are needed to implement a gluing process suitable of cryogenic applications.
Preliminary results have also confirmed the feasibility of the use of commercially available FBG sensors for HTS material [40] more specifically for temperature and strain monitoring of YBCO tapes during a heat induced quench [41]. Furthermore, studies have been carried out to test the capability of the sensor for monitoring the heat treatment required for chemical reaction process of alloying. During the heat treatment process monitoring, issues has been reported with FBG for which an erasure of the grating (Micron Optics os4200 temperature FBG sensor) occurs at 665 °C [42]

_________ FBG sensors as challenging technology for superconducting magnets and cryogenic applications
47
The analysis of the state of the art highlights the complexity of the research on the use of FBG sensors for cryogenic applications and superconducting magnets over the last 20 years. However, promising results so far obtained, coupled to the challenging needs for advanced sensors not existing yet, push the research to pursue this technology to high targets and specifications which can make it a valid alternative to traditional and commonplace sensors.
FBG sensors as a challenging technology for superconducting magnets and cryogenic applications
The use of FBG for cryogenic applications and superconducting magnets has revealed the potential of this technology among the fiber optic sensors as an innovative solution to overcome issues related to standard sensors. Despite the FBG sensors represent an accepted and well known technology for many applications at room temperature, the main challenge in developing a cryogenic FBG based sensor relies on the demanding requirements and specifications imposed by the cryogenic environment. The exceptional working conditions and the challenging applications lead to new approaches in the development, design, fabrication and analysis of new sensors far from the standard commonly used for commercially available sensors. This is the case of large scale cryogenic applications like superconducting magnets or superconducting transmission lines for HEP where non-intrusive sensors are requested to give complete temperature information in wide ranges of operation and to map the strain distribution in complex mechanical structures.
The main challenge of using FBGs for these applications arises from the need to develop solutions suitable for cryogenic temperature since existing commercially available FBG cannot be used for this purpose. From this the need to embed the sensor in a host material and to model the thermo-mechanical behaviour of the silica coupled with that of the material surrounding at very low temperature.
As the temperature sensitivity of the FBG arises on the thermal contraction coefficient of the coating material, the design of the cryogenic sensor is mainly driven by the ability of this material to transfer strain to the grating down to 1.9 K. However, the material selection and the definition of the coating thickness and the geometries are not straightforward.
Besides the development of cryogenic FBG based sensors, the integration within composite materials, such as the superconducting coils, becomes a key aspect to take into account in the implementation of a monitoring system considering the high thermo mechanical stresses to which the fiber are subjected. What finally can really make the

_________ FBG sensors as challenging technology for superconducting magnets and cryogenic applications
48
use of FBG as a valid challenging instrumentation for superconducting magnet is the implementation of a compensation temperature-strain scheme in embedded configuration. This would help in having a complete temperature and strain profile of the magnet coils during fabrication and operation.
In these perspectives, the FBG sensor may serve several purposes such as: temperature monitoring in cryogenic devices, to detect local temperature variations which may compromise the safe working conditions, localized temperature monitoring for quench detection in magnet’s coils, strain distribution monitoring during the magnet service life.

49
References
[1] B. Nabovati and H. Gholamzadeh, "Fiber optic sensors," WorldAcad. Sci. Eng. Technology, vol. 42, pp. 297-307, 2008.
[2] S. Mohan, V. Arjunan and S. P. Jose, Fiber Optics and Optoelectronic Devices, MJP.
[3] S. Ghetia, R. Gajjar and P. Trivedi, "Classification of Fiber Optical Sensors," International Journal of Electronics Communication and Computer Technology, vol. 3, 2013.
[4] K. T. V. Grattam and B. T. Maggitt, Optical fiber sensor technology, Dordrecht: Kluwer Academic Publishers, 2000.
[5] S. Yin, P. B. Ruffin and F. T. S. Yu, Fiber Optic Sensors, Second Edition, CRC Press, 2008.
[6] A. Cusano, A. Cutolo and J. Albert, Fiber Bragg Grating Sensors: Recent Advancements, Industrial Applications and Market Exploitation, Bentham Science Publishers, 2011.
[7] J. Van Oort, R. Scanlan and T. Kate, "A Fiber-Optic Strain Measurement and Quench Localization System for Use in Superconducting Accelerator Dipole Magnets," Applied Superconductivity, IEEE Transactions on, vol. 5, no. 2, pp. 882-885, 1995.
[8] S. W. James, R. P. Tatam1, A. Twin, R. Bateman and P. Noonan, "Cryogenic temperature response of fibre optic long period gratings," Measurement Science and Technology , vol. 14, no. 8.
[9] X. Bao and L. Chen, "Recent Progress in Distributed Fiber Optic Sensors," Sensors , vol. 12, no. 7, p. 8601–8639, 2012.
[10] L. Palmieri and L. Schenato, "Distributed Optical Fiber Sensing Based on Rayleigh Scattering," The Open Optics Journal, vol. 7, no. Special Issue 1, pp. 104-127, 2013.

50
[11] L. Thévenaz, A. Fellay, M. Facchini, W. Scandale, M. Niklès and P. A. Robert, "Brillouin optical fiber sensor for cryogenic thermometry," SPIE 9th Annual Intern. Symp. on Smart Structures and Materials, pp. 22-27, 2002.
[12] C. D. Boyd, B. D. Dickerson and B. K. Fitzpatrick, "Monitoring distributed temperatures along superconducting degaussing cables via Rayleigh backscattering in optical fibers," in Proc. of the Intelligent Ships Symp. IX, 2011.
[13] X. Lu, M. A. Soto and L. Thévenaz, "MilliKelvin resolution in cryogenic temperature distributed fibre sensing based on coherent Rayleigh scattering," in OFS23 Proc. SPIE, 2014.
[14] W. K. Chan, G. Flanagan and J. Schwartz, "Spatial and temporal resolution requirements for quench detection in (RE)Ba2Cu3Ox magnets using Rayleigh-scattering-based fiber optic distributed sensing," Superconductor Science and Technology, vol. 26, 2013.
[15] K. Hill and G. Meltz, "Fiber Bragg grating technology fundamentals and overview," J. Lightwave Technology, vol. 15, p. 1263–1276 , 1997.
[16] G. Rajan, Optical Fiber Sensors: Advanced Techniques and Applications, CRC Press, 2015.
[17] A. D. Kersey, "Review of Recent Developments in Fiber Optic Sensor Technology," Optical Fiber Technology, , vol. 2, pp. 291- 317, 1996.
[18] R. Yun-Jiang, "In-fibre Bragg grating sensors," Measurement science and technology , vol. 8, no. 4, p. 355, 1997.
[19] R. M. Measures, Structural monitoring with fiber optic Technology, London: Academic,Press, 2001.
[20] "Micron Optics," [Online]. Available: http://www.micronoptics.com/products/sensing_solutions/instruments/.
[21] W. Meng-Chou, H. P. Ruth and L. S. DEHAVEN, "Effects of coating and diametric load on fiber Bragg gratings as cryogenic temperature sensors," in 15th International Symposium on: Smart Structures and Materials & Nondestructive Evaluation and Health Monitoring. International Society for Optics and Photonics, 2008.
51
[22] H. Zhang, F. Deng, Q. Wang, L. Yan, Y. Dai and K. Kim, "Development of Strain Measurement in Superconducting Magnet through Fiber Bragg Grating," IEEE Trans. Appl. Superconductivity, vol. 18, no. 2, pp. 1419-1422, 2008.
[23] S. James, R. Tatam, A. Twin, M. Morgan and P. Noonan, "Strain response of fibre Bragg grating sensors at cryogenic temperatures," Meas. Sci. Technol., vol. 13, no. 1535, 2002.
[24] T. Habisreuther, E. Hailemichael, W. Ecke, I. Latka, K. Schroder, C. Chojetzki, K. Schuster, M. Rothhardt and R. Willsch, "ORMOCER Coated Fiber-Optic Bragg Grating Sensors at Cryogenic Temperatures," Sensors Journal, IEEE , vol. 12, no. 1, pp. 13-16, 2012.
[25] S. Gupta, T. Mizunami, T. Yamao and T. Shimomura, "Fiber Bragg grating cryogenic temperature sensors," Appl. Opt., vol. 35, pp. 5202-5205, 1996.
[26] C. Lupi, F. Felli, L. Ippoliti, M. A. Caponero, Ciotti, V. Nardelli and A. Paolozzi, "Metal coating for enhancing the sensitivity of fibre Bragg grating sensors at cryogenic temperature," Smart Materials and Structures, vol. 14, no. 3, 2005.
[27] C. Lupi, F. Felli, A. Brotzu, A. C. Michele and A. Paolozzi, "Improving FBG Sensor Sensitivity at Cryogenic Temperature by Metal Coating," IEEE Sensors Journal, vol. 8, no. 7, 2008.
[28] R.Rajini-Kumar, M. Suesser, K. G. Narayankhedkar, G. Krieg and M. D. Atrey, "Performance evaluation of metalcoated fiber Bragg grating sensors for sensing cryogenic temperature," Cryogenics, vol. 48, no. 3/4, p. 142–147, 2008.
[29] R. Rajinikumar, M. Süßer, K. G. Narayankhedkar, G. Krieg and M. D. Atrey, "Design parameter evaluation of a metal recoated Fiber Bragg Grating sensors for measurement of cryogenic temperature or stress in superconducting devices," Cryogenics, vol. 49, pp. 202-209, 2009.
[30] T. Mizunami, H. Tatehata and H. Kawashima, "High-sensitivity cryogenic fibre-Bragg-grating temperature sensors using Teflon substrates," Meas. Sci. Technol, vol. 12, no. 7, p. 914, 2001.
[31] P. S. reddy, R. L. N. S. Prasad, K. S. Narayana, D. S. Gupta and M. S. Shanka, "Teflon Coated Fiber Bragg Grating sensor response at cryogenic temperatures," in International Conference on Optics and Photonics , 2009.

52
[32] J. Roths, G. Andrejevic, R. Kuttler and M. Süßer, "Calibration of Fiber Bragg Cryogenic Temperature Sensors," in Optical Fiber Sensors, OSA Technical Digest, Optical Society of America, Cancún, Mexico, 2006.
[33] D. Sengupt, M. Sai Shankar, P. Saidi Reddy, R. Sai Prasad, K. Narayana and P. Kishore, "An improved low temperature sensing using PMMA coated FBG," in Communications and Photonics Conference and Exhibition, 2011.
[34] R. K. Ramalingam, M. Kläser, T. Schneider and H. Neumann, "Fiber Bragg Grating Sensors for Strain Measurement at Multiple Points in an NbTi Superconducting Sample Coil," IEEE Sensors Journal, vol. 14, no. 3, p. 873, 3 2014.
[35] R. Ramalingam, "Fiber Bragg Grating sensors for localized strain measurements at low temperature and high magnetic field," in AIP Conf. Proc. 1218, 2010.
[36] M. Willsch, H. Hertsch, T. Bosselmann, M. Oomen, W. Ecke, I. Latka and H. Höfer, "Fiber optical temperature and strain measurements for monitoring and quench detection of superconducting coils," Proc. SPIE 700, 2008.
[37] H. Zhang, Q. Wang, H. Wang, S. Song, B. Zhao, Y. Dai, G. Huang and Z. Jiang, "Fiber Bragg Grating Sensor for Strain Sensing in Low Temperature Superconducting Magnet," Applied Superconductivity, IEEE Transactions on, vol. 20, no. 3, pp. 1798-1801, 2010.
[38] E. Chehura, S. J. Buggy, S. W. James, A. Johnstone, M. Lakrimi, F. Domptail, A. Twin and R. P. Tatam, "Multi-component strain development in superconducting magnet coils monitored using fibre Bragg grating sensors fabricated in highly linearly birefringent fibre," Smart Materials and Structures, vol. 20, 2011.
[39] A. Poncet, F. Rodriguez Mateos, D. Inaudi and R. Belli, "Fibre Optic Sensors for the Thermo-Mechanical Instrumentation of the ITER Magnets," in 5th European Conference on Structural Control EACS 2012 , Genova, Italy, 2012.
[40] J. Schwartz, R. P. Johnson, S. A. Kahn and M. & Kuchnir, " Multi-purpose fiber optic sensors for HTS magnets," in 11th European Particle Accelerator Conference, Genova, Italy, 2008.
[41] F. Hunte, H. Song, J. Schwartz, R. P. Johnson and M. Turenne, "Fiber Bragg optical sensors for YBCO applications," in Particle Accelerator Conference, Vanvuver, Canada, 2009.

53
[42] M. Turenne, R. Johnson, F. Hunte, J. Schwartz and H. Song, "Multi-purpose fiber optic sensors for high temperature superconducting magnets," in Particle Accelerator Conference, Vancouver, Canada, 2009.
[43] I. Latka, W. Ecke, B. Hfer, C. Chojetzki and A. Reutlinger, "Fiber optic sensors for the monitoring of cryogenic spacecraft tank structures.,," Photonics North 2004: Photonic Applications in Telecommunications, Sensors, p. Proc. SPIE 5579, 2004.

54

55
Chapter 3 Development of FBG based Thermal Cryogenic Sensor The FBG's low intrinsic temperature sensitivity at cryogenic temperature requires the development of a cryogenic sensor based on a material selection which aims to use the thermal contraction coefficient of the material as temperature dependence parameter. The thermo- mechanical properties of the coated sensor need to be studied through thermal characterization down to 4.2 K in order to validate the sensor design and fabrication, to define the final geometries and to evaluate the sensitivity performances. Optimized material selection and geometries lead to the development of miniaturized sensors with sensitivity performances suitable for cryogenic applications.

__________________________________________________________ Introduction
56
Introduction This chapter presents the development made on cryogenic thermal fiber optic sensors based on FBG technology. As seen in Chapter 2, the temperature response of a coated FBG depends on thermo-mechanical, thermo-optical and elasto-optical effects that all produces a local variation of the Bragg reflected wavelength λb. The constitutive law that describes the wavelength shift ∆λb is function of the temperature through the behavior of the thermal expansion coefficient α [K-1], the thermo-optic coefficient ξ [K-1] and the photo-elastic constant ρe [m/m] as recalled hereafter. Literature shows that the parameters α and ξ strongly vary, in a non-linear way, with the temperature in the wide range of 4.2 – 300 K. In particular, a bare FBG becomes insensitive to temperature change below 50 K, domain where α and ξ do not vary anymore thus no detectable shift of λb [1] [2].
This chapter focuses on the effort made to increase the sensitivity of FBG at cryogenic temperature, by the enhancement of the thermal apparent strain locally applied to the FBG sensor during cool-down. The sensitivity increase relies on the selection of appropriate material for the fiber coating and on the optimization of the sensor geometries. In line with the literature it will be seen that among the possible materials for the coating, polymers appear the best candidates because of their higher thermal expansion coefficient and other attributes. Polymers will be then our preferred material for the FBG sensing optimization and design.
In the first part of this chapter, the theoretical approach of the thermo-mechanical problem of the apparent strain is introduced. Then, the experimental work that has been done on the design and fabrication process to manufacture the first PMMA and epoxy coated sample is presented.
The dedicated test facility based on the use of a cryogen free cryostat that has been set up at CERN during this thesis is described. This new facility has allowed to fully characterized FBG samples of different kinds in the wide temperature range of 300 - 4.2 K along tens of thermal cycles in a well-controlled environment. The apparatus allows fast calibration of FBG sensors for their future integration in cryogenic devices, see Chapter 4 and 5. Numbers of sample characterization has given us important information on the bonding and manufacturing process qualities of FBG sensors.
The last part of the chapter presents the effort made on the optimization of the geometry of coated sensors where epoxy has been preferred as coating material for its easier fabrication process and good quality of the FBG response. Their optimization has led to sensors of smaller coating geometries and shorter grating lengths, fully characterized and

____________________________________________ Sensors design and fabrication
57
calibrated in the range 300 – 4.2 K. The comparison of their temperature sensitivity helps to conclude on the effect of the coating material and of the thickness on the performance. The study contributed to the improvement of the design of FBG sensors that have been used in the present cryogenic applications, such as the superconducting link and high field magnet.
Sensors design and fabrication
Coated FBGs design and material selection
Most of the materials experiences a contraction when cooled-down. The magnitude of the contraction depends on the type of material: polymers, metals, glasses, etc. The design of a cryogenic FBG based sensor requires a careful selection of appropriate materials, able to increase the FBG sensor sensitivity at cryogenic temperatures. The material selection mainly relies on the effect of the Coefficient of Thermal Contraction (CTE) of the host material (coating material) to induce thermal strain to the grating in order to achieve a good thermo-mechanic response (thermal apparent strain) at cryogenic temperatures where the pure thermal effect of silica is negligible.
Solid materials expand upon heating and contract when cooled with a change in length that can be expressed as:
�𝐿𝐿𝑒𝑒 − 𝐿𝐿0�𝐿𝐿0
= 𝛼𝛼�𝑇𝑇𝑒𝑒 − 𝑇𝑇0� (3- 1)
∆𝐿𝐿𝐿𝐿0
= 𝛼𝛼 ∆𝑇𝑇 (3- 2)
where α [K-1] is the linear thermal expansion coefficient of the material, L0 and Lf [m] represent respectively, the original and final lengths measured at the temperatures T0 to Tf [K]. Using the differential approach, the true linear expansion coefficient related to the rate of change in one dimension per unit change in temperature writes [3]:
𝛼𝛼(𝑇𝑇) = 1𝐿𝐿𝑑𝑑𝐿𝐿(𝑇𝑇)𝑑𝑑𝑇𝑇
(3- 3)
Most of the literature reports the integrated linear thermal expansion as a percent change in length from some original length generally measured at 293 K. The integration is needed as it significantly varies over the temperature range of interest. Defining the thermal strain as the change of length due to a change of temperature, it reads:
𝜀𝜀𝑡𝑡ℎ =∆𝐿𝐿𝐿𝐿
= � 𝛼𝛼(𝑇𝑇)𝑑𝑑𝑇𝑇𝜕𝜕ref
𝜕𝜕
(3- 4)

____________________________________________ Sensors design and fabrication
58
where L is the length at the reference temperature Tref and T the absolute temperature.
Figure 3. 1 displays the integrated value of the linear thermal expansion coefficient for various materials, with Tref = 293 K and T= 4 K.
The graphic shows how the silica experiences the lowest contraction at cryogenic temperature, followed by the metals and the polymers. Typical values for metals and alloys are in the range 10×10−6 to 30×10−6 K−1. Ceramics normally have lower values in the range 1×10⁻⁶ to 20×10−6 K−1 [4]. It results that polymers are the best materials to achieve the largest thermal contraction being their CTEs at cryogenic temperatures 2 to 5 times larger than metals. The data is coherent with previous studies found in literature which state Teflon and PMMA might be the best materials to obtain the highest thermal sensitivity of FBG coated sensors [5].
Figure 3. 1 Materials linear thermal contraction at 4 K
When the coated FBG, free from any external applied load, is subjected to temperature variation, a thermally induced axial stress is developed along the grating length due to the mismatching of the thermal expansion coefficients between the fiber and the host material. For coated FBG sensor, modelled as concentric cylinders and shell, submitted to a variation of temperature and supposing perfect bonding of the material, the balance of the force leads to the following set of equations [6]:
�𝐹𝐹 = 0 (3- 5)
With σ the axial stress and S the material cross section, for both the material involved, fiber and host material, it yields to:

____________________________________________ Sensors design and fabrication
59
𝜎𝜎𝐻𝐻𝑆𝑆𝐻𝐻 + 𝜎𝜎𝐹𝐹𝑆𝑆𝐹𝐹 = 0 (3- 6)
𝜎𝜎𝐻𝐻 = −𝜎𝜎𝐹𝐹𝑆𝑆𝐹𝐹𝑆𝑆𝐻𝐻
(3- 7)
From the compatibility of the axial deformation, assuming fully bonding of the material, the thermally induced axial strain εΤ of the composite (the same for the host and fiber materials), gives:
𝜀𝜀𝜕𝜕 ≡ 𝜀𝜀𝐻𝐻 = 𝜀𝜀𝐹𝐹 (3- 8)
From the superposition principle, this axial strain is composed of the thermal and mechanical induced strain, as:
𝜀𝜀𝜕𝜕 = 𝜀𝜀𝑡𝑡ℎ + 𝜀𝜀𝑚𝑚 (3- 9)
That can be written for both materials as:
𝜀𝜀𝐻𝐻 = 𝛼𝛼𝐻𝐻Δ𝑇𝑇 +𝜎𝜎𝐻𝐻𝐸𝐸𝐻𝐻
(3- 10)
𝜀𝜀𝐹𝐹 = 𝛼𝛼𝐹𝐹Δ𝑇𝑇 +𝜎𝜎𝐹𝐹𝐸𝐸𝐹𝐹
(3- 11)
where αH and αF are the linear thermal expansion coefficients, EH and EF the Young modulus of the host material and the fiber respectively.
From the compatibility of the deformation
𝜀𝜀𝐻𝐻 − 𝜀𝜀𝐹𝐹 = 0 (3- 12)
The strain locally applied to the FBG by the host material is:
𝜀𝜀𝜕𝜕 = �𝛼𝛼𝐻𝐻𝑆𝑆𝐻𝐻𝐸𝐸𝐻𝐻 + 𝛼𝛼𝐹𝐹𝑆𝑆𝐹𝐹𝐸𝐸𝐹𝐹𝑆𝑆𝐻𝐻𝐸𝐸𝐻𝐻 + 𝑆𝑆𝐹𝐹𝐸𝐸𝐹𝐹
� ∆𝑇𝑇 (3- 12)
By defining the stiffness ratio for both materials, vH and vF as:
𝜈𝜈𝐻𝐻 =𝑆𝑆𝐻𝐻𝐸𝐸𝐻𝐻
𝑆𝑆𝐻𝐻𝐸𝐸𝐻𝐻 + 𝑆𝑆𝐹𝐹𝐸𝐸𝐹𝐹𝑎𝑎𝑛𝑛𝑑𝑑 𝜈𝜈𝐹𝐹 =
𝑆𝑆𝐹𝐹𝐸𝐸𝐹𝐹𝑆𝑆𝐻𝐻𝐸𝐸𝐻𝐻 + 𝑆𝑆𝐹𝐹𝐸𝐸𝐹𝐹
(3- 13)

____________________________________________ Sensors design and fabrication
60
It yields:
𝜀𝜀𝜕𝜕 = (𝛼𝛼𝐻𝐻𝜈𝜈𝐻𝐻 + 𝛼𝛼𝐹𝐹𝜈𝜈𝐹𝐹)𝑑𝑑𝑇𝑇 (3- 14)
The Young’s modulus of the coating material plays also a crucial role in dominating the bare grating deformation. As first assumption and as it is the case for FBG embedded in thick host material, the stiffness of fiber can be neglected before the one of the host material, therefore, we can easily assume that vH = 1 and vF = 0, and write that the strain applied to the fiber is equal to the strain of the structure that is probed and:
𝜀𝜀𝜕𝜕 = 𝜀𝜀𝐹𝐹 = 𝛼𝛼𝐻𝐻∆𝑇𝑇 (3- 15)
From the (3.11) the mechanical induced strain can then be deduced and reads:
𝜀𝜀𝑚𝑚 = (𝛼𝛼𝐻𝐻 − 𝛼𝛼𝐹𝐹)∆𝑇𝑇 (3- 17)
Considering the strain components from either applied mechanical strain εM or thermal induced strain εT:
∆𝜆𝜆𝐵𝐵𝜆𝜆𝐵𝐵
= (1 − 𝑝𝑝𝑒𝑒)(𝜀𝜀𝑀𝑀 + 𝜀𝜀𝑚𝑚) + (𝛼𝛼𝐹𝐹 + ξ) ∆𝑇𝑇 (3- 18)
Supposing that no mechanical strain in applied to the FBG (𝜀𝜀𝑀𝑀 = 0), saying in stress-free conditions, and still assuming a perfect bonding at sensor interface, the normalized Bragg shift writes:
∆𝜆𝜆𝐵𝐵𝜆𝜆𝐵𝐵
= �(1 − 𝑝𝑝𝑒𝑒)(𝛼𝛼𝐻𝐻 − 𝛼𝛼𝐹𝐹) + 𝛼𝛼𝐹𝐹 + ξ�∆𝑇𝑇 (3- 19)
Integrating the signal over the temperature allows computing the expected shift whereas derivative gives the sensitivity of the sensor to temperature and allows to calibrate the sensors as written here:
∆𝜆𝜆𝐵𝐵(T) = 𝜆𝜆0 � �(1 − 𝑝𝑝𝑒𝑒)(𝛼𝛼𝐻𝐻 − 𝛼𝛼𝐹𝐹) + 𝛼𝛼𝐹𝐹 + ξ�𝜕𝜕
𝜕𝜕0d𝑇𝑇
(3- 20)
𝑑𝑑𝜆𝜆𝐵𝐵𝑑𝑑𝑇𝑇
(T) = (1 − 𝑝𝑝𝑒𝑒)(𝛼𝛼𝐻𝐻(𝑇𝑇) − 𝛼𝛼𝐹𝐹(𝑇𝑇)) + 𝛼𝛼𝐹𝐹(𝑇𝑇) + ξ(𝑇𝑇) (3- 21)

____________________________________________ Sensors design and fabrication
61
Setting calibrated thermocouple, bare fibers and coated fibers in a well-controlled environment allows a good identification of the thermal effect with the objective of increasing the temperature sensitivity down to 4.2 K.
For our study, and given that the parameter ρe is constant, we have tried to increase at best this sensitivity finding material for coating of the sensor with high thermal contraction coefficient and high stiffness ratio with respect to the fiber. The thickness of the coating has been adapted to increase the transfer of a uniform axial stress to the FBG without over enlarging the sensing part and without perturbing the quality of the signal, saying without bending of the sensing part up to low temperature [6].
Aside from maximizing the coating thermally induced strain down to cryogenic temperatures, the selected coating material must also exhibit a good adhesion to the fiber. Adhesion is fundamental to assure a good transfer of thermal induced strain. For instance, despite Teflon has been found the material able to induce the highest strain to the fiber, it is also the most inadequate material to assure the proper adhesion to the fiber interface. Coating with Teflon requires specific treatment of the substrate as well as the use of proper fixing which may increase the adhesive strength [5]. From this process, insufficient strength against shear stress, as produced from thermal gradient, may compromise the reliability of the sensor. At last, the bounding process, the final geometry of the host material should avoid non-uniform strain (local bending or radial stress) which can compromise the quality of the reflection spectrum of the grating element. A thin coating may be preferred to lower the thermal inertia of the sensor but it has to be sufficient for the elastic modulus to properly transfer the strain to the fiber [7]. For the further presented studies, PMMA and epoxy have been preferred to other materials with the goal to fabricate samples of different thickness to be characterized at cryogenic temperatures.
Sensors fabrication
The main objective of a reliable and robust fabrication process is also to make as effective as possible the choice of the coating material. Thus it has to ensure: a good strain transfer to the grating in order not to lose the sensor sensitivity, a uniform applied coating in order to avoid residual strain which may create FBG local chirp deforming the shape of FBG spectrum.
The fabrication process used for the realization of the FBG coated sensors discussed in this section is based on reactive casting [6]. This has been found the most suitable manufacturing technique to allow a good interface between the material and the fiber cladding thus an efficient strain transfer to the grating. The polymeric coatings have been produced using polymeric precursors which are liquid and compatible with the silica allowing a good surface wetting, thus a good interface fiber – coating before the

____________________________________________ Sensors design and fabrication
62
polymerization [6]. This solution has been used for all the sensors presented in the next sections although materials, precursors and dimensions of the samples may change with the specific sensor taken into account. The process of casting has required the design of a mold in which dedicated cavities of the sample dimensions have been realized to produce four coated sensors at once and in the same fabrication conditions. Figure 3. 2 shows the constrained system with opportune weights fixed at the fiber extremities that has been also used in order to induce the pre alignment and the needed pre – stress to the sensors during the first curing stage. After casting the sensors in the respective cavities, a curing procedure was followed, consisting in a preliminary curing stage at room temperature for 12 h followed by 4 h post curing at 100 °C or 120 °C according to the material [6]. In order to affect the temperature sensitivity, the thickness of the coating material needs to be greater than the diameter of the fiber and its length to be longer than the grating which are ranged on the order of several millimeters to centimeters. The final dimensions and thickness will be specified in the next sections for each sensor.
Figure 3. 2 Mold set up for reactive casting coating
Before casting, the fiber should be opportunely cleaned and stripped along the grating region such to cast the material directly on the coating section of the fiber. The sensors have been provided by the Welltech Instrument Company Limited (Hong Kong) with the following specifications: grating length 10 mm or 2 mm, Bragg wavelength tolerance ±0.5 nm, reflectivity > 90%; FWHM (full width at half maximum of the spectrum) < 0.3 nm [6]. The coated sensors have been realized at the Institute for composite and biomedical materials – National Research Council (IMCB – CNR) in Portici (Naples, Italy).

_____________________________ Sensors characterization in the range 300 – 4.2 K
63
Sensors characterization in the range 300 – 4.2 K
Cryo - cooler experimental set up
The characterization of the thermal behavior of the coated FBGs at cryogenic temperature can be mainly limited by the use and the availability of LHe needed to reach 4.2 K, which moreover requires accurate and complex handling. The high operating costs and the limited LHe availability brought, in the last 20 years, to the development of cryogen free systems, saying no contact of the sample with the coolant, in which the cryostat is cooled with the help of a Pulse Tube (PT) refrigerator. In the cryo-cooler, helium gas is progressively cooled by its successive compression and expansion though a complex compressor and heat exchangers system to release or gain energy [8]. The helium gas is compressed by the compressor producing the circulation of the helium gas through the system. The compressed gas flows through a regenerator (which absorbs heat from the gas), the tube (where the gas move back and worth) and an heat exchanger, connected to a helium buffer, at the lowest temperature (where the gas is cooled). When the gas is forced to flow back worth, it expands leaving the heat exchanger. The gas passes through the regenerator again which gives off the heat. The cycle is repeated continuously, so that the circulating gas progressively cool down until the required temperature of 4.2 K [9]. The cryostat where the PT is installed is cooled down first, when the cryostat reaches the base temperature of 4.2 K, the VTI can be cooled down by conduction through the heat exchanger connected to the pulse tube.
For the development and the characterization of FBG cryogenic sensors it has been specified a cryogen free system specifically adapted for the use and the test of fiber optic sensors and presently installed in the SM18 cryogenic test facility at CERN. The technical drawing and the picture of the installation are shown in Figure 3. 3. This system allows performing tests in a temperature controlled environment without the use of the LHe.

_____________________________ Sensors characterization in the range 300 – 4.2 K
64
Figure 3. 3. Cryogen free refrigerator system: technical drawing (from Cryogenic Ltd.) and installation in SM18 test facility
More precisely, the system provided by Cryogenic Ltd.TM consists of a two stages closed cycle refrigerator system with a cryogen free cryostat, a PT of 1 W cooling power at 4.2 K and a variable temperature insert (VTI) in a top loading configuration [10]. This configuration allows cooling down separately, in two stages, the cryostat and the insert, to slide the samples, from the top via a long rod, in a static gas column, to rapidly exchange the samples while the refrigerator is operating without the need to warm up the whole system. The VTI temperature is controlled by using heaters and monitored by a temperature sensor located at the bottom of the column, in order to meet the demanding specifications of ± 0.5 K temperature homogeneity in an isothermal region of 50 mm outer diameter and 100 mm height. In this region the sample are inserted and placed vertically to be tested. The rod used to insert the sensors, is equipped at its end with a gold – coated copper platform (24 mm width and 132 mm length) as sample holder for mounting and dismounting the set up. All the components are shown in Figure 3. 4.
The sensors, typically tested in single ended configuration, are laid down, free of any stress, on the platform at the same locations of 2 reference resistive sensors (CERNOXTM Lake Shore) connected in series, installed inside the platform at 100 mm from each other. The fibers are connected to four optical vacuum thigh feed-through at the top of the rod in order to realize the external connection to the interrogation system.

_____________________________ Sensors characterization in the range 300 – 4.2 K
65
Figure 3. 4 Insert used to slide the rod and the gold – coated copper platform inside the VTI; Locations of the FBG and CernoxTM sensors on the platform.
The reflection wavelength of each FBG sensor is acquired by mean of the compact optical sensor interrogation module Micron Optics sm125 at a maximum frequency of 2 Hz. The reference sensors of the platform and the one of the VTI are connected to the Lake Shore 350 temperature controller together with the heaters, while the temperature sensors of the cryostat which monitor the status of the PT 1st stage and 2nd stage, are connected to the 218 Lake Shore temperature monitor. The optical interrogator and the modules for the temperature control of the system are all connected to the same computer. Different software are used for the data acquisition of the optical and the resistive sensors. The FBG data acquisition and saving is carried out by means of the Micron Optics’ sensing analysis software ENLIGHT [11], while for the reference sensors and the heaters the software provided by Cryogenic Ltd. is used to run the corresponding electronics.
PMMA coated FBG characterization
PMMA has been used as coating for 10 mm grating sensor to produce samples of dimensions: 2.5 × 5.0 × 25.0 mm (height × width × length) as shown in Figure 3. 5. Sensors with this type of coating will be referred to with the letter “B” followed by two digits which represent the initial Bragg wavelength at room temperature (e.g. 57 will indicate 1557 nm) [6].

_____________________________ Sensors characterization in the range 300 – 4.2 K
66
Figure 3. 5 PMMA coated FBG.
In order to characterize the sensors, 12 cycles from 300 K to 4.2 K have been performed with the goal to study the stability and the repeatability of the measurements. The thermal cycling effect on the material has been investigated as well. Figure 3. 6 shows the initial reflected spectrum of the sensor at 300 K (blue curve) and the final one at 4 K (red curve).
Figure 3. 6 Reflection spectra of the PMMA coated FBG at 300 and 4 K affected by chirping due to the non-uniform strain distribution along the grating length
The shift produced towards lower wavelengths shows the effect of the compressive strain induced by the thermal contraction of the coating material. Furthermore, the non-well defined peak spectrum at room temperature indicates a non-uniform strain distribution along the length of the FBG produced by the fabrication process and which becomes more evident at 4 K owing to thermal residual stress on the grating after the cool down to 4 K.
The Bragg wavelength shift with respect to 300 K as function of the temperature is shown in Figure 3. 7a reported together with the FBG B62 of the same type, confirming the non-linear behavior in the range 300 – 4 K. Both sensor show a very similar behavior. Therefore the further analysis will be detailed only for FBG57. A maximum wavelength shift Δλ = -14.79 nm after the first cool down is measured. The wavelength shift vs.

_____________________________ Sensors characterization in the range 300 – 4.2 K
67
temperature curve has been fitted, for both sensors, with a sixth degree polynomial function. The resulting sensitivities obtained by the differentiation of the polynomial fitting curve (ST= dλ/dT) is shown in Figure 3. 7b. It reports values of ST = 110 pm/K at 298 K, ST = 15.5 pm/K at 30 K, ST = 5 pm/K at 10 K [12].
Figure 3. 7 a. Bragg wavelength vs. temperature; b. Sensitivity curve dλ/dT for two different PMMA-based sensors.
The reflected wavelength of the FBG sensor has been measured every 10 seconds during 12 controlled cool-down from 300 to 4.2 K shown in Figure 3. 8, each lasting about 6 hours allowing repeatability and the thermal cycling effect studies on the sensor.
Figure 3. 8 PMMA coated FBG wavelength shift vs. temperature during 12 cool down
The study of the thermal cycling on the material gives an important feedback for the design validation, the manufacturing and the optimization of the sensor. Repeated cooling and heating may cause cracks of the material, change the bounding quality or the

_____________________________ Sensors characterization in the range 300 – 4.2 K
68
material stiffness due to high thermal stresses. Therefore, the thermo-mechanical behavior of the fiber-coating system along thermal cycles has been studied. In Figure 3. 8, the wavelength shift during the 12 cool down is reported considering:
Δλ = λ-λ298K, i (3- 16)
with λ298K, i is the wavelength at 298 K at each cycle i. The thermal cycling does not affect the behavior of the coated FBG over the range 298 – 4 K showing a good repeatability of the data: at 30 K the averaged wavelength shift is Δλ = -14.53 nm with a standard deviation of 26 pm corresponding to less than 2 K.
The effect of the thermal cycle on the coating may be evaluated considering the change Δλwarm between λ298K at each cycle i and λ298K at the same temperature at the beginning of the first cool down i=1:
Δλwarm = λ298K, 1 -λ298K, i (3- 17)
The same effect can be evaluated at 10 K considering the difference Δλcold between λ10K at each cycle i and λ10K at the end of the test first cool down i=1:
Δλcold = λ10K, 1 –λ10K, i (3- 18)
During the thermal cycle, a red shift of the initial wavelength with respect to the initial condition is observed. It may correspond to a mechanical settling of the fiber-coating that evolved with the thermal cycles. The last value of λb will define the new initial condition at 298 K as characteristic parameter of the cryogenic sensor device.
Figure 3. 9 reports the wavelength shift Δλwarm and Δλcold as function of the number of cycles. After 7 cycles a slight mechanical effect due to the thermal cycling can be appreciated, after 12 cycles the overall shift of λ at 298 K is 0.14 nm which is corresponding < 1% of the whole variation of lambda in the full range of temperature 298 – 7 K of the first cool down. After 12 cycles the overall shift of λ at 10 K is 0.1 nm.

_____________________________ Sensors characterization in the range 300 – 4.2 K
69
Figure 3. 9 Comparison of the wavelength shift at 300 K and 11K along the thermal cycles
The dataset has been used to calibrate the sensors in the range 298 – 7 K in terms of temperature variation ΔT = T – T0 as function of the wavelength shift Δλ = λ – λ0 considering λ0 at T0 = 298 K:
ΔT = f (Δλ) (3- 19)
This function represents the calibration curve of the specific sensor. Figure 3. 10 shows the plots along with its fit with a piecewise polynomial functions. For the sensor B57, the fitting function is given by two 6th order polynomial functions in different ranges:
ΔT(∆𝜆𝜆) = � 𝑎𝑎𝑖𝑖Δ𝜆𝜆𝑖𝑖𝑛𝑛
𝑖𝑖=0
(3- 20)
The coefficients are reported in table 1. The choice of the fitting curve has followed the criteria to obtain the smallest residuals with the highest R2. Specifically the ranges found are Δλ ≥ -13.4 nm corresponding to T ≥ 79 K and Δλ < -13.4 nm corresponding to the range 7 – 79 K. In Figure 3. 10b, the interpolation error, the difference between the measured data and the fitted data is shown: the maximum error of 2 K occurs at 15 K.

_____________________________ Sensors characterization in the range 300 – 4.2 K
70
Figure 3. 10 Calibration curve and piecewise polynomial function; Difference between the measured data and the fitted data.
For sensor B62 the double polynomial function has been found as the combination of a 6th and a 9th degree polynomial functions which coefficients are specified in table 1 giving a maximum error of 1.5 K at 12 K. In this case the ranges specified for the 6th and 9th polynomials are Δλ ≥ -13.4 nm corresponding to T ≥ 87 K and Δλ < -13.4 nm corresponding to the range 7 – 87 K respectively.
Table 1 PMMA coated FBG fitting functions coefficients
FBG B57 FBG B62
Δλ ≥ -13.4 nm Δλ < -13.4 nm Δλ ≥ -13.2 nm Δλ < -13.2 nm
a0 1.64E-01 -5.78E+08 1.25E-01 -1.30E+11
a1 8.45E+00 -2.48E+08 6.34E+00 -6.28E+10
a2 -9.32E-01 -4.42E+07 -2.06E+00 -1.20E+10
a3 -1.46E-01 -4.21E+06 -4.34E-01 -1.02E+09
a4 -2.19E-02 -2.26E+05 -5.71E-02 -2.15E+06
a5 -1.62E-03 -6.45E+03 -3.58E-03 7.49E+06
a6 -4.83E-05 -7.67E+01 -8.87E-05 7.22E+05
a7 - - - 3.33E+04
a8 - - - 7.96E+02
a9 - - - 7.92E+00
In Figure 3. 11, an example of the FBG B57 temperature reconstruction obtained with the calibration using a reference sensor placed at the same location as the FBG shows the coherence of method. One cool down in the cryo cooler is of about 6 hours.

_____________________________ Sensors characterization in the range 300 – 4.2 K
71
Figure 3. 11. FBG B57 cryo - cooler cool - down temperature reconstruction for PMMA-based sensor
Epoxy coated FBG characterization
The same analysis as for the PMMA coated sensors has been carried out for epoxy coated FBGs. The epoxy labelled EC – 170 + IG 824 – K24 [6] has been used to produce samples of the same dimensions as reported in Figure 3. 5 and referred as type “A” sensors. The following digits correspond to the nominal wavelength taken at room temperature. The first evidence of a different coating effect is given by the spectral analysis reported in Figure 3. 12. The spectrum at 300 K (blue curve) presents a slight chirping effect due to the residual strain from the fabrication process. However the effect is reduced compared to the PMMA coated sensors. The compressive thermal strain after the cool down to 4 K does not introduce any degradation to the Bragg reflected spectrum (red curve). The axial strain may likely be more uniform along the grating for these samples.

_____________________________ Sensors characterization in the range 300 – 4.2 K
72
Figure 3. 12 Reflection spectra of the epoxy coated FBG at 300 and 4 K
Figure 3. 13a reports the Bragg wavelength as function of the temperature for both the sensors under test, A65 and A55. As expected the wavelength variation is non-linear with the decreasing temperature in the range 300 – 4 K reaching a maximum wavelength shift Δλ = -12.82 nm after the first cool down, considering Δλ = λ-λ0 with λ0 at 300 K.
The epoxy – coated sensors experience a smaller change in wavelength in respect to the PMMA coated in the range of interest. The wavelength shift vs. temperature curve has been fitted with a 7th degree polynomial function. The resulting sensitivity for both the sensors is shown in Figure 3. 13b reporting values of ST = 85 pm/K at 300 K, ST = 14 pm/K at 30 K reducing to ST = 4 pm/K at 10 K [12].
The A55 and A65 reported similar results, for the further analysis will be considered only A55. As for the PMMA coated sensors, the repeatability and the thermal effect study has been carried out also for these samples. Figure 3. 14 reports the wavelength shifts for,
Δλ = λ-λ300K, i (3- 21)
with λ300K at each cycle i during twelve cool down showing that the thermal cycle does not affect the behavior of the sensor. A good repeatability of the measurement is also evident for epoxy coated sensor; in the case of FBG A55 at 30 K Δλ averaged is -12.64 nm with a standard deviation of 10 pm, corresponding at about 2 K.

_____________________________ Sensors characterization in the range 300 – 4.2 K
73
Figure 3. 13 (a) Bragg wavelength vs. temperature; (b) Sensitivity curve dλ/dT for two different Epoxy-based sensors.
Just as PMMA, Figure 3. 15 shows the total shift at each cycle at 300 K compared with the shift obtained at 11 K in function of the number of cycles for the epoxy sample A55.
Figure 3. 14 Epoxy coated FBG wavelength shift vs. temperature during 12 cool down
After 12 cycles the overall shift of λwarm at 300 K is - 0.02 nm while at 11 K it is - 0.03 nm. Differently form the PMMA, a blue shift characterizes the wavelength after the thermal cycles owing to a compressive strain induced to the grating.

_____________________________ Sensors characterization in the range 300 – 4.2 K
74
Figure 3. 15 Comparison of the wavelength shift at 300 K and 11K along the thermal cycles for Epoxy-based sensor
The lowest temperature operation limit for this type of sensor may be considered 9 K for a sensitivity value of 1 pm/K.
The dataset obtained allows an accurate calibration of the sensors type “A” in the range 300 – 7 K. Figure 3. 16a shows the ΔT = f (Δλ) plot with λ0 at T0 = 300 K. The fitting curve is also shown. For the sensor A55 the fitting function is given by a 6th order and 8th order polynomial functions, as the eq. 3.23, in different ranges and the coefficients are reported in table 2. Specifically the ranges found are Δλ ≥ -11.91 nm corresponding to T ≥ 66 K and Δλ < -11.91 nm corresponding to the range 7 – 66 K. In Figure 3. 16b, the difference between the measured data and the fitted data is shown: the maximum error of 1.2 K occurs in the range 11- 15 K.
Figure 3. 16 Calibration curve and piecewise polynomial function; Difference between the measured data and the fitted data for Epoxy based sensor.

__________________________________________ Epoxy coated FBGs optimization
75
Table 2 Epoxy coated FBG fitting functions coefficients
FBG A55 FBG A65
Coefficients Δλ ≥ -11.91 nm
Δλ < -11.91nm Δλ ≥ -11.2 nm Δλ < -11.2 nm
a0 5.56E-02 5.60E+10 1.23E-01 -3.55E+10
a1 9.41E+00 9.95E+09 8.43E+00 -1.84E+10
a2 -2.52E+00 6.47E+08 -2.77E+00 -3.38E+09
a3 -6.23E-01 -3.23E+07 -6.32E-01 -1.21E+08
a4 -9.19E-02 -8.45E+06 -8.65E-02 5.19E+07
a5 -6.53E-03 -6.01E+05 -5.77E-03 9.91E+06
a6 -1.87E-04 -1.99E+04 -1.57E-04 8.61E+05
a7 - -2.62E+02 - 4.18E+04
a8 - 5.60E+10 - 1.10E+03
a9 - - - 1.23E+01
Epoxy coated FBGs optimization
Sensors selection
The development of a FBG based cryogenic sensor is led by design and manufacturing requirements which may combine the need to assure good performance in terms of sensitivity of the sensors and feasibility of the fabrication process. However, the potential applications where these sensors may be needed require characteristics as reduced dimensions and easy fabrication on large scale. These are the key parameters which introduce the need of optimized sensors development.
Out of our former sample characterization, the first choice towards an optimized (and so also miniaturized) sensor is to use the epoxy resins. This type of material eases the manufacturing process without compromising the quality of the reflected spectrum of the FBG see section 3.2.3. Moreover, the study carried out in the same section reports the good stability of the measurements after thermal cycling thus making the coating process reliable for the fabrication. For the fabrication process check, new samples made with the epoxy resin (Epon Resin) used with curing agent Epikure 3234 (provided by The Miller Stephenson - U.S.A.) have been characterized.

__________________________________________ Epoxy coated FBGs optimization
76
Figure 3. 17 Optimized epoxy coated FBG.
Sensors have been produced following the fabrication process described in section 3.1.2 but reducing the dimensions to 12 mm in length and 3 or 2 mm in thickness of the coating centered around the 2 mm long grating as shown in Figure 3.17. Shortening the grating length reduces the effect on the reflected signal in response to the non-uniform strain transfer from the host material to the grating. The result of the coating process on the spectra of the sensors is reported in Figure 3. 18. No chirping effect and no birefringence is observed confirming that the epoxy homogeneously transfers the longitudinal stress to the grating. The sensors considered for this study will be referred to FBG 5 and FBG 11 characterized by 2 mm and 3 mm coating thickness respectively. The initial Bragg wavelengths λ0 at T0 = 300 K equals to respectively 1525 nm and 1555 nm.
Figure 3. 18 Reflection spectra of the epoxy coated FBGs at 300 K. No chirping and no birefringence affect the signal.
The reduction of the coating dimensions decrease the stiffness ratio that may lead to a lower thermal apparent strain. For this reason a comparative study on the different thickness and their effect on their sensitivity is discussed in section 3.3.3 finalizes the optimization study.
The FBG used to be coated with the epoxy have been “written” in polyimide coated fibers as they display a high strength and resistance assuring easy handling. The

__________________________________________ Epoxy coated FBGs optimization
77
polyimide has been removed only along the grating length and kept all along the fiber such to reduce the fiber breakage at the fragile edges of the coating material.
Sensors calibration in the range 300 – 4.2 K
The characterization along nine thermal cycle has been carried out on the sensors. The thermal cycling effect on both sensors is studied. Figure 3. 19 shows the total shift at 300 K compared with the shift obtained at 10 K in function of the number of cycles for both the FBG 11 and 5 (3 and 2 mm epoxy thickness respectively).
Figure 3. 19 Total wavelength shift at 300 K compared with the shift obtained at 11 K in function of the number of cycles
A slight mechanical effect due to the thermal cycling can be appreciated after the first two cycles. However, the behavior stabilizes five cycles, which was not the case for previous samples, showing the thermo mechanical settling of the sensors. After 9 cycles the overall shift of λ300 K is - 0.05 for FBG 11 and -0.01 for FBG 5 nm. Similarly after 9 cycles the overall shift of λ10 K is - 0.07 nm for FBG 11 and -0.01 nm for FBG 5 showing a better stability for the thinner coating. The blue shift to which the wavelength is set after the thermal cycles is coherent with the expected behavior studied with the epoxy – coated sensors in the section 3.2.3.
The thermal cycle has set a new characteristic value of λ0 at 300 K to be taken into account as reference for the implementation of the sensors in a sensing system.
Following the same calibration procedure used in the previous sections, the curves ΔT vs. Δλ have been fitted with a double polynomial function in different ranges of temperature with the criteria to obtain the minimum interpolation error. The coefficients and the ranges are specified in table 3. For the FBG 11 the ranges have been identified for Δλ ≥ -11.9 nm and ≥ 64 K obtained a maximum error of 4.5 K at 12 K and less than 1 K in the range 20 – 300 K.

__________________________________________ Epoxy coated FBGs optimization
78
Figure 3. 20 Calibration curves and piecewise polynomial functions for sensors FBG 11 and FBG 5; Difference between the measured data and the fitted data for both the sensors.
For the sensors FBG 5 the ranges specified for the 6th and 9th polynomials are Δλ ≥ -12.1 nm corresponding to T ≥ 48 K and Δλ < -12.1 nm corresponding to the range 4 – 48 K respectively giving a maximum error of 3.5 K at 12 K and less than 1 K in the range 20 – 300 K. For both the sensors the results are shown in Figure 3. 20.
Table 3 Optimized epoxy coated FBG fitting functions coefficients
FBG 5 FBG 11
Coefficients Δλ ≥ -12.1 nm Δλ < -12.1 nm Δλ ≥ -11.9 nm Δλ < -11.9 nm
a0 3.00E+02 3.19E+09 8.66E-02 -1.26E+10
a1 1.19E+01 1.30E+09 1.11E+01 -6.16E+09
a2 -1.36E+00 2.11E+08 -1.55E+00 -1.25E+09
a3 -3.87E-01 1.72E+07 -3.87E-01 -1.36E+08
a4 -6.41E-02 7.02E+05 -5.91E-02 -8.28E+06
a5 4.32E-04 1.14E+04 -4.09E-03 -2.70E+05
a6 1.81E-03 - -1.15E-04 -3.65E+03
a7 2.87E-04 - - -
a8 1.91E-05 - - -
a9 4.79E-07 - - -
The characteristic curves of the different samples can be appreciated in Figure 3. 21 where PMMA and Epoxy behaviors are compared

__________________________________________ Epoxy coated FBGs optimization
79
Figure 3. 21 Characteristic curves of the different tested PMMA and epoxy samples
The agreement and the coherence of the sensors’ behavior coated with the same type of material over the wide range 300 – 4.2 K is remarkable.
Despite the better performance of the type B sensor (PMMA), in terms of sensitivity, the trade-off between quality of fabrication and good performance are anyway guaranteed by the use of epoxy coatings (FBG type A, 11, 5). The next section will be dedicated to the effects of the coating thickness on the sensitivity of the epoxy coated sensors.
Sensitivity study
To investigate the effect of the coating thickness on the sensitivity of the FBG, three FBG coated with 5, 3 and 2 mm thickness epoxy resin have been tested. Their characteristic curves are compared in Figure 3. 22a and b.
At three representative temperatures 100, 30 and 10 K the averaged shift and the corresponding standard deviations are reported in table 4.
Table 2 Avaraged shifts and standard deviations at representative temperatures
mean Δλ ± std [nm] 5 mm 3 mm 2 mm
100 K -10.87 ± 0.021 -10.84 ± 0.090 -10.64 ± 0.010
30 K -12.65 ± 0.010 -12.60 ± 0.010 -12.38 ± 0.016
11 K -12.81 ± 0.010 -12.77 ± 0.003 -12.55 ± 0.004

__________________________________________ Epoxy coated FBGs optimization
80
The behavior of the FBG coated with 5 and 3 mm epoxy thickness is very close in the whole range of interest reaching a wavelength shift of - 12.81 nm and - 12.77 nm at 11 K respectively, while, as the thickness decreases to 2 mm, a slight smaller shift of -12.55 nm may be appreciated. This difference in shift between the 3 and the 2 mm thickness becomes more evident below 150 K and it is equivalent to a maximum of 200 pm at 100 K and 260 pm at 11 K. Nevertheless this is not really impacting the sensitivity of the sensors at the same temperatures. The variation of the wavelength shift in function of the temperature is computed using a numerical derivative of the averaged shift and it is reported in Figure 3.22.
Although the different thickness coatings, the FBG considered are not showing significant differences in terms of sensitivities over the whole range 300 – 10 K. The 5 mm coated FBG shows a sensitivity of 0.096 nm/K at 300 K which is slightly reducing with the thickness to 0.090 and 0.088 nm/K for the FBG coated with 3 and 2 mm epoxy thickness respectively. Nevertheless, with the decreasing temperature, the sensitivities approach the same values of 0.003 nm/K at 10 K showing the same performances for the three sensors at low temperature. The coherence of the results for the three sensors can be attributed to the thermal expansion coefficient of the same polymer used as coating thus validating the material selection and the coating process. It is worth to recall that epoxy coating enhances considerably the sensitivity of the FBG at cryogenic temperature reaching, in the range 20 - 30 K, the same sensitivity of about 0.010 – 0.014 nm/K of a bare FBG at room temperature thus making this sensor highly suitable down to cryogenic temperature down to 20 K.
Figure 3. 22 Averaged wavelength shift (over the all cool down) in the range 300 – 10 K and the magnified plot in the range 10 – 90 K for the three epoxy coated FBG
A further investigation is still needed to improve the sensitivity below 10 K. Additionally the analysis leads to the important result that decreasing the thickness of the coating from 5 to 2 mm doesn’t affect the sensitivity at very low temperature, thus giving the perspectives to finalize the design of a miniaturized cryogenic coated FBG without losing the performance and the reliability.

___________________________________________________________ Conclusions
81
Figure 3. 23 Sensitivity comparison between the different epoxy coatings thickness
Further investigations may be addressed to decrease the thickness and to study the performance and the robustness of smaller sensors.
Conclusions In this chapter, the development of a FBG based sensors for monitoring cryogenic temperature has been presented. The goal of the study is to design, fabricate and characterize the sensors in the range 300 – 4.2 K in order to increase the FBG temperature sensitivity at cryogenic temperature, to improve the fabrication process and to define the geometries. The design of the sensor relies on the material selection following the criteria to choose those materials characterized by a thermal expansion coefficient able to induce thermal strain to the grating at cryogenic temperature. Polymers result to be the best candidates to improve the FBG temperature sensitivity. Investigations reported in this chapter on PMMA and epoxy samples, fabricated with reactive casting and tested in a controlled cryogenic system, confirm that the range of sensitivity can be extended to 7 K and 9 K with values of 2 pm/K for the PMMA and 1 pm/ K for the epoxy. These results are encouraging if compared to previous tests reported in literature where the temperature of investigation has been extended to 15 K with the use of metals [13] and to 30 K with the use of PMMA [14]. The choice of PMMA and epoxy also responds to requirements of coating uniformity and adhesion to the interface fiber – material. If it is not coated adequately all along the length of the grating, bending may occur causing degradation on the signal quality and if the adhesion is not assured the shift of the reflection wavelength may be smaller preventing the required sensitivity improvement.

___________________________________________________________ Conclusions
82
The analysis of the spectrum after the fabrication process demonstrate that the use of the epoxy resins results easier and more adequate in respect to the PMMA to assure good quality of the signal avoiding residual stresses along the length of the grating. This, coupled to the reduction of the coated material dimension and to the shortening of the grating (from 10 to 2 mm), leads to the optimization of the sensor design. Tests carried out on different thickness epoxy coatings show a better stability to the thermal cycling for coated FBG with the shortest grating (2 mm) and no loss of sensitivity at cryogenic temperature when the sensors dimensions are reduced. These results confirm the goodness of the material choice and the coating process, the validation of the design and the definition of the geometries which assure good performance in terms of sensitivity at temperature down to 10 K. The sensors development presented in this chapter offers the perspectives to implement this kind of sensors for applications which requires the monitoring of He gas for temperatures above 10 K. Further investigations are needed for improving the FBG sensitivity in the range 4.2 – 10 K and for application which require the use of liquid He.

83
References
[1] H. Zhang, F. Deng, Q. Wang, L. Yan, Y. Dai and K. Kim, "Development of Strain Measurement in Superconducting Magnet through Fiber Bragg Grating," IEEE Trans. Appl. Superconductivity, vol. 18, no. 2, pp. 1419-1422, 2008.
[2] A. Chiuchiolo, M. Bajko, J. Perez, H. Bajas, M. Consales, M. Giordano, G. Breglio and A. Cusano, "Fiber Bragg Grating Cryosensors for Superconducting Accelerator Magnets," Photonics Journal, IEEE, vol. 6, no. 6, pp. 1-10, 2014.
[3] "Thermal Expansion," in Thermal properties of metals, ASM Ready Reference, p. 9.
[4] J. D. James, J. A. Spittle, S. G. R. Brown and R. W. Evans, "A review of measurement techniques for the thermal expansion coefficient of metals and alloys at elevated temperatures," Measurement Science and Technology, vol. 12, no. 3, 2000.
[5] T. Mizunami, H. Tatehata and H. Kawashima, "High-sensitivity cryogenic fibre-Bragg-grating temperature sensors using Teflon substrates," Meas. Sci. Technol, vol. 12, no. 7, p. 914, 2001.
[6] M. Esposito, S. Buontempo, A. Petriccione, M. Zarrelli, G. Breglio, A. Saccomanno, Z. Szillasi, A. Makovec, A. Cusano, A. Chiuchiolo, M. Bajko and M. Giordano, "Fiber Bragg Grating sensors to measure the coefficient of thermal expansion of polymers at cryogenic temperatures," Sensors and Actuators A: Physical, vol. 189, pp. 195-203, 2013.
[7] C. Lupi, F. Felli, L. Ippoliti, M. A. Caponero, Ciotti, V. Nardelli and A. Paolozzi, "Metal coating for enhancing the sensitivity of fibre Bragg grating sensors at cryogenic temperature," Smart Materials and Structures, vol. 14, no. 3, 2005.
[8] R. Ray, "Development of the pulse tube refrigerator as an efficient and reliable cryocooler," in Institute of refrigeration, London, 2000.
[9] A. d. Waele, "Pulse-tube refrigerators: principle, recent developments,," Elsevier Physica B, pp. 479 - 482, 2000.

84
[10] B. Evans, R. Down, J. Keeping, O. Kirichek and Z. Bowden, "Cryogen-free low temperature sample environment for neutron scattering based on pulse tube refrigeration," Meas. Sci. Technol., vol. 19, 2008.
[11] "Micron Optic," [Online]. Available: http://www.micronoptics.com/uploads/library/documents/datasheets/Micron_Optics_ENLIGHT.pdf.
[12] A. Chiuchiolo, L. Palmieri, M. Consales, M. Giordano, A. Borriello, H. Bajas, A. Galtarossa, M. Bajko and A. Cusano, "Cryogenic-temperature profiling of high-power superconducting lines using local and distributed optical fiber sensors," Optics Leters, vol. 40, no. 19, pp. 4424-4427, 2015.
[13] R.Rajini-Kumar, M. Suesser, K. G. Narayankhedkar, G. Krieg and M. D. Atrey, "Performance evaluation of metalcoated fiber Bragg grating sensors for sensing cryogenic temperature," Cryogenics, vol. 48, no. 3/4, p. 142–147, 2008.
[14] J. Roths, G. Andrejevic, R. Kuttler and M. Süßer, "Calibration of Fiber Bragg Cryogenic Temperature Sensors," in Optical Fiber Sensors, OSA Technical Digest, Optical Society of America, Cancún, Mexico, 2006.

85
Chapter 4 Validation of Fiber Optic Thermal Cryogenic Sensors for Superconducting Transmission Lines The assessment of advanced technologies and devices designed to operate in cryogenic environment is leading to an increasing interest in accurate monitoring systems. Long-term robustness and reliability have to be assured to guarantee good operation and safe working conditions of the equipment. Fiber optic sensors, combining both multi point and distributed capabilities, offer appealing advantages of monitoring cryogenic temperatures over long distance in the power transmission lines.

__________________________________________________________ Introduction
86
4.1 Introduction The development and the characterization of FBG based sensors for cryogenic temperature in controlled and dedicated ambient described in Chapter 3, can find its proof of principle and validation in real scale applications. In these environments the temperature monitoring represents an important parameter for the correct working condition of the device where the temperature sensors are installed.
In this Chapter, the cryogenic FBG coated sensors are proposed to monitor temperature over long distance: no other applications of this kind have been reported in literature so far being the development of the coated sensors itself a field of study not widely developed yet. In particular, the integration of the calibrated FBG sensors in the first prototype of 20-m-long superconducting transmission line designed and developed at CERN (hereafter called SC - Link), will be described. The goal is to monitor the temperature of the He gas along the line taking advantage of the Wavelength Division Multiplexing (WDM) of the FBGs to increase the number of measuring points. It assure measurement redundancy in case of fiber or resistive thermometers damages in such harsh working conditions and environment. By the way, the number of resistive sensors cannot be easily increased due to the limitation introduced by the wiring. Moreover, the precise monitoring of the local temperature variation all along the superconducting transmission line gives complementary information to localize possible sections where the He cooling is not sufficient in order to assure safe operation of the superconducting cable below its critical temperature (transition from resistive to superconducting state) [1]. The tests presented in this Chapter allow validating the technology development based on the FBG for monitoring cryogenic temperature as described in Chapter 3.
The Chapter presents the implementation of the PMMA and epoxy coated FBG sensors in the SC- Link and the feasibility of their use down to 30 K. In the same set up, the feasibility of the distributed sensing based on Rayleigh scattering is also described based on multipoint and distributed sensing hybrid sensing system.
At last the Chapter presents tests carried out on the optimized epoxy coated FBGs in static temperature conditions with the goal to monitor the temperature change during superconducting cable critical current measurement [2]. Then dynamic temperature monitoring in range 35 – 80 K is also performed in order to test the effectiveness of the sensors to monitor local temperature variations in different portions along the cryostat length.
For their validation, the FBG based sensors have been compared during the test to the standard sensors commonly used in the test station.

________________________________________ Sensors integration in the SC – Link
87
4.2 Sensors integration in the SC – Link The integration and the validation of the coated FBG sensors takes place in the test station designed and built at CERN in the cryogenic test facility called SM18. This test station was optimized for testing the cable prototype to be employed in the SC-Link. The test station consists in a 4 m high distribution feed – box for the He gas injection, a 20-m-long semi-flexible cryostat (CRYOFLEX® type) operating in the range of 10 – 70 K for the cables hosting and insulating for the room temperature and a volume for the instrumentation wires connected to the instrumentation via electrical and optical feed through. The schematic drawing of the test station is shown in Figure 4. 1 [3].
To monitor the temperature along the line, resistive temperature sensors (CCS [4]) are placed at the gas entrance (connection between the feed-box and the cryostat), along the 20-m-long cryostat and in the instrumentation volume. The fiber optic sensors, arranged in arrays of 20 m, have been placed in the same locations as the CCS. In function of the Superconducting link test program proposing to test links at different current and lengths, the instrumentation is adapted. In some cases cables of 10 m in some others of 20 m have been tested. The superconducting cable and the temperature sensors are located in the innermost cylindrical volume of the cryostat, with inner diameter of 63 mm. All the electrical and optical wires need to be kept in this volume, along the 20 m line from the gas injection point to the instrumentation volume where all the connections take place. In this context, the advantage of using fiber optic sensors in WDM helps in reducing the wiring load over long distance and in the instrumentation volume.
Figure 4. 1 Schematic drawing of the SC – Link test station in SM18 (drawing by R. Betemps) [3]

________________________________________ Sensors integration in the SC – Link
88
For the implementation of the FBG sensors in customized arrays, an appropriate packaging is needed in order to protect the pigtails from any damage which can occur during the fiber handling and integration. Figure 4. 2 shows the packaging of the PMMA recoated FBG with commercial flexible polyolefin heat-shrinking tubes which protect the edges of the sensor [1], while the fibers are protected with standard commercial patch cords as shown in Figure 4. 4a.
Figure 4. 2 PMMA coated FBG packaging for pigtails protection
Moreover, to assure the integrity of the fibers during the installation and the operation, the sensors arranged in arrays, are placed inside a 10 mm inner diameter Kapton (DuPontTM) loose tube conveniently perforated in order to allow the He gas to freely flow inside (Figure 4. 4a). The tube is fixed to the insulated superconducting cable (Figure 4. 4b) and pushed together inside the 20-m-long horizontal innermost volume of the cryostat as shown in Figure 4. 4c. This installation procedure is followed each time a new superconducting link is implemented for testing, thus making the location and the instrumentation of the line not permanent and flexible to the requirements of the test. Although this integration procedure seems to be, so far, the most appropriate for the fiber protection, it still may introduces some stress to the sensors that adds complexity to the sensors interrogation. It has been noted that the installation introduces a variation of the sensor initial wavelength λ0 at room temperature. As reference value we have used the initial wavelength measured during the calibration in the cryo cooler, recorded at 300 K. When it happens that a shift having mechanical origin occurs, it should be removed in order to use the calibration as defined in the cryo cooler test. Similarly, any mechanical constrain along the fiber length, may introduce bending of the fibers or damage to the splices which can affect the power of the reflected signal, thus compromising or losing the reading. The splices needed to connect the sensors and the fiber extra length to reach 20 m have been realized with the advanced and robust Fujikura Fusion Splicer FSM-70s [5]. It was chosen to use plastic protection sleeves with non-metallic strength member able to withstand the cold temperature and the compressive stress during the cool down without breaking the fiber or inducing losses. Figure 4. 3 shows the splice protection sleeve with metallic strength member in (a) and the one without in (b) used for all the cryogenic tests.
The use of splices can be avoided or reduced once the technology is assessed. The design and the fabrication of customized arrays for the specific application are possible.

________________________________________ Sensors integration in the SC – Link
89
Figure 4. 3 Splice protection sleeve with metallic strength member (above); Splice protection sleeve without metallic strength member used for cryogenic applications (below)
Once the SC-link instrumented with the temperature sensors is located inside the cryostat, the installation is completed connecting the wires to the feed through. The optical fibers coming out the Kapton tube are opportunely spliced, in the instrumentation volume, together to the protected fiber extensions of 2 m length, permanently connected to the optical feed through and located in a flexible tube. Figure 4. 4c shows the wiring at the end of the cryostat in correspondence of the instrumentation volume which is then tighten for allowing the vacuum pumping and the cooling process.
Figure 4. 4 (a) Fiber optic protection inside the Kapton tube; (b) Kapton tube fixing to the superconducting cable; (c) Innermost cryostat volume for cable and sensors insertion and
instrumentation electrical and optical wires.
(b) (c)
(a)

________________________________________ FBGs validation in real application
90
All the acquisition systems are then connected from the side of the instrumentation volume through the electrical and the optical feed through.
4.3 FBGs validation in real application
4.3.1 Temperature sensors set up
The first validation of the coated FBG sensors has been carried on the calibrated PMMA and epoxy samples of dimensions 2.5 × 5.0 × 25.0 mm (height × width × length) described in the sections 3.3.2 and 3.3.3 of Chapter 3 and named as FB B57, A55, A65 and B62. The sensors have been concatenated in two separate arrays of 20 m and placed at 0, 7, 14 and 20 m respectively from the end of the cryostat on the side of the optical feed-through as shown in Figure 4. 5. The sensor capacity on each fiber is determined by the wavelength shift that each sensor will measure and the total spectral range of the instrument. This means that, for this kind of application, considering a wavelength shift of around 15 - 12 nm for each sensor and the interrogator bandwidth range of 80 nm, the implementation allows a maximum concatenation of 5 FBGs on the same fiber. However, the choice to place two sensors only per fiber has been limited mostly by the nominal wavelength of each sensor at room temperature in order to avoid overlap of the spectra during the cool down to cryogenic temperature. This solution has been also adopted for redundancy reason to guarantee the minimum reading points in case of failure or damage of the set up.
Together with the FBG sensors in a multi-point distributed configuration, the set up includes two bare fiber for distributed monitoring, each one of about 10 m length, spliced together at the middle of the cryostat. They are referred as GEOSIL-SM, polyimide-coated single-mode fiber and Pirelli FreeLight, acrylate-coated single-mode fiber. The results concerning the distributed sensing will be discussed in the section 4.4.
Figure 4. 5 PMMA and epoxy coated FBGs and CCS locations along the 20 m length Kapton tube
In order to validate the FBG sensors, these have been placed in the same locations of the CCS named as T3, T4, T5, T6 at 0, 7, 14 and 20 m respectively from the connection side,

________________________________________ FBGs validation in real application
91
see Figure 4. 5. As shown in the schematic, the CCS are placed outside the Kapton tube. While the FBG sensors are implemented to be completely in the He gas, T3, T4 and T5 are fixed on the insulation of the superconducting cable. This position in contact with the cable does not really affect the temperature reading in steady state conditions but could have a small impact in the dynamics. The sensor T6 is the one at the injection part of the He gas having the same location in every test.
The FBGs were connected to the Micron Optics sm125 using a dedicated ultra - vacuum tight feed through and measured every 5 minutes. Distributed measurements have been performed at the same rate using a Luna Inc. OBR 4600 read out system [5].
4.3.2 Feasibility in the SC - Link
As introduced in section 4.2 the fiber integration in cryogenic devices is not straight forward and it may add complexity to the set-up which can affect the reading of the measurements if not controlled.
As reported in Figure 4. 6 for the sensors FBG A55, it has been noted that after the installation in the SC - Link, the wavelength at the reference temperature of 294 K experiences a shift in respect to its value at the same temperature in the cryo cooler, where the sensors has been calibrated.
Figure 4. 6 Reflection spectra before and after the integration in the SC - Link
This change in wavelength may be attributed to a mechanical strain induced on the sensors after the integration and during the preliminary tests. Further tests are needed to identify the source of such compression. The data need to be corrected from this shift, which we can call for simplicity ΔλM. The temperature read by the FBG during the cool

________________________________________ FBGs validation in real application
92
down of the SC - Link is obtained using the calibration curves of the sensors presented in chapter 3. They represent the correlation expressed by the eq 3.18 in strain free conditions (𝜀𝜀𝑀𝑀 = 0). Therefore, the correction from the applied strain identified after the installation is needed in order to have the temperature reconstruction. If not corrected from this contribution, the shift ΔλM = 400 pm would introduce an error of about 4 K at room temperature, which corresponds to approximately 28 K at 30 K (considering the sensitivity presented in Chapter 3). Thus, for the temperature reconstruction, the following relation is used
𝑇𝑇 = 𝑓𝑓(𝜆𝜆 − (𝜆𝜆0 − ∆𝜆𝜆𝑀𝑀)) + 𝑇𝑇0 (4- 1)
where λ is the measured wavelength during the cool down and λ0 is the initial wavelength at T0 as measured in the cryo - cooler, f is the calibration function. These considerations reported for one sensors are extended to all the sensors involved in the test.
The SC-link has been cooled down to about 30 K in about 12 hours and the temperature kept homogeneous by a forced flow of He gas coming from a feed box. The variation of temperature vs. time measured by the 4 calibrated FBGs sensors is shown in Figure 4. 7a, while Figure 4. 7b shows the reading of the CCS located at the same distances. The FBGs’ data have been obtained using the calibration curves defined in the Chapter 3 after the sensors characterization in the cryo-cooler.
Figure 4. 7 (a) – (b) FBGs and CCS temperature vs. time during the SC – Link cool down to 30 K
The temperature profiles are consistent with the fact that the cold He gas is entering from the gas entrance located at 20 m.
Under the assumption that, in steady state conditions, the cryostat is isothermal and the temperature is homogenous along the 20 m cryostat where the sensors are placed, the average temperature and the standard deviation measured at the beginning of the cool down by the four FBGs results to be 294 ± 1.5 K and 290 K ± 4.2 K for the CCS. At the
(a) (b)

________________________________________ FBGs validation in real application
93
end of the cool down the temperature measured by the FBGs results to be 28.5 K ± 1.3K and 28.33 K ± 0.8 K by the CCS. These measurements suggest a 4 K difference between the FBG and the CCS readings at warm temperature which is then recovered at very low temperature, when the agreement between the optical and the resistive sensors is extremely good. It is therefore not straightforward to explain the difference between the two types of sensors at warm temperature, it is indeed worth to mention that the sensors T6 at the feed-box side and T2 in the instrumentation volume, are probably not located exactly in the same place of the FBG B62 and B57 respectively, thus affecting the correct reading. An important outcome of this test is that the precision of the FBG sensors stays within 1.5 K on the whole range of interest.
Coherently with the temperature profile monitored by the resistive sensors, it is therefore possible to map the temperature along the cryostat in four different locations. As shown in Figure 4. 8, a temperature decrease to 200 K is seen at the entrance of the cold gas at 20 m after 4 h and 45 min while the same temperature is reached at the distance 14 m, 7 m and then at the beginning of the cryostat in more than 5 h, 6 h and about 7 h respectively showing the cooling power of the He gas over long distance. This is coherent with the cooling process for which the He gas, fed from the feed box, warms up along the line absorbing the heat, therefore the time to cool down the cryostat it is longer for higher temperature.
Figure 4. 8 Temperature SC – Link mapping over the 20 m distance
Reaching lower temperature, the time needed to each sensor, therefore to each location, to get the same temperature decreases until the line reaches a stable and homogenous temperature at 30 K in about 12 h [1].

____ Feasibility study of using Rayleigh scattering fiber optic sensors in the SC - Link
94
4.4 Feasibility study of using Rayleigh scattering fiber optic sensors in the SC - Link
The temperature monitoring over long distance has been implemented with the FBG in WDM scheme for the first time in a power superconducting transmission line. Furthermore the SC – Link has been considered the ideal environment also for the first feasibility study of distributed optical fiber sensors based on Rayleigh scattering. The hybrid system which combines the multi-point sensing capability of coated FBGs with distributed Rayleigh measurements has been used to both perform the temperature monitoring in the SC-link with the FBGs, as reported in the previous section, and to calibrate the bare fibers used for the distributed measurements. The calibration of the Rayleigh based sensors could not be performed in the cryo cooler as for the FBG sensors due to a lack of space in the VTI.
To briefly recall the Rayleigh-based distributed sensor working principle, this is conceptually similar to FBG-based ones. While the FBG generates a selective reflection spectrum because of its ordered structure, the reflection spectrum generated by Rayleigh backscattering looks like a random signal, that originates from the silica amorphous structure [6]. This random pattern is a “fingerprint” characteristic of the fiber conditions and any variation in temperature and strain causes a shift of the spectra reflected by a fiber section. Due to the random nature, however, it is difficult, although not impossible, to relate an absolute Rayleigh reflected spectrum to an absolute temperature and strain condition. The relationship between the measured spectral shift and the applied strain/temperature variation depends on the characteristics of the fiber and its coating, and hence needs to be calibrated. As a bare FBG loses its sensitivity approaching cryogenic temperature, the Rayleigh scattering is affected by the same decrease in thermal sensitivity. Nevertheless, as the strain sensitivity is not affected at cryogenic temperature, an appropriate coating can be chosen to impact the thermo-mechanical behaviour of the fiber preserving high sensitivity [7].
As presented in Chapter 3, the development of a coated FBG sensor for cryogenic temperature, requires an accurate material selection necessary coupled to an effective fabrication process and characterization at low temperature. Despite the complexity of the study, it is however possible for the FBG to choose the coatings over several alternatives in agreement with the specific needs and requirements of the specific application. The same coating process is clearly not straightforward for the distributed sensing limiting the choice to commercially available fibers [8].

____ Feasibility study of using Rayleigh scattering fiber optic sensors in the SC - Link
95
For the feasibility study of the distributed monitoring in the SC – Link the option to use 10 m polyimide-coated fiber and 10 m acrylate-coated fiber was chosen. In the sketch in Figure 4. 5 the fibers GEOSIL-SM (polyimide-coated) and Pirelli FreeLight (double layer acrylate-coated) are characterized by a coating thickness of 15 µm and 62.5 µm respectively.
The FBGs’ temperature readings in Figure 4. 7a have been used to calibrate the frequency response of the bare fibers, thus making the FBG sensors their reference sensors. From the schematic of the Kapton tube in Figure 4. 5, there are two FBG sensors in correspondence of each of the two fibers. More specifically, FBG B57 and A55 have been used to calibrate the 10 m polyimide coated fiber, while FBG A65 and B62 have been used for the calibration of the acrylate fiber.
The characteristic curves obtained are shown in Figure 4. 9a, where the Rayleigh-shift vs. temperature is plotted for each fiber and each of the two corresponding FBG sensors. As expected, since the fibers properties are uniform, the two FBGs provide the same calibration curves for the corresponding fiber: the agreement of the two curves for each fiber is very good, confirming the quality of the measurements. In particular, the reported Rayleigh-shift has been measured on a 5-cm-long section of fiber at the location of the corresponding FBG.
The effect of the different coating on the characteristic curves is also evident for figure Figure 4. 9a showing that, for the same temperature variation 300 – 50 K, the polyimide-coated fiber generates a Rayleigh-shift of -1.65 nm compared to the -3.24 nm of the acrylate-coated ones. These differences can be ascribed to the different coating materials and their thickness, in agreement with previously reported measurements [9]. For the calibration, the characteristic curve of each fiber has been estimated averaging the temperature vs. Rayleigh-shift curves obtained from each FBG and then fitted with sixth degree polynomials. The residuals of the interpolations are below 2 K over the whole range.
By differentiating the polynomials, the sensitivities of the fibers have been evaluated and they are shown in Figure 4. 9b.
In particular, the sensitivities at 60 K are about 2.5 and 9.5 pm/K for the polyimide and the acrylate-coated fiber, respectively, whereas at 30 K they drop to about 0.4 and 4 pm/K [3].

____ Feasibility study of using Rayleigh scattering fiber optic sensors in the SC - Link
96
Figure 4. 9 (a) Characteristic curves of the two fibers with respect to each FBG; (b) Sensitivity curves of the two fibers
After the calibration, it has been possible to measure the temperature variation along the SC – Link during the cool down from 300 to 30 K with a spatial resolution of 5 cm. Figure 4. 10 shows the temperature profile of the SC – Link along the distance in 6 different measurement times. As for the FBG sensors, the temperature profile measured by the two portion of fiber, are consistent with the fact that the cold He gas was entering from the far end of the SC-link at 20 m of distance.
From the temperature mapping in Figure 4. 10 the fiber section at 20 m (right end of the red curves) reaches 100 K after about 8 h and 40 m (520 min) while the fiber section in the opposite side at 0 m (left end of the blue curves) reaches the same temperature after about 9h and 30 m (570 min).
Figure 4. 10 Temperature variation along the SC-link at 6 different times during the cool-down.
(a) (b)

____________________ Optimized epoxy coated FBGs validation in real application
97
It is clear form Figure 4. 10 that at lower temperature the blue curves become noisier. This can be due to the reduced sensitivity of polyimide coated fiber at lower temperature. On the contrary, the rough oscillations reported for both fibers at higher temperature are not due to noise, but are likely caused by small inhomogeneity of coating diameter, as suggested in [9], and/or uncontrolled installation issues, as for example the Kapton tube being not as loose as intended.
It is lastly worth to underline the agreement of the temperatures measured by the two fibers near the splice position in the middle of the cryostat: less than 1.5 K of difference on the whole range can be appreciated, confirming the consistency and quality of the measurements [3].
4.5 Optimized epoxy coated FBGs validation in real application
4.5.1 Temperature sensors set up
For the validation of the optimized coated FBG sensors, a new set up has been implemented for the test of a 10 m superconducting cable. To be noted that the cryostat is 20 m long. The sensors used for these tests are epoxy coated sensors of 2 mm grating length and 2 or 3 mm coating thickness previously calibrated in the cryo-cooler as presented in Chapter 3 and named FBG 10 and 11 (3 mm thickness), FBG 5 and 7 (2 mm thickness). The sensors have been arranged in two arrays and placed respectively at 0, 9, 11, 18 m from the connection side. Also for this test the choice to place two sensors per fiber has been decided accordingly the wavelength of each sensor at room temperature in order to avoid overlap of the spectra during the cool down and to have a minimum number reading points in case of failure. The location of the temperature sensors, CCS and FBG, shown in the schematic of the set up in Figure 4. 11, is mainly related to the position of the superconducting cable. This is connected from the side of the feed box along the 10 m, therefore the choice to have 6 sensors over 8, CCS and FBGs, on these
Figure 4. 11 Epoxy coated FBGs and CCS locations along the 20 m length Kapton tube

____________________ Optimized epoxy coated FBGs validation in real application
98
10 m is mainly due to the interest in precisely monitoring the homogeneity of the temperature in the portion of the cryostat where the cable is placed and tested.
The integration of the sensors in the Kapton tube and in the cryostat has followed the same procedure described in the section 4.2. Differently from the integration described in the section 4.3.2, the Kapton tube has been kept slightly outside the innermost volume of the cryostat thus moving the sensors FBG 10 and T2, directly in the instrumentation volume. This volume, hosting all the instrumentation wires is bigger and it is differently shielded from the cryostat volume where the superconducting cable and the other sensors are placed. The temperature in this location, thus, can be slightly different from the rest of the line.
4.5.2 Cryogenic tests
The SC – Link has been cooled down to 30 K as already reported in the section 4.3.2 and several cryogenic tests have been performed for temperature measurements in both static and dynamic conditions. The reflection spectra of the array (FBG 11-FBG 7) during the cool down from 300 – 30 K are shown in Figure 4. 12. No deformation of the spectra and no losses along the chain affect the reading of the signals, confirming the reliability of the sensors.
Static measurements have been carried out keeping the gas injection temperature and the mass flow rate fixed for several hours. In these conditions it was possible to estimate the homogeneity of the temperature in steady states assuming the 20-m-long cryostat isothermal.
Figure 4. 12 Reflection spectra of the FBG array during the SC – Link cool down from 300 to 30 K.

____________________ Optimized epoxy coated FBGs validation in real application
99
Figure 4. 13 reports the temperature variations in time measured along the line by the FBGs (a) and the CCS (b) showing a good agreement between the two technologies. As expected from the configuration of the set-up, the sensors FBG 10 and T2 placed in the instrumentation volume, measure a variation of maximum 4 K respect the other sensors placed along the 10 m line. The slight difference among the FBGs and the CCS may be explained by the intrinsic technology difference and eventually by the different locations in terms of distance from the feed box and contact with the He gas. It is worth to recall that the CCS T5 and T3 are placed in direct contact with the insulated cable (a kind of thermalization to a bulk material) while all the FBGs are surrounded by the gas.
Figure 4. 13 (a) FBGs and (b) CCS temperature variations in time along the 20 m SC - Link
Assuming the temperature homogeneous along the 10 m cryostat from 10 to 20 m (where the cable is placed), during the steady state in the range T= 25 – 28 K, the average temperature among FBG 11, 5 and 7 results to be T = 26.97 K ± 0.39 K. In the same range the average temperature among the CCS T3, T5, T6 is T = 26.19 K ± 0.73 K. The average temperature is computed discarding the readings of the FBG 10 and T2 being outside the portion of the cryostat where we consider that the conditions should be the same. The FBG sensors are able to measure the temperature of the cryostat with less than 1 K precision and they are in good agreement with the resistive conventional CCS sensors.
In order to study the effect of the warm gas flow propagation along the SC Link, dynamics test have been also performed where pulses of warm gas at injection are set and the heat propagation is monitored at the different sensors locations. The temperature variations at the entrance of the cryostat are obtained by properly mixing an ambient-temperature He gas flow with a cold gas flow [2]. Figure 4. 14 shows six temperature variations in time of different amplitude, measured in two different locations: at the gas entrance where FBG 7 and T6 are placed, and at the middle of the cryostat where FBG 11 and T3 are placed.
(a) (b)

____________________ Optimized epoxy coated FBGs validation in real application
100
Figure 4. 14 FBGs and CCS comparison measurements in two locations along the SC - Link
From the Figure 4. 14a and b, at the same temperature variations, the rising temperature in the two locations changes with the distance. Being FBG 7 and T6 the sensors closest to the gas inlet (Figure 4. 14a) the temperature changes in this location is higher in amplitude respect to the same variation measure at 10 m distance (Figure 4. 14b). The difference of about 3 K between T6 (blue curve) and FBG 7 (green curve) in steady state conditions may be due to the fact that T6 is located right in front of the gas injection port while FBG 7 is at a distance of 2 m from it. Instead, the 1 m distance between T3 and FBG 11 doesn’t affect the readings in steady state conditions showing a good agreement. What is changing between T3 and FBG 11 is the amplitude of the temperature changes, which is larger for the FBG (red curve in Figure 4. 14b). This may be explained considering that the FBG is completely surrounded by the He gas, while the CCS is in contact with the cable thus affecting its dynamics and thermalization.
Figure 4. 15 FBGs and CCS temperature variation propagation in four locations along the SC - Link
(a) (b)

___________________________________________________________ Conclusions
101
The presence of several sensors along the cryostat allows mapping its thermal profile in case of sudden temperature changes, to give information on the propagation of the temperature and on the recovery of the operative conditions. This is shown in Figure 4. 15 where three different temperature changes are measured in four locations at 0, 9, 15 and 18 m, two monitored with the FBGs and two with the CCS.
The time response of the sensors is coherent with their distance from the gas injection point, therefore the same temperature variation is propagating along the 20-m-long cryostat and measured in different times in the four locations. The Figure 4. 15 also shows the progressive reduction in amplitude of the temperature change with the distance. These measurements also helps to estimate the gas flow propagation velocity: a maximum variation of 16 K measured by FBG 7 (close to the injection) propagates along 9 m in 3 minutes (0.05 m/s) reducing to 8 K variation seen by FBG 11.
4.6 Conclusions The first promising results on the implementation of a FBG based monitoring system for cryogenic temperature monitoring over long distance have been presented in this Chapter.
The FBGs sensors have been integrated in the first horizontal test station built at CERN and running in the test facility SM18, for testing prototypes of superconducting cables for the SC-Link project of HL-LHC.
The set up and the installation of the fibers in a complex environment as the 20-m-long cryostat of the SC- Link, is mainly influenced by the design constrains of the Link and the specifications of the test. For this, two set up have been implemented for two different tests, and protection solutions for handling the fibers and the sensors have been developed and improved.
The first prototypes of PMMA and epoxy coated FBGs samples, previously calibrated in the cryo - cooler, have been used to monitor the ambient temperature of the 20-m-long cryostat during the cool down to 30 K. The FBG sensors in WDM scheme have been proposed in a hybrid configuration with the Rayleigh based sensors for distributed monitoring. The main goal of the test is both to monitor the temperature of the SC – Link for the FBGs validation and to calibrate the Rayleigh based sensors for their feasibility study.
The FBG sensors’ measurements with a precision < 1.5 K, show a good agreement with the resistive sensors and they are consistent with the dynamics of the cryostat during its cool down to 30 K all along the 20 m length. These data have been used to calibrate two

___________________________________________________________ Conclusions
102
fibers of 10 m each, with different coating materials, for the distributed sensing. As result, in this first test, the FBG have been validated for long distance temperature monitoring. Moreover, although further investigations are needed to increase the thermal sensitivity and coating effects, Rayleigh-based sensor results to be a viable solution for distributed monitoring at cryogenic temperature.
Beyond the encouraging results, integration issues which may compromise the readings of the sensors need to be improved and adapted to further challenging requirements.
Further tests have been presented on the optimized epoxy coated sensors. The goal of these tests is to validate the new technology for static and dynamic measurements. The measurements with < 1 K precision, show a very good agreement with the reference sensors in steady state conditions. Dynamic tests have been also performed generating variable temperature changes in order to see the temperature change propagation inside the cryostat. The FBGs are able to detect the variation of temperature in the range 35 – 80 K and the measurements are consistent with the expected dynamics all along the 20 m. The results validate the multipoint sensing system for the implementation of an accurate temperature monitoring over long distances. This validation helps in the implementation of monitoring systems for the gas leak detection in order to preserve the safe working conditions of the superconducting cables.
In conclusion, the reported results confirm that proper coating materials and fabrication techniques make the FBGs suitable and reliable sensors for cryogenic temperature monitoring for cryogenic applications working in He gas.
Further development may be addressed to the quench detection of the high temperature superconducting cables, which therefore introduces other problematic to be properly analysed.

103
References
[1] A. Chiuchiolo, M. Bajko, J. Perez, H. Bajas, M. Consales, M. Giordano, G. Breglio e A. Cusano, «Fiber Bragg Grating Cryosensors for Superconducting Accelerator Magnets,» Photonics Journal, IEEE, vol. 6, n. 6, pp. 1-10, 2014.
[2] S. Giannelli, A. Ballarino, B. Bordini, J. Hurte e A. Jacquemod, «First measurements of MgB2cables operatedin Helium Gas up to 35 K,» Cern Internal note EDMS Nr: 1476839, 2015.
[3] A. Chiuchiolo, L. Palmieri, M. Consales, M. Giordano, A. Borriello, H. Bajas, A. Galtarossa, M. Bajko e A. Cusano, «Cryogenic-temperature profiling of high-power superconducting lines using local and distributed optical-fiber sensors,» Optics Letters, vol. 40, n. 19, pp. 4424-4427, 2015.
[4] V. Datskov, G. Kirby, L. Bottura, J. Perez, F. Borgnolutti, B. Jenninger e P. Ryan, «Precise Thermometry for Next Generation LHC Superconducting Magnet Prototypes,» Applied Superconductivity, IEEE Transactions on, vol. 24, n. 3, pp. 1-5, 2014.
[5] «fujikura,» [Online]. Available: http://www.fujikura.co.uk/products/fusion-splicers-and-accessories/fusion-splicers/70s/.
[6] L. Palmieri e L. Schenato, «Distributed Optical Fiber Sensing Based on Rayleigh Scattering,» The Open Optics Journal, vol. 7, n. Special Issue 1, pp. 104-127, 2013.
[7] X. Lu, M. A. Soto e L. Thévenaz, «MilliKelvin resolution in cryogenic temperature distributed fibre sensing based on coherent Rayleigh scattering,» in OFS23 Proc. SPIE, 2014.
[8] C. D. Boyd, B. D. Dickerson e B. K. Fitzpatrick, «Monitoring distributed temperatures along superconducting degaussing cables via Rayleigh backscattering in optical fibers,» in Proceedings of the Intelligent Ships Symposium IX, 2011.
[9] L. Thévenaz, A. Fellay, M. Facchini, W. Scandale, M. Niklès e P. A. Robert, «Brillouin optical fiber sensor for cryogenic thermometry,» SPIE 9th Annual Intern. Symp. on Smart Structures and Materials, pp. 22-27, 2002.

104

105
Chapter 5 Embedded Fiber Bragg Grating sensors for new generation of Superconducting Magnets The new generation of superconducting magnets requires new design and fabrication
approaches during their development phase. The integration of temperature and strain
sensors on the magnet structure and inside the coil would lead to a better
characterization of the performance of the high field magnets. The use of fiber optic
sensors based on the FBG technology appears a feasible solution to implement a reliable
embedded sensing system able to define critical parameters for the superconductor
during the whole magnet service life.
__________________________________________________________ Introduction
106
Introduction The new magnet technology based on Nb3Sn requires new approaches for magnet design and fabrication because of the brittle and strain sensitive characteristics of the material. Technological innovation is also extended to the instrumentation for monitoring the integrity of the brittle coils during the magnet service life and for the magnet protection during operation.
In order to retain the electromagnetic forces that appear during the powering, high pre-stress is applied on the coils trough a mechanical structure. Since the superconductor is brittle, it is important that the pre-stress level does not exceed the filament breaking point. Therefore for magnet operation, the stress should be optimized from magnet assembly to cooldown and powering. Moreover, in order to protect the superconducting coil during the quench event, the temperature of the conductor should not exceed critical value that would deteriorate the conductor or its components. Typically 300 K is seen as safe value. However, no direct measurement of this “hot spot temperature” is yet possible. Precise monitoring of the magnet thermo-mechanics during the different stages of its service life appears then crucial in giving proper feedback for improved magnet design. A reliable sensing system should sustain applied compressive forces during the assembly and thermal cycle (down to 1.9 K), when the pre stress on the coil increases up to hundreds of MPa. It should also provide for accurate reading of the coil loading and unloading during the energization (up to 20 kA) and high magnetic fields (up to 13 T).
In this Chapter the use of FBG sensors as complementary technology to traditional sensors (resistive strain gauges presented in Chapter 1), for monitoring the thermo - mechanical performance of the superconducting magnet, is proposed. The use of fiber optic may help to get a better definition of the applied strain that define the superconductor critical current and the hot spot temperature that set the magnet protection system.
From 2010 on, short-scale models of Nb3Sn dipole magnets are designed and built at CERN with the aim to study the behaviour of high current density of the Nb3Sn conductor in a magnet configuration. This program enables also the necessary technology development for Nb3Sn magnet fabrication. Several models have been produced to validate the design and fabrication process, supported by detailed finite element models. They are also test beds for the implementation and the improvement of new instrumentation for measuring temperature, strain, voltage, for detecting the quench and protecting the magnet. In section 5.2 a brief description of the magnet mechanical structure, its main components and the stages of fabrications and operation is introduced

__________________________________________ Magnet structure and service life
107
before presenting the integration of the FBG in the magnet followed by the results obtained during this thesis work.
As reported in Chapter 2, few studies on the use of FBG based sensors for superconducting magnets exist that focus on the measurement of the strain distribution in coils [4] during the powering or on quench detection [5]. Besides, no studies are reported so far on coils fabricated using Nb3Sn and monitored with fiber optic sensors. It appears indeed that, despite the potential of the FBG, their delicate integration in complex accelerator magnet structure and their highly non-linear behaviour down to cryogenics conditions, where both effects of the strain and temperature need to be carefully discriminated, this technology is not yet assessed in this field of application. This Chapter aims at presenting the work made on the first integration of fiber optic sensors technology in CERN Nb3Sn-based magnet models monitored in real operational conditions.
With the purpose of measuring separately the strain and the temperature in embedded configuration, a feasibility test has been carried out using Nb3Sn cables stacked and instrumented with FBG sensors as presented in section 5.3.
The main issue in using the fiber optic sensors for the superconducting magnets is their integration and this is presented in section 5.4. For the magnet structural health monitoring the difficulty arises in the implementation of a bonding procedure suitable for cryogenic temperatures and real operational magnets, which has not been largely investigated so far. Section 5.4 is dedicated, in its first part, to the FBG sensors bonding on the Al structure of the magnet for its mechanical behaviour monitoring.
However, the challenge in using the FBGs is to embed them directly on the superconducting cables. The coils fabricated at CERN have currently only strain gauges glued on the main pole around which the conductor is wounded [1]. The second part of section 5.4 will present the integration of the FBG into the coil before its filling with epoxy and its curing process.
The section 5.5 is then dedicated to the experimental results of both bonded and embedded FBG during the main steps of the magnet service life: assembly, cool down, powering.
Magnet structure and service life In order to understand the needs and the requirements of the use of FBGs in the new generation of superconducting magnets, a brief introduction of the characteristics of the

__________________________________________ Magnet structure and service life
108
magnets and their structure, the main components and service life is presented in this section.
The FBG based sensors monitoring is used on subscales racetrack dipoles magnets. Different coils, with different wires and dimensions uses the same type of structure called the SMC (Short Model Coil) and RMC (Racetrack Model Coil) magnets. The structure and the main components of the magnets are shown in Figure 5. 1 [2].
In the so-called racetrack coil the Nb3Sn insulated cable is wounded around a central titanium pole. After the coil heat treatment, the fabrication process foresees the coil impregnation with epoxy resin before the assembly of the magnet within its structure. The role of the impregnation is double: to assure a safe handling of the coil during assembly and to complete the electrical insulation and instrumentation of the windings. The SMC consists of two racetrack-shape coils mounted into an iron yoke which is then inserted into a 20 mm thick Al cylinder of 500 mm length and 540 mm outer diameter with a given interference to assure the compression of the coils and so to retain the electromagnetic forces created by the coils while powered with DC current [2] [3]. The RMC magnet takes over the same design principles of the SMC with a structure upgrade in order to test larger Nb3Sn cables. The RMC racetrack coil pack is mounted into the iron yoke which is then assembled in the 570 mm outer diameter and 39 mm thickness Al shell of 1 m length [4].
Figure 5. 1 Magnet structure and main components [2]
During the assembly phase, at room temperature, the coil pack is pre-compressed through the outside structure, using bladders and keys. The bladders are made by two stainless steel sheets welded together around their perimeter. They are placed between the coils and the iron yoke where dedicated placements are foreseen to incrementally inflate the bladders with pressurized water delivering an azimuthal pre-stress to the aluminum shell while compressing the coils. Bladders are inflated incrementally and temporary keys inserted every 15-20 MPa. After the last pressurization, keys with a given dimensions and if needed also shims are inserted and the bladders deflated and removed in order to

__________________________________________ Magnet structure and service life
109
leave the shell in the desired tension. The longitudinal pre-stress is provided by means of a couple of bolted Al rods axially acting on the end plates [5].
Additional pre compression is applied during the cool down from the differential thermal contraction of the magnets components, basically aluminum, iron and steel. The pre-compression is necessary to retain the electromagnetic forces that appear during the powering. A good calibration of the applied pre-stress is here crucial for properly balance the Lorentz force [2]. To be reminded that the optimum value is to find for the pre stress while the friction is very difficult to be estimated only using FEM. Therefore the models are typically calibrated with thermo - mechanical measurements using instead of coils (inhomogeneous composite materials) dummy pieces made of known materials.
Monitoring the mechanical behaviour of the structure from the assembly phase to operation is essential to validate the mechanical model and to understand weather the forces become larger than the retaining forces compromising eventually the integrity of the coil during operation. Additionally, the strain monitoring of the coil gives a critical feedback on possible coil motion which may lead to unwanted quenches.
The magnets are tested in the SM18 test facility at CERN using dedicated vertical cryostats. For the study of the thermo mechanical behaviour of the magnet components a 4 meter height dedicated cryostat built for liquid Nitrogen cooling has been used, it is shown in Figure 5. 2a [6]. For powering tests at 4.2 and 1.9 K the magnets are installed in the vertical station provided with power supply in order to operate at currents up to 20 kA.
Figure 5. 2 (a) Liquid Nitrogen test facility for magnet mechanical study; (b) Vertical insert for magnet tests and powering.
(a) (b)

______________________ Embedded FBG for strain and temperature measurements
110
Before the insertion inside the cryostats, the magnets were installed on vertical inserts used to close the cryostats. This insert allows the connections of all electrical, optic and cryogenic instrumentation to the outside read out systems while supporting the structure inside the cryostat. During the study which is part of this thesis work, the various cryostats has been equipped with fiber optic installation as shown in Figure 5. 2.
The implementation of a permanent fiber optic installation able to connect the fiber optic leak - tight feed through placed on the top of the cryostats now enables to connect the devices to the acquisition system at several meters of distance (up to 30 m) from the test station.
Embedded FBG for strain and temperature measurements
The complex thermo - mechanical sensing system required for the new generation of magnets has to be resistant and reliable during the thermal transient between room temperature and 125 °C, corresponding to the curing of the coil in the epoxy resin, and from 300 K to1.9 K for its cooling. Moreover, in order to protect the superconducting coil after the quench, a temperature monitoring is needed to control the critical value that would deteriorate the conductor.
The sensitivity to both temperature and strain of a FBG sensor has led to the development of an improved embedded configuration in order to separate the mechanical effects due to the pre-stress application, from the thermal effects that arise during coil fabrication, cool-down or Joule heating in the zone of the quench initiation. The goal of the presented work is to monitor the real strain and temperature applied to the conductor during the magnet fabrication (curing) and during its operation (Lorentz force or hot spot temperature). The evaluation of the hot spot temperature at the moment of the quench has been so far based on theoretical calculations using semi-analytical models [7]. No direct measurements of the Nb3Sn cable temperature in a racetrack coil at the moment of the quench are reported in literature. As already mentioned, one of the reasons is the complexity in placing resistive sensors directly in contact with the cable without compromising the integrity of the coil.
The hot spot temperature, in the experiments performed on CERN Nb3Sn models so far, has been raised up from 60 K to 220 K in the straight segment of the coil at the high field zone, by controlling the energy extraction delay [7].
The temperatures reached at the hot spots, being above the lowest temperature where the FBG becomes insensitive [8] can be monitored with a bare FBG opportunely embedded

_______Feasibility of strain and temperature monitoring with embedded FBG sensors
111
in the impregnated coil. The issue in having a temperature FBG based sensor in embedded configuration is the need to develop a solution which makes the sensor free from any mechanical stress and as less intrusive as possible. Moreover the implementation needs to respond to the magnet design constraints such to avoid any eventual damage of the brittle coil. The approach proposed in this Chapter is the use of an Al tube where a polyimide recoated FBG is mounted for pure temperature monitoring. A temperature sensor designed with this purpose, drawn close to a polyimide recoated FBG embedded in the composite material, allows the temperature – strain discrimination, needed to distinguish weather the change in the Bragg resonance is due to purely mechanical forces or to temperature variations.
The feasibility of this approach is studied integrating the sensors in a cable stack configuration and following the same fabrication and impregnation process used for the racetrack coils as presented in the next section.
Feasibility of strain and temperature monitoring with embedded FBG sensors
5.4.1 Experimental set-up of Nb3Sn cables stack instrumented with FBGs
The goal of the experiment is to validate the integration process of a strain free FBG inside an Al tube embedded in the epoxy resin and to monitor the temperature profile of the cables during the impregnation process. The same impregnation process is used for the fabrication of the coil, therefore the stack test represents the very first step to the further implementation in the magnet.
Two FBG sensors of 5 mm long grating, 0.5 nm bandwidth and written in 155 µm fully polyimide recoated fibers have been used for strain and temperature monitoring in embedded configuration.
The temperature sensor has been realized by integrating the FBG in an Al tube of 20 mm length, 0.3 mm inner and 0.6 mm outer diameter. The geometries of the Al tube are chosen in order to respect the coil design parameters and to avoid damaging the brittle cable. The schematic of the scheme is reported in Figure 5. 3. It consists in two FBG sensors inscribed in a polyimide recoated fiber, one of them is integrated inside an Al tube for strain free conditions. The sensor in the tube is supposed to measure only temperature effects while the other both temperature and strain

_______Feasibility of strain and temperature monitoring with embedded FBG sensors
112
Figure 5. 3 Schematic of the scheme for strain and temperature discrimination in embedded configuration
A picture of the sample obtained integrating the FBG inside the Al tube in single ended configuration is shown in Figure 5. 4.
Figure 5. 4 FBG temperature sensor realized integrating a bare FBG inside the Al tube
In order to avoid any resin capillarity during the impregnation process and therefore to assure the FBG to be free from any mechanical load, the Al tube has been closed to one extremity with the adhesive Stycast and the fiber has been glued at the other extremity with the same glue. For the fiber protection at the edge of the stack, a Teflon® tube of 1 mm outer diameter has been used and it has been partially impregnated into the stack at the proximity of the edge.
For the strain monitoring the FBG has been integrated in direct contact with the cables. The two sensors have been placed in the middle and along the axial direction of the 180 mm long stack of 15 mm wide and 1.4 mm thick cables. The two sensors were laid in between two cables in opposite and symmetric locations, as shown in the cross section in Figure 5. 5. The stack instrumented with fiber optic sensors has been mounted in a dedicated stainless steel mould used for the epoxy injection and curing. The picture of the mould is shown in Figure 5. 6.

_______Feasibility of strain and temperature monitoring with embedded FBG sensors
113
Figure 5. 5 Cable stack inside the mould and FBGs loacation: trasversal cross section
The experimental set up is completed using one more FBG temperature sensor monitoring the ambient temperature during the entire impregnation process. Also in this case a 5 mm long grating FBG written in fully polyimide recoated fiber has been used for the experiment.
The fiber optic sensors have been used to monitor continuously both the epoxy injection in the vacuum chamber and the curing cycle in the oven. Two K - Type thermocouples have been also used for temperature monitoring of the mould and the ambient temperature in order to compare the readings from the two technologies.
Figure 5. 6. Pictures of the mould. The thermocouple location is indicated
Figure 5. 6 shows the mould used for the stack impregnation and the location of the thermocouple used for monitoring the temperature of the mould. There is no direct measurement of the temperature inside the stack performed with resistive sensors.

_______Feasibility of strain and temperature monitoring with embedded FBG sensors
114
5.4.2 Experimental results of the impregnation monitoring
Following the standard fabrication procedure used for the coils, the stack has been impregnated in the following two steps:
1. during the epoxy injection in the mould at a stable temperature of 60 °C after 18 hours vacuum pumping to 6*10^-1 mbar,
2. during the epoxy curing cycle of 5 hours at 110 °C and a post curing phase of 16 hours at 125 °C.
The epoxy used for the stack is the CTD – 101K type commercial resin.
Figure 5. 7a shows the wavelength shift of the tree FBGs during the first phase of injection under vacuum conditions and rising temperature. During this phase the wavelength shift reported by the FBG in contact with the resin (named strain FBG embedded) is due to the thermal responses of the surrounding material. Differently, the FBG inside the Al tube, being not in direct contact with the same materials, is responding to temperature changes through the thermal conductivity of the Al.
Figure 5. 7 (a) Wavelength shift during the resin injection in the vacuum chamber; (b) FBG temperature reconstruction of the injection phase
Figure 5. 7b reports the temperature reconstruction of the temperature sensors in comparison with the thermocouples, which are located inside the mould and inside the chamber. The computed temperature for the FBG sensors has been obtained using a temperature sensitivity of 10 pm/K from a previous characterization of the sensors in the range 300 - 230 K considering the linear behaviour of the wavelength with temperature variation in the range of interest.
(a) (b)

_______Feasibility of strain and temperature monitoring with embedded FBG sensors
115
The four temperature sensors are coherent in respect to their location. The FBG embedded inside the stack is in good agreement with the thermocouple measuring the temperature of the mould. The temperature measured by the FBG and the thermocouple placed in the chamber is slightly different in the transitory phase. This is explained by the fact that the sensors are not exactly in the same location inside the chamber. Furthermore, the difference in temperature between the mould and the chamber may be explained with the distance of the sensors from the heaters. Inside the chamber the heat is coming from the heaters located on the floor where the mould is placed. On the contrary, the FBG and the thermocouples used to monitor the ambient temperature are located in the middle of the chamber thus reading a lowest temperature.
After the mould is filled with the resin under vacuum conditions, the set-up is moved to the oven for the curing process. Figure 5. 8 shows the wavelength shift of the 3 FBGs during the curing. The behaviour of the FBG inside the Al tube (green curve in Figure 5. 8a) is consistent with the behaviour of the FBG used for temperature monitoring in the oven showing the same wavelength shift for the same temperature change. This result validates the strain free condition of the FBG inside the Al tube for this process. On the contrary the output signal of the strain FBG embedded in the composite material in direct contact with the resin is responding differently during the process as well as at the end of the impregnation, when the wavelength does not come back to the initial value.
Figure 5. 8 Wavelength shift during the resin curing phase; (b) FBG and thermocouple temperature profile during the curing phase
The wavelength shift of the strain sensor is dominated by the resin thermal expansion which is clearly not affecting the sensor in the Al tube.
The embedded FBG are able to monitor the exothermic peak due to the reaction between the resin and the hardener at 110 °C. At this point, the hardness process of the resin starts to be then completed during the 16 hours of post curing. During the isothermal post curing phase, the induced strain transferred to the embedded strain sensor is due to the
(a) (b)

_______Feasibility of strain and temperature monitoring with embedded FBG sensors
116
bonding effect between the polymer and the fiber which becomes more effective owing to the increasing stiffness developed by the resin.
At the end of the process, the strain sensor is then affected by the residual strain accumulated between the fiber and the host material inducing a total wavelength shift of -1.5 nm respect the beginning of the process as shown with the magenta curve in Figure 5. 8a. Due to the compressive effect of the resin on the sensor, the strain sensor does not go back to its initial condition before the curing process.
The temperature reconstruction for the FBG temperature sensors is reported in Figure 5. 8b with the temperature reading of the thermocouples. As for the vacuum chamber, one thermocouple is installed in the mould and the other one is used to monitor the ambient temperature inside the oven. Slight difference in the dynamics is coherent with the locations of the sensors especially at 110 °C when the exothermic reaction is only measured by the FBG embedded and the thermocouple in the mould as shown in Figure 5. 9. The temperature readings of the two technologies are consistent.
Figure 5. 9 Exothermic peak at 110 °C measured by the FBG inside the Al tube and the thermocouple inside the mould
The validation of the strain-free condition is also confirmed by the comparison of the spectra before and after the impregnation process. Figure 5. 10 shows the Bragg spectra of the strain and temperature FBG embedded before and after the impregnation, at room temperature. As expected, the axial residual stress applied by the composite material to the strain sensor after the impregnation process is evident from the shift of the spectrum toward lower wavelength in Figure 5. 10a. On the contrary, from Figure 5. 10b the temperature sensor inside the Al tube does not experience any shift in wavelength confirming its free condition from any applied strain.

_______Feasibility of strain and temperature monitoring with embedded FBG sensors
117
Figure 5. 10 Reflection spectra before and after the impregnation for both the strain and the temperature FBG sensors
The spectra do not show any distortion or birefringence effect. The good quality of the measurements allows the validation of both the integration procedure and the solution used to realize a temperature sensor in embedded configuration. The shape of the spectra also shows that the installation and the impregnation process do not introduce transverse stresses to the strain sensor.
In Figure 5. 11 photographs of the mould filled with the epoxy before the curing process and the stack after de-mould are reported.
Figure 5. 11 Pictures after the injection phase, before the curing (above), and after the curing and demolding (below).
(a) (b)

__________________________________________ Sensors integration in the magnet
118
Further tests may be required to validate the use of the temperature sensor in embedded configuration when the stack is cooled to cryogenic temperatures and subjected to stresses up to 150 MPa. This procedure applied to the cables stack would reproduce the whole coil fabrication process and service life allowing a further instrumentation of the embedded sensors in the real Nb3Sn coils.
Sensors integration in the magnet
5.5.1 Bonded FBGs on the magnet structures
No standard procedure is known for gluing fiber optic sensors for cryogenic applications so far. Therefore it was decided to use the glue and gluing procedure used for the resistive strain gauges. After the preparation of the surface, eight FBGs of 10 mm grating inscribed in fully polyimide recoated fibers were glued on the shell (Al cylinder, the external surface of the magnets) with commercial araldite (two-part adhesive resin) and left for 24 hours under pressure to complete the bonding process minimizing the glue thickness between the sensor and the host material. The sensors were arranged in 4 arrays placed in transversal and longitudinal directions, shown in Figure 5. 12b on two opposite sides of the magnet, four sensors for each side. Two opposite points of measurements have been chosen in the middle of the length of the cylindrical structure, few centimetres far from the resistive strain gauges. Figure 5. 12c shows one side of the magnet where the sensors are located and the fibers protected with a Kapton foil. The choice of this location is driven by the fact that the arising azimuthal forces during the powering are directed towards the mid-plane, where the accumulated stress reaches its peak at high field.
Figure 5. 12 (a) FBG glued on the Al sample; (b) FBGs glued on the shell in the azimuthal and axial directions; (c) RMC magnet; (d) magnet’s components during assembly [9].
(a)
(b) (c) (d)

__________________________________________ Sensors integration in the magnet
119
The set up was completed with one free FBG for temperature monitoring and one FBG glued on a rectangular Al sample free from any mechanical stress shown in Figure 5. 12a [9]. The thermal contraction experienced by the Al sample during the cool down may be used to correct the thermal apparent strain of the structure. This allows deriving the mechanical strain provided to the shell by the differential thermal contraction of the several magnets components (Figure 5. 12d) and will be discussed in section 5.5.2.
The sensors arranged in arrays have been read out in a Wavelength Division Multiplexing (WDM) scheme by means of the four channels of the optical interrogator Micron Optics SM125 and the module SM041 Channel Multiplexer in order to read six arrays [9].
Figure 5. 13 Reflection spectra of the FBGs glued in the azimuthal and axial directions before and after the bonding process on one side of the magnet [1].
Figure 5. 13a and b show the reflection spectra of two FBGs arrays bonded in azimuthal and axial directions before and after the gluing process. The absence of birefringence shows that the bonding layer homogeneously stresses the sensors along their length.
The feasibility of the bonded FBGs for the study of the magnet structural behaviour has been performed through the main life steps, assembly, cool down and powering, as it will be discussed in the section 5.6.
5.5.2 Embedded FBGs in Nb3Sn race track coils
A double layer “coil pack” of dimensions 500 x 193.6 x 31.7 mm has been used for the integration and the embedding of two 10 mm long FBG sensors inscribed in two fully polyimide recoated fibers. The sensors were laid between the first and the second turn of the winding close to the Ti pole as shown in Figure 5. 14b. The two sensors have been placed each one for each layer, in a symmetric configuration as shown in the cross section of Figure 5. 15.
(a) (b)

__________________________________________ Sensors integration in the magnet
120
Figure 5. 14 (a) Racetrack coli before impregnation; (b) location of strain gauges on the Ti pole, voltage taps and fiber on the winding.
In order to monitor the strain in the axial direction of the coil, particular care has been taken to ensure that the sensors were located along the axial direction in the middle of the 160 mm straight section. In this location the cable is subjected to the maximum transverse stress during assembly and cool down and the quench location is expected during the powering due to the highest magnetic field in that zone [1].
Figure 5. 15 SMC coil transvers cross section (view from the inside) and FBGs location between the first and the second turn of winding on the upper and lower layer [10]
Figure 5. 16a and b show the reflection spectra of the two FBGs before and after the impregnation process. The signals are recorded at the same temperature, therefore the shift to lower wavelengths obtained after the impregnation process shows the overall longitudinal compression of the sensors due to the compressive stress impressed on them by the composite material. This compression effect is more evident on FBG1 which shows a shifted wavelength of 280 pm in respect to the 80 pm wavelength shift of FBG2. This difference between the two sensors can be explained by their different locations and
(a) (b)

__________________________________________ Sensors integration in the magnet
121
thus the resin thickness surrounding as well as the misalignment of the FBG along its measuring axis [10]
Figure 5. 16 Reflection spectra of the FBG on the winding before and after the embedding
The coil was also instrumented with voltage taps and resistive strain gauges as shown in Figure 5. 14b. In particular for the strain gauges, dedicated cavities have been machined in the Ti pole in order to prevent any damages of the sensors during assembly of the magnet. Furthermore, because of their size and cross section, their installation directly on the winding would be cumbersome rather than placed on the Ti pole. For comparison the same configuration on the Ti pole was also adopted for the FBGs in order to monitor the pole transversal strain. For this configuration FBGs of 5 mm grating length in fully polyimide recoated fibers were chosen and glued close to the cavity dedicated to the strain gauge location (Figure 5. 17a) with araldite. Figure 5. 17b shows the reflection spectra of the FBG before and after the impregnation process. The signals are recorded at the same temperature therefore the shift to lower wavelengths obtained after the impregnation process shows axial compressive stress impressed on the sensors by the material. The total shift of 600 pm for the sensor on the Ti pole after the impregnation, in comparison to the sensors located on the winding, can be due to the different induced stresses from the different materials where the sensors are located. The sensor on the pole is additionally affected by the glue used to fix it to the Ti which is not used for fixing the sensor on the winding. Moreover, after the coil impregnation, an attenuation of the spectra is also visible that may arise from a permanent bending of the fiber during the impregnation process. The fiber integration in the coil has required particular care in protecting the fiber at the sharp coil edges. Dedicated grooves have been fabricated in the Ti structure in order to guide the fibers towards the edge of the coil and to save them from any damage when the coil needs to be closed in the mould for its impregnation. In order to assure their integrity from the edge of the coil to the connectors, the fibers have been protected with a Teflon® tube of 1 mm outer diameter placed in the dedicated groove in the Ti structure.
(a) (b)

__________________________________________ Sensors integration in the magnet
122
Figure 5. 17 (a) Picture of the FBG location on the Ti pole close to the strain gauge; (b) refelction spectra before and after the impregnation process
After the instrumentation, the coil is placed in the mould for its impregnation process as shown in Figure 5. 18. Following the standard fabrication process of the Nb3Sn coils, firstly the coil is placed in a vacuum tank for the resin injection at 60 °C. The resin used is a mix of epoxy resin and polyetheramine hardener that require a curing cycle at 125 °C to complete the process [2]. A picture of the coil after the impregnation process is shown in Figure 5. 18b.
Figure 5. 18 Pictures of the case used to hold the coil inside the mold for the impregnation (above) and the race track coil after the impregnation (below).
The fiber integration inside the superconducting coil plays a relevant advancement of the FBG technology applied at the superconductivity field. The complexity of the embedding
(a) (b)

________________________________________ Magnet behaviour characterization
123
in the magnet assembly may damage the fibers if they are not protected carefully. Moreover, the FBG location requires particular care both to save the brittle coil and to prevent the FBG from not uniform strain along its length affecting the signal quality.
Magnet behaviour characterization
5.6.1 Assembly at room temperature
The magnet assembly at room temperature has been followed by monitoring the mechanical behaviour of the supporting Al structure. Figure 5. 19a and b show the change in wavelength with the mechanical deformation of the shell during the first assembly of the dummy coil in both azimuthal and axial direction. Then the coil pack has been inserted in the yoke and the surrounded shell, four lateral bladders were slide between the yoke and coil pack. By monitoring the shell strain, the bladders are pressurized gradually forcing the yoke against the shell inner surface up to 20 MPa, target defined by the FEM model. The final gain is then achieved increasing the size of the interference keys with shims. The expansion in the azimuthal direction explained by the red shift of λB in Figure 5. 19a is corresponding to a contraction and the consequently blue shift in the axial direction shown in Figure 5. 19b.
Figure 5. 19 Wavelength variations during assembly in the azimuthal (a) and axial (b) directions compared to the strain gauges’ measurements
The small variation in strain as well as in wavelength shift in the axial direction is coherent with the mechanics since the pre load of the coil pack using bladders and keys is mainly performed in the azimuthal direction. The data shown in Figure 5. 19a refer to both the sensors located on side 1 in the azimuthal direction while Figure 5. 19b shows the two FBGs in the axial direction on the same side.
(a) (b)

________________________________________ Magnet behaviour characterization
124
The same response to the bladder and keys operation is shown also by the azimuthal FBGs on side 2 reporting in this case 20% less in wavelength shift. This is anyway in agreement with the strain gauges measurements, which report 23% strain difference between the two sides. In Figure 5. 20 it is clearly shown the linearity of the azimuthal FBGs responses with the azimuthal strain during the assembly at room temperature on both the sides of the magnet.
Figure 5. 20 Azimuthal FBGs' wavelength shift versus azimuthal strain during assembly
By deriving the obtained λ-ε curves, the strain sensitivity Sε is found to be 0.7 pm/με for FBG AZ1 up and 0.8 pm/με for FBG AZ1 down. The same analysis has been performed for the azimuthal sensors on side 2 bringing to a sensitivity of 0.8 pm/με for both the FBGs. Using these values of sensitivity the strain measured by the FBGs can be computed and the results are shown in Figure 5. 21a and b together with the values measured by the resistive, conventional strain gauges [9].
Figure 5. 21 FBG and strain gauges’ strain deformation on the magnet shell in the azimuthal and axial directions during assembly
(a) (b)

________________________________________ Magnet behaviour characterization
125
The FBGs computed strain variation after the assembly on both sides of the magnet is reported in Table 1 in comparison with the measurements from the resistive strain gauges.
Table 3 Computed strain variation after the assembly
FBG Side 1 Strain gauge Side 1 FBG Side 2 Strain gauge Side 2 1839 με 1679 με 1365 με 1343 με 1835 με 1388 με
The difference between the strain gauges and the FBGs may be due to the different locations on the structure of the magnet or to the different effect of the glue substrate in both the technologies. Nevertheless the agreement between FBGs located on the same side may validate the gluing process at room temperature.
5.6.2 Cool down to 77 K and 1.9 K
a. Cool down to 77 K
After the assembly at room temperature, two cool down to 77 K are performed in order to study the mechanical properties of the magnet’s components. The fibers are installed in the cryostat to measure the ambient temperature, whereas some are glued on Al samples and while the others sensors are glued on the shell of the structure.
The glued FBGs responses during the second 30 h cool down and 140 h warm up are shown in Figure 5. 22a and b in double axis with a carbon ceramic sensor (CCS) located in the same place of the free FBG sensors.
In Figure 5. 23a four of the 10 sensors- wavelength shifts are shown in function of the temperature during the warm up in order to evaluate the different effects in the four configurations: FBG glued on the shell in the azimuthal direction (FBG AZ 1 up), FBG glued on the shell in the axial direction on the same side (FBG AX 1 left), FBG free in the liquid Nitrogen bath (FBG T sensor) and FBG glued on the Al sample. For the free FBG without substrate the wavelength shifted only by -1.4 nm for the temperature change from 300 to 77 K. Differently, the wavelength variation of the bonded FBGs is dominated, as expected, by the induced strain related to the thermal contraction of the host material, the Al sample and the shell.

________________________________________ Magnet behaviour characterization
126
Figure 5. 22 Wavelength shifts during cool down from 300 K to 77 K (a) and warm up (b) for the FBGs in Az and Ax direction, the FBG glued on the Al sample and the free FBGs in
the LN bath, compared to the Carbon Ceramic Sensor (CCS)
The FBG glued on the rectangular Al sample shows the effect of the temperature – induced apparent strain reaching a wavelength shift of -6.1 nm for that temperature range. On the other hand, in addition to the thermal apparent strain, the responses of FBGs glued on the magnet structure also take into account the effect of the differential thermal contraction of the Al shell with respect to the iron yoke that is enclosed. This effect induces a smaller variation in wavelength in both azimuthal and axial directions respectively of -5.5 and -5.8 nm. The small strain variation between Al sample and shell is expected as the shell imposes its deformation to the hard iron yoke and the soft coils, which is the goal of the presence of the thick Al shell for azimuthal pre-stress and the Al tie rods for the axial press-tress.
Figure 5. 23 (a) Wavelength shift respect to temperature in different locations; (b) wavelength shift in the Az direction for the two thermal cycles.
The bar chart in Figure 5. 23b summarizes the wavelength shift of the FBGs in the azimuthal direction during the two thermal cycles showing the reliability of the fibers and the bonding process at cryogenic temperature.
(a) (b)
(a) (b)

________________________________________ Magnet behaviour characterization
127
The strain measured by the fiber glued on a host material during the cool down is the result of both thermal and mechanical induced strain: the first ε𝑠𝑠𝑡𝑡ℎ is due to the thermal contraction experienced by the Al structure (𝛼𝛼𝐴𝐴𝐴𝐴 ∆𝑇𝑇), the second ε𝑠𝑠𝑚𝑚 = 𝜎𝜎𝑠𝑠/𝐸𝐸𝐴𝐴𝐴𝐴 .is given by the effect on the structure of the differential thermal contraction of the magnet elements surrounded by the structure itself.
εs = ε𝑠𝑠𝑡𝑡ℎ + ε𝑠𝑠𝑚𝑚 = 𝛼𝛼𝐴𝐴𝐴𝐴 ∆𝑇𝑇 + 𝜎𝜎𝑠𝑠𝐸𝐸𝐴𝐴𝐴𝐴
(5- 1)
Once the measured strain of the Al structure εs is corrected from the thermal contribution 𝛼𝛼𝐴𝐴𝐴𝐴 ∆𝑇𝑇 it is possible to identify the mechanical induced strain of the structure and thus, the stress 𝜎𝜎𝑠𝑠 to which the structure is subjected.
The behaviour of the FBG bonded on a host material, as explained in Chapter 3 in the eq. (3-19), is depending on the mismatch of the thermal expansion coefficients between the fiber and the host material.
∆𝜆𝜆𝐴𝐴𝐴𝐴𝜆𝜆𝐴𝐴𝐴𝐴
= �(1 − 𝑝𝑝𝑒𝑒)(𝛼𝛼𝐴𝐴𝐴𝐴 − 𝛼𝛼𝐹𝐹) + 𝛼𝛼𝐹𝐹 + ξ�∆𝑇𝑇 (5- 2)
However, in the case of FBG bonded on the magnet structure subjected to a mechanical induced strain ε𝑠𝑠𝑚𝑚, the total wavelength variation takes into account the contribution of
the thermal contraction of the material ∆𝜆𝜆𝐴𝐴𝐴𝐴𝜆𝜆𝐴𝐴𝐴𝐴
effected by the ε𝑠𝑠𝑚𝑚 as following
∆𝜆𝜆𝑆𝑆𝜆𝜆𝑆𝑆
= (1 − 𝑝𝑝𝑒𝑒)ε𝑠𝑠𝑚𝑚 + (1 − 𝑝𝑝𝑒𝑒)(𝛼𝛼𝐴𝐴𝐴𝐴 − 𝛼𝛼𝐹𝐹)∆𝑇𝑇 + (𝛼𝛼𝐹𝐹 + ξ)∆𝑇𝑇 (5- 3)
Similarly to the strain gauges, the thermal contribution due only to the Al thermal contraction can be considered, in first approximation, to be measured by the sensor glued in the Al sample free from any applied strain. This contribution can be considered at stable temperature when it is assured that the Al structure and the sample are both well thermalized.
The mechanical strain induced by the yoke on the Al shell can now be written as:
Assuming the same temperature sensitivity for all the FBG under test and the strain sensitivity (1 − 𝑝𝑝𝑒𝑒) constant with the temperature [11] obtained during the assembly phase, the induced mechanical strain variation after the cool down measured by the FBGs and strain gauges in the same locations is summarized in the table:
ε𝑠𝑠𝑚𝑚 =1
(1 − 𝑝𝑝𝑒𝑒) �∆𝜆𝜆𝑆𝑆𝜆𝜆𝑆𝑆
−∆𝜆𝜆𝐴𝐴𝐴𝐴𝜆𝜆𝐴𝐴𝐴𝐴
� (5- 4)

________________________________________ Magnet behaviour characterization
128
Table 4 Computed strain variation after cool down
FBG Side 1 Strain gauge Side 1 FBG Side 2 Strain gauge Side 2 1000 µε 1180 µε 625 µε 355 µε 930 µε 685 µε
On side 1 the FBGs and the strain gauges are in agreement but it cannot be concluded the same for side 2. Nevertheless the agreement between FBGs located on the same side may validate the gluing process also at cryogenic temperatures.
b. Cool down to 1.9 K
After the mechanical design has been validated through the thermal cycles to 77 K and the magnet assembly is completed with the Nb3Sn coils, the cool down to 1.9 K is performed for the mathet powering test.
Figure 5. 24a and b show the change in wavelength during the cool down from 300 to 1.9 K and the warm up for the two embedded sensors in the axial direction on the SMC coil winding. The response of the sensors is dominated by the thermal apparent strain induced by the thermal contraction of the host material which explains the blue shift of λ reaching a total shift of - 4 nm.
Figure 5. 24 Wavelength shift during cool down (a) from 300 K to 1.9 K and warm up (b) of the FBG embedded on the SMC winding
The observed thermal behaviour, at low temperatures, is dominated by the epoxy resin contraction. Furthermore the Al shell provides additional pre-stress to the coil by differential thermal contraction with the coil pack. The data reported in Figure 5. 24a and b provide information of the coil thermo–mechanical behaviour following the evolution of its strain during an entire thermal cycle (cool down to 1.9 K and warm up to 300 K). In fact, the wavelength shift in Figure 5. 24b differs of 250 pm
(a) (b)

________________________________________ Magnet behaviour characterization
129
from the values at the same temperatures in Figure 5. 24 b, showing the change in strain due to an overall relaxation of the coil after tests made at 1.9 K and a complete thermal cycle. As expected from the magnet mechanics, motions of the wires, friction and cracks in the resin due to the powering and the stress release during the warm up, can set the coil to a slightly different strain from the original one.
Figure 5. 25 Wavelength shift of the embedded sensors during four cool down [10].
Despite the complex integration in the coil the fibers survived to four thermal cycles to 1.9 K and 4.2 K. In the bar chart of Figure 5. 25 the computed wavelength shift for both sensors at each cool down is reported, showing the reproducibility of the data during the four runs and the reliability of the fibers during the whole test campaign allowing a complete monitoring of the coil mechanical behaviour during its operation.
5.6.3 Powering and quench monitoring
a. Response of bonded FBGs on the magnet structure
As part of the standard test procedure, after the cool down to 1.9 K, the magnet is powered and trained. In the field of superconducting magnets “training” is used to refer to a set of quenches performed in the same run (thermal cycle), in which ideally the quenches occur each time at higher current thanks to a mechanical settling of the magnet. With the bonded and embedded sensors it was possible to monitor the mechanical behaviour of both the shell and coils during this phase. During this process the coils have been powered with a maximum of 20 kA DC current.

________________________________________ Magnet behaviour characterization
130
Figure 5. 26 Bonded FBGs responses during powering to 20 kA at 1.9 K on the azimuthal (a) and axial (b) directions.
Figure 5. 26 a and b show an example of FBG response in the azimuthal and axial directions to the current ramp and the quench event, after which the current is discharged for magnet protection. The increase of the wavelength during the current ramp followed by a sharp decrease after the quench explains the effects of the coil stress release on the magnet structure. The maximum shift of 0.033 nm reached for a maximum current of 20 kA in both directions corresponds to a maximum strain variation of 40 µε using the strain sensitivity derived from the assembly, considering it constant and independent of temperature as reported in [11].
b. Response of embedded FBGs inside the coil
The mechanical behaviour of the coil has been monitored while the magnet was powered with current ramped at 50 A/s to 8 kA and then at 10 A/s to the quench current achieving a record magnetic field of 13.5 T [3]. Figure 5. 27 a and b shows the change in wavelength of the two FBGs along the longitudinal direction to a series of current ramps and quenches at around 15.5 kA. In response to the powering, the coil releases the pre-stress achieved after the assembly and the cool down expanding in its axial direction, while after each quench, when the current is discharged, the coil returns to the original strain it had before the powering [10].
Source of slight difference between the two sensors may be their different location as well as the misalignment of the FBG along its measuring axis, the resin thickness surrounding and the movement of the cables.
(a) (b)

________________________________________ Magnet behaviour characterization
131
Figure 5. 27 Wavelength responses of the embedded FBG 1 (a) and FBG 2 (b) during a series of current ramps and quenches at 15.5 kA [10].
This is illustrated in more details in Figure 5. 28 for the first quench of the series of FBG 1 where the current profile is also plotted, showing the increase of the wavelength during the ramp followed by a sharp decrease after the quench. Before the quench event, while the current is ramping up, the strain variation is due to the increase of the electromagnetic forces (proportional to I2) while the temperature is constant. After the quench, as consequence of the quench itself, apart from stress changes, there is also a slow temperature variation. In fact, due to the Joule heating in the zone of the quench initiation, the temperature increases from the hot spot, explaining why the wavelength doesn’t go back to the original value it had before the powering as fast as the current drops to zero.
Figure 5. 28 Wavelength variation of the embedded FBG on the winding during powering to 15.5 kA at 1.9 K
For the new magnets currently built at CERN, tests are needed to validate the embedded temperature sensor presented in section 5.2. The configuration of a strain FBG and a temperature FBG inside the Al tube (free from any applied strain) would help in
(a) (b)

________________________________________ Magnet behaviour characterization
132
monitoring separately the strain profile (during ramping and after quench) and the hot spot temperature (after quench).
A comparison between the sensor on the winding and the one glued on the Ti pole for the strain monitoring in the azimuthal direction is showed in Figure 5. 29a and b. The quench considered is not at the same current, being the acquisitions of the two sensors at different moments. Considering a maximum current of 14.33 kA the sensor on the winding measures a wavelength variation ∆λ= 550 pm along the coil longitudinal direction. For a maximum current of 14 kA the sensor on the Ti pole measures a ∆λ= 1886 pm along the azimuthal direction of the coil. Using the theoretical strain sensitivity of 1.2 pm/με and considering the constant temperature during the magnet ramp up, the corresponding strain values result 460 and 1572 µε respectively in the axial and transversal direction of the coil. This difference in the measurement in the two directions is not surprising and it is in line with the mechanical expectations of the magnet [12] [13].
Figure 5. 29 Wavelength variation of the embedded FBG on the winding (a) in the axial direction and on the Ti pole (b) in the transversal direction during powering
The results obtained are in agreement with the expected global behaviour of the magnet, but no reference data from strain gauges can be reported since they resulted to break during the test.
Nevertheless an interesting comparison may be considered using the expected strain values provided by the magnet Finite Element Model (FEM). Considering the constant temperature during the magnet ramp up and the theoretical sensitivity of 1.2 pm/με, for a current of 14.3 kA the measured values of FBG 1 and FBG 2 in the longitudinal direction were respectively 460 µε and 420 µε in respect of the expected theoretical value of 638 µε [10].
Further investigations are needed to validate both strain and temperature measurements in the superconducting magnet. Nevertheless, the results so far obtained are remarkable
(a) (b)

___________________________________________________________ Conclusions
133
showing the capability of the FBG sensors to follow the entire service life of the magnet from fabrication to operation.
Conclusions The Chapter presented the feasibility study of the use of the FBG sensors for monitoring the magnets service life.
In order to perform coherent measurements it has been necessary to deal with two main issues: the fiber integration in the complex magnet structure and the strain-temperature discrimination in embedded configuration. Two approaches have been chosen: to integrate the sensors and to monitor the mechanical behaviour of the magnet. This led us to tow different techniques of integration: gluing and embedding. More precisely, the sensors have been glued on the magnet Al supporting structure and embedded in the magnet Nb3Sn coil before the impregnation process. The repeatability of the measurements over different thermal cycles and the agreement with the expectations validates both the bonding and embedding process. The FBG sensors result to be a viable complementary technology to the standard sensor being able to perform structural health monitoring on the magnet structure and quench monitoring within the coils at low temperature and in the presence of high magnetic field (up to 13.5 T).
Furthermore, the feasibility study performed in the cables stack configuration has given encouraging results on the possibility to embed a temperature FBG sensor. The approach to use a capillary Al tube where the FBG is integrated free from any applied strain enables the temperature monitoring in embedded configuration. The results on the stack impregnation process open perspectives to the implementation of a hot spot temperature monitoring system directly located on the Nb3Sn cable and to the development for a compensation scheme for the strain monitoring.

134
References
[1] A. Chiuchiolo, M. Bajko, J. C. Perez, H. Bajas, M. Consales, M. Giordano, G. Breglio and A. Cusano, "Fiber Bragg Grating Cryosensors for Superconducting Accelerator Magnets," Photonics Journal, IEEE, vol. 6, no. 6, pp. 1-10, 2014.
[2] M. Bajko, "An R&D Program Towards Nb3Sn Accelerator Magnets," IEEE Transactions on Applied Superconductivity, vol. 22, pp. 4002704-4002704, 2012.
[3] J. C. Perez, M. Bajko, H. Bajas, B. Bordini, A. Chiuchiolo, P. Ferracin and X. Sarasola, "Performance of the Short Model Coils Wound With the CERN 11-T Nb 3 Sn Conductor," Applied Superconductivity, IEEE Transactions on, vol. 25, no. 3, pp. 1-5, 2015.
[4] E. Fornasiere, "Status of the Activities on the Nb3Sn Dipole SMC and of the Design of the RMC," IEEE Transactions on Applied Superconductivity, vol. 23, pp. 4002308 - 4002308, 2013.
[5] S. Caspi, S. Gourlay, R. Hafalia, A. Lietzke, J. O’Neill, C. Taylor and A. Jackson, "The use of pressurized bladders for stress control of superconducting magnets," IEEE Transaction on Applied Superconductivity, no. 11, pp. 2272,2275, 2001.
[6] H. Bajas, M. Bajko, V. Benda, L. Bottura, G. Bourgeois, M. Charrondiere, A. Chiuchiolo, P. Ferracin, M. Guinchard, J. E. M. Garcia, C. Giloux, M. Juchno, J. C. Perez, G. d. Rijk, P. Viret and D. T. Ziemianski, "Test Set-Up for the Cooling of Heavy Magnets by Controlled Way Down to 77 K," Physics Procedia, vol. 67, pp. 331-337, 2015.
[7] H. Bajas, M. Bajko, L. Bottura, J. C. Perez, S. I. Bermudez, B. Bordini and G. Willering, "Quench Analysis of High Current Density Nb3Sn Conductors in Racetrack Coil Configuration," IEEE Transaction on Applied Superconductivity, vol. 25, no. 3, pp. 1,5, 2015.
[8] H. Zhang, F. Deng, Q. Wang, L. Yan, Y. Dai and K. Kim, "Development of Strain Measurement in Superconducting Magnet through Fiber Bragg Grating," IEEE Trans. Appl. Superconductivity, vol. 18, no. 2, pp. 1419-1422, 2008.

135
[9] A. Chiuchiolo, M. Bajko, J. C. Perez, H. Bajas, M. Guinchard, M. Giordano, G. Breglio, M. Consales and A. Cusano, "Structural Health Monitoring of Superconducting Magnets using Fiber Bragg Grating Sensors," in EWSHM - 7th European Workshop on Structural Health Monitoring, Nantes, 2014.
[10] A. Chiuchiolo, M. Bajko, J. C. Perez, H. Bajas, P. Viret, M. Consales, M. Giordano, G. Breglio and A. Cusano, "Fiber Bragg grating sensor as valuable technological platform for new generation of superconducting magnets," in Proc. SPIE 9157, 23rd International Conference on Optical Fibre Sensors, 2014.
[11] S. James, R. Tatam, A. Twin, M. Morgan and P. Noonan, "Strain response of fibre Bragg grating sensors at cryogenic temperatures," Meas. Sci. Technol., vol. 13, no. 1535, 2002.
[12] C. Kokkinos, J. C. Perez, M. Karppinen, P. Manil, F. Regis, M. Guinchard and M. Bajko, "The SMC (Short Model Coil) Program: FE Analysis With 3D Modeling," Applied Superconductivity, IEEE Transactions on, vol. 22, no. 3, pp. 4900705-4900705, 2012.
[13] H. Bajas, G. Ambrosio, M. Anerella, M. Bajko, R. Bossert, S. Caspi and M. C. Yu, "Cold Test Results of the LARP HQ Quadrupole Magnet at 1.9 K," Applied Superconductivity, IEEE Transactions on, vol. 23, no. 3, pp. 4002606-4002606, 2013.
[14] J. D. James, J. A. Spittle, S. G. R. Brown and R. W. Evans, "A review of measurement techniques for the thermal expansion coefficient of metals and alloys at elevated temperatures," Measurement Science and Technology, vol. 12, no. 3, 2000.

136

137
Conclusions
The luminosity upgrade of the Large Hadron Collider (HL - LHC) requires a remarkable technology development concerning the design and the fabrication of the new superconducting magnets and power transmission lines but also the instrumentation which these devices need. Advanced instrumentation for monitoring strain and temperature results a valuable help for fabrication process validation and for monitoring the devices conditions during operation. The well assessed traditional sensing technologies based on electrical sensors still suffer from the number of electrical wires and the complex compensation of magnetic and thermal effects.
Fiber optic sensors based on the Fiber Bragg Grating (FBG) technology have been proposed in this work as alternative or complementary instrumentation for cryogenic temperatures and superconducting magnets with their advantages due to the multiplexing capability (one wire for several sensors), their transparency for magnetic field and heat transmission.
One of the main challenges and objectives of this work has been the selection, the development and the characterization in the range 300 – 4.2 K of coated FBG sensors to be used for the environmental temperature monitoring of cryogenic devices, since commercially available FBG sensors are not suitable for cryogenic temperature.
In parallel, a challenging integration of the FBGs inside the superconducting magnet has been also performed for the study of its thermo-mechanical behaviour when subjected to wide temperature variation (400 – 1.9 K), strong magnetic field (up to 13 T) and high mechanical stresses (up to 200 MPa). A solution for the temperature – strain discrimination in embedded configuration within Nb3Sn superconducting cables has been also proposed and a first successful trial done.
The FBG sensors integration has been driven by the design and fabrication constraints for each device under test. A part of the main difficulties presented before regarding the environment, it has been necessary to develop also protection solutions for handling the fibers in order to avoid damages which could affect the reading of the signals.

___________________________________________________________ Conclusions
138
Although the technology proposed is the same for several applications, each one required different approaches for the sensors’ design and set up facing the common complexity deriving from the cryogenic environment and the superconductivity.
For the first application, the temperature monitoring in the power transmission lines, the work has been addressed firstly to the material selection, the sensors geometry definition and then to their validation in real operating conditions. Experimental tests performed in controlled conditions have been carried out in order to select the proper material able to increase the FBG temperature sensitivity down to 4.2 K. Through accurate characterization of PMMA and epoxy samples in the range 300 – 4.2 K the achievement of this work has been to extend the operative temperature range of the coated FBG down to 7 K with a sensitivity of 2 pm/K (for PMMA) and to 9 K with 1 pm/K (for epoxy) in respect to the 4 pm/K at 15 K (reached with metal coating) reported in literature.
Comparative studies were also performed to analyse the effects of the coating size on the sensor performance. For the use in the before described devices the optimum solution is the minimized size. The results highlighted that the size chosen for the optimized device does not affect the performance of the sensors in terms of sensitivity down to 4.2 K.
The achievements on the development and the characterization have been followed by the validation of the technology in real application. Tests have been performed in the first 20-m-long power transmission line built and operated at CERN, where the coated FBG sensors have been used for monitoring the helium gas temperature in the cryostat in the range 300 – 30 K. The measurements show an agreement within < 1 K difference with the reference sensors. In parallel, as integral part of the thesis, the use of distributed optical fiber sensors based on Rayleigh scattering has been studied. Although further investigations are needed to increase the thermal sensitivity and coating effects, Rayleigh-based sensor results to be a viable solution for distributed monitoring above 30 K.
FBG sensors have been also proposed during this work for the structural health monitoring of the magnet during its service life and for the quench monitoring during operation.
Two approaches have been used for monitoring the strain in the superconducting magnets, one consisted in gluing the sensors on the magnet supporting structure, the other approach, probably the most challenging one, has been to embed the bare FBG inside the Nb3Sn coils before their filling with epoxy.
Experimental tests have been performed and monitored with the FOS at room temperature for the magnet assembly, down to 77 K for the magnet mechanical model validation, at 4.2 and 1.9 K for the magnet operation and the quench monitoring. The

___________________________________________________________ Conclusions
139
FBG measurements showed good repeatability along several thermal cycles and the reliability of the sensors after careful integration.
The implementation of the monitoring system can be considered successful in terms of potential and feasibility, nevertheless the validation of the FBG sensors as strain sensors for superconducting magnets still needs further tests and improvements.
It is however worth to underline that the FBG are able to monitor the strain variation along the axial direction of the Nb3Sn cables in close contact with the winding, for which purpose no other sensors are implemented.
As the discrimination temperature - strain represents the major complexity of this study, a feasibility study of a discrimination scheme has been also introduced in this work using cables stack configuration. The first validation of the use of this approach has been carried out by using FBG sensors during a cables stack impregnation process in the epoxy resin, which is part of the standard fabrication process of the coil. Although it requires further investigations, the preliminary results on the solution adopted has opened perspectives for future implementations directly within the coil. This approach would help in monitoring the hot spot temperature of the cable at the moment of the quench, which is so far only based on analytical assumptions and models.
In conclusion, fiber optic based sensors demonstrated to be a valid instrumentation technology for real scale and cutting - edges cryogenic applications, increasing the interest in using them in the field of superconductivity, especially for Nb3Sn and high temperature superconductors, opening the doors towards further promising investigations:
- Material science: new materials in the class of the polymers need to be selected in order to enhance the FBG sensitivity down to 4.2 K. Their characteristics have to meet the necessary fabrication requirements, design and dimensions.
- Sensor technology: FBG sensors implementation inside the Nb3Sn coils may be addressed to the qualification of the impregnation process by mapping the epoxy resin transition in several locations
- Optoelectronics: FBG sensors multiplexing capability and Rayleigh scattering based sensors can be used for the magnet quench localization during operation especially in the high temperature superconducting (HTS) magnets.
Lastly, and mostly challenging, a dedicated set up for the strain and temperature characterization can be implemented for both the strain characterization and the hot spot temperature model validation.