crustal structure of the northwestern basin and range ... structure of the northwestern basin and...
TRANSCRIPT

Crustal structure of the northwestern Basin and RangeProvince and its transition to unextended volcanic plateaus
D. W. LerchDepartment of Geological and Environmental Sciences, Stanford University, Building 320, Stanford, California 94305,USA
Department of Geophysics, Stanford University, Mitchell Building 353, Stanford, California 94305, USA
Now at Environmental Studies, Feather River College, 570 Golden Eagle Avenue, Quincy, California 95971, USA([email protected])
S. L. KlempererDepartment of Geophysics, Stanford University, Mitchell Building 353, Stanford, California 94305, USA
J. M. G. Glen and D. A. PonceU.S. Geological Survey, MS 989, 345 Middlefield Road, Menlo Park, California 94025, USA
E. L. MillerDepartment of Geological and Environmental Sciences, Stanford University, Building 320, Stanford, California 94305,USA
J. P. ColganU.S. Geological Survey, MS 989, 345 Middlefield Road, Menlo Park, California 94025, USA
[1] The northwestern margin of the Basin and Range Province is characterized by a transition from low-magnitude (�20%) extension in northwestern Nevada to relatively unextended volcanic plateaus innortheastern California. Seismic-velocity and potential-field modeling provides new control on theMesozoic-to-present tectonic evolution of this poorly understood portion of the U.S. Cordillera. Wedocument �20% crustal thinning associated with Basin and Range extension from a crustal thickness of�37 km under northeastern California to �31 km under northwestern Nevada that is consistent with theamount of extension recorded in the upper crust in northwestern Nevada, suggesting the crustal response toextension was relatively homogeneous over the entire crustal column. Our modeling also shows a well-defined, 80-km-wide zone of unusually low upper-crustal velocities (�5.9–6.1 km/s) that coincide withthe surface location of sparse Cretaceous granites, locating the elusive northern extension of the SierraNevada batholith through northwestern Nevada for the first time in the subsurface. Combining geologicaland geophysical data, we reconstruct the late Cretaceous-to-present crustal evolution of this region,documenting an interplay between magmatic addition to the crust, erosional exhumation, sedimentation,and extension that has reversed the direction of crustal thinning from a west-facing continental margin toan east-facing interior basin margin over this time interval. Finally, we find no evidence in northwesternNevada for unusually thick crust (>40 km) prior to Basin and Range extension.
Components: 3868 words, 12 figures, 1 table.
Keywords: Basin and Range; crustal seismology; gravity; transition zone; tectonics.
G3G3GeochemistryGeophysics
Geosystems
Published by AGU and the Geochemical Society
AN ELECTRONIC JOURNAL OF THE EARTH SCIENCES
GeochemistryGeophysics
Geosystems
Article
Volume 8, Number 2
23 February 2007
Q02011, doi:10.1029/2006GC001429
ISSN: 1525-2027
ClickHere
for
FullArticle
Copyright 2007 by the American Geophysical Union 1 of 21

Index Terms: 1299 Geodesy and Gravity: General or miscellaneous (1709); 7205 Seismology: Continental crust (1219);
8109 Tectonophysics: Continental tectonics: extensional (0905).
Received 24 July 2006; Revised 30 October 2006; Accepted 20 November 2006; Published 23 February 2007.
Lerch, D. W., S. L. Klemperer, J. M. G. Glen, D. A. Ponce, E. L. Miller, and J. P. Colgan (2007), Crustal structure of the
northwestern Basin and Range Province and its transition to unextended volcanic plateaus, Geochem. Geophys. Geosyst., 8,
Q02011, doi:10.1029/2006GC001429.
1. Introduction
[2] Despite extensive research over the last�100 years in the northern Basin and RangeProvince (Figure 1) [e.g., Emmons, 1907], itsnorthwestern margin remains little-studied. Thisregion is characterized by a transition from Basinand Range extension in northwestern Nevada tohigh volcanic plateaus in northwesternmostNevada, northeastern California, and southernOregon. Geologic and thermochronologic studiesdocument a later (�12 Ma), lower magnitude(�20%) extensional history in northwesternNevada [e.g., Colgan et al., 2004, 2006a] thanin the central portion of the northern Basin andRange (�30 Ma and 50–100%) [e.g., Gans et al.,1989; Best and Christiansen, 1991; Smith et al.,1991; Christiansen et al., 1992]. Despite minorupper-crustal extension across the northwesternmargin of the Basin and Range, previous nearbygeophysical surveys (COCORP 40�N and 1986PASSCAL surveys) suggested that crustal thick-nesses in this region (�30–32 km) are as thin orthinner than the more highly extended region tothe south (�30–36 km, Figure 1) [e.g., Klempereret al., 1986; Catchings and Mooney, 1991]. Westof this transition zone, Moho depth increases to38–40 km beneath the Modoc Plateau in northernCalifornia (Figure 1) [e.g., Zucca et al., 1986;Mooney and Weaver, 1989]. Because no dataexists across this transition zone between theunextended lava plateaus and the northwesternBasin and Range, the details of how the changein crustal thickness is accomplished are unknown.
[3] Two likely explanations for the phenomenonof thin crust in a region of low upper-crustalextension are (1) that the crust in the northwesterncorner of the Basin and Range was simply not asthick as that of central Nevada to begin with or(2) that strain has been heterogeneous with depth,allowing for significant lower-crustal thinningwith only minor upper-crustal extension. Resolu-tion of this question has important implicationsfor the nature of how extensional deformation
takes place in continental crust. In the centralportion of the northern Basin and Range, differen-tial strain between the upper and lower crust isthought to maintain homogeneous crustal thick-nesses despite local variations in upper-crustalextension [e.g., Gans, 1988]. On what length scalescan lower-crustal deformation decouple from upper-crustal deformation? If the northwestern margin ofthe Basin and Range possessed pre-extensionalcrustal thicknesses comparable to central Nevada(perhaps as much as �45–50 km [e.g., Smith etal., 1991]), then long-wavelength lower-crustal flowwould have been necessary to produce the modernMoho depths.
[4] To address the apparent discrepancy betweenthe magnitude of upper-crustal extension in thenorthwestern Basin and Range with respect to itssuspected thin crust, we collected a �300 kmseismic refraction/reflection/teleseismic profileand a �260 km potential field profile across thisportion of the Basin and Range, spanning thetransition to the unfaulted crust of the ModocPlateau (Figures 1 and 2). Our data document�20% crustal thinning associated with Basin andRange extension and are consistent with the low-magnitude extension (�25%) recorded at the sur-face, suggesting that extensional strain has beenapproximately homogeneous with depth across thisportion of the Basin and Range. In addition, weobserve no evidence in our survey area for thedistributed lower-crustal reflectivity commonlyattributed to large-magnitude ductile strain in thecentral portion of the Basin and Range [e.g.,Catchings, 1992]. Utilizing our data to reconstructthe evolution of the northwestern Basin and Range,we step backward through time, estimating therelative importance of various tectonic and mag-matic events from Late Cretaceous to the present.Our simple reconstruction offers a significantlydifferent image of crustal structure at �90 Ma,when the crustal thickness of the western end ofour survey area was less than the eastern end,opposite to its present-day configuration, and thethickest crust was only equal to the global conti-
GeochemistryGeophysicsGeosystems G3G3
lerch et al.: basin and range transition zone 10.1029/2006GC001429
2 of 21

nental average (�41 km [Christensen and Mooney,1995]).
2. Regional Geology and Geophysics
[5] The northwestern margin of the Basin andRange is characterized by limited exposures of allbut the most recent volcanic units because it isaffected by only a minor amount of surface fault-ing. East of the Sheldon Plateau (Figure 2), Paleo-zoic and Mesozoic sedimentary and volcanic rocks(described in more detail below) form the mostdeeply exhumed footwall portions of the tilted faultblocks. West of and including the Sheldon Plateau,no pre-Tertiary exposures are present along ourtransect, and the only Paleogene units are found inthe Warner Range tilt block. Despite the seemingpaucity of geologic constraints across this region,we have derived a constrained tectonic history thatis consistent with both the geophysical and geo-logical data.
2.1. Pre-40 Ma: East of theBlack Rock Range
[6] The eastern portion of the northwestern Basinand Range contains Paleozoic and Mesozoic rockunits that record multiple episodes of convergence,and consist of highly deformed Cambrian-Mississippian basinal sequences of the RobertsMountain allochthon, the Pennsylvanian-Permiansediments of the Antler Overlap Assemblage, andallochthonous upper Paleozoic deep-water sedi-ments and Permian arc sequences of the Golcondaallochthon [e.g., Stewart and Carlson, 1978;Milleret al., 1992; Wyld, 1992]. This late Paleozoicconvergent history was followed by Triassic-earlyJurassic extension, when thick (�6 km) siliciclasticand carbonate sedimentary sequences accumulatedin a subsiding basin [Wyld, 2000]. Plutons that formthe eastern part of the Sierra Nevada batholithintrude these rock units, and range in age from196 to 102Ma [Quinn et al., 1997]. In their regionalstudy and synthesis of Mesozoic contact metamor-
Figure 1. Map summarizing topography, heat flow [Blackwell et al., 1991], and relevant seismic data in thenorthern Basin and Range Province. Dashed black and white lines indicate COCORP seismic reflection profiles[Allmendinger et al., 1987]; solid black lines indicate PASSCAL experiment [Catchings and Mooney, 1991],Wyoming Ruby profile [Stoerzel and Smithson, 1998], USGS profiles in northern CA [Zucca et al., 1986], Cascadiaprofiles [Trehu et al., 1994], and Mendocino profiles from Beaudoin et al. [1996]. Short dashed black line showsprofile of Hill and Pakiser [1976]; long dashed black line shows mine-blast profile of the University of Nevada, Reno[Louie et al., 2004]. Small blue circle near the intersection of the 1986 PASSCAL lines: their Shotpoint 4, describedin text. Our 2004 experiment shown by white line (seismographs) and circles (shotpoints). Numbers along seismiclines indicate crustal thickness in kilometers.
GeochemistryGeophysicsGeosystems G3G3
lerch et al.: basin and range transition zone 10.1029/2006GC001429lerch et al.: basin and range transition zone 10.1029/2006GC001429
3 of 21

phism, Barton et al. [1988] placed the easternboundary of the region underlain by >50% Creta-ceous batholithic material�50 km east of the BlackRock Range (Figure 2). The exposed plutonsexhibit narrow contact aureoles, typically withandalusite developed [e.g., Compton, 1960], sug-gesting a relatively shallow emplacement level (5–10 km). Thermochronologic data document coolingof the batholith through the�70�C isotherm (U-Th/He method, �2–3 km depth) by �60 Ma [Colganet al., 2006b]. Continuity of these Paleozoic andMesozoic rock units within and between ranges,and lack of exposure of deep-crustal levels, supportthe hypothesis of only limited extension and tilting(and thus exhumation) during Basin and Rangefaulting [Colgan et al., 2006b].
2.2. Pre-40 Ma: West of theBlack Rock Range
[7] The tectonic development of the region west ofthe Black Rock and Pine Forest Ranges is more
difficult to assess because there are so few pre-Tertiary rocks exposed. Interpolating from theexposures of Mesozoic units both to the east(northwestern Nevada) and west (Klamath Moun-tains, northeastern California), multiple contrac-tional, accretionary episodes in the Paleozoic andMesozoic affected this region [e.g., Ernst, 1999;Wyld, 2002]. This convergent history appears tohave ended by the late Cretaceous, because units ofthis age document the growth of an extensivemarine basin. In northern California, the latest-Cretaceous Hornbrook Formation attains a thick-ness of �1.5 km [Nilsen, 1993]. In southernOregon, the Eocene Payne Cliffs Formation con-tains >2 km of predominantly subaerial sandstonesand siltstones [McKnight, 1984]. This pattern oflate Cretaceous-early Cenozoic sedimentation isechoed in the Warner Range (Figure 2), where>1.5 km of cobble conglomerates, volcaniclasticsandstones, lacustrine sediments, and thin basalticflows underlie �34 Ma andesites [Duffield and
Figure 2. Experiment layout and geology superimposed on a shaded relief map. Gray regions: Quaternary deposits.Tan regions: Tertiary volcanic and sedimentary units. Red regions: Mesozoic granites. Blue regions: Paleozoic andMesozoic metamorphic units. Thin black lines: significant normal faults. Red circles: shotpoints (SPs 1 and 5,1800 kg; SPs 2, 3, 4, and 6, 1100 kg) and mine blasts (Twin Creeks (TC) and Florida Canyon (FC) = 68 tonnes and16 tonnes, respectively). Black circles: geophone locations (appears as a solid line between SPs 1 and 5 due to denseinstrument spacing). Yellow circles: passive deployment. Gray ellipses: approximate PmP bounce points shown inFigure 5. Black dotted line: 2-D gravity profile. HR: Surprise Valley high-resolution reflection profile. Blue dashedlines correspond to basement suggested by Barton et al. [1988] to have >50% Cretaceous granitic material. Geologysimplified from Jennings et al. [1977], Stewart and Carlson [1978], and Walker and MacLeod [1991].
GeochemistryGeophysicsGeosystems G3G3
lerch et al.: basin and range transition zone 10.1029/2006GC001429
4 of 21

McKee, 1986; Miller et al., 2005]. Although thevolcanic flows at the base of this section are as ofyet undated, the thickness and mixed compositionof the section suggests an extended period of timewas required for its accumulation. U-Pb zirconanalyses on granitic cobbles from the base of thesection were performed on the Stanford-USGSSHRIMP and provided crystallization ages of�113 and �171 Ma [Miller et al., 2005]. The�171 Ma age is a non-unique value for granites inthis portion of the U.S. Cordillera, with middleJurassic plutons present to the east in northwesternNevada [e.g., Wyld, 1996], to the west in north-eastern California [e.g., Irwin, 2003], and to thesouth in the northern Sierra Nevada [e.g., Girty etal., 1995]. The Cretaceous granitic rocks (�113 Ma)are more diagnostic: they are absent from theKlamath Mountains [Irwin, 2003], but are commonin both northwestern Nevada and the northernSierra Nevada [e.g., Irwin and Wooden, 2001;Colgan et al., 2006b], suggesting the graniticcobbles were sourced from either the south or east.Thus northeastern California (and presumablysouthern Oregon and northwesternmost Nevada)was a depocenter during the early Cenozoic andaccumulated material derived from the east and/orsouth as the Sierra Nevada batholith becameunroofed.
2.3. Eocene-Miocene Volcanism
[8] Multiple volcanic episodes spanned the latestEocene to middle Miocene across the northwesternmargin of the Basin and Range. East of theSheldon Plateau, sparse 38–35 Ma basalts andbasaltic andesites represent the earliest Cenozoicvolcanic products [Lerch et al., 2005a; Colgan etal., 2006a]. These units, deposited unconformablyon the Paleozoic and Mesozoic granitic, sedimen-tary, and volcanic rocks described above, haverelatively minor amounts of basal topography[e.g., Lerch et al., 2005a], documenting a subaerialand low-relief depositional environment in thelatest Eocene. The ensuing volcanic stratigraphyis fairly straightforward: significant bimodal vol-canism occurred in two discrete, conformable epi-sodes (26–21 Ma and 16–14 Ma [e.g., Noble etal., 1970; Lerch et al., 2005a; Colgan et al.,2006a]), the latter being largely associated withthe McDermitt caldera system and the inception ofColumbia River Flood Basalt volcanism [e.g.,Zoback and Thompson, 1978; Pierce and Morgan,1992]. In total, the Cenozoic volcanic section eastof the Sheldon Plateau is 1–2 km thick, and isprimarily composed of basaltic and rhyolitic prod-
ucts from multiple volcanic episodes that occurredacross this region.
[9] Information about the thickness, timing, andcomposition of the Cenozoic volcanic stratigraphyis limited west of and on the Sheldon Plateau. Themost recent volcanic products (usually middleMiocene and younger) are often the only unitsexposed due to the general absence of large-offsetnormal faults. In the Warner Range, however, lateEocene (�34 Ma) andesitic flows overlie a verythick early Tertiary sedimentary sequence [Duffieldand McKee, 1986]. These Eocene-Oligoceneandesites were followed by Oligocene-Miocenebasalts and rhyolites [Duffield and McKee, 1986].Together with interbedded sedimentary units, morethan 3 km of material accumulated since �34 Main what later became the Warner Range [Fosdick etal., 2005].
2.4. Neogene Extension in theNorthern Basin and Range
[10] Extensional faulting began in the northernBasin and Range in the Eocene, and has continuedepisodically up to the present day [e.g., Gans et al.,1989; Seedorff, 1991; Christiansen et al., 1992;Wernicke, 1992]. The modern topography of muchof the northern Basin and Range formed during aperiod of large magnitude extension which peakedat about 20–15 Ma [e.g., Miller et al., 1999;Stockli, 1999; Surpless et al., 2002], and coincidedwith the eruption of the Columbia River floodbasalts in Washington and Oregon, and the onsetof bimodal basalt-rhyolite volcanism across muchof the northern Basin and Range [e.g., McKee,1971; Stewart and Carlson, 1978; Seedorff, 1991;Christiansen et al., 1992] associated with theYellowstone hot spot, which is thought to havereached the base of the lithosphere at about 16 Mabeneath McDermitt, Nevada [e.g., Zoback andThompson, 1978; Pierce and Morgan, 1992; Smithet al., 1993]. Some researchers have suggested thatthe thermal effects of this plume were responsiblefor widespread extension across the Basin andRange [e.g., Pierce and Morgan, 1992; Parsonset al., 1994].
[11] Extension began significantly later across thenorthwesternmost margin of the Basin and Range.Apatite fission-track (AFT) and (U-Th)/He datacollected from across northwestern Nevada indicatethat extension along the modern range-boundingnormal faults began around 12–10 Ma [Colgan etal., 2004, 2006b], later than the 16 Ma inception ofvolcanism attributed to the Yellowstone plume.
GeochemistryGeophysicsGeosystems G3G3
lerch et al.: basin and range transition zone 10.1029/2006GC001429
5 of 21

Geologic relationships suggest the 10 Ma - presentextension represents the only significant faultingand tilting to affect the region in the Cenozoic[Colgan et al., 2006b]. Thus it appears that Yellow-stone hot-spot-related magmatism was accompa-nied by little or no coeval extensional faulting inthe northwestern Basin and Range province. Thisregion must have behaved semi-independently fromthe central part of the Basin and Range province(�200 km SE), where significant extension byBasin and Range faulting occurred at 17–15 Ma[Stockli, 1999].
2.5. Geophysical Setting
[12] Today, the Basin and Range province is charac-terized by high average heat flow (�90 mW/m2) andelevated geothermal gradients (�30–40�C/km),although there is considerable local variation withinthe province (Figure 1) [e.g., Morgan and Gosnold,1989; Blackwell et al., 1991]. The elevated geother-mal gradients implied by high regional heat flow areconsistent with typical earthquake focal depths of10–15 km, and presumably indicate the approximatethickness of the seismogenic crust and depth to thebrittle-ductile transition zone.
[13] As seen from regional gravity data, a pro-nounced isostatic gravity low (�25 mGal) charac-terizes the northwestern margin of the Basin andRange, with its eastern edge corresponding to theeastern margin of the Sheldon Plateau (Figure 3).Possible tectonic explanations for the gravity lowinclude: a crustal-scale structural boundary [Wyldand Wright, 2001], the granitic Cretaceous arc[Barton et al., 1988], Oligocene-Miocene rhyoliticcenters [Noble et al., 1970; Plouff, 1985, 1997;Blakely and Jachens, 1991], or an early Tertiarysedimentary basin. The origin of this �30 mGalanomaly in northwestern Nevada and northeasternCalifornia is discussed in greater detail below.
[14] Figure 1 shows the location of previous seismicreflection and refraction profiles across the northernBasin and Range that provide data on crustal thick-ness and velocity structure across the region. Thebest data come from the COCORP (Consortium forContinental Reflection Profiling) 40�Ndeep seismicreflection profiles [e.g., Allmendinger et al., 1987;Klemperer et al., 1986] and the 1986 PASSCALBasin and Range Lithospheric Seismic Experiment[e.g., Jarchow et al., 1993; Catchings and Mooney,1991]. The COCORP and PASSCAL data are aug-mented by passive imaging of the eastern Basin andRange [Gilbert and Sheehan, 2004], refraction/
reflection imaging along the Ruby Mountains[Stoerzel and Smithson, 1998], and a coarse refrac-tion survey across western Nevada and easternCalifornia [Louie et al., 2004]. The crust varies inthickness from 34 km in central Nevada to �30 kmat 40�N in northwestern Nevada and western Utah(Figure 1), and has been interpreted to be underlainby a high-velocity (Vp � 7.4 km/s) ‘‘rift pillow’’[e.g., Catchings and Mooney, 1991] across muchof northwestern Nevada. The reflection profilesshow a relatively sharp Moho across the entireBasin and Range, with subhorizontal reflectivity inthe middle and lower crust [e.g., Holbrook et al.,1991; Klemperer et al., 1986]. These features arenow recognized as characteristic of extended ter-ranes worldwide, and have led numerous workersto a now widely accepted model of continentalextension in which spatially varying amounts ofupper-crustal extension are accommodated bymore uniform ductile flow and thinning in themiddle and lower crust [e.g., Gans, 1988; Blockand Royden, 1990; McKenzie et al., 2000].
3. Data Acquisition and Processing
3.1. Seismic Data
[15] In September 2004, we completed a �300 kmactive-source seismic survey as part of the Earth-scope program and with funding from the Petro-leum Research Foundation. Five in-line shots, andone off-line fan shot (shot sizes 1100 to 1800 kg)were recorded by �1100 vertical seismometers(Figure 2). These data were augmented by twoadditional blasts at the Twin Creeks (in-line) andFlorida Canyon (off-line) mines (TC and FC,Figure 2). These much larger shots (75 tons and15 tons, respectively) were ripple-fired, producinglong source signatures that make their recordingsuseful only for first-arriving energy. Approximately35 km of vibrator-source data using the Networkfor Earthquake Engineering Simulation (NEES)Tri-Axial ‘‘T-Rex’’ vibrator (267 kN peak force,60 s sweeps, 5–40 Hz) provide useful first-arrivalsat near offsets (�25 km) but were too widelyseparated to allow creation of a stacked reflectionprofile. While the bulk of the recording was done byself-contained, single channel Reftek RT125s(Texans), we also used Reftek RT130 multi-channeldigitizers with short-period (4.5 Hz) three-componentsensors to provide an additional 114 channels. Werelied largely on PASSCAL equipment providedwithin the framework of Earthscope, resulting instation spacing that was nominally 300 m, but
GeochemistryGeophysicsGeosystems G3G3
lerch et al.: basin and range transition zone 10.1029/2006GC001429
6 of 21

included a denser recording interval (100 m) overthe central �35 km of the line (western edge of theBlack Rock Range to the Jackson Mountains,Figure 2). A �10 km gap in the recording lineoccurs at the Summit Lake Indian Reservationjust west of the Black Rock Range (Figure 2).Only sparse recorders (�5 km spacing) weredeployed between Shotpoint 1 and the Twin CreeksMine, because the latter represented a shot ofopportunity that had not been guaranteed to takeplace during our recording windows. All data werepre-processed by PASSCAL and are archived at theIRIS Data Management Center (DMC). Our project
also included a 7-month deployment of short-periodpassive instruments for teleseismic recording in thecentral portion of our profile [Gashawbeza et al.,2005], and a high-resolution shallow penetrationVibroseis reflection profile across Surprise Valley[Lerch et al., 2005b] (Figure 2). In this paper, weutilize only the vertical component data as S-waveenergy from our controlled sources was disap-pointingly absent. The passive-source and reflec-tion data are left as the subjects of separatestudies [Gashawbeza et al., 2005; Lerch et al.,2005b].
Figure 3. Regional isostatic gravity: complete Bouguer gravity corrected for the effects of Moho topographyassuming an Airy-Heiskanen isostatic compensation model with a crustal density of 2.67 g/cm3, and a densitycontrast across the Moho of 0.4 g/cm3. (a) Isostatic gravity for the northwestern Basin and Range and neighboringregions. Heavy black line: refraction profile. Thin blue lines: middle Miocene basaltic dike swarms (Northern NevadaRifts). (b) Isostatic gravity for region immediately surrounding our seismic profile. White circles: existing gravitystations. Gray circles: 84 gravity stations collected here. Dashed black line A-A0: gravity model profile of Figure 8.Heavy black line: path of receivers from the refraction survey.
GeochemistryGeophysicsGeosystems G3G3
lerch et al.: basin and range transition zone 10.1029/2006GC001429
7 of 21

[16] The gathers from the in-line shots showclear first arrivals to offsets from 150 to 200 km(Figure 4, note that Shotpoint 2 failed and producedno useful data). Low surface velocities are evidenton all gathers, with an extreme velocity pull-downpresent in Surprise Valley (see Shotpoint 4, Figure 4).The upper-crustal refracted phase (Puc �6 km/s) isobserved on all gathers, and is the first arrival togreater offsets at the western end of the survey(�150 km for Shotpoint 5) than the eastern end(�100 km for Shotpoint 1). A clear lower-crustalrefracted phase (Plc) was recorded from Shotpoints
1, 3, and 4, but is obscured at the Pn crossoverdistance from Shotpoint 5 (Figure 4). RefractedMoho arrivals (Pn) are visible on Shotpoints 1 and5, as well as from the Twin Creeks mine blast (notshown). There are very few intra-crustal reflectionsvisible in the data, of which the most convincing is amid-crustal reflection (PcP) observed under theeastern end of the survey in the region of 100 mreceiver spacing (Figures 4 and 5, Shotpoint 1).
[17] Data processing consisted of established tech-niques: picking observed phases, forward modelingfor first-order fit, and inversions for more complete
Figure 4. Shot gathers from Shotpoints 1, 3, 4, and 5. All gathers reduced at 7.0 km/s; velocity wheel in Shotpoint 3gather shows slopes of arrivals of velocities from 4 to 8 km/s. Data processing described in text. MP, Modoc Plateau;SP, Sheldon Plateau; BRR, Black Rock Range. SV in SP4: Surprise Valley pull-down described in text.
GeochemistryGeophysicsGeosystems G3G3
lerch et al.: basin and range transition zone 10.1029/2006GC001429
8 of 21

traveltime agreement. Traveltime-modeling wasfollowed by amplitude and gravity modeling toconfirm the major features of the model. A band-pass filter (corner frequencies of 2, 4, 10, and16 Hz) and a minimum phase predictive deconvo-lution (500 ms operator length, 50 ms predictiondistance, 0.1% pre-whitening) were applied to allshot gathers. Pick uncertainties varied from 75–150 ms, depending on arrival clarity. The velocitymodel is constrained by 2192 picks (Table 1) fromthe in-line shot gathers (Figure 4), with an addi-tional 515 picks from the vibrator-source (T-Rex)gathers that illuminate the surface velocities in thevicinity of the Black Rock and Pine Forest Ranges(Figure 2). In our forward modeling, we usedModeling (a GUI by Gou Fujie based on ColinZelt’s RayInvr) to establish a starting model andobtain a reasonable fit to the data. Inversions werethen computed with RayInvr [Zelt and Smith,1992] by using a layer-stripping approach [Zelt etal., 1993] to arrive at a final model that adequatelyfits the observed arrivals (Figures 6 and 7). Sixraygroups (Psur, Puc, PcP, Plc, PmP, and Pn) wereused in the velocity modeling and included bothprimary and secondary arrivals.
3.2. Potential Field Data
[18] We collected 84 new gravity stations (averagespacing �3 km) along the seismic line and com-piled these with the existing regional coverage[Snyder et al., 1981; Ponce, 1997] to produce agrid from which we interpolated a profile for
potential-field modeling. New gravity data werereduced using standard gravity methods [Blakely,1995] that include: earth-tide, instrument drift, lat-itude, free-air, simple Bouguer, curvature, terrain,and isostatic corrections to yield the complete Bou-guer (CBA) and isostatic anomalies. A straight-linetwo-dimensional profile of the CBA that coincideswith the seismic profile and is roughly perpendic-ular to the strike of geologic structure wasextracted from the gravity grid (dotted line,Figure 2) and forward modeled [Talwani et al.,1959; Blakely and Connard, 1989] using GMSYSsoftware. Velocity-to-density mapping consisted ofconverting P-wave velocities to densities by usingthe [Brocher, 2005] modification of the Nafe-Drake relationship [Ludwig et al., 1970] that seeksa best average velocity-to-density conversionapplicable to a broad range of common rock types.
[19] At the regional scale, the profile is character-ized by three distinct gravity domains (Figure 8):
Figure 5. Shot gathers with NMO applied using a 1-D correction velocity profile derived from average values ofthe velocity model. Left panel shows PmP arrival at Surprise Valley (SV) and the Modoc Plateau (MP) fromShotpoint 6 (offline fan shot). Center panel shows PmP arrival at the Black Rock Range (BRR) and southern end ofthe Pine Forest Range (PFR) from Shotpoint 6 (offline fan shot). Right panel shows PmP and PcP arrivals at the BlackRock Range (BRR) and the southern end of the Pine Forest Range (PFR) from Shotpoint 1 (inline). Bounce pointlocations shown in Figure 2. (Note: horizontal scale varies between figures.)
Table 1. Velocity Modeling Results for ObservedPhases
Phase Picks (Used/Made) RMS Residual, sec c2
Psurface 39/62 0.103 1.953Pupper crust 1515/1522 0.114 1.242PcP 14/14 0.069 0.225Plower crust 202/215 0.094 0.862PmP 115/119 0.139 0.872Pn 258/260 0.155 0.980Total 2142/2192 0.120 1.181
GeochemistryGeophysicsGeosystems G3G3
lerch et al.: basin and range transition zone 10.1029/2006GC001429
9 of 21

two relatively equal Bouguer highs (��160 mGal)at either end of the profile and a broad centralnegative anomaly (��190 mGal) that is separatedfrom the western and eastern highs by short-wave-length gradients. Included in Figure 8 is the Bougueranomaly (�70 mGal, see dotted line) arising fromthe velocity-derived Moho topography assuming a
Dr = 0.4 g/cm3 increase across the Moho. Thiseastward-increasing variation is counteracted by thelaterally varying velocity and density structure of thecrust which has higher values at the western end ofthe survey than to the east. Densities calculated fromour seismic model (discretized at 0.2 km/s velocityintervals) provide a reasonable fit between observed
Figure 7. Final velocity model. Velocities displayed in km/s, contoured every 0.2 km/s (heavy contours every1.0 km/s). Geographical features labeled (MP, Modoc Plateau; SV, Surprise Valley; SP, Sheldon Plateau; BRR, BlackRock Range; JM, Jackson Mountains; DHM, Double H Mountains). Shotpoints (SP) 1–5 and Twin Creeks (TC)mine blast are labeled. V.E. 3:1.
Figure 6. Reduced shot gather from Shotpoint 1 (LMO = 7.0 km/s). Phase picks (colored vertical bars showassigned uncertainties) and modeled arrivals (black lines) are superimposed on data. Dashed black line from offsets of75–130 km represents modeled Puc arrivals produced by increasing upper-crustal velocities near the Black RockRange by 0.2 km/s (see text for discussion). Phase color scheme: magenta (Psurface), red (Pupper crust), green (PcP),orange (Plower crust), yellow (PmP), and blue (Pn).
GeochemistryGeophysicsGeosystems G3G3
lerch et al.: basin and range transition zone 10.1029/2006GC001429
10 of 21

and predicted data (long dashed line, Figure 8). Thisgravity signature is broadlymatched by our velocity-density conversion, showing all three major trends,and relatively sharp gradients on either side of thecentral negative anomaly.
[20] A modified density model provides an im-proved fit to the observed values, and was pro-duced by reducing density values (never by morethan 1.5%, or 0.04 g/cm3) while maintaining thegeometry of the density structure exactly as con-strained by the velocity model (Figure 8). Thismodified density model more accurately matchesboth the sharp gradient on the eastern edge of theSheldon Plateau, and the gravity signal near theJackson Mountains. In producing this modifieddensity model, we changed a minimum numberof values, seeking only a first-order fit to the data.Despite the broad agreement between our modeled
and observed densities, persistent misfit of theshort-wavelength signals (<20 km) between theobserved and modeled gravity are seen in boththe Warner Range and Double H Mountains(Figure 8). At the eastern end of the gravityprofile, a �30 mGal positive anomaly that is notaccounted for by the model occurs over theDouble H Mountains. Inspection of the 2-Dgravity profile location (Figure 2) explains muchof this incompatibility: the gravity profile crossesthe southern end of the Double H Mountains,whereas the seismic data is confined to the basinat the southern end of the range. Focused maficdikes of the westernmost arm of the northernNevada rift trend SSE through the Double HMountains (Figure 3), accounting for an addi-tional �5–8 mGal [Zoback et al., 1994] of thepositive anomaly in this portion of the model.
Figure 8. Comparison of observed Bouguer gravity (black circles) with that predicted by various density models.Short dashed line: modeled Bouguer anomaly with no lateral density heterogeneities other than Moho topography(Dr = 0.4 g/cm3) taken directly from the seismic model (Figure 7). Long dashed line: predicted Bouguer anomalyfrom directly mapping Vp to density using the modified Nafe-Drake approximation of Brocher [2005]. Solid line:predicted Bouguer anomaly from modified density structure, with density modifications labeled on figure in percentchange from the Brocher [2005] approximation (e.g., �1.1% between BRR and JM corresponds to reducing densityfrom 2.70 to 2.67 g/cm3). Geographical features labeled are as follows: MP, Modoc Plateau; SV, Surprise Valley; SP,Sheldon Plateau; BRR, Black Rock Range; JM, Jackson Mountains; DHM, Double H Mountains.
GeochemistryGeophysicsGeosystems G3G3
lerch et al.: basin and range transition zone 10.1029/2006GC001429
11 of 21

To the west in the Warner Range, a �12 mGalpositive disparity is centered on the westernedge of the range, and marks the southern endof a spatially limited and poorly defined (poordata coverage) gravity high (Figure 3b) associ-ated with Tertiary intrusive rocks [Chapman andBishop, 1968]. We interpret this disagreementbetween the observed and modeled data sets tobe related to a mismatch in survey locations, asthe seismometers on either side of this gravityhigh were positioned south of the anomaly,meaning that many of the raypaths traveling tothese stations failed to sample the source body.
[21] Several additional models (not shown here[Glen et al., 2005]) were developed (independentof the seismic velocity structure and velocity-derived densities) through simultaneous forwardmodeling of gravity and magnetic data to matchthe calculated anomalies with observed anomalieswhile taking into account constraints imposed bysurface geology, rock property data, and geophys-ical data. Density and magnetic properties ofbodies were adjusted iteratively to match observedand calculated gravity and magnetic profiles. Thesemodels confirm the fundamental results presentedhere: that the steepest seismic velocity gradientsoccur at shallow to mid-crustal levels at the mar-gins of the anomalous gravity low.
4. Crustal Structure and AverageVelocities and Densities
4.1. Crustal Thickness and Reflectivity
[22] Crustal thickness is constrained both by PmPand Pn arrivals in the seismic data, and varies from�38 km under the western, unextended end of thesurvey, to �32 km to the east (Figure 7). TheseMoho depths agree with earlier studies from north-western Nevada (COCORP 40�N and 1986 PASS-CAL) and northeastern California (1981 USGS),confirming the change in crustal thickness acrossthe western margin of the Basin and Range prov-ince. PmP and PcP arrivals are most coherent underthe eastern portion of the line (see Figure 5, rightpanel) where we deployed instruments at 100 mspacing, yet present a contrasting image of crustalreflectivity when compared to previous surveysfrom more highly extended portions of the Basinand Range. In particular, distributed lower-crustalreflectivity is missing from the crustal columnunder northwesternmost Nevada. Because ourShotpoint 2 (Figure 2) failed, we recorded nonear-offset explosion data with our most densely
spaced receivers, obviating an absolute comparisonof reflectivity between our survey and the remark-able middle- and lower-crustal reflectivity observedin the 1986 PASSCAL survey [Catchings andMooney, 1991]. A comparison of relative amplitudeagainst time for our data (SP1) and for the 1986PASSCAL experiment (their SP4) [Catchings andMooney, 1991, Figure 11a] is shown in Figure 9. Atnear-offsets (10–15 km), the relative amplitude(a proxy for signal-to-noise ratio) in both our dataand in the 1986 PASSCAL survey show continuingamplitude decay to�10 s, which is the standard testfor signal propagation to depths equivalent to thosetraveltimes. Thus absence of evidence for reflectiv-ity is, in this case, evidence of absence.
4.2. Near-Surface Velocities and Densities
[23] Velocities and densities within �2 km of thesurface are particularly low (Vp � 3 km/s, r �2.3 g/cm3) between the Black Rock Range andSurprise Valley (Figures 7 and 8), correspondingto the topographically high Sheldon Plateau(Figure 2), despite the fact that outcrops aredominated by basalts and welded ash-flow tuffs.Large-offset normal faults are absent on the SheldonPlateau, leaving only the youngest volcanic rocksvisible at the surface. Insight into the subsurfacelithologies across this region comes from largetilted fault blocks on its eastern and western mar-gins that expose deeper structural levels. To theeast, the Black Rock Range (Figure 2) is a gentlydipping horst block that preserves a remarkablycomplete section of Tertiary volcanic rocks [Lerchet al., 2005a]. In the �1 km volcanic section ofthe northern Black Rock Range, roughly 60–70%is composed of slope-forming, unwelded volca-nic units. On the western margin of the SheldonPlateau, the Surprise Valley fault exposes nearly2 km of Tertiary sedimentary and volcaniclasticdeposits [Duffield and McKee, 1986; Carmichael etal., 2006]. Hence, although basalts and variablywelded ash-flow tuffs dominate the surface of theSheldon Plateau, the bulk of the underlying Tertiarysection is inferred to consist of sedimentary andunwelded silicic volcanic deposits (Figure 7) and islikely responsible for much of the gravity lowacross this region (km 85 to 155 in Figure 8).
4.3. Upper-Crustal Velocities and Densitiesand the Sierra Nevada Batholith
[24] Upper-crustal velocities are laterally heteroge-neous across the study area, with the most pro-nounced anomaly present in the central portion of
GeochemistryGeophysicsGeosystems G3G3
lerch et al.: basin and range transition zone 10.1029/2006GC001429
12 of 21

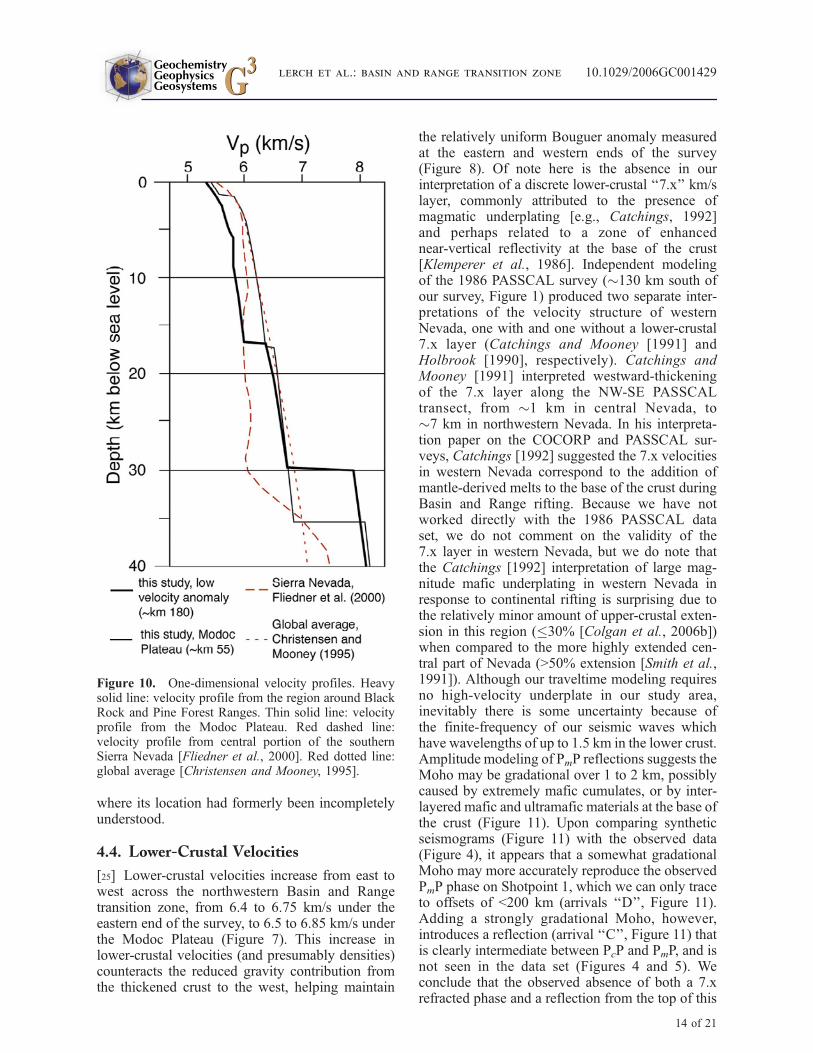
our profile near the Black Rock Range and JacksonMountains (Figure 7). Iso-velocity contours in thispart of the model dip steeply inward from the westand east, defining a 15 km-thick region of lowvelocities (Vp � 5.8–6.1 km/s) that occurs beneathexposed Jurassic and Cretaceous granitic rocks thathave been interpreted to mark the trace of theSierran batholith as it passes through northwesternNevada (Figure 2) [Barton et al., 1988]. It is worthnoting that eastern edge of our low-velocity depres-sion agrees reasonably well with the estimates fromBarton et al. [1988] (Figure 2). We attribute thediscrepancy on the western edge to the absence ofsurface exposures of pre-Tertiary rocks available toBarton et al. [1988] when they constructed theirboundaries (Figure 2). Our low-velocity depressionis robustly imaged: an increase in Vp of 0.2 km/s,still not enough to make this region have globallyaverage upper-crustal velocities, would predict farearlier traveltimes than the error bounds of ourinterpretations (Figure 6). This low-velocity uppercrust spans �100 km (Figure 7), equivalent to thesurface outcrop of the Sierra Nevada batholith incentral California, and shows even lower seismicvelocities than the anomalously low-velocity crustin the southern Sierra Nevada (Figure 10) [Fliedner
et al., 2000]. This region near the Black Rock andPine Forest Ranges also presents the greatestdiscrepancy in our gravity modeling (Figure 8),and a better fit to the gravity data was obtained byusing densities slightly lower than predicted by the[Brocher, 2005] approximation. Densities pre-dicted from Vp using the Nafe-Drake or Brocherconversions which average all rock types areexpected to be systematically high (�0.06 g/cm3
or �2%) for granitic-granodioritic lithologies[Christensen and Mooney, 1995], strengthening thecase for granitic material in this region. Non-graniticvelocities (�6.4 km/s) below the mid-crust in ourstudy area indicate that either the lower crust hasbeen substantially altered by Cenozoic magmatism,or that Cretaceous arc magmatism in this portion ofthe Cordillera was lower in magnitude than in thesouthern Sierra Nevada. While the absence of reli-able seismic velocity information anywhere betweenour survey and the southern Sierra Nevada makes itdifficult to draw an absolute correlation betweenthese two data points �500 km apart, we concludeon the basis of the available geologic and geophys-ical information that we have better described thelocation and extent of the Cretaceous arc in a region
Figure 9. Amplitude comparison between our survey and the 1986 PASSCAL Basin and Range experiment. Eachamplitude-decay curve was produced by taking the Hilbert transform of the original data, summing over adjacenttraces at source receiver offsets from 10–15 km, and then plotting the amplitude as a function of time.
GeochemistryGeophysicsGeosystems G3G3
lerch et al.: basin and range transition zone 10.1029/2006GC001429
13 of 21
where its location had formerly been incompletelyunderstood.
4.4. Lower-Crustal Velocities
[25] Lower-crustal velocities increase from east towest across the northwestern Basin and Rangetransition zone, from 6.4 to 6.75 km/s under theeastern end of the survey, to 6.5 to 6.85 km/s underthe Modoc Plateau (Figure 7). This increase inlower-crustal velocities (and presumably densities)counteracts the reduced gravity contribution fromthe thickened crust to the west, helping maintain
the relatively uniform Bouguer anomaly measuredat the eastern and western ends of the survey(Figure 8). Of note here is the absence in ourinterpretation of a discrete lower-crustal ‘‘7.x’’ km/slayer, commonly attributed to the presence ofmagmatic underplating [e.g., Catchings, 1992]and perhaps related to a zone of enhancednear-vertical reflectivity at the base of the crust[Klemperer et al., 1986]. Independent modelingof the 1986 PASSCAL survey (�130 km south ofour survey, Figure 1) produced two separate inter-pretations of the velocity structure of westernNevada, one with and one without a lower-crustal7.x layer (Catchings and Mooney [1991] andHolbrook [1990], respectively). Catchings andMooney [1991] interpreted westward-thickeningof the 7.x layer along the NW-SE PASSCALtransect, from �1 km in central Nevada, to�7 km in northwestern Nevada. In his interpreta-tion paper on the COCORP and PASSCAL sur-veys, Catchings [1992] suggested the 7.x velocitiesin western Nevada correspond to the addition ofmantle-derived melts to the base of the crust duringBasin and Range rifting. Because we have notworked directly with the 1986 PASSCAL dataset, we do not comment on the validity of the7.x layer in western Nevada, but we do note thatthe Catchings [1992] interpretation of large mag-nitude mafic underplating in western Nevada inresponse to continental rifting is surprising due tothe relatively minor amount of upper-crustal exten-sion in this region (�30% [Colgan et al., 2006b])when compared to the more highly extended cen-tral part of Nevada (>50% extension [Smith et al.,1991]). Although our traveltime modeling requiresno high-velocity underplate in our study area,inevitably there is some uncertainty because ofthe finite-frequency of our seismic waves whichhave wavelengths of up to 1.5 km in the lower crust.Amplitude modeling of PmP reflections suggests theMoho may be gradational over 1 to 2 km, possiblycaused by extremely mafic cumulates, or by inter-layered mafic and ultramafic materials at the base ofthe crust (Figure 11). Upon comparing syntheticseismograms (Figure 11) with the observed data(Figure 4), it appears that a somewhat gradationalMoho may more accurately reproduce the observedPmP phase on Shotpoint 1, which we can only traceto offsets of <200 km (arrivals ‘‘D’’, Figure 11).Adding a strongly gradational Moho, however,introduces a reflection (arrival ‘‘C’’, Figure 11) thatis clearly intermediate between PcP and PmP, and isnot seen in the data set (Figures 4 and 5). Weconclude that the observed absence of both a 7.xrefracted phase and a reflection from the top of this
Figure 10. One-dimensional velocity profiles. Heavysolid line: velocity profile from the region around BlackRock and Pine Forest Ranges. Thin solid line: velocityprofile from the Modoc Plateau. Red dashed line:velocity profile from central portion of the southernSierra Nevada [Fliedner et al., 2000]. Red dotted line:global average [Christensen and Mooney, 1995].
GeochemistryGeophysicsGeosystems G3G3
lerch et al.: basin and range transition zone 10.1029/2006GC001429
14 of 21

interface, dictates that if a high-velocity mafic under-plate exists under our survey area, it is minor inmagnitude (<3 km). Thus, although the extensionaland magmatic histories surveyed by 1986 PASSCALand our experiment are comparable, the addition of amafic underplate may not have been uniform.
4.5. Pn Velocities
[26] Observed Pn velocities increase from east(�7.95 km/s) to west (�8.05 km/s) across oursurvey, possibly corresponding to elevated litho-spheric mantle temperatures under the Basin andRange. A 0.1 km/s increase in velocity is aboutdouble that expected due to the �5 km increase inMoho depth (and corresponding increase in pres-sure) and may indicate a decrease in temperature of�100�C. This variation in Pn agrees qualitativelywith recent work in our study area that constrainsdepth to the lithosphere-asthenosphere boundary at�60 km in northwestern Nevada (X. Li et al., Thelithosphere-asthenosphere boundary beneath thewestern United States, submitted to GeophysicalJournal International, 2007) and �70 km in north-eastern California. Our Pn velocities are slightlybelow the global average [e.g., Christensen andMooney, 1995] and fit well with other seismicexperiments from across the northern Basin and
Range [Catchings and Mooney, 1991], consistentwith above-average heat flow and below-averagecrustal thickness of this province (Figure 1). Thehomogeneity of Basin and Range Moho velocitiessuggests that composition and state of the litho-spheric mantle is moderately uniform despite localheterogeneities in surface heat flow [e.g., Blackwellet al., 1991] and magmatism [e.g., Best et al.,1989].
5. Tectonic Implications
[27] Together with the geologic history preservedat the surface, our geophysical data have broadimplications for the tectonic development of thenorthwestern Basin and Range and its transition tounextended crust in northeastern California andsoutheastern Oregon. Working backward in timefrom the most recent tectonic activity, we recon-struct the major tectonic and magmatic events, andprovide an interpretation of the crustal evolution ofour study area from the late Cretaceous through theCenozoic (Figure 12).
5.1. Tectonic Reconstruction at 13 Ma
[28] As described above (Regional Geology andGeophysics), Basin and Range extension in north-
Figure 11. Synthetic seismogram for Shotpoint 1 (using code of Zelt and Smith [1992]). Black: seismogramproduced with best-fit velocity model (Figure 7). Red: seismogram produced with gradational Moho to simulatedistributed mafic addition to the base of the crust (abrupt velocity jump in Figure 7 is artificially spread out over3 km). Inset figure shows 1-D velocity profiles for best-fit model (black dashed line) and gradational Moho model(red line). ‘‘A’’ arrivals do not interact with the crust-mantle interface and are identical in the two seismograms. ‘‘B’’arrivals have similar arrival times and waveforms in both models. ‘‘C’’ arrivals show that a gradational Moho shouldgive additional reflectivity above the main PmP that is not observed in our data set. ‘‘D’’ arrivals represent a mismatchbetween the two models, described in the text.
GeochemistryGeophysicsGeosystems G3G3
lerch et al.: basin and range transition zone 10.1029/2006GC001429
15 of 21

western Nevada and northeastern California beganat �12–10 Ma, and has accommodated a stretch-ing total of 20–25% east of the Sheldon Plateau,with 0–5% extension west of the Black Rock andPine Forest Ranges (Figure 2). The magnitude ofupper-crustal extension recorded at the surface isroughly consistent with the degree of eastwardcrustal thinning across this transition zone, andsuggests the response to Basin and Range exten-sion has been relatively uniform over the entire
crustal column. This relationship is straightforwardwhen compared to other portions of the northernBasin and Range, where the heterogeneous natureof upper crustal deformation contrasts with thehomogeneous strain observed in the lower crust[e.g., Gans, 1988]. This inferred decouplingbetween upper and lower crustal deformation,considered responsible for the absence of high-amplitude Moho relief [e.g., Klemperer et al.,1986] despite large local variations in upper-crustalextension, is not required in our survey area. Byrestoring extension across the survey region, thelateral change in crustal thickness is effectivelyremoved and provides an estimated Moho depth of�38 ± 1 km (Figure 12b) prior to the inception ofBasin and Range faulting.
5.2. Tectonic Reconstruction at 35 Ma
[29] Prior to extension, the northwestern Basin andRange witnessed long-lived, voluminous magma-tism [Noble et al., 1970; Lerch et al., 2005a;Colgan et al., 2006a]. The Black Rock, PineForest, and Warner Ranges (Figure 2) record ba-saltic through rhyolitic volcanism that dominatedthe landscape from the late Eocene to the Pliocene.As described above (Regional Geology and Geo-physics), �2–3 km of volcanic cover accumulatedin the vicinity of the Warner Range, with slightlyless (�1–2 km) deposited to the east near theBlack Rock and Pine Forest Ranges.
[30] Because the volcanic products represent aninterplay between magmatic addition to the crustand assimilation (partial-melting) of the countryrock, we cannot simply remove the volcanic coverto arrive at an estimate of pre-volcanic crustalthickness. Volcanism across this region variedgreatly in composition, and occurred in three mainepisodes that provided 1–3 km of volcanic coversince the late Eocene. Because isotope geochemis-try has not been carefully studied for most of theCenozoic volcanic units, estimating the ratio ofcrustal magmatic addition to erupted material isdifficult. Through our velocity and amplitude mod-eling, we find only marginal evidence for maficunderplating (Vp � 7.4 km/s, thickness �1 ± 1 km)at the base of the crust (Figure 11), leaving nostraightforward way to directly measure theamount of magmatic addition. Previous attemptsto relate the degree of assimilation (crustal melting)to recharge (magmatic addition) have been madefor the Basin and Range province [e.g., Perry etal., 1993], but have not addressed our study areaspecifically. Although calculated assimilation/
Figure 12. Schematic crustal evolution from lateCretaceous-present. (a) Present-day crustal structurewith west-dipping Moho, lower- and mid-crustal mag-matic addition, and modern topography (MP, ModocPlateau; SV, Surprise Valley; SP, Sheldon Plateau; BRR,Black Rock Range; SRR, Santa Rosa Range). Redcrosses: region of low Vp inferred to mark location ofthe Sierra Nevada batholith. (b) Crustal structure beforeBasin and Range extension; Moho topography isreduced. (c) Removing Cenozoic magmatic additionthins crust. Prior to magmatic addition, region of low Vp
inferred to represent the Sierra Nevada batholith thatmay extend through the entire crust. (d) Restoringerosion (east) and removing sedimentation (west)produces an east-dipping Moho. Reconstruction uncer-tainty (RMS) is represented by the gray Moho outline.V.E. � 2:1; topography is shown schematically.
GeochemistryGeophysicsGeosystems G3G3
lerch et al.: basin and range transition zone 10.1029/2006GC001429
16 of 21

recharge (a/r) ratios in the Basin and Range prov-ince vary over two orders of magnitude for differ-ent episodes of magmatism and different igneouscompositions, observed patterns in magmatic char-acteristics narrow the likely range of this ratio. Bysimply taking an average of values through time,Perry et al. [1993] note that late Oligocene rhyo-lites have an a/r ranging from 0.75–3 (for simplic-ity we use the average of these two values, 1.9),whereas Miocene-Pliocene rhyolites display a/r� 0.5. In the case of the northwestern Basin andRange transition zone, we observe � 1 km ofOligocene rhyolitic material, and � 1 km ofMiocene rhyolitic material [e.g., Noble et al.,1970; Duffield and McKee, 1986; Colgan et al.,2006a], providing an upper limit for the mantlecontribution to these flows of �1.0 km. Thisestimate does not account for mafic material addedto the crust that cooled at depth, an inherentlydifficult quantity to constrain. In their tectonic andmagmatic reconstruction of the eastern Basin andRange, Gans et al. [1989] assume that an amountof magma equal to or larger than the observedvolcanic material intruded the crust but was noterupted. Recognizing the uncertainty in this step inour reconstruction, we estimate �2 ± 1 km ofmaterial may have been added to the crust relatedto the production of rhyolitic volcanism. The localthickness of basaltic products is generally nogreater than 1 km, and in many places is signifi-cantly less (here we assume an average thickness of0.5 km). Assimilation/recharge ratios for basaltsare commonly lower than for rhyolites (a/r � 0.3[e.g., DePaolo, 1985; Stewart and DePaolo, 1990],providing a maximum estimate of the basalt-pro-ducing magmatic addition of �0.4 km. Combiningthe upper estimates of magmatic addition sinceEocene time, and applying a conservative uncer-tainty to our calculation, we arrive at a total of2.4 ± 2 km. Because the uncertainty introducedin this phase of our reconstruction is uncorrelatedwith that from the restoration of Basin and Rangeextension, we take the RMS of the two steps thusfar (restoring Basin and Range extension andremoving latest Eocene to Miocene magmatism),reaching a total uncertainty of ±2.25 km(Figure 12c).
[31] In the modern crustal section, we infer theexistence of Sierra Nevadan arc beneath the easternSheldon Plateau, Black Rock Range, and JacksonMountains, marked by a low-velocity upper crust.Prior to Cenozoic Basin and Range magmatism,unmodified arc material may have extendedthrough the entire crust (Figure 12c), providing a
crustal column more similar to that observed in thesouthern Sierra Nevada [Fliedner et al., 2000].
5.3. Tectonic Reconstruction at 90 Ma
[32] The tectonic histories of the eastern and west-ern portions of our study area differed sharplyduring the late Cretaceous to middle Cenozoic.As described in more detail above (RegionalGeology and Geophysics), upper crustal (depth �5 km) granitic, metasedimentary, and metavolcaniclithologies [Compton, 1960] east of the SheldonPlateau were exhumed from �90–60 Ma, and thisregion was characterized by subdued topographyand minor sedimentation when volcanism began inthe late Eocene [Lerch et al., 2005a; Colgan et al.,2006a]. To the west in the Warner Range, lateEocene andesites overlie a thick (>1.5 km) subaer-ial to submarine sedimentary section [Duffield andMcKee, 1986; Miller et al., 2005]. Granitic cobblesfrom a coarse conglomerate near the base of theWarner Range section yielded U-Pb zircon ages of�113 and �171 Ma [Miller et al., 2005], commongranitic crystallization ages in northwesternNevada [e.g., Wyld, 1992; Colgan et al., 2006b].On the basis of these regional patterns, it isreasonable that much of the material removed fromnorthwestern Nevada in the early Cenozoic wastransported and deposited to the west in northernCalifornia and southern Oregon. By restoring thematerial associated with the unroofing of the uppercrustal batholithic rocks in northwestern Nevada(4 ± 3 km), and removing the sedimentation fromnortheastern California (2 ± 1 km), we arrive at asketch of crustal thickness across this region that ismarkedly different from today (Figure 12d). Thus,at �90 Ma, the present-day Basin and Rangetransition zone was instead a transition from stan-dard crustal thickness of �40 km (global average�41 km [Christensen and Mooney, 1995]) in theeast, to thin (�34 km) continental-margin typecrust in the west. This estimated crustal thicknessunder the western end of our survey is betweenthe global averages for rifts and extended crust(�37 and �31 km, respectively [Christensen andMooney, 1995]), compatible with its depositionalsetting at late-Cretaceous to early-Tertiary time.Thus a westward-thinning continental margin at90 Ma has evolved into an eastward-thinning riftshoulder at the present day. The transition betweenthicker and thinner crust occurred at the location ofthe then-waning Sierra Nevada magmatic arc, andit is possible that a deeper crustal root existedbetween thinner crust to both the west and east.However, because of the significant erosion
GeochemistryGeophysicsGeosystems G3G3
lerch et al.: basin and range transition zone 10.1029/2006GC001429
17 of 21

recorded inboard of the arc at this time, wespeculate that arc thickness was �40 km, transi-tional between the continental interior to the eastand the continental margin to the west, and that nocontinuous high barrier separated these regions.
6. Conclusions
[33] In addition to broadly confirming the crustalthickness and velocity structure of previous geo-physical studies from neighboring regions, ourcombined seismic and potential field data constrainthe crustal response to magmatism and extension,and the Cretaceous-to-present tectonic evolution ofthis region.
[34] Basin and Range extension in this region hasspanned the late Miocene to present and appears tohave been relatively homogeneous with depth: weobserve no evidence that deformation of the lowercrust was significantly different in magnitude thanthe upper-crustal extension recorded at the surface.This statement is supported by the absence ofdistributed lower-crustal reflectivity, commonlyattributed to large-magnitude ductile deformation,and by crustal thinning that is proportional to theamount of upper-crustal extension (�20%, Figure 7).Because we interpret there to have been no signif-icant material transport away from this regionduring Basin and Range extension (e.g., lower-crustal flow in excess of the transport by exten-sion), reconstructing the pre-extensional historyproduces only moderately thick crust (�40 km,on par with the global average for continentalcrust). Crustal thickness in northwestern Nevada,according to our reconstruction, appears to havenever been as great as it is inferred to have been inthe more highly extended portions of the Basin andRange where pre-extensional thicknesses are esti-mated to have been 45–55 km [e.g., Smith et al.,1991], and where large crustal thicknesses mayhave helped trigger extension.
[35] The widespread magmatism that has occurredin this region over the last �35 Ma undoubtedlyaltered the crustal composition through the additionof mantle-derived melts, evidenced by the largeamount of basaltic material erupted over this timeinterval. Despite this long-lived magmatic activity,there appears to be no discrete high-velocity(7.x km/s) zone in the lower crust equivalent tothat claimed by Catchings and Mooney [1991] inthe 1986 PASSCAL survey in northwesternNevada (�130 km south of our experiment). Wedo not believe the lack of a lower-crustal 7.x layer
in our study area necessarily contradicts the Catch-ings and Mooney [1991] interpretation of the 1986PASSCAL survey for two reasons: (1) the degreeof lower-crustal extension under the northwesternend of the 1986 PASSCAL line is interpreted to besignificantly greater on the basis of the presence ofdistributed lower-crustal reflectivity and may haveenhanced the development of a 7.x layer in thePASSCAL survey area, and (2) our amplitudemodeling indicates a gradient of high velocitiesnear the Moho that may be produced by distributedmafic material.
[36] Our data document the location of the Creta-ceous arc as it trends northeastward from thenorthern Sierra Nevada to southern Idaho, consis-tent with the surface exposures of Cretaceousgranitic rocks (Figure 2) [Barton et al., 1988].The 1-D velocity profile of the low upper-crustalvelocities near the Black Rock Range and BlackRock Desert is similar to that obtained from thesouthern Sierra Nevada to mid-crustal depths (Fig-ure 10), and our gravity modeling supports thepresence of granitic material by having a higherVp/r ratio than the average of all basement lithol-ogies [Brocher, 2005].
[37] Our estimated crustal thicknesses for the east-ern and western ends of our survey at 90 Ma fit wellwith the late Cretaceous tectonic setting of thisregion. The thin crust (�34 km) under what isnow northeastern California allowed for the accu-mulation of a thick late-Cretaceous to early-Tertiarysedimentary section. This sedimentary materialappears to have been derived from northern SierraNevada arc and the relatively thicker crust (�40 km)to the east that underwent regional exhumation andunroofing in the late Cretaceous [Miller et al., 2005;Colgan et al., 2006a, 2006b].
Acknowledgments
[38] We would like to thank the hard-working volunteers who
made this experiment possible: Tom Burdette, Ewenet Gashaw-
beza, Charlie Wilson, Adam Abeles, Martins Akintunde, Steve
Azevedo, Lloyd Carothers, Matt Coble, Trevor Dumitru, Anne
Egger, Julie Fosdick, Tyson Fulmer, Nathan Fung, Bob
Greschke, Kelly Grijalva, Aaron Hirsch, Nick Hoffman, Julia
James, Kyrill Krylov, Nick Leindecker, Mingjun Liu, Simone
Manganelli, Chris Mattinson, Nic Markman, Darlene McEwan,
Walter Mooney, Marleen Nyst, Willy Rittase, Brian Romans,
Dave Scholl, Mario Torres, Amy Weislogel, and Charlie
Wilson Sr.. We thank E. Brueckl (Vienna Univ. of Technology),
H. Thybo (Univ. of Copenhagen), P. Heikkinen (Univ. of
Helsinki), A. Guterch (Polish Academy of Sciences), and
C. Knapp (Univ. of South Carolina) for the use of their Texans.
Farn-Yuh Menq and Cecil Hoffpauir operated the NEES-UT
GeochemistryGeophysicsGeosystems G3G3
lerch et al.: basin and range transition zone 10.1029/2006GC001429
18 of 21

Austin T-Rex vibrator. The Twin Creeks (Newmont Mining
Corporation) and Florida Canyon (Apollo Gold Corporation)
mines generously provided access to their properties and
coordinated mine blasts with our recording windows. We
also thank Colin Zelt, Barry Zelt, and Fujie Gou for making
their velocity modeling software available. Andy Calvert,
Bryan Kerr, and Eiji Kurashimo provided necessary guidance
related to the velocity modeling. Conversations with George
Thompson greatly strengthened our tectonic interpretations.
Constructive reviews from Kate Miller and Randy Keller
improved the clarity of this paper. Principal funding for
explosive-source profiling was provided by NSF-Earthscope
grant 0346245 and by the Petroleum Research Fund of
the American Chemical Society; support for Vibroseis pro-
filing was received from NSF-Geoenvironmental Engineering
and Geohazard Mitigation grant 0444696; and funding for
passive-source deployments came from Stanford University.
Field support and instruments were provided to all parts of
the experiment by the PASSCAL Instrument Center. All
seismic data are available through the IRIS DMC.
References
Allmendinger, R., T. Hauge, E. Hauser, C. Potter, S. Klemperer,K. Nelson, P. Kneupfer, and J. Oliver (1987), Overview ofthe COCORP 40�N transect, western United States: The fab-ric of an orogenic belt, Geol. Soc. Am. Bull., 98, 308–319.
Barton, M., D. Battles, G. Debout, R. Capo, J. Christensen,S. Davis, R. Hanson, C. Michelsen, and H. Trim (1988),Mesozoic contact metamorphism in the western UnitedStates, in Rubey Colloquium on Metamorphism and CrustalEvolution of the Western United States, vol. 7, Metamorph-ism and Crustal Evolution of the Western United States,edited by W. Ernst, pp. 110–178, Univ. of Calif., LosAngeles.
Beaudoin, B., et al. (1996), Transition from slab to slabless:Results from the 1993 Mendocino Triple Junction seismicexperiment, Geology, 24, 195–199.
Best, M., and E. Christiansen (1991), Limited extension duringpeak Tertiary volcanism, Great Basin of Nevada and Utah,J. Geophys. Res., 96, 13,509–13,528.
Best, M., E. Christiansen, A. Deino, C. Gromme, E. McKee,and D. Noble (1989), Eocene through Miocene volcanismin the Great Basin of the western United States, in FieldExcursions to Volcanic Terranes in the Western UnitedStates, vol. II, Cascades and Intermountain West, Mem.N. M. Bur. Mines Miner. Resour., 47, 91–133.
Blackwell, D., J. Steele, and L. Carter (1991), Heat-flowpatterns of the North American continent: A discussion ofthe geothermal map of North America, in Decade of NorthAmerican Geology, vol. 1, Neotectonics of North America,edited by D. Slemmons et al., pp. 423–436, Geol. Soc. ofAm., Boulder, Colo.
Blakely, R. (1995), Potential Theory in Gravity and MagneticApplications, Cambridge Univ. Press, New York.
Blakely, R., and G. Connard (1989), Crustal studies usingmagnetic data, in Geophysical Framework of the ContinentalUnited States, edited by L. Pakiser and W. Mooney, Mem.Geol. Soc. Am., 172, 45–60.
Blakely, R., and R. Jachens (1991), Regional study of mineralresources in Nevada: Insights from three-dimensional analy-sis of gravity and magnetic anomalies, Geol. Soc. Am. Bull.,103, 795–803.
Block, L., and L. Royden (1990), Core complex geometriesand regional scale flow in the lower crust, Tectonics, 9, 557–567.
Brocher, T. (2005), Empirical relations between elastic wave-speeds and density in the Earth’s crust, Bull. Seismol. Soc.Am., 95, 2081–2092.
Carmichael, I., R. Lange, C. Hall, and P. Renne (2006),Faulted and tilted Pliocene olivine-tholeiite lavas nearAlturas, NE California, and their bearing on the uplift ofthe Warner Range, Geol. Soc. Am. Bull., 118, 1196–1211.
Catchings, R. (1992), A relation among geology, tectonics, andvelocity structure, western to central Nevada Basin andRange, Geol. Soc. Am. Bull., 104, 1178–1192.
Catchings, R., and W. Mooney (1991), Basin and Range crus-tal and upper mantle structure, northwest to central Nevada,J. Geophys. Res., 96, 6247–6267.
Chapman, R., and C. Bishop (1968), Bouguer gravity map ofCalifornia, Alturas Sheet, scale 1:250,000, Calif. Div. ofMines and Geol., Sacramento.
Christensen, N., and W. Mooney (1995), Seismic velocitystructure and composition of the continental crust: A globalview, J. Geophys. Res., 100, 9761–9788.
Christiansen, R., R. Yeats, S. Graham, W. Niem, A. Niem,and P. Snavely (1992), Post-Laramide geology of the U.S.Cordilleran region, in The Geology of North America, vol.G2, The Cordilleran Orogen: Conterminous U. S., editedby B. Burchfiel, P. W. Lipman, and M. L. Zoback,pp. 261–406, Geol. Soc. of Am., Boulder, Colo.
Colgan, J., T. Dumitru, and E. Miller (2004), Diachroneity ofBasin and Range extension and Yellowstone hotspot volcan-ism in northwestern Nevada, Geology, 32, 121–124.
Colgan, J., T. Dumitru, M. McWilliams, and E. Miller (2006a),Timing of Cenozoic volcanism and Basin and Range exten-sion in northwestern Nevada: New constraints from thenorthern Pine Forest Range, Geol. Soc. Am. Bull., 118,126–139.
Colgan, J., T. Dumitru, E. Miller, and P. Reiners (2006b),Cenozoic tectonic evolution of the Basin and Range Pro-vince in northwestern Nevada, Am. J. Sci., 306, 616–654.
Compton, R. (1960), Contact metamorphism in the Santa RosaRange, Nevada, Geol. Soc. Am. Bull., 71, 1383–1416.
DePaolo, D. (1985), Isotopic studies of processes in maficmagma chambers: I. The Kiglapait Intrusion, Labrador,J. Petrol., 26, 925–951.
Duffield, W., and E. McKee (1986), Geochronology, structure,and basin-range tectonism of the Warner Range, northeasternCalifornia, Geol. Soc. Am. Bull., 97, 142–146.
Emmons, W. (1907), Normal faulting in the Bullfrog District,Nevada, Science, 26, 221–222.
Ernst, W. (1999), Mesozoic petrotectonic development of theSawyers Bar suprasubduction-zone arc, central KlamathMountains, northern California, Geol. Soc. Am. Bull., 111,1217–1232.
Fliedner, M., S. Klemperer, and N. Christensen (2000),Three-dimensional seismic model of the Sierra NevadaArc, California, and its implications for crustal and uppermantle composition, J. Geophys. Res., 105, 10,899–10,921.
Fosdick, J., A. Egger, J. Colgan, B. Surpless, E. Miller, andD. Lerch (2005), Cenozoic evolution of the northwesternboundary of the Basin and Range: Geologic constraints fromthe Warner Range and Surprise Valley region, Geol. Soc. Am.Abstr. Programs, 37, 70.
Gans, P. (1988), An open-system, two-layer crustal stretchingmodel for the eastern Great Basin, Tectonics, 6, 1–12.
GeochemistryGeophysicsGeosystems G3G3
lerch et al.: basin and range transition zone 10.1029/2006GC001429
19 of 21

Gans, P., G. Mahood, and E. Schermer (1989), Synextensionalmagmatism in the Basin and Range Province: A case studyfrom the eastern Great Basin, Geol. Soc. Am. Spec. Pap.,233.
Gashawbeza, E., D. Lerch, C. Wilson, S. Klemperer, andE. Miller (2005), Integrated passive and active source seis-mic investigation of the northwestern Basin and Range Pro-vince, Eos Trans. AGU, 86(52), Fall Meet. Suppl., AbstractS41A–0973.
Gilbert, H. J., and A. F. Sheehan (2004), Images of crustalvariations in the intermountain west, J. Geophys. Res.,109, B03306, doi:10.1029/2003JB002730.
Girty, G., R. Hanson, M. Girty, R. Schweickert, D. Harwood,A. Yoshinobu, K. Bryan, J. Skinner, and C. Hill (1995),Timing of emplacement of the Haypress Creek and EmigrantGap plutons: Implications for the timing and controls ofJurassic orogenesis, northern Sierra Nevada, California, inJurassic Magmatism and Tectonics of the North AmericanCordillera, edited by D. Miller and C. Busby, Geol. Soc. Am.Spec. Pap., 299, 191–202.
Glen, J., D. Lerch, S. Klemperer, and D. Ponce (2005), Seis-mic refraction and potential field modeling from the north-western Basin and Range transition zone, Nevada andCalifornia, Eos Trans. AGU, 86(52), Fall Meet. Suppl.,Abstract T51D-1367.
Hill, D., and L. Pakiser (1976), Seismic-refraction study ofcrustal structure between the Nevada Test Site and Boise,Idaho, Geol. Soc. Am. Bull., 78, 685–704.
Holbrook, W. (1990), The crustal structure of the northwestBasin and Range Province, Nevada, J. Geophys. Res., 95,21,843–21,869.
Holbrook, W., R. Catchings, and C. Jarchow (1991), Origin ofdeep crustal reflections: Implications of coincident seismicrefraction and reflection data in Nevada, Geology, 19, 175–179.
Irwin, W. (2003), Correlation of the Klamath Mountains andSierra Nevada, U.S. Geol. Surv. Open File Rep., OF02-0490.
Irwin, W., and J. Wooden (2001), Map showing plutons andaccreted terranes of the Sierra Nevada, California with atabulation of U/Pb isotopic ages, U.S. Geol. Surv. Open FileRep., OF01-0229.
Jarchow, C., G. Thompson, R. Catchings, and W. Mooney(1993), Seismic evidence for active magmatic underplatingbeneath the Basin and Range Province, western UnitedStates, J. Geophys. Res., 98, 22,095–22,108.
Jennings, C., R. Strand, and T. Rogers (1977), Geologic mapof California, scale 1:750,000, Calif. Div. of Mines andGeol., Sacramento.
Klemperer, S., T. Hauge, E. Hauser, J. Oliver, and C. Potter(1986), The Moho in the northern Basin and Range Pro-vince, Nevada, along the COCORP 40�N seismic reflectiontransect, Geol. Soc. Am. Bull., 97, 603–618.
Lerch, D., J. Colgan, E. Miller, and M. McWilliams (2005a),Tectonic and magmatic evolution of the northwestern Basinand Range transition zone: Mapping and geochronologyfrom the Black Rock Range, NV, Geol. Soc. Am. Abstr.Programs, 37, 70.
Lerch, D., S. Klemperer, K. Stokoe, and F. Menq (2005b),Application of the NEES T-Rex vibrator for 3-componentcrustal reflection/refraction profiling: 2004 test in the Basinand Range, Eos Trans. AGU, 86(52), Fall Meet. Suppl.,Abstract S23B-0258.
Louie, J., W. Thelen, S. Smith, J. Scott, M. Clark, andS. Pullammanappallil (2004), The northern Walker Lanerefraction experiment: Pn arrivals and the northern SierraNevada root, Tectonophysics, 388, 253–269.
Ludwig, W., J. Nafe, and C. Drake (1970), Seismic refraction,in The Sea, vol. 4, edited by A. Maxwell, pp. 53–84, JohnWiley, Hoboken, N. J.
McKee, E. (1971), Tertiary igneous chronology of the GreatBasin of the western United States: Implications for tectonicmodels, Geol. Soc. Am. Bull., 82, 3497–3501.
McKenzie, D., F. Nimmo, J. Jackson, P. Gans, and E. Miller(2000), Characteristics and consequences of flow in the low-er crust, J. Geophys. Res., 105, 11,029–11,046.
McKnight, B. (1984), Stratigraphy and sedimentology of thePayne Cliffs Formation, southwestern Oregon, in Oregonand California, Field Trip Guidebook—Pacific Section,vol. 42, Geology of the Upper Cretaceous HornbrookFormation, edited by T. Nilsen, pp. 187–194, Soc. of Econ.Paleontol. and Mineral., Tulsa, Okla.
Miller, E., M. Miller, J. Wright, and R. Madrid (1992), LatePaleozoic paleogeographic and tectonic evolution of thewestern U. S. Cordillera, in Decade of North American Geol-ogy, vol. 1, Neotectonics of North America, edited byD. Slemmons et al., pp. 57 –106, Geol. Soc. of Am.,Boulder, Colo.
Miller, E., T. Dumitru, R. Brown, and P. Gans (1999), RapidMiocene slip on the Snake Range–Deep Creek Range faultsystem, east-central Nevada, Geol. Soc. Am. Bull., 111, 886–905.
Miller, E., J. Colgan, B. Surpless, S. Riedel, A. Strickland,A. Egger, and D. Benoit (2005), Drill core data from theWarner Range and Surprise Valley, Geol. Soc. Am. Abstr.Programs, 37, 203–204.
Mooney, W., and C. Weaver (1989), Regional crustal structureand tectonics of the Pacific coastal states: California, Ore-gon, and Washington, in Geophysical Framework of theContinental United States, edited by L. Pakiser andW. Mooney, Mem. Geol. Soc. Am., 172, 129–161.
Morgan, P., and W. Gosnold (1989), Heat flow and thermalregimes in the continental United States, in GeophysicalFramework of the Continental United States, edited byL. Pakiser and W. Mooney, Mem. Geol. Soc. Am., 172,493–522.
Nilsen, T. (1993), Stratigraphy of the Cretaceous HornbrookFormation, southern Oregon and northern California, U. S.Geol. Surv. Prof. Pap., P1521.
Noble, D., E. McKee, J. Smith, and M. Korringa (1970),Stratigraphy and geochronology of Miocene volcanic rocksin northwestern Nevada, U.S. Geol. Surv. Prof. Pap.,P0700-D, D23–D32.
Parsons, T., G. Thompson, and N. Sleep (1994), Mantle plumeinfluence on the Neogene uplift and extension of the U.S.western Cordillera?, Geology, 22, 83–86.
Perry, F., D. DePaolo, and W. Baldridge (1993), Neodymiumisotopic evidence for decreasing crustal contributions to Cen-ozoic ignimbrites of the western United States: Implicationsfor the thermal evolution of the Cordilleran crust, Geol. Soc.Am. Bull., 105, 872–882.
Pierce, L., and K. Morgan (1992), The track of the Yellow-stone hot spot: Volcanism, faulting, and uplift, in RegionalGeology of Eastern Idaho and Western Wyoming, edited byP. Link, M. Kuntz, and L. Platt, Mem. Geol. Soc. Am., 179,1–53.
Plouff, D. (1985), Many gravity lows may reflect Cenozoicplutons beneath volcanic terranes of the western UnitedStates, Eos Trans. AGU, 66, 845.
Plouff, D. (1997), Resource assessment of the Bureau of LandManagement’s Winnemucca District and Surprise ResourceArea, northwest Nevada and northeast California, U.S. Geol.Surv. Open File Rep., OF97-99.
GeochemistryGeophysicsGeosystems G3G3
lerch et al.: basin and range transition zone 10.1029/2006GC001429
20 of 21

Ponce, D. A. (1997), Gravity map of Nevada, U.S. Geol. Surv.Digital Data Ser., DDS-42.
Quinn, M., J. Wright, and S. Wyld (1997), Happy Creekigneous complex and tectonic evolution of the early Meso-zoic arc in the Jackson Mountains, northwest Nevada, Geol.Soc. Am. Bull., 109, 461–482.
Seedorff, E. (1991), Magmatism, extension, and ore depositsof Eocene to Holocene age in the Great Basin: Mutual effectsand preliminary proposed genetic relationships, in Geologyand Ore Deposits of the Great Basin, edited by G. Raines etal., pp. 133–178, Geol. Soc. of Nev., Reno.
Smith, D., P. Gans, and E. Miller (1991), Palinspastic restora-tion of Cenozoic extension in the central and eastern Basinand Range Province at latitude 39–40�N, in Geology andOre Deposits of the Great Basin, edited by G. Raines et al.,pp. 75–86, Geol. Soc. of Nev., Reno.
Smith, R., L. Braile, J. Steidtmann, and S. Roberts (1993),Topographical signature, space-time evolution, and physicalproperties of the Yellowstone–Snake River plain volcanicsystem: The Yellowstone hotspot, in Geology of Wyoming,Mem., vol. 5, edited by A. Snoke, J. Steidtmann, andS. Roberts, pp. 694–754, Geol. Surv. of Wyo., Laramie.
Snyder, D., C. Roberts, R. Saltus, and R. Sikora (1981), Mag-netic tape containing the principal facts of 64402 gravitystations in the state of California, Rep. PB82-168287, U.S.Geol. Surv., Reston, Va.
Stewart, B., and D. DePaolo (1990), Isotopic studies of pro-cesses in mafic magma champers: II. The Skaergaard Intru-sion, east Greenland, J. Petrol., 104, 125–141.
Stewart, J., and J. Carlson (1978), Geologic map of Nevada,scale 1:500,000, U.S. Geol. Surv., Reston, Va.
Stockli, D. (1999), Regional timing and spatial distribution ofMiocene extension in the northern Basin and Range Pro-vince, Ph.D. thesis, Stanford Univ., Stanford, Calif.
Stoerzel, A., and S. Smithson (1998), Two-dimensional traveltime inversion for crustal P and S wave velocity structure ofthe Ruby Mountains metamorphic core complex, NE Neva-da, J. Geophys. Res., 103, 21,121–21,143.
Surpless, B. E., D. F. Stockli, A. Trevor Dumitru, and E. L.Miller (2002), Two-phase westward encroachment of Basinand Range extension into the northern Sierra Nevada, Tec-tonics, 21(1), 1002, doi:10.1029/2000TC001257.
Talwani, M., J. Worzel, and M. Landisman (1959), Rapidgravity computations for two-dimensional bodies with appli-cation to the Mendocino submarine fracture zone, PacificOcean, J. Geophys. Res., 64, 49–59.
Trehu, A., I. Asudeh, T. Brocher, J. Luetgert, W. Mooney,J. Nabelek, and Y. Nakamura (1994), Crustal structure ofthe Cascadia Forearc, Science, 266, 237–243.
Walker, G., and N. MacLeod (1991), Geologic map of Oregon,scale 1:500,000, U.S. Geol. Surv., Reston, Va.
Wernicke, B. (1992), Cenozoic extensional tectonics ofthe U.S. Cordillera, in Decade of North AmericanGeology, vol. 1, Neotectonics of North America, editedby D. Slemmons et al., pp. 553–581, Geol. Soc. ofAm., Boulder, Colo.
Wyld, S. (1992), Geology and geochronology of the Pine For-est Range, northwest Nevada: Stratigraphic, structural andmagmatic history, and regional implications, Ph.D. thesis,Stanford Univ., Stanford, Calif.
Wyld, S. (1996), Early Jurassic deformation in the Pine ForestRange, northwest Nevada, and implications for Cordillerantectonics, Tectonics, 15, 566–583.
Wyld, S. (2000), Triassic evolution of the arc and backarc ofnorthwestern Nevada, and evidence for extensional tecton-ism, in Paleozoic and Triassic Paleogeography and Tec-tonics of Western Nevada and Northern California, editedby M. Soreghan and G. Gehrels, Spec. Pap. Geol. Soc. Am.,347, 185–207.
Wyld, S. (2002), Structural evolution of a Mesozoic backarcfold-and-thrust belt in the U. S. Cordillera: New evidencefrom northern Nevada, Geol. Soc. Am. Bull., 114, 1452–1468.
Wyld, S., and J. Wright (2001), New evidence for Cretaceousstrike-slip faulting in the United States Cordillera and impli-cations for terrane-displacement, deformation patterns, andplutonism, Am. J. Sci., 301, 150–181.
Zelt, B., R. Ellis, and R. Clowes (1993), Crustal structure inthe eastern Insular and southernmost Coast belts, CanadianCordillera, Can. J. Earth Sci., 30, 1014–1027.
Zelt, C., and R. Smith (1992), Seismic traveltime inversion for2-D crustal velocity structure, Geophys. J. Int., 108, 16–34.
Zoback, M., and G. Thompson (1978), Basin and Range riftingin northern Nevada: Clues from a mid-Miocene rift and itssubsequent offsets, Geology, 6, 111–116.
Zoback, M., E. McKee, R. Blakely, and G. Thompson (1994),The northern Nevada rift: Regional tectono-magmatic rela-tions and middle Miocene stress direction, Geol. Soc. Am.Bull., 106, 371–382.
Zucca, J., G. Fuis, B. Milkereit, W. Mooney, and R. Catchings(1986), Crustal structure of northeastern California, J. Geo-phys. Res., 91, 7359–7382.
GeochemistryGeophysicsGeosystems G3G3
lerch et al.: basin and range transition zone 10.1029/2006GC001429
21 of 21