crustal structure from an obs survey of the nootka fault zone off
TRANSCRIPT

Geophys. J. R . astr. Soc. (1982) 68,21-41
Crustal structure from an OBS survey of the Nootka fault zone off western Canada
D. AU and R. M. owes Department of Geophysics and Astronomy, University ofBritish Columbia, Vancouver V6T 1 W5, Canada
Received 1981 February 5 ; in original form 1980 September 29
Summary. The Nootka fault zone is the boundary between the small Explorer and Juan de Fuca plates which are situated between the America and Pacific plates off western Canada. To investigate the crustal structure in the region, three explosive/large airgun refraction lines were shot into three ocean bottom seismometers (OBSs) with three-component geophone assemblies. In this phase of the study, P-wave velocity-depth models are interpreted by comparison of the travel time and amplitude characteristics of the observed data with theoretical seismograms computed using a WKBJ algorithm. The interpretation gives relatively consistent results for the upper crust. However, the structure of the lower crust is significantly different among the various profiles. Upper mantle velocities range from 7.5 to 8.3 kms-’ and the sub- bottom crustal thickness vanes from 6.4 to 11 km. Nevertheless, these seismic models are consistent in general terms with oceanic crustal models repre- sented by ophiolite complexes. Some aspects of the differences among profiles can be explained by consideration of a recent tectonic model for the development of the fault zone. This requires, within a 1 Myr time interval, variations in the process of crustal formation at the ridge, crustal ‘maturing’, or both. The abnormally thick crust near a spreading centre may result in part from the complex interaction of the Juan de Fuca and Explorer plates with the larger and older America and Pacific plates. Upper mantle velocity varia- tions are consistent with the concept of velocity anisotropy. The different record sections show that seismic energy is attenuated for ray paths traversing the Nootka fault zone.
1 Introduction
The north-east Pacific Ocean off the coast of western Canada has played a significant role in the development of theories related to plate tectonics. Dating from the original proposals of Wilson (1965) and Vine & Wilson (1965) based on the magnetic anomaly map of Raff & Mason (1961), the region has been a plate tectonic study area for many scientists. The general tectonic configuration and approximate relative motions of the plates have been
Dow
nloaded from https://academ
ic.oup.com/gji/article/68/1/27/705365 by guest on 04 January 2022
28
established for some time (e.g. Atwater 1970). However, certain important and critical details have been worked out only recently. These are discussed in an extensive review by Keen & Hyndman (1979).
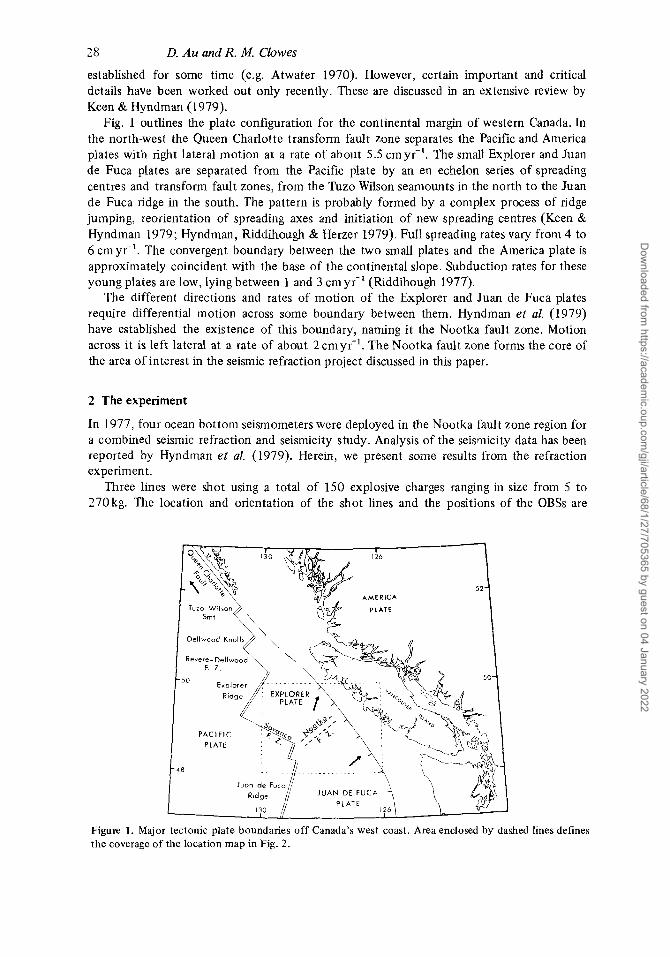
Fig. 1 outlines the plate configuration for the continental margin of western Canada. In the north-west the Queen Charlotte transform fault zone separates the Pacific and America plates with right lateral motion at a rate of about 5.5 cmyr-'. The small Explorer and Juan de Fuca plates are separated from the Pacific plate by an en echelon series of spreading centres and transform fault zones, from the Tuzo Wilson seamounts in the north to the Juan de Fuca ridge in the south. The pattern is probably formed by a complex process of ridge jumping, reorientation of spreading axes and initiation of new spreading centres (Keen & Hyndman 1979; Hyndman, Riddihough & Herzer 1979). Full spreading rates vary from 4 to 6 cm yr-'. The convergent boundary between the two small plates and the America plate is approximately coincident with the base of the continental slope. Subduction rates for these young plates are low, lying between 1 and 3 cm yr-' (Riddihough 1977).
The different directions and rates of motion of the Explorer and Juan de Fuca plates require differential motion across some boundary between them. Hyndman et al. (1979) have established the existence of this boundary, naming it the Nootka fault zone. Motion across it is left lateral at a rate of about 2cmyr-'. The Nootka fault zone forms the core of the area of interest in the seismic refraction project discussed in this paper.
D. Au and R. M. Clowes
2 The experiment
In 1977, four ocean bottom seismometers were deployed in the Nootka fault zone region for a combined seismic refraction and seismicity study. Analysis of the seismicity data has been reported by Hyndman ef al. (1979). Herein, we present some results from the refraction experiment.
Three lines were shot using a total of 150 explosive charges ranging in size from 5 to 270 kg. The location and orientation of the shot lines and the positions of the OBSs are
Figure 1. Major tectonic plate boundaries off Canada's west coast. Area enclosed by dashed lines defines the coverage of the location map in Fig. 2.
Dow
nloaded from https://academ
ic.oup.com/gji/article/68/1/27/705365 by guest on 04 January 2022
29 Crustal structure of the Nootka fault zone
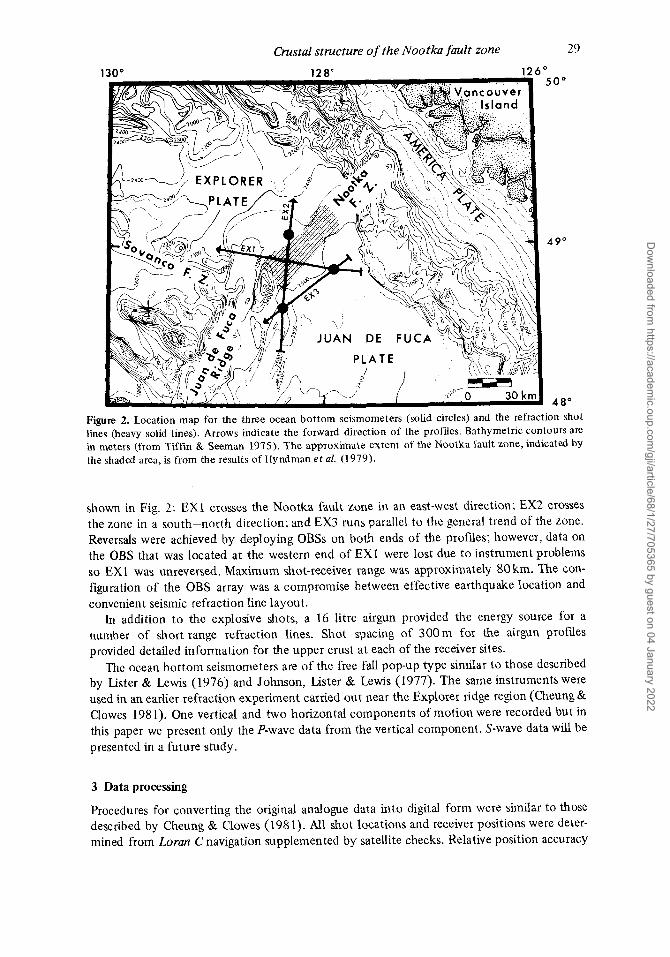
Figure 2. Location map for the three ocean bottom seismometers (solid circles) and the refraction shot lines (heavy solid lines). Arrows indicate the forward direction of the profiles. Bathymetric contours are in meters (from Tiffin & Seeman 1975). The appmximate extent of the Nootka fault zone, indicated by the shaded area, is from the results of Hyndman et al. (1979).
shown in Fig. 2: EX1 crosses the Nootka fault zone in an east-west direction; EX2 crosses the zone in a south-north direction; and EX3 runs parallel to the general trend of the zone. Reversals were achieved by deploying OBSs on both ends of the profiles; however, data on the OBS that was located at the western end of EX1 were lost due to instrument problems so EX1 was unreversed. Maximum shot-receiver range was approximately 80 km. The con- figuration of the OBS array was a compromise between effective earthquake location and convenient seismic refraction line layout.
In addition to the explosive shots, a 16 litre airgun provided the energy source for a number of short range refraction lines. Shot spacing of 300m for the airgun profdes provided detailed information for the upper crust at each of the receiver sites.
The ocean bottom seismometers are of the free fall pop-up type similar to those described by Lister & Lewis (1976) and Johnson, Lister & Lewis (1977). The same instruments were used in an earlier refraction experiment carried out near the Explorer ridge region (Cheung & Clowes 1981). One vertical and two horizontal components of motion were recorded but in this paper we present only the P-wave data from the vertical component. S-wave data will be presented in a future study.
3 Data processing
Procedures for converting the original analogue data into digital form were similar to those described by Cheung & Clowes (1981). All shot locations and receiver positions were deter- mined from Loran C navigation supplemented by satellite checks. Relative position accuracy
Dow
nloaded from https://academ
ic.oup.com/gji/article/68/1/27/705365 by guest on 04 January 2022
30 D. Au and R. M. Clowes
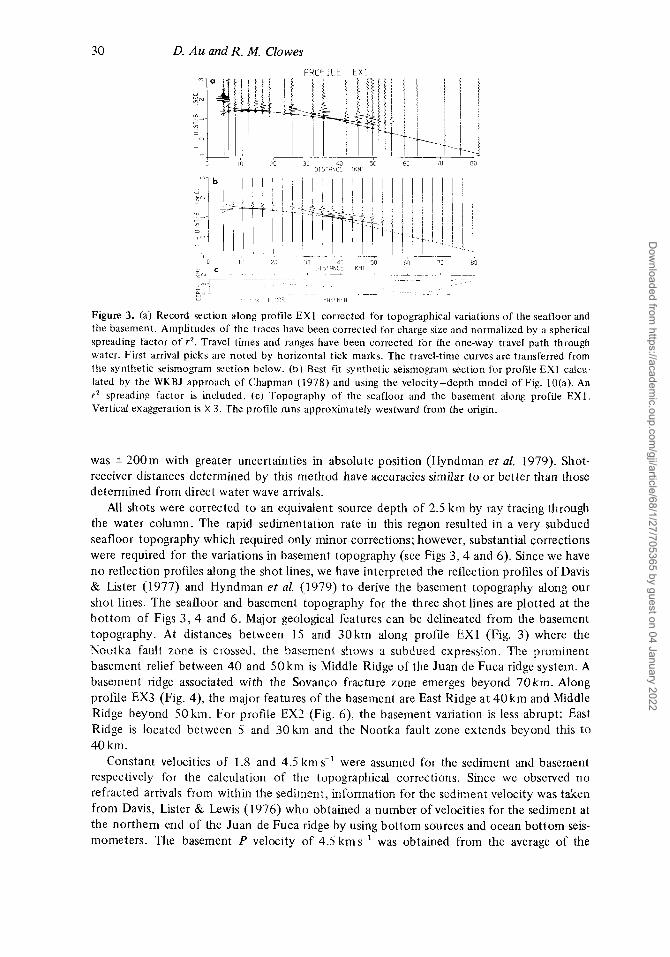
Figure 3. (a) Record section along profile EX1 corrected for topographical variations of the seafloor and the basement. Amplitudes of the traces have been corrected for charge size and normalized by a spherical spreading factor of rz . Travel times and ranges have been corrected for the one-way travel path through water. t i r s t arrival picks are noted by horizontal tick marks. The travel-time curves are transferred from the synthetic seismogram section below. (b) Best fit synthetic seismogram section for profile EX1 calcu. lated by the WKBJ approach of Chapman (1978) and using the velocity-depth model of Fig. 10(a). An r z spreading Factor is included. (c) Topography of the seafloor and the basement along prof ie E X l . Vertical exaggeration is X 3. The profile runs approximately westward from the origin.
was 200m with greater uncertainties in absolute position (Hyndman et al. 1979). Shot- receiver distances determined by this method have accuracies similar to or better than those determined from direct water wave arrivals.
All shots were corrected to an equivalent source depth of 2.5 km by ray tracing through the water column. The rapid sedimentation rate in this region resulted in a very subdued seafloor topography which required only minor corrections; however, substantial corrections were required for the variations in basement topography (see Figs 3 , 4 and 6). Since we have no reflection profiles along the shot lines, we have interpreted the reflection profdes of Davis & Lister (1977) and Hyndman et al. (1979) to derive the basement topography along our shot lines. The seafloor and basement topography for the three shot lines are plotted at the bottom of Figs 3, 4 and 6. Major geological features can be delineated from the basement topography. At distances between 15 and 30km along profile EX1 (Fig. 3) where the Nootka fault zone is crossed, the basement shows a subdued expression. The prominent basement relief between 40 and 50 km is Middle Ridge of the Juan de Fuca ridge system. A basement ridge associated with the Sovanco fracture zone emerges beyond 70km. Along profile EX3 (Fig. 4), the major features of the basement are East Ridge at 40 km and Middle Ridge beyond 50 km. For profile EX2 (Fig. 6), the basement variation is less abrupt: East Ridge is located between 5 and 30 km and the Nootka fault zone extends beyond this to 40 km.
Constant velocities of 1.8 and 4.5 km sC1 were assumed for the sediment and basement respectively for the calculation of the topographical corrections. Since we observed no refracted arrivals from within the sediment, information for the sediment velocity was taken from Davis, Lister & Lewis (1976) who obtained a number of velocities for the sediment at the northern end of the Juan de Fuca ridge by using bottom sources and ocean bottom seis- mometers. The basement P velocity of 4.5 kms-' was obtained from the average of the
Dow
nloaded from https://academ
ic.oup.com/gji/article/68/1/27/705365 by guest on 04 January 2022
Crustal structure of the Nootka fault zone 31
PROFILE EX3
0 10 20 30 40 50 60 D I S T R N C E l K M l
10 20 30 40 50 60 7 - v - p ~ T
DISTANCE l K M l -L- - - .~ ~.
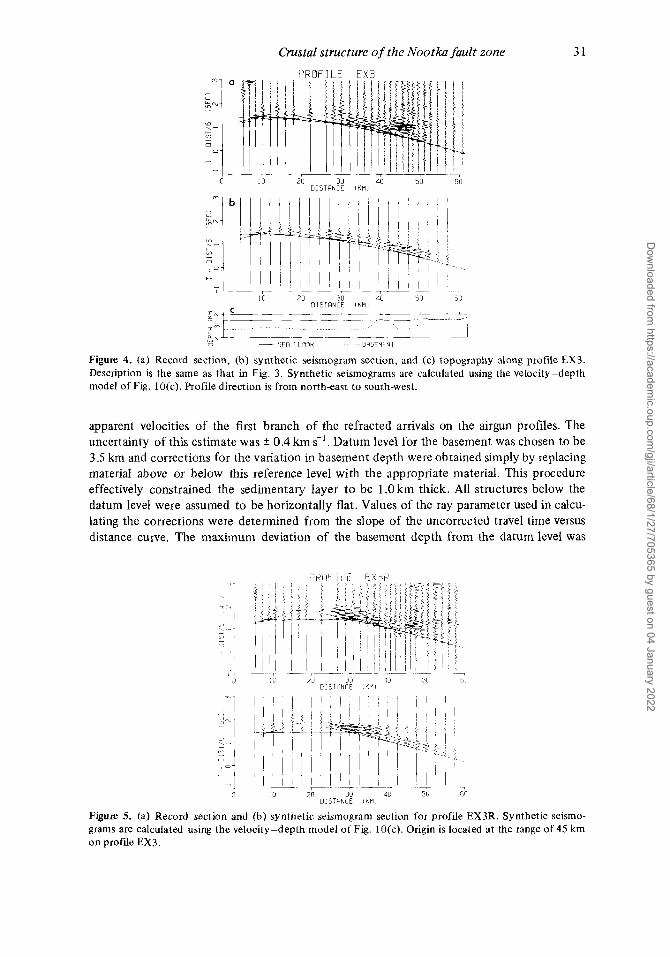
Figure 4. (a) Record section, (b) synthetic seismogram section, and (c) topography along profile EX3 Descnption is the same as that in Fig 3 Synthetic seismograms are calculated using the velocity-depth model of Fig. lO(c). Profile direction is from northeast to south-west.
apparent velocities of the first branch of the refracted arrivals on the airgun profiles. The uncertainty of this estimate was * 0.4 km s-'. Datum level for the basement was chosen to be 3.5 krn and corrections for the variation in basement depth were obtained simply by replacing material above or below this reference level with the appropriate material. This procedure effectively constrained the sedimentary layer to be 1.Okm thick. All structures below the datum level were assumed to be horizontally flat. Values of the ray parameter used in calcu- lating the corrections were determined from the slope of the uncorrected travel time versus distance curve. The maximum deviation of the basement depth from the datum level was
. o 70 30 46 5G U:5:HNCE r K N I
Figure 5. (a) Record section and (b) synthetic seismogram section for profile EX3R. Synthetic seismo- grams are calculated using the velocity-depth model of Fig. lO(c). Origin is located at the range of 45 km on profiie EX3.
Dow
nloaded from https://academ
ic.oup.com/gji/article/68/1/27/705365 by guest on 04 January 2022

32 D. Au and R. M. Clowes P R O F I L E EX2
2: 30 4C sc OliTANiE < M I
~ ~ - - _ ~ ~ 2 - -~ - i t , ,,"4 +U?i tit I
Figure 6. (a) Record section, (b) synthetic seismogram section, and (c) topography along profile EX2 Descnption is the same as that rn Fig. 3. Synthetic seismograms are calculated using the velocity-deptl model of Fig. lo@). Profile duection is from south to north.
approximately 1 .O km which corresponded to a correction of 0.3 s. A vertical travel path was assumed in making corrections for the different receiver depths. This was acceptable because both the water and basement depths at the OBS sites differed only slightly from the reference levels and the actual angIes of emergence were estimated to be near vertical.
As with other marine refraction studies in areas of considerable topography (Spudich & Orcutt 1980a; Detrick & h r d y 1980), the topographical correction was the largest uncer- tainty in our data due to possible errors in the velocity estimates of the upper layers and uncertainties about the ray entry points. Errors associated with the topographical correc- tions are estimated to be in the order of * 0.03 s.
Corrected record sections of the explosion profiles are shown in Figs 3(a) to 7(a) while examples of airgun profdes are given in Figs S(a) and 9(a). For the explosion profiles, the
'KUt 11.t FX22
Figure 7. (a) Record section and (b) synthetic seismogram section for profile EX2R. Synthetic seismo- grams are calculated using the velocity-depth model of Fig. lo@). Origin is located at the range of 5 3 km on profile EX2. Profile direction is from north to south.
Dow
nloaded from https://academ
ic.oup.com/gji/article/68/1/27/705365 by guest on 04 January 2022
Crustal structure o f the Nootka fault zone 33
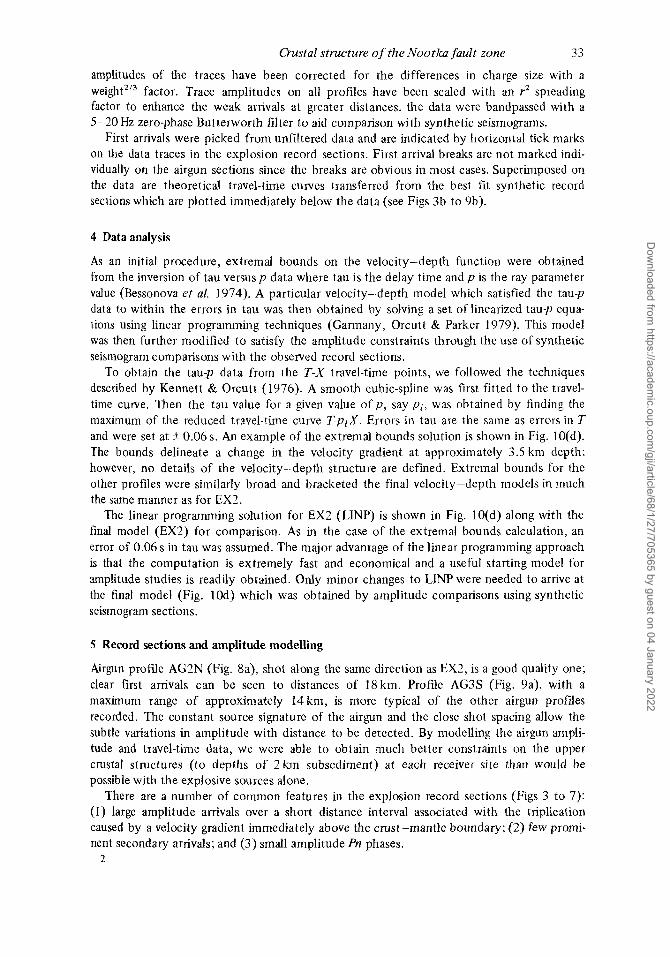
amplitudes of the traces have been corrected for the differences in charge size with a eight^'^ factor. Trace amplitudes on all profiles have been scaled with an r2 spreading factor to enhance the weak arrivals at greater distances. the data were bandpassed with a 5-20 Hz zero-phase Butterworth filter to aid comparison with synthetic seismograms.
First arrivals were picked from unfiltered data and are indicated by horizontal tick marks on the data traces in the explosion record sections. First arrival breaks are not marked indi- vidually on the airgun sections since the breaks are obvious in most cases. Superimposed on the data are theoretical travel-time curves transferred from the best fit synthetic record sections which are plotted immediately below the data (see Figs 3b to 9b).
4 Data analysis
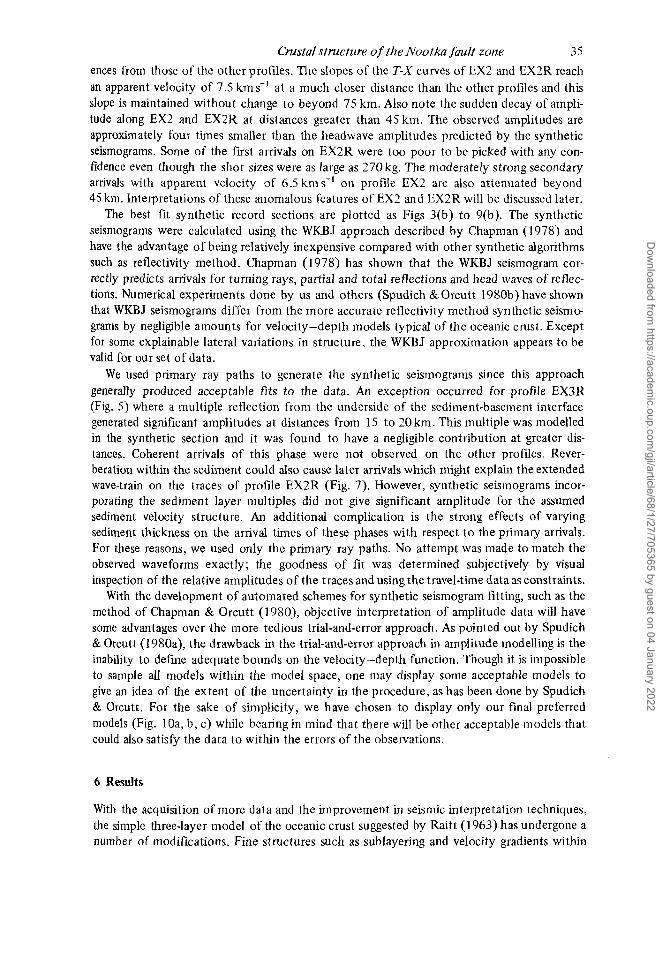
As an initial procedure, extremal bounds on the velocity-depth function were obtained from the inversion of tau versus p data where tau is the delay time and p is the ray parameter value (Bessonova et al. 1974). A particular velocity-depth model which satisfied the tau-p data to within the errors in tau was then obtained by solving a set of linearized tau-p equa- tions using linear programming techniques (Garmany, Orcutt & Parker 1979). This model was then further modified to satisfy the amplitude constraints through the use of synthetic seismogram comparisons with the observed record sections.
To obtain the tau-p data from the T-X travel-time points, we followed the techniques described by Kennett & Orcutt (1976). A smooth cubic-spline was first fitted to the travel- time curve. Then the tau value for a given value o fp , say p i , was obtained by finding the maximum of the reduced travel-time curve T - p i X . Errors in tau are the same as errors in T and were set at ? 0.06 s. An example of the extremal bounds solution is shown in Fig. 10(d). The bounds delineate a change in the velocity gradient at approximately 3.5 kin depth; however, no details of the velocity-depth structure are defined. Extremal bounds for the other profdes were similarly broad and bracketed the final velocity-depth models in much the same manner as for EX2.
The linear programming solution for EX2 (LINP) is shown in Fig. 10(d) along with the final model (EX2) for comparison. As in the case of the extremal bounds calculation, an error of 0.06 s in tau was assumed. The major advantage of the linear programming approach is that the computation is extremely fast and economical and a useful starting model for amplitude studies is readily obtained. Only minor changes to LINP were needed to arrive at the final model (Fig. 10d) which was obtained by amplitude comparisons using synthetic seismogram sections.
5 Record sections and amplitude modelling
Airgun profile AG2N (Fig. 8a), shot along the same direction as EX2, is a good quality one; clear first arrivals can be seen to distances of 18km. Profde AG3S (Fig. 9a), with a maximum range of approximately 14km, is more typical of the other airgun profdes recorded. The constant source signature of the airgun and the close shot spacing allow the subtle variations in amplitude with distance to be detected. By modelling the airgun ampli- tude and travel-time data, we were able to obtain much better constraints on the upper crustal structures (to depths of 2km subsediment) at each receiver site than would be possible with the explosive sources alone.
There are a number of common features in the explosion record sections (Figs 3 to 7): ( I ) large amplitude arrivals over a short distance interval associated with the triplication caused by a velocity gradient immediately above the crust-mantle boundary; (2) few promi- nent secondary arrivals; and (3) small amplitude Pn phases.
2
Dow
nloaded from https://academ
ic.oup.com/gji/article/68/1/27/705365 by guest on 04 January 2022

34 D. Au and R. M. Clowes LE FIG2N
' 0 I -- 71 , v
4 b 8 10 12 14 16 16 DISTANCE I K M I
,I
4 6 8 10 12 14 16 16 D I S T A N C E I K M l
Figure 8. (a) Record section and (b) synthetic seismogram section of the airgun profile AG2N shot along the same direction as EX2. The synthetic seismograms were calcutated to a distance of 18 km using the same velocity-depth model as EX2 but with a denser trace spacing. Some subcritical reflection travel- time branches are included, ihough the amplitudes of these arrivals are small.
There are also a number of important differences among the record sections. The distance range over which the large amplitude triplication occurs differs from profile to profile and even between forward and reverse profiles. For example, the triplication is near 25 km in EX2 but is near 35 krn in EX2R (Figs 6a and 7a). This indicates that there are some lateral variations in the structures at depth and that the crustal thickness varies between the different locations. The travel-time curves of EX2 and EX2R also show noticeable differ-
a PROFILE flG3S
tot --I 4 6 8 10 12 14
DISTHNCE (KMI
4 6 8 10 12 14 D I S T R N C E ( K M I
Figure 9. (a) Record section and (b) synthetic seismogram section for airgun profile AG3S shot along the same direction as profile EX2R. The extended coda on traces between 12 and 14 k m is well modelled by the synthetic seismograms. The large amplitude secondary arrivals between 7 and 8 km, probably due t o niultiplc rcllecled phascs. were no1 modelled. The velocity-depth model used in thc calculation of ihc synthetic seismograms is the same as for EX2R.
Dow
nloaded from https://academ
ic.oup.com/gji/article/68/1/27/705365 by guest on 04 January 2022
&stal structure of the NootJza fault zone 35 ences from those of the other profiles. The slopes of the T-X curves of EX2 and EX2R reach an apparent velocity of 7.5 km s-' at a much closer distance than the other profdes and this slope is maintained without change to beyond 75 km. Also note the sudden decay of ampli- tude along EX2 and EX2R at distances greater than 45 km. The observed amplitudes are approximately four times smaller than the headwave amplitudes predicted by the synthetic seismograms. Some of the first arrivals on EX2R were too poor to be picked with any con- fidence even though the shot sizes were as large as 270 kg. The moderately strong secondary arrivals with apparent velocity of 6.5 km s-' on profie EX2 are also attenuated beyond 45 km. Interpretations of these anomalous features of EX2 and EX2R will be discussed later.
The best fit synthetic record sections are plotted as Figs 3(b) to 9(b). The synthetic seismograms were calculated using the WKBJ appraach described by Chapman (1978) and have the advantage of being relatively inexpensive compared with other synthetic algorithms such as reflectivity method. Chapman (1978) has shown that the WKBJ seismogram cor- rectly predicts arrivals for turning rays, partial and total reflections and head waves of reflec- tions. Numerical experiments done by us and others (Spudich & Orcutt 1980b) have shown that WKBJ seismograms differ from the more accurate reflectivity method synthetic seismc- grams by negligible amounts for velocity-depth models typical of the oceanic crust. Except for some explainable lateral variations in structure, the WKBJ approximation appears to be valid for our set of data.
We used primary ray paths to generate the synthetic seismograms since this approach generally produced acceptable f i t s to the data. An exception occurred for profile EX3R (Fig. 5) where a multiple reflection from the underside of the sediment-basement interface generated significant amplitudes at distances from 15 to 20km. This multiple was modelled in the synthetic section and it was found to have a negligible contribution at greater dis- tances. Coherent arrivals of this phase were not observed on the other profiles. Rever- beration within the sediment could also cause later arrivals which might explain the extended wave-train on the traces of profile EX2R (Fig. 7). However, synthetic seismograms incor- porating the sediment layer multiples did not give significant amplitude for the assumed sediment velocity structure. An additional complication is the strong effects of varying sediment thickness on the arrival times of these phases with respect to the primary arrivals. For these reasons, we used only the primary ray paths. No attempt was made to match the observed waveforms exactly; the goodness of fit was determined subjectively by visual inspection of the relative amplitudes of the traces and using the travel-time data as constraints.
With the development of automated schemes for synthetic seismogram fitting, such as the method of Chapman & Orcutt (1980), objective interpretation of amplitude data will have some advantages over the more tedious trial-and-error approach. As pointed out by Spudich & Orcutt (1980a), the drawback in the trial-and-error approach in amplitude modelling is the inability to define adequate bounds on the velocity-depth function. Though it is impossible to sample all models within the model space, one may display some acceptable models to give an idea of the extent of the uncertainty in the procedure, as has been done by Spudich & Orcutt. For the sake of simplicity, we have chosen to display only our fmal preferred models (Fig. 10a, b, c) while bearing in mind that there will be other acceptable models that could also satisfy the data to within the errors of the observations.
6 Results
With the acquisition of more data and the improvement in seismic interpretation techniques, the simple three-layer model of the oceanic crust suggested by Raitt (1963) has undergone a number of modifications. Fine structures such as sublayering and velocity gradients within
Dow
nloaded from https://academ
ic.oup.com/gji/article/68/1/27/705365 by guest on 04 January 2022

36 D. AM and R. M. Clowes VELOCi 1 Y I K M / I I
4 b 8 "r 1- -i
€ X I
a
VELOCITY I K M / S I 0 2 4 6 8
VELOCITY I K N / S I 2 4 6 8
I I .>! ,
;r_-
C
I X!R I \ I
I . r
h . !
N 1
d ~
Figure 10. (a), (b) and (c): velocity-depth curves for all the profiles. Depths are measured from the sea- floor. The sedimentary layer on all profiles is constrained to be l k m thick and has a velocity of 1.8 km s-l. The upper crustal models to a subsediment depth o f 2 km arc derived from the airgun data. (d) Iktremal bounds for profile E X 2 are denoted by squares. The linear programming solution L I N P (dashed line) can be compared with the final model for EX2 (solid line).
1.8
H . i I
7 . '>
ES: LAYER
Figure 11. Schematic representation o f the velocity-depth profiles of Fig. 10 in terms of the conven- tional layered model of the oceanic crust. The depth is measured from the seafloor. The numbers are the velocity a t the top of each layer in km s-'. The sediments, layer 1 , are constrained to have a thickness of l.Okm and a velocity of 1 .8km s-l. Layer designations follow those of Christensen & Salisbury (1975). The question marks on the layer 2A-3B boundary of EX3R indicate that no boundary is evident in the velocity-depth curve; the velocity of 6.1 kms- ' is that at the depth marked.
Dow
nloaded from https://academ
ic.oup.com/gji/article/68/1/27/705365 by guest on 04 January 2022
Crustal structure of the Nootka fault zone 37
the layers are commonly found. In addition, there appears to be a systematic variation of the crustal structure with age, location, and tectonic regime of the site.
In this section, we shall discuss the seismic velocity structures for each of the three profiles and their reversals. The final velocity-depth models, shown in Fig. 10(a, b, c), indicate that the crustal structure in the Nootka fault zone region consists of zones of differ- ing velocity gradients rather than distinctive layers. Still, the notion of a layered structure is useful for the purpose of comparison of seismic results; therefore, we have assigned layer divisions to our final velocity-depth profiles in accordance with the characteristics of the velocity gradient in each layer. Fig. 11 is such a schematic representation.
6.1 U P P E R C R U S T
A relatively consistent picture of the upper crust is shown by the velocity-depth profiles in Fig. 10. Immediately below the sediment layer, the velocity ranges from 3.7 to 4.7kms-' and increases with depth at a moderate average velocity gradient of 0.5 km s-' km-' (here- after abbreviated to s-') to a depth of approximately 1.9 km. Then a zone of very high- velocity gradient is found which marks the transition from layer 2A to layer 2B. The average gradient of 1.6 s-' in this zone is the highest that we have encountered. Such a zone is not found in the velocity-depth profile of EX2R; instead, a velocity discontinuity is found at the depth of 1.4 km. However, this feature of EX2R is not well constrained.
Below the transition zone lies layer 2B where the velocity gradient decreases to a lower value of 0.3 s-' except for EX2 and EX2R, for which the velocity gradient remains high at 1.0s-'. At the base oflayer 2B, velocities are found to be in the range of 6.0-6.4kms-'. The combined thickness of layers 2A and 2B ranges from 2.3 to 3.1 km but a lower value of 1.6 km is found for profile EX2R.
6.2 L O W E R C R U S T
Beneath layer 2B, a velocity discontinuity, varying in its degree of sharpness, is interpreted for all profiles except for EX3R where no discontinuity in either the velocity or the gradient is present. Where the discontinuity is observed, it is interpreted to be the boundary between layers 2B and 3A. The structure of the lower crust is sufficiently different among the various profiles to warrant an individual discussion of each.
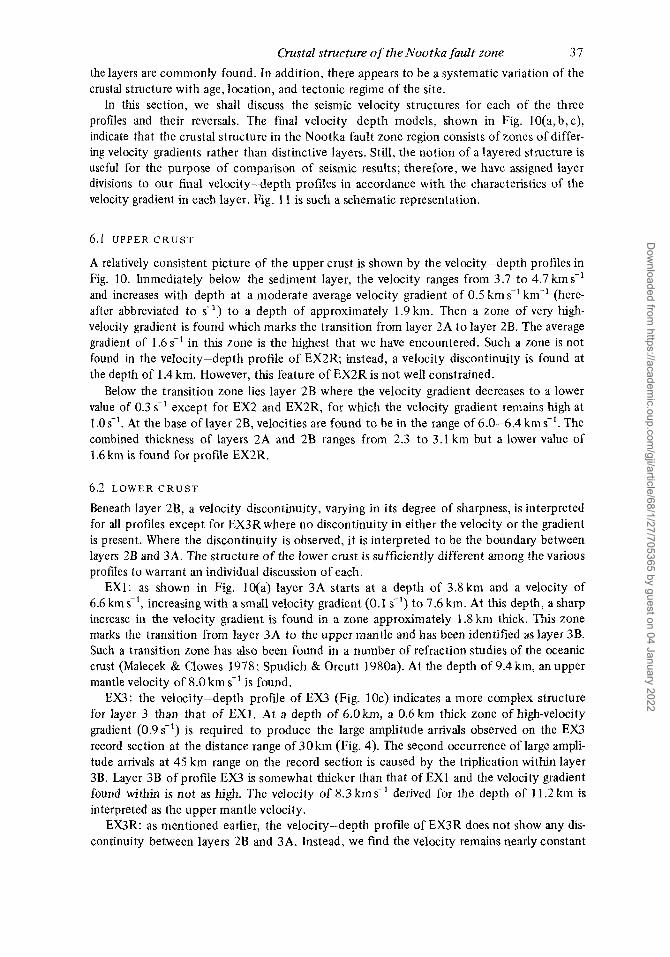
EXI: as shown in Fig. l q a ) layer 3A starts at a depth of 3.8 km and a velocity of 6.6 km s-', increasing with a small velocity gradient (0.1 s-') to 7.6 km. At this depth, a sharp increase in the velocity gradient is found in a zone approximately 1.8 km thick. This zone marks the transition from layer 3A to the upper mantle and has been identified as layer 3B. Such a transition zone has also been found in a number of refraction studies of the oceanic crust (Malecek & Clowes 1978; Spudich & Orcutt 1980a). At the depth of 9.4 km, an upper mantle velocity of 8.0 km s-' is found.
EX3: the velocity-depth profile of EX3 (Fig. 1Oc) indicates a more complex structure for layer 3 than that of EXI. At a depth of 6.0km, a 0.6km thick zone of high-velocity gradient (0.9s-') is required to produce the large amplitude arrivals observed on the EX3 record section at the distance range of 30 km (Fig. 4). The second occurrence of large ampli- tude arrivals at 45 km range on the record section is caused by the triplication within layer 3B. Layer 3B of profie EX3 is somewhat thicker than that of EX1 and the velocity gradient found within is not as high. The velocity of 8.3 km s-l derived for the depth of 11.2 km is interpreted as the upper mantle velocity.
EX3R: as mentioned earlier, the velocity-depth profile of EX3R does not show any dis- continuity between layers 2B and 3A. Instead, we find the velocity remains nearly constant
Dow
nloaded from https://academ
ic.oup.com/gji/article/68/1/27/705365 by guest on 04 January 2022

38
at 6.0 km s-' to the depth of approximately 6.0 km and between 6.0 and 8.6 km the velocity gradient begins to increase rapidly (Fig. 1Oc). This zone of high-velocity gradient gives rise to the large amplitude arrivals at the distances of 27 to 35 km on the record section of profile EX3R (Fig. 5). These arrivals even dominate the triplication caused by layer 3B. Thls differ- ence in amplitude behaviour between EX3 and EX3R is quite apparent when comparing the two record sections. Such a difference can be explained by the fact that the two profiles are not exact reversals; that is, seismic waves from shots at a range of 30 km from the respective receivers did not sample the same crustal material. The common depth region for the two profiles is at upper mantle depths, where the same velocity of 8.3 km s-' is found for the reversed profiles EX3 and EX3R.
EX2: unlike the other profiles, there is no apparent velocity higher than 7.5 kms-' observed on profile EX2 below a depth of 6.4 km (Fig. lob). A zone of high-velocity gradient similar to layer 3B of the other profiles is found at a much shallower depth of 5.0 km. The shallow depth of this transition zone on EX2 reflects the fact that the large amplitude tripli- cation occurs at the much closer distance of 25 km (Fig. 6) than that observed on the other profiles. There are no other large amplitude triplications observed to distances as far as 80 km. This implies that the velocity must remain constant below 6.4 km to some depth, a fact further confirmed by the extremal bounds of EX2 (Fig. 10d) which show that the maxi- mum velocity below 6.4km is well constrained to be less than 7.8kms-'. We have inter- preted the 7.5 km s-' velocity to be that of the upper mantle along EX2 [compared with 8.0 and 8.3 km sC1 for EX1 and EX3). The maximum velocity observed on the reverse profile EX2R is also 7.5 km s-' so that a dipping structure cannot be used to explain the low upper mantle velocity. A more likely explanation may be anisotropy in the upper mantle, similar t o that observed in other refraction studies (Snydsman, Levis & McClain 1975; Malecek & Clowes 1978). This point will be discussed further. Aside from the low velocity of the upper mantle, the second anomalous aspect of profile EX2 is the shallow upper mantle depth of 6.4km compared to 9.4 and 11.2km for EX1 and EX3 respectively. The thinner crust of EX2 has resulted mainly from the reduced thicknesses of layers 3A and 3B. The combined thickness of layers 3A and 3B for EX2 is 4.0 km compared to the average value of 6.7 km for EXI, EX3 and EX3R.
EX2R: for profile EX2R, an upper mantle velocity of 7.5 km s-' at a depth of 8.1 km is found. This depth, while shallower than those of EX1 and EX3, is considerably greater than the 6.4 km upper mantle depth of EX2. The greater upper mantle depth also means a greater ph cross-over distance - 35 km for EX2R compared with 25 km for EX2. This discrepancy between EX2 and EX2R raises a question concerning the validity of the assumption of lateral homogeneity required by the interpretation techniques. Certainly, part of the differ- ence is due to the fact that EX2 and EX2R do not form exact reversals of each other. Another possibility is the existence of a vertical fault dong EX2, which means that the results obtained by assuming lateral homogeneity must be used with care.
D. Au and R. M. Clowes
7 Discussion
Hyndman et al. (1979) presented a model for the development of the Nootka fault zone derived from calculations based on the observed magnetic anomalies and other data. They showed that the orientation of the fault zone has rotated from an east-west to a north-east- south-west direction then returning closer to east-west, all within the past 8Myr. Fig. 12 shows the three seismic profdes superimposed on the Hyndman et al. (1979) model; two of the most recent orientations of the Nootka fault zone, for average ages of 0.5 and 1.5 Myr, are also shown. According to this model, the age of the Juan de Fuca plate in our study area
Dow
nloaded from https://academ
ic.oup.com/gji/article/68/1/27/705365 by guest on 04 January 2022

Crustal structure of theNootka fault zone 39
z= Q 3 7
- N o
Figure 12. Tectonic model of Hyndman et al. (1979) showing the present configuration of the Explorer and Juan de Fuca plates using spreading parameters from observed magnetic anomalies. The thin solid lines with small numbers show seatloor ages; the two heavier lines with large numbers show fault locations at the time; both number sets in millions of years before the present. The approximate continental margin is indicated by the dashed line. The location of the explosive lines and OBS sites are shown by the heavy solid lines and solid circles.
ranges from 1 to 3 Myr and the adjacent crust on the Explorer plate across the fault zone is older by approximately 4 Myr. Much of the lithosphere older than 6 Myr on both plates has now been subducted beneath the America plate. In the discussion that follows we will illus- trate how this model can explain some aspects of our seismic results. We will also relate the lithology of ophiolite complexes, which are believed to be segments of oceanic crust emplaced on land, to the seismic velocity structure of the crust in this region.
7.1 L A Y E R 2
Fig. 11 shows that the top of the igneous crust has a velocity ranging from 3.7 to 4.7kms-' which is in good agreement with other studies (e.g. Cheung & Clowes 1981; Spudich & Orcutt 1980a). Deep sea drilling (e.g. Hyndman et al. 1976), dredging, and studies on ophiolites (Salisbury & Christensen 1978) have established that the subsediment material near spreading ridges is generally composed of fractured basalt flows and pillows. The velocity of the upper layer found by seismic refraction surveys is usually much lower than that observed from velocity measurements on laboratory samples (Hyndman & Drury 1976). This discrepancy is most likely due to the fact that the actual crust contains fractures, voids and intercalated sediments of a scale much larger than the size of the laboratory samples. These factors tend to decrease the seismic velocity of the upper crust while the coherent samples used in laboratory measurements tend to give the maximum velocity. The increase in velocity with depth in layer 2A is probably a result of the closing of cracks and fractures within the basalt.
In the transition zone from layer 2A to 2B, the velocity increases from an average of 4.5 km s-' to the 6.0 kms-' range. This sudden increase in velocity probably marks the change from extrusive to intrusive levels of the crust. Spudich & Orcutt (1980a) have argued that the reduction in pore space from a porosity of 24 to 2 per cent can only account for the
Dow
nloaded from https://academ
ic.oup.com/gji/article/68/1/27/705365 by guest on 04 January 2022

40
velocity increase within the top 0.6 km of the igneous crust. Any further increase in velocity with depth must result from other factors such as changing composition or increasing pressure. From the results of Salisbury & Christensen (1978), the increase in velocity from layers 2A t o 2B observed in this study would correspond to the change from pillow and flow basalt to greenschist facies metabasalt and brecciated dykes found in the upper level of the Bay of Islands ophiolite complex in Newfoundland. The reduced velocity gradient in layer 2B probably reflects the fact that the cracks and fractures at this depth are fewer in number so that their effect on the velocity gradient is diminished.
The boundary between layers 2B and 3A is highly variable. The velocity change across it ranges from a sharp jump in profile EX1 t o a smooth transition in profile EX3R. Salisbury & Christensen (1978) suggested that the velocity discontinuity between layers 2 and 3 marks a metamorphic boundary between greenschist facies and epidote-amphibolite facies metabasalt and is related to the downward migration of water along joints and fractures. Lithologically, it coincides with the transition from brecciated dykes to metadolerite sheeted dykes. From the study of the Chilean ophiolite, Stern, de Wit & Lawrence (1976) proposed a similar metamorphic boundary between layers 2 and 3. If this is the case, the abnormally deep boundary between layers 2B and 3A (3 km subsediment) may be a consequence of the complex plate motion that took place in the region within the past 8Myr as described by Hyndman et aZ. (1979). The intense shear and fracturing associated with the constantly changing plate boundary, exemplified by the present-day Nootka fault zone, would allow seawater to migrate deeply into the crust. The variability of the nature of the boundary between layers 2 and 3 would be a result of the varying degree of water penetration and metamorphism at the different locations. One possible contradiction to this hypothesis is profile EX2R which has the shallowest layer 2-layer 3 boundary, yet a great number of active faults are found along the profile. This suggests that the nature of the boundary between layers 2 and 3 may be much more complicated than a simple metamorphic boundary associated with water circulation.
D. Au and R . M. Clowes
7.2 L A Y E R 3A
Previous studies have shown that layer 3 of the oceanic crust has a well-defined velocity range (6.4-7.0 km s-') but its thickness varies considerably (see, for example, the compila- tion of Christensen and Salisbury 1975). Our study is no exception. The velocity at the top of layer 3A has a narrow range of 6.4-6.6 km s-l and the total thickness of layer 3 ranges from 3 . I to 7.4 km. The low 6.1 km s-' layer 3A velocity of profile EX3R can be explained by an interface with medium velocity of 6.4 km s-' which down-dips away from the Juan de Fuca ridge at an angle of 4" from the horizontal. Such a dip near an active spreading ridge is reasonable in view of the fact that most models of the oceanic crust indicate sloping structures near the ridge crest.
Besides the well-defined velocity range, the other distinctive aspect of layer 3A is its small velocity gradient ( - 0.1 s-') in contrast with the larger and more variable gradient of layer 2. The uniformity of the velocity structure of layer 3A has led to the postulation of uniform composition for this part of the crust (Malecek & Clowes 1978). The lithology of the Bay of Islands ophiolite shows that the top 1.0 km of layer 3 is composed of metadolerite sheeted dikes with a compressional wave velocity of 6.4-6.8 km s-' measured at pressures of 0.9 to 1.2 kbar (Salisbury & Christensen, 1978). This certainly correlates well with our results for the top of layer 3A. However, layer 3A of the Bay of Islands ophiolite does show some changes in composition with depth: a thick layer of intrusive metagabbro and gabbro followed by a layer of pyroxene gabbro are found below the sheeted dykes. Velocities within
Dow
nloaded from https://academ
ic.oup.com/gji/article/68/1/27/705365 by guest on 04 January 2022

Crustal structure o f the Nootka fault zone 41
the metagabbro vary widely between 6.0 and 6.8 km s-’ where the low velocities are asso- ciated with the discontinuous presence of late differentiates. Velocities in the pyroxene gabbro increase slowly with depth from 6.9 to 7.1 kms-’. Salisbury & Christensen (1978) pointed out that these detailed changes in the velocity structure are probably too small to be detected by routine seismic refraction surveys, resulting in the interpretation of a uniform layer 3A. This can explain the simple layer 3A structure interpreted for profile EX1 where some gaps in shot spacing existed between 20 and 40 km due to misfired shots. On the other hand, profile EX3 had a dense shot spacing and revealed more details within layer 3A. Similar structures, however, are not present in the reverse profile EX3R, rendering it difficult t o make any significant inferences on the fine stnicture of layer 3A.
1.3 L A Y E R 38
The existence of a transition layer between layer 3A and the upper mantle is well docu- mented in both the Pacific (Sutton, Maynard & Hussong 1971; Malecek & Clowes 1978; Spudich & Orcutt 1980) and the Atlantic (Steinmetz, Whitmarsh & Moreira 1977; Fowler & Keen 1979; Detrick & Purdy 1980). The velocity in this transition layer (3B) generally varies from 7.0 to 7.7 kms-’, with the thickness ranging from 2.0 to 5.0km. The velocity-depth profiles in Fig. 10 indicate that layer 3B of the crust in this region of the Pacific is best described as a zone 1.4-2.3 kni thick, in which the velocity increases gradually from that of the lower crust to that of the upper mantle, with no sharp discontinuity in velocity at the crust-mantle interface. Christensen & Salisbury (1975) suggested that the transition from layer 3A to the basal layer 3B corresponds to the transition from metagabbros to fresh gabbros. In the model of Stern et al. (1976), this boundary marks the maximum depth of hydrothermal circulation and layer 3 B is also composed of fresh gabbros. The observed velocity at the lower half of layer 3B, however, is higher than that of fresh gabbro and the presence of moderate to strong velocity gradients implies that the composition within this layer must be changing gradually. Layer 3B, therefore, cannot be composed of fresh gabbro throughout. The zone of interlayered olivine gabbro, troctolite and peridotite found in the Bay of Islands ophiolite would be more likely to give the required velocity and gradient inferred from our data.
7.4 U P P E R M A N T L E
Normal upper mantle velocities of 8.0 and 8.3 km s-‘ are observed for profile EX1 and the reversed profile EX3, 3R. An anomalously low velocity of 7.5 km s-’ has been interpreted as the upper mantle velocity for the reversed profile EX2, 2R. Although these values of upper mantle velocity are within the range found during other studies on the Juan de Fuca plate, some explanation of the difference is necessary.
Davis et al. (1976) reported the results of an OBS refraction survey on the Juan de Fuca ridge. Their refraction line ‘east’ partially reverses our profie EX1. For this line, they inter- preted an upper mantle velocity of 8.3 kms-’ which agrees with the 8.0kms ’ found for EX1. For lines ‘north’ and ‘south’, which are parallel to our profile EX2, they observed no upper mantle refracted arrivals. From a refraction survey carried out on Explorer plate near Explorer ridge, in an area northwest of the Nootka fault zone, Malecek & Clowes (1978) found a velocity of 7.9 km s-’ for the upper mantle along a reversed profile that ran perpen- dicular to the spreading ridge. On the profile that ran parallel to the ridge, the upper mantle velocity was found to be 7.3 km s-’. Anisotropy of the upper mantle was invoked to explain the difference in the velocities.
Dow
nloaded from https://academ
ic.oup.com/gji/article/68/1/27/705365 by guest on 04 January 2022

42 D. Au and R. M. Clowes
Fig. 12 shows that profile EX2 is parallel to the Juan de Fuca ridge and is only 23 km from the magnetic lineation on the Explorer plate. I t is along this profile that we found the upper mantle velocity to be low (7.5 kms-'). For profiles EX1 and EX3, the strikes of the magnetic anomaly pattern vary from 55" to 80". Here, we found the upper mantle velocities to be hgh. This apparent anisotropy agrees well with the observations of Malecek & Clowes (1978). Anisotropy of the upper mantle has been well documented by other studies and is summarized by Christensen & Salisbury (1975). Generally, it is found that the upper mantle velocity is high in a direction perpendicular to the ridge and low parallel to i t (Raitt et ul. 1969; Keen & Barrett 1971; Snydsman et ul. 1975). Hess (1964) suggested that mantle anisotropy is produced at the ridge crest by the alignment of olivine crystals in the direction of flow. Subsequently, a number of authors proposed similar mechanisms which required a preferred alignment of the a-axis of olivine crystals to create the anisotropy observed. We suggest that the 10 per cent variation (defined by (1 - Vmh/Vmax)x 100 per cent) in upper mantle velocity observed in this study is due to the anisotropy of the upper mantle. Since the crustal ages are so young, this implies that the process which causes formation of the anisotropy effect takes place while new crust is being created at or near the ridge and remains 'frozen in' thereafter.
7.5 C R U S T A L T H I C K N E S S
Except for profile EX2, the upper mantle depths shown in Fig. 12 are usually deep for crust less than 6 Myr old. The result is in line with other crustal studies undertaken on the Juan de Fuca and Explorer plates. For example, Davis et ul. (1976) interpreted a crustal thickness in excess of 11 km in their refraction study on the Juan de Fuca ridge. Malecek & Clowes (1978) reported abnormally thick crust (8-10km) on the Explorer plate within 50km of the spreading ridge crest. 'Bunching up' of the young crust on 'collision' with the America plate was suggested by Malecek & Clowes to explain the anomalous crust in the region. On inspection of Fig. 1 I , we can conclude that whatever the mechanism is for producing such thick crust, it must do so by the thickening of layer 3, the layer that is associated with metagabbros and cumulus gabbros.
We have remarked earlier that the differences in the upper mantle depths interpreted for the profiles must be reconciled so that the interpretation using laterally homogeneous models would be meaningful. This is especially true for the reversed profile EX2. 2R. The following arguments are offered to explain the differences in crustal thickness observed for these two profiles. We make the assertion that the velocity-depth structure of EX2 (Figs 10b and 11) is more representative of the 1 Myr old Juan de Fuca plate and its reversal, EX2R, is more indicative of the crustal structure of the 5 Myr old Explorer plate. The differences of the upper crustal structures and the thicknesses are real. They can be attributed to differ- ences in crustal formation and/or evolution with time, as described later, or to the Nootka fault where a 1.6 km vertical offset in the upper mantle depth may be present. The offset is inferred from the difference between the interpreted depths to Moho for profiles EX2 and EX2R.
Consider the tectonic model of Hyndman et al. (1979) in Fig. 12. For profile EX2, shots from distances to 30km would have travelled through only the 1 Myr old crust of the Juan de Fuca plate while for EX2R shots over the same distance range would have travelled through only the Explorer plate. Interpretation of the data up to the fault would produce the velocity-depth models of Fig. 10(b) for the respective plates. What about crossing the fault zone? Ray tracing through a faulted model consisting of the two laterally homogeneous models of Fig. IO(b), joined by a vertical fault, produces neghgible differences in the travel
Dow
nloaded from https://academ
ic.oup.com/gji/article/68/1/27/705365 by guest on 04 January 2022
Crustal structure of the Nootka fault zone 43
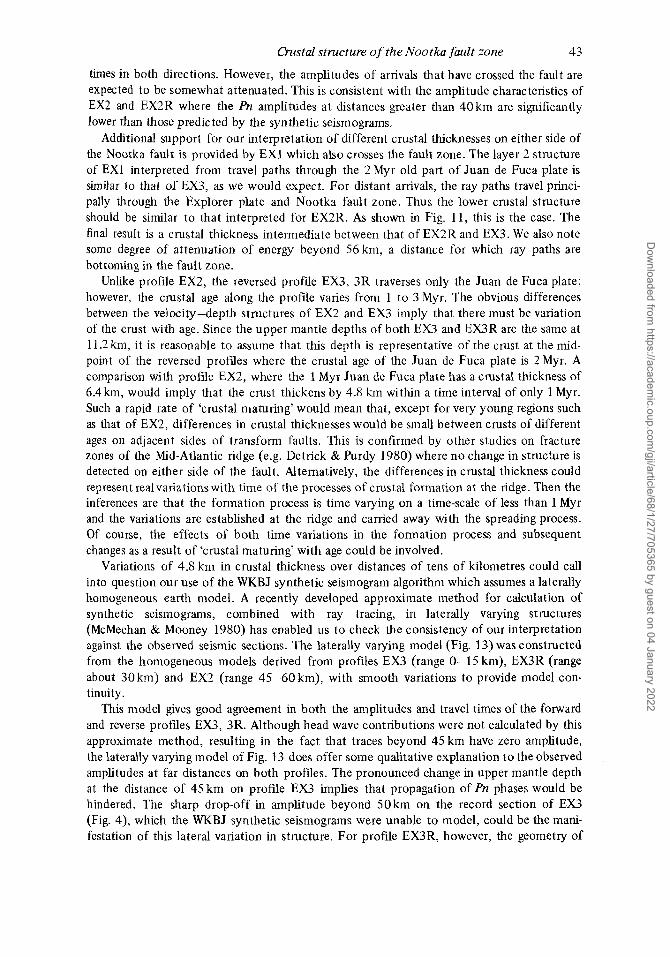
times in both directions. However, the amplitudes of arrivals that have crossed the fault are expected to be somewhat attenuated. This is consistent with the amplitude characteristics of EX2 and EX2R where the Pn amplitudes at distances greater than 40 km are significantly lower than those predicted by the synthetic seismograms.
Additional support for our interpretation of different crustal thicknesses on either side of the Nootka fault is provided by EX1 which also crosses the fault zone. The layer 2 structure of EX1 interpreted from travel paths through the 2 Myr old part of Juan de Fuca plate is similar to that of EX3, as we would expect. For distant arrivals, the ray paths travel princi- pally through the Explorer plate and Nootka fault zone. Thus the lower crustal structure should be similar to that interpreted for EX2R. As shown in Fig. 11, this is the case. The final result is a crustal thickness intermediate between that of EX2R and EX3. We also note some degree of attenuation of energy beyond 56 km, a distance for which ray paths are bottoming in the fault zone.
Unlike profile EX2, the reversed profile EX3, 3R traverses only the Juan de Fuca plate; however, the crustal age along the profile varies from 1 to 3 Myr. The obvious differences between the velocity-depth structures of EX2 and EX3 imply that there must be variation of the crust with age. Since the upper mantle depths of both EX3 and EX3R are the same at 11.2 km, it is reasonable to assume that this depth is representative of the crust at the mid- point of the reversed profiles where the crustal age of the Juan de Fuca plate is 2Myr. A comparison with profile EX2, where the 1 Myr Juan de Fuca plate has a crustal thickness of 6.4km, would imply that the crust thickens by 4.8 km within a time interval of only 1 Myr. Such a rapid rate of ‘crustal maturing’ would mean that, except for very young regions such as that of EX2, differences in crustal thicknesses would be small between crusts of different ages on adjacent sides of transform faults. This is confirmed by other studies on fracture zones of the Mid-Atlantic ridge (e.g. Detrick & Purdy 1980) where no change in struckre is detected on either side of the fault. Alternatively, the differences in crustal thickness could represent realvariations with time of the processes of crustal formation at the ridge. Then the inferences are that the formation process is time varying on a time-scale of less than 1 Myr and the variations are established at the ridge and carried away with the spreading process. Of course, the effects of both time variations in the formation process and subsequent changes as a result of ‘crustal maturing’ with age could be involved.
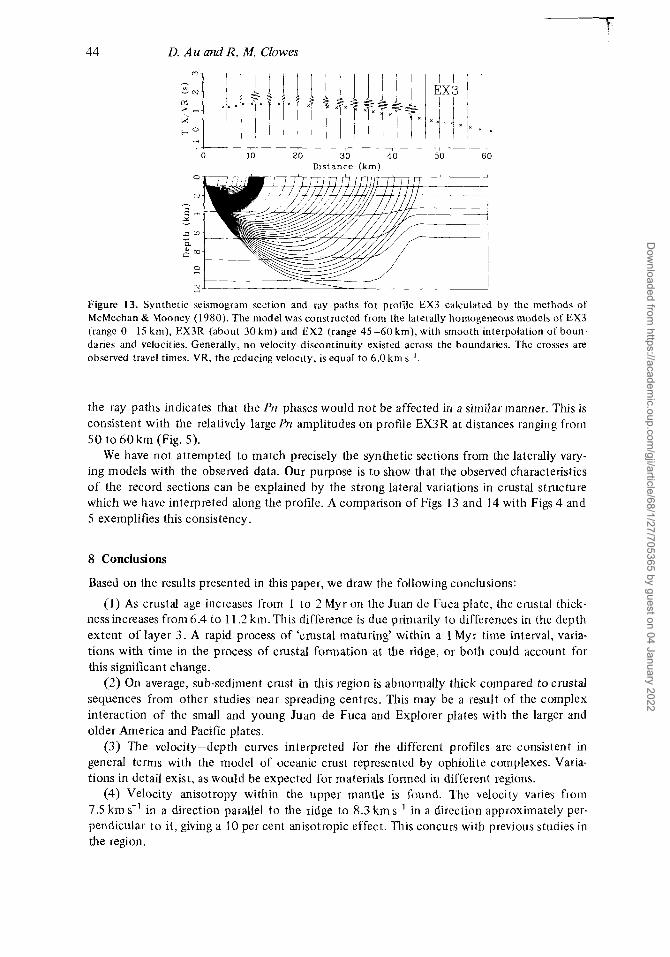
Variations of 4.8 kin in crustal thickness over distances of tens of kilometres could call into question our use of the WKBJ synthetic seismogram algorithm which assumes a laterally homogeneous earth model. A recently developed approximate method for calculation of synthetic seismograms, combined with ray tracing, in laterally varying structures (McMechan & Mooney 1980) has enabled us to check the consistency of our interpretation against the observed seismic sections. The laterally varying model (Fig. 13) was constructed from the homogeneous models derived from profiles EX3 (range 0-15 km), EX3R (range about 30 km) and EX2 (range 45-60 km), with smooth variations to provide model con- tinuity.
This model gives good agreement in both the amplitudes and travel times of the forward and reverse profiles EX3, 3R. Although head wave contributions were not calculated by this approximate method, resulting in the fact that traces beyond 45 km have zero amplitude, the laterally varying model of Fig. 13 does offer some qualitative explanation to the observed amplitudes at far distances on both profiles. The pronounced change in upper mantle depth at the distance of 45 km on profile EX3 implies that propagation of Pn phases would be hindered. The sharp drop-off in amplitude beyond 50km on the record section of EX3 (Fig. 4), which the WKBJ synthetic seismograms were unable to model, could be the mani- festation of this lateral variation in structure. For profile EX3R, however, the geometry of
Dow
nloaded from https://academ
ic.oup.com/gji/article/68/1/27/705365 by guest on 04 January 2022
44 D. Au and R. M. Clowes
,, 0 10 20 30 40 50 60
Distance (km)
Figure 13. Synthetic seismogram section and ray paths for profile EX3 calculated by the methods of McMechan & Mooney (1980). The model was constructed from the laterally homogeneous models of EX3 (range 0-15 km), EX3R (about 30 km) and EX2 (range 45-60 km), with smooth interpolation ofboun daries and velocities. Generally, no velocity discontinuity existed across the boundaries. The crosses are observed travel times. VR, the reducing velocity, is equal to 6.0 km s-'.
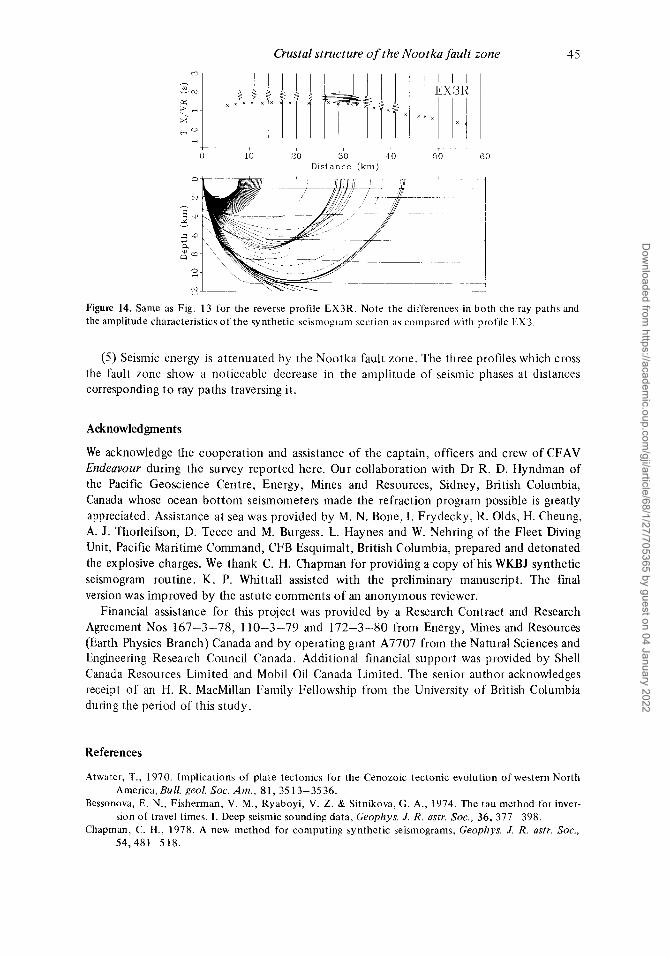
the ray paths indicates that the Pn phases would not be affected in a similar manner. This is consistent with the relatively large Pn amplitudes on profde EX3R at distances ranging from 50 to 60 km (Fig. 5).
We have not attempted to match precisely the synthetic sections from the laterally vary- ing models with the observed data. Our purpose is to show that the observed characteristics of the record sections can be explained by the strong lateral variations in crustal structure which we have interpreted along the profile. A comparison of Figs 13 and 14 with Figs 4 and 5 exemplifies this consistency.
8 Conclusions
Based on the results presented in this paper, we draw the following conclusions:
(1) As crustal age increases from 1 to 2 Myr on the Juan de Fuca plate, the crustal thick- ness increases from 6.4 to 11.2 km. This difference is due primarily to differences in the depth extent of layer 3. A rapid process of 'crustal maturing' within a 1 Myr time interval, varia- tions with time in the process of crustal formation at the ridge, or both could account for this significant change.
(2) On average, sub-sediment crust in this region is abnormally thick compared to crustal sequences from other studies near spreading centres. This may be a result of the complex interaction of the small and young Juan de Fuca and Explorer plates with the larger and older America and Pacific plates.
(3) The velocity-depth curves interpreted for the different profiles are consistent in general terms with the model of oceanic crust represented by ophiolite complexes. Varia- tions in detail exist, as would be expected for materials formed in different regions.
(4) Velocity anisotropy within the upper mantle is found. The velocity vanes from 7.5 km s-' in a direction parallel to the ridge to 8.3 km s-' in a direction approximately per- pendicular to it, giving a 10 per cent anisotropic effect. This concurs with previous studies in the region.
Dow
nloaded from https://academ
ic.oup.com/gji/article/68/1/27/705365 by guest on 04 January 2022
Crustal structure of the Nootka fault zone 45
t r - - I--- ~ r n i n 20 30 40 50 6 0
Distance (km)
i
Figure 14. Same as Fig. 1 3 for the reverse profile EX3R. Note the differences in both the ray paths and the amplitude characteristics of the synthetic seismogram section as compared with profile EX3.
(5) Seismic energy is attenuated by the Nootka fault zone. The three profiles which cross the fault zone show a noticeable decrease in the amplitude of seismic phases at distances corresponding to ray paths traversing it.
Acknowledgments
We acknowledge the cooperation and assistance of the captain, officers and crew of CFAV Endeavour during the survey reported here. Our collaboration with Dr R. D. Hyndman of the Pacific Geoscience Centre, Energy, Mines and Resources, Sidney, British Columbia, Canada whose ocean bottom seismometers made the refraction program possible is greatly appreciated. Assistance at sea was provided by M. N. Bone, I . Frydecky, R. Olds, H. Cheung, A. J. Thorleifson, D. Teece and M. Burgess. L. Haynes and W. Nehring of the Fleet Diving Unit, Pacific Maritime Command, CFB Esquimalt, British Columbia, prepared and detonated the explosive charges. We thank C. H. Chapman for providing a copy of his WKBJ synthetic seismogram routine. K. P. Whittall assisted with the preliminary manuscript. The final version was improved by the astute comments of an anonymous reviewer.
Financial assistance for this project was provided by a Research Contract and Research Agreement Nos 167-3-78, 110-3-79 and 172-3-80 from Energy, Mines and Resources (Earth Physics Branch) Canada and by operating grant A7707 from the Natural Sciences and Engineering Research Council Canada. Additional financial support was provided by Shell Canada Resources Limited and Mohil Oil Canada Limited. The senior author acknowledges receipt of an H. R. MacMillan Family Fellowship from the University of British Columbia during the period of this study.
References
Atwater, T., 1970. Implications of plate tectonics for the Cenozoic tectonic evolution of western North America,Bull. geol. SOC. Am. , 81, 3513-3536.
Bessonova, E. N., Fisherman, V. M., Ryaboyi, V. Z. & Sitnikova, G. A,, 1974. The tau method for inver- sion of travel times. 1. Deep seismic sounding data, Geophys. J. R. astr. SOC., 36, 377-398.
Chapman, C. H., 1978. A new method for computing synthetic seismograms, Geophys. J. R. a m . Soc., 54.481L5 18.
Dow
nloaded from https://academ
ic.oup.com/gji/article/68/1/27/705365 by guest on 04 January 2022
46 Chapman, C. H. & Orcutt, J. A,, 1980. Inversion of seismic refraction data (abstract), EOS Trans. Am.
geophys. Un., 61, 304. Cheung, H. P. Y. & Clowes, R. M., 1981. Crustal structure from P- and S-wave analyses: ocean bottom
seismometer results in the N.E. Pacific, Geophys. J. R. astr. SOC., 65, 47 -73. Christensen, N . I . & Salisbury, M. Ii., 1975. Structure and constitution of the lower oceanic crust,Rev.
Geophys. Space Phys., 13,57-86. Davis, E. E. & Lister, C. R. B., 1977. Tectonic structures on the Juan de Fuca ridge, Bull. geol. SOC. Am.,
88,346-363. Davis E. E., Lister, C. R. B. & Lewis, B. T. R., 1976. Seismic structure on Juan de Fuca ridge: ocean
bottom seismometer results from median vaIley,J. geophys. Res., 81, 3541-3555. Detrick, K. S. J r & Purdy, G. M . , 1980. The crustal structure of the Kane Fracture Zone from seismic
refraction studies, J. geophys. Rex, 85, 3759-3777. Fowler, C. M. R. & Keen, C. E., 1979. Oceanic crust structure - Mid-Atlantic Ridge at 45" N, Geophys.
J. R. astr. SOC., 56, 2 19-226. Garmany, J., Orcutt, J . & Parker, R., 1979. Travel time inversion: a geometrical approach, J geophys.
Res., 84, 3615-3622. Hess, I+., 1964. Seismic anisotropy of the uppermost mantle under the oceans,Nature, 203. 629-631. Hyndman, R . D., Aumento, I ; . , Melson, W. G. , Hall, J . M., Bougault, l i . , Dmitriev, L., I'isher, J . I;.,
blower, M., Howe, R. C., Miles, G. A., Robinson, P. T. & Wright, T. L., 1976. Seismic structure of the oceanic crust from deep drilling on the mid-Atlantic ridge, Geophys. Res. Lett., 3, 201 -204.
Hyndman, K. D. & Drury, M. J . , 1976. The physical properties of oceanic basement rocks from deep drilling on the mid-Atlantic ridge, J. geophys. Rex, 81, 4042-4052.
Hyndman, R. D., Riddihough, R. P. & Herzer, R., 1979. The Nootka fault zone - a new plate boundary off western Canada, Geophys. J. R. astr. SOC., 58, 667-683.
Johnson, R. V. 11, C. R. B. & Lewis, B. T. R., 1977. A direct recording ocean bottom seismometer, Mar. geophys. Res., 3,65-85.
Keen, C. E. & Barrett, D. L., 1971. A measurement of seismic anisotropy in the northeast Pacific, Can. J. Earth Sci., 8, 1056-1064.
Keen, C. E. & Hyndman, R. D., 1979. Geophysical review of the continental margins of eastern and western Canada, Can. J. Earth Sci., 16, 7 12-747.
Kennett, B. L. N. & Orcutt, J. A., 1976. A comparison of travel time inversions - marine refraction protiles, J. geophys. Rex, 81,406 1 --4070.
Lister, C. R. B. & Lewis, B. T. R. , 1976. An ocean-bottom seismometer suitable for arrays, Deep Sea Res., 13, 113-124.
McMechan, G . A. & Mooney, W. D., 1980. Asymptotic ray theory and synthetic seismograms for laterally varying structure: theory and application to the Imperial Valley, California, Bull. seism. SOC. Am., 70, 202 1-2035.
Malecek, S. J . & Clowes, R. M., 1978. Crustal structure near Explorer Ridge from a marine deep seismic sounding survey, J. geophys. Res., 83,5899-5912.
Raff, A. D. & Maston, R. G., 196 1. Magnetic survey off the west coast of North America, 40" N to 52" N latitude, Bull. geol. SOC. Am., 72, 1267-1270.
Raitl, R. W., 1963. The crusral rocks, in The Sea, 3, 85-102, ed. Hill, M. N., Wiley (Interscience), New York.
Raitl, R . W., Shor, G . G. J r , I'rdncis, T. J . G. & Morris, G. B., 1969. Anisotropy ot' the Pacific upper mantlc,J. geophys. Res., 74, 3095-3 109.
Riddihough, R. P., 1977. A model for recent plate interactions ot'f Canada's west coast, Can. J. Earth Sci., 14,384-396.
Salisbury, M. H. & Christensen, N. I . , 1978. The seismic velocity structure o f a traverse through the Bay of Islands ophiolite complex, Newfoundland, a n exposure 0 1 oceanic crust and upper mantle, J. geophys. Res., 83,805-817.
Snydsman, W. E., Lewis, B. T. R. & McClain, J . , 1975. Upper mantle velocities on the northern Cocos plate, Earth planet. Sci. Let!., 28, 46-50.
Spudich, P. K. & Orcutt, J., 1980a. Petrology and porosity of an oceanic crustal site: results from wave form modelling of seismic refraction data,J. geophys. Res., 85, 1409-1433.
Spudich, P. K . & Orcutt, J . , 1980b. A new look at the seismic velocity structure of the oceanic crust, Rev. Geophys. Space Phys., 18,627-645.
Steininetz, L., Whitniarsh, K. B. & Moreira, V. S., 1977. Upper mantlc struclurc ot' the Mid-Atlantic ridge north of the Azores based on observation of compressional waves, Geophys. J. R. astr. SOC., 50, 353-380.
D. Au and R. M. Clowes
Dow
nloaded from https://academ
ic.oup.com/gji/article/68/1/27/705365 by guest on 04 January 2022
Czustal structure of the Nootka fault zone 47 Stern, C., de Wit, M. J . & Lawrence, J . R., 1976. lgneous metamorphic processes associated with the for-
mation o f Chilean ophiolites and their implication for ocean floor metamorphism, seismic layering and magnetism, J. geophys. Res., 81,4370-4380.
Sutton, G. H., Maynard, G. L. & Hussong, D. M., 1971. Widespread occurrence of a high velocity basal layer in the Pacific crust found with repetitive sources and sonobuoys, The Structure and Physical Properties of the Earth's Crust, Geophys. Monogr. Ser., 14, 193-209. ed. Heacock, J . G., American Geophysical Union, Washington, D.C.
Tiffin, D., L. & Seeman, D., 1975. Bathymetry map of the continental margin of western Canada, open file map, Geol. Sum. Can., Vancouver, British Columbia.
Vine, F. J . & Wilson, J . T., 1965. Magnetic anomalies over a young oceanic ridge off Vancouver Island, Science, 150,485-489.
Wilson, J . T., 1965. Transform faults, ocean ridges and magnetic anomalies southwest of Vancouver Island Science, 150.482-484.
Dow
nloaded from https://academ
ic.oup.com/gji/article/68/1/27/705365 by guest on 04 January 2022