crowdsourcing bicycle volumes: exploring the role of ... bicycle... · algorithm addressing factors...
TRANSCRIPT

1
Author Contact Information
Greg P. Griffin The University of Texas at Austin, School of Architecture, 310 Inner Campus Drive, Austin, TX 78712 | [email protected]
Junfeng Jiao The University of Texas at Austin, School of Architecture, 310 Inner Campus
Drive, Austin, TX 78712 | [email protected]
Crowdsourcing Bicycle Volumes: Exploring the role of volunteered geographic information and established monitoring methods
ABSTRACT
The recent interest in performance measures and new bicycle infrastructure development has triggered rapid advancements in monitoring methods for active transportation, but comprehensive monitoring programs for the bicycle mode are far from ubiquitous. This study evaluates the use of GPS survey data and a new crowdsourced volume dataset that may offer promise to extend the reach of limited counting programs. The authors integrated count data from 5 separate trail locations in Austin, Texas, with a previous survey using the CycleTracks smartphone app, and a new data product derived from a larger-scale use of the Strava fitness app. New crowdsourced methods offer prospect to expand the relative time and geography of bicycle traffic monitoring, but do not currently offer many other attributes about trips obtainable from other methods. Further studies involving the combination of high-accuracy monitoring points with crowdsourced datasets may improve the efficiency of monitoring programs over large areas. Keywords: volunteered geographic information, bicycle, crowdsourcing, global positioning
systems, transport planning

2
INTRODUCTION
Currently, bicycle volume data is not typically gathered by transportation agencies, despite the
fact that several new methods to count bicycle volumes have been developed in recent years
(Nordback & Janson 2010; Ryan & Lindsey 2013). Methods to incorporate nonmotorized
volume data as a regular practice was only introduced to the Federal Highway Administration’s
Traffic Monitoring Guide in 2013 (United States Department of Transportation Federal Highway
Administration 2013), and the cost and perceived importance of counting this mode may
continue to be a barrier to increased data development. This paper begins with a review of these
challenges and opportunities reflected in the literature, and employs temporal and geographic
analysis to review two community-contributed geographic datasets developed in the Austin,
Texas area, with actual count data from bicycle traffic counters on 5 locations of the downtown
trail system. The method demonstrates that some data sources are likely to vary in the proportion
of actual volumes.
This study addresses a need to evaluate current datasets that may extend the value of
bicycle counting programs through volumes contributed through other means. Significant
progress in institutionalizing bicycle and pedestrian monitoring has been made in Colorado,
Minnesota and Oregon, and agencies are searching for efficient solutions to fill this need
(Lindsey, Nordback, & Figliozzi 2014; Nordback & Janson 2010; Nordback 2014). A recent
Transportation Research Board Circular summarized a number of recent and ongoing studies in
the realm of active transportation monitoring methods, and identified a need to continue research
in crowdsourced volume data sources (Griffin, Nordback, Götschi, Stolz, & Kothuri 2014).
The concept of crowdsourcing information on improving bicycling conditions is not new,
but the datasets and tools for their analysis are continuing to expand. Indeed, the Federal
Highway Administration’s Bicycle Compatibility Index, developed in the late 1990’s is
predicated on multiple users’ perspective of a video-based evaluation of roadways (Harkey,
Reinfurt, & Knuiman 1998). Krykewycz et al. expanded the bicycle level of service concept with
web-based crowdsourcing, allowing a localized valuation of ‘bikability’ (Krykewycz, Pollard,
Canzoneri, & He 2011).This very concept of asking for public input on the fundamental
components of a decision-making process that is traditionally technically-driven (e.g. roadway
conditions, traffic volumes, etc.) is by itself a paradigm shift (Brabham 2009; Connors, Lei, &

3
Kelly 2011; Elwood, Goodchild, & Sui 2013; Schlossberg & Brehm 2009; Schlossberg &
Shuford 2005; Tulloch 2008). The idea of crowdsourcing may be merging with transportation
practitioners’ notions of survey-based input, both for travel surveys and public engagement in
planning (Akar & Clifton 2009; Shen & Stopher 2014).
Two principal research questions posed in this study are:
1. At a given location, what proportion of total bicycle volumes are reflected in a global
positioning system (GPS) travel survey, and a new crowdsourced dataset?
2. How do GPS surveys and crowdsourced methods vary in terms of trip purpose?
These questions are explored by corroborating trail count values from recording
equipment, along with comparison of a smartphone-based GPS survey, and a crowdsourced
bicycle volume dataset.
Data Sources
In addition to bicycle traffic counts recorded with pneumatic tubes, this study takes advantage of
a previous study using the smartphone app CycleTracks (Sall n.d.), and a new crowdsourced data
product called Strava Metro (Albergotti 2014). Recent availability of accurate trail counts for the
Austin area, along with the recent CycleTracks study and new Strava Metro data allow unique
comparisons.
Since all of the five trail locations include at least one week’s worth of data in 15-minute
increments, evaluation of bicycle volumes by time of day and day of week is possible. The trail
counts were gathered with Eco-counter pneumatic tubes, and the counts on the Lance Armstrong
Bikeway were gathered using an automatic traffic recorder (ATR) developed by Eco-counter that
uses inductive loops to count passing bicycles.
CycleTracks is a smartphone application that was developed by the San Francisco County
Transportation Authority, and has been employed and adapted for use in several other cities (Sall
n.d.). It was applied in an Austin area study in 2011, and the current study incorporates its
summarized traffic volumes (Hudson, Duthie, Yatinkumar, Larsen, & Meyer 2012). CycleTracks
is essentially a GPS-based travel diary, and gathers additional valuable information such as trip
purpose and demographics that passive data collection techniques do not.

4
Strava is a popular smartphone-based, GPS-supported fitness app that records route
volume information now sold as Strava Metro, which the creators describe as “…aggregate[ing]
collective real world cycling preferences in real time with the purpose of enabling state and local
departments of transportation as well as advocacy groups and corporations to make informed and
effective choices when improving and repairing alternative transportation corridors” (Strava Inc.
2014b). Though this dataset includes a trip purpose attribute derived from a proprietary
algorithm addressing factors such as whether a trip had a coincident origin and destination
(personal communication, Brian Riordan, February 19, 2014)., all trips were used in this
assessment without analyzing trip purpose.
Each of these data sources provides a type of potential bicycle volume data, but they must
be normalized in terms of the type of volume data to be comparable, and they must overlap
spatially to remove spatial effects on traffic volumes. Table 1 describes the locations and times
of the three separate data sources.
TABLE 1. Bicycle Volume Sources
Technology Location(s) Time Population Automatic traffic recorder (counts)
Lance Armstrong Bikeway at Waller Creek
2011-present (with minor breaks)
n/a
Pneumatic tube counters (counts)
Johnson Creek Trail Lady Bird Lake Trail Shoal Creek Trail
Aug. 9-15, 2013 n/a
CycleTracks (GPS survey) Austin, Texas area May 1-Oct. 31, 2011
316
Strava Metro (crowdsourced) Travis County, Texas Aug. 9-15, 2013 2,701
The crowdsourced dataset covers the entire roadway network in a given area, which is a
major change from existing monitoring methods focused on individual points. Previously,
bicycle volumes covering entire networks could only be estimated through modeling. Though a
variety of cursory sketch-level and more sophisticated models have been developed, very few
transportation agencies apply them, partially due to a lack of traffic counts (Griffin et al. 2014;
Griffin 2009; Kuzmyak, Walters, Bradley, & Kockelman 2014). The crowdsourced dataset,
depicting traffic volumes during the week of August 9-15, 2013 in Austin, Texas is depicted in
figure 1. Strava users are bicycling on a variety of Austin roadways, but the highest volumes are

5
found on state highways with wide shoulders in Austin’s western, hillier areas. A great deal of
the other high-volume bicycling is distributed throughout the city, most having either bicycle
lanes or low traffic volumes and speeds. As described later, this dataset is limited in that it
characterizes only Strava users, and taking a first glimpse at the differences between these
crowdsourcing contributors and all bicyclists is a central question of this study.
.
FIGURE 1. Bicycle volumes reported by Strava, 9-15 August 2013
Whereas the bicycle traffic counts by definition include all bicyclists passing a given
point, the survey and crowdsourced datasets are merely a sample of the entire population. Of

6
those that reported a gender in the CycleTracks study, 30 percent were female, which is 7 percent
less than a national study of all bicyclists from 2002 (Hudson et al. 2012). Participants also
skewed younger than the general population, though the study cannot reflect the population since
it was targeted towards adults. Similarly, the users of Strava Metro are less than one quarter
female, and skew younger than the general population. Comparison of American Community
Survey demographic estimates within Travis County, Texas, with the Strava Metro community
in August 2013 in the same county is depicted in figure 2. Though the Strava community is
strongly skewed male, a gender study of the included trails necessary for precise qualification
was not part of this study.
FIGURE 2. Travis County population estimate by age and sex at left (U.S. Census Bureau 2012), Strava fitness
app bicyclists at right (Kitchel & Riordan 2014)
Study Area
Austin is used as a case study location because of the availability of both the previous
CycleTracks study, a newly-available Strava Metro sample dataset, and bicycle volumes from
portable pneumatic tube counters and two automatic traffic recorders (ATR) positioned on the
Lance Armstrong Bikeway at its crossings of Shoal Creek and Waller Creek (see Figure 2). The
ATRs began recording bi-directional bicycle and pedestrian volumes in 15-minute increments, in
January, 2011, however the one at the crossing of Shoal Creek has been removed due to
construction in the area.

7
Downtown Austin, Texas is a relatively dense, mixed-use district with an on and off-
street network of bicycle facilities connecting a multitude of destinations, including restaurants,
parks, and offices (Halff Associates Inc. 2014). Austin launched a bicycle sharing system on
December 21, 2013, and has expanded to 40 stations as of spring 2014 (B-Cycle 2014). The data
used in this study all preceded the launch of this system, so this system was not a factor in the
traffic volumes reviewed.
The off-street bicycle network includes a variety of materials, but most are at least three
to four meters (10-13 feet) in width. The trails surrounding and connecting to Lady Bird Lake are
predominantly surfaced with decomposed granite, and are more popular for running and walking
than as specific bicycle routes. Construction on the Lance Armstrong Bikeway began in 2007,
and the last section of its almost ten kilometer (6 mile) downtown is a cycle track facility under
development as of this writing.
Researchers chose five specific monitoring locations shown in figure 3 because they
found the City of Austin had recorded bicycle counts at these locations during the same duration
as the available Strava sample dataset, enabling synchronous comparison. These locations
happen to be located along each side of popular entrances to downtown, and were anticipated to
provide options for a range of potential trip purposes. All five of the monitoring locations in this
study are off-street, shared-use paths in downtown Austin, Texas, that are on facilities accessible
to a wide range of bicycling skill levels, in areas that can serve business, shopping and recreation
destinations.
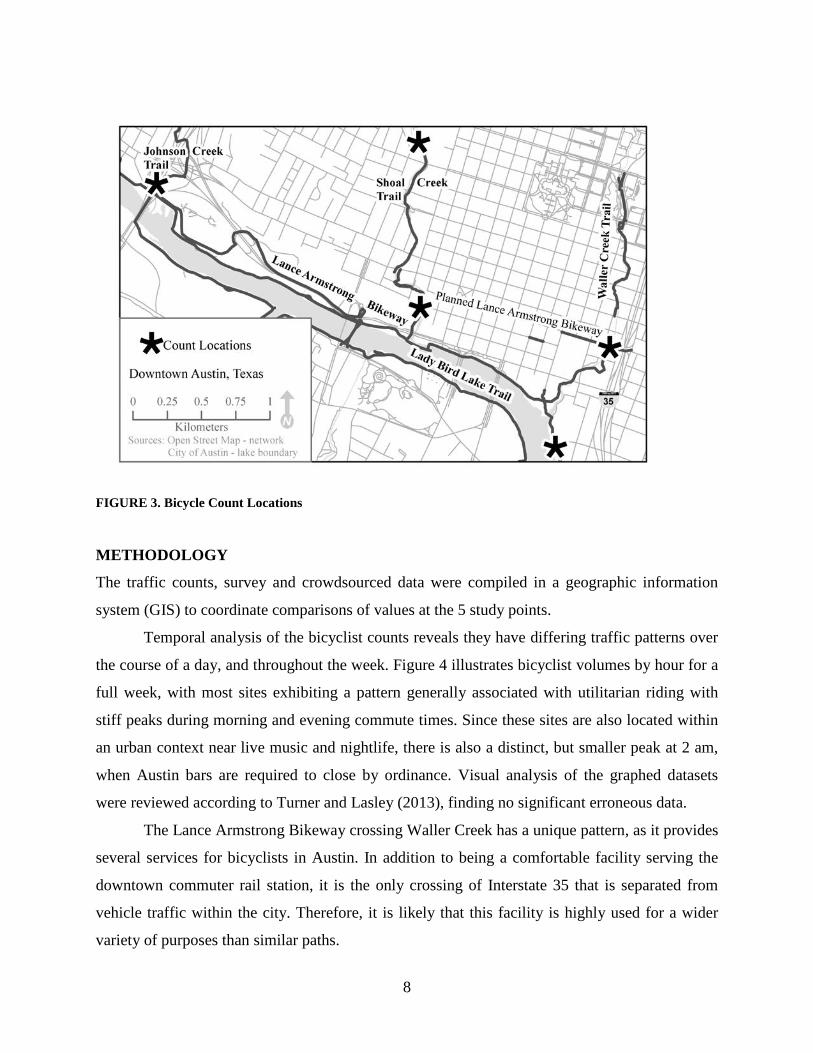
8
FIGURE 3. Bicycle Count Locations
METHODOLOGY
The traffic counts, survey and crowdsourced data were compiled in a geographic information
system (GIS) to coordinate comparisons of values at the 5 study points.
Temporal analysis of the bicyclist counts reveals they have differing traffic patterns over
the course of a day, and throughout the week. Figure 4 illustrates bicyclist volumes by hour for a
full week, with most sites exhibiting a pattern generally associated with utilitarian riding with
stiff peaks during morning and evening commute times. Since these sites are also located within
an urban context near live music and nightlife, there is also a distinct, but smaller peak at 2 am,
when Austin bars are required to close by ordinance. Visual analysis of the graphed datasets
were reviewed according to Turner and Lasley (2013), finding no significant erroneous data.
The Lance Armstrong Bikeway crossing Waller Creek has a unique pattern, as it provides
several services for bicyclists in Austin. In addition to being a comfortable facility serving the
downtown commuter rail station, it is the only crossing of Interstate 35 that is separated from
vehicle traffic within the city. Therefore, it is likely that this facility is highly used for a wider
variety of purposes than similar paths.

9
FIGURE 4. Percentage of bicyclists by time of day
The weekly spread of bicyclists is also associated with various trip purposes identified in
the literature (Lindsey, Hankey, Wang, & Chen 2013; Roll 2013). Previous studies generally
indicated volumes gradually increased during the week towards Friday, often with more traffic
on weekend days. The fairly flat patterns in figure 5 are associated with multiple trip purposes,
spread over the week. The strong increase of the Lady Bird Lake Trail and Shoal Creek Trail
sites on Saturday are likely related to their settings within larger downtown parks, and may
reflect more emphasis on recreation.

10
FIGURE 5. Percentage of bicyclists by day of week
Miranda-Moreno et al. developed classification factors for trip purpose based on the day
of week, and time of peak travel to estimate the predominant travel use of a given facility (2013).
The following formulae offer comparability on trail traffic with recent work by Hankey, Lindsey
and Marshall (2014). The first formula calculates an index of weekday versus weekend traffic,
noted as WWI. The second is the average morning commute period (7-9 am) divided by the
midday (11 am- 1 pm) traffic, AMI.
𝑊𝑊𝑊 = 𝑉𝑤𝑤𝑉𝑤𝑤
(1)
𝐴𝐴𝑊 = 𝑉𝑎𝑎𝑉𝑎𝑚𝑤
(2)
This line of research logically assumes that sites with a higher ratio of weekend traffic
versus weekday can reasonably be considered to have a predominantly recreational use. This
temporal factor is further bolstered by examining the ratio of morning traffic to mid-day traffic,
following that a higher AMI (relative morning trips versus mid-day) is associated with commute,

11
or utilitarian traffic. Since this study includes results from a GPS survey using the CycleTracks
app, the 5 sites in Austin have actual trip purposes allocated to individual routes, which are
reviewed in the next section by comparing WWI and AMI against actual recorded trip purposes.
In order to evaluate the overall relationship between the counted volumes and the
CycleTracks survey and Strava Metro data, the final method applies ordinary least squares
regression.
RESULTS
In order to compare the surveyed and crowdsourced traffic volumes with the total traffic volume,
the researchers coordinated the datasets over time and location. The CycleTracks and Strava
Metro datasets were collected over different time spans, May 1-August 31, 2011, and August 9-
15, 2013, respectively. The Lance Armstrong Bikeway was counted using the automatic traffic
recorders during the CycleTracks period, and the remaining trails were counted by the City of
Austin using pneumatic tubes during the Strava Metro dataset recording time. The average daily
bicycle (ADB) volumes are several times higher on the Lance Armstrong Bikeway through
downtown than on the trails nearest Lady Bird Lake.
In terms of proportions of the full traffic as reflected in the counts, table 2 shows the
CycleTracks survey included a very small proportion of the total volume, less than a tenth of one
percent of the volume of the 2 traffic recorders on the Lance Armstrong Bikeway. As the original
study in Austin (Hudson et al. 2012), and this evaluation shows, the advantage of a GPS survey
is its balance of breadth of coverage with depth of information. However, the Strava Metro
dataset includes a much larger proportion of the total bicycle traffic on the three trail counting
sites that coincided with the Strava Metro data from August 9-15, 2013, including almost five
percent of the total traffic.

12
TABLE 2. Counted, GPS Survey (CycleTracks) and Crowdsourced (Strava Metro) Bicycle Volumes
May 1-Aug. 31, 2011 ADB Count CycleTracks Percent of Count
L. Armstrong Bikeway at Waller Cr. 664 81707 9 0.0110 L. Armstrong Bikeway at Shoal Cr. 824 101363 102 0.1006 Total 1488 183070 111 0.0606
Aug. 9-15, 2013 ADB Count Strava Metro
Percent of Count
Johnson Creek Trail 141 990 87 8.7879 Lady Bird Lake Trail 231 1615 46 2.8483 Shoal Creek Trail 252 1767 76 4.3011 Total 625 4372 209 4.7804
Similar to Hankey, Lindsey and Marshall (2014), this study has access to a small sample
size of five locations with counts at least a week long, factoring trip purposes is limited. Shown
in table 3, results of the relative weekend versus weekday traffic (WWI) is not consistent with
the index of morning to midday traffic (AMI). However, they all include mid-range values,
reflecting multiple uses of the trail system. This is consistent with the downtown location in
parkland, but surrounded by employment, densifying residential areas, retail and other uses.
At this stage of refinement of bicycle factor groups and trip purposes, no known studies
of volume-based factor group classifications and user-surveyed trip purposes exist. A previous
study by Hudson, et al. using the CycleTracks app (Hudson et al. 2012), and the new Strava
Metro data product (Kitchel & Riordan 2014) allows comparison on the actual trail sites, though
separated in time.
Table 3 summarizes results of the trip purpose comparison, though the trail counts,
CycleTracks GPS survey, and Strava metro crowdsourced data all vary in total counts and time
periods. Though the CycleTracks data is the smallest sample in this study, it provides the only
direct insight into trip purpose, since it asks participants to categorize each trip among one of six
purposes: commute, errands, school, exercise, social, and other. Strava Metro includes a number
of commute trips that is inferred through GIS-based rules such as the trip beginning and ending
at locations more than a certain distance apart, though the full algorithm is proprietary (personal
communication, Brian Riordan, February 19, 2014). Since Strava is a fitness-oriented app
(Strava Inc. 2014a), this study allocates all trips not designated as commute purposes as
recreational. In each of the 4 trip purpose categorization methods, the three trails in park settings

13
had the highest proportion of recreational trips. This finding is compatible with the authors’
familiarity with each of the five sites.
TABLE 3. Volume-based factor group classifications and CycleTracks trip purpose
WWIa Classification AMIb Classification
CycleTracks Percent
Recreational (# of total
trips)
Strava Metro
Percent Recreational
(# of total trips)
L. Armstrong Bikeway at Waller Cr. 0.935 Mixed-
utilitarian 0.738 Mixed-recreational 13 (102) 44 (163)
L. Armstrong Bikeway at Shoal Cr. 0.919 Mixed-
utilitarian 0.794 Mixed-recreational 80 (10) 61 (216)
Johnson Creek Trail 1.258 Mixed-recreational 1.401 Mixed-
utilitarian 100 (1) 70 (87)
Lady Bird Lake Trail 1.582 Mixed-recreational 1.081 Mixed-
utilitarian 100 (1) 91 (46)
Shoal Creek Trail 1.297 Mixed-recreational 1.921 Utilitarian 100 (3) 62 (68)
Average 1.198 Mixed-utilitarian 1.187 Mixed-
utilitarian 23 (weighted
avg.)
60 (weighted
avg.)
Since the Lance Armstrong Bikeway is designed as a concrete facility with proper width
and sightlines for all bicycling purposes, and it directly connects multiple destinations, it is likely
used more for commuting and other utilitarian purposes, in addition to recreation. Its western end
at Shoal Creek (closed of this writing for construction) is located at the edge of parkland
reaching in to the western side of downtown. This corroborates its more recreation-oriented
values in each of the methods, as compared with the Lance Armstrong Bikeway’s crossing of
Waller Creek on the east side of downtown Austin.
The overall relationship of the five counted locations with the survey and crowdsourced
data was evaluated using ordinary least squares regression, and additional measures of spatial
autocorrelation using OpenGeoDa software (Anselin, Syabri, & Kho 2006). Inclusion of both the
CycleTracks and Strava Metro as independent variables resulted in a 0.95 R-squared (0.90
adjusted R-squared), but neither met statistical significance tests for a 95% confidence interval,
likely due to the small number of sites. Spatial autcorrelation is indicated with a Moran’s I value

14
of 3.49, and an associated probability of 0.0005. Tests of both the Breusch-Pagan and Koenker-
Bassett have insignificant probabilities at 0.6 and 0.5 respectively, indicating no significant
heteroskedasticity. These values are consistent with comparison of the values on the trails near
each other in relatively similar urban contexts. Additional monitoring points would need to be
included to draw additional conclusions based on regression methods.
CONCLUSIONS
Through in depth analysis of three bicycle volume data sources at 5 locations in Austin Texas,
this study demonstrates that crowdsourced datasources, sometimes included in the ‘big data’
discourse, show promise as a legitimate tool for evaluating volumes of bicyclists. The relative
sparseness of bicycle volume counts performed restricts analysis of various performance
measures addressing safety, health, air quality, livability and other factors. Additional
crowdsourced data sources, and the increasing volume and opportunities for temporal
comparison through time will indicate this study may serve an important role in the growing
field of active transportation monitoring.
The growing literature on bicycle traffic monitoring has demonstrated solid methods for
counting and evaluating volumes on a range of infrastructure types, but no studies have
previously addressed the challenge of how to fill enormous gaps of unfunded data needs to
acquire volume data on the majority of roadways. Figure 1 shows the extent of geographic
coverage offered by this method, and this study begins to characterize the differences between
users of a fitness-oriented app that crowdsources bicycle volumes, and the larger population in
an area. Crowdsourced methods offer prospect to help fill the dearth of bicycle volume data, and
this study demonstrates the percentage of one proprietary source of data ranging between 2.8%
and 8.8% of all users on trails in downtown Austin, Texas. This study’s methods could be
replicated in other locations to determine locally-consistent factors of crowdsourced data
contributors. Considering that the only previously-available method to estimate volumes on most
roadways was implementation of sophisticated non-motorized travel models, crowdsourced
traffic volumes offer significant opportunities to improve large-area data used in planning for
active transportation, though subject to significant limitations at this time.
In terms of time-based factoring and trip purposes, this study provides further evidence
that the bicycle factor groupings developed by Miranda-Moreno et al. (Miranda-Moreno et al.

15
2013) later extended to mixed-mode trail traffic by Hankey et al. (Hankey et al. 2014) are
generally supported by the CycleTracks trip purpose responses. Researchers and practitioners are
urged caution in the application of a potentially growing field of crowdsourced datasets, in that
they may or may not represent the given population that is considered in a transportation
planning context. Furthermore, the performance measures facilitated by traffic volumes standing
alone should not be mistaken for a comprehensive and ethical planning process (Appleyard,
Ferrell, Carroll, & Taecker 2014).
Limitations and Further Research
The number of available week-long counts restricts the number of factor groups, and therefore
the accuracy of expansion of crowdsourced volumes. In addition, the relatively small number of
trips recorded through the CycleTracks GPS survey does not meet statistical thresholds to
represent the locations in this study, perhaps with the exception of the Lance Armstrong
Bikeway at Waller Creek (n=102). An intercept survey with a question on trip purpose such as
that developed by Forsyth et al. (Forsyth, Agrawal, & Krizek 2012) should be implemented to
further evaluate this study’s findings within other contexts. Acquisition of additional location site
counts of at least one-week duration following recent guidance (Figliozzi, Johnson, Monsere, &
Nordback 2014; Nordback & Janson 2010; Turner & Lasley 2013; United States Department of
Transportation Federal Highway Administration 2013) could allow spatial extrapolation of
counted locations with crowdsourced datasets, yielding accuracy characteristics of focused
counts along with the spatial extent of crowdsourcing.

16
About the Authors
Greg Griffin is a PhD student in Community & Regional Planning, and researches
crowdsourcing methods and active transportation with the Public Engagement Planning program
of the Texas A&M Transportation Institute. Greg is a member of the American Institute of
Certified Planners, and a lifelong bicyclist.
Corresponding Address: Greg Griffin, AICP PhD student The University of Texas at Austin School of Architecture 310 Inner Campus Drive Austin, TX 78712 [email protected] Dr. Junfeng Jiao received three master degrees and one PhD in Architecture, Geographic
Information Systems, Transportation Engineering, and Urban Planning from China, Netherlands,
and USA. He is an Assistant Professor in School of Architecture at UT Austin and interested in
the applications of GIS, GPS, and Big Data in urban environments.
Junfeng Jiao, Ph.D. Assistant Professor The University of Texas at Austin School of Architecture 310 Inner Campus Drive Austin, TX 78712 Phone: (512) 471-1922 Fax: (512) 471-0716 [email protected]
Acknowledgements
The authors appreciate Aleksiina Chapman of the City of Austin Transportation Department
providing the trail bicycle counts, and Brian Riordian of Strava Inc. providing early access to
Strava Metro data used in this study. No external funding supported with study.
17
REFERENCES
Akar, G., & Clifton, K. 2009, Influence of Individual Perceptions and Bicycle Infrastructure on Decision to Bike. Transportation Research Record: Journal of the Transportation Research Board, 2140, 165–172.
Albergotti, R. 2014, Strava, Popular With Cyclists and Runners, Wants to Sell Its Data to Urban Planners. Retrieved September 05, 2014, from http://blogs.wsj.com/digits/2014/05/07/strava-popular-with-cyclists-and-runners-wants-to-sell-its-data-to-urban-planners/
Anselin, L., Syabri, I., & Kho, Y. 2006, GeoDa: An Introduction to Spatial Data Analysis. Geographical Analysis, 38(1), 5–22.
Appleyard, B., Ferrell, C. E., Carroll, M. A., & Taecker, M. 2014. Toward Livability Ethics. Transportation Research Record: Journal of the Transportation Research Board, 2403, 62–71.
B-Cycle, L. 2014. About Austin B-Cycle. Retrieved July 12, 2014, from https://austin.bcycle.com/about/
Brabham, D. C. 2009, Crowdsourcing the Public Participation Process for Planning Projects. Planning Theory, 8(3), 242–262.
Connors, J. P., Lei, S., & Kelly, M. 2011, Citizen Science in the Age of Neogeography: Utilizing Volunteered Geographic Information for Environmental Monitoring. Annals of the Association of American Geographers.
Elwood, S., Goodchild, M. F., & Sui, D. 2013, Prospects for VGI Research and the Emerging Fourth Paradigm. In S. Elwood, M. F. Goodchild, & D. Sui (Eds.), Crowdsourcing Geographic Knowldegde: Volunteered Geographic Information in Theory and Practice, (New York, NY: Springer), 361–375.
Figliozzi, M., Johnson, P., Monsere, C. M., & Nordback, K. 2014, Methodology to Characterize Ideal Short-Term Counting Conditions and Improve AADT Estimation Accuracy Using a Regression-Based Correcting Function. Journal of Transportation Engineering, 140(5).
Forsyth, A., Agrawal, A. W., & Krizek, K. J. 2012, Simple, Inexpensive Approach to Sampling for Pedestrian and Bicycle Surveys. Transportation Research Record: Journal of the Transportation Research Board, 2299, 22–30.
Griffin, G. 2009, Simple Techniques for Forecasting Bicycle and Pedestrian Demand. Practicing Planner, 7(3). Retrieved from http://www.planning.org/practicingplanner/2009/fall/index.htm

18
Griffin, G., Nordback, K., Götschi, T., Stolz, E., & Kothuri, S. 2014, Transportation Research Circular E-C183, Monitoring Bicyclist and Pedestrian Travel and Behavior, Current Research and Practice (p. 31). Washington, D.C.: Transportation Research Board. Retrieved from http://onlinepubs.trb.org/onlinepubs/circulars/ec183.pdf
Halff Associates Inc. 2014, City of Austin Urban Trails Master Plan, Working Draft for Review and Discussion. (Austin, TX: City of Austin).
Hankey, S., Lindsey, G., & Marshall, J. 2014, Day-of-Year Scaling Factors and Design Considerations for Non-motorized Traffic Monitoring Programs. Transportation Research Record: Journal of the Transportation Research Board, in press.
Harkey, D., Reinfurt, D., & Knuiman, M. 1998, Development of the Bicycle Compatibility Index. Transportation Research Record, 1636, 13–20.
Hudson, J. G., Duthie, J. C., Yatinkumar, K., Larsen, K. A., & Meyer, J. L. 2012, Using Smartphones to Collect Bicycle Travel Data in Texas Final Report. (College Station, TX: Texas A&M Transportation Institute).
Kitchel, D., & Riordan, B. 2014, Strava Metro Product Documentation (pp. 1–10). Hanover, NH.
Krykewycz, G. R., Pollard, C., Canzoneri, N., & He, E. 2011, Web-Based “Crowdsourcing” Approach to Improve Areawide “Bikeability” Scoring. Transportation Research Record: Journal of the Transportation Research Board, 2245, 1–7.
Kuzmyak, J. R., Walters, J., Bradley, M., & Kockelman, K. M. 2014, NCHRP Report 770, Estimating Bicycling and Walking for Planning and Project Development: A Guidebook. (Washington, D.C.: Transportation Research Board of the National Academies).
Lindsey, G., Hankey, S., Wang, X., & Chen, J. 2013, The Minnesota Bicycle and Pedestrian Counting Initiative: Methodologies for Non-motorized Traffic Monitoring. Minneapolis, MN. Retrieved from http://www.dot.state.mn.us/research/TS/2013/201324.pdf
Lindsey, G., Nordback, K., & Figliozzi, M. A. 2014, Institutionalizing Bicycle and Pedestrian Monitoring Programs in Three States: Progress and Challenges. Transportation Research Record, 1–22.
Miranda-Moreno, L. F., Nosal, T., Schneider, R. J., & Proulx, F. 2013, Classification of bicycle traffic patterns in five North American Cities. Transportation Research Record: Journal of the Transportation Research Board, 2339, 68–79.
Nordback, K., & Janson, B. 2010, Automated Bicycle Counts. Transportation Research Record: Journal of the Transportation Research Board, 2190, 11–18.
Nordback, K., & Sellinger, M. 2014, Methods for Estimating Bicycling and Walking in Washington State. (Seattle, WA: Washington State Department of Transportation).

19
Roll, J. F. 2013, Bicycle Traffic Count Factoring: An Examination of National, State and Locally Derived Daily Extrapolation Factors. Master’s Thesis, Portland State University.
Ryan, S., & Lindsey, G. 2013, Counting Bicyclists and Pedestrians to Inform Transportation Planning. Princeton, NJ: Robert Wood Johnson Foundation.
Sall, E. A. n.d., The CycleTracks Smartphone Application. Retrieved May 15, 2013, from http://www.sfcta.org/modeling-and-travel-forecasting/cycletracks-iphone-and-android/cycletracks-smartphone-application
Schlossberg, M., & Brehm, C. 2009, Participatory Geographic Information Systems and Active Transportation. Transportation Research Record: Journal of the Transportation Research Board, 2105, 83–91.
Schlossberg, M., & Shuford, E. 2005, Delineating “Public” and “Participation” in PPGIS. URISA Journal, 16(2), 15–26.
Shen, L., & Stopher, P. R. 2014, Review of GPS Travel Survey and GPS Data-Processing Methods. Transport Reviews, 34(3), 316–334.
Strava Inc. 2014a, About Us. Retrieved May 09, 2014, from http://www.strava.com/about
Strava Inc. 2014b, Strava Metro Brief. Hanover, NH.
Tulloch, D. L. 2008, Is VGI participation? From vernal pools to video games. GeoJournal, 72(3-4), 161–171.
Turner, S., & Lasley, P. 2013, Quality Counts for Pedestrians and Bicyclists. Transportation Research Record: Journal of the Transportation Research Board, 2339, 57–67.
U.S. Census Bureau. 2012, American Community Survey 1-Year Estimates. Retrieved May 16, 2014, from http://factfinder2.census.gov/
United States Department of Transportation Federal Highway Administration. 2013, Traffic Monitoring Guide. Washington, D.C.: U.S. Department of Transportation Bureau of Transportation.