crowdsourced geographic information use in government
TRANSCRIPT

i
CrowdsourCed geographiC information use in government
A report prepared for the World Bank
Global Facility for Disaster Reduction and Recovery
About GFDRR The Global Facility for Disaster Reduction and Recovery (GFDRR) helps high-risk low-income developing countries better understand and reduce their vulnerabilities to natural hazards and adapt to climate change Working with over 300 national community level and international partners GFDRR provides grant financing on-the-ground technical assistance helping mainstream disaster mitigation policies into country-level strategies and thought leadership on disaster and climate resilience issues through a range of knowledge sharing activities GFDRR is managed by the World Bank and funded by 21 donor partners
wwwgfdrrorg
Participatory GIS training Bhaktapur (see case study 5)PhoTo KAThmAnDu LIvInG LABS
wwwkathmandulivinglabsorg CC By-SA 30
A land management specialist deployed to the Warrap state South Sudan (see case study 7)PhoTo unDP SouTh SuDAnBRIAn SoKo CC By-nC-SA
Boston StreetBump application in use (see case study 17)PhoTo SuRRey CounTy CounCIL CC By-nD 20
CrowdsourCed geographiC
information use in government
This work is being supported as part of the World Bankrsquos Global Facility for Disaster Reduction and Recovery (GFDRR) project the open Data for Resilience Initiative (openDRI) engaging the public in the process of collecting data on location and characteristics of basic infrastructure and critical facilities has become a key pillar of the openDRI project which has engaged in activities that incorporate this approach in Colombia haiti malawi nepal Sri Lanka Bangladesh Indonesia and the Philippines understanding how governments can better interact with volunteer communities will be critical to the future development of openDRIrsquos work The research is carried out at the extreme Citizen Science group university College London (uCL)
Report written by
Prof mordechai (muki) haklay Department of Civil environmental and Geomatic engineering uCL
Dr vyron Antoniou hellenic Army Geographic Directorate
Sofia Basiouka School of Rural and Surveying engineering national Technical university of Athens
Robert Soden World Bank Global Facility for Disaster Reduction amp Recovery (GFDRR)
Dr Peter mooney Department of Computer Science national university of Ireland maynooth
Reference
haklay m Antoniou v Basiouka S Soden R and mooney P 2014 Crowdsourced geographic information use in government Report to GFDRR (World Bank) London
copy 2014 International Bank for Reconstruction and Development The World Bank1818 h Street nW Washington DC 20433Telephone 202-473-1000 Internet wwwworldbankorg
Some rights reserved
This work is a product of the staff of The World Bank with external contributions note that The World Bank does not necessarily own each component of the content included in the work The World Bank therefore does not warrant that the use of the content contained in the work will not infringe on the rights of third parties The risk of claims resulting from such infringement rests solely with you
The findings interpretations and conclusions expressed in this work do not necessarily reflect the views of The World Bank its Board of executive Directors or the governments they represent The World Bank does not guarantee the accuracy of the data included in this work The boundaries colors denominations and other information shown on any map in this work do not imply any judgment on the part of The World Bank concerning the legal status of any territory or the endorsement or acceptance of such boundaries
nothing herein shall constitute or be considered to be a limitation upon or waiver of the privileges and immunities of The World Bank all of which are specifically reserved
Rights and PermissionsThis work is available under the Creative Commons Attribution 30 unported license (CC By 30) httpcreativecommonsorglicensesby30 under the Creative Commons Attribution license you are free to copy distribute transmit and adapt this work including for commercial purposes under the following conditions
AttributionmdashPlease cite the work as follows haklay m Antoniou v Basiouka S Soden R and mooney P 2014 Crowdsourced geographic information use in government Report to GFDRR (World Bank) London License Creative Commons Attribution CC By 30
TranslationsmdashIf you create a translation of this work please add the following disclaimer along with the attribution This translation was not created by The World Bank and should not be considered an official World Bank translation The World Bank shall not be liable for any content or error in this translation
All queries on rights and licenses should be addressed to the office of the Publisher The World Bank 1818 h Street nW Washington DC 20433 uSA fax 202-522-2625 e-mail pubrightsworldbankorg
Acknowledgement this report was supported by the contributors of the case studies which are listed at the end of the report We would like to thank madeleine hatfield of yellowback for editing and mary Pargeter for the final design of the report Dr Jamal Jokar contributed to the final stages of the report preparation We would also want to thank Kate Chapman nicolas Chavent nama Budhathoki mikel maron Alex Barth Kiru Pillay elizabeth mcCartney Cristina Capineri Glen hart Russell Deffner Steven Johnson Jim mcAndrew and martin van exel for their contribution to the case studies
ConTenTS
7 exeCuTIve SummARy
8 InTRoDuCTIon
11 LeARnInG FRom PAST ImPLemenTATIon oF
GeoGRAPhIC InFoRmATIon In GoveRnmenT
13 ReSeARCh meThoDoLoGy
15 CASe STuDIeS STRuCTuRe AnD oveRvIeW
21 AnALySIS
1 Incentivesdrivers 22
2 Scope and aims 23
3 Participants stakeholders and relationships 24
4 modes of engagement 25
5 Technical aspects 26
6 Success factors 27
7 Problems encountered 28
29 ADoPTInG CRoWDSouRCeD GeoGRAPhIC
InFoRmATIon In GoveRnmenT
32 SummARy AnD WAy FoRWARD
34 CASe STuDIeS
Quick reference 36
1 Participatory mapping and decision support tools for disaster risk reduction the Philippines 38
2 Community mapping for exposure in Indonesia 39
3 Flood preparedness through openStreetmap Jakarta Indonesia 40
4 humanitarian openStreetmap Team mapping in ulaanbaatar mongolia 41
5 mapping schools and health facilities in Kathmandu valley nepal 42
6 Informal settlement mapping map Kibera nairobi Kenya 44
7 mapping of South Sudan 45
8 iCitizen mapping service delivery South Africa 46
9 Skandobs Scandinavian predator tracking system norway and Sweden 47
10 Corine Land Cover 2006 in openStreetmap France 48
11 FixmyStreet for municipality maintenance information uK 49
12 FInTAn vernacular placenames project ordnance Survey and maritime and Coastguard Agency uK 51
13 Towns Conquer gamification and Instituto Geograacutefico nacional toponyms database Spain 52
14 national Biodiversity Data Centre Ireland 53
15 haiti disaster response 55
16 mapping for natural Resources Canada 56
17 Boston StreetBump uS 57
18 open data initiative new york City uS 58
19 Imagery to the Crowd State Department humanitarian Information unit uS 60
20 openStreetmap community of practice uS Census Bureau 61
21 Crowdsourcing The national map national map Corps uS 62
22 uS Geological Survey ldquoDid you feel itrdquo 64
23 Places of Interest project national Park Service uS 65
24 California Roadkill observation System (CRoS) uS 66
25 Shelter Associates slum mapping in India 67
26 Crowdsourcing satellite imagery in Somalia 68
27 Agricultural data collection and sharing by Community Knowledge Workers uganda 68
28 Twitter use in Italian municipalities 69
29 Portland Trimet transportation planner oregon uS 69
70 ReFeRenCeS AnD SouRCeS
5
openStreetmap data collection in haiti (see case study 15) ToD
D h
oFF
mA
n
CC
By
20
6
Participatory GIS training Bhaktapur (see case study 5) KAThmAnDu LIvInG LABS wwwkathmandulivinglabsorg CC By-SA 30
7
The findings are that
bull There are some established cases of close collaboration between government and the public which range from land management and biodiversity monitoring to disaster response These examples demonstrate that successful interaction is possible under certain conditions
bull Many of the lessons from the early implementation of Geographic Information Systems (GIS) in government hold for VGI projects and can be used to ensure their successful implementation
bull Where governmental data is lacking the need for suitable data sets can lead to the initiation of VGI projects
bull Technical issues are not insurmountable so these are not the limiting factor in VGI adoption by government
bull Organizational practices regulations and legal issues such as license conditions are much more likely to restrict VGI projects
bull The acceptance and use of VGI will be influenced by individual organizational business model technical and conceptual factors
exeCuTIve SummARy
This report is based on a six-month study of the use of volunteered geographic information (vGI) by government It focuses on government use of information relating to a location which was produced through what is known as ldquocrowdsourcingrdquo the process of obtaining information from many contributors amongst the general public regardless of their background and skill level The aim of this report is to provide a guide for the successful implementation of vGI in government
Specifically the most significant issues that need to be considered from the start of any VGI project are
bull How the data collected will contribute to government process and the organizational issues that this entails
bull The ways traditional GIS practices and concerns over organizational change might limit the adoption of VGI by government
bull Methods to overcome inherent coverage temporal and participation biases which influence data quality
bull Funding continuation and sustainability beyond often short-term initial projects
bull Maintaining user participation
bull Licensing and other Intellectual Property Rights (IPRs)
bull Identifying clear responsibilities and lines of communication for stakeholders
bull Creating clear reporting channels for participants
8
InTRoDuCTIon
The acceptance of volunteered geographic information (vGI) as a valued and useful source of information for governments is growing at all levels Put simply vGI is ldquocrowdsourcedrdquo geographic information provided by a wide range of participants with varying levels of education knowledge and skills (see michael Goodchildrsquos writing for the original definition of the term) While a growing body of research demonstrates the reliability and accuracy of vGI when compared to official or government produced data sets the progression towards their adoption and wider use is slow There are a range of mechanisms and methods available for ensuring that crowdsourced information is fit for purpose so concerns about data quality are not the major reason for the lack of adoption Instead organizational practices regulations and legal issues limit the rate of change
open dialogue on peoplersquos priorities for their communities in Kigali Rwanda SouRCe unDP CC By-SA 30
9
As the World Bankrsquos Open Data for Resilience Initiative (OpenDRI - see below) has recognized to build resilient societies policy makers and the public must have access to the right data and information to reach good decisions Sharing data and creating open systems promotes transparency accountability and ensures that a wide range of actors can participate in the challenge of building resilience Within this context VGI has a role to play and arguably it will be impossible to achieve the desired results without the active involvement of local communities in this kind of data collection and maintenance
The aim of this report is to review governmental projects that incorporate voluntary and crowdsourced data collection and to provide information that can be used to support the wider adoption of VGI (the terms crowdsourced information and VGI are used interchangeably) To this end the report compiles and distributes lessons learned and successful models from existing efforts by governments at different sectors and scales The research presented in this report was motivated by the following interrelated issues
bull Sources of VGI data such as OpenStreetMap (OSM) are increasingly important across a range of thematic areas and user communities
bull The quality consistency and completeness of VGI data have been assessed by a range of studies and overall have been found to be suited to many tasks and therefore concerns about these issues should not prevent the exploitation of VGI as a valuable source
bull Interacting with VGI communities is a different and potentially more complex relationship than governments have had with traditional sellers and resellers of geographical information systems (GIS) data
bull There are a number of ways in which governments have begun engaging with VGI communities and there is much to learn from early experiences
VGI projects rely on different kinds of information flows which are summarized below
bull PublicGovernment VGI provided by the public to government authorities also has a long history pre-dating the web eg calling to report a problem at a location This report includes several examples of such cooperation to illuminate specific aspects of VGI practice
hosted by the World Bankrsquos Global Facility for Disaster Reduction and Recovery the open Data for Resilience Initiative (openDRI) works to bring the philosophies and practices of the open data movement to bear on the challenges of building resilience to natural hazards and impacts of climate change Partnering with governments international organizations and civil society groups this initiative develops open systems for creating sharing and using disaster risk and climate change information to ensure that a wide range of actors can participate in the challenge of building resilience Since it was launched in 2011 openDRI has worked to implement these ideas in over 25 countries around the world
openDRI
10
bull GovernmentPublicGovernment and PublicGovernmentPublic Examples of two-way cooperation between government and the public or civic society organizations form the core of this report Again collaboration with commercial entities has a long history This report refers particularly to the use of publicly contributed information by a government authority to make decisions and actions (eg NGOs (non-governmental organizations) using OSM data for disaster preparedness) and the release of government information to the public for improvement and its subsequent use by government
In addition there is one flow of information that is not covered in this report but is important in the context of information flows in general in order to understand the full picture
bull GovernmentPublic The flow of information from government to the public is important
but is very rarely implemented to initiate VGI projects The main focus of this report is not on the application of ldquoopen datardquo which is made available by governmental bodies without charge or restrictions to the public as there are examples aplenty in commercial and civic society This is also covered in the OpenDRI Field Guide
This report explores different aspects of government use of VGI including the maintenance of public space (streets public buildings and parks) education health tourism and civil safety It includes a set of case studies with a common structure which are presented at the end of the report The following sections provide background on the use of geographical information by government which has a long history and should be taken into account It then turns to the methodology of the research and explains how it developed A detailed explanation for the case study structure and overview of the case studies is provided next This is followed by analysis of the findings and recommendations for improving the use of VGI in government
Boston StreetBump application in use (see case study 17) SuRRey CounTy CounCIL CC By-nD 20
11
By the 1980s with the introduction of customisable and off-the-shelf software packages GIS implementation became more common in organizations This led to research into the processes that assist organizations in implementing GIS and how to ensure that the use of digital geographical information is done in an effective way Of particular importance and relevance to this report are the work of Stan Aronoff and his 1989 book Geographic Information Systems a Management Perspective and William Huxholdrsquos An Introduction to Urban GIS Both paid attention to the management of GIS projects the importance of understanding the way organizations work and the effort required for successful GIS implementation
The issue of data capture is particularly relevant to contemporary VGI projects In the early days a major part of any given GIS project was the conversion of paper maps to digital formats The challenges of integrating varied data sources into a coherent database reflect many of the issues emerging from crowdsourced information Since this early work the implementation of GIS projects have received on-going attention with Roger Tomlinsonrsquos 2007 Thinking about GIS Geographic information system planning for managers and significant portions of a leading GIS textbook such as Longley et alrsquos
LeARnInG FRom PAST ImPLemenTATIon oF GeoGRAPhIC InFoRmATIon In GoveRnmenT
2010 Geographic Information Systems and Science providing the latest summaries from nearly four decades of practice
While VGI projects may seem fundamentally different from these projects with their higher level of public engagement and informal participation scheme there are a lot of parallels This is because the governmental systems to which VGI is integrated are often ldquoenterprise systemsrdquo set along the same lines Moreover many of the early lessons from when GIS was first introduced to governmental organizations are similar to the findings discussed below For example as with early GIS implementation VGI use relies on specific individuals who act as ldquochampionsrdquo inside the organization and spearhead the effort necessary to secure acceptance for this source of information Another example is the opportunity that major events such as disaster response create in terms of rethinking current procedures and practices Evaluations of organizational responses provide opportunities to reflect on the way current systems are utilized and develop new procedures for data capture and use They also open up the policy opportunity to recognize the use of VGI just as for GIS
The history of digital geographical information is intertwined with government activities The system commonly recognized as the first GIS was created by the Canadian government in the 1960s to map land use and agricultural productivity and suitability moreover the use of geographical information by government bodies at all levels ndash from the local to the regional national and intergovernmental ndash continues to be one of the most significant applications of GIS
12
Brabham (2013) Best practices for crowdsourcing in government
One Clearly define the problem and solution parameters
Two Determine the level of commitment to the outcomes commit to communicate to the online community exactly how much impact user-submitted ideas and labor will have on the organization
Three Know the online community and their motivations It is important to know whether a given crowdsourcing application will appeal to participants
Four Invest in usable stimulating well-designed tools
Five Craft policies that consider the legal needs of the organization and the online community
Six Launch a promotional plan and a plan to grow and sustain the community
Seven Be honest transparent and responsive
Eight Be involved but share control
Nine Acknowledge users and follow through on obligations
Ten Assess the project from many angles
As a consequence working with people who are experienced in implementing GIS in government and encouraging them to adopt VGI as a usable source of information makes it possible to use past lessons from other projects and adapt them to VGI In other words while accepting the specific characteristics of VGI it should not be seen as an unprecedented data source
To the best of our knowledge though this is the first study and report of its kind to deal directly with VGI use in government Brabham (2013) produced a report called ldquoUsing Crowdsourcing in Governmentrdquo which outlines a more general overview of the potential for crowdsourcing in government (see box) Brabham also attempts to classify crowdsourcing and understand when and how to deploy crowdsourcing in government His analysis includes a small number of case studies and the report concludes with ten best practices and considerations for crowdsourcing This summary is a helpful starting point on which this report builds
ordnance Survey map of the coast (see case study 12)
CR
AIG
Ch
eW
-mo
uLD
InG
C
C B
y-S
A 2
0
13
The website and questionnaire were tested with five experts active in the area of VGI and government and their feedback was used to improve it before promoting the website in email lists and other social media outlets between late February and early May 2014 The website offered an incentive scheme in which contributors chose between donating to OSM another organization or receiving Amazon vouchers This aimed to encourage a variety of contributors to provide the research team with concrete case studies The website received 3500 page views over the period from about 1100 visitors However only five responses were provided through the open questionnaire Therefore in parallel to
ReSeARCh meThoDoLoGy
The overall structure of the research process was as follows First seven cases known to the research team were developed collaboratively to establish the relevant information required for each case study and develop a questionnaire with appropriate fields to capture this once the pilot case studies had been developed in January 2014 they were transferred to a website The case studies together with introductory material and details about the report provided the context for the questionnaire which was integrated on the site
the questionnaire the research team continued to search for identify and compile further case studies bringing the total to 29 The details of the case studies are summarized below and then provided in full in a later section (five are shorter due to the limited information available)
Following the data collection exercise the case studies were reviewed analyzed further documented and classified according to themes This provided the outline of the Analysis section The final report was then opened for comments from the Global Facility for Disaster Reduction and Recovery (GFDRR) and the wider community before it was concluded
14
openStreetmap mapping in London ALexAnDeR KAChKAev CC By-SA 20
15
each case study is intended to provide an example of the use of vGI by government or by the public and summarizes the context positive and negative outcomes and main lessons The case studies are presented in full in a later section and are all deliberately short with the same structure
First a summary table provides general information about the case study in the format below
Interaction type The flow of the data (either crowdsourced or authoritative) in one of the categories introduced earlier PublicGovernment GovernmentPublicGovernment or PublicGovernmentPublic
Trigger event A specific event that might have triggered the data sharing (eg change in data license natural disaster etc) where relevant
Domain The area in which the data sets have been used This may include both an abstract characterisation of the general area (eg generic mapping) as well as information about the specific field (eg update of national topographic database)
Organization The organization(s) that initiated the data sharing process and those that have been actively involved in the whole project
Actors Interested partiesstakeholders that have contributed to or benefited from the data sharing process in any way
Data sets The data sets that have been shared and used by the public or the authorities (including new data sets generated)
Process The process followed to implement the data sharing data integration and cooperation
Feedback The immediate result returned to the initiator of andor participants in the data sharing process if any
Goal The original goal of the project and reason for exploring crowdsourced geographic information
Side effects Any other issues or outcomes
Contact point The person who has either provided details about or been significantly involved in the case study when available
CASe STuDIeS STRuCTuRe AnD oveRvIeW
16
Next each case study includes the context a description of the project and a discussion of the positive and negative aspects of the collaboration They each close with bullet points indicating the most important lessons to be learnt Below are short descriptions of the case studies that provide the basis for this report
1 Participatory mapping and decision support tools for disaster risk reduction the PhilippinesThis project provided training and technical assistance to local government units to create basemap information and then perform impact analysis using InaSAFE impact modeling software This allows analysis of the effect of a disaster on an area using scientific models as well as populationinfrastructure data
2 Community Mapping for Exposure in IndonesiaThe goal of this project is to reduce vulnerability to natural disasters Young people have successfully
collected spatial and attribute data and traced them in the OSM platform so that thematic maps can be created to show potential damage in case of physical disasters
3 Flood preparedness through OpenStreetMap Jakarta IndonesiaA sub-category of Community Mapping for Exposure in this project the heads of villages in the area of interest were asked to identify their critical infrastructure by using paper maps and university students entered the information into OSM The data can produce maps for disaster risk planning
4 Humanitarian OpenStreetMap Team mapping in Ulaanbaatar MongoliaA greater vision for creating a ldquoSmart Cityrdquo in Ulaanbaatar Mongolia motivated local stakeholders and volunteers to participate in a project to create an updated topographic map The World BankICT and the Humanitarian OpenStreetMap Team (HOT) worked with local officials (universities city officials and government) to establish an OSM community in the city to support this project
Trimet mAx and bus on Portland mall (see case study 29) TRImeT CC By-nC-SA 20
17
5 Mapping schools and health facilities in Kathmandu Valley NepalThis is a proactive crowdsourced mapping project to minimize the consequences of a possible future natural disaster in an area at high risk of a high-magnitude earthquake Learning from the difficulties in Haiti Kathmandu officials have worked with NGOs to map the basic education and health infrastructure These data sets will facilitate the delivery of humanitarian efforts if needed
6 Informal settlement mapping Map Kibera Nairobi KenyaMap Kibera was carried out in the most crowded slum in Nairobi Kenya in an effort to improve its reputation and offer an accurate picture of the area which is quite dynamic due to the movement of the population Local people collected and edited GPS tracks Innovative techniques such as SMS video and voice reporting were also launched and a small amount of compensation offered to participants
7 Mapping of South SudanThis was launched because of the need for a temporal and up-to-date map when the new nation was created Google Map Maker the Sudanese diaspora and various organizations carried out workshops to train people to work separately on the digitization of aerial imagery A significant amount of work was completed in a short time by adopting local knowledge and providing technical tools Those who experienced the training sessions were inspired to recruit new volunteers
8 iCitizen mapping service delivery South Africa This project is at the design phase and aims to involve the public at a local level to collect data points via mobile phones and adopt different ways of geotagging photos in real time or via SMS and email The purpose is to report infrastructure problems
9 Skandobs Scandinavian predator tracking system Norway and Sweden This is a cross-country project developed to collect observations for lynx wolverine brown bear and wolf populations driven by new legislation requirements Reliable observations help to inform management objectives including long-term conservation and population-level management Monitoring is complicated and expensive for many reasons including the geographical size of the area under observation but involving the public has been very successful
10 Corine Land Cover 2006 in OpenStreetMap FranceThe change in the data release policy of CLC2006 enabled the French OSM community to integrate it into OSM and engage the public to add updates The methodology and best practices were adopted by a large number of national OSM communities The updated OSM data can be used by the public and governmental agencies
11 FixMyStreet for municipality maintenance information UKLed by a third sector organization (mySociety) this project is based on a web platform that engages the public to provide data about problems in the local area The data collected is propagated to the local authority responsible for maintenance which can then feedback any action taken to remedy the problem
12 FINTAN vernacular placenames project Ordnance Survey and Maritime and Coastguard Agency UKThis project leverages ldquoprofessionalrdquo crowdsourcing to facilitate the response to distress calls by centrally recording and managing vernacular placenames In order to achieve this HM Coastguard personnel and other professionals submit their local knowledge on placenames to a central platform
18
13 Towns Conquer gamification and Instituto Geograacutefico Nacional toponyms database SpainDeveloped when a university research team were awarded a small funding prize an Android-based game was created and linked to a web-based map service at Spainrsquos national mapping agency (NMA) Volunteers were able to submit their suggestions for corrections and updates within a competition format
14 National Biodiversity Data Centre IrelandThis project was initiated to leverage the potential of outreach groups and the general public for data survey and observation This widens the base from which observational biodiversity data may be obtained in Ireland Another aim was to initiate a stronger engagement of non-professional scientists and heighten the understanding of biodiversity related matters amongst the general population
15 Haiti disaster responseOne of the most well-known crowdsourcing applications this was developed after the earthquake hit Haiti in 2010 Within 48 hours the capital had been mapped by volunteers who contributed from every part of the world to create a temporal topographic map to fill the gap left by the official mapping agency The maps were used by various organizations to allocate supplies and medicine
16 Mapping for Natural Resources CanadaThe Mapping Information Branch of Natural Resources Canada (NRCan) is releasing its data sets into OSM format in an effort to engage the local OSM community The aim is to update the national database to supplement the agencyrsquos limited resources and correct outdated topographic maps
17 Boston StreetBump USThis is part of an initiative by the Boston Mayorrsquos Office of New Urban Mechanics (MONUM) to pilot experiments that offer the potential to radically improve the quality of city services The idea was to capture new technology ndash from smartphones to GPS ndash and a resurgent spirit of civic engagement In this example the public use their smartphones to help detect bumps or potholes on Bostonrsquos streets
18 Open data initiative New York City USPart of a broader open data initiative the City of New York has released building footprint and address location data MapBox a private company in partnership with the US OSM community has begun importing these data sets into OSM The city administration receives email updates when changes are made This helps them to prioritize surveying efforts and keep government data up to date
19 Imagery to the Crowd State Department Humanitarian Information Unit USA program whereby high-resolution satellite imagery is made available to the OSM community to facilitate the digitization of ground features The resulting data has been used to support a number of humanitarian operations
20 OpenStreetMap Community of Practice US Census BureauSeveral US Census Bureau employees have worked to build an active volunteer group of OSM contributors within the Bureau This group is now advocating for the incorporation of VGI practices into Census operations
21 Crowdsourcing The National Map National Map Corps USThe National Map Corps has given volunteers the chance to collect and edit data about ten different human-made structures in 50 states in an effort to provide accurate and authoritative spatial data The methodology includes various steps such as
19
adding new features removing obsolete points and correcting existing data A pilot test in Colorado showed that the VGI was satisfactory in its accuracy
22 US Geological Survey ldquoDid you feel itrdquoA website that automatically maps reports from the public about their perception of recent seismic activity in their areas It also collects quantitative data from citizen reports The project was driven by a lack of instrumental ground-motion data in regions of low seismicity and the vast amount of new data being collected offers a valuable resource and has the potential to address some long-standing controversies in earthquake science
23 Places of Interest project National Park Service USThe US National Park service is seeking to incorporate VGI principles into their strategy for keeping park maps up to date and accurate Using tools developed by the OSM community park visitors and staff can now contribute to mapping trails tourist sites and other park infrastructure
24 California Roadkill Observation System (CROS) USThis project was developed by a university-based research organization to understand the relationship between ecology wildlife behavior and transportation It includes the use of GIS and statistical modeling to predict roadkill hotspots measure contributing factors quantify impacts and estimate benefits of different remedial actions CROS can be used to record observations from reporters out in the field who come across identifiable road-killed wildlife The goal is to provide a safer environment for wildlife in relation to Californiarsquos motorways
25 Shelter Associates slum mapping in IndiaShelter Associates is an NGO focused on housing projects sanitation health and education initiatives in India It uses slum mapping to promote good governance and decision making policies It is
a hybrid model with expert and local volunteer contributors and has used GIS since the late 1990s recently introducing Google Earth as an easy-to-use tool for informal settlement mapping
26 Crowdsourcing satellite imagery in SomaliaThis project was launched in an effort to map all shelters located in the Afgooye corridor Somalia to identify the number and location of refugees Satellite imagery was used to map the information in order to facilitate decision making policies
27 Agricultural data collection and sharing by Community Knowledge Workers UgandaA Community Knowledge Workers network in Uganda facilitates grassroots data collection and sharing by farmers for other farmers and policy makers The network has overcome the lack of electric power and mobile network infrastructures to provide data and services such as weather forecasts crop market prices livestock disease outbreaks and focused policy implementation for improved farming practices
28 Twitter use in Italian municipalitiesA research project into the profile activity and use of Twitter accounts of Italian municipalities the study focused on the types of messages sent revealing that culture and tourism are the most common topics Twitter also provides opportunities for members of the public to communicate with municipalities
29 Portland TriMet transportation planner Oregon USTriMet the public agency that provides bus light rail and commuter rail transit services in the Portland Oregon metropolitan area turned to the use of OSM data to improve its services by including multimodal transportation plans The TriMet officials committed to support the OSM community and realized that releasing governmental data to the public led to improved public services
20
Participants of the map Kibera project (see case study 6) mAP KIBeRA CC By-nC-SA 20
21
AnALySIS
The overall analysis of the collected case studies delineates seven main components of vGI projects for government use
1 Incentivesdrivers to start a project mostly from the government perspective
2 Scope and aims
3 Participants stakeholders and relationships identifying the roles that different participants play
4 modes of engagement
5 Technical aspects
6 Success factors
7 Problems encountered
22
Lack of institutional data in time sensitive situationsThis is one of the most common drivers and its importance was shown particularly by the aftermath of the Haiti earthquake where there was an urgent need to provide mapping to facilitate humanitarian and first aid efforts The Kathmandu case study is a proactive example of local and international stakeholders teaming up to provide basic mapping of schools and health facilities in case of earthquake
Policy change around governmental dataFor example the adoption of an open data policy in New York City the use of the released CLC2006 data by the French OSM community and the US State Department Humanitarian Information Unit (HIU) sharing high-resolution imagery with humanitarian organizations and volunteer communities
Low resources and need for infrastructure supportInterestingly this situation can be a driver for both well-established NMAs such as the one in Canada where updates are needed to mapping covering 10 million km2 and newly established ones such as in South Sudan where basic topographic features are needed to build the first data infrastructure of the new state Similarly the implementation of ambitious efforts like the ldquoSmart Cityrdquo project in Ulaanbaatar Mongolia need support from VGI
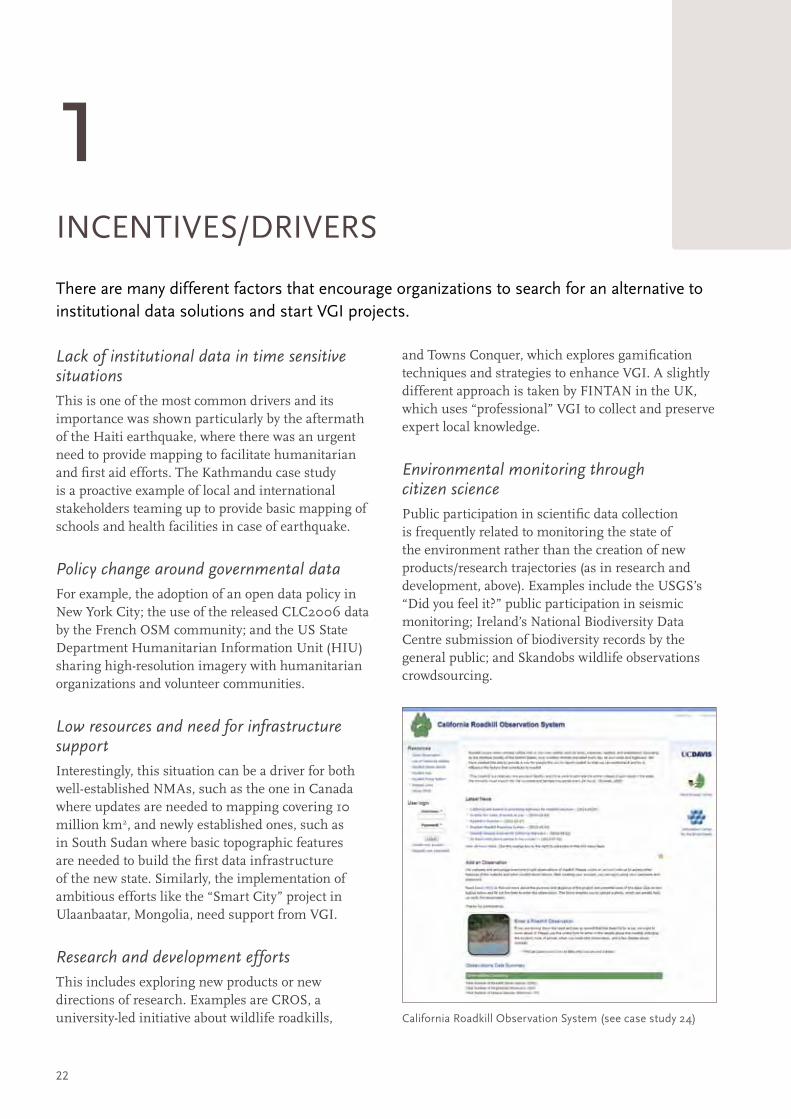
Research and development effortsThis includes exploring new products or new directions of research Examples are CROS a university-led initiative about wildlife roadkills
1InCenTIveSDRIveRS
and Towns Conquer which explores gamification techniques and strategies to enhance VGI A slightly different approach is taken by FINTAN in the UK which uses ldquoprofessionalrdquo VGI to collect and preserve expert local knowledge
Environmental monitoring through citizen sciencePublic participation in scientific data collection is frequently related to monitoring the state of the environment rather than the creation of new productsresearch trajectories (as in research and development above) Examples include the USGSrsquos ldquoDid you feel itrdquo public participation in seismic monitoring Irelandrsquos National Biodiversity Data Centre submission of biodiversity records by the general public and Skandobs wildlife observations crowdsourcing
There are many different factors that encourage organizations to search for an alternative to institutional data solutions and start vGI projects
California Roadkill observation System (see case study 24)
23
2SCoPe AnD AImS
Basic mapping coverageIn many cases the aim is as basic as the creation of a cartographic background for an area of interest or entire country In many developing countries there is no spatial data infrastructure to support efforts such as humanitarian support disaster prevention and general planning Examples include South Sudan where the new nation was in urgent need of basic cartographic coverage and Map Kibera where the aim is to create a topographic backdrop of Nairobirsquos biggest informal urban settlement
Update authoritative spatial data setsA step further is the aim to support established spatial infrastructures Keeping data sets up to date (mainly through change detection projects) is a crucial task especially for NMAs as this guarantees the quality of their services Examples include NRCan Towns Conquer New York Cityrsquos open data initiative Ulaanbaatarrsquos ldquoSmart Cityrdquo and the US Census Bureau
Upgrade public sector servicesRelated to the above is the effort to collect new and unrecorded spatial data sets to upgrade the quality of the services provided by a public sector organization Examples include the FINTAN project in the UK which will improve HM Coastguard services in terms of time response to distress calls Portland TriMet iCitizen in South Africa Boston StreetBump and FixMyStreet
Policy development or reportingLocal knowledge and the timely nature of participantsrsquo observations are two of the most important VGI characteristics that stakeholders are trying to tap into Examples that combine observation gathering and policy planning are CROS where observations about roadkills help stakeholders
understand the phenomenon and the best remedial actions and Skandobs where wildlife observations inform actions and policies in accordance with new legislation Irelandrsquos NBDC and USGSrsquos ldquoDid you feel itrdquo are more report oriented and use the observations to stimulate public engagement and analysis respectively
iCitizen interface (case study 8)
Natural disaster preparedness (proactive) and crisis management (reactive)As well as being a driver one of the most important aims of existing projects is to build spatial data sets for humanitarian purposes This covers both the action of crisis management after a natural disaster as in Haiti and the proactive actions of creating the necessary infrastructure in an effort to minimize the consequences of a future disaster as in the cases of Kathmandu Indonesia and the Imagery to the Crowd project
KIR
u P
ILL
Ay
un
IveR
SIT
y o
F T
he
WIT
WA
TeR
SRA
nD
24
Public sector and NGOsinternational organizationsThis type of cooperation is relevant to various contexts including crisis management where the active participation of all stakeholders is needed to address often difficult and complicated tasks Those involved in such partnerships include the United Nations World Bank HOT NMAs state mapping departments and local universities The following examples indicate the breadth of such cooperative efforts Haiti disaster response Imagery to the Crowd Ulaanbaatarrsquos ldquoSmart Cityrdquo Kathmandu and Map Kibera (the latter involving thirteen national and international bodies)
Public sector private sector and NGO cooperationAn even more inclusive type of cooperation is the additional participation of the private sector For example MapBox joined forces with the OSM community and the New York City government to support data migration and software provision in turn gaining valuable insight into the data released In another case a number of international organizations had the active support of Google in terms of software and user motivation to help the local government begin the mapping of South Sudan
3PARTICIPAnTS STAKehoLDeRS AnD ReLATIonShIPS
Universities and research institutionsAs VGI is a relatively new and dynamic phenomenon there is much active research undertaken by universities and research institutions on its evolution (eg Towns Conquer) and on possible real-life applications (eg Skandobs USGSrsquos ldquoDid you feel itrdquo Irelandrsquos National Biodiversity Data Centre and CROS California)
Private and public sector initiativesThe private rather than public sector can also lead on projects for VGI use in government One such example is FixMyStreet run by social enterprise mySociety another is the involvement of the UKrsquos Ordnance Survey (which functions with market criteria despite being an NMA) in the development of an application that supports ldquoprofessionalrdquo crowdsourcing for vernacular placenames for use by HM Coastguard
Skandobs observation of a lynx (see case study 9)
25
4moDeS oF enGAGemenT
Reaching out for public supportOne of most common types of engagement is for the stakeholders to directly reach out for public support and in parallel engage with pre-existing local communities of volunteers (eg Kathmandu) or create such communities (eg Ulaanbaatar) as part of the effort to produce geospatial data sets Another example is the engagement of the diaspora of South Sudan to provide a solid topographic map of the new state The Haiti disaster response is an interesting example because there was strong hesitation on behalf of the local NMA regarding the support that non-experts could provide However due to the initiatives of other participants (ie OSM UN) the results of the public engagement proved to be a valuable tool for delivering relief on the ground
Releasing existing resourcesThis can include the release of data sets (including visual databases) or license changes enabling greater use for public users including the OSM community and private entrepreneurs The most characteristic cases of this type of engagement are the Imagery to the Crowd project New York City open data initiative and use of Corine Land Cover 2006 in France Both the general public and active volunteers seem to be in quest of data sets that will facilitate their efforts and thus welcome such initiatives
Direct investmentDirectly employing contributors can help government agencies to ensure that the data collected meets their immediate needs while still benefiting from participation in the broader ecosystem In both the Portland TriMet and Community Mapping for Exposure in Indonesia case studies government resources were used to hire in-house mappers to contribute to OSM Community-based projects in areas of very low income can also benefit from providing financial compensation to public
participants to replace earning potential as Map Kibera did in Kenya
Research and citizen science initiativesAlthough giving the public the opportunity to participate in monitoring and research projects has a very long and successful history technological advances especially in the mobile domain offer a different level of dynamic engagement The case studies of Towns Conquer CROS USGS Skandobs and Irelandrsquos National Biodiversity Data Centre all demonstrate this type of engagement
Role of champions within a specific community of practiceThis type of engagement stems from individualsrsquo prior knowledge about the nature and use of VGI and often from their cooperation with local communities such as OSM volunteers Their personal effort pushes their organizations to engage more actively in VGI and develop methodologies and best practices that would be beneficial for all stakeholders including governmental organizations the OSM community and the public This particular mode of engagement can be observed in the case studies of the US Census Bureau and Natural Resources Canada
Christmas Bird Count is an example for citizen science projectsJe
nn
IFeR
Je
We
TT
uSF
WS
C
C B
y 2
0
26
Combination of conventional and open source dataMany crowdsourcing projects use a wide range of software applications both closed and open source The Corine Land Cover in France and Natural Resources Canada case studies prove that combining various tools in different applications can widen the technical horizons of an application and create new opportunities However access to the knowledge and experience of using these software tools is not available to everyone and requires high technical abilities
Data setsAnother issue with VGI data sets is the need for synchronisation and coordination During update operations data sets often diverge but the users and recipients of a project should know which version is the correct one and how to maintain a definitive copy In some cases and especially where open source software is used the format of data is not convenient for further use in proprietary software packages making it difficult to reintegrate the data Therefore the interoperability of data formats is a significant issue
Accuracy and qualityThe accuracy of the information continues to play a key role in VGI projects Community Mapping for Exposure in Indonesia indicated that accuracy varies among the different data sets which is an issue of concern Elsewhere the Colorado pilot project for the National Map Corps showed that accuracy significantly improved when volunteer participation increased A related concern includes the accuracy of data collected by mobile phones as in the iCitizen
5TeChnICAL ASPeCTS
project where this is the main issue However there are many methods for quality assurance in VGI and these can be used to ensure the accuracy and quality of the information
AuthorityThe authority given to VGI data is one of the most challenging issues for its use in government In a departure from an era in which information is considered authoritative simply because it originates from a government organization recognition of the inherent heterogeneity in geographical information and the need to keep it up to date permeate many of the case studies However because government bodies have both the authority and the responsibility to provide accurate and comprehensive information this requires more control over the data and its quality Many of the case studies such as USGS or NRCan show that governmental organizations need to put appropriate procedures in place to ensure that regardless of the source the information released is accepted as trustworthy and valuable
of specific relevance here is the need to formalize and standardize vGI before it can be used in government systems This influences the following aspects
openStreetmap buildings
Do
nA
LD n
oB
Le
CC
By
20
27
Identification of appropriate cooperation between the public and governmentApproval and acceptance by the government is central to VGI success in this context regardless of the stage of the project Approval means not only the adoption of crowdsourcing techniques but also the cooperation between the public and government in a continuous effort to produce the desired result Governmental experimentation plays a crucial role in identifying how to incorporate crowdsourcing techniques into official activities and projects VGI support is divided into two main categories that offered during the evolution of the project (eg NRCan-OSM on-going collaboration) and that offered in its aftermath (eg South Sudan government evaluation of the project by Google Map Maker and the Sudanese diaspora) In contrast it is notable that the outcomes of the Haiti disaster response were not subsequently used by the local official mapping agency though they were used by other humanitarian actors operating in the country at the time This represents a missed opportunity to establish a richer connection between the Haitian government and the OSM community and is linked to issues of IPR covered below
Partnership of scientific organizationsStrong collaboration between different organizations which are experts in different parts of a project is key to success Although in a few cases this has led to a lack of coordination and duplication of data (eg the Haiti disaster response) in others duties are separated into technical economic and human resources (eg the National Map Corps project) Research organizations and universities can play a positive role in this as centers of innovative ideas and techniques as well as participants and volunteers
6SuCCeSS FACToRS
WorkshopsA series of workshops carried out in the preliminary stages of projects encourages the training of volunteers and defines the pattern for participant coordination It is noticeable that among the most successful stories (eg Community Mapping for Exposure in Indonesia Map Kibera in Kenya and South Sudan mapping) the workshops indicated the value of partnering with scientific organizations such as local universities to train volunteers and conduct quality assessment to ensure government acceptance of the data
Recruitment of volunteersAlthough the common view is that the public can participate in all crowdsourcing applications without restriction the reality is quite different Most projects are oriented to specific tasks and recruit the public according to their age background or technical skills One example is Community Mapping for Exposure in Indonesia where young undergraduate students were recruited and scholarships offered in exchange for participation As crowdsourcing reaches new locations compensations and awards to participants may also become more important as in the case of Map Kibera
Innovative techniquesIn an effort to keep the interest of the public and adopt new technologies and platforms different organizations have promoted new crowdsourcing techniques such as gamification (eg Towns Conquer) and reporting with the aid of photographs video and SMS (eg Map Kibera) or use of social media (eg by Italian municipalities)
elements that contribute to the success of vGI projects should be considered from the outset and are often linked to the original drivers
28
One-off event versus on-going initiativeWhile many VGI activities are conceived as a single event the longevity of updates and maintenance needs careful consideration Projects vary significantly in this respect For example the use of CLC2006 in OSM in France lasted many months and resulted in an outcome which remained unexploited while others lasting only a few days such as the mapping of South Sudan and the Haitian disaster response provided a clear solution to a significant problem relatively quickly The main differentiation concerns the strategy behind each VGI project and how it is recognized by local authorities and the public whether as a one-off crowdsourcing event or as an on-going initiative The response is directly linked to the perspectives that have been cultivated the trust that is given and the aims of the project
Accuracy and reliabilityThe quality of the VGI and its application are among the main questions that must be answered at the beginning of and during a project A challenge in projects launched or supported by governmental bodies is that they are responsible for providing authoritative data while also integrating input from the public making accuracy and reliability key issues The case studies demonstrate different levels of accuracy and ways of assessing this (eg Community Mapping for Exposure in Indonesia National Map Corps in the US) Accuracy varies depending on the new datarsquos purpose and the existing data available as a reference This is also relevant to hardware issues in passive VGI in which data from sensors that are carried by members of the public is shared with government bodies For example in the Boston StreetBump case study the use of smartphone-based sensor technology produced many ldquofalse-positivesrdquo due to erroneous movement detection As noted there are multiple
methodologies for quality assurance of VGI and these should be explored and integrated according to the specific context and aims
Maintaining public interestPublic interest and participation need to be maintained through the life of a VGI project For example researchers involved in iCitizen are concerned about how to convince the public to use mobile phones and applications The experiences of other projects indicate that solutions are divided between less and more economically developed contexts In the former attracting volunteers means offering a small amount of compensation to replace time that could otherwise be used to generate income In the latter innovative techniques such as gamification and clear targets can be helpful Maintaining the data and the relevant software is also an issue of concern Financial resources should therefore be split across the whole life of a project rather than allocated only to the beginning stages
7PRoBLemS enCounTeReD
Five-day openStreetmap training to nepal Red Cross Society for community based disaster risk reduction (Koshi Basin) program
KA
Th
mA
nD
u L
IvIn
G L
AB
S w
ww
kat
hm
and
uliv
ingl
abs
org
C
C B
y-S
A 3
0
29
Separation between data collection and use for policy analysisOne of the key concerns for the public involved in VGI is how and where their data and contributions are put to use Very often it is unclear if their information has been used at all In this report we have emphasized where VGI has been used to directly influence policy It is very important when adopting crowdsourcing that the connection between data collection and eventual use by the government is made clear
Traditional GIS practices and concern over organizational changeIt is important to highlight that VGI should not be seen as an activity that replaces the work of professionals but as one that enhances it In some cases such as Haiti the use of VGI was seen as a direct threat to the business model of the NMA and the OSM data could not be adopted without consideration of how this could be protected (see also Intellectual Property Rights issues) In other cases VGI is perceived as a challenge to existing procedures funding and professional standing which leads to a negative response There is also a need to integrate VGI processes including issues of engagement and feedback to contributors into established systems practices and procedures In some cases current practice does not require
ADoPTInG CRoWDSouRCeD GeoGRAPhIC InFoRmATIon In GoveRnmenT
The clear message in this report is that there is no ldquomagic bulletrdquo or perfect methodology for a vGI project however it does reveal that there are a series of issues which need to be addressed when considering a crowdsourcing project Attention to these issues can increase the likelihood of successful adoption by government and acceptance by the public
such high levels of engagement so organizational transition is required This is particularly important in emergency situations where entrenched procedures are necessary to ensure an appropriate response and capacity to deal with uncertainty and complexity is reduced If VGI is considered for use in crisis response it should be evaluated and tried in preparation exercises to ensure that it is fit for purpose
Inherent coverage temporal and participation biasesThe growing body of research into VGI demonstrates that they can exhibit certain biases in the level of participation as well as when and where the activities take place For example there is a problem of coverage bias towards populated and popular places (such as large urban centers) and crowdsourcing rarely includes a representative sample of the general population An example of a case study limited by such inherent biases is the Skandobs project where the real areas of interest are geographically remote and present physically challenging terrain Special incentives may be needed to encourage public involvement from specific regions and known biases of this kind should be considered during the design and implementation of such projects
30
Project continuation and sustainabilityIn many of the case studies examined there is no specific plan for longer term adoption of VGI by the governments involved Adoption of crowdsourcing by government is a process which must be subject to resource management and organizational change Adopting crowdsourcing is likely to require additional resources in terms of managing the crowdsourcing processes the data collected and engaging with the communities involved Interaction with crowdsourcing projects may be terminated by governments for a number of reasons the VGI champion may be redeployed there may be a change in policy or resources may not be available to continue the engagement Governments must consider long-term plans and assess the sustainability of their adoption of crowdsourcing
Licensing and other Intellectual Property Rights (IPR)Concerns over data ownership and specific licensing agreements are another obstacle to the adoption of VGI in government Incompatibility in licensing should be considered at the outset of the project For example the OSM license requires data to be shared-alike and Google owns all data in Google Map Maker IPR is especially important in geographical data sets because most of the value will not come from a single data set but from linking and matching it with other data sets This means that problems with derivation (eg the source that dictates the coordinates used to locate an object on the map) can emerge and create uncertainty about how the data can be used and under which conditions
Contact pointsWhen governments engage with established crowdsourcing communities it is very important that there are open and clear lines of communication between both parties Some of the skepticism around VGI stems from the fact that it can be difficult to contact those involved This is very different from when governments enter into a contract with a third party company or organization When governments provide a general call for contributions from the public there is often no way of contacting the leader or director of the crowdsourcing community and indeed such a person may not exist HOT provides an example as to how this can be resolved as an established organization dedicated to providing VGI services in crisis situations More generally there is a need to define clear ownership of the process and responsibility over its management The information should be clear so volunteers can easily identify and contact the responsible individual especially in case of emergency
Conflict between channels of reportingIn some projects channels of reporting can be confusing and conflicting for participants An example is the relationship between FixMyStreet which is run by an independent body and the helpline of the local authority In other cases there are multiple channels which can be important in crisis situations but require management At the same time it is clear that different participants will prefer different channels so enforcing the use of a single channel can be counterproductive
Reporting with FixmyStreet (see case study 11)A
LA
n S
TAn
Ton
C
C B
y-S
A 2
0
31
Jo SummeRFIeLD CC By-nD 20Citizen science participant during a Bioblitz
32
SummARy AnD WAy FoRWARD
This report has reviewed vGI use in government and identified success factors and challenges While suggestions of crowdsourcing best practices that were identified by Brabham (2013) are relevant here such as the need to define the problem clearly ensuring commitment from the organization and knowing the online community this report identifies several factors specific to vGI projects To summarize the factors likely to influence the use of vGI relate to the following
At the individual level champions and change leaders within public sector organizations can be critical In both the UK and France there are examples of open data enthusiasts at local government level who have led to significant changes in the way organizations use VGI Such champions were always critical in the adoption of geographic information technologies in government and will continue to be so On the other hand specific individuals with worldviews that oppose public participation in data collection and analysis can block or hinder the integration of VGI into government
The organizational level is also important In organizations mostly using information provided by external sources (eg private sector) there is a higher potential for replacing this information with VGI than if information is maintained internally and the use of VGI might be seen as a threat This is despite evidence demonstrating that successful
VGI augments rather than replaces organizational activities Further organizational issues can be procedural such as existing legislations and obligations to service delivery or structural such as the responsibilities for data collection and use
Next are issues that relate to business models Organizations responsible for data collection maintenance and dissemination have an incentive to use VGI to reduce costs although additional costs might be involved in communicating with the public and maintaining their interest On the other hand for organizations responsible for selling data to maintain their operations the use of open data and release of highly valuable geographic information is a threat to their financial viability Private sector organizations are also affected when they have committed to deliver public services based on assumptions that emerging data can be used for profit
Technical problems should be also noted which include the ability to merge data sets that have been changed by the public into an existing system This requires various abilities from version management to object level metadata In some cases differences in formatting and fundamental data structure as well as semantic ambiguity add to the challenges of using VGI fully In addition the plurality of tools and channels through which information can reach an organization are significant challenges
Finally conceptual or ldquoworldviewrdquo issues need to be recognized and may well be presented as one of
bull individuals
bull organizations
bull business models
bull technical problems and
bull conceptual issues
33
the above categories VGI use requires accepting a higher level of uncertainty attention to heterogeneity and the need to work closely with diverse groups and communicate with the public This can be challenging to people who are used to working in an isolated and top-down manner In addition perceptions of VGI as professionally threatening should be accepted as genuine and reasonable and need to be addressed
To conclude this report has documented only the early stages of VGI use in government There is a need for further research to explore the factors influencing the success and failure of VGI projects for government use Some of the problems such as licensing terms will require specific effort from both governmental organizations and crowdsourcing communities At this point in time there is much misunderstanding between the two groups in terms
of time frames work practices and problem solving approaches
At the same time this report has demonstrated that collaboration between government organizations and the public is possible and beneficial to both parties Technological and societal changes over the past decades mean that opportunities for such collaboration are increasing However like any cooperation between established institutions and external groups or individuals VGI projects require attention and planning The successful cases are no longer ldquohappy accidentsrdquo but evidence of commitment and investment at individual and organizational levels which provide a return in the form of information that would otherwise be difficult to obtain Practitioners can use the lessons identified from case studies across the world in order to further develop this field
KAThmAnDu LIvInG LABS wwwkathmandulivinglabsorg CC By-SA 30Participatory GIS training (see case study 5)
34
CASe STuDIeS
35
36
No Case study Disasterrisk
New data sets
Maintain data sets
Public services
Specialist knowledge
1 Participatory mapping and decision support tools for disaster risk reduction the Philippines
Yes
2 Community Mapping for Exposure in Indonesia Yes
3 Flood preparedness through OpenStreetMap Jakarta Indonesia
Yes
4 Humanitarian OpenStreetMap Team Mapping in Ulaanbaatar Mongolia
Yes
5 Mapping schools and health facilities in Kathmandu Valley Nepal
Yes Yes
6 Informal settlement mapping Map Kibera Nairobi Kenya
Yes Yes
7 Mapping of South Sudan Yes
8 iCitizen mapping service delivery South Africa Yes
9 Skandobs Scandinavian predator tracking system Norway and Sweden
Yes
10 Corine Land Cover 2006 in OpenStreetMap France Yes
11 FixMyStreet for municipality maintenance information UK
Yes
12 FINTAN vernacular placenames project Ordnance Survey and Maritime and Coastguard Agency UK
Yes
13 Towns Conquer gamification and Instituto Geograacutefico Nacional toponyms database Spain
Yes
14 National Biodiversity Data Centre Ireland Yes
Quick reference
37
No Case study Disasterrisk
New data sets
Maintain data sets
Public services
Specialist knowledge
15 Haiti disaster response Yes Yes
16 Mapping for Natural Resources Canada Yes
17 Boston StreetBump US Yes
18 Open data initiative New York City US Yes
19 Imagery to the Crowd State Department Humanitarian Information Unit US
Yes
20 OpenStreetMap community of practice US Census Bureau
Yes
21 Crowdsourcing The National Map National Map Corps US
Yes
22 US Geological Survey ldquoDid you feel itrdquo Yes
23 Places of Interest project National Park Service US Yes
24 California Roadkill Observation System (CROS) US Yes
25 Shelter Associates slum mapping in India Yes Yes
26 Crowdsourcing satellite imagery in Somalia Yes Yes
27 Agricultural data collection and sharing by Community Knowledge Workers Uganda
Yes
28 Twitter use in Italian municipalities Yes
29 Portland TriMet transportation planner Oregon US
Yes
38
The goal of this project was to use participatory mapping and InaSAFE impact modeling software to support Philippines LGUs in disaster risk reduction activities DILG had a need to better support such activities and determined that participatory mapping and use of InaSAFE was the best way to accomplish this
1 Participatory mapping and decision support tools for disaster risk reduction the Philippines
Interaction type GovernmentPublicGovernment
Trigger event The Department of Interior and Local Government (DILG) of the Philippines wanted to better support local government units (LGUs) to prepare risk-sensitive land-use plans structural audits of public infrastructure and disaster contingency plans Detailed data to be used for planning was not available
Domain Generic mapping by local government
Organization DILG
Actors World Bank - East Asia Pacific (EAP) Environment Science for Social Change (ESSC) DILG LGUs of Pampanga Project NOAH OSM Philippines Community GeoRepublic Japan HOT
Data sets OSM data describing standard features land use and administrative boundaries
Process New training materials were created specifically aimed at LGUs in the Philippines Next training and mapping activities were conducted in the selected LGUs Further community building activities to support the growth of the OSM community in the Philippines were also conducted Key to this was inviting community members to all the trainings either to learn or assist in delivering the training
Feedback Success in the data collection in OSM varied by participating municipality For two very little data collection occurred after the initial training and mapping phase but one continued to map afterwards
Goal Collect detailed data to better support LGUs in developing disaster plans
Side effects -
Contact point Kate Chapman HOT katechapmanhotosmorg
The project provided training and technical assistance to LGUs to create basemap information and then perform impact analysis using InaSAFE Three LGUs participated in the program from the province of Pampanga (Candaba Lubao Guagua) A total of 85 people participated in the process from these areas and six OSM volunteers additionally participated and assisted the training team during the activities The first portion of the training was about the collection of infrastructure data using OSM Later InaSAFE workshops were held to show how the collected data could be analyzed
The intent was that the LGUs could continue mapping in OSM to improve the analysis in InaSAFE and create a more detailed basemap for other uses Freely available data of the areas are now available in OSM During the training the OSM Philippines community assisted with the goal of further strengthening and supporting the OSM community as a whole
Teaching LGUs how to map in OSM and then analyze the data in InaSAFE was of benefit though it was difficult for LGUs to continue mapping after their initial workshops Little mapping occurred outside of the scheduled mapping activities during the training Only one LGU continued to map any amount of substance afterwards New methods for better supporting mapping are being explored including creating a Training of Trainers (ToT) program to expand the community within the Philippines able to provide support in OSM Creating and discovering local champions within LGUs will help to ensure greater support for mapping after training Using these methodologies in other places is certainly possible but it would be important to take into account the context and government structure to ensure support for mapping outside of initial training
Main lessonsbull It is important to highlight the benefit of mapping
outside of the immediate usage to encourage continued work and data collection after the project period concludes
bull Efforts to build broader VGI communities as part of focused data collection activities can be valuable and should be encouraged
bull With care VGI data can be an important complement to official data sources and used for scientific modeling purposes
39
An example of an a priori disaster response the Indonesian mapping project began in early 2011 and at the time of writing is still active The main idea behind the project was to use OSM to collect previously unavailable data about buildings and their structure in both urban and agricultural environments and to use appropriate models to calculate likely damage in case of physical disaster The combination of the impact models and the use of realistic data led to the development of an open source risk modeling software (InaSAFE) showing the affected people infrastructure and damage if disaster were to hit a specific area This offers a practical tool for governments to develop actionable contingency plans and fills the need for risk assessments identified by the World Bank
The pilot phase consisted of workshops offering training on the project and building construction as well as data collection in urban and rural areas The approach between rural and urban areas was slightly different although the result was similar The original data were derived from paper maps
2 Community Mapping for Exposure in Indonesia
Interaction type GovernmentPublicGovernment
Trigger event -
Domain A priori disaster response
Organization Community Mapping for Exposure in Indonesia
Actors Indonesian Disaster Management Agency (BNBP) Australian Agency for International Development (AusAID) HOT Civil Society Strengthening Scheme (ACCESS) GFDRR
Data sets Satellite imagery GPS tracks and attribute data
Process Collecting spatial and attribute data and tracing in OSM platform
Feedback Thematic maps showing damage in case of various physical disasters
Goal Reduction of vulnerability to natural disasters
Side effects Deemed a successful example of disaster relief preparedness that could be applied in other developing countries
Contact point Kate Chapman HOT katechapmanhotosmorg
which were edited by local people satellite imagery depending on availability and GPS tracks Data were edited using JOSM and Potlach2 web editor and then used in QGIS Urban areas were mapped by students who took part in a mapping competition Rural areas were mapped with ACCESS contributors and local people The second phase lasted from July 2012 to March 2013 and focused on collecting exposure information essential for impact modeling software In total 163912 buildings were mapped during the pilot 29230 of them in urban areas and 16 workshops were held with 124 people participating in rural areas and 5 universities in urban areas
To encourage participation Community Mapping for Exposure has a pyramid format based on leadership with specific guidelines in data manipulation and great coordination between different contributors The whole process is focused on workshops participants were supervised at many stages and the procedure of data collection and manipulation was firmly defined Motivations for participation varied with incentives covering a spectrum from disaster protection to a mapping competition In terms of technical support the project was not only supported by HOT and OSM but also by open source software such as QGIS The main innovation in data collection was the private datastore which offered a unique ID for each object The final output has also been a success in enabling local government to visualize where people are most in danger by combining local wisdom with scientific knowledge to produce realistic scenarios for numerous different physical disasters
The main aspect of concern is the quality of the results which showed great variation According to the final report the quality was either very bad or very good in different areas although it was found to be acceptable generally The attribute quality which has a principal role in the success of the project indicated a great number of empty or incorrect records concerning the structure of buildings Other minor deficiencies were also noticed such as failing to create constant mapping volunteers and the use of time-consuming technical methods in a few cases (eg Excel spreadsheets in data collection or manual methods of data manipulation)
40
3 Flood preparedness through OpenStreetMap Jakarta Indonesia
Jakarta Indonesia is a large megacity that has frequent seasonal flooding issues Jakartarsquos disaster management agency (BPBD DKI Jakarta) needed better data to prepare for the flood season AIFDR UNOCHA HOT and University of Indonesia assisted in the process
The original idea was to ask the heads of the 267 urban villages the location of their critical infrastructure then ask university students to help with technical mapping Impact analysis using InaSAFE open source impact modeling software was then performed as part of a contingency planning process and the data has been used to create government maps to report flood conditions
Main lessonsbull An a priori disaster response can be focused
on appropriate models and parameters and can calculate damage in case of a physical disaster by using VGI
bull Interaction between official providers and VGI is a parameter of success not only for the beginning of the project but also for its continuity
bull Open source data can be reliable for scenario building but its quality can vary especially in terms of attribute data
bull Risk managers local communities and the public can combine local wisdom with scientific knowledge to produce realistic scenarios for numerous different physical disasters that may occur in an area of interest
bull The coordination of participating organizations and volunteers is important to take full advantage of human resources and technical innovations
Interaction type PublicGovernment Public
Trigger event Disaster management agency of Jakarta wanted to have better data for flood planning and reporting
Domain Mapping for disaster preparedness
Organization Jakarta Disaster Management Agency (BPBD DKI Jakarta)
Actors Australia-Indonesia Facility for Disaster Reduction (AIFDR) United Nations Office for Coordination of Humanitarian Affairs (UNOCHA) HOT University of Indonesia
Data sets OSM data of neighborhood boundaries (Rukun Warga) religious health sports and government facilities schools and roads
Process The heads of Jakartarsquos 267 urban villages were asked the locations of their critical infrastructure which was then mapped by university students and entered into OSM
Feedback Urban village leaders received paper poster maps of their villages
Goal Improve geographic information available for flood planning
Side effects Having a detailed basemap of Jakarta has made others interested in the idea of crowdsourcing and using community mapping to collect base data and record event data at a relevant scale
Contact point Kate Chapman HOT katechapmanhotosmorg
41
and village heads have used poster maps to plan logistics when responding to flooding
The project also created an open data set that can be used for a variety of analyses at the village district and provincial levels Using an open platform means that anyone can use the data and it can be updated easily as the information becomes outdated The data collected was useful in both the 2013 and 2014 floods allowing the government of Jakarta to show more detailed maps than previously available and increasing demand for additional mapping at a higher resolution
One negative aspect of the methodology used is that while it did collect the data very quickly the urban village officials do not have an easy way to update their area as the data changes
Main lessonsbull Collaboration between different teams of local
people depending on their knowledge means participants can contribute to specific tasks and stages of the project
bull Open data can be used at different levels of decision making policies such as village district and provincial levels
bull Difficulties in keeping data up to date is one of the most important concerns in terms of viability
bull Data can be used in a variety of ways including by governmental bodies for the creation of maps
4 Humanitarian OpenStreetMap Team mapping in Ulaanbaatar Mongolia
Interaction type PublicGovernment Public
Trigger event A greater vision to create a ldquoSmart Cityrdquo
Domain Topographic mapping
Organization Ulaanbaatar City Governorrsquos Office
Actors World BankICT HOT Mongolian University of Science and Technology city officials Mongolian Land Management Geodesy and Cartography Department
Data sets Aerial and satellite imagery (Bing Maps) field survey
Process Training core group of people in field data collection mapping a part of the city creating conditions for the project to continue by setting up an OSM community
Feedback Topographic maps of the city
Goal Map a part of the city create an OSM community and train locals to continue the mapping effort in order to support the vision to transform Ulaanbaatar into a ldquoSmart Cityrdquo
Side effects -
Contact point -
At the beginning of March 2013 the local authorities of Ulaanbaatar in Mongolia announced their vision to turn their city into a ldquoSmart Cityrdquo by 2020 The aim is to enable city residents to access information regarding public services provide a consolidated list of public service assets and allow citizens to send comments reports and requests to relevant officials via the Internet This effort is expected to promote transparency and fair public service while cutting down on bureaucracy
Such an effort could only be successful if it could rely on a comprehensive and detailed cartographic background of the city which did not exist at the time To support this effort a project to map the city was funded by World BankICT The aims of this project were to map a part of the city under OSM guidance and simultaneously train a core community to continue the task of mapping the entire city
The process started with basic training on tracing features from imagery and moved to the handling
42
of GPS devices in data collection The data sets were documented by field papers and ground photos which facilitated data management before the final uploading An OSM wiki page was also created with useful information and a catalog of resources for trainees and the newly built OSM community including training videos translated in Mongolian OSM data collection best practices and local tagging rules A consensus on the best tagging practice had to be achieved in order to describe geographic features that do not exist in other areas of the world and are therefore not documented elsewhere
An important challenge was that the city of Ulaanbaatar was undergoing a great reconstruction phase and thus the available imagery data sets might not provide up-to-date information Additionally due to weather conditions the data collection process was taking place during mild days while data management and upload was taking place days later possibly by volunteers who did not collect the data themselves These two factors raise some issues regarding data quality Another factor that might influence the overall data quality was the fact that the contributors had no previous OSM experience such as an active OSM community or available OSM wiki pages while the contributors also had little knowledge of the English language to assist them in steepening the learning curve On the positive side after five weeks the project had created an OSM community to continue the mapping project improved the awareness of local officials of the use of VGI and open data and also caught the attention of the private sector which can enhance OSM community efforts by providing resources while at the same time drawing more official attention to them
Main lessonsbull Building an OSM community from scratch might
be intensive and slow to begin with
bull Spatial data sets and mapping products might suffer in quality at least until a populous and active OSM community forms
bull Local tagging requirements might be missing from the overall OSM project or might be considered as outliers when it comes to normalizing the data set into a spatial product (eg shapefile import into a database schema etc)
bull Both governmental officials and private sector organizations recognize the value and potential of VGI and open data
5 Mapping schools and health facilities in Kathmandu Valley Nepal
Interaction type PublicGovernmentPublic
Trigger event No single event but increasing disasters around the world including the earthquake in Haiti inspired discussion about the safety of school and hospital buildings in Nepal
Domain Generic mapping of major points of interest and critical infrastructure as well as schools and health facilities
Organization Department of Education and Kathmandu Living Labs with support from World BankGFDRR
Actors Department of Education Kathmandu Living Labs World BankGFDRR Nepal Risk Reduction Consortium (NRRC) NSET
Data sets Aerial imagery from Bing and HIU lists of schools from government and health facilities from other sources Data sets on the road network and other points of interest with a focus on school and health facilities have been generated
Process Initial data about schools and hospitals were mapped using a variety of techniques and the results were presented to authorities and discussed
Feedback Interactive thematic map (for schools and hospitals) showing structural and non-structural attributes more detailed online map of Kathmandu Valley
Goal Collect and map exposure data for schoolscolleges and hospitals digitize building footprints build a robust OSM community
Side effects None so far
Contact point Nama Budhathoki namabudhathokigmailcom
Nepal is considered one of the countries most exposed to natural hazards and especially earthquakes The capital city of Kathmandu has experienced rapid urbanization in the last decades and is considered to be vulnerable to earthquakes as the majority of the houses do not meet earthquake safety requirements In Kathmandu local stakeholders have recognized the danger and have tried to be proactive by initiating an effort to create an OSM map of the city The aim is to provide a
43
critical resource for disaster risk mitigation and emergency planning
In 2012 the World Bankrsquos South Asia Region launched the Open Cities Project to create an asset and exposure database for urban areas and facilitate its use for urban planning and disaster resilience As part of this project Open Cities Kathmandu was started in November 2012 as a pilot initiative
The process was to first divide the Kathmandu Valley into zones each one consisting of several wards and assigned an OSM champion Using GPS paper field maps satellite imagery web and mobile technology exposure data of schoolscolleges and health facilities was then collected in the field These data were uploaded onto OSM using an in-house web application called WebDRI developed by Kathmandu Living Labs This was followed by a rigorous data validation process which ensured that data were accurate
The champions worked simultaneously towards building an OSM community in Nepal by delivering sensitization presentations and training other people at mapping parties This effectively took the project back to its direct recipients the community It also multiplied the number of ldquosurveyorsrdquo in the project because it produced new mappers and data providers whose contributions enriched map data and brought local knowledge of the exact locations of schoolshospitals in field
Mapping was done in multiple stages focusing on different geographical features at different times and regular validation was a part of the mapping process itself In November 2013 the GeoCenter of USAID organized a distant mapping party with the collaboration of George Washington University and in one evening 90 students digitized more than 15000 buildings in Kathmandu Open Cities Kathmandu has to date mapped over 130000 buildings and collected exposure data for 2256 educational and 350 health facilities
The outcome of the project has sparked a policy-level discussion about ensuring the safety of schools and health facilities in emergency situations This has also expanded to private schools while
previous discussions were limited to government schools Following the outcome of the project the Department of Survey Nepalrsquos authoritative mapping agency is now exploring ways to integrate VGI in their workflows Additionally the National Society for Earthquake Technology in Nepal has decided to share its own data sets with the public As part of the Open Cities program more than 1500 people received training on OSM procedures and a large number of presentations were delivered to universities in an effort to build a robust OSM community At the same time Kathmandu Living Labs is continuing the effort to expand the coverage of the map both within and beyond Kathmandu Valley as well as enhance the quality of the data
Main lessonsbull Being proactive is key to ensure that an area is
prepared for future natural disasters
bull A solid mapping background is needed for relief efforts following disaster Creating or updating an existing map is of great importance
bull A well-managed and coordinated effort to drum up public support can provide valuable input from both local and international contributors
bull As well as a short intensive mapping effort it is also vital to create a community that will continue the task to complete or update the maps
44
6 Informal settlement mapping Map Kibera Nairobi Kenya
The homepage of the project welcomes the visitors by stating that ldquoKibera in Nairobi Kenya was a blank spot on the map until November 2009 when young Kiberans created the first free and open digital map of their own communityrdquo The welcome message summarizes the main idea behind the project which is to map one of the biggest informal settlements of the world by putting marginalized communities on the map
Map Kibera was launched in 2009 by Mikel Maron and Erica Hagen with initial funding by Jumpstart International an NGO specializing in community-based mapping The first phase which lasted three weeks from October to December 2009 involved 13 young people who were trained to collect and edit GPS tracks OSM was used to create a dynamic and easily edited map and QGIS software was adopted to do further analysis and create specialty maps ARCGIS
Interaction type PublicGovernmentPublic
Trigger event -
Domain Generic mapping of the biggest informal urban settlement area and thematic mapping of security water sanitation health and education
Organization Map Kibera
Actors Map Kibera team CfK (Carolina for Kibera) GOAL USIP Indigo trust ATTI Habitat Global Giving Plan Kenya Hivos Unicef JumpStart International Ushahidi SODNET (Social Development Network) KCODA (Kibera Community Development Agenda)
Data sets GPS tracks open source and conventional software
Process Collecting GPS tracks and tracing them in the OSM platform after training workshops
Feedback Topographic and purpose-built maps for the management of supplies in health education security and water sanitation
Goal Map the unmapped Kibera and actively involve local people
Side effects -
Contact point Mikel Maron HOT mikel_maronyahoocom
a non-open source software and Tile Mill and other MapBox products were also used
The second phase of the project (February to August 2010) offered the opportunity for mappers to enhance points of interest such as water public toilets schools police stations and clinics It also included two other mini projects the Voice of Kibera and the Kibera News Network The first offered the opportunity to submit reports write articles and add breaking news with the aid of Wordpress blogging and Ushahidi software Work could be sent by SMS and published after approval by an editorial team The second is a video journalism initiative offering more locals the opportunity to participate ensuring the wider acceptance of the project and hence its longevity
Among the main successes is the projectrsquos acceptance by local government which embraced it from the beginning At the end of the project Map Kibera representatives presented the analysis to government officials The negotiation between the two sides had a positive impact for the community which became recognized as a real neighborhood and residents gained new technological knowledge
The project faced various challenges the primary being to educate residents in new technologies The voluntary participation model was unrealistic in Kibera Locals suffer great survival issues so a small daily compensation was given for their participation Residents also found it hard to understand the benefits they could gain through participation and the general potential impact of the project Finally NGOs found it difficult to cooperate and share information They had learned to work separately and competitively for a long time which meant that voluntary work was splintered off into small pieces for different purposes
Main lessonsbull Slum mapping can be achieved by young local
people relatively quickly
bull Basic topographic maps can be enhanced with essential thematic layers
bull A combination of open source and conventional software can facilitate VGI projects
bull Compensation may be needed to improve participation in locations where participants suffer great survival issues
bull Innovative methods such as SMS voice and video reporting can support the appeal of mapping projects
45
7 Mapping of South Sudan
After years of political instability South Sudan became a new nation on 9 July 2011 after its official independence Although South Sudan is expansive and the newest nation it is poorly mapped Maps are particularly important for the development of the infrastructure and economy of the country and the distribution of humanitarian aid
Google with the aid of World Bank UNOSAT and RCMRD recognized this need and started the project for the creation of better maps of South Sudan by supporting communities to map schools hospitals roads and more with Google Map Maker The project was launched with a series of events to disseminate
Interaction type PublicGovernmentPublic
Trigger event On 9 July 2011 South Sudan became Africarsquos 54th nation after its official independence Although it is the newest nation it is poorly mapped
Domain Generic mapping of a poorly mapped area and thematic maps of essential features like roads hospitals and schools
Organization Google NGOs along with the World Bank United Nations Institute for Training and Research (UNITAR) Operational Satellite Applications Programme (UNOSAT) and Regional Center for Mapping of Resources for Development (RCMRD)
Actors The Sudanese diaspora Google the World Bank UNOSAT and RCMRD
Data sets Updated satellite imagery covering 125000 km2 (40 percent of the UNrsquos priority areas) uploaded to Google Earth and Maps
Process Workshops and editing on Google Maps via Google Map Maker
Feedback Generic and thematic maps covering important points of interest such as schools hospitals and roads
Goal To engage and train the Sudanese diaspora and other volunteers worldwide to participate in Google Map Maker
Side effects Mapping the poorly mapped South Sudan so that the infrastructure and economy of the country could be developed and humanitarian aid provided to the local population
Contact point -
the purpose of the mapping and inspire and train participants The first event was in April 2011 at the World Bank headquarters in Washington DC with a satellite event in Nairobi at the same time The next event was in September 2011 held by the South Sudan National Bureau of Statistics in Juba
To aid their work updated satellite imagery of the region covering 125000 km2 (40 percent of the UNrsquos priority areas) was uploaded to Google Earth and Maps In the last event volunteers worked together and made hundreds of edits in less than four hours The process is simple citizens edit using available web tools and their local knowledge and after approval edits become visible to all Google users worldwide The mapping was used by the Satellite Sentinel Project a collaborative project focused on human rights violations and human security concerns in Sudan and involving Google the Enough Project Not On Our Watch UNITAR UNOSAT DigitalGlobe the Harvard Humanitarian Initiative and Trellon
Among the main factors for the projectrsquos success is not only the enthusiasm and inspiration of the Sudanese diaspora which encouraged them to convey the experience and knowledge to other people but also the interest that the local government showed in the project The projectrsquos approval by local government and its impact in decision making policies is noticeable Another innovation of the project is the principal role and contribution played by the Sudanese diaspora Through VGI projects local knowledge can be shared worldwide and from different parts of the world not only from the area of interest At the same time among the main weaknesses of the mapping is that local people were not actively involved The project lacked research in the field and did not use GPS or open source software although Googlersquos involvement guaranteed great participation levels
Main lessonsbull Crowdsourcing projects can be coordinated and
implemented from a distance
bull Great participation of volunteers and transmission of motivation to others are key factors in terms of participation in crowdsourcing applications
bull Inspiration for other projects and improved applications can be beneficial to areas of interest
bull Acceptance by local government as an opportunity for decision making policies and humanitarian aid can escalate the impacts of a VGI project
46
8 iCitizen mapping service delivery South Africa
In recent years South Africa has seen a surge in political protest against slow service delivery While the United Nations Human Development Index considers South Africa to be a middle-income country there is a large disparity in income distribution across the population Social unrest is an obvious consequence of poverty high levels of unemployment and service delivery backlogs
Within the context of these issues a new initiative has been launched which intends to improve the daily life of citizens by collecting crowdsourced reports of service issues and passing them to the relevant authorities for resolution The iCitizen project will give members of the public the ability to report on fundamental problems with basic infrastructure and services The researchers involved in the project intend to contact local municipalities to discuss the extent to which this project can be embedded within current initiatives around citizen monitoring and evaluation The main aim of the project is to give citizens an active voice A secondary research objective is to understand and identify the role of mobile phones in citizen-led monitoring and evaluation
Interaction type PublicGovernment
Trigger event -
Domain Generic mapping with focus on local infrastructure issues
Organization University of Witwatersrand LINK Centre
Actors LINK Centre
Data sets Multiple data sets per service delivery issue to be tracked
Process Collection of data points via mobile phones Adoption of different ways of geotagging photos in real time or via SMS orand email
Feedback Generic and purpose-built maps for disaster preparedness
Goal Reporting and solving fundamental problems with basic infrastructure and services
Side effects -
Contact point Dr Kiru Pillay University of the Witwatersrand kiru2010gmailcom
Members of the public will be able to report issues by forwarding geotagged photographs sending in locations via SMS or reporting issues via email The first iteration of iCitizen was built upon the Drupal open source content management system (CMS) As an enterprise CMS it provided a lot of services out of the box including membership management image upload taxonomy (category) management user commenting thorough user permissions field APIs (application programing interfaces) views templating and reporting and HTML5 theming capability Researchers were able to extend the core functionality to include mapping enabled through geolocation leaflet maps (using OpenStreetMap as the Map Tile server) and a voting API allowing users to verify incidents
The designers of the application will be extracting boundary data for South African provinces districts and local municipalities and exposing these on the online map using GeoJSON data This will automate the process of calculating the jurisdiction of any reported incidents A live reporting engine and online social tool will also allow for two-way communication between the web server (and its user base) and local municipalities and civil societies
The main difficulty relates to the acceptance of the project One university found validity in the concept but was unable to commit resources for the development of the application Going forward two difficulties are envisaged The first is acceptance of the validity of the generated data sets by local municipalities The second is acceptance of the use of mobile phone and applications by the public as an effective tool for voicing service delivery concerns Even though the penetration rate of mobile phones is fast approaching 100 percent of the adult population in South Africa the use of mobile applications and GIS-mapping tools of this nature is largely untested
Main lessonsbull Projects can be used for a variety of tasks at local
level not just that for which they were designed
bull Using a range of software programing languages and platforms can broaden a projectrsquos horizons
bull VGI applications face financial issues due to their technological nature and the resources of the organizations involved
bull Concerns from agencies about the quality of generated data sets and improving public adoption of mobile applications are common challenges
47
9 Skandobs Scandinavian predator tracking system Norway and Sweden
Skandobs was developed to to collect observations for lynx wolverine brown bear and wolf locations and population sizes driven by new legislation international conventions and directives Reliable observations help to inform management objectives including long-term conservation and population-level management Monitoring is complicated and expensive for many reasons including the
Interaction type PublicGovernment
Trigger event Policy requirements for wildlife monitoring in Scandinavia
Domain Species population observation and tracking
Organization Rovdata (an independent part of the Norwegian Institute for Nature Research (NINA)) and the Swedish Environmental Protection Agency (EPA)
Actors Rovdata EPA
Data sets -
Process Using either smartphone applications or the Skandobs website contributors can submit their observations Geographical data are required with each observation and anonymous submissions are not allowed All contributors who wish to see their contributions listed on the website and stored in the Skandobs database must register on the website Quality checks are performed by Skandobs staff
Feedback The number of observations in the database is updated on the website every 15 minutes A table provides summary information of the total number of observations for the current year and month League tables also show top contributors by individual and municipality
Goal To collect observations for lynx wolverine brown bear and wolf to increase knowledge about species populations in Scandinavia
Side effects Increasing expectations from NGOs the media and the public who want information on numbers and distribution of carnivore populations in their countries
Contact point -
geographical size of the area under observation but involving the public has been very successful
The Skandobs database is jointly maintained by two national agencies Norwayrsquos Rovdata and Swedenrsquos EPA Citizens can submit their observations at any time using iPhone or Android smartphone applications or through the website The addition of photographs and other information is encouraged The Skandobs database is made available for download via a search interface on the website A Google Maps-based visualisation tool is also available to allow map-based visualisation of the Skandobs database
User observations are subjected to internal validation and when this is completed they are assigned a validation status which appears in the list of observations Only rated observations are also added to Rovbase the primary database for national population monitoring data in Norway and Sweden The number of observations in the database is updated on the website every 15 minutes with tables summarizing the total number of observations plus totals for the year and month Observation totals are also provided for key species
There are concerns about the potential bias in the observational data For example because there is greater population density in southern Sweden there will be more observations than in northern Sweden This problem of the distribution of observationsobservers is a problem in citizen science and VGI more generally
Main lessonsbull Feedback can be provided to participants through
real-time updating summaries of the types and quantities of contributions
bull Nations can work together on VGI initiatives to meet policy requirements and reduce costs
bull VGI initiatives can work well in transboundary situations
bull Observational bias due to population distribution remains an inherent challenge in VGI
48
COoRdinate INformation on the Environment (Corine) is a European Commission supported program that aims to provide a land cover data set (known as CLC Corine Land Cover) for 39 European countries The CLC2006 project was coordinated by the European Environment Agency The image production for the land cover digitization was centrally coordinated by the EEA and the actual data production was undertaken by EEA member states to ldquobenefit from local knowledgerdquo The data integration of the national contributions was managed by the EEA and the European Topic Centre on Land Use and Spatial Information (ETC LUSI) As in previous CLC projects CLC2006 includes 44 land cover classes
As permitted under the release terms of CLC2006 the French OSM community imported the CLC2006 data set into the OSM database However only ~60 percent of the original data set was automatically imported which was for those areas where there was
Interaction type GovernmentPublicGovernment
Trigger event Change in the license policy of the Corine Land Cover 2006 data set
Domain Generic mapping (update of land coverenvironmental data sets)
Organization European Environment Agency (EEA)
Actors French OSM Community EEA
Data sets 44 land cover classes for France
Process CLC2006 data not overlapping existing OSM data have been imported (accounting for ~60 percent of the land) The CLC2006 typology has been adjusted to match OSM
Feedback -
Goal Update the OSM database with land cover information mainly in rural areas as the contribution in such areas is limited
Side effects A number of national OSM communities have followed the example and integrated CLC2006 Inconsistencies in levels of detail semantics and metadata between VGI and authoritative data sets have been revealed
Contact point pieren3gmailcom (OSM community member)
10 Corine Land Cover 2006 in OpenStreetMap France
no OSM data The rest was not imported because it was in conflict with existing land cover polygons created manually by the OSM contributors This was deemed more efficient as the OSM community realized that land cover polygons created by OSM contributors were more accurate than the CLC2006 data set Moreover as OSM contributors now have access to high-resolution Bing aerial imagery their data should be even more accurate than the CLC which is based on IMAGE2006
The integration of CLC2006 to the OSM data sets has instantly enriched the latter with data regarding ~60 percent of the French territory Land cover classification based on imagery interpretation needs considerably more expertise than road classification and in general attracts fewer contributors that the ldquohigh-profilerdquo urban fabrics However in this case the land cover parcels imported serve as first-class photo interpretation keys to aid the OSM community The French example has paved the way and built the expertise for more countries to follow this practice successfully (nine more countries have imported their national CLC2006 data)
The integration of the French CLC2006 and OSM data sets has brought to light a number of issues characteristic of the co-existence of VGI and authoritative data First importing authoritative data into a VGI database injects both the positive and negative endogenous issues such as the failure to keep the data up to date For example CLC2006 data set was imported in 2009 which means the data were already two years old (the project for France finished in 2007) However the authoritative nature of CLC2006 might give OSM users the false impression that such data sets are more accurate or more recent than they actually are diverting their attention to other as yet uncovered areas Second it should be expected that there will be semantic inconsistencies For example the CLC2006 has fewer land cover classes than those used in OSM while some CLC2006 classes are too vague for OSM and have not therefore been converted and imported to OSM Third it must also be expected that there will be inconsistencies regarding the level of detail In the case of CLC2006 the features captured were at 1100000 (country-level) while OSM is a street-level data set
49
Main lessonsbull The existence of active public communities
facilitates the take up of opportunities to work on open source data
bull Data integration should not be considered easy or straightforward This should also be made clear to volunteers as any integration initiative might mean large workloads with moderate results Considerable expertise among volunteers is required for success
bull Successful community-led efforts can be replicated by others now experience in solving problems has been built and often shared
bull Multiple data sets often have semantic inconsistencies and temporal accuracy should be addressed during integration
FixMyStreet is a web-based application launched in February 2007 which enables the public to report local problems (eg abandoned vehicles graffiti unlit lampposts potholes litter) Reporting is facilitated by the use of Ordnance Survey maps as a backdrop for users to mark the exact location of the problem Issues reported by users are propagated to the relevant local authorities by email Users reporting a problem are contacted by FixMyStreet after four weeks to check if the issue has been resolved
FixMyStreet was built and administered by mySociety a social enterprise (business with social aims) and is free to the public However there is also a FixMyStreet for Councils application which is a paid version adapted to local authority needs for handling the problem reports
FixMyStreet has been one of the most popular web applications that enable the public to voice their
Interaction type PublicGovernment
Trigger event -
Domain Local authoritymunicipality maintenance
Organization mySociety (originally developed with central government funding)
Data sets Government data sets of postcodes basemap local authority boundaries contact details and email addresses of relevant personnel in local authorities
Process A problem is indicated on a website using its location postcode and an email alerts the local authority The authority can respond to the complaint on the website
Feedback Update to participants provided through the website and in email that can be triggered when a person registers
Goal Provide online tool for residents to report problems to their local authority and follow up the exchange with the public body in an open way
Side effects Application source code released under the GNU Affero GPL software license and has been used in other countries
Contact point -
11 FixMyStreet for municipality maintenance information UK
50
concerns regarding local issues Through a simple process the website has succeeded in engaging people and opened a channel for public input into problem solving Moreover it has resulted in public value creation both direct (ie social gain that has immediate relationship with the user that reports the problem and hisher neighbors) and indirect (ie social gain that is dispersed to the entire community) The difference between FixMyStreet and previous mechanisms for reporting local problems is the public aspect instead of the report being recorded on a local authority system it is done in the open and other residents can see the issues reported and how the local authority dealt with them
However there are some issues of concern especially when it comes to the data created the cycle of public data creation propagation consumption and diffusion back to the public creates inconsistencies More specifically councils themselves have an independent channel for local problem reporting and thus the launch of FixMyStreet created a parallel channel that often simply duplicates problems already known to the council or in the worst case confuses the authorities as descriptions of the same problem appear slightly different Additionally when the council fixes the problem (which might take more than four weeks) it is not able to report progress on the issue within the application This is the driving force behind FixMyStreet for Councils but as this is a paid version few local authorities have adopted it so far
In analyzing the success of FixMyStreet it is also important to note the overall context first in UK there are digital savvy members of the public which makes it easy for users to participate and second in most Western societies the core social principles on which FixMyStreet is based are shared and voicing criticism of the government is accepted practice which may not be the case in other countries (see case study 8)
Main lessonsbull Given technological advances it should be
expected that the public will find their way to web applications of this kind
bull Authorities should develop processes and methods to integrate data from the public in order to avoid issues of data duplication confusion and misunderstandings
bull Public VGI initiatives that address community problems might overshadow existing authoritative structures Flexibility in embracing such initiatives might minimize future problems for local authorities and maximize impact on society
bull Successful examples of public participation can increase pressure on authorities for data sharing under flexible license schemes
FixmyStreet (uK) is an example of participation in municipal maintenance
my
So
CIe
Ty
51
12 FINTAN vernacular placenames project Ordnance Survey and Maritime and Coastguard Agency UK
Two of the most prominent UK governmental agencies the HM Coastguard of the Maritime and Coastguard Agency responsible for the initiation and coordination of all civilian maritime search and rescue operations and Ordnance Survey the UKrsquos national mapping agency have joined forces to create an up-to-date data set of vernacular placenames Vernacular placenames are those in common usage irrespective of whether they are official names or not
There has been an increasing recognition by the OS of the need to capture richer and more detailed vernacular placenames At the same time the
UK Coastguard were in the process of closing approximately half of their Coastguard centers and recognized that a lot of local knowledge could be lost In that context both sides recognized the mutual benefit of capturing vernacular coastal placenames using the knowledge of the coastguards (professional crowdsourcing) and local coastguard volunteers (local people who assist in coastguard operations)
An updated database of vernacular placenames is a priceless tool when it comes to providing swift response to life-threatening situations One of the most important parts of the response process is to understand the position of the person in difficulty and often official mapping products might not provide all the necessary information It is very common for people in need to use local names that do not exist in official gazetteers
FINTAN is an OS application that enables the crowdsourcing of vernacular local names of coastal areas FINTAN includes topographic mapping on a wide range of scales provided to the Coastguard to enable the recording of placenames Additionally address and placename gazetteers containing current known placenames have been used Special care has been taken to allow other emergency services that use different reference systems to work to a common geography and terminology
Through FINTAN HM Coastguard and their volunteers can enter locate and classify vernacular placenames of features such as beaches or rocks to update the existing database Personal connection with participants has been helpful in encouraging participation facilitated by coastguards inputting data from their local volunteers and the specialist application has been targeted at their specific interest (as opposed to more generic approaches like OSM) The future of FINTAN is promising as there are plans to open the application to other stakeholders such as sailing clubs and thus harvest more local knowledge
On the negative side tensions in areas where English is not the first language have been observed as some groups are unwilling to report English names even when these are in common usage even by locals
Interaction type GovernmentPublicGovernment
Trigger event Increasing recognition of the use of vernacular placenames and their importance to emergency services
Domain Emergency operations such as search and rescue
Organization Ordnance Survey (OS) and Maritime and Coastguard Agency (MCA)
Actors OS (research staff data capture staff) MCA (coastguards) volunteer coastguards
Data sets OS topographic maps address and placename gazetteers containing current known placenames
Process FINTAN application developed by OS to enable MCA and their volunteers to enter locate and classify vernacular placenames OS then assessed the quality of the data
Feedback Many new vernacular placenames that are assessed and quality controlled by OS
Goal Improve ability of the Coastguard to locate people when contacted in emergency situations improve OS database of placenames for use in new and existing products
Side effects Tensions in areas where English is not the first language - some groups unwilling to report English names even when in common usage even by locals
Contact point Glen Hart Ordnance Survey glenhartordnancesurveycouk
52
Main lessonsbull Crowdsourcing can be a valuable tool when it
comes to existing knowledge preservation
bull Professional crowdsourcing might be equally or even more productive compared to general crowdsourcing practices when collecting data for specific areas or subjects
bull Local and regional interests and perceptions might introduce biases to the data collected
bull Two-way data flow can be a win-win situation for all involved parties as well as the general public and is facilitated by shared interests and benefits
13 Towns Conquer gamification and Instituto Geograacutefico Nacional toponyms database Spain
The Towns Conquer application was developed when the research team were awarded a small funding prize from a joint funding venture between AGILE and EuroSDR This funding allowed the support of one person to work in the university in collaboration with a nominated national mapping agency The aim of this project was the validation of a toponyms database provided by the Spanish Instituto
Interaction type PublicGovernment
Trigger event Funding opportunity from AGILE and EuroSDR project on Crowdsourcing in National Mapping 2013
Domain Validation of a national toponyms database
Organization Universities (University of Nottingham UK and Universitat Jaume I of Castelloacuten Spain) ESRI Europe (sponsor) Instituto Geograacutefico Nacional (IGN) Spain
Actors IGN University of Nottingham UK and Universitat Jaume I of Castelloacuten Spain
Data sets IGN national toponyms database of Spain
Process Users provide updates to the database while playing a game for rewards contributions are checked by the national mapping agency before being incorporated into the national database
Feedback Users played the game to gain points Points were maintained in a league table format and when a user gained enough points they became the mayor of that particular region The more validations the user provided the more points they gained
Goal Volunteer validation of a national toponyms database In Spain it has taken over ten years to implement a model to standardize the nomenclature of municipalities yet today there are still conflicts with the names of some places especially in regions with two languages
Side effects Validated gamification techniques for public update and management of important national databases
Contact point Dr Joaquiacuten Huerta Universidad Jaume I Castelloacuten Spain huertaujies
53
Geograacutefico Nacional with 136454 entities requiring validation The public is involved through mobile and web-based gamification techniques which are used to persuade users to contribute their amendments to the given toponyms database The goal is for citizens to amend well-known placenames while playing a game and using their knowledge of their local area or other areasregions in Spain
An Android-based game was developed which was linked to a web-map service at IGN This allowed IGN Spain to deliver the toponyms database on suitable basemaps for the mobile application Users signed up for free There were some prizes at the end of the game (with a time limit on the number of months) for the citizens who had gained the most points (conquered the most placenames) during this time Placenames submitted to IGN via the gamification software were checked by an IGN official before being submitted and updated in the database
This funding allowed the NMA to test out crowdsourcing and gamification as a means of updating a national database In Spain it has taken over 10 years to implement a model to standardize the nomenclature of municipalities yet today there are still conflicts with the names of some places especially in regions with two languages
This project did highlight that gamification techniques (when properly designed and thought out) could provide a very good platform from which bodies like IGN could involve the public in updating and managing important national databases The game also provided the mechanism to motivate users to participate
Main lessonsbull Funding can drive innovative VGI projects and
instigate new modes of engagement
bull Links between government agencies and research centers can generate the resources required for VGI projects
bull Gamification can be a successful way of engaging the public in VGI projects
bull Data quality issues can be addressed through checking processes done by the official organization
14 National Biodiversity Data Centre Ireland
The National Biodiversity Data Centre initiated this project to leverage the potential of outreach groups and the general public for data survey and observation This widens the base from which observational biodiversity data may be obtained in Ireland The NBDC also launched this project with an aim to initiate a stronger engagement of non-professional scientists and heighten the understanding of biodiversity related matters in the general population in Ireland There is a good tradition of observational work being performed by volunteer community groups in Ireland
All of the systems and software are housed at NBDC Contributors are also given assistance in working out grid references for their records observations
Interaction type PublicGovernmentPublic
Trigger event -
Domain Update of national biodiversity database
Organization National Biodiversity Data Centre (NBDC) Ireland
Actors NBDC and the Irish biodiversity community (in particular university researchers)
Data sets Existing NBDC database
Process Users enter their observations through the appropriate HTML forms on the NBDC website Observational data is checked internally at NBDC then made available for access and visualisation on the online maps and charts Data is submitted by email for large and possibly incorrectly formatted observations
Feedback Data is quickly checked and made available for access and visualisation on an online map Those who submit their data to the system can access this data in the future
Goal Heighten the understanding of biodiversity in Ireland and widen the base from which observational data may be obtained
Side effects -
Contact point Dr Liam Lysaght National Biodiversity Data Centre llysaghtbiodiversityirelandie
54
and sightings The system provides online forms for recording observations but these can also be submitted in bulk via email if the contributor has collected a lot of data
Since June 2012 there have been over 61000 records submitted validated and stored in the NBDC databases Approximately 1600 records are submitted per month NBDC also makes these data available to the Global Biodiversity Information Facility (GBIF) a network of 80 participants worldwide working on an open biodiversity data infrastructure funded by governments It allows anyone anywhere to access data about all types of life on earth shared across national boundaries via the Internet The NBDC is Irelandrsquos GBIF node and contributes Irish data to the more than 400 million biodiversity records mobilized through the GBIF data portal
For the submission of observational data there are species and site forms with the latter allowing a more detailed recording of biodiversity information The data from these forms and collections are extracted and merged with other data sets in the NBDC for insertion into their spatial databases Data is quickly checked and made available for access and visualisation on an online map Those who submit their data to the system can access this data in the future
When there is particular need for observation or data collection for a specific species there is a call for ldquospecies in focusrdquo where the importance reasoning and biodiversity importance of a specific species is outlined The NBDC ensures that the contributors have their efforts well recognized and advertised online For example there is an annual distinguished recorder award presented to the person who has made an outstanding contribution This is very important in recognizing the work of the volunteers who submit data to initiatives like this Workshops are also held on a frequent basis which report on the progress of this project the types of uses that this data is being put to and how the project can be sustained and improved Events such as Bioblitz (held annually) involve the general public in biodiversity data collection events which have an aspect of fun and competition
Main lessonsbull Feedback for contributors is very important
and can be established in many forms For example personal contact with contributors publishing information on the website (ldquowe have x records this monthrdquo) awards for distinguished contributors
bull Providing several options for users to contribute their biodiversity observations improves accessibility for different users
bull Allowing contributors to provide as much (or as little) information as they have available means there can be great diversity in the resolution of data provided requiring manual and automated checking controls
55
15 Haiti disaster response
Haiti was dramatically affected after a 70 magnitude earthquake hit the capital city of Port-au-Prince on 12 January 2010 Death toll estimates range from 100000 to 200000 More than 250000 residents were injured and more than 30000 buildings collapsed or were severely damaged When the magnitude of the disaster became clear the main issue for those responding to the disaster was that the only available spatial data were poor and last updated in 1960s The local mapping agency collapsed in the earthquake with the loss of most of the skilled employees An updated map was urgently needed for the distribution of supplies identification of collapsed buildings damaged infrastructure and medical stations
The Haiti disaster response is one of the successful examples of geographic information being made open by official partners enhanced by public volunteers and returned to government for action (although the government was reluctant about the
Interaction type PublicGovernmentPublic
Trigger event A natural disaster (earthquake) and humanitarian crisis
Domain Generic mapping (topographic maps of the area) and purpose-built maps (disaster relief management)
Organization HOT
Actors United Nations NGOs National Haitian Mapping Agency National Center of Spatial Information Haitian civil society
Data sets Historic maps CIA maps high-resolution imagery from Yahoo paper maps and GPS tracks
Process Tracing in OSM platform from different data sources and collecting GPS tracks
Feedback Topographic and purpose-built maps for the management of supplies of medicine and food and location of settlements
Goal Facilitate disaster response management
Side effects The data sets created have not been used by the national mapping agency but by international aid organizations (UN USAID)
Contact point Mikel Maron HOT mikel_maronyahoocom
involvement of volunteers) The first imagery was loaded on the OSM platform in 48 hours Sixty people were trained and more that 700 contributed to the mapping among them people from UN agencies NGOs National Haitian Mapping Agency National Center of Spatial Information (CNIGS) and Haitian civil society Historic maps CIA maps and high-resolution imagery from Yahoo were first used for tracing in OSM to improve the basic maps Volunteers with paper maps and GPS completed the second phase of tracing The effort led to the PDNA (Post Disaster Needs Assessment) the result of the analysis of satellite and aerial imagery by multiple sources in which more than 30000 damaged infrastructures were identified and classified According to HOT 600 volunteers added spatial information to OSM in a month and the result was used as a default basemap for responding organizations and the Haitian government
The main reasons for its success can be focused on four main factors time cost great participation of volunteers and official trust The sensitization of the public to the Haitian crisis led to a great participation of volunteers and immediate mobilization worldwide The contribution of NGOs and other official partners and the release of conventional data sets as reference maps for tracing without license restrictions were vital to success Government support was inevitable due to the critical circumstances and limited resources
Although the project is characterized as successful there were a few weaknesses On the one hand all the responding organizations lacked experience and awareness of the operational norms in humanitarian response which constitute an operational framework for the accountability of different sources Deficiency of coordination led to the duplication of data The national mapping agency CNIGS also never really engaged with OSM although official data were given supportively at the beginning of the project
Main lessonsbull This was the first crowdsourced mapping exercise
for humanitarian reasons and shows its successful use in reacting to disaster
bull An integrated methodology of this kind follows four steps spatial data contributed by official providers supplemented with GPS tracks
56
integrated into OSM and updated by a great number of volunteers from each part of the world
bull Time cost and official trust of data by NGOs and other official partners are key to success
bull Lack of coordination and experience between different actors can lead to duplication of data and waste of resources
bull Differentiation between conventional and governmental data in terms of engagement to the project did not prevent success
16 Mapping for Natural Resources Canada
National mapping agencies are responsible for providing up-to-date topographic maps and a range of spatial products to the public and private sector The role of the Mapping Information Branch at Natural Resources Canada is to provide accurate geographic information of the landmass at the scale of 150000 However this translates to regularly covering an area of 10 million km2 divided into 13200 map sheets so keeping geographic information up to date is a challenge
The collaboration with the OSM community is based mainly on two factors i) a proven inability to keep national data up to date and ii) a willingness to trust OSM VGI data The Canadian authorities are also well organized and equipped to implement standard processes of data collection change detection quality control and assurance This facilitates the integration of the two different data sets
Interaction type GovernmentPublicGovernment
Trigger event The proven inability of the NMA to keep data sets up to date along with the familiarisation of its personnel with OSM data quality and processes
Domain Generic mapping (update of national topographic database)
Organization Mapping Information Branch (MIB) at Natural Resources Canada (NRCan)
Actors OSM community MIB NRCan
Data sets Canvec (mainly the road network)
Process NRCan releases its database into osm format The data is imported into OSM and updatedmodified by the OSM community NRCan regularly compares OSM data sets with its own as a change detection mechanism to keep its database up to date
Feedback Change detection data sets that have been verified by NMA employees
Goal Keep national databases up to date
Side effects OSM data cannot directly be used by the authorities due to IPR and licensing issues
Contact point -
57
The process was enabled the Centre for Topographic Information in Sherbrooke (CTIS) release of Canvec (the digital topographic map of Canada) in osm format (the native OSM format) This allowed the Canadian authoritative data to be integrated into OSM and gave the OSM community the opportunity to interact with it (ie by completing correcting or updating) The OSM database is regularly compared with the Canvec data to pinpoint the differences Any differences are treated as potential changes and are verified using the authoritative channel in the field Verified changes are propagated to the Canvec database
Leveraging the OSM crowdsourcing mechanism means the Canadian authorities have developed a much needed change detection process which helps them concentrate resources on potential changes Challenges include the compatibility of the two data sets (in terms of semantic and attribution differences) the lack of metadata for OSM data and the differences in coverage (OSM contributions are concentrated mainly in urban areas) These challenges stem from the differences in the two data generating processes (ie the bottom-up informal OSM process compared to the top-down authoritative NMA procedures) and still need to be addressed Moreover there is a conflict between the license and use terms of OSM data and the IPR of Canadian authorities that needs to be resolved
Main lessonsbull The need for other sources of geographic data sets
such as VGI can be generated when authorities are falling short of their targets
bull VGI data sets can be used by authoritative and governmental bodies to supplement or facilitate their standard operational procedures
bull Differences in structure and operation mean that updates to geographic information do not move freely between the two systems
bull Connectivity between the two different data sets is limited by different terms of use and licenses
17 Boston StreetBump US
Bostonrsquos Mayorrsquos Office of New Urban Mechanics (MONUM) pilots experiments that offer the potential to improve the quality of city services New technology ndash from smartphones to GPS ndash and a resurgent spirit of civic engagement have created increased opportunities for closer connection and communication between the city government and its citizens Partnering frequently with the Mayorrsquos Constituent Service Office MONUM is piloting projects that leverage this new technology and civic spirit to deliver services that are more personal and citizen driven
Using the motion-sensing capabilities of smartphones volunteers who download Bostonrsquos StreetBump application automatically send
Interaction type PublicGovernment
Trigger event Smartphone technologies and resurgent civic engagement
Domain Public contribution to urban services reports database
Organization Mayorrsquos office City of Boston
Actors The City of Boston Roads and Public Infrastructure Division
Data sets -
Process Using the accelerometer and GPS devices on smartphones users with the StreetBump application automatically report ldquobumprdquo or pothole information to the City of Boston These reports are collected in a database The Roads and Public Infrastructure Division carefully monitor these reports If a specific area receives many reports an engineer will physically examine that location
Feedback Users gain points (ldquostreet credrdquo) for each pothole they assist in reporting which is subsequently fixed or repaired by the city engineers
Goal Overcome the manual antiquated method of reporting potholes from public complaints or manual survey by city inspectors
Side effects The City of Boston uses this information to plan long-term investments in road and street infrastructure repair upgrade and construction
Contact point -
58
information to the city about the condition of the streets they are driving on When their cars hit a potholemdashor a pothole-to-bemdashtheir phone sends the accelerometer data to a server application which combines the information from many other phones to pinpoint problem areas on the streets If three or more bumps occur at the same location the City of Boston will physically inspect this obstacle and assign it to a queue for short-term repair or record its location to assist with longer-term repair planning
There are some problems around the reporting of ldquofalse positivesrdquo The use of phone accelerometers means that other vibrations feltabsorbed by the phone can be incorrectly calculated as a pothole or bump in the road surface Users are encouraged to ensure that the phone is stationary inside the vehicle with horizontal positioning of the device likely to offer more accurate observations according to the help documentation However these ldquofalse positivesrdquo are reviewed manually internally Unless there are multiple reports of a bump or pothole problem in the vicinity of a specific location it will not be physically investigated by city engineers Users can contact a specific hotline number to manually report a problem In addition to the passive reporting of the accelerometer GPS data users can also submit geolocated photographs of the problematic street segment
Main lessonsbull VGI can be used to address urban service
issues such as problems with roads and street infrastructure
bull ldquoFalse positivesrdquo in reports can be effectively handled by applying a limit to the number of reports which are required before action is taken by the government agency
bull The types of devices and their hardware capabilities must be considered in the planning in using VGI Some technologies can be unreliable over-sensitive or unsuited to particular applications
18 Open data initiative New York City US
In September 2013 New York City released over 200 government data sets to the public as part of a broad open data initiative to ldquoimprove the accessibility transparency and accountability of City governmentrdquo Using the web-platform Socrata the data is made available for download or through APIs (application programing interfaces) that allow software developers to construct mobile and web-based applications that incorporate this information This data release continues an aggressive open data push by the city government that began in 2011 New York Cityrsquos open data law signed by Mayor Bloomberg in March 2012 mandates that all city agencies ldquosystematically categorize and make accessible in ldquoopenrdquo formats all public data sets at no chargerdquo before 2018 To date over 1100 data sets have been made available on the cityrsquos open data portal and numerous applications have been built that address issues ranging from transportation to food safety and the environment
In partnership with the Department of Information Technology and Telecommunications the members of the local OSM community have begun to import city building footprint and address point data sets into the OSM database These critical data sets which are necessary to support a wide variety of data analysis and visualization projects can be difficult and expensive to keep up to date in a city as large and dynamic as New York Thanks to software developed
Interaction type GovernmentPublicGovernment
Trigger event Adoption of open data policy
Domain Local authority
Organization NYC GIS Department and Department of Information Technology and Telecommunications (DoITT)
Actors NYC OSM community NYC government private sector
Data sets Building footprint addresses
Process Data import into OSM and public maintenance in OSM platform
Feedback Daily changes
Goal Leverage volunteers to help keep authoritative data current
Contact point Alex Barth MapBox alexmapboxcom
59
by the company Mapbox the New York City GIS department now receives daily emails detailing changes to OSM building or address information These emails allow the GIS team to quickly assess updates in OSM to identify where new construction or other changes in the city may necessitate updates to the authoritative city data set
Upon completion of the import of the city data into OSM a feedback loop between the city and the volunteer OSM community allows both the government and the public to work together to create and make use of up-to-date and high-quality spatial data Importing large and detailed data sets like addresses and buildings is a complex process that requires technical resources significant labor and solid coordination between the OSM community and others involved In this case the information released by DoITT was up to date and of high quality but the same cannot be said of all municipal data sets It should also be noted that DoITT has expressed interest in incorporating OSM into other parts of their data management practices but have so far been unable to due to the conflict between OSMrsquos share-alike license and the public domain license required by NYC open data mandates There has also been a great deal of communication between the city government the OSM community and the people working on the import which is critical to the success of these kinds of efforts It will be important and useful to revisit this project in the future in order to learn more but so far it provides an excellent example of cooperation between local government and the volunteer OSM community around open data
Main lessonsbull Releasing government data sets freely into the
public domains means citizens can download and create their own applications
bull VGI communities like those of OSM can keep government data sets up to date even in large dynamic cities
bull Cooperation between VGI communities and relevant government departments allows them to work together to create and make use of up-to-date and high-quality spatial data
bull VGI communities and government departments can bring technical resources significant labor and solid coordination
bull Municipal data sets even when of high quality need to be maintained in order to stay accurate This can be achieved effectively and at lower cost than via traditional practices through the cooperation of VGI communities and government departments
60
19 Imagery to the Crowd State Department Humanitarian Information Unit US
As shown in Haiti (see case study 15) facilitating the access of volunteer communities to high-quality aerial and satellite imagery can have dramatic results However such imagery is often prohibitively expensive or only available under licenses that would prevent digitization by the public With this in mind the US State Departmentrsquos Humanitarian Information Unit launched a new initiative in 2012 called ldquoImagery to the Crowdrdquo This program makes high-resolution imagery purchased by the US Government from providers like Digital Globe accessible to humanitarian organizations and the volunteer communities that support them Since its inception Imagery to the Crowd has facilitated the digitization of basic infrastructure data into OSM in eight countries to support humanitarian response or disaster risk reduction
In the recent 2013 Typhoon Haiyan disaster in the Philippines Imagery to the Crowd published images for Tacloban Ormoc Northern Cebu and Carles This imagery supported a massive volunteer effort of over 1600 mappers from the OSM community coordinated by the HOT who contributed nearly five
Interaction type GovernmentPublicGovernment
Trigger event Adoption of new policy (the ldquoImagery to the Crowdrdquo program)
Domain Generic mapping and purpose-built maps for humanitarian relief programs
Organization HIU State Departmentrsquos Imagery to the Crowd program
Actors HIU HOT
Data sets Satellite imagery
Process Manual digitization of roads buildings and other features
Feedback Access to vector OSM data for local and international humanitarian organizations
Goal Leverage volunteers to create OSM data to support efficient management of disaster relief efforts
Contact point Josh Campbell State Department HIU CampbellJS3stategov
million changes to the map These changes provided detailed information on the location and extents of pre-event infrastructure as well as preliminary damage assessment The OSM data created through these efforts was in turn used by a number of actors in the response including UNOCHA MapAction the World Bank and the American Red Cross
Another recent Imagery to the Crowd project implemented in partnership with the Global Facility for Disaster Reduction and Recovery and USAID recently organized volunteers in Nepal the United States Germany and the United Kingdom to digitize roads and building footprints in the Kathmandu Valley of Nepal Kathmandu is one of the most seismically at-risk cities in the world and the data created through this program will help inform an earthquake retrofitting program led by the government of Nepal and disaster response planning by USAID (see also case study 5)
These examples from the Imagery to the Crowd project demonstrate that the release of US government owned imagery to volunteer communities has resulted in the creation of valuable spatial data which is in turn accessible to governments and international agencies Technical and policy efforts are underway to increase the speed at which imagery can be released and to standardize and improve the process but this new initiative has already achieved demonstrable results In cases like USAIDrsquos work in Nepal this becomes a full-loop example where a US government agency makes direct use of the data created as a result of the imagery release In other instances the users are UN agencies or not-for-profit organizations working towards humanitarian ends
Main lessonsbull Making government-owned high-resolution
imagery accessible to humanitarian organizations and the volunteer communities can support them in their work worldwide
bull Technical and policy efforts are required to increase the speed at which imagery can be released and to standardize and improve the process
bull Such projects demonstrate successful full-loop and half-loop feedback projects
61
20 OpenStreetMap community of practice US Census Bureau
At the moment the US Census Bureau has no formal interaction with OSM However a small number of internal champions have been working to build a community of mapping enthusiasts to create support for the incorporation of OSM into the Bureaursquos work
One of the leading advocates for the use of volunteered geographic information within the US Census Bureaursquos programs says that there a number of ways in which the platform could be useful Data collection is expensive and OSM could offer a way for the Census to partner with citizens to help identify areas where change has occurred and perhaps collect basic location data about the neighborhoods where they live OSM could also be used as a tool for helping Census professionals better understand issues that Census field representatives encounter in their work For example by participating in OSM they would have to engage with ambiguity in tagging systems as well as better understand the geography of the areas to which they are assigned
In order to help grow the OSM community within the Census Bureau advocates held mapping
Interaction type PublicGovernmentPublic
Trigger event Internal champion
Domain Generic mapping
Organization United States Census Bureau
Actors United States Census Bureau
Data sets OSM
Process Mapping events and outreach within the Bureau
Feedback -
Goal To build a group of mappers and supporters of OSM within the US Census Bureau
Side effects -
Contact point Steven Johnson OSM US
Suitland Federal Center - Google maps and openStreetmap comparison
Go
oG
Le o
Pen
ST
Ree
Tm
AP
Co
nT
RIB
uTo
RS
62
events during lunch hours every other week during June and July of 2013 Participants were given basic information about the OSM platform and community taught how to map using OSM tools and sent out in small teams to survey the area around the Suitland Federal Center where the Census Bureau offices are located In addition advocates have given a number of internal presentations about OSM and its applicability to the Censusrsquos mission and brought their colleagues to OSM conferences and meetups
OSM champions face a number of challenges in promoting adoption of OSM within the Census Bureau Many who have traditional GIS backgrounds have difficulty accepting OSMrsquos open source model of data production In government data sets there is a notion that databases are authoritative OSM offers no such assurances The OSM community has no central point of contact to provide support Thus learning how to engage with the distributed OSM community would be an important part of any adoption Finally the census could potentially use OSM as a data source for TIGERLine products which describe fundamental features such as transportation networks natural features and geographic boundaries but are unable to do so because the Census would need to release this into the public domain which is disallowed by the current license
Main lessonsbull Building support within government
organizations for VGI requires time and willingness to learn different models of creating validating and using data
bull Hands-on exposure to OSM tools is a useful way of helping individuals understand the platform and its potential value
21 Crowdsourcing The National Map National Map Corps US
VGI is not new to the USGS but past efforts have been hampered by available technologies Over the last two decades the USGS has sponsored various forms of volunteer map data collection projects including the Earth Science Corps where volunteers annotated topographic paper maps the collection of GPS points using handheld GPS devices and finally web-based technology to input data in 2006 In spite of these efforts and as valuable as the updates were technology could not keep pace with decreasing USGS resources and the VGI effort was suspended in 2008 Today improved technology social media and ever decreasing resources have once again made crowdsourcing an attractive option
Interaction type PublicGovernmentPublic
Trigger event The need to update the national map and other national map databases
Domain Generic mapping
Organization US Geological Survey (USGS) National Geospatial Program
Actors Local state and federal agencies including the USGS
Data sets USDA National Aerial Imagery Program (NAIP) imagery National Map base layers ESRI world imagery Alaska community photos the national structures database and USTopo
Process Using crowdsourcing techniques the USGSrsquos National Map Corps encourages public volunteers to collect and edit data about human-made structures to provide accurate and authoritative spatial map data for the USGS National Geospatial Programrsquos web-based The National Map
Feedback Updated structures are contributed in real-time Databases are downloaded on a nightly basis Data collected is in the public domain and freely downloadable
Goal Maximize limited resources while continuing to support the National Geospatial Program by leveraging volunteers with local knowledge to update The National Map and USTopo
Side effects -
Contact point Elizabeth McCartney emccartneyusgsgov or nationalmapcorpsusgsgov
63
After several pilot projects to determine the viability of bringing back the volunteer mapping program The National Map Corps volunteers are successfully editing ten different structure types in all 50 states including schools hospitals post offices police stations and other important public buildings Using National Agricultural Imagery Program imagery as the primary base layer volunteers collect and improve data by adding new features removing obsolete points and correcting existing data Edits are contributed through a web-based mapping platform built using open source technology developed by OpenStreetMap Points edited are incorporated into The National Map and ultimately become part of USTopo
In order to address quality concerns an analysis of a pilot project was conducted over the state of Colorado For all structure feature types volunteer involvement was found to improve positional accuracy attribute accuracy and reduce errors of omission The Colorado pilot demonstrated that volunteer edits improve baseline structures data that further review by advanced volunteers willing to provide peer review improves the data further and that sample-based inspection by USGS personnel can monitor these processes
Successful crowdsourcing is not without challenges some of which include volunteer recruitment volunteer engagement and participant motivation The National Map Corps endeavors to meet these challenges using gamification techniques and a mixture of traditional and social media Gamification includes easy on-ramping virtual recognition badges friending map challenges social
media interaction and a tiered editing approach Using these techniques has been successful The National Map Corps continues to see substantial increases in the number of volunteers and volunteer contributions to The National Map
Other challenges continue to exist and include organizational resistance to accepting data from volunteers as being ldquogood enoughrdquo to populate national databases and working through issues for which there is no well-established policy regarding government accepting data from citizens One example is the requirement to obtain approval for conducting a ldquosurveyrdquo from the Office of Management and Budget as part of the Paperwork Reduction Act even though the project is not really conducting a ldquosurveyrdquo
Main lessonsbull Adoption of challenging techniques such as
gamification has been successful and attracts volunteer interest
bull Evaluation of the quality indicated that the participation improves accuracy and reduces errors
bull Organizational resistance to accepting data from volunteers is one of the major challenges for VGI projects of this kind
bull Key factors to successful crowdsourcing include building on past experience leveraging existing technology and having the support of key individuals within the organization
uS national map Corps editor
eLIz
AB
eT
h m
CC
AR
Tn
ey
uS
GS
64
22 US Geological Survey ldquoDid you feel itrdquo
The USGSrsquos Community Internet Intensity Map (more commonly referred to as ldquoDid you feel itrdquo) is a website that automatically maps reports from citizens about their perception of recent seismic activity in their area If a member of the public feels a tremor they can visit the DYFI website and report their location and their estimate of the intensity of the tremors they have just felt In combination with a large network of sensors which are placed all over the world these additional citizen reports allow USGS to develop a more detailed map of the intensity of an earthquakersquos activity Over 360000 earthquake events have been submitted to DYFI and are available to browse online on the archive section of the website There is an option for users to give
Interaction type PublicGovernment
Trigger event Paucity of instrumental ground-motion data in regions of low seismicity
Domain Collection of ground-motion seismic data from the public
Organization United States Geological Survey (USGS) Community Internet Intensity Map (ldquoDid you feel itrdquo DYFI)
Actors USGS Earthquake Hazards Program
Data sets -
Process On feeling earthquake activity users log-on to the DYFI website and submit their observation The intensity of the earthquake they have just felt is quantified using the Modified Mercalli Intensity (MMI) scale There is no need for users to have experience in seismology
Feedback Maps and graphics are generated automatically by the DYFI system and made available to the public There is no specific personalized feedback to the contributor
Goal To integrate the public into the seismic monitoring network and allow USGS to continue to learn and understand more about earthquake activity
Side effects The data collected from DYFI is made compatible with ShakeMap a product of the USGS Earthquake Hazards Program in conjunction with regional seismic network operators
Contact point -
first-person descriptions of how the earthquake affected them However it is made clear on the form that if the USGS uses this qualitative information the user will only be referred to as ldquothe observerrdquo Contributors can watch the DYFI webpage for the display of their report Maps and graphics are generated automatically by the DYFI system and made available to the public
The ldquoDid you feel itrdquo form interface is easy to use Ideally those reporting earthquake events in the United States will know their ZIP code but citizens from outside the US can submit observations with their coordinates in longitude and latitude The form is mostly comprised of drop-down lists asking for feedback on your situation when the earthquake occurred your experience of the earthquake (shaking strength duration reaction) earthquake effects (sounds damage to free standing objects etc) damage to buildings etc
DYFIrsquos appeal to users means the data makes up in quantity what it may lack in scientific quality and offers the potential to resolve long-standing issues in earthquake ground-motion science Such issues have been difficult to address due to the paucity of instrumental ground-motion data in regions of low seismicity Prior to this system intensity maps were rarely made for US earthquakes of a magnitude of less than about 55 now intensities as low as magnitude 20 are routinely reported for the smallest felt earthquakes nationwide The intensity of earthquakes reported by users is quantified using the Modified Mercalli Intensity (MMI) scale MMI measures the intensity of ground motions from the perspective of human and structural response on a qualitative scale from 1 (not felt) to 10 (very heavy damage) or sometimes 12 (total destruction) based on descriptions such as ldquofelt indoorsrdquo (MMI = 3) to ldquofelt by all windows dishes glassware broken weak plaster crackedrdquo (MMI = 6) to ldquosome structures with complete collapserdquo (MMI = 9) The MMI allows anyone to report activity There is no need for the contributor to have experience in seismology This public reporting allows the USGS to continue to learn and understand more about earthquake activity In addition the USGS can then use this knowledge to inform emergency response planning efforts and budgets for modeling disaster relief
65
There are some negative aspects to ldquoDid you feel itrdquo Despite their significant value to emergency responders the subjective observations of untrained users are only a qualitative indicator of the effects of an earthquake Moreover the effectiveness of DYFI-based maps may be greatly hampered by the speed at which people report critical information during crises
Main lessonsbull Quality control can be achieved by securing a large
response rate from contributors
bull The requirement for non-technical jargon free locational data allows greater levels of public participation
bull Accessible and easy to understand input forms which avoid using specialist terminology helps to engage non-specialist users
bull VGI can be used to fill gaps in official data sets and supplement official government monitoring programs
23 Places of Interest project National Park Service US
The National Park Service does not have a comprehensive data set of geographic information describing tourist infrastructure and natural features for all of the 400 or so individual territories managed by NPS Some parks have their own GIS departments and produce excellent data while other parks are small and do not have these resources The aim of the NPS Places of Interest project is to allow non-technical users to add and modify important landmarks in the parks in a single map This map can then be used as a basemap for all NPS web maps When users see the crowdsourced map in parks and notice errors they will be able to make changes to the maps immediately
The NPS Places project uses the OSM platform because of the robust open source tools that are available This includes the backend API and rendering formats as well as the easy-to-use iD editor It does not use the OSM database itself Due to licensing restrictions on OSM data the NPS maintains its data separately
The project is designed to collect point data from NPS employees that will be displayed on most of the web maps on the NPS website There are future plans to expand this project further to the public and
Interaction type PublicGovernmentPublic
Trigger event Licensing and data validation concerns
Domain Mapping of tourist infrastructure and natural features
Organization National Park Service (NPS) US
Actors NPS
Data sets OSM
Process Edits to NPS data are made by Park Service employees There is no validation in effect but this may change in future
Feedback Internal park data sets that have been digitized from park maps
Goal To create an up-to-date map of all the parks for viewing and use by the public on the parksrsquo websites
Side effects None yet but data quality issues are anticipated
Contact point Jim McAndrew US National Park Service
66
use Park employees to verify information before it is published on the map
There is currently no easy way to extract information from the NPS Places project although its API is open and fully documented It is possible for motivated users to extract the information they want from this API
The biggest success of this project is collecting contributions from non-technical Park staff This includes people with extensive knowledge about the parks such as rangers and maintenance managers These people know the parks better than anyone but they have not been able to get their data into traditional GIS at parks without a dedicated GIS staff Few non-technical users are involved yet but the project is planning to visit the parks and train users so they know what they can add Some parks with GIS departments have already started synchronizing their own information with the system and have been making a big push to use the system for all of their web pages
The biggest challenge is that OSM does not deal with traditional GIS very well This means building tools to synchronize ESRI databases with the NPS database using the ESRI REST API NPS would like to make contributing to the system as easy as possible for the existing GIS departments that do the bulk of the GIS work in the parks While the goal is to get non-technical people involved the core of the project will still be the GIS departments the exist in the parks and the regional offices
Main lessonsbull It is possible and sometimes desirable to use
the OSM toolset to facilitate voluntary mapping activities without using the data set itself
bull The OSM platform can be used as a great platform for empowering non-technical users to start modifying maps The iD editor is extremely easy to use and rendering tools such as Tile Mill and Mapnik allow the data to be updated in real time
bull The success of the system relies on working with existing GIS managers on site and regional offices
bull Non-specialists are an important part of this process but require more training to get their contributions into the system
bull Live feedback is an important feature to encourage contributions
24 California Roadkill Observation System (CROS) US
The California Roadkill Observation System can be used to record observations from reporters out in the field who come across identifiable road-killed wildlife This includes the type of animal and
Interaction type PublicGovernment
Trigger event A university-based research project
Domain Development of a database of user-contributed observations of roadkill incidents
Organization ICE (an environmental information brokerage and research laboratory in the Department of Environmental Science and Policy at the University of California Davis) and Caltrans (California Department of Transportation)
Actors ICE Caltrans
Data sets GIS data sets such as Californian roads infrastructure
Process A user can contribute details of incidents of roadkill in California (location type of roadkill photographs etc) Contributions are uploaded on the CROS website then submitted to the CROS database and displayed on the public web map interface
Feedback The contributor of roadkill information is provided with feedback to state that the contribution has been successfully submitted to the CROS system If contributors register on the website their name is placed beside any contribution they make All contributions are made publicly available The top 20 species observed and top 20 observers are listed on the website
Goal To understand the ecology wildlife behavior and how transportation contributes to this problem This includes the application of GIS and statistical modeling to predict roadkill hotspots to measure the contributing factors to roadkill to quantify impacts and to estimate benefits of different remedial actions
Side effects Caltrans have used the data from CROS and the expertise at ICE to develop a guidance manual for effective strategies to address roadwildlife conflicts in California
Contact point -
67
25 Shelter Associates slum mapping in IndiaIn urban areas of India the percentage of citizens who live in slums fluctuates from 10-50 percent which means that a great number of people lack basic infrastructure and housing Housing health sanitation education and livelihood are among the main issues that NGO Shelter Associates tries to address in specific areas of India through a variety of projects intended to improve the living conditions of slum dwellers Shelter Associates was established in 1993 by architects and planners and works in direct collaboration with the local government for the improvement of citizensrsquo lives It has adopted a hybrid model of experts in various academic fields such as GIS analysts sociologists planners and architects who work with the aid of local volunteers The volunteers contribute to slum mapping by maintaining up-to-date data for informal settlements and supporting community participation in other projects carried out by Shelter Associates
According to Shelter Associates the main issue that local government faces is the lack of local knowledge about the spatial infrastructure of slums which results in the exclusion of informal settlements from city planning and urban development The local people consider mapping as an opportunity to move to other areas where schools are located or to save money by adopting better transportation routes
Shelter Associates pioneered the use of GIS for poverty mapping in the late 1990s However in recent years the need to connect the data collected for the various projects and stored in different layers alongside spatial information became crucial The team adopted Google Earth as a basemap for the slum mapping and among other benefits Google Earth is easy to use easy to understand because it includes aerial images and offers a clear picture of development within the city The spatial data was introduced into a variety of projects to support good governance and decision making policies
or species found its location when it was found how long it might have been dead pictures of the roadkill and any additional details about road or traffic conditions CROS displays a summary of this information for different wildlife groups across the state Information about where wildlife vehicle collisions occur what animals are involved on what kinds of roads and other data can help inform policy management and financial investment to reduce roadkill The mission is to provide a safer environment for wildlife in relation to California motorways
The collectors of the roadkill data are a university-based research organization The CROS project includes past and current participation by over 900 volunteer scientists including several hundred academics as well as agency and NGO biologists and natural historians More than 25000 observations have been logged on the website since August 2009 An Android application is available but the website is the most stable and robust means of submitting contributions
The observations are used in a geographic information system to find wildlife-vehicle collision hotspots By contributing wildlife observation data users help researchers understand where wildlife live and the threats they face from human activities The research organization hope to use this data and their GIS analysis to inform transportation planning in the state of California Caltrans and ICE teamed up to create a guidance manual for California
Main lessonsbull Internet-based training materials can be provided
to allow some contributors to undertake training in scientific methods of surveying
bull The user interface for contribution should be easy to use and should include widgets such as pre-defined lists and clickable maps to decrease the opportunities for erroneous data submission
bull Photographs submitted in addition to basic geographical data can provide very useful visual context information
68
26 Crowdsourcing satellite imagery in SomaliaThis is a humanitarian project to geo-locate all shelters in Somaliarsquos Afgooye corridor with the aid of satellite imagery provided by the Standby Volunteer Task Force UNHCR DigitalGlobe Tomnod SBTF and Ushahidi are the main organizational bodies cooperating so that crowdsourcing can take place with the aid of volunteers The aim of the project behind this collaboration is to map all shelters by dividing them into three main categories large permanent structures temporary structures with a metal roof and temporary shelters without a metal roof The rule set describes the shape color tone and clustering of the different shelter types The project was divided into two phases a trial and an official launch where specific instructions were given to participants The goal of the project is to test the feasibility of crowdsourcing rapid shelter enumerations of internally displaced persons to support population estimates The process cannot be replaced by an automated system because this could not identify the type of shelter
The satellite imagery methodology was adopted because access to the area of interest is limited The main question was how many people are in the shelters and need humanitarian aid in order to inform decision making around logistics and planning policies During the project 253711 tags were created and more than 9400 shelters visually identified after processing 3909 satellite images
27 Agricultural data collection and sharing by Community Knowledge Workers UgandaThe digital divide is an urgent social and technical issue in Uganda especially for small farmers who have low literacy rates and limited access to the power grid to support the use of technical equipment The lack of technology savvy people also results in the exclusion of local people from data collection which could help them to reach informed decisions and improve their farming efficiency and consequently their everyday lives
Community Knowledge Workers (CKW) is an initiative of the Grameen Foundation that aims to train locals in the use of technology overcoming power infrastructure issues for data collection and sharing to enable their communities to make informed decisions based on actionable and up-to-date farming knowledge
After registering participants of the CKW network can use mobile phones to collect a range of information regarding livestock and farming The mobile phones can be recharged by solar power or manually (eg using bicycles) As most areas are not covered by the mobile network data collection takes place offline simply using the GPS sensor of the device and properly designed forms Once the phones are inside a wireless or mobile network area the data is uploaded to a central server and becomes available to other farmers or stakeholders The information shared is helping farmers and policy makers to evaluate the needs of farmers assess potential disease outbreaks provide market price updates receive weather forecasts and even provide income to the farmers as the surveyed data is used by agricultural organizations All the data have feedbacks to the farmers in terms of improved policies and prompt government action Thus CKW has established an efficient grassroots network of data and services that has fundamentally changed agricultural knowledge sharing in Uganda
69
28 Twitter use in Italian municipalitiesResearch investigating the Twitter profiles of Italian municipalities identified that at the time of the survey (November 2013) only 461 of more than 8000 Italian municipalities had Twitter profiles approximately 6 percent After a few months this increased to about 25 percent while six months before only 368 municipalities had a Twitter account The geography of municipal Twitter profiles in Italy seems to reflect the urban structure of the country which is mostly made up of many small and medium sized cities At the time of the survey only 1 percent of the 461 profiles had been activated by large municipalities 4 percent by medium municipalities 44 percent by small to medium municipalities while 51 percent had been activated by municipalities with less than 10000 inhabitants
This demonstrates that reduced population size is not a barrier to the spread of social applications but may in fact be an advantage or a driver The first and most active (in terms of tweets sent and followers) municipalities on Twitter are those which started with the activation of ldquocivic networksrdquo (municipality websites) in the late 1990s showing the relationship between the adoption of these kinds of technologies
The survey analyzed the types of messages sent since the activity profiles must be assessed not only in relation to the amount of tweets and followers but also with respect to the quality and type of information sent The latter relate to different fields which include simple messages for informational purposes up to more complex messages addressing planning and territorial management The research team classified the hashtags used by most municipal profiles into several categories and the most widely represented information related to culture and tourism followed by geographical information utilities and weather forecasts Messages about governance are still quite limited except in some cases demonstrating that the potential of Twitter as a collector and distributor of information on complex issues around which to initiate debates and discussions has not been realized Only a few municipalities have used Twitter for emergency and risk management such as Castelnuovo Garfagnana (earthquake) and some municipalities in Sardinia (flooding) Nevertheless it is worth noting that the news about LrsquoAquilarsquos severe earthquake of 2009 was first announced through Twitter before other media
29 Portland TriMet transportation planner Oregon USTriMet is a public agency that provides bus light rail and commuter rail transit services in the Portland Oregon metropolitan area In an effort to keep the services provided to the public at the highest possible level TriMet is incorporating a range of services such as multimodal trip planning and service change analysis TriMet needs a new generation of data that traditional proprietary data sets cannot provide To solve this problem TriMet turned to the use of OSM As well as traditional road network data sets OSM also provides data about pedestrian paths and bicycle routes that can enable TriMet to provide multimodal services to the citizens of Portland Moreover proprietary routing data sets are costly and do not come with near real-time updates
In this context OSM data sets are now used by all internal systems and applications that need routing data Also TriMet officials have realized the value of OSM data and have committed to contribute to OSM with a full-time employee Moreover city officials realized that by releasing governmental data to the public the OSM community will contribute to data improvement and will enable TriMet to provide better services to the public
70
Aronoff S 1989 Geographic Information Systems a management perspective WDL Publications Ontario
Atkinson G M and Wald D J 2007 ldquoDid You Feel Itrdquo intensity data A surprisingly good measure of earthquake ground motion Seismological Research Letters 78 362-368
Ball M 2013 New York City Opens More of Cityrsquos Data Including OpenStreetMap Collaboration [online] Available at [httpinformedinfrastructurecom6088new-york-city-open-more-of- the-citys-data-including-openstreetmap-collaboration] [Accessed 22 December 2013]
Barron C Neis P and Zipf A 2014A comprehensive framework for intrinsic OpenStreetMap quality analysis Transactions in GIS doi101111tgis12073
Barth A 2013 New York City and OpenStreetMap Collaborating Through Open Data [online] Available at [httpswwwmapboxcomblognyc-and-openstreetmap-cooperating-through- open-data] [Accessed 22 December 2013]
Beaulieu A Begin D and Genest D 2010 Community Mapping and Government Mapping Potential Collaboration Symposium of ISPRS Commission I Calgary Canada June 16-18 3
Begin D 2012 Towards Integrating VGI and National Mapping Agency Operations - A Canadian Case Study The Seventh International Conference on Geographic Information Science Available at [httpwebornlgovscigistworkshops2012documentsBegin20Daniel20-20Paperpdf] [Accessed 15 February 2014]
Berdou E 2011 Mediating Voices and Communicating Realities Using information crowdsourcing tools open data initiatives and digital media to support and protect the vulnerable and marginalised [online] Available at [httpmapkiberaorgwikiimages778IDS_MediatingVoices_FinalReportpdf] [Accessed 16 April 2014]
Brabham D 2013 Using Crowdsourcing in Government Collaboration Across Boundaries IBM Center for The Business of Government Washington DC Available at [httpwwwbusinessofgovernmentorgreportusing-crowdsourcing-government] [Accessed 16 April 2014 ]
Brain Off 2010 Haiti OpenStreetMap Response [online] Available at [httpbrainoffcomweblog201001141518] [Accessed 8 December 2013]
Brown M and Heaton L 2011 New Country in the Making Building a Map for South Sudan [online] Available at [httpwwwenoughprojectorgblogsnew-country-making-building-map-south-sudan] [Accessed 28 April 2014]
Castellote J Huerta J Pescador J and Brown M 2013Towns Conquer A Gamified Application to Collect Geographical Names (vernacular namestoponyms) Proceedings of AGILE 2013 in Leuven Belgium Available at [httpeprintsnottinghamacuk2131] [Accessed 16 April 2014]
Chapman K Wibowo A and Nurwadjedi 2013 Filling the Data Gap with Participatory Mapping for Effective Disaster Preparedness [online] Available at [httpwwwjointokyoorgfilescmsnewspdf(Final)_Session_2_Summarypdf] [Accessed 10 December 2013]
Deffner R 2013 Mongolia mapping Ulaanbaatar [Online] Available at [httphotopenstreetmaporgprojectsmongolia_mapping_ulaanbaatar] [Accessed 12 April 2014]
EIONET 2012 Corine Land Cover 2006 [online] Available at [httpsiaeioneteuropaeuCLC2006] [Accessed 18 December 2013]
Fowler A Whyatt JD Davies G and Ellis R 2013 How Reliable Are Citizen-Derived Scientific Data Assessing the Quality of Contrail Observations Made by the General Public Transactions in GIS 17 (4) 488ndash506 doi101111tgis12034
GFDRR 2013 Preparing Communities through Understanding Risk [online] Available at [httpwwwgfdrrorgsitesgfdrrorgfilesPillar_1_Preparing_Communities_through_Understanding_Risk_0pdf] [Accessed 10 December 2013]
Gollan J Lobry de Bruyn L Reid N and Wilkie L 2012 Can Volunteers Collect Data That Are Comparable to Professional Scientists A Study of Variables Used in Monitoring the Outcomes of Ecosystem Rehabilitation Environmental Management 50 (5) 969ndash78 doi101007s00267-012-9924-4
Goodchild MF 2007 Citizens as sensors the world of volunteered geography GeoJournal 69 (4) 211-221
ReFeRenCeS AnD SouRCeS
71
Hagen E 2010 Putting Nairobirsquos Slums on the Map Final Report [online] Available at [httpsopenknowledgeworldbankorgbitstreamhandle109866072deor_12_1_41pdfsequence=1] [Accessed 18 April 2014]
Hagen E 2012 Workspaces The changing environment of infomediariesMap Kibera [online] Available at [httpwikiikmemergentnetindexphpWorkspacesThe_changing_environment_of_infomediariesMap_Kibera] [Accessed 19 April 2014]
Haklay M 2010 Usability of VGI in Haiti earthquake response [online] Available at [httpwwwslidesharenetmukihusability-of-vgi-in-haiti-earthquake-response-preliminary-thoughts] [Accessed 8 December 2013]
Heymann Y Steenmans Ch Croissille G and Bossard M 1994 Corine Land Cover Technical Guide Luxembourg Office for Official Publications of the European Communities
Humanitarian OpenStreetMap Team 2013 Haiti [online] Available at [httphotopenstreetmaporgprojectshaiti-2] [Accessed 8 December 2013]
Humanitarian OpenStreetMap Team 2013 Indonesia [online] Available at [httphotopenstreetmaporgprojectsindonesia-0] [Accessed 15 December 2013]
Huxhold W An Introduction to Urban GIS Oxford and New York Oxford University Press
iRevolution 2011 Crowdsourcing Satellite Imagery Analysis for Somalia Results of Trial Run [online] Available at [httpirevolutionnet20111101crowdsourcing-unhcr-somalia] [Accessed 25 May 2014]
iRevolution 2011 Crowdsourcing Satellite Imagery Analysis for UNHCR-Somalia Latest Results [online] Available at [httpirevolutionnet20111109crowdsourcing-unhcr-somalia-latest-results] [Accessed 25 May 2014]
IT News Africa 2011 Google maps out Southern Sudan [Online] Available at [httpwwwitnewsafricacom201107google-maps-out-south-sudan] [Accessed 25 April 2014]
King SF and Brown P 2007 Fix my street or else using the Internet to voice local public service concerns Proceedings of the 1st international conference on Theory and practice of electronic governance ICEGOV 72ndash80
Lamy F 2011a South Sudan is now official on Google Maps [online] Available at [httpbloggoogleorg201109south-sudan-is-now-official-on-googlehtml] [Accessed 25 April 2014]
Lamy F 2011b South Sudanese sing and map their way to independence [online] Available at [httpgoogle-africablogspotgr201107south-sudanese-sing-and-map-their-wayhtml] [Accessed 27 April 2014]
Lamy F 2011c Using the power of mapping to support South Sudan [online] Available at [httpgoogleblogblogspotgr201105using-power-of-mapping-to-support-southhtml] [Accessed 26 April 2014]
Longley P A Goodchild M F Maguire D J and Rhind D W 2001 Geographic information system and Science Oxford John Wiley amp Sons Ltd
Map Kibera 2014 [online] Available at [httpmapkiberaorg] [Accessed 15 April 2014]
Maron M 2007 OpenStreetMap A disaster waiting to happen [online] Available at [httpwwwslidesharenetmikel_maronopenstreetmap-a-disaster-waiting-to-happen] [Accessed 8 December 2013]
Marras S 2012 Kibera Mapping the Unmapped [online] Available at [httpwww djemme comdocsdocsschedeKiberaEN Pdf] [Accessed 17 April 2014]
McLaren R A 2011 Crowdsourcing Support of Land Administration A New Collaborative Partnership between Citizens and Land Professionals London Royal Institute of Chartered Surveyors (RICS)
Meyer R 2013 How Online Mapmakers Are Helping the Red Cross Save Lives in the Philippines [online] Available at [httpwwwtheatlanticcomtechnologyarchive201311how-online- mapmakers-are-helping-the-red-cross-save-lives-in-the-philippines281366] [Accessed 22 December 2013]
The National Map 2014 Home [online] Available at [httpnationalmapgov] [Accessed 27 April 2014]
The National Map US Topo 2014 US Topo Quadrangles mdash Maps for America [online] Available at [httpnationalmapgovustopo] [Accessed 27 April 2014]
72
OpenSourcecom 2010 OpenStreetMap Haiti [online] Available at [httpopensourcecomosm] [Accessed 8 December 2013]
OpenStreetMap 2014 WikiProject Mongolia [online] Available at [httpwikiopenstreetmaporgwikiWikiProject_Mongolia] [Accessed 6 June 2014]
OpenStreetMap 2013 WikiProject Indonesia [online] Available at [httpwikiopenstreetmaporgwikiWikiProject_Indonesia] [Accessed 16 December 2013]
OpenStreetMap 2012 WikiProject Corine Land Cover [online] Available at [httpwikiopenstreetmaporgwikiWikiProject_Corine_Land_Cover] [Accessed 18 December 2013]
OpenStreetMap Indonesia 2014 Home [online] Available at [httpenopenstreetmaporid] [Accessed 4 January 2014]
OpenStreetMap Indonesia 2012 Community Mapping for Exposure in Indonesia Project Report [online] Available at [httpwwwopenstreetmaporiddocsCommunity_Mapping_for_Exposure_in_Indonesia_ENpdf] [Accessed 7 December 2013]
OpenStreetMap Indonesia 2012 Evaluation of OpenStreetMap Data in Indonesia Final Report [online] Available at [httpopenstreetmaporiddocsFinal_Report-OSM_Evaluation_in_Indonesia_2012pdf] [Accessed 10 December 2013]
Roberts S 2014 Open Cities and Crisis Mapping [online] Available at [httpblogusaidgov2014 01opencities-and-crisis-mapping] [Accessed 8 December 2013]
Roberts S 2011 UNHCR and Crowdsourcing A partnership with the Stand By Task Force [online] Available at [httpswfoundorgmedia54239s2-0220robertspdf] [Accessed 1 June 2014]
Shelter Associates 2014 [online] Research and Poverty Mapping (city slum profiles) Available at [httpshelter-associatesorgmapping-research] [Accessed 9 June 2014]
Shelter Associates 2014 [online] Home Page Available at [httpshelter-associatesorg] [Accessed 9 June 2014]
Shelter Associates 2014 GIS and Remote Sensing [online] Available at [httpshelter-associatesorggis-remote-sensing] [Accessed 9 June 2014]
South Sudan Mapping 2014 [online] Available at [httpssitesgooglecomsitemapsudan] [Accessed 27 April 2014]
Thoumlrneloumlf E 2013 EPA Network Workshop ndash Citizen Science 12 -13 March 2013 - Increasing involvement of the public in large-scale monitoring of large carnivores across Scandinavia Sweden EPA Available at [httpepaneteweeaeuropaeuad-hoc-meetingsepa-network-workshop-citizen-science-12-13-march-2013eva-thornelof_-sepa-swedenpdf] [Accessed 1 June 2014]
Tomlinson R 2007 Thinking about GIS Geographic information system planning for managers Redlands CA ESRI Press
Touya G and Brando-Escobar C 2013 Detecting Level-of-Detail Inconsistencies in Volunteered Geographic Information Data Sets Cartographica 48 (2) 134ndash143
United States Department of Agriculture Farm Service Agency 2014 Naip Imagery [online] Available at [httpswwwfsausdagovFSAapfoapparea=homeampsubject=progamptopic=nai] [Accessed 1 June 2014]
US Geological Survey 2014 Home [online] Available at [httpnavigatorerusgsgov] [Accessed 1 June 2014]
Waters T 2010 The OpenStreetMap project and Haiti Earthquake Case study [online] Available at [httpwwwslidesharenetchippyopenstreetmap-case-study-haiti-crisis-response] [Accessed 8 December 2013]
Zoljargal M 2013 Ulaanbaatar to become a lsquosmart cityrsquo [online] Available at [httpubpostmongolnewsmnp=3238] [Accessed 12 April 2014]
73
1818 h Street nW Washington DC 20433 wwwworldbankorg
1818 h Street nW Washington DC 20433wwwgfdrrorg
university College LondonGower StreetLondon WC1e 6BT wwwuclacuk
openStreetmap for KathmanduPhoTo copyoPenSTReeTmAP ConTRIBuToRS
TILeS CouRTeSy oF humAnITARIAn oPenSTReeTmAP TeAm

About GFDRR The Global Facility for Disaster Reduction and Recovery (GFDRR) helps high-risk low-income developing countries better understand and reduce their vulnerabilities to natural hazards and adapt to climate change Working with over 300 national community level and international partners GFDRR provides grant financing on-the-ground technical assistance helping mainstream disaster mitigation policies into country-level strategies and thought leadership on disaster and climate resilience issues through a range of knowledge sharing activities GFDRR is managed by the World Bank and funded by 21 donor partners
wwwgfdrrorg
Participatory GIS training Bhaktapur (see case study 5)PhoTo KAThmAnDu LIvInG LABS
wwwkathmandulivinglabsorg CC By-SA 30
A land management specialist deployed to the Warrap state South Sudan (see case study 7)PhoTo unDP SouTh SuDAnBRIAn SoKo CC By-nC-SA
Boston StreetBump application in use (see case study 17)PhoTo SuRRey CounTy CounCIL CC By-nD 20
CrowdsourCed geographiC
information use in government
This work is being supported as part of the World Bankrsquos Global Facility for Disaster Reduction and Recovery (GFDRR) project the open Data for Resilience Initiative (openDRI) engaging the public in the process of collecting data on location and characteristics of basic infrastructure and critical facilities has become a key pillar of the openDRI project which has engaged in activities that incorporate this approach in Colombia haiti malawi nepal Sri Lanka Bangladesh Indonesia and the Philippines understanding how governments can better interact with volunteer communities will be critical to the future development of openDRIrsquos work The research is carried out at the extreme Citizen Science group university College London (uCL)
Report written by
Prof mordechai (muki) haklay Department of Civil environmental and Geomatic engineering uCL
Dr vyron Antoniou hellenic Army Geographic Directorate
Sofia Basiouka School of Rural and Surveying engineering national Technical university of Athens
Robert Soden World Bank Global Facility for Disaster Reduction amp Recovery (GFDRR)
Dr Peter mooney Department of Computer Science national university of Ireland maynooth
Reference
haklay m Antoniou v Basiouka S Soden R and mooney P 2014 Crowdsourced geographic information use in government Report to GFDRR (World Bank) London
copy 2014 International Bank for Reconstruction and Development The World Bank1818 h Street nW Washington DC 20433Telephone 202-473-1000 Internet wwwworldbankorg
Some rights reserved
This work is a product of the staff of The World Bank with external contributions note that The World Bank does not necessarily own each component of the content included in the work The World Bank therefore does not warrant that the use of the content contained in the work will not infringe on the rights of third parties The risk of claims resulting from such infringement rests solely with you
The findings interpretations and conclusions expressed in this work do not necessarily reflect the views of The World Bank its Board of executive Directors or the governments they represent The World Bank does not guarantee the accuracy of the data included in this work The boundaries colors denominations and other information shown on any map in this work do not imply any judgment on the part of The World Bank concerning the legal status of any territory or the endorsement or acceptance of such boundaries
nothing herein shall constitute or be considered to be a limitation upon or waiver of the privileges and immunities of The World Bank all of which are specifically reserved
Rights and PermissionsThis work is available under the Creative Commons Attribution 30 unported license (CC By 30) httpcreativecommonsorglicensesby30 under the Creative Commons Attribution license you are free to copy distribute transmit and adapt this work including for commercial purposes under the following conditions
AttributionmdashPlease cite the work as follows haklay m Antoniou v Basiouka S Soden R and mooney P 2014 Crowdsourced geographic information use in government Report to GFDRR (World Bank) London License Creative Commons Attribution CC By 30
TranslationsmdashIf you create a translation of this work please add the following disclaimer along with the attribution This translation was not created by The World Bank and should not be considered an official World Bank translation The World Bank shall not be liable for any content or error in this translation
All queries on rights and licenses should be addressed to the office of the Publisher The World Bank 1818 h Street nW Washington DC 20433 uSA fax 202-522-2625 e-mail pubrightsworldbankorg
Acknowledgement this report was supported by the contributors of the case studies which are listed at the end of the report We would like to thank madeleine hatfield of yellowback for editing and mary Pargeter for the final design of the report Dr Jamal Jokar contributed to the final stages of the report preparation We would also want to thank Kate Chapman nicolas Chavent nama Budhathoki mikel maron Alex Barth Kiru Pillay elizabeth mcCartney Cristina Capineri Glen hart Russell Deffner Steven Johnson Jim mcAndrew and martin van exel for their contribution to the case studies
ConTenTS
7 exeCuTIve SummARy
8 InTRoDuCTIon
11 LeARnInG FRom PAST ImPLemenTATIon oF
GeoGRAPhIC InFoRmATIon In GoveRnmenT
13 ReSeARCh meThoDoLoGy
15 CASe STuDIeS STRuCTuRe AnD oveRvIeW
21 AnALySIS
1 Incentivesdrivers 22
2 Scope and aims 23
3 Participants stakeholders and relationships 24
4 modes of engagement 25
5 Technical aspects 26
6 Success factors 27
7 Problems encountered 28
29 ADoPTInG CRoWDSouRCeD GeoGRAPhIC
InFoRmATIon In GoveRnmenT
32 SummARy AnD WAy FoRWARD
34 CASe STuDIeS
Quick reference 36
1 Participatory mapping and decision support tools for disaster risk reduction the Philippines 38
2 Community mapping for exposure in Indonesia 39
3 Flood preparedness through openStreetmap Jakarta Indonesia 40
4 humanitarian openStreetmap Team mapping in ulaanbaatar mongolia 41
5 mapping schools and health facilities in Kathmandu valley nepal 42
6 Informal settlement mapping map Kibera nairobi Kenya 44
7 mapping of South Sudan 45
8 iCitizen mapping service delivery South Africa 46
9 Skandobs Scandinavian predator tracking system norway and Sweden 47
10 Corine Land Cover 2006 in openStreetmap France 48
11 FixmyStreet for municipality maintenance information uK 49
12 FInTAn vernacular placenames project ordnance Survey and maritime and Coastguard Agency uK 51
13 Towns Conquer gamification and Instituto Geograacutefico nacional toponyms database Spain 52
14 national Biodiversity Data Centre Ireland 53
15 haiti disaster response 55
16 mapping for natural Resources Canada 56
17 Boston StreetBump uS 57
18 open data initiative new york City uS 58
19 Imagery to the Crowd State Department humanitarian Information unit uS 60
20 openStreetmap community of practice uS Census Bureau 61
21 Crowdsourcing The national map national map Corps uS 62
22 uS Geological Survey ldquoDid you feel itrdquo 64
23 Places of Interest project national Park Service uS 65
24 California Roadkill observation System (CRoS) uS 66
25 Shelter Associates slum mapping in India 67
26 Crowdsourcing satellite imagery in Somalia 68
27 Agricultural data collection and sharing by Community Knowledge Workers uganda 68
28 Twitter use in Italian municipalities 69
29 Portland Trimet transportation planner oregon uS 69
70 ReFeRenCeS AnD SouRCeS
5
openStreetmap data collection in haiti (see case study 15) ToD
D h
oFF
mA
n
CC
By
20
6
Participatory GIS training Bhaktapur (see case study 5) KAThmAnDu LIvInG LABS wwwkathmandulivinglabsorg CC By-SA 30
7
The findings are that
bull There are some established cases of close collaboration between government and the public which range from land management and biodiversity monitoring to disaster response These examples demonstrate that successful interaction is possible under certain conditions
bull Many of the lessons from the early implementation of Geographic Information Systems (GIS) in government hold for VGI projects and can be used to ensure their successful implementation
bull Where governmental data is lacking the need for suitable data sets can lead to the initiation of VGI projects
bull Technical issues are not insurmountable so these are not the limiting factor in VGI adoption by government
bull Organizational practices regulations and legal issues such as license conditions are much more likely to restrict VGI projects
bull The acceptance and use of VGI will be influenced by individual organizational business model technical and conceptual factors
exeCuTIve SummARy
This report is based on a six-month study of the use of volunteered geographic information (vGI) by government It focuses on government use of information relating to a location which was produced through what is known as ldquocrowdsourcingrdquo the process of obtaining information from many contributors amongst the general public regardless of their background and skill level The aim of this report is to provide a guide for the successful implementation of vGI in government
Specifically the most significant issues that need to be considered from the start of any VGI project are
bull How the data collected will contribute to government process and the organizational issues that this entails
bull The ways traditional GIS practices and concerns over organizational change might limit the adoption of VGI by government
bull Methods to overcome inherent coverage temporal and participation biases which influence data quality
bull Funding continuation and sustainability beyond often short-term initial projects
bull Maintaining user participation
bull Licensing and other Intellectual Property Rights (IPRs)
bull Identifying clear responsibilities and lines of communication for stakeholders
bull Creating clear reporting channels for participants
8
InTRoDuCTIon
The acceptance of volunteered geographic information (vGI) as a valued and useful source of information for governments is growing at all levels Put simply vGI is ldquocrowdsourcedrdquo geographic information provided by a wide range of participants with varying levels of education knowledge and skills (see michael Goodchildrsquos writing for the original definition of the term) While a growing body of research demonstrates the reliability and accuracy of vGI when compared to official or government produced data sets the progression towards their adoption and wider use is slow There are a range of mechanisms and methods available for ensuring that crowdsourced information is fit for purpose so concerns about data quality are not the major reason for the lack of adoption Instead organizational practices regulations and legal issues limit the rate of change
open dialogue on peoplersquos priorities for their communities in Kigali Rwanda SouRCe unDP CC By-SA 30
9
As the World Bankrsquos Open Data for Resilience Initiative (OpenDRI - see below) has recognized to build resilient societies policy makers and the public must have access to the right data and information to reach good decisions Sharing data and creating open systems promotes transparency accountability and ensures that a wide range of actors can participate in the challenge of building resilience Within this context VGI has a role to play and arguably it will be impossible to achieve the desired results without the active involvement of local communities in this kind of data collection and maintenance
The aim of this report is to review governmental projects that incorporate voluntary and crowdsourced data collection and to provide information that can be used to support the wider adoption of VGI (the terms crowdsourced information and VGI are used interchangeably) To this end the report compiles and distributes lessons learned and successful models from existing efforts by governments at different sectors and scales The research presented in this report was motivated by the following interrelated issues
bull Sources of VGI data such as OpenStreetMap (OSM) are increasingly important across a range of thematic areas and user communities
bull The quality consistency and completeness of VGI data have been assessed by a range of studies and overall have been found to be suited to many tasks and therefore concerns about these issues should not prevent the exploitation of VGI as a valuable source
bull Interacting with VGI communities is a different and potentially more complex relationship than governments have had with traditional sellers and resellers of geographical information systems (GIS) data
bull There are a number of ways in which governments have begun engaging with VGI communities and there is much to learn from early experiences
VGI projects rely on different kinds of information flows which are summarized below
bull PublicGovernment VGI provided by the public to government authorities also has a long history pre-dating the web eg calling to report a problem at a location This report includes several examples of such cooperation to illuminate specific aspects of VGI practice
hosted by the World Bankrsquos Global Facility for Disaster Reduction and Recovery the open Data for Resilience Initiative (openDRI) works to bring the philosophies and practices of the open data movement to bear on the challenges of building resilience to natural hazards and impacts of climate change Partnering with governments international organizations and civil society groups this initiative develops open systems for creating sharing and using disaster risk and climate change information to ensure that a wide range of actors can participate in the challenge of building resilience Since it was launched in 2011 openDRI has worked to implement these ideas in over 25 countries around the world
openDRI
10
bull GovernmentPublicGovernment and PublicGovernmentPublic Examples of two-way cooperation between government and the public or civic society organizations form the core of this report Again collaboration with commercial entities has a long history This report refers particularly to the use of publicly contributed information by a government authority to make decisions and actions (eg NGOs (non-governmental organizations) using OSM data for disaster preparedness) and the release of government information to the public for improvement and its subsequent use by government
In addition there is one flow of information that is not covered in this report but is important in the context of information flows in general in order to understand the full picture
bull GovernmentPublic The flow of information from government to the public is important
but is very rarely implemented to initiate VGI projects The main focus of this report is not on the application of ldquoopen datardquo which is made available by governmental bodies without charge or restrictions to the public as there are examples aplenty in commercial and civic society This is also covered in the OpenDRI Field Guide
This report explores different aspects of government use of VGI including the maintenance of public space (streets public buildings and parks) education health tourism and civil safety It includes a set of case studies with a common structure which are presented at the end of the report The following sections provide background on the use of geographical information by government which has a long history and should be taken into account It then turns to the methodology of the research and explains how it developed A detailed explanation for the case study structure and overview of the case studies is provided next This is followed by analysis of the findings and recommendations for improving the use of VGI in government
Boston StreetBump application in use (see case study 17) SuRRey CounTy CounCIL CC By-nD 20
11
By the 1980s with the introduction of customisable and off-the-shelf software packages GIS implementation became more common in organizations This led to research into the processes that assist organizations in implementing GIS and how to ensure that the use of digital geographical information is done in an effective way Of particular importance and relevance to this report are the work of Stan Aronoff and his 1989 book Geographic Information Systems a Management Perspective and William Huxholdrsquos An Introduction to Urban GIS Both paid attention to the management of GIS projects the importance of understanding the way organizations work and the effort required for successful GIS implementation
The issue of data capture is particularly relevant to contemporary VGI projects In the early days a major part of any given GIS project was the conversion of paper maps to digital formats The challenges of integrating varied data sources into a coherent database reflect many of the issues emerging from crowdsourced information Since this early work the implementation of GIS projects have received on-going attention with Roger Tomlinsonrsquos 2007 Thinking about GIS Geographic information system planning for managers and significant portions of a leading GIS textbook such as Longley et alrsquos
LeARnInG FRom PAST ImPLemenTATIon oF GeoGRAPhIC InFoRmATIon In GoveRnmenT
2010 Geographic Information Systems and Science providing the latest summaries from nearly four decades of practice
While VGI projects may seem fundamentally different from these projects with their higher level of public engagement and informal participation scheme there are a lot of parallels This is because the governmental systems to which VGI is integrated are often ldquoenterprise systemsrdquo set along the same lines Moreover many of the early lessons from when GIS was first introduced to governmental organizations are similar to the findings discussed below For example as with early GIS implementation VGI use relies on specific individuals who act as ldquochampionsrdquo inside the organization and spearhead the effort necessary to secure acceptance for this source of information Another example is the opportunity that major events such as disaster response create in terms of rethinking current procedures and practices Evaluations of organizational responses provide opportunities to reflect on the way current systems are utilized and develop new procedures for data capture and use They also open up the policy opportunity to recognize the use of VGI just as for GIS
The history of digital geographical information is intertwined with government activities The system commonly recognized as the first GIS was created by the Canadian government in the 1960s to map land use and agricultural productivity and suitability moreover the use of geographical information by government bodies at all levels ndash from the local to the regional national and intergovernmental ndash continues to be one of the most significant applications of GIS
12
Brabham (2013) Best practices for crowdsourcing in government
One Clearly define the problem and solution parameters
Two Determine the level of commitment to the outcomes commit to communicate to the online community exactly how much impact user-submitted ideas and labor will have on the organization
Three Know the online community and their motivations It is important to know whether a given crowdsourcing application will appeal to participants
Four Invest in usable stimulating well-designed tools
Five Craft policies that consider the legal needs of the organization and the online community
Six Launch a promotional plan and a plan to grow and sustain the community
Seven Be honest transparent and responsive
Eight Be involved but share control
Nine Acknowledge users and follow through on obligations
Ten Assess the project from many angles
As a consequence working with people who are experienced in implementing GIS in government and encouraging them to adopt VGI as a usable source of information makes it possible to use past lessons from other projects and adapt them to VGI In other words while accepting the specific characteristics of VGI it should not be seen as an unprecedented data source
To the best of our knowledge though this is the first study and report of its kind to deal directly with VGI use in government Brabham (2013) produced a report called ldquoUsing Crowdsourcing in Governmentrdquo which outlines a more general overview of the potential for crowdsourcing in government (see box) Brabham also attempts to classify crowdsourcing and understand when and how to deploy crowdsourcing in government His analysis includes a small number of case studies and the report concludes with ten best practices and considerations for crowdsourcing This summary is a helpful starting point on which this report builds
ordnance Survey map of the coast (see case study 12)
CR
AIG
Ch
eW
-mo
uLD
InG
C
C B
y-S
A 2
0
13
The website and questionnaire were tested with five experts active in the area of VGI and government and their feedback was used to improve it before promoting the website in email lists and other social media outlets between late February and early May 2014 The website offered an incentive scheme in which contributors chose between donating to OSM another organization or receiving Amazon vouchers This aimed to encourage a variety of contributors to provide the research team with concrete case studies The website received 3500 page views over the period from about 1100 visitors However only five responses were provided through the open questionnaire Therefore in parallel to
ReSeARCh meThoDoLoGy
The overall structure of the research process was as follows First seven cases known to the research team were developed collaboratively to establish the relevant information required for each case study and develop a questionnaire with appropriate fields to capture this once the pilot case studies had been developed in January 2014 they were transferred to a website The case studies together with introductory material and details about the report provided the context for the questionnaire which was integrated on the site
the questionnaire the research team continued to search for identify and compile further case studies bringing the total to 29 The details of the case studies are summarized below and then provided in full in a later section (five are shorter due to the limited information available)
Following the data collection exercise the case studies were reviewed analyzed further documented and classified according to themes This provided the outline of the Analysis section The final report was then opened for comments from the Global Facility for Disaster Reduction and Recovery (GFDRR) and the wider community before it was concluded
14
openStreetmap mapping in London ALexAnDeR KAChKAev CC By-SA 20
15
each case study is intended to provide an example of the use of vGI by government or by the public and summarizes the context positive and negative outcomes and main lessons The case studies are presented in full in a later section and are all deliberately short with the same structure
First a summary table provides general information about the case study in the format below
Interaction type The flow of the data (either crowdsourced or authoritative) in one of the categories introduced earlier PublicGovernment GovernmentPublicGovernment or PublicGovernmentPublic
Trigger event A specific event that might have triggered the data sharing (eg change in data license natural disaster etc) where relevant
Domain The area in which the data sets have been used This may include both an abstract characterisation of the general area (eg generic mapping) as well as information about the specific field (eg update of national topographic database)
Organization The organization(s) that initiated the data sharing process and those that have been actively involved in the whole project
Actors Interested partiesstakeholders that have contributed to or benefited from the data sharing process in any way
Data sets The data sets that have been shared and used by the public or the authorities (including new data sets generated)
Process The process followed to implement the data sharing data integration and cooperation
Feedback The immediate result returned to the initiator of andor participants in the data sharing process if any
Goal The original goal of the project and reason for exploring crowdsourced geographic information
Side effects Any other issues or outcomes
Contact point The person who has either provided details about or been significantly involved in the case study when available
CASe STuDIeS STRuCTuRe AnD oveRvIeW
16
Next each case study includes the context a description of the project and a discussion of the positive and negative aspects of the collaboration They each close with bullet points indicating the most important lessons to be learnt Below are short descriptions of the case studies that provide the basis for this report
1 Participatory mapping and decision support tools for disaster risk reduction the PhilippinesThis project provided training and technical assistance to local government units to create basemap information and then perform impact analysis using InaSAFE impact modeling software This allows analysis of the effect of a disaster on an area using scientific models as well as populationinfrastructure data
2 Community Mapping for Exposure in IndonesiaThe goal of this project is to reduce vulnerability to natural disasters Young people have successfully
collected spatial and attribute data and traced them in the OSM platform so that thematic maps can be created to show potential damage in case of physical disasters
3 Flood preparedness through OpenStreetMap Jakarta IndonesiaA sub-category of Community Mapping for Exposure in this project the heads of villages in the area of interest were asked to identify their critical infrastructure by using paper maps and university students entered the information into OSM The data can produce maps for disaster risk planning
4 Humanitarian OpenStreetMap Team mapping in Ulaanbaatar MongoliaA greater vision for creating a ldquoSmart Cityrdquo in Ulaanbaatar Mongolia motivated local stakeholders and volunteers to participate in a project to create an updated topographic map The World BankICT and the Humanitarian OpenStreetMap Team (HOT) worked with local officials (universities city officials and government) to establish an OSM community in the city to support this project
Trimet mAx and bus on Portland mall (see case study 29) TRImeT CC By-nC-SA 20
17
5 Mapping schools and health facilities in Kathmandu Valley NepalThis is a proactive crowdsourced mapping project to minimize the consequences of a possible future natural disaster in an area at high risk of a high-magnitude earthquake Learning from the difficulties in Haiti Kathmandu officials have worked with NGOs to map the basic education and health infrastructure These data sets will facilitate the delivery of humanitarian efforts if needed
6 Informal settlement mapping Map Kibera Nairobi KenyaMap Kibera was carried out in the most crowded slum in Nairobi Kenya in an effort to improve its reputation and offer an accurate picture of the area which is quite dynamic due to the movement of the population Local people collected and edited GPS tracks Innovative techniques such as SMS video and voice reporting were also launched and a small amount of compensation offered to participants
7 Mapping of South SudanThis was launched because of the need for a temporal and up-to-date map when the new nation was created Google Map Maker the Sudanese diaspora and various organizations carried out workshops to train people to work separately on the digitization of aerial imagery A significant amount of work was completed in a short time by adopting local knowledge and providing technical tools Those who experienced the training sessions were inspired to recruit new volunteers
8 iCitizen mapping service delivery South Africa This project is at the design phase and aims to involve the public at a local level to collect data points via mobile phones and adopt different ways of geotagging photos in real time or via SMS and email The purpose is to report infrastructure problems
9 Skandobs Scandinavian predator tracking system Norway and Sweden This is a cross-country project developed to collect observations for lynx wolverine brown bear and wolf populations driven by new legislation requirements Reliable observations help to inform management objectives including long-term conservation and population-level management Monitoring is complicated and expensive for many reasons including the geographical size of the area under observation but involving the public has been very successful
10 Corine Land Cover 2006 in OpenStreetMap FranceThe change in the data release policy of CLC2006 enabled the French OSM community to integrate it into OSM and engage the public to add updates The methodology and best practices were adopted by a large number of national OSM communities The updated OSM data can be used by the public and governmental agencies
11 FixMyStreet for municipality maintenance information UKLed by a third sector organization (mySociety) this project is based on a web platform that engages the public to provide data about problems in the local area The data collected is propagated to the local authority responsible for maintenance which can then feedback any action taken to remedy the problem
12 FINTAN vernacular placenames project Ordnance Survey and Maritime and Coastguard Agency UKThis project leverages ldquoprofessionalrdquo crowdsourcing to facilitate the response to distress calls by centrally recording and managing vernacular placenames In order to achieve this HM Coastguard personnel and other professionals submit their local knowledge on placenames to a central platform
18
13 Towns Conquer gamification and Instituto Geograacutefico Nacional toponyms database SpainDeveloped when a university research team were awarded a small funding prize an Android-based game was created and linked to a web-based map service at Spainrsquos national mapping agency (NMA) Volunteers were able to submit their suggestions for corrections and updates within a competition format
14 National Biodiversity Data Centre IrelandThis project was initiated to leverage the potential of outreach groups and the general public for data survey and observation This widens the base from which observational biodiversity data may be obtained in Ireland Another aim was to initiate a stronger engagement of non-professional scientists and heighten the understanding of biodiversity related matters amongst the general population
15 Haiti disaster responseOne of the most well-known crowdsourcing applications this was developed after the earthquake hit Haiti in 2010 Within 48 hours the capital had been mapped by volunteers who contributed from every part of the world to create a temporal topographic map to fill the gap left by the official mapping agency The maps were used by various organizations to allocate supplies and medicine
16 Mapping for Natural Resources CanadaThe Mapping Information Branch of Natural Resources Canada (NRCan) is releasing its data sets into OSM format in an effort to engage the local OSM community The aim is to update the national database to supplement the agencyrsquos limited resources and correct outdated topographic maps
17 Boston StreetBump USThis is part of an initiative by the Boston Mayorrsquos Office of New Urban Mechanics (MONUM) to pilot experiments that offer the potential to radically improve the quality of city services The idea was to capture new technology ndash from smartphones to GPS ndash and a resurgent spirit of civic engagement In this example the public use their smartphones to help detect bumps or potholes on Bostonrsquos streets
18 Open data initiative New York City USPart of a broader open data initiative the City of New York has released building footprint and address location data MapBox a private company in partnership with the US OSM community has begun importing these data sets into OSM The city administration receives email updates when changes are made This helps them to prioritize surveying efforts and keep government data up to date
19 Imagery to the Crowd State Department Humanitarian Information Unit USA program whereby high-resolution satellite imagery is made available to the OSM community to facilitate the digitization of ground features The resulting data has been used to support a number of humanitarian operations
20 OpenStreetMap Community of Practice US Census BureauSeveral US Census Bureau employees have worked to build an active volunteer group of OSM contributors within the Bureau This group is now advocating for the incorporation of VGI practices into Census operations
21 Crowdsourcing The National Map National Map Corps USThe National Map Corps has given volunteers the chance to collect and edit data about ten different human-made structures in 50 states in an effort to provide accurate and authoritative spatial data The methodology includes various steps such as
19
adding new features removing obsolete points and correcting existing data A pilot test in Colorado showed that the VGI was satisfactory in its accuracy
22 US Geological Survey ldquoDid you feel itrdquoA website that automatically maps reports from the public about their perception of recent seismic activity in their areas It also collects quantitative data from citizen reports The project was driven by a lack of instrumental ground-motion data in regions of low seismicity and the vast amount of new data being collected offers a valuable resource and has the potential to address some long-standing controversies in earthquake science
23 Places of Interest project National Park Service USThe US National Park service is seeking to incorporate VGI principles into their strategy for keeping park maps up to date and accurate Using tools developed by the OSM community park visitors and staff can now contribute to mapping trails tourist sites and other park infrastructure
24 California Roadkill Observation System (CROS) USThis project was developed by a university-based research organization to understand the relationship between ecology wildlife behavior and transportation It includes the use of GIS and statistical modeling to predict roadkill hotspots measure contributing factors quantify impacts and estimate benefits of different remedial actions CROS can be used to record observations from reporters out in the field who come across identifiable road-killed wildlife The goal is to provide a safer environment for wildlife in relation to Californiarsquos motorways
25 Shelter Associates slum mapping in IndiaShelter Associates is an NGO focused on housing projects sanitation health and education initiatives in India It uses slum mapping to promote good governance and decision making policies It is
a hybrid model with expert and local volunteer contributors and has used GIS since the late 1990s recently introducing Google Earth as an easy-to-use tool for informal settlement mapping
26 Crowdsourcing satellite imagery in SomaliaThis project was launched in an effort to map all shelters located in the Afgooye corridor Somalia to identify the number and location of refugees Satellite imagery was used to map the information in order to facilitate decision making policies
27 Agricultural data collection and sharing by Community Knowledge Workers UgandaA Community Knowledge Workers network in Uganda facilitates grassroots data collection and sharing by farmers for other farmers and policy makers The network has overcome the lack of electric power and mobile network infrastructures to provide data and services such as weather forecasts crop market prices livestock disease outbreaks and focused policy implementation for improved farming practices
28 Twitter use in Italian municipalitiesA research project into the profile activity and use of Twitter accounts of Italian municipalities the study focused on the types of messages sent revealing that culture and tourism are the most common topics Twitter also provides opportunities for members of the public to communicate with municipalities
29 Portland TriMet transportation planner Oregon USTriMet the public agency that provides bus light rail and commuter rail transit services in the Portland Oregon metropolitan area turned to the use of OSM data to improve its services by including multimodal transportation plans The TriMet officials committed to support the OSM community and realized that releasing governmental data to the public led to improved public services
20
Participants of the map Kibera project (see case study 6) mAP KIBeRA CC By-nC-SA 20
21
AnALySIS
The overall analysis of the collected case studies delineates seven main components of vGI projects for government use
1 Incentivesdrivers to start a project mostly from the government perspective
2 Scope and aims
3 Participants stakeholders and relationships identifying the roles that different participants play
4 modes of engagement
5 Technical aspects
6 Success factors
7 Problems encountered
22
Lack of institutional data in time sensitive situationsThis is one of the most common drivers and its importance was shown particularly by the aftermath of the Haiti earthquake where there was an urgent need to provide mapping to facilitate humanitarian and first aid efforts The Kathmandu case study is a proactive example of local and international stakeholders teaming up to provide basic mapping of schools and health facilities in case of earthquake
Policy change around governmental dataFor example the adoption of an open data policy in New York City the use of the released CLC2006 data by the French OSM community and the US State Department Humanitarian Information Unit (HIU) sharing high-resolution imagery with humanitarian organizations and volunteer communities
Low resources and need for infrastructure supportInterestingly this situation can be a driver for both well-established NMAs such as the one in Canada where updates are needed to mapping covering 10 million km2 and newly established ones such as in South Sudan where basic topographic features are needed to build the first data infrastructure of the new state Similarly the implementation of ambitious efforts like the ldquoSmart Cityrdquo project in Ulaanbaatar Mongolia need support from VGI
Research and development effortsThis includes exploring new products or new directions of research Examples are CROS a university-led initiative about wildlife roadkills
1InCenTIveSDRIveRS
and Towns Conquer which explores gamification techniques and strategies to enhance VGI A slightly different approach is taken by FINTAN in the UK which uses ldquoprofessionalrdquo VGI to collect and preserve expert local knowledge
Environmental monitoring through citizen sciencePublic participation in scientific data collection is frequently related to monitoring the state of the environment rather than the creation of new productsresearch trajectories (as in research and development above) Examples include the USGSrsquos ldquoDid you feel itrdquo public participation in seismic monitoring Irelandrsquos National Biodiversity Data Centre submission of biodiversity records by the general public and Skandobs wildlife observations crowdsourcing
There are many different factors that encourage organizations to search for an alternative to institutional data solutions and start vGI projects
California Roadkill observation System (see case study 24)
23
2SCoPe AnD AImS
Basic mapping coverageIn many cases the aim is as basic as the creation of a cartographic background for an area of interest or entire country In many developing countries there is no spatial data infrastructure to support efforts such as humanitarian support disaster prevention and general planning Examples include South Sudan where the new nation was in urgent need of basic cartographic coverage and Map Kibera where the aim is to create a topographic backdrop of Nairobirsquos biggest informal urban settlement
Update authoritative spatial data setsA step further is the aim to support established spatial infrastructures Keeping data sets up to date (mainly through change detection projects) is a crucial task especially for NMAs as this guarantees the quality of their services Examples include NRCan Towns Conquer New York Cityrsquos open data initiative Ulaanbaatarrsquos ldquoSmart Cityrdquo and the US Census Bureau
Upgrade public sector servicesRelated to the above is the effort to collect new and unrecorded spatial data sets to upgrade the quality of the services provided by a public sector organization Examples include the FINTAN project in the UK which will improve HM Coastguard services in terms of time response to distress calls Portland TriMet iCitizen in South Africa Boston StreetBump and FixMyStreet
Policy development or reportingLocal knowledge and the timely nature of participantsrsquo observations are two of the most important VGI characteristics that stakeholders are trying to tap into Examples that combine observation gathering and policy planning are CROS where observations about roadkills help stakeholders
understand the phenomenon and the best remedial actions and Skandobs where wildlife observations inform actions and policies in accordance with new legislation Irelandrsquos NBDC and USGSrsquos ldquoDid you feel itrdquo are more report oriented and use the observations to stimulate public engagement and analysis respectively
iCitizen interface (case study 8)
Natural disaster preparedness (proactive) and crisis management (reactive)As well as being a driver one of the most important aims of existing projects is to build spatial data sets for humanitarian purposes This covers both the action of crisis management after a natural disaster as in Haiti and the proactive actions of creating the necessary infrastructure in an effort to minimize the consequences of a future disaster as in the cases of Kathmandu Indonesia and the Imagery to the Crowd project
KIR
u P
ILL
Ay
un
IveR
SIT
y o
F T
he
WIT
WA
TeR
SRA
nD
24
Public sector and NGOsinternational organizationsThis type of cooperation is relevant to various contexts including crisis management where the active participation of all stakeholders is needed to address often difficult and complicated tasks Those involved in such partnerships include the United Nations World Bank HOT NMAs state mapping departments and local universities The following examples indicate the breadth of such cooperative efforts Haiti disaster response Imagery to the Crowd Ulaanbaatarrsquos ldquoSmart Cityrdquo Kathmandu and Map Kibera (the latter involving thirteen national and international bodies)
Public sector private sector and NGO cooperationAn even more inclusive type of cooperation is the additional participation of the private sector For example MapBox joined forces with the OSM community and the New York City government to support data migration and software provision in turn gaining valuable insight into the data released In another case a number of international organizations had the active support of Google in terms of software and user motivation to help the local government begin the mapping of South Sudan
3PARTICIPAnTS STAKehoLDeRS AnD ReLATIonShIPS
Universities and research institutionsAs VGI is a relatively new and dynamic phenomenon there is much active research undertaken by universities and research institutions on its evolution (eg Towns Conquer) and on possible real-life applications (eg Skandobs USGSrsquos ldquoDid you feel itrdquo Irelandrsquos National Biodiversity Data Centre and CROS California)
Private and public sector initiativesThe private rather than public sector can also lead on projects for VGI use in government One such example is FixMyStreet run by social enterprise mySociety another is the involvement of the UKrsquos Ordnance Survey (which functions with market criteria despite being an NMA) in the development of an application that supports ldquoprofessionalrdquo crowdsourcing for vernacular placenames for use by HM Coastguard
Skandobs observation of a lynx (see case study 9)
25
4moDeS oF enGAGemenT
Reaching out for public supportOne of most common types of engagement is for the stakeholders to directly reach out for public support and in parallel engage with pre-existing local communities of volunteers (eg Kathmandu) or create such communities (eg Ulaanbaatar) as part of the effort to produce geospatial data sets Another example is the engagement of the diaspora of South Sudan to provide a solid topographic map of the new state The Haiti disaster response is an interesting example because there was strong hesitation on behalf of the local NMA regarding the support that non-experts could provide However due to the initiatives of other participants (ie OSM UN) the results of the public engagement proved to be a valuable tool for delivering relief on the ground
Releasing existing resourcesThis can include the release of data sets (including visual databases) or license changes enabling greater use for public users including the OSM community and private entrepreneurs The most characteristic cases of this type of engagement are the Imagery to the Crowd project New York City open data initiative and use of Corine Land Cover 2006 in France Both the general public and active volunteers seem to be in quest of data sets that will facilitate their efforts and thus welcome such initiatives
Direct investmentDirectly employing contributors can help government agencies to ensure that the data collected meets their immediate needs while still benefiting from participation in the broader ecosystem In both the Portland TriMet and Community Mapping for Exposure in Indonesia case studies government resources were used to hire in-house mappers to contribute to OSM Community-based projects in areas of very low income can also benefit from providing financial compensation to public
participants to replace earning potential as Map Kibera did in Kenya
Research and citizen science initiativesAlthough giving the public the opportunity to participate in monitoring and research projects has a very long and successful history technological advances especially in the mobile domain offer a different level of dynamic engagement The case studies of Towns Conquer CROS USGS Skandobs and Irelandrsquos National Biodiversity Data Centre all demonstrate this type of engagement
Role of champions within a specific community of practiceThis type of engagement stems from individualsrsquo prior knowledge about the nature and use of VGI and often from their cooperation with local communities such as OSM volunteers Their personal effort pushes their organizations to engage more actively in VGI and develop methodologies and best practices that would be beneficial for all stakeholders including governmental organizations the OSM community and the public This particular mode of engagement can be observed in the case studies of the US Census Bureau and Natural Resources Canada
Christmas Bird Count is an example for citizen science projectsJe
nn
IFeR
Je
We
TT
uSF
WS
C
C B
y 2
0
26
Combination of conventional and open source dataMany crowdsourcing projects use a wide range of software applications both closed and open source The Corine Land Cover in France and Natural Resources Canada case studies prove that combining various tools in different applications can widen the technical horizons of an application and create new opportunities However access to the knowledge and experience of using these software tools is not available to everyone and requires high technical abilities
Data setsAnother issue with VGI data sets is the need for synchronisation and coordination During update operations data sets often diverge but the users and recipients of a project should know which version is the correct one and how to maintain a definitive copy In some cases and especially where open source software is used the format of data is not convenient for further use in proprietary software packages making it difficult to reintegrate the data Therefore the interoperability of data formats is a significant issue
Accuracy and qualityThe accuracy of the information continues to play a key role in VGI projects Community Mapping for Exposure in Indonesia indicated that accuracy varies among the different data sets which is an issue of concern Elsewhere the Colorado pilot project for the National Map Corps showed that accuracy significantly improved when volunteer participation increased A related concern includes the accuracy of data collected by mobile phones as in the iCitizen
5TeChnICAL ASPeCTS
project where this is the main issue However there are many methods for quality assurance in VGI and these can be used to ensure the accuracy and quality of the information
AuthorityThe authority given to VGI data is one of the most challenging issues for its use in government In a departure from an era in which information is considered authoritative simply because it originates from a government organization recognition of the inherent heterogeneity in geographical information and the need to keep it up to date permeate many of the case studies However because government bodies have both the authority and the responsibility to provide accurate and comprehensive information this requires more control over the data and its quality Many of the case studies such as USGS or NRCan show that governmental organizations need to put appropriate procedures in place to ensure that regardless of the source the information released is accepted as trustworthy and valuable
of specific relevance here is the need to formalize and standardize vGI before it can be used in government systems This influences the following aspects
openStreetmap buildings
Do
nA
LD n
oB
Le
CC
By
20
27
Identification of appropriate cooperation between the public and governmentApproval and acceptance by the government is central to VGI success in this context regardless of the stage of the project Approval means not only the adoption of crowdsourcing techniques but also the cooperation between the public and government in a continuous effort to produce the desired result Governmental experimentation plays a crucial role in identifying how to incorporate crowdsourcing techniques into official activities and projects VGI support is divided into two main categories that offered during the evolution of the project (eg NRCan-OSM on-going collaboration) and that offered in its aftermath (eg South Sudan government evaluation of the project by Google Map Maker and the Sudanese diaspora) In contrast it is notable that the outcomes of the Haiti disaster response were not subsequently used by the local official mapping agency though they were used by other humanitarian actors operating in the country at the time This represents a missed opportunity to establish a richer connection between the Haitian government and the OSM community and is linked to issues of IPR covered below
Partnership of scientific organizationsStrong collaboration between different organizations which are experts in different parts of a project is key to success Although in a few cases this has led to a lack of coordination and duplication of data (eg the Haiti disaster response) in others duties are separated into technical economic and human resources (eg the National Map Corps project) Research organizations and universities can play a positive role in this as centers of innovative ideas and techniques as well as participants and volunteers
6SuCCeSS FACToRS
WorkshopsA series of workshops carried out in the preliminary stages of projects encourages the training of volunteers and defines the pattern for participant coordination It is noticeable that among the most successful stories (eg Community Mapping for Exposure in Indonesia Map Kibera in Kenya and South Sudan mapping) the workshops indicated the value of partnering with scientific organizations such as local universities to train volunteers and conduct quality assessment to ensure government acceptance of the data
Recruitment of volunteersAlthough the common view is that the public can participate in all crowdsourcing applications without restriction the reality is quite different Most projects are oriented to specific tasks and recruit the public according to their age background or technical skills One example is Community Mapping for Exposure in Indonesia where young undergraduate students were recruited and scholarships offered in exchange for participation As crowdsourcing reaches new locations compensations and awards to participants may also become more important as in the case of Map Kibera
Innovative techniquesIn an effort to keep the interest of the public and adopt new technologies and platforms different organizations have promoted new crowdsourcing techniques such as gamification (eg Towns Conquer) and reporting with the aid of photographs video and SMS (eg Map Kibera) or use of social media (eg by Italian municipalities)
elements that contribute to the success of vGI projects should be considered from the outset and are often linked to the original drivers
28
One-off event versus on-going initiativeWhile many VGI activities are conceived as a single event the longevity of updates and maintenance needs careful consideration Projects vary significantly in this respect For example the use of CLC2006 in OSM in France lasted many months and resulted in an outcome which remained unexploited while others lasting only a few days such as the mapping of South Sudan and the Haitian disaster response provided a clear solution to a significant problem relatively quickly The main differentiation concerns the strategy behind each VGI project and how it is recognized by local authorities and the public whether as a one-off crowdsourcing event or as an on-going initiative The response is directly linked to the perspectives that have been cultivated the trust that is given and the aims of the project
Accuracy and reliabilityThe quality of the VGI and its application are among the main questions that must be answered at the beginning of and during a project A challenge in projects launched or supported by governmental bodies is that they are responsible for providing authoritative data while also integrating input from the public making accuracy and reliability key issues The case studies demonstrate different levels of accuracy and ways of assessing this (eg Community Mapping for Exposure in Indonesia National Map Corps in the US) Accuracy varies depending on the new datarsquos purpose and the existing data available as a reference This is also relevant to hardware issues in passive VGI in which data from sensors that are carried by members of the public is shared with government bodies For example in the Boston StreetBump case study the use of smartphone-based sensor technology produced many ldquofalse-positivesrdquo due to erroneous movement detection As noted there are multiple
methodologies for quality assurance of VGI and these should be explored and integrated according to the specific context and aims
Maintaining public interestPublic interest and participation need to be maintained through the life of a VGI project For example researchers involved in iCitizen are concerned about how to convince the public to use mobile phones and applications The experiences of other projects indicate that solutions are divided between less and more economically developed contexts In the former attracting volunteers means offering a small amount of compensation to replace time that could otherwise be used to generate income In the latter innovative techniques such as gamification and clear targets can be helpful Maintaining the data and the relevant software is also an issue of concern Financial resources should therefore be split across the whole life of a project rather than allocated only to the beginning stages
7PRoBLemS enCounTeReD
Five-day openStreetmap training to nepal Red Cross Society for community based disaster risk reduction (Koshi Basin) program
KA
Th
mA
nD
u L
IvIn
G L
AB
S w
ww
kat
hm
and
uliv
ingl
abs
org
C
C B
y-S
A 3
0
29
Separation between data collection and use for policy analysisOne of the key concerns for the public involved in VGI is how and where their data and contributions are put to use Very often it is unclear if their information has been used at all In this report we have emphasized where VGI has been used to directly influence policy It is very important when adopting crowdsourcing that the connection between data collection and eventual use by the government is made clear
Traditional GIS practices and concern over organizational changeIt is important to highlight that VGI should not be seen as an activity that replaces the work of professionals but as one that enhances it In some cases such as Haiti the use of VGI was seen as a direct threat to the business model of the NMA and the OSM data could not be adopted without consideration of how this could be protected (see also Intellectual Property Rights issues) In other cases VGI is perceived as a challenge to existing procedures funding and professional standing which leads to a negative response There is also a need to integrate VGI processes including issues of engagement and feedback to contributors into established systems practices and procedures In some cases current practice does not require
ADoPTInG CRoWDSouRCeD GeoGRAPhIC InFoRmATIon In GoveRnmenT
The clear message in this report is that there is no ldquomagic bulletrdquo or perfect methodology for a vGI project however it does reveal that there are a series of issues which need to be addressed when considering a crowdsourcing project Attention to these issues can increase the likelihood of successful adoption by government and acceptance by the public
such high levels of engagement so organizational transition is required This is particularly important in emergency situations where entrenched procedures are necessary to ensure an appropriate response and capacity to deal with uncertainty and complexity is reduced If VGI is considered for use in crisis response it should be evaluated and tried in preparation exercises to ensure that it is fit for purpose
Inherent coverage temporal and participation biasesThe growing body of research into VGI demonstrates that they can exhibit certain biases in the level of participation as well as when and where the activities take place For example there is a problem of coverage bias towards populated and popular places (such as large urban centers) and crowdsourcing rarely includes a representative sample of the general population An example of a case study limited by such inherent biases is the Skandobs project where the real areas of interest are geographically remote and present physically challenging terrain Special incentives may be needed to encourage public involvement from specific regions and known biases of this kind should be considered during the design and implementation of such projects
30
Project continuation and sustainabilityIn many of the case studies examined there is no specific plan for longer term adoption of VGI by the governments involved Adoption of crowdsourcing by government is a process which must be subject to resource management and organizational change Adopting crowdsourcing is likely to require additional resources in terms of managing the crowdsourcing processes the data collected and engaging with the communities involved Interaction with crowdsourcing projects may be terminated by governments for a number of reasons the VGI champion may be redeployed there may be a change in policy or resources may not be available to continue the engagement Governments must consider long-term plans and assess the sustainability of their adoption of crowdsourcing
Licensing and other Intellectual Property Rights (IPR)Concerns over data ownership and specific licensing agreements are another obstacle to the adoption of VGI in government Incompatibility in licensing should be considered at the outset of the project For example the OSM license requires data to be shared-alike and Google owns all data in Google Map Maker IPR is especially important in geographical data sets because most of the value will not come from a single data set but from linking and matching it with other data sets This means that problems with derivation (eg the source that dictates the coordinates used to locate an object on the map) can emerge and create uncertainty about how the data can be used and under which conditions
Contact pointsWhen governments engage with established crowdsourcing communities it is very important that there are open and clear lines of communication between both parties Some of the skepticism around VGI stems from the fact that it can be difficult to contact those involved This is very different from when governments enter into a contract with a third party company or organization When governments provide a general call for contributions from the public there is often no way of contacting the leader or director of the crowdsourcing community and indeed such a person may not exist HOT provides an example as to how this can be resolved as an established organization dedicated to providing VGI services in crisis situations More generally there is a need to define clear ownership of the process and responsibility over its management The information should be clear so volunteers can easily identify and contact the responsible individual especially in case of emergency
Conflict between channels of reportingIn some projects channels of reporting can be confusing and conflicting for participants An example is the relationship between FixMyStreet which is run by an independent body and the helpline of the local authority In other cases there are multiple channels which can be important in crisis situations but require management At the same time it is clear that different participants will prefer different channels so enforcing the use of a single channel can be counterproductive
Reporting with FixmyStreet (see case study 11)A
LA
n S
TAn
Ton
C
C B
y-S
A 2
0
31
Jo SummeRFIeLD CC By-nD 20Citizen science participant during a Bioblitz
32
SummARy AnD WAy FoRWARD
This report has reviewed vGI use in government and identified success factors and challenges While suggestions of crowdsourcing best practices that were identified by Brabham (2013) are relevant here such as the need to define the problem clearly ensuring commitment from the organization and knowing the online community this report identifies several factors specific to vGI projects To summarize the factors likely to influence the use of vGI relate to the following
At the individual level champions and change leaders within public sector organizations can be critical In both the UK and France there are examples of open data enthusiasts at local government level who have led to significant changes in the way organizations use VGI Such champions were always critical in the adoption of geographic information technologies in government and will continue to be so On the other hand specific individuals with worldviews that oppose public participation in data collection and analysis can block or hinder the integration of VGI into government
The organizational level is also important In organizations mostly using information provided by external sources (eg private sector) there is a higher potential for replacing this information with VGI than if information is maintained internally and the use of VGI might be seen as a threat This is despite evidence demonstrating that successful
VGI augments rather than replaces organizational activities Further organizational issues can be procedural such as existing legislations and obligations to service delivery or structural such as the responsibilities for data collection and use
Next are issues that relate to business models Organizations responsible for data collection maintenance and dissemination have an incentive to use VGI to reduce costs although additional costs might be involved in communicating with the public and maintaining their interest On the other hand for organizations responsible for selling data to maintain their operations the use of open data and release of highly valuable geographic information is a threat to their financial viability Private sector organizations are also affected when they have committed to deliver public services based on assumptions that emerging data can be used for profit
Technical problems should be also noted which include the ability to merge data sets that have been changed by the public into an existing system This requires various abilities from version management to object level metadata In some cases differences in formatting and fundamental data structure as well as semantic ambiguity add to the challenges of using VGI fully In addition the plurality of tools and channels through which information can reach an organization are significant challenges
Finally conceptual or ldquoworldviewrdquo issues need to be recognized and may well be presented as one of
bull individuals
bull organizations
bull business models
bull technical problems and
bull conceptual issues
33
the above categories VGI use requires accepting a higher level of uncertainty attention to heterogeneity and the need to work closely with diverse groups and communicate with the public This can be challenging to people who are used to working in an isolated and top-down manner In addition perceptions of VGI as professionally threatening should be accepted as genuine and reasonable and need to be addressed
To conclude this report has documented only the early stages of VGI use in government There is a need for further research to explore the factors influencing the success and failure of VGI projects for government use Some of the problems such as licensing terms will require specific effort from both governmental organizations and crowdsourcing communities At this point in time there is much misunderstanding between the two groups in terms
of time frames work practices and problem solving approaches
At the same time this report has demonstrated that collaboration between government organizations and the public is possible and beneficial to both parties Technological and societal changes over the past decades mean that opportunities for such collaboration are increasing However like any cooperation between established institutions and external groups or individuals VGI projects require attention and planning The successful cases are no longer ldquohappy accidentsrdquo but evidence of commitment and investment at individual and organizational levels which provide a return in the form of information that would otherwise be difficult to obtain Practitioners can use the lessons identified from case studies across the world in order to further develop this field
KAThmAnDu LIvInG LABS wwwkathmandulivinglabsorg CC By-SA 30Participatory GIS training (see case study 5)
34
CASe STuDIeS
35
36
No Case study Disasterrisk
New data sets
Maintain data sets
Public services
Specialist knowledge
1 Participatory mapping and decision support tools for disaster risk reduction the Philippines
Yes
2 Community Mapping for Exposure in Indonesia Yes
3 Flood preparedness through OpenStreetMap Jakarta Indonesia
Yes
4 Humanitarian OpenStreetMap Team Mapping in Ulaanbaatar Mongolia
Yes
5 Mapping schools and health facilities in Kathmandu Valley Nepal
Yes Yes
6 Informal settlement mapping Map Kibera Nairobi Kenya
Yes Yes
7 Mapping of South Sudan Yes
8 iCitizen mapping service delivery South Africa Yes
9 Skandobs Scandinavian predator tracking system Norway and Sweden
Yes
10 Corine Land Cover 2006 in OpenStreetMap France Yes
11 FixMyStreet for municipality maintenance information UK
Yes
12 FINTAN vernacular placenames project Ordnance Survey and Maritime and Coastguard Agency UK
Yes
13 Towns Conquer gamification and Instituto Geograacutefico Nacional toponyms database Spain
Yes
14 National Biodiversity Data Centre Ireland Yes
Quick reference
37
No Case study Disasterrisk
New data sets
Maintain data sets
Public services
Specialist knowledge
15 Haiti disaster response Yes Yes
16 Mapping for Natural Resources Canada Yes
17 Boston StreetBump US Yes
18 Open data initiative New York City US Yes
19 Imagery to the Crowd State Department Humanitarian Information Unit US
Yes
20 OpenStreetMap community of practice US Census Bureau
Yes
21 Crowdsourcing The National Map National Map Corps US
Yes
22 US Geological Survey ldquoDid you feel itrdquo Yes
23 Places of Interest project National Park Service US Yes
24 California Roadkill Observation System (CROS) US Yes
25 Shelter Associates slum mapping in India Yes Yes
26 Crowdsourcing satellite imagery in Somalia Yes Yes
27 Agricultural data collection and sharing by Community Knowledge Workers Uganda
Yes
28 Twitter use in Italian municipalities Yes
29 Portland TriMet transportation planner Oregon US
Yes
38
The goal of this project was to use participatory mapping and InaSAFE impact modeling software to support Philippines LGUs in disaster risk reduction activities DILG had a need to better support such activities and determined that participatory mapping and use of InaSAFE was the best way to accomplish this
1 Participatory mapping and decision support tools for disaster risk reduction the Philippines
Interaction type GovernmentPublicGovernment
Trigger event The Department of Interior and Local Government (DILG) of the Philippines wanted to better support local government units (LGUs) to prepare risk-sensitive land-use plans structural audits of public infrastructure and disaster contingency plans Detailed data to be used for planning was not available
Domain Generic mapping by local government
Organization DILG
Actors World Bank - East Asia Pacific (EAP) Environment Science for Social Change (ESSC) DILG LGUs of Pampanga Project NOAH OSM Philippines Community GeoRepublic Japan HOT
Data sets OSM data describing standard features land use and administrative boundaries
Process New training materials were created specifically aimed at LGUs in the Philippines Next training and mapping activities were conducted in the selected LGUs Further community building activities to support the growth of the OSM community in the Philippines were also conducted Key to this was inviting community members to all the trainings either to learn or assist in delivering the training
Feedback Success in the data collection in OSM varied by participating municipality For two very little data collection occurred after the initial training and mapping phase but one continued to map afterwards
Goal Collect detailed data to better support LGUs in developing disaster plans
Side effects -
Contact point Kate Chapman HOT katechapmanhotosmorg
The project provided training and technical assistance to LGUs to create basemap information and then perform impact analysis using InaSAFE Three LGUs participated in the program from the province of Pampanga (Candaba Lubao Guagua) A total of 85 people participated in the process from these areas and six OSM volunteers additionally participated and assisted the training team during the activities The first portion of the training was about the collection of infrastructure data using OSM Later InaSAFE workshops were held to show how the collected data could be analyzed
The intent was that the LGUs could continue mapping in OSM to improve the analysis in InaSAFE and create a more detailed basemap for other uses Freely available data of the areas are now available in OSM During the training the OSM Philippines community assisted with the goal of further strengthening and supporting the OSM community as a whole
Teaching LGUs how to map in OSM and then analyze the data in InaSAFE was of benefit though it was difficult for LGUs to continue mapping after their initial workshops Little mapping occurred outside of the scheduled mapping activities during the training Only one LGU continued to map any amount of substance afterwards New methods for better supporting mapping are being explored including creating a Training of Trainers (ToT) program to expand the community within the Philippines able to provide support in OSM Creating and discovering local champions within LGUs will help to ensure greater support for mapping after training Using these methodologies in other places is certainly possible but it would be important to take into account the context and government structure to ensure support for mapping outside of initial training
Main lessonsbull It is important to highlight the benefit of mapping
outside of the immediate usage to encourage continued work and data collection after the project period concludes
bull Efforts to build broader VGI communities as part of focused data collection activities can be valuable and should be encouraged
bull With care VGI data can be an important complement to official data sources and used for scientific modeling purposes
39
An example of an a priori disaster response the Indonesian mapping project began in early 2011 and at the time of writing is still active The main idea behind the project was to use OSM to collect previously unavailable data about buildings and their structure in both urban and agricultural environments and to use appropriate models to calculate likely damage in case of physical disaster The combination of the impact models and the use of realistic data led to the development of an open source risk modeling software (InaSAFE) showing the affected people infrastructure and damage if disaster were to hit a specific area This offers a practical tool for governments to develop actionable contingency plans and fills the need for risk assessments identified by the World Bank
The pilot phase consisted of workshops offering training on the project and building construction as well as data collection in urban and rural areas The approach between rural and urban areas was slightly different although the result was similar The original data were derived from paper maps
2 Community Mapping for Exposure in Indonesia
Interaction type GovernmentPublicGovernment
Trigger event -
Domain A priori disaster response
Organization Community Mapping for Exposure in Indonesia
Actors Indonesian Disaster Management Agency (BNBP) Australian Agency for International Development (AusAID) HOT Civil Society Strengthening Scheme (ACCESS) GFDRR
Data sets Satellite imagery GPS tracks and attribute data
Process Collecting spatial and attribute data and tracing in OSM platform
Feedback Thematic maps showing damage in case of various physical disasters
Goal Reduction of vulnerability to natural disasters
Side effects Deemed a successful example of disaster relief preparedness that could be applied in other developing countries
Contact point Kate Chapman HOT katechapmanhotosmorg
which were edited by local people satellite imagery depending on availability and GPS tracks Data were edited using JOSM and Potlach2 web editor and then used in QGIS Urban areas were mapped by students who took part in a mapping competition Rural areas were mapped with ACCESS contributors and local people The second phase lasted from July 2012 to March 2013 and focused on collecting exposure information essential for impact modeling software In total 163912 buildings were mapped during the pilot 29230 of them in urban areas and 16 workshops were held with 124 people participating in rural areas and 5 universities in urban areas
To encourage participation Community Mapping for Exposure has a pyramid format based on leadership with specific guidelines in data manipulation and great coordination between different contributors The whole process is focused on workshops participants were supervised at many stages and the procedure of data collection and manipulation was firmly defined Motivations for participation varied with incentives covering a spectrum from disaster protection to a mapping competition In terms of technical support the project was not only supported by HOT and OSM but also by open source software such as QGIS The main innovation in data collection was the private datastore which offered a unique ID for each object The final output has also been a success in enabling local government to visualize where people are most in danger by combining local wisdom with scientific knowledge to produce realistic scenarios for numerous different physical disasters
The main aspect of concern is the quality of the results which showed great variation According to the final report the quality was either very bad or very good in different areas although it was found to be acceptable generally The attribute quality which has a principal role in the success of the project indicated a great number of empty or incorrect records concerning the structure of buildings Other minor deficiencies were also noticed such as failing to create constant mapping volunteers and the use of time-consuming technical methods in a few cases (eg Excel spreadsheets in data collection or manual methods of data manipulation)
40
3 Flood preparedness through OpenStreetMap Jakarta Indonesia
Jakarta Indonesia is a large megacity that has frequent seasonal flooding issues Jakartarsquos disaster management agency (BPBD DKI Jakarta) needed better data to prepare for the flood season AIFDR UNOCHA HOT and University of Indonesia assisted in the process
The original idea was to ask the heads of the 267 urban villages the location of their critical infrastructure then ask university students to help with technical mapping Impact analysis using InaSAFE open source impact modeling software was then performed as part of a contingency planning process and the data has been used to create government maps to report flood conditions
Main lessonsbull An a priori disaster response can be focused
on appropriate models and parameters and can calculate damage in case of a physical disaster by using VGI
bull Interaction between official providers and VGI is a parameter of success not only for the beginning of the project but also for its continuity
bull Open source data can be reliable for scenario building but its quality can vary especially in terms of attribute data
bull Risk managers local communities and the public can combine local wisdom with scientific knowledge to produce realistic scenarios for numerous different physical disasters that may occur in an area of interest
bull The coordination of participating organizations and volunteers is important to take full advantage of human resources and technical innovations
Interaction type PublicGovernment Public
Trigger event Disaster management agency of Jakarta wanted to have better data for flood planning and reporting
Domain Mapping for disaster preparedness
Organization Jakarta Disaster Management Agency (BPBD DKI Jakarta)
Actors Australia-Indonesia Facility for Disaster Reduction (AIFDR) United Nations Office for Coordination of Humanitarian Affairs (UNOCHA) HOT University of Indonesia
Data sets OSM data of neighborhood boundaries (Rukun Warga) religious health sports and government facilities schools and roads
Process The heads of Jakartarsquos 267 urban villages were asked the locations of their critical infrastructure which was then mapped by university students and entered into OSM
Feedback Urban village leaders received paper poster maps of their villages
Goal Improve geographic information available for flood planning
Side effects Having a detailed basemap of Jakarta has made others interested in the idea of crowdsourcing and using community mapping to collect base data and record event data at a relevant scale
Contact point Kate Chapman HOT katechapmanhotosmorg
41
and village heads have used poster maps to plan logistics when responding to flooding
The project also created an open data set that can be used for a variety of analyses at the village district and provincial levels Using an open platform means that anyone can use the data and it can be updated easily as the information becomes outdated The data collected was useful in both the 2013 and 2014 floods allowing the government of Jakarta to show more detailed maps than previously available and increasing demand for additional mapping at a higher resolution
One negative aspect of the methodology used is that while it did collect the data very quickly the urban village officials do not have an easy way to update their area as the data changes
Main lessonsbull Collaboration between different teams of local
people depending on their knowledge means participants can contribute to specific tasks and stages of the project
bull Open data can be used at different levels of decision making policies such as village district and provincial levels
bull Difficulties in keeping data up to date is one of the most important concerns in terms of viability
bull Data can be used in a variety of ways including by governmental bodies for the creation of maps
4 Humanitarian OpenStreetMap Team mapping in Ulaanbaatar Mongolia
Interaction type PublicGovernment Public
Trigger event A greater vision to create a ldquoSmart Cityrdquo
Domain Topographic mapping
Organization Ulaanbaatar City Governorrsquos Office
Actors World BankICT HOT Mongolian University of Science and Technology city officials Mongolian Land Management Geodesy and Cartography Department
Data sets Aerial and satellite imagery (Bing Maps) field survey
Process Training core group of people in field data collection mapping a part of the city creating conditions for the project to continue by setting up an OSM community
Feedback Topographic maps of the city
Goal Map a part of the city create an OSM community and train locals to continue the mapping effort in order to support the vision to transform Ulaanbaatar into a ldquoSmart Cityrdquo
Side effects -
Contact point -
At the beginning of March 2013 the local authorities of Ulaanbaatar in Mongolia announced their vision to turn their city into a ldquoSmart Cityrdquo by 2020 The aim is to enable city residents to access information regarding public services provide a consolidated list of public service assets and allow citizens to send comments reports and requests to relevant officials via the Internet This effort is expected to promote transparency and fair public service while cutting down on bureaucracy
Such an effort could only be successful if it could rely on a comprehensive and detailed cartographic background of the city which did not exist at the time To support this effort a project to map the city was funded by World BankICT The aims of this project were to map a part of the city under OSM guidance and simultaneously train a core community to continue the task of mapping the entire city
The process started with basic training on tracing features from imagery and moved to the handling
42
of GPS devices in data collection The data sets were documented by field papers and ground photos which facilitated data management before the final uploading An OSM wiki page was also created with useful information and a catalog of resources for trainees and the newly built OSM community including training videos translated in Mongolian OSM data collection best practices and local tagging rules A consensus on the best tagging practice had to be achieved in order to describe geographic features that do not exist in other areas of the world and are therefore not documented elsewhere
An important challenge was that the city of Ulaanbaatar was undergoing a great reconstruction phase and thus the available imagery data sets might not provide up-to-date information Additionally due to weather conditions the data collection process was taking place during mild days while data management and upload was taking place days later possibly by volunteers who did not collect the data themselves These two factors raise some issues regarding data quality Another factor that might influence the overall data quality was the fact that the contributors had no previous OSM experience such as an active OSM community or available OSM wiki pages while the contributors also had little knowledge of the English language to assist them in steepening the learning curve On the positive side after five weeks the project had created an OSM community to continue the mapping project improved the awareness of local officials of the use of VGI and open data and also caught the attention of the private sector which can enhance OSM community efforts by providing resources while at the same time drawing more official attention to them
Main lessonsbull Building an OSM community from scratch might
be intensive and slow to begin with
bull Spatial data sets and mapping products might suffer in quality at least until a populous and active OSM community forms
bull Local tagging requirements might be missing from the overall OSM project or might be considered as outliers when it comes to normalizing the data set into a spatial product (eg shapefile import into a database schema etc)
bull Both governmental officials and private sector organizations recognize the value and potential of VGI and open data
5 Mapping schools and health facilities in Kathmandu Valley Nepal
Interaction type PublicGovernmentPublic
Trigger event No single event but increasing disasters around the world including the earthquake in Haiti inspired discussion about the safety of school and hospital buildings in Nepal
Domain Generic mapping of major points of interest and critical infrastructure as well as schools and health facilities
Organization Department of Education and Kathmandu Living Labs with support from World BankGFDRR
Actors Department of Education Kathmandu Living Labs World BankGFDRR Nepal Risk Reduction Consortium (NRRC) NSET
Data sets Aerial imagery from Bing and HIU lists of schools from government and health facilities from other sources Data sets on the road network and other points of interest with a focus on school and health facilities have been generated
Process Initial data about schools and hospitals were mapped using a variety of techniques and the results were presented to authorities and discussed
Feedback Interactive thematic map (for schools and hospitals) showing structural and non-structural attributes more detailed online map of Kathmandu Valley
Goal Collect and map exposure data for schoolscolleges and hospitals digitize building footprints build a robust OSM community
Side effects None so far
Contact point Nama Budhathoki namabudhathokigmailcom
Nepal is considered one of the countries most exposed to natural hazards and especially earthquakes The capital city of Kathmandu has experienced rapid urbanization in the last decades and is considered to be vulnerable to earthquakes as the majority of the houses do not meet earthquake safety requirements In Kathmandu local stakeholders have recognized the danger and have tried to be proactive by initiating an effort to create an OSM map of the city The aim is to provide a
43
critical resource for disaster risk mitigation and emergency planning
In 2012 the World Bankrsquos South Asia Region launched the Open Cities Project to create an asset and exposure database for urban areas and facilitate its use for urban planning and disaster resilience As part of this project Open Cities Kathmandu was started in November 2012 as a pilot initiative
The process was to first divide the Kathmandu Valley into zones each one consisting of several wards and assigned an OSM champion Using GPS paper field maps satellite imagery web and mobile technology exposure data of schoolscolleges and health facilities was then collected in the field These data were uploaded onto OSM using an in-house web application called WebDRI developed by Kathmandu Living Labs This was followed by a rigorous data validation process which ensured that data were accurate
The champions worked simultaneously towards building an OSM community in Nepal by delivering sensitization presentations and training other people at mapping parties This effectively took the project back to its direct recipients the community It also multiplied the number of ldquosurveyorsrdquo in the project because it produced new mappers and data providers whose contributions enriched map data and brought local knowledge of the exact locations of schoolshospitals in field
Mapping was done in multiple stages focusing on different geographical features at different times and regular validation was a part of the mapping process itself In November 2013 the GeoCenter of USAID organized a distant mapping party with the collaboration of George Washington University and in one evening 90 students digitized more than 15000 buildings in Kathmandu Open Cities Kathmandu has to date mapped over 130000 buildings and collected exposure data for 2256 educational and 350 health facilities
The outcome of the project has sparked a policy-level discussion about ensuring the safety of schools and health facilities in emergency situations This has also expanded to private schools while
previous discussions were limited to government schools Following the outcome of the project the Department of Survey Nepalrsquos authoritative mapping agency is now exploring ways to integrate VGI in their workflows Additionally the National Society for Earthquake Technology in Nepal has decided to share its own data sets with the public As part of the Open Cities program more than 1500 people received training on OSM procedures and a large number of presentations were delivered to universities in an effort to build a robust OSM community At the same time Kathmandu Living Labs is continuing the effort to expand the coverage of the map both within and beyond Kathmandu Valley as well as enhance the quality of the data
Main lessonsbull Being proactive is key to ensure that an area is
prepared for future natural disasters
bull A solid mapping background is needed for relief efforts following disaster Creating or updating an existing map is of great importance
bull A well-managed and coordinated effort to drum up public support can provide valuable input from both local and international contributors
bull As well as a short intensive mapping effort it is also vital to create a community that will continue the task to complete or update the maps
44
6 Informal settlement mapping Map Kibera Nairobi Kenya
The homepage of the project welcomes the visitors by stating that ldquoKibera in Nairobi Kenya was a blank spot on the map until November 2009 when young Kiberans created the first free and open digital map of their own communityrdquo The welcome message summarizes the main idea behind the project which is to map one of the biggest informal settlements of the world by putting marginalized communities on the map
Map Kibera was launched in 2009 by Mikel Maron and Erica Hagen with initial funding by Jumpstart International an NGO specializing in community-based mapping The first phase which lasted three weeks from October to December 2009 involved 13 young people who were trained to collect and edit GPS tracks OSM was used to create a dynamic and easily edited map and QGIS software was adopted to do further analysis and create specialty maps ARCGIS
Interaction type PublicGovernmentPublic
Trigger event -
Domain Generic mapping of the biggest informal urban settlement area and thematic mapping of security water sanitation health and education
Organization Map Kibera
Actors Map Kibera team CfK (Carolina for Kibera) GOAL USIP Indigo trust ATTI Habitat Global Giving Plan Kenya Hivos Unicef JumpStart International Ushahidi SODNET (Social Development Network) KCODA (Kibera Community Development Agenda)
Data sets GPS tracks open source and conventional software
Process Collecting GPS tracks and tracing them in the OSM platform after training workshops
Feedback Topographic and purpose-built maps for the management of supplies in health education security and water sanitation
Goal Map the unmapped Kibera and actively involve local people
Side effects -
Contact point Mikel Maron HOT mikel_maronyahoocom
a non-open source software and Tile Mill and other MapBox products were also used
The second phase of the project (February to August 2010) offered the opportunity for mappers to enhance points of interest such as water public toilets schools police stations and clinics It also included two other mini projects the Voice of Kibera and the Kibera News Network The first offered the opportunity to submit reports write articles and add breaking news with the aid of Wordpress blogging and Ushahidi software Work could be sent by SMS and published after approval by an editorial team The second is a video journalism initiative offering more locals the opportunity to participate ensuring the wider acceptance of the project and hence its longevity
Among the main successes is the projectrsquos acceptance by local government which embraced it from the beginning At the end of the project Map Kibera representatives presented the analysis to government officials The negotiation between the two sides had a positive impact for the community which became recognized as a real neighborhood and residents gained new technological knowledge
The project faced various challenges the primary being to educate residents in new technologies The voluntary participation model was unrealistic in Kibera Locals suffer great survival issues so a small daily compensation was given for their participation Residents also found it hard to understand the benefits they could gain through participation and the general potential impact of the project Finally NGOs found it difficult to cooperate and share information They had learned to work separately and competitively for a long time which meant that voluntary work was splintered off into small pieces for different purposes
Main lessonsbull Slum mapping can be achieved by young local
people relatively quickly
bull Basic topographic maps can be enhanced with essential thematic layers
bull A combination of open source and conventional software can facilitate VGI projects
bull Compensation may be needed to improve participation in locations where participants suffer great survival issues
bull Innovative methods such as SMS voice and video reporting can support the appeal of mapping projects
45
7 Mapping of South Sudan
After years of political instability South Sudan became a new nation on 9 July 2011 after its official independence Although South Sudan is expansive and the newest nation it is poorly mapped Maps are particularly important for the development of the infrastructure and economy of the country and the distribution of humanitarian aid
Google with the aid of World Bank UNOSAT and RCMRD recognized this need and started the project for the creation of better maps of South Sudan by supporting communities to map schools hospitals roads and more with Google Map Maker The project was launched with a series of events to disseminate
Interaction type PublicGovernmentPublic
Trigger event On 9 July 2011 South Sudan became Africarsquos 54th nation after its official independence Although it is the newest nation it is poorly mapped
Domain Generic mapping of a poorly mapped area and thematic maps of essential features like roads hospitals and schools
Organization Google NGOs along with the World Bank United Nations Institute for Training and Research (UNITAR) Operational Satellite Applications Programme (UNOSAT) and Regional Center for Mapping of Resources for Development (RCMRD)
Actors The Sudanese diaspora Google the World Bank UNOSAT and RCMRD
Data sets Updated satellite imagery covering 125000 km2 (40 percent of the UNrsquos priority areas) uploaded to Google Earth and Maps
Process Workshops and editing on Google Maps via Google Map Maker
Feedback Generic and thematic maps covering important points of interest such as schools hospitals and roads
Goal To engage and train the Sudanese diaspora and other volunteers worldwide to participate in Google Map Maker
Side effects Mapping the poorly mapped South Sudan so that the infrastructure and economy of the country could be developed and humanitarian aid provided to the local population
Contact point -
the purpose of the mapping and inspire and train participants The first event was in April 2011 at the World Bank headquarters in Washington DC with a satellite event in Nairobi at the same time The next event was in September 2011 held by the South Sudan National Bureau of Statistics in Juba
To aid their work updated satellite imagery of the region covering 125000 km2 (40 percent of the UNrsquos priority areas) was uploaded to Google Earth and Maps In the last event volunteers worked together and made hundreds of edits in less than four hours The process is simple citizens edit using available web tools and their local knowledge and after approval edits become visible to all Google users worldwide The mapping was used by the Satellite Sentinel Project a collaborative project focused on human rights violations and human security concerns in Sudan and involving Google the Enough Project Not On Our Watch UNITAR UNOSAT DigitalGlobe the Harvard Humanitarian Initiative and Trellon
Among the main factors for the projectrsquos success is not only the enthusiasm and inspiration of the Sudanese diaspora which encouraged them to convey the experience and knowledge to other people but also the interest that the local government showed in the project The projectrsquos approval by local government and its impact in decision making policies is noticeable Another innovation of the project is the principal role and contribution played by the Sudanese diaspora Through VGI projects local knowledge can be shared worldwide and from different parts of the world not only from the area of interest At the same time among the main weaknesses of the mapping is that local people were not actively involved The project lacked research in the field and did not use GPS or open source software although Googlersquos involvement guaranteed great participation levels
Main lessonsbull Crowdsourcing projects can be coordinated and
implemented from a distance
bull Great participation of volunteers and transmission of motivation to others are key factors in terms of participation in crowdsourcing applications
bull Inspiration for other projects and improved applications can be beneficial to areas of interest
bull Acceptance by local government as an opportunity for decision making policies and humanitarian aid can escalate the impacts of a VGI project
46
8 iCitizen mapping service delivery South Africa
In recent years South Africa has seen a surge in political protest against slow service delivery While the United Nations Human Development Index considers South Africa to be a middle-income country there is a large disparity in income distribution across the population Social unrest is an obvious consequence of poverty high levels of unemployment and service delivery backlogs
Within the context of these issues a new initiative has been launched which intends to improve the daily life of citizens by collecting crowdsourced reports of service issues and passing them to the relevant authorities for resolution The iCitizen project will give members of the public the ability to report on fundamental problems with basic infrastructure and services The researchers involved in the project intend to contact local municipalities to discuss the extent to which this project can be embedded within current initiatives around citizen monitoring and evaluation The main aim of the project is to give citizens an active voice A secondary research objective is to understand and identify the role of mobile phones in citizen-led monitoring and evaluation
Interaction type PublicGovernment
Trigger event -
Domain Generic mapping with focus on local infrastructure issues
Organization University of Witwatersrand LINK Centre
Actors LINK Centre
Data sets Multiple data sets per service delivery issue to be tracked
Process Collection of data points via mobile phones Adoption of different ways of geotagging photos in real time or via SMS orand email
Feedback Generic and purpose-built maps for disaster preparedness
Goal Reporting and solving fundamental problems with basic infrastructure and services
Side effects -
Contact point Dr Kiru Pillay University of the Witwatersrand kiru2010gmailcom
Members of the public will be able to report issues by forwarding geotagged photographs sending in locations via SMS or reporting issues via email The first iteration of iCitizen was built upon the Drupal open source content management system (CMS) As an enterprise CMS it provided a lot of services out of the box including membership management image upload taxonomy (category) management user commenting thorough user permissions field APIs (application programing interfaces) views templating and reporting and HTML5 theming capability Researchers were able to extend the core functionality to include mapping enabled through geolocation leaflet maps (using OpenStreetMap as the Map Tile server) and a voting API allowing users to verify incidents
The designers of the application will be extracting boundary data for South African provinces districts and local municipalities and exposing these on the online map using GeoJSON data This will automate the process of calculating the jurisdiction of any reported incidents A live reporting engine and online social tool will also allow for two-way communication between the web server (and its user base) and local municipalities and civil societies
The main difficulty relates to the acceptance of the project One university found validity in the concept but was unable to commit resources for the development of the application Going forward two difficulties are envisaged The first is acceptance of the validity of the generated data sets by local municipalities The second is acceptance of the use of mobile phone and applications by the public as an effective tool for voicing service delivery concerns Even though the penetration rate of mobile phones is fast approaching 100 percent of the adult population in South Africa the use of mobile applications and GIS-mapping tools of this nature is largely untested
Main lessonsbull Projects can be used for a variety of tasks at local
level not just that for which they were designed
bull Using a range of software programing languages and platforms can broaden a projectrsquos horizons
bull VGI applications face financial issues due to their technological nature and the resources of the organizations involved
bull Concerns from agencies about the quality of generated data sets and improving public adoption of mobile applications are common challenges
47
9 Skandobs Scandinavian predator tracking system Norway and Sweden
Skandobs was developed to to collect observations for lynx wolverine brown bear and wolf locations and population sizes driven by new legislation international conventions and directives Reliable observations help to inform management objectives including long-term conservation and population-level management Monitoring is complicated and expensive for many reasons including the
Interaction type PublicGovernment
Trigger event Policy requirements for wildlife monitoring in Scandinavia
Domain Species population observation and tracking
Organization Rovdata (an independent part of the Norwegian Institute for Nature Research (NINA)) and the Swedish Environmental Protection Agency (EPA)
Actors Rovdata EPA
Data sets -
Process Using either smartphone applications or the Skandobs website contributors can submit their observations Geographical data are required with each observation and anonymous submissions are not allowed All contributors who wish to see their contributions listed on the website and stored in the Skandobs database must register on the website Quality checks are performed by Skandobs staff
Feedback The number of observations in the database is updated on the website every 15 minutes A table provides summary information of the total number of observations for the current year and month League tables also show top contributors by individual and municipality
Goal To collect observations for lynx wolverine brown bear and wolf to increase knowledge about species populations in Scandinavia
Side effects Increasing expectations from NGOs the media and the public who want information on numbers and distribution of carnivore populations in their countries
Contact point -
geographical size of the area under observation but involving the public has been very successful
The Skandobs database is jointly maintained by two national agencies Norwayrsquos Rovdata and Swedenrsquos EPA Citizens can submit their observations at any time using iPhone or Android smartphone applications or through the website The addition of photographs and other information is encouraged The Skandobs database is made available for download via a search interface on the website A Google Maps-based visualisation tool is also available to allow map-based visualisation of the Skandobs database
User observations are subjected to internal validation and when this is completed they are assigned a validation status which appears in the list of observations Only rated observations are also added to Rovbase the primary database for national population monitoring data in Norway and Sweden The number of observations in the database is updated on the website every 15 minutes with tables summarizing the total number of observations plus totals for the year and month Observation totals are also provided for key species
There are concerns about the potential bias in the observational data For example because there is greater population density in southern Sweden there will be more observations than in northern Sweden This problem of the distribution of observationsobservers is a problem in citizen science and VGI more generally
Main lessonsbull Feedback can be provided to participants through
real-time updating summaries of the types and quantities of contributions
bull Nations can work together on VGI initiatives to meet policy requirements and reduce costs
bull VGI initiatives can work well in transboundary situations
bull Observational bias due to population distribution remains an inherent challenge in VGI
48
COoRdinate INformation on the Environment (Corine) is a European Commission supported program that aims to provide a land cover data set (known as CLC Corine Land Cover) for 39 European countries The CLC2006 project was coordinated by the European Environment Agency The image production for the land cover digitization was centrally coordinated by the EEA and the actual data production was undertaken by EEA member states to ldquobenefit from local knowledgerdquo The data integration of the national contributions was managed by the EEA and the European Topic Centre on Land Use and Spatial Information (ETC LUSI) As in previous CLC projects CLC2006 includes 44 land cover classes
As permitted under the release terms of CLC2006 the French OSM community imported the CLC2006 data set into the OSM database However only ~60 percent of the original data set was automatically imported which was for those areas where there was
Interaction type GovernmentPublicGovernment
Trigger event Change in the license policy of the Corine Land Cover 2006 data set
Domain Generic mapping (update of land coverenvironmental data sets)
Organization European Environment Agency (EEA)
Actors French OSM Community EEA
Data sets 44 land cover classes for France
Process CLC2006 data not overlapping existing OSM data have been imported (accounting for ~60 percent of the land) The CLC2006 typology has been adjusted to match OSM
Feedback -
Goal Update the OSM database with land cover information mainly in rural areas as the contribution in such areas is limited
Side effects A number of national OSM communities have followed the example and integrated CLC2006 Inconsistencies in levels of detail semantics and metadata between VGI and authoritative data sets have been revealed
Contact point pieren3gmailcom (OSM community member)
10 Corine Land Cover 2006 in OpenStreetMap France
no OSM data The rest was not imported because it was in conflict with existing land cover polygons created manually by the OSM contributors This was deemed more efficient as the OSM community realized that land cover polygons created by OSM contributors were more accurate than the CLC2006 data set Moreover as OSM contributors now have access to high-resolution Bing aerial imagery their data should be even more accurate than the CLC which is based on IMAGE2006
The integration of CLC2006 to the OSM data sets has instantly enriched the latter with data regarding ~60 percent of the French territory Land cover classification based on imagery interpretation needs considerably more expertise than road classification and in general attracts fewer contributors that the ldquohigh-profilerdquo urban fabrics However in this case the land cover parcels imported serve as first-class photo interpretation keys to aid the OSM community The French example has paved the way and built the expertise for more countries to follow this practice successfully (nine more countries have imported their national CLC2006 data)
The integration of the French CLC2006 and OSM data sets has brought to light a number of issues characteristic of the co-existence of VGI and authoritative data First importing authoritative data into a VGI database injects both the positive and negative endogenous issues such as the failure to keep the data up to date For example CLC2006 data set was imported in 2009 which means the data were already two years old (the project for France finished in 2007) However the authoritative nature of CLC2006 might give OSM users the false impression that such data sets are more accurate or more recent than they actually are diverting their attention to other as yet uncovered areas Second it should be expected that there will be semantic inconsistencies For example the CLC2006 has fewer land cover classes than those used in OSM while some CLC2006 classes are too vague for OSM and have not therefore been converted and imported to OSM Third it must also be expected that there will be inconsistencies regarding the level of detail In the case of CLC2006 the features captured were at 1100000 (country-level) while OSM is a street-level data set
49
Main lessonsbull The existence of active public communities
facilitates the take up of opportunities to work on open source data
bull Data integration should not be considered easy or straightforward This should also be made clear to volunteers as any integration initiative might mean large workloads with moderate results Considerable expertise among volunteers is required for success
bull Successful community-led efforts can be replicated by others now experience in solving problems has been built and often shared
bull Multiple data sets often have semantic inconsistencies and temporal accuracy should be addressed during integration
FixMyStreet is a web-based application launched in February 2007 which enables the public to report local problems (eg abandoned vehicles graffiti unlit lampposts potholes litter) Reporting is facilitated by the use of Ordnance Survey maps as a backdrop for users to mark the exact location of the problem Issues reported by users are propagated to the relevant local authorities by email Users reporting a problem are contacted by FixMyStreet after four weeks to check if the issue has been resolved
FixMyStreet was built and administered by mySociety a social enterprise (business with social aims) and is free to the public However there is also a FixMyStreet for Councils application which is a paid version adapted to local authority needs for handling the problem reports
FixMyStreet has been one of the most popular web applications that enable the public to voice their
Interaction type PublicGovernment
Trigger event -
Domain Local authoritymunicipality maintenance
Organization mySociety (originally developed with central government funding)
Data sets Government data sets of postcodes basemap local authority boundaries contact details and email addresses of relevant personnel in local authorities
Process A problem is indicated on a website using its location postcode and an email alerts the local authority The authority can respond to the complaint on the website
Feedback Update to participants provided through the website and in email that can be triggered when a person registers
Goal Provide online tool for residents to report problems to their local authority and follow up the exchange with the public body in an open way
Side effects Application source code released under the GNU Affero GPL software license and has been used in other countries
Contact point -
11 FixMyStreet for municipality maintenance information UK
50
concerns regarding local issues Through a simple process the website has succeeded in engaging people and opened a channel for public input into problem solving Moreover it has resulted in public value creation both direct (ie social gain that has immediate relationship with the user that reports the problem and hisher neighbors) and indirect (ie social gain that is dispersed to the entire community) The difference between FixMyStreet and previous mechanisms for reporting local problems is the public aspect instead of the report being recorded on a local authority system it is done in the open and other residents can see the issues reported and how the local authority dealt with them
However there are some issues of concern especially when it comes to the data created the cycle of public data creation propagation consumption and diffusion back to the public creates inconsistencies More specifically councils themselves have an independent channel for local problem reporting and thus the launch of FixMyStreet created a parallel channel that often simply duplicates problems already known to the council or in the worst case confuses the authorities as descriptions of the same problem appear slightly different Additionally when the council fixes the problem (which might take more than four weeks) it is not able to report progress on the issue within the application This is the driving force behind FixMyStreet for Councils but as this is a paid version few local authorities have adopted it so far
In analyzing the success of FixMyStreet it is also important to note the overall context first in UK there are digital savvy members of the public which makes it easy for users to participate and second in most Western societies the core social principles on which FixMyStreet is based are shared and voicing criticism of the government is accepted practice which may not be the case in other countries (see case study 8)
Main lessonsbull Given technological advances it should be
expected that the public will find their way to web applications of this kind
bull Authorities should develop processes and methods to integrate data from the public in order to avoid issues of data duplication confusion and misunderstandings
bull Public VGI initiatives that address community problems might overshadow existing authoritative structures Flexibility in embracing such initiatives might minimize future problems for local authorities and maximize impact on society
bull Successful examples of public participation can increase pressure on authorities for data sharing under flexible license schemes
FixmyStreet (uK) is an example of participation in municipal maintenance
my
So
CIe
Ty
51
12 FINTAN vernacular placenames project Ordnance Survey and Maritime and Coastguard Agency UK
Two of the most prominent UK governmental agencies the HM Coastguard of the Maritime and Coastguard Agency responsible for the initiation and coordination of all civilian maritime search and rescue operations and Ordnance Survey the UKrsquos national mapping agency have joined forces to create an up-to-date data set of vernacular placenames Vernacular placenames are those in common usage irrespective of whether they are official names or not
There has been an increasing recognition by the OS of the need to capture richer and more detailed vernacular placenames At the same time the
UK Coastguard were in the process of closing approximately half of their Coastguard centers and recognized that a lot of local knowledge could be lost In that context both sides recognized the mutual benefit of capturing vernacular coastal placenames using the knowledge of the coastguards (professional crowdsourcing) and local coastguard volunteers (local people who assist in coastguard operations)
An updated database of vernacular placenames is a priceless tool when it comes to providing swift response to life-threatening situations One of the most important parts of the response process is to understand the position of the person in difficulty and often official mapping products might not provide all the necessary information It is very common for people in need to use local names that do not exist in official gazetteers
FINTAN is an OS application that enables the crowdsourcing of vernacular local names of coastal areas FINTAN includes topographic mapping on a wide range of scales provided to the Coastguard to enable the recording of placenames Additionally address and placename gazetteers containing current known placenames have been used Special care has been taken to allow other emergency services that use different reference systems to work to a common geography and terminology
Through FINTAN HM Coastguard and their volunteers can enter locate and classify vernacular placenames of features such as beaches or rocks to update the existing database Personal connection with participants has been helpful in encouraging participation facilitated by coastguards inputting data from their local volunteers and the specialist application has been targeted at their specific interest (as opposed to more generic approaches like OSM) The future of FINTAN is promising as there are plans to open the application to other stakeholders such as sailing clubs and thus harvest more local knowledge
On the negative side tensions in areas where English is not the first language have been observed as some groups are unwilling to report English names even when these are in common usage even by locals
Interaction type GovernmentPublicGovernment
Trigger event Increasing recognition of the use of vernacular placenames and their importance to emergency services
Domain Emergency operations such as search and rescue
Organization Ordnance Survey (OS) and Maritime and Coastguard Agency (MCA)
Actors OS (research staff data capture staff) MCA (coastguards) volunteer coastguards
Data sets OS topographic maps address and placename gazetteers containing current known placenames
Process FINTAN application developed by OS to enable MCA and their volunteers to enter locate and classify vernacular placenames OS then assessed the quality of the data
Feedback Many new vernacular placenames that are assessed and quality controlled by OS
Goal Improve ability of the Coastguard to locate people when contacted in emergency situations improve OS database of placenames for use in new and existing products
Side effects Tensions in areas where English is not the first language - some groups unwilling to report English names even when in common usage even by locals
Contact point Glen Hart Ordnance Survey glenhartordnancesurveycouk
52
Main lessonsbull Crowdsourcing can be a valuable tool when it
comes to existing knowledge preservation
bull Professional crowdsourcing might be equally or even more productive compared to general crowdsourcing practices when collecting data for specific areas or subjects
bull Local and regional interests and perceptions might introduce biases to the data collected
bull Two-way data flow can be a win-win situation for all involved parties as well as the general public and is facilitated by shared interests and benefits
13 Towns Conquer gamification and Instituto Geograacutefico Nacional toponyms database Spain
The Towns Conquer application was developed when the research team were awarded a small funding prize from a joint funding venture between AGILE and EuroSDR This funding allowed the support of one person to work in the university in collaboration with a nominated national mapping agency The aim of this project was the validation of a toponyms database provided by the Spanish Instituto
Interaction type PublicGovernment
Trigger event Funding opportunity from AGILE and EuroSDR project on Crowdsourcing in National Mapping 2013
Domain Validation of a national toponyms database
Organization Universities (University of Nottingham UK and Universitat Jaume I of Castelloacuten Spain) ESRI Europe (sponsor) Instituto Geograacutefico Nacional (IGN) Spain
Actors IGN University of Nottingham UK and Universitat Jaume I of Castelloacuten Spain
Data sets IGN national toponyms database of Spain
Process Users provide updates to the database while playing a game for rewards contributions are checked by the national mapping agency before being incorporated into the national database
Feedback Users played the game to gain points Points were maintained in a league table format and when a user gained enough points they became the mayor of that particular region The more validations the user provided the more points they gained
Goal Volunteer validation of a national toponyms database In Spain it has taken over ten years to implement a model to standardize the nomenclature of municipalities yet today there are still conflicts with the names of some places especially in regions with two languages
Side effects Validated gamification techniques for public update and management of important national databases
Contact point Dr Joaquiacuten Huerta Universidad Jaume I Castelloacuten Spain huertaujies
53
Geograacutefico Nacional with 136454 entities requiring validation The public is involved through mobile and web-based gamification techniques which are used to persuade users to contribute their amendments to the given toponyms database The goal is for citizens to amend well-known placenames while playing a game and using their knowledge of their local area or other areasregions in Spain
An Android-based game was developed which was linked to a web-map service at IGN This allowed IGN Spain to deliver the toponyms database on suitable basemaps for the mobile application Users signed up for free There were some prizes at the end of the game (with a time limit on the number of months) for the citizens who had gained the most points (conquered the most placenames) during this time Placenames submitted to IGN via the gamification software were checked by an IGN official before being submitted and updated in the database
This funding allowed the NMA to test out crowdsourcing and gamification as a means of updating a national database In Spain it has taken over 10 years to implement a model to standardize the nomenclature of municipalities yet today there are still conflicts with the names of some places especially in regions with two languages
This project did highlight that gamification techniques (when properly designed and thought out) could provide a very good platform from which bodies like IGN could involve the public in updating and managing important national databases The game also provided the mechanism to motivate users to participate
Main lessonsbull Funding can drive innovative VGI projects and
instigate new modes of engagement
bull Links between government agencies and research centers can generate the resources required for VGI projects
bull Gamification can be a successful way of engaging the public in VGI projects
bull Data quality issues can be addressed through checking processes done by the official organization
14 National Biodiversity Data Centre Ireland
The National Biodiversity Data Centre initiated this project to leverage the potential of outreach groups and the general public for data survey and observation This widens the base from which observational biodiversity data may be obtained in Ireland The NBDC also launched this project with an aim to initiate a stronger engagement of non-professional scientists and heighten the understanding of biodiversity related matters in the general population in Ireland There is a good tradition of observational work being performed by volunteer community groups in Ireland
All of the systems and software are housed at NBDC Contributors are also given assistance in working out grid references for their records observations
Interaction type PublicGovernmentPublic
Trigger event -
Domain Update of national biodiversity database
Organization National Biodiversity Data Centre (NBDC) Ireland
Actors NBDC and the Irish biodiversity community (in particular university researchers)
Data sets Existing NBDC database
Process Users enter their observations through the appropriate HTML forms on the NBDC website Observational data is checked internally at NBDC then made available for access and visualisation on the online maps and charts Data is submitted by email for large and possibly incorrectly formatted observations
Feedback Data is quickly checked and made available for access and visualisation on an online map Those who submit their data to the system can access this data in the future
Goal Heighten the understanding of biodiversity in Ireland and widen the base from which observational data may be obtained
Side effects -
Contact point Dr Liam Lysaght National Biodiversity Data Centre llysaghtbiodiversityirelandie
54
and sightings The system provides online forms for recording observations but these can also be submitted in bulk via email if the contributor has collected a lot of data
Since June 2012 there have been over 61000 records submitted validated and stored in the NBDC databases Approximately 1600 records are submitted per month NBDC also makes these data available to the Global Biodiversity Information Facility (GBIF) a network of 80 participants worldwide working on an open biodiversity data infrastructure funded by governments It allows anyone anywhere to access data about all types of life on earth shared across national boundaries via the Internet The NBDC is Irelandrsquos GBIF node and contributes Irish data to the more than 400 million biodiversity records mobilized through the GBIF data portal
For the submission of observational data there are species and site forms with the latter allowing a more detailed recording of biodiversity information The data from these forms and collections are extracted and merged with other data sets in the NBDC for insertion into their spatial databases Data is quickly checked and made available for access and visualisation on an online map Those who submit their data to the system can access this data in the future
When there is particular need for observation or data collection for a specific species there is a call for ldquospecies in focusrdquo where the importance reasoning and biodiversity importance of a specific species is outlined The NBDC ensures that the contributors have their efforts well recognized and advertised online For example there is an annual distinguished recorder award presented to the person who has made an outstanding contribution This is very important in recognizing the work of the volunteers who submit data to initiatives like this Workshops are also held on a frequent basis which report on the progress of this project the types of uses that this data is being put to and how the project can be sustained and improved Events such as Bioblitz (held annually) involve the general public in biodiversity data collection events which have an aspect of fun and competition
Main lessonsbull Feedback for contributors is very important
and can be established in many forms For example personal contact with contributors publishing information on the website (ldquowe have x records this monthrdquo) awards for distinguished contributors
bull Providing several options for users to contribute their biodiversity observations improves accessibility for different users
bull Allowing contributors to provide as much (or as little) information as they have available means there can be great diversity in the resolution of data provided requiring manual and automated checking controls
55
15 Haiti disaster response
Haiti was dramatically affected after a 70 magnitude earthquake hit the capital city of Port-au-Prince on 12 January 2010 Death toll estimates range from 100000 to 200000 More than 250000 residents were injured and more than 30000 buildings collapsed or were severely damaged When the magnitude of the disaster became clear the main issue for those responding to the disaster was that the only available spatial data were poor and last updated in 1960s The local mapping agency collapsed in the earthquake with the loss of most of the skilled employees An updated map was urgently needed for the distribution of supplies identification of collapsed buildings damaged infrastructure and medical stations
The Haiti disaster response is one of the successful examples of geographic information being made open by official partners enhanced by public volunteers and returned to government for action (although the government was reluctant about the
Interaction type PublicGovernmentPublic
Trigger event A natural disaster (earthquake) and humanitarian crisis
Domain Generic mapping (topographic maps of the area) and purpose-built maps (disaster relief management)
Organization HOT
Actors United Nations NGOs National Haitian Mapping Agency National Center of Spatial Information Haitian civil society
Data sets Historic maps CIA maps high-resolution imagery from Yahoo paper maps and GPS tracks
Process Tracing in OSM platform from different data sources and collecting GPS tracks
Feedback Topographic and purpose-built maps for the management of supplies of medicine and food and location of settlements
Goal Facilitate disaster response management
Side effects The data sets created have not been used by the national mapping agency but by international aid organizations (UN USAID)
Contact point Mikel Maron HOT mikel_maronyahoocom
involvement of volunteers) The first imagery was loaded on the OSM platform in 48 hours Sixty people were trained and more that 700 contributed to the mapping among them people from UN agencies NGOs National Haitian Mapping Agency National Center of Spatial Information (CNIGS) and Haitian civil society Historic maps CIA maps and high-resolution imagery from Yahoo were first used for tracing in OSM to improve the basic maps Volunteers with paper maps and GPS completed the second phase of tracing The effort led to the PDNA (Post Disaster Needs Assessment) the result of the analysis of satellite and aerial imagery by multiple sources in which more than 30000 damaged infrastructures were identified and classified According to HOT 600 volunteers added spatial information to OSM in a month and the result was used as a default basemap for responding organizations and the Haitian government
The main reasons for its success can be focused on four main factors time cost great participation of volunteers and official trust The sensitization of the public to the Haitian crisis led to a great participation of volunteers and immediate mobilization worldwide The contribution of NGOs and other official partners and the release of conventional data sets as reference maps for tracing without license restrictions were vital to success Government support was inevitable due to the critical circumstances and limited resources
Although the project is characterized as successful there were a few weaknesses On the one hand all the responding organizations lacked experience and awareness of the operational norms in humanitarian response which constitute an operational framework for the accountability of different sources Deficiency of coordination led to the duplication of data The national mapping agency CNIGS also never really engaged with OSM although official data were given supportively at the beginning of the project
Main lessonsbull This was the first crowdsourced mapping exercise
for humanitarian reasons and shows its successful use in reacting to disaster
bull An integrated methodology of this kind follows four steps spatial data contributed by official providers supplemented with GPS tracks
56
integrated into OSM and updated by a great number of volunteers from each part of the world
bull Time cost and official trust of data by NGOs and other official partners are key to success
bull Lack of coordination and experience between different actors can lead to duplication of data and waste of resources
bull Differentiation between conventional and governmental data in terms of engagement to the project did not prevent success
16 Mapping for Natural Resources Canada
National mapping agencies are responsible for providing up-to-date topographic maps and a range of spatial products to the public and private sector The role of the Mapping Information Branch at Natural Resources Canada is to provide accurate geographic information of the landmass at the scale of 150000 However this translates to regularly covering an area of 10 million km2 divided into 13200 map sheets so keeping geographic information up to date is a challenge
The collaboration with the OSM community is based mainly on two factors i) a proven inability to keep national data up to date and ii) a willingness to trust OSM VGI data The Canadian authorities are also well organized and equipped to implement standard processes of data collection change detection quality control and assurance This facilitates the integration of the two different data sets
Interaction type GovernmentPublicGovernment
Trigger event The proven inability of the NMA to keep data sets up to date along with the familiarisation of its personnel with OSM data quality and processes
Domain Generic mapping (update of national topographic database)
Organization Mapping Information Branch (MIB) at Natural Resources Canada (NRCan)
Actors OSM community MIB NRCan
Data sets Canvec (mainly the road network)
Process NRCan releases its database into osm format The data is imported into OSM and updatedmodified by the OSM community NRCan regularly compares OSM data sets with its own as a change detection mechanism to keep its database up to date
Feedback Change detection data sets that have been verified by NMA employees
Goal Keep national databases up to date
Side effects OSM data cannot directly be used by the authorities due to IPR and licensing issues
Contact point -
57
The process was enabled the Centre for Topographic Information in Sherbrooke (CTIS) release of Canvec (the digital topographic map of Canada) in osm format (the native OSM format) This allowed the Canadian authoritative data to be integrated into OSM and gave the OSM community the opportunity to interact with it (ie by completing correcting or updating) The OSM database is regularly compared with the Canvec data to pinpoint the differences Any differences are treated as potential changes and are verified using the authoritative channel in the field Verified changes are propagated to the Canvec database
Leveraging the OSM crowdsourcing mechanism means the Canadian authorities have developed a much needed change detection process which helps them concentrate resources on potential changes Challenges include the compatibility of the two data sets (in terms of semantic and attribution differences) the lack of metadata for OSM data and the differences in coverage (OSM contributions are concentrated mainly in urban areas) These challenges stem from the differences in the two data generating processes (ie the bottom-up informal OSM process compared to the top-down authoritative NMA procedures) and still need to be addressed Moreover there is a conflict between the license and use terms of OSM data and the IPR of Canadian authorities that needs to be resolved
Main lessonsbull The need for other sources of geographic data sets
such as VGI can be generated when authorities are falling short of their targets
bull VGI data sets can be used by authoritative and governmental bodies to supplement or facilitate their standard operational procedures
bull Differences in structure and operation mean that updates to geographic information do not move freely between the two systems
bull Connectivity between the two different data sets is limited by different terms of use and licenses
17 Boston StreetBump US
Bostonrsquos Mayorrsquos Office of New Urban Mechanics (MONUM) pilots experiments that offer the potential to improve the quality of city services New technology ndash from smartphones to GPS ndash and a resurgent spirit of civic engagement have created increased opportunities for closer connection and communication between the city government and its citizens Partnering frequently with the Mayorrsquos Constituent Service Office MONUM is piloting projects that leverage this new technology and civic spirit to deliver services that are more personal and citizen driven
Using the motion-sensing capabilities of smartphones volunteers who download Bostonrsquos StreetBump application automatically send
Interaction type PublicGovernment
Trigger event Smartphone technologies and resurgent civic engagement
Domain Public contribution to urban services reports database
Organization Mayorrsquos office City of Boston
Actors The City of Boston Roads and Public Infrastructure Division
Data sets -
Process Using the accelerometer and GPS devices on smartphones users with the StreetBump application automatically report ldquobumprdquo or pothole information to the City of Boston These reports are collected in a database The Roads and Public Infrastructure Division carefully monitor these reports If a specific area receives many reports an engineer will physically examine that location
Feedback Users gain points (ldquostreet credrdquo) for each pothole they assist in reporting which is subsequently fixed or repaired by the city engineers
Goal Overcome the manual antiquated method of reporting potholes from public complaints or manual survey by city inspectors
Side effects The City of Boston uses this information to plan long-term investments in road and street infrastructure repair upgrade and construction
Contact point -
58
information to the city about the condition of the streets they are driving on When their cars hit a potholemdashor a pothole-to-bemdashtheir phone sends the accelerometer data to a server application which combines the information from many other phones to pinpoint problem areas on the streets If three or more bumps occur at the same location the City of Boston will physically inspect this obstacle and assign it to a queue for short-term repair or record its location to assist with longer-term repair planning
There are some problems around the reporting of ldquofalse positivesrdquo The use of phone accelerometers means that other vibrations feltabsorbed by the phone can be incorrectly calculated as a pothole or bump in the road surface Users are encouraged to ensure that the phone is stationary inside the vehicle with horizontal positioning of the device likely to offer more accurate observations according to the help documentation However these ldquofalse positivesrdquo are reviewed manually internally Unless there are multiple reports of a bump or pothole problem in the vicinity of a specific location it will not be physically investigated by city engineers Users can contact a specific hotline number to manually report a problem In addition to the passive reporting of the accelerometer GPS data users can also submit geolocated photographs of the problematic street segment
Main lessonsbull VGI can be used to address urban service
issues such as problems with roads and street infrastructure
bull ldquoFalse positivesrdquo in reports can be effectively handled by applying a limit to the number of reports which are required before action is taken by the government agency
bull The types of devices and their hardware capabilities must be considered in the planning in using VGI Some technologies can be unreliable over-sensitive or unsuited to particular applications
18 Open data initiative New York City US
In September 2013 New York City released over 200 government data sets to the public as part of a broad open data initiative to ldquoimprove the accessibility transparency and accountability of City governmentrdquo Using the web-platform Socrata the data is made available for download or through APIs (application programing interfaces) that allow software developers to construct mobile and web-based applications that incorporate this information This data release continues an aggressive open data push by the city government that began in 2011 New York Cityrsquos open data law signed by Mayor Bloomberg in March 2012 mandates that all city agencies ldquosystematically categorize and make accessible in ldquoopenrdquo formats all public data sets at no chargerdquo before 2018 To date over 1100 data sets have been made available on the cityrsquos open data portal and numerous applications have been built that address issues ranging from transportation to food safety and the environment
In partnership with the Department of Information Technology and Telecommunications the members of the local OSM community have begun to import city building footprint and address point data sets into the OSM database These critical data sets which are necessary to support a wide variety of data analysis and visualization projects can be difficult and expensive to keep up to date in a city as large and dynamic as New York Thanks to software developed
Interaction type GovernmentPublicGovernment
Trigger event Adoption of open data policy
Domain Local authority
Organization NYC GIS Department and Department of Information Technology and Telecommunications (DoITT)
Actors NYC OSM community NYC government private sector
Data sets Building footprint addresses
Process Data import into OSM and public maintenance in OSM platform
Feedback Daily changes
Goal Leverage volunteers to help keep authoritative data current
Contact point Alex Barth MapBox alexmapboxcom
59
by the company Mapbox the New York City GIS department now receives daily emails detailing changes to OSM building or address information These emails allow the GIS team to quickly assess updates in OSM to identify where new construction or other changes in the city may necessitate updates to the authoritative city data set
Upon completion of the import of the city data into OSM a feedback loop between the city and the volunteer OSM community allows both the government and the public to work together to create and make use of up-to-date and high-quality spatial data Importing large and detailed data sets like addresses and buildings is a complex process that requires technical resources significant labor and solid coordination between the OSM community and others involved In this case the information released by DoITT was up to date and of high quality but the same cannot be said of all municipal data sets It should also be noted that DoITT has expressed interest in incorporating OSM into other parts of their data management practices but have so far been unable to due to the conflict between OSMrsquos share-alike license and the public domain license required by NYC open data mandates There has also been a great deal of communication between the city government the OSM community and the people working on the import which is critical to the success of these kinds of efforts It will be important and useful to revisit this project in the future in order to learn more but so far it provides an excellent example of cooperation between local government and the volunteer OSM community around open data
Main lessonsbull Releasing government data sets freely into the
public domains means citizens can download and create their own applications
bull VGI communities like those of OSM can keep government data sets up to date even in large dynamic cities
bull Cooperation between VGI communities and relevant government departments allows them to work together to create and make use of up-to-date and high-quality spatial data
bull VGI communities and government departments can bring technical resources significant labor and solid coordination
bull Municipal data sets even when of high quality need to be maintained in order to stay accurate This can be achieved effectively and at lower cost than via traditional practices through the cooperation of VGI communities and government departments
60
19 Imagery to the Crowd State Department Humanitarian Information Unit US
As shown in Haiti (see case study 15) facilitating the access of volunteer communities to high-quality aerial and satellite imagery can have dramatic results However such imagery is often prohibitively expensive or only available under licenses that would prevent digitization by the public With this in mind the US State Departmentrsquos Humanitarian Information Unit launched a new initiative in 2012 called ldquoImagery to the Crowdrdquo This program makes high-resolution imagery purchased by the US Government from providers like Digital Globe accessible to humanitarian organizations and the volunteer communities that support them Since its inception Imagery to the Crowd has facilitated the digitization of basic infrastructure data into OSM in eight countries to support humanitarian response or disaster risk reduction
In the recent 2013 Typhoon Haiyan disaster in the Philippines Imagery to the Crowd published images for Tacloban Ormoc Northern Cebu and Carles This imagery supported a massive volunteer effort of over 1600 mappers from the OSM community coordinated by the HOT who contributed nearly five
Interaction type GovernmentPublicGovernment
Trigger event Adoption of new policy (the ldquoImagery to the Crowdrdquo program)
Domain Generic mapping and purpose-built maps for humanitarian relief programs
Organization HIU State Departmentrsquos Imagery to the Crowd program
Actors HIU HOT
Data sets Satellite imagery
Process Manual digitization of roads buildings and other features
Feedback Access to vector OSM data for local and international humanitarian organizations
Goal Leverage volunteers to create OSM data to support efficient management of disaster relief efforts
Contact point Josh Campbell State Department HIU CampbellJS3stategov
million changes to the map These changes provided detailed information on the location and extents of pre-event infrastructure as well as preliminary damage assessment The OSM data created through these efforts was in turn used by a number of actors in the response including UNOCHA MapAction the World Bank and the American Red Cross
Another recent Imagery to the Crowd project implemented in partnership with the Global Facility for Disaster Reduction and Recovery and USAID recently organized volunteers in Nepal the United States Germany and the United Kingdom to digitize roads and building footprints in the Kathmandu Valley of Nepal Kathmandu is one of the most seismically at-risk cities in the world and the data created through this program will help inform an earthquake retrofitting program led by the government of Nepal and disaster response planning by USAID (see also case study 5)
These examples from the Imagery to the Crowd project demonstrate that the release of US government owned imagery to volunteer communities has resulted in the creation of valuable spatial data which is in turn accessible to governments and international agencies Technical and policy efforts are underway to increase the speed at which imagery can be released and to standardize and improve the process but this new initiative has already achieved demonstrable results In cases like USAIDrsquos work in Nepal this becomes a full-loop example where a US government agency makes direct use of the data created as a result of the imagery release In other instances the users are UN agencies or not-for-profit organizations working towards humanitarian ends
Main lessonsbull Making government-owned high-resolution
imagery accessible to humanitarian organizations and the volunteer communities can support them in their work worldwide
bull Technical and policy efforts are required to increase the speed at which imagery can be released and to standardize and improve the process
bull Such projects demonstrate successful full-loop and half-loop feedback projects
61
20 OpenStreetMap community of practice US Census Bureau
At the moment the US Census Bureau has no formal interaction with OSM However a small number of internal champions have been working to build a community of mapping enthusiasts to create support for the incorporation of OSM into the Bureaursquos work
One of the leading advocates for the use of volunteered geographic information within the US Census Bureaursquos programs says that there a number of ways in which the platform could be useful Data collection is expensive and OSM could offer a way for the Census to partner with citizens to help identify areas where change has occurred and perhaps collect basic location data about the neighborhoods where they live OSM could also be used as a tool for helping Census professionals better understand issues that Census field representatives encounter in their work For example by participating in OSM they would have to engage with ambiguity in tagging systems as well as better understand the geography of the areas to which they are assigned
In order to help grow the OSM community within the Census Bureau advocates held mapping
Interaction type PublicGovernmentPublic
Trigger event Internal champion
Domain Generic mapping
Organization United States Census Bureau
Actors United States Census Bureau
Data sets OSM
Process Mapping events and outreach within the Bureau
Feedback -
Goal To build a group of mappers and supporters of OSM within the US Census Bureau
Side effects -
Contact point Steven Johnson OSM US
Suitland Federal Center - Google maps and openStreetmap comparison
Go
oG
Le o
Pen
ST
Ree
Tm
AP
Co
nT
RIB
uTo
RS
62
events during lunch hours every other week during June and July of 2013 Participants were given basic information about the OSM platform and community taught how to map using OSM tools and sent out in small teams to survey the area around the Suitland Federal Center where the Census Bureau offices are located In addition advocates have given a number of internal presentations about OSM and its applicability to the Censusrsquos mission and brought their colleagues to OSM conferences and meetups
OSM champions face a number of challenges in promoting adoption of OSM within the Census Bureau Many who have traditional GIS backgrounds have difficulty accepting OSMrsquos open source model of data production In government data sets there is a notion that databases are authoritative OSM offers no such assurances The OSM community has no central point of contact to provide support Thus learning how to engage with the distributed OSM community would be an important part of any adoption Finally the census could potentially use OSM as a data source for TIGERLine products which describe fundamental features such as transportation networks natural features and geographic boundaries but are unable to do so because the Census would need to release this into the public domain which is disallowed by the current license
Main lessonsbull Building support within government
organizations for VGI requires time and willingness to learn different models of creating validating and using data
bull Hands-on exposure to OSM tools is a useful way of helping individuals understand the platform and its potential value
21 Crowdsourcing The National Map National Map Corps US
VGI is not new to the USGS but past efforts have been hampered by available technologies Over the last two decades the USGS has sponsored various forms of volunteer map data collection projects including the Earth Science Corps where volunteers annotated topographic paper maps the collection of GPS points using handheld GPS devices and finally web-based technology to input data in 2006 In spite of these efforts and as valuable as the updates were technology could not keep pace with decreasing USGS resources and the VGI effort was suspended in 2008 Today improved technology social media and ever decreasing resources have once again made crowdsourcing an attractive option
Interaction type PublicGovernmentPublic
Trigger event The need to update the national map and other national map databases
Domain Generic mapping
Organization US Geological Survey (USGS) National Geospatial Program
Actors Local state and federal agencies including the USGS
Data sets USDA National Aerial Imagery Program (NAIP) imagery National Map base layers ESRI world imagery Alaska community photos the national structures database and USTopo
Process Using crowdsourcing techniques the USGSrsquos National Map Corps encourages public volunteers to collect and edit data about human-made structures to provide accurate and authoritative spatial map data for the USGS National Geospatial Programrsquos web-based The National Map
Feedback Updated structures are contributed in real-time Databases are downloaded on a nightly basis Data collected is in the public domain and freely downloadable
Goal Maximize limited resources while continuing to support the National Geospatial Program by leveraging volunteers with local knowledge to update The National Map and USTopo
Side effects -
Contact point Elizabeth McCartney emccartneyusgsgov or nationalmapcorpsusgsgov
63
After several pilot projects to determine the viability of bringing back the volunteer mapping program The National Map Corps volunteers are successfully editing ten different structure types in all 50 states including schools hospitals post offices police stations and other important public buildings Using National Agricultural Imagery Program imagery as the primary base layer volunteers collect and improve data by adding new features removing obsolete points and correcting existing data Edits are contributed through a web-based mapping platform built using open source technology developed by OpenStreetMap Points edited are incorporated into The National Map and ultimately become part of USTopo
In order to address quality concerns an analysis of a pilot project was conducted over the state of Colorado For all structure feature types volunteer involvement was found to improve positional accuracy attribute accuracy and reduce errors of omission The Colorado pilot demonstrated that volunteer edits improve baseline structures data that further review by advanced volunteers willing to provide peer review improves the data further and that sample-based inspection by USGS personnel can monitor these processes
Successful crowdsourcing is not without challenges some of which include volunteer recruitment volunteer engagement and participant motivation The National Map Corps endeavors to meet these challenges using gamification techniques and a mixture of traditional and social media Gamification includes easy on-ramping virtual recognition badges friending map challenges social
media interaction and a tiered editing approach Using these techniques has been successful The National Map Corps continues to see substantial increases in the number of volunteers and volunteer contributions to The National Map
Other challenges continue to exist and include organizational resistance to accepting data from volunteers as being ldquogood enoughrdquo to populate national databases and working through issues for which there is no well-established policy regarding government accepting data from citizens One example is the requirement to obtain approval for conducting a ldquosurveyrdquo from the Office of Management and Budget as part of the Paperwork Reduction Act even though the project is not really conducting a ldquosurveyrdquo
Main lessonsbull Adoption of challenging techniques such as
gamification has been successful and attracts volunteer interest
bull Evaluation of the quality indicated that the participation improves accuracy and reduces errors
bull Organizational resistance to accepting data from volunteers is one of the major challenges for VGI projects of this kind
bull Key factors to successful crowdsourcing include building on past experience leveraging existing technology and having the support of key individuals within the organization
uS national map Corps editor
eLIz
AB
eT
h m
CC
AR
Tn
ey
uS
GS
64
22 US Geological Survey ldquoDid you feel itrdquo
The USGSrsquos Community Internet Intensity Map (more commonly referred to as ldquoDid you feel itrdquo) is a website that automatically maps reports from citizens about their perception of recent seismic activity in their area If a member of the public feels a tremor they can visit the DYFI website and report their location and their estimate of the intensity of the tremors they have just felt In combination with a large network of sensors which are placed all over the world these additional citizen reports allow USGS to develop a more detailed map of the intensity of an earthquakersquos activity Over 360000 earthquake events have been submitted to DYFI and are available to browse online on the archive section of the website There is an option for users to give
Interaction type PublicGovernment
Trigger event Paucity of instrumental ground-motion data in regions of low seismicity
Domain Collection of ground-motion seismic data from the public
Organization United States Geological Survey (USGS) Community Internet Intensity Map (ldquoDid you feel itrdquo DYFI)
Actors USGS Earthquake Hazards Program
Data sets -
Process On feeling earthquake activity users log-on to the DYFI website and submit their observation The intensity of the earthquake they have just felt is quantified using the Modified Mercalli Intensity (MMI) scale There is no need for users to have experience in seismology
Feedback Maps and graphics are generated automatically by the DYFI system and made available to the public There is no specific personalized feedback to the contributor
Goal To integrate the public into the seismic monitoring network and allow USGS to continue to learn and understand more about earthquake activity
Side effects The data collected from DYFI is made compatible with ShakeMap a product of the USGS Earthquake Hazards Program in conjunction with regional seismic network operators
Contact point -
first-person descriptions of how the earthquake affected them However it is made clear on the form that if the USGS uses this qualitative information the user will only be referred to as ldquothe observerrdquo Contributors can watch the DYFI webpage for the display of their report Maps and graphics are generated automatically by the DYFI system and made available to the public
The ldquoDid you feel itrdquo form interface is easy to use Ideally those reporting earthquake events in the United States will know their ZIP code but citizens from outside the US can submit observations with their coordinates in longitude and latitude The form is mostly comprised of drop-down lists asking for feedback on your situation when the earthquake occurred your experience of the earthquake (shaking strength duration reaction) earthquake effects (sounds damage to free standing objects etc) damage to buildings etc
DYFIrsquos appeal to users means the data makes up in quantity what it may lack in scientific quality and offers the potential to resolve long-standing issues in earthquake ground-motion science Such issues have been difficult to address due to the paucity of instrumental ground-motion data in regions of low seismicity Prior to this system intensity maps were rarely made for US earthquakes of a magnitude of less than about 55 now intensities as low as magnitude 20 are routinely reported for the smallest felt earthquakes nationwide The intensity of earthquakes reported by users is quantified using the Modified Mercalli Intensity (MMI) scale MMI measures the intensity of ground motions from the perspective of human and structural response on a qualitative scale from 1 (not felt) to 10 (very heavy damage) or sometimes 12 (total destruction) based on descriptions such as ldquofelt indoorsrdquo (MMI = 3) to ldquofelt by all windows dishes glassware broken weak plaster crackedrdquo (MMI = 6) to ldquosome structures with complete collapserdquo (MMI = 9) The MMI allows anyone to report activity There is no need for the contributor to have experience in seismology This public reporting allows the USGS to continue to learn and understand more about earthquake activity In addition the USGS can then use this knowledge to inform emergency response planning efforts and budgets for modeling disaster relief
65
There are some negative aspects to ldquoDid you feel itrdquo Despite their significant value to emergency responders the subjective observations of untrained users are only a qualitative indicator of the effects of an earthquake Moreover the effectiveness of DYFI-based maps may be greatly hampered by the speed at which people report critical information during crises
Main lessonsbull Quality control can be achieved by securing a large
response rate from contributors
bull The requirement for non-technical jargon free locational data allows greater levels of public participation
bull Accessible and easy to understand input forms which avoid using specialist terminology helps to engage non-specialist users
bull VGI can be used to fill gaps in official data sets and supplement official government monitoring programs
23 Places of Interest project National Park Service US
The National Park Service does not have a comprehensive data set of geographic information describing tourist infrastructure and natural features for all of the 400 or so individual territories managed by NPS Some parks have their own GIS departments and produce excellent data while other parks are small and do not have these resources The aim of the NPS Places of Interest project is to allow non-technical users to add and modify important landmarks in the parks in a single map This map can then be used as a basemap for all NPS web maps When users see the crowdsourced map in parks and notice errors they will be able to make changes to the maps immediately
The NPS Places project uses the OSM platform because of the robust open source tools that are available This includes the backend API and rendering formats as well as the easy-to-use iD editor It does not use the OSM database itself Due to licensing restrictions on OSM data the NPS maintains its data separately
The project is designed to collect point data from NPS employees that will be displayed on most of the web maps on the NPS website There are future plans to expand this project further to the public and
Interaction type PublicGovernmentPublic
Trigger event Licensing and data validation concerns
Domain Mapping of tourist infrastructure and natural features
Organization National Park Service (NPS) US
Actors NPS
Data sets OSM
Process Edits to NPS data are made by Park Service employees There is no validation in effect but this may change in future
Feedback Internal park data sets that have been digitized from park maps
Goal To create an up-to-date map of all the parks for viewing and use by the public on the parksrsquo websites
Side effects None yet but data quality issues are anticipated
Contact point Jim McAndrew US National Park Service
66
use Park employees to verify information before it is published on the map
There is currently no easy way to extract information from the NPS Places project although its API is open and fully documented It is possible for motivated users to extract the information they want from this API
The biggest success of this project is collecting contributions from non-technical Park staff This includes people with extensive knowledge about the parks such as rangers and maintenance managers These people know the parks better than anyone but they have not been able to get their data into traditional GIS at parks without a dedicated GIS staff Few non-technical users are involved yet but the project is planning to visit the parks and train users so they know what they can add Some parks with GIS departments have already started synchronizing their own information with the system and have been making a big push to use the system for all of their web pages
The biggest challenge is that OSM does not deal with traditional GIS very well This means building tools to synchronize ESRI databases with the NPS database using the ESRI REST API NPS would like to make contributing to the system as easy as possible for the existing GIS departments that do the bulk of the GIS work in the parks While the goal is to get non-technical people involved the core of the project will still be the GIS departments the exist in the parks and the regional offices
Main lessonsbull It is possible and sometimes desirable to use
the OSM toolset to facilitate voluntary mapping activities without using the data set itself
bull The OSM platform can be used as a great platform for empowering non-technical users to start modifying maps The iD editor is extremely easy to use and rendering tools such as Tile Mill and Mapnik allow the data to be updated in real time
bull The success of the system relies on working with existing GIS managers on site and regional offices
bull Non-specialists are an important part of this process but require more training to get their contributions into the system
bull Live feedback is an important feature to encourage contributions
24 California Roadkill Observation System (CROS) US
The California Roadkill Observation System can be used to record observations from reporters out in the field who come across identifiable road-killed wildlife This includes the type of animal and
Interaction type PublicGovernment
Trigger event A university-based research project
Domain Development of a database of user-contributed observations of roadkill incidents
Organization ICE (an environmental information brokerage and research laboratory in the Department of Environmental Science and Policy at the University of California Davis) and Caltrans (California Department of Transportation)
Actors ICE Caltrans
Data sets GIS data sets such as Californian roads infrastructure
Process A user can contribute details of incidents of roadkill in California (location type of roadkill photographs etc) Contributions are uploaded on the CROS website then submitted to the CROS database and displayed on the public web map interface
Feedback The contributor of roadkill information is provided with feedback to state that the contribution has been successfully submitted to the CROS system If contributors register on the website their name is placed beside any contribution they make All contributions are made publicly available The top 20 species observed and top 20 observers are listed on the website
Goal To understand the ecology wildlife behavior and how transportation contributes to this problem This includes the application of GIS and statistical modeling to predict roadkill hotspots to measure the contributing factors to roadkill to quantify impacts and to estimate benefits of different remedial actions
Side effects Caltrans have used the data from CROS and the expertise at ICE to develop a guidance manual for effective strategies to address roadwildlife conflicts in California
Contact point -
67
25 Shelter Associates slum mapping in IndiaIn urban areas of India the percentage of citizens who live in slums fluctuates from 10-50 percent which means that a great number of people lack basic infrastructure and housing Housing health sanitation education and livelihood are among the main issues that NGO Shelter Associates tries to address in specific areas of India through a variety of projects intended to improve the living conditions of slum dwellers Shelter Associates was established in 1993 by architects and planners and works in direct collaboration with the local government for the improvement of citizensrsquo lives It has adopted a hybrid model of experts in various academic fields such as GIS analysts sociologists planners and architects who work with the aid of local volunteers The volunteers contribute to slum mapping by maintaining up-to-date data for informal settlements and supporting community participation in other projects carried out by Shelter Associates
According to Shelter Associates the main issue that local government faces is the lack of local knowledge about the spatial infrastructure of slums which results in the exclusion of informal settlements from city planning and urban development The local people consider mapping as an opportunity to move to other areas where schools are located or to save money by adopting better transportation routes
Shelter Associates pioneered the use of GIS for poverty mapping in the late 1990s However in recent years the need to connect the data collected for the various projects and stored in different layers alongside spatial information became crucial The team adopted Google Earth as a basemap for the slum mapping and among other benefits Google Earth is easy to use easy to understand because it includes aerial images and offers a clear picture of development within the city The spatial data was introduced into a variety of projects to support good governance and decision making policies
or species found its location when it was found how long it might have been dead pictures of the roadkill and any additional details about road or traffic conditions CROS displays a summary of this information for different wildlife groups across the state Information about where wildlife vehicle collisions occur what animals are involved on what kinds of roads and other data can help inform policy management and financial investment to reduce roadkill The mission is to provide a safer environment for wildlife in relation to California motorways
The collectors of the roadkill data are a university-based research organization The CROS project includes past and current participation by over 900 volunteer scientists including several hundred academics as well as agency and NGO biologists and natural historians More than 25000 observations have been logged on the website since August 2009 An Android application is available but the website is the most stable and robust means of submitting contributions
The observations are used in a geographic information system to find wildlife-vehicle collision hotspots By contributing wildlife observation data users help researchers understand where wildlife live and the threats they face from human activities The research organization hope to use this data and their GIS analysis to inform transportation planning in the state of California Caltrans and ICE teamed up to create a guidance manual for California
Main lessonsbull Internet-based training materials can be provided
to allow some contributors to undertake training in scientific methods of surveying
bull The user interface for contribution should be easy to use and should include widgets such as pre-defined lists and clickable maps to decrease the opportunities for erroneous data submission
bull Photographs submitted in addition to basic geographical data can provide very useful visual context information
68
26 Crowdsourcing satellite imagery in SomaliaThis is a humanitarian project to geo-locate all shelters in Somaliarsquos Afgooye corridor with the aid of satellite imagery provided by the Standby Volunteer Task Force UNHCR DigitalGlobe Tomnod SBTF and Ushahidi are the main organizational bodies cooperating so that crowdsourcing can take place with the aid of volunteers The aim of the project behind this collaboration is to map all shelters by dividing them into three main categories large permanent structures temporary structures with a metal roof and temporary shelters without a metal roof The rule set describes the shape color tone and clustering of the different shelter types The project was divided into two phases a trial and an official launch where specific instructions were given to participants The goal of the project is to test the feasibility of crowdsourcing rapid shelter enumerations of internally displaced persons to support population estimates The process cannot be replaced by an automated system because this could not identify the type of shelter
The satellite imagery methodology was adopted because access to the area of interest is limited The main question was how many people are in the shelters and need humanitarian aid in order to inform decision making around logistics and planning policies During the project 253711 tags were created and more than 9400 shelters visually identified after processing 3909 satellite images
27 Agricultural data collection and sharing by Community Knowledge Workers UgandaThe digital divide is an urgent social and technical issue in Uganda especially for small farmers who have low literacy rates and limited access to the power grid to support the use of technical equipment The lack of technology savvy people also results in the exclusion of local people from data collection which could help them to reach informed decisions and improve their farming efficiency and consequently their everyday lives
Community Knowledge Workers (CKW) is an initiative of the Grameen Foundation that aims to train locals in the use of technology overcoming power infrastructure issues for data collection and sharing to enable their communities to make informed decisions based on actionable and up-to-date farming knowledge
After registering participants of the CKW network can use mobile phones to collect a range of information regarding livestock and farming The mobile phones can be recharged by solar power or manually (eg using bicycles) As most areas are not covered by the mobile network data collection takes place offline simply using the GPS sensor of the device and properly designed forms Once the phones are inside a wireless or mobile network area the data is uploaded to a central server and becomes available to other farmers or stakeholders The information shared is helping farmers and policy makers to evaluate the needs of farmers assess potential disease outbreaks provide market price updates receive weather forecasts and even provide income to the farmers as the surveyed data is used by agricultural organizations All the data have feedbacks to the farmers in terms of improved policies and prompt government action Thus CKW has established an efficient grassroots network of data and services that has fundamentally changed agricultural knowledge sharing in Uganda
69
28 Twitter use in Italian municipalitiesResearch investigating the Twitter profiles of Italian municipalities identified that at the time of the survey (November 2013) only 461 of more than 8000 Italian municipalities had Twitter profiles approximately 6 percent After a few months this increased to about 25 percent while six months before only 368 municipalities had a Twitter account The geography of municipal Twitter profiles in Italy seems to reflect the urban structure of the country which is mostly made up of many small and medium sized cities At the time of the survey only 1 percent of the 461 profiles had been activated by large municipalities 4 percent by medium municipalities 44 percent by small to medium municipalities while 51 percent had been activated by municipalities with less than 10000 inhabitants
This demonstrates that reduced population size is not a barrier to the spread of social applications but may in fact be an advantage or a driver The first and most active (in terms of tweets sent and followers) municipalities on Twitter are those which started with the activation of ldquocivic networksrdquo (municipality websites) in the late 1990s showing the relationship between the adoption of these kinds of technologies
The survey analyzed the types of messages sent since the activity profiles must be assessed not only in relation to the amount of tweets and followers but also with respect to the quality and type of information sent The latter relate to different fields which include simple messages for informational purposes up to more complex messages addressing planning and territorial management The research team classified the hashtags used by most municipal profiles into several categories and the most widely represented information related to culture and tourism followed by geographical information utilities and weather forecasts Messages about governance are still quite limited except in some cases demonstrating that the potential of Twitter as a collector and distributor of information on complex issues around which to initiate debates and discussions has not been realized Only a few municipalities have used Twitter for emergency and risk management such as Castelnuovo Garfagnana (earthquake) and some municipalities in Sardinia (flooding) Nevertheless it is worth noting that the news about LrsquoAquilarsquos severe earthquake of 2009 was first announced through Twitter before other media
29 Portland TriMet transportation planner Oregon USTriMet is a public agency that provides bus light rail and commuter rail transit services in the Portland Oregon metropolitan area In an effort to keep the services provided to the public at the highest possible level TriMet is incorporating a range of services such as multimodal trip planning and service change analysis TriMet needs a new generation of data that traditional proprietary data sets cannot provide To solve this problem TriMet turned to the use of OSM As well as traditional road network data sets OSM also provides data about pedestrian paths and bicycle routes that can enable TriMet to provide multimodal services to the citizens of Portland Moreover proprietary routing data sets are costly and do not come with near real-time updates
In this context OSM data sets are now used by all internal systems and applications that need routing data Also TriMet officials have realized the value of OSM data and have committed to contribute to OSM with a full-time employee Moreover city officials realized that by releasing governmental data to the public the OSM community will contribute to data improvement and will enable TriMet to provide better services to the public
70
Aronoff S 1989 Geographic Information Systems a management perspective WDL Publications Ontario
Atkinson G M and Wald D J 2007 ldquoDid You Feel Itrdquo intensity data A surprisingly good measure of earthquake ground motion Seismological Research Letters 78 362-368
Ball M 2013 New York City Opens More of Cityrsquos Data Including OpenStreetMap Collaboration [online] Available at [httpinformedinfrastructurecom6088new-york-city-open-more-of- the-citys-data-including-openstreetmap-collaboration] [Accessed 22 December 2013]
Barron C Neis P and Zipf A 2014A comprehensive framework for intrinsic OpenStreetMap quality analysis Transactions in GIS doi101111tgis12073
Barth A 2013 New York City and OpenStreetMap Collaborating Through Open Data [online] Available at [httpswwwmapboxcomblognyc-and-openstreetmap-cooperating-through- open-data] [Accessed 22 December 2013]
Beaulieu A Begin D and Genest D 2010 Community Mapping and Government Mapping Potential Collaboration Symposium of ISPRS Commission I Calgary Canada June 16-18 3
Begin D 2012 Towards Integrating VGI and National Mapping Agency Operations - A Canadian Case Study The Seventh International Conference on Geographic Information Science Available at [httpwebornlgovscigistworkshops2012documentsBegin20Daniel20-20Paperpdf] [Accessed 15 February 2014]
Berdou E 2011 Mediating Voices and Communicating Realities Using information crowdsourcing tools open data initiatives and digital media to support and protect the vulnerable and marginalised [online] Available at [httpmapkiberaorgwikiimages778IDS_MediatingVoices_FinalReportpdf] [Accessed 16 April 2014]
Brabham D 2013 Using Crowdsourcing in Government Collaboration Across Boundaries IBM Center for The Business of Government Washington DC Available at [httpwwwbusinessofgovernmentorgreportusing-crowdsourcing-government] [Accessed 16 April 2014 ]
Brain Off 2010 Haiti OpenStreetMap Response [online] Available at [httpbrainoffcomweblog201001141518] [Accessed 8 December 2013]
Brown M and Heaton L 2011 New Country in the Making Building a Map for South Sudan [online] Available at [httpwwwenoughprojectorgblogsnew-country-making-building-map-south-sudan] [Accessed 28 April 2014]
Castellote J Huerta J Pescador J and Brown M 2013Towns Conquer A Gamified Application to Collect Geographical Names (vernacular namestoponyms) Proceedings of AGILE 2013 in Leuven Belgium Available at [httpeprintsnottinghamacuk2131] [Accessed 16 April 2014]
Chapman K Wibowo A and Nurwadjedi 2013 Filling the Data Gap with Participatory Mapping for Effective Disaster Preparedness [online] Available at [httpwwwjointokyoorgfilescmsnewspdf(Final)_Session_2_Summarypdf] [Accessed 10 December 2013]
Deffner R 2013 Mongolia mapping Ulaanbaatar [Online] Available at [httphotopenstreetmaporgprojectsmongolia_mapping_ulaanbaatar] [Accessed 12 April 2014]
EIONET 2012 Corine Land Cover 2006 [online] Available at [httpsiaeioneteuropaeuCLC2006] [Accessed 18 December 2013]
Fowler A Whyatt JD Davies G and Ellis R 2013 How Reliable Are Citizen-Derived Scientific Data Assessing the Quality of Contrail Observations Made by the General Public Transactions in GIS 17 (4) 488ndash506 doi101111tgis12034
GFDRR 2013 Preparing Communities through Understanding Risk [online] Available at [httpwwwgfdrrorgsitesgfdrrorgfilesPillar_1_Preparing_Communities_through_Understanding_Risk_0pdf] [Accessed 10 December 2013]
Gollan J Lobry de Bruyn L Reid N and Wilkie L 2012 Can Volunteers Collect Data That Are Comparable to Professional Scientists A Study of Variables Used in Monitoring the Outcomes of Ecosystem Rehabilitation Environmental Management 50 (5) 969ndash78 doi101007s00267-012-9924-4
Goodchild MF 2007 Citizens as sensors the world of volunteered geography GeoJournal 69 (4) 211-221
ReFeRenCeS AnD SouRCeS
71
Hagen E 2010 Putting Nairobirsquos Slums on the Map Final Report [online] Available at [httpsopenknowledgeworldbankorgbitstreamhandle109866072deor_12_1_41pdfsequence=1] [Accessed 18 April 2014]
Hagen E 2012 Workspaces The changing environment of infomediariesMap Kibera [online] Available at [httpwikiikmemergentnetindexphpWorkspacesThe_changing_environment_of_infomediariesMap_Kibera] [Accessed 19 April 2014]
Haklay M 2010 Usability of VGI in Haiti earthquake response [online] Available at [httpwwwslidesharenetmukihusability-of-vgi-in-haiti-earthquake-response-preliminary-thoughts] [Accessed 8 December 2013]
Heymann Y Steenmans Ch Croissille G and Bossard M 1994 Corine Land Cover Technical Guide Luxembourg Office for Official Publications of the European Communities
Humanitarian OpenStreetMap Team 2013 Haiti [online] Available at [httphotopenstreetmaporgprojectshaiti-2] [Accessed 8 December 2013]
Humanitarian OpenStreetMap Team 2013 Indonesia [online] Available at [httphotopenstreetmaporgprojectsindonesia-0] [Accessed 15 December 2013]
Huxhold W An Introduction to Urban GIS Oxford and New York Oxford University Press
iRevolution 2011 Crowdsourcing Satellite Imagery Analysis for Somalia Results of Trial Run [online] Available at [httpirevolutionnet20111101crowdsourcing-unhcr-somalia] [Accessed 25 May 2014]
iRevolution 2011 Crowdsourcing Satellite Imagery Analysis for UNHCR-Somalia Latest Results [online] Available at [httpirevolutionnet20111109crowdsourcing-unhcr-somalia-latest-results] [Accessed 25 May 2014]
IT News Africa 2011 Google maps out Southern Sudan [Online] Available at [httpwwwitnewsafricacom201107google-maps-out-south-sudan] [Accessed 25 April 2014]
King SF and Brown P 2007 Fix my street or else using the Internet to voice local public service concerns Proceedings of the 1st international conference on Theory and practice of electronic governance ICEGOV 72ndash80
Lamy F 2011a South Sudan is now official on Google Maps [online] Available at [httpbloggoogleorg201109south-sudan-is-now-official-on-googlehtml] [Accessed 25 April 2014]
Lamy F 2011b South Sudanese sing and map their way to independence [online] Available at [httpgoogle-africablogspotgr201107south-sudanese-sing-and-map-their-wayhtml] [Accessed 27 April 2014]
Lamy F 2011c Using the power of mapping to support South Sudan [online] Available at [httpgoogleblogblogspotgr201105using-power-of-mapping-to-support-southhtml] [Accessed 26 April 2014]
Longley P A Goodchild M F Maguire D J and Rhind D W 2001 Geographic information system and Science Oxford John Wiley amp Sons Ltd
Map Kibera 2014 [online] Available at [httpmapkiberaorg] [Accessed 15 April 2014]
Maron M 2007 OpenStreetMap A disaster waiting to happen [online] Available at [httpwwwslidesharenetmikel_maronopenstreetmap-a-disaster-waiting-to-happen] [Accessed 8 December 2013]
Marras S 2012 Kibera Mapping the Unmapped [online] Available at [httpwww djemme comdocsdocsschedeKiberaEN Pdf] [Accessed 17 April 2014]
McLaren R A 2011 Crowdsourcing Support of Land Administration A New Collaborative Partnership between Citizens and Land Professionals London Royal Institute of Chartered Surveyors (RICS)
Meyer R 2013 How Online Mapmakers Are Helping the Red Cross Save Lives in the Philippines [online] Available at [httpwwwtheatlanticcomtechnologyarchive201311how-online- mapmakers-are-helping-the-red-cross-save-lives-in-the-philippines281366] [Accessed 22 December 2013]
The National Map 2014 Home [online] Available at [httpnationalmapgov] [Accessed 27 April 2014]
The National Map US Topo 2014 US Topo Quadrangles mdash Maps for America [online] Available at [httpnationalmapgovustopo] [Accessed 27 April 2014]
72
OpenSourcecom 2010 OpenStreetMap Haiti [online] Available at [httpopensourcecomosm] [Accessed 8 December 2013]
OpenStreetMap 2014 WikiProject Mongolia [online] Available at [httpwikiopenstreetmaporgwikiWikiProject_Mongolia] [Accessed 6 June 2014]
OpenStreetMap 2013 WikiProject Indonesia [online] Available at [httpwikiopenstreetmaporgwikiWikiProject_Indonesia] [Accessed 16 December 2013]
OpenStreetMap 2012 WikiProject Corine Land Cover [online] Available at [httpwikiopenstreetmaporgwikiWikiProject_Corine_Land_Cover] [Accessed 18 December 2013]
OpenStreetMap Indonesia 2014 Home [online] Available at [httpenopenstreetmaporid] [Accessed 4 January 2014]
OpenStreetMap Indonesia 2012 Community Mapping for Exposure in Indonesia Project Report [online] Available at [httpwwwopenstreetmaporiddocsCommunity_Mapping_for_Exposure_in_Indonesia_ENpdf] [Accessed 7 December 2013]
OpenStreetMap Indonesia 2012 Evaluation of OpenStreetMap Data in Indonesia Final Report [online] Available at [httpopenstreetmaporiddocsFinal_Report-OSM_Evaluation_in_Indonesia_2012pdf] [Accessed 10 December 2013]
Roberts S 2014 Open Cities and Crisis Mapping [online] Available at [httpblogusaidgov2014 01opencities-and-crisis-mapping] [Accessed 8 December 2013]
Roberts S 2011 UNHCR and Crowdsourcing A partnership with the Stand By Task Force [online] Available at [httpswfoundorgmedia54239s2-0220robertspdf] [Accessed 1 June 2014]
Shelter Associates 2014 [online] Research and Poverty Mapping (city slum profiles) Available at [httpshelter-associatesorgmapping-research] [Accessed 9 June 2014]
Shelter Associates 2014 [online] Home Page Available at [httpshelter-associatesorg] [Accessed 9 June 2014]
Shelter Associates 2014 GIS and Remote Sensing [online] Available at [httpshelter-associatesorggis-remote-sensing] [Accessed 9 June 2014]
South Sudan Mapping 2014 [online] Available at [httpssitesgooglecomsitemapsudan] [Accessed 27 April 2014]
Thoumlrneloumlf E 2013 EPA Network Workshop ndash Citizen Science 12 -13 March 2013 - Increasing involvement of the public in large-scale monitoring of large carnivores across Scandinavia Sweden EPA Available at [httpepaneteweeaeuropaeuad-hoc-meetingsepa-network-workshop-citizen-science-12-13-march-2013eva-thornelof_-sepa-swedenpdf] [Accessed 1 June 2014]
Tomlinson R 2007 Thinking about GIS Geographic information system planning for managers Redlands CA ESRI Press
Touya G and Brando-Escobar C 2013 Detecting Level-of-Detail Inconsistencies in Volunteered Geographic Information Data Sets Cartographica 48 (2) 134ndash143
United States Department of Agriculture Farm Service Agency 2014 Naip Imagery [online] Available at [httpswwwfsausdagovFSAapfoapparea=homeampsubject=progamptopic=nai] [Accessed 1 June 2014]
US Geological Survey 2014 Home [online] Available at [httpnavigatorerusgsgov] [Accessed 1 June 2014]
Waters T 2010 The OpenStreetMap project and Haiti Earthquake Case study [online] Available at [httpwwwslidesharenetchippyopenstreetmap-case-study-haiti-crisis-response] [Accessed 8 December 2013]
Zoljargal M 2013 Ulaanbaatar to become a lsquosmart cityrsquo [online] Available at [httpubpostmongolnewsmnp=3238] [Accessed 12 April 2014]
73
1818 h Street nW Washington DC 20433 wwwworldbankorg
1818 h Street nW Washington DC 20433wwwgfdrrorg
university College LondonGower StreetLondon WC1e 6BT wwwuclacuk
openStreetmap for KathmanduPhoTo copyoPenSTReeTmAP ConTRIBuToRS
TILeS CouRTeSy oF humAnITARIAn oPenSTReeTmAP TeAm