crossed markets arbitrage opportunities in nasdaq … opportunities... · crossed markets:...
TRANSCRIPT

Crossed Markets: Arbitrage Opportunities in Nasdaq Stocks
Ryan Garvey and Anthony Murphy*
* Ryan Garvey is assistant professor of finance at the A.J. Palumbo School of Business Administration and the John F. Donahue Graduate School of Business, Duquesne University, Pittsburgh, PA. 15282. Phone 412-396-4003, fax 412-396-4764, email [email protected]. Anthony Murphy is a Research Fellow at Nuffield College, New Road, Oxford, OX1 1NF, UK. Phone +44 (0)1865 278526, fax +44 (0)1865 278621, email [email protected]. We are grateful to the editor and an anonymous referee for their helpful suggestions and comments. The first version of the paper, entitled “Crossed and Locked Markets: An Examination of Market Quality”, was written in May 2004.
2
Abstract We examine how crossed markets create potential arbitrage opportunities in Nasdaq
stocks. On average, actively traded Nasdaq listed stocks are crossed approximately 0.5%
of the trading day. The incidence of crosses is higher in more fragmented markets.
When crosses occur, the mean duration is three seconds, the value of the cross is around
one cent, and the offer side has approximately 2,000 shares available for trading. Our
simulated trading analysis shows that institutional traders, who act fast and pay little in
transaction costs, can potentially exploit the arbitrage opportunities presented by market
crosses.
Keywords: Locks and crosses, Nasdaq, arbitrage, trading strategy.
JEL Codes: G14, G19

3
Nasdaq listed stocks are traded in multiple trading venues. For example, during
May 2005, only 42% of all trades occurred on Nasdaq; the remaining 58% of trades
occurred in non-linked market centers.1 Quotes in these non-linked markets often lock or
cross each other. A locked market occurs when the best bid price, across all markets,
equals the best offer price in one or more of the markets. A crossed market occurs when
the national best bid price is greater than the best offer price in one or more of the
markets. Locks and crosses do not generally occur in the same market because internal
trading systems will immediately execute the initiating lock or cross order against the
opposite side quotes. Moreover, locks and crosses seldom occur on New York Stock
Exchange (NYSE) listed stocks since the NYSE executes approximately 80% of all the
volume traded in their stocks.2 According to Nasdaq [2003], locks and crosses mainly
occur on heavily traded Nasdaq stocks.
The issue of locked and crossed markets is an area of concern for market
professionals. Locks and crosses are an important market quality characteristic and their
occurrences have been on the rise. A locked or crossed market quote may cause
problems ranging from general confusion in the marketplace to possible system errors on
trading desks (Schmerken [2003]). According to the Security and Exchange Commission
[2004]:
“Lock/cross markets indicate one of the following: one of the two quotes is not
valid, brokers are not diligently representing their clients, or inefficiencies exist
that deter trading with the quoting market. The result is confusion regarding the
reliability of displayed quote and increased difficulty for market participants
seeking best execution for customer orders” (p. 11158).

4
This is the reason the SEC discourages market participants from locking and crossing the
overall market in their recently adopted Regulation NMS (National Market System).3 If
Regulation NMS does get fully implemented,4 the precise impact of the new rules on the
increasing number of locks and crosses is still uncertain. The Commission notes that
locks and crosses have to be tolerated to a certain extent in the existing market
environment.
While many seem to portray locks and crosses as a problem, academics have not
shared this view. For example, Cao, Ghysels, and Hatheway [2000] examine locked and
crossed markets during the Nasdaq pre-opening trading period (9:00 a.m. to 9:30 a.m.).
They suggest that Nasdaq dealers often lock and cross the market in order to signal
information. The ability of market participants to engage in price discovery through
locks and crosses is also observed during the trading day (9:30 a.m. to 4:00 p.m.) in
Shkilko, Van Ness, and Van Ness [2005]. In addition, Shkilko et al. [2005] suggest that
locking and crossing quotes are used to avoid stale quotes and prevent liquidity shortages
on electronic limit order books.5 These positive attributes lead Shkilko et al. [2005] to
view locks and crosses as a “natural mechanism that allows traders to cope with today’s
increasingly competitive and fragmented market environment” (p. 5).
While academics, practitioners, and regulators continue to debate the positive and
negative effects of locked and crossed markets, many interesting questions remain
unanswered. In particular, do crossed markets present arbitrage opportunities? Suppose
the national best bid price is $10.02 and the best offer price is $10.01. Then, a trader
could go short (sell) at the market center quoting $10.02 and cover (buy) at the competing
market center quoting $10.01. In theory, this strategy would generate a 1 cent gross profit

5
per share, if the orders were filled at these prices. Of course, this is often difficult to do
because crosses are fleeting and prices adjust rapidly as shown in Figure 1 below.
In this paper we examine the arbitrage opportunities (if any) presented by crossed
quotes. In order to do this, we interviewed a large National Securities Dealer who has
experimented with trading strategies that take advantage of crossed prices. The firm
claims that their arbitrage strategies are quite profitable. While we were not given details
of the firm’s actual trades, we obtained a list of the firm’s ten most actively traded stocks
for the year and proprietary information on what it cost the firm to operate their trading
desk. Using this proprietary information and intraday quote data provided by Nasdaq, we
were able to examine the profitability of this sort of arbitrage. To the best of our
knowledge, our study is unique in focusing on this aspect of crossed quotes. Our results
suggest that institutional traders, who act fast and pay little in trading costs, should be
able to profitably exploit the arbitrage opportunities presented by market crosses. On the
other hand, retail traders, who try to exploit crossed markets, are unlikely to cover their
trading costs.
The Origin of Locks and Crosses
The incidence of locked and crossed markets is a relatively new issue confronting
market participants and security regulators. Three factors have significantly increased the
incidence of locked and crossed markets. The first factor is the switch from quoting
prices for Nasdaq stocks in fractions of a dollar (generally one-sixteenth of a dollar or 6
and one-fourth cent for large capitalization stocks) to quoting in cents and the reduction
of the minimum price increment / tick size to one cent.

6
This switch, which occurred in March and April 2001, immediately cut quoted
and effective bid-ask spreads. Bessembinder [2003] found that the most striking
reduction in average quoted spreads occurred with large capitalization Nasdaq stocks.
Average spreads on these stocks decreased, on a volume-weighted basis, from 5.2 to 1.6
cents per share. Decimalization also increased the number of quote updates. According
to Nasdaq [2001], the average number of quote updates, after controlling for day-to-day
fluctuations in trading activity, increased by between 12% and 20% in the two-week post-
decimalization period. Smaller spreads and more frequent quote updates tend to increase
the incidence of locks and crosses. In fact, the same study found that instances of locks
and crosses, for the most active stocks, increased by more than 100% after the switch to
decimalization. These findings were confirmed in interviews with market makers.
The second factor which contributed to a sharp increase in the number of locks
and crosses was the launch of Supermontage, Nasdaq’s new trading platform in mid
October 2002. Supermontage was designed to centralize liquidity in Nasdaq listings.
Market participants were given the option of participating in Supermontage or posting
their quotes on a non-linked market center. Many ECNs decided to operate
independently and post their quotes on regional exchanges.6
Prior to Supermontage, locks and crosses rarely occurred, because all the ECNs
participated in Nasdaq’s trading platform, and both market makers and ECN’s were
obliged to execute against all posted orders before they locked or crossed a market.
Nasdaq [2003] reported a sharp increase in the number of locked and crossed quotes in
the overall market with the implementation of Supermontage. Although locks and
crosses never occur in the Nasdaq market center, the new trading platform fragmented the

7
market for Nasdaq stocks. Now, the majority of trades in Nasdaq stocks occur away
from the Nasdaq, in non-linked market centers.
A third factor contributing to the rise in the incidence of locked and crossed
markets are differential access fees and liquidity rebates. When several major market
participants opted out of Supermontage, fierce competition for order flow between
Nasdaq and rival market centers resulted. Markets began offering liquidity rebates to
traders who provide liquidity. In addition, larger liquidity providers receive somewhat
higher rebates and pay lower access fees.7
Differential access fees and liquidity rebates increase the incidence of locks and
crosses precisely because they are not the same across all trading venues or for all market
participants. As a result, what is a locked or a crossed quote for one market participant
may not be a locked or crossed quote for another market participant.
Data
We used three datasets in our study. The first dataset is a transaction database
provided by the National Securities Dealer we interviewed. We use this data to estimate
institutional transaction costs. The data reveal what it cost the firm to execute their 1.3
million trades (2.5 billion shares) during the period June 2002 to May 2003. The firm
runs several trading operations. The transaction data consists of all trades executed
through their proprietary trading desk for the year.
For each trade, we know the size of the trade, the market where the trade was
executed, the type of trade as well as the fixed and variable costs associated with each
trade. Execution costs vary with the size of the trade, the market where the trade was
8
executed (Nasdaq, ARCA, etc.) and the type of trade (marketable vs. limit order). The
firm also applies a fixed cost to each trade. This fixed cost consists of a market clearing
charge for the trade and general overhead expenses incurred with operating a trading desk
(e.g. trading technology, site expenses, etc.). It is usually around $0.50 per transaction.
The total cost of a trade is just the sum of the fixed and variable costs.
The other two datasets – the October 2003 Nastraq and SIP (Security Information
Processor) data provided by the Nasdaq Stock Market - are used to identify market
crosses. Our analysis is based on quote data for twenty heavily traded Nasdaq listed
stocks. When choosing our twenty stocks, we first selected the ten most actively traded
stocks of our sample firm. We then added the ten largest market capitalization stocks -
excluding the top ten firm stocks - from the Nasdaq 100 index. We used this selection
process so that we could compare the stocks the firm actively traded with other actively
traded stocks in the marketplace. The stocks chosen are shown in Exhibits 1 and 2.
We extracted intraday quote data from both Nastraq and SIP databases for our
analysis. Basically, we recreated the aggregated Level II quotes for the entire market,
which market professionals continuously monitor throughout the day. Nastraq contains
detailed quote data for market participants in the Nasdaq stock market, while SIP data
contains detailed quote data for market participants outside of the Nasdaq market center.
We used two Nastraq datasets. The first file gives the inside or NBBO quotes
across all markets throughout the trading day. The second file gives the top of file quotes
for all market participants in the Nasdaq stock market only. The SIP data, which is
organized slightly differently from the Nastraq data, contains detailed quote and trade
data for market participants outside of the Nasdaq Stock Market.

9
Our first step was to use the Nastraq dealer quote file to recreate the inside quotes
and size originating from the Nasdaq market center for each second of the trading day.
Each time a market participant changes their bid or offer quote and/or volume, a new
entry was generated, which allowed us to calculate the inside price, spread and size
throughout the day for the Nasdaq market. Whenever multiple quote change occurred
during the same second, we used the last quote for that second.
Second, we used the SIP dataset, which records the inside quotes and sizes of
non-Supermontage market participants, to create a file containing the inside quotes and
size for each second of the trading day for the four non-Supermontage market centers
which traded Nasdaq listed stocks in October 2003. These four centers are the American
Stock Exchange, the Alternative Display Facility (ADF), the Cincinnati Stock Exchange,
and the Archipelago Stock Exchange.8
Finally, we matched the inside quotes for each of the five market centers –
(American, Cincinnati, ADF, Nasdaq, and Archipelago) to the Nastraq inside quote file
and determined where the best quotes were coming from and what the corresponding size
(if any) was in each market center. We had to use this tedious procedure because the
Nastraq inside quote file does not reveal the size or origin of the NBBO quotes and we
needed this information to identify locks and crosses.
Empirical Results
During the month of October 2003 there were 23 trading days. On each day and
for all twenty stocks, we examined the quotes every second from 9.30 a.m. to 4 p.m.
This gave us a total of 538,200 observations (seconds) per stock per market center. In
10
total we analyzed over 53.8 million quotes (538,200 seconds x 5 market centers x 20
stocks). Exhibits 1 and 2 display some summary statistics on when the inside ask price
was equal to (market lock) or lower than (market cross) the inside bid price on our
sample stocks.
--- Exhibits 1 and 2 ---
(a) The Incidence of Locks and Crosses
The incidence and duration of locks and crosses vary by stock. On average, the
twenty stocks are locked far more often than they are crossed (14.7% of the time versus
0.5% of the time). For example, Microsoft was locked 25% of the time (approximately
133,400 seconds) during October, yet it was crossed only 1% of the time (approximately
5,200 seconds). When Microsoft was locked, the lock lasted 5 seconds on average before
clearing, with an average offer size of about 7,500 shares. Crossed scenarios on
Microsoft lasted 3 seconds on average with an average offer size of about 5,200 shares.
Some stocks are locked or crossed far more often than others. For example, PALM is
locked 4% of the time while JDSU is locked 26% of the time. However, JDSU is only
crossed slightly more than PALM.
On average, the top 10 stocks traded by our firm are crossed less than the other 10
large cap Nasdaq stocks (0.3% of the time vs. 0.7% of the time). Why, then, didn’t the
firm simply concentrate on these other Nasdaq stocks that were crossed more frequently?
There may be several reasons for this. First, the average duration of crosses for the firm
stocks is 7 seconds vs. 3 seconds for the large capitalization Nasdaq stocks. In addition,
11
the average cross offer size for the firm stocks is 7,000 vs. 2,000 shares for the other
Nasdaq stocks. Thus, at the level of the individual cross, the arbitrage opportunities
provided by the 10 firm stocks appear to be better than those provided by the other
Nasdaq stocks in our sample. Another reason may be the fact that the very large cap
Nasdaq stocks are heavily traded stocks, with multiple market participants monitoring
and trading them throughout the day, which make it more difficult to execute orders
against crossed prices.
--- Figure 1 and Exhibit 3 ---
(b) The Duration and Value of Crosses
It is clear from Exhibit 2 that crosses are fleeting occurrences. Overall, the mean
duration of crosses is only 1 second, whereas the median is 3 seconds. The corresponding
figures are 4¾ and 2 seconds for the 10 firm stocks and 2½ and 1 second for the other
large cap Nasdaq stocks. In Exhibit 3, we show that the value of crosses is not likely to
exceed one cent. Stocks are usually crossed for 1 cent, with a weighted average cross
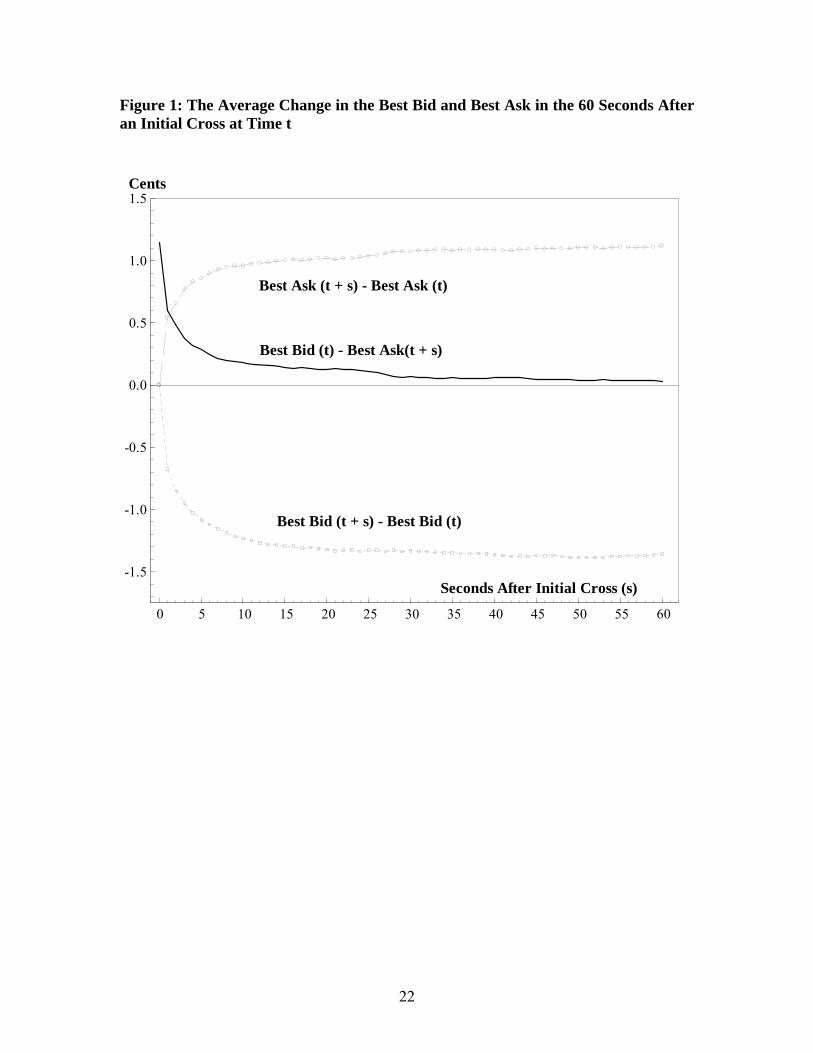
price of 1.3 cents.9 Figure 1 shows that average NBBO quotes adjust very quickly in the
60 seconds following an initial cross. The inside bid falls quickly, the inside ask rises and
most of the difference between the initial best bid and current best ask is eroded within 10
seconds. It is clear that arbitrage opportunities are very short lived and need to be
exploited quickly.
--- Exhibit 4 ---
12
(c) Who Initiates Crosses?
In Exhibit 4, we show who tends to initiate crossed markets. Nasdaq is the main
culprit, which is consistent with existing research examining this issue (e.g., Shkilko et al.
[2005]). This finding may be somewhat surprising to some in view of Nasdaq’s strong
public opposition to locked and crossed markets. For example, in a recent letter to the
SEC, Nasdaq encouraged the SEC to establish and enforce rules prohibiting market
participants from locking or crossing the overall market in their listed stocks.10
--- Exhibit 5---
(d) Market Fragmentation and the Incidence of Crosses
A priori, the incidence of crosses should rise when a stocks market share becomes
less concentrated. In order to provide evidence of this, we examine the relationship
between the incidence of crosses, volume, volatility and the degree of market
fragmentation. Some OLS regression results are set out in Exhibit 5. The dependent
variable is a logit transformation of the incidence of crosses i.e. logit p = ln(p / (1-p))
where p = incidence of crosses and ln denotes a natural log.11 Volume and volatility are
both measured as deviations from their group means (the monthly mean for each stock) in
order to eliminate fixed effects. Volatility is measured as the square of ln(phi/plo) where
phi and plo are the daily high and low price respectively. We use an entropy measure E to
measure market fragmentation. The entropy measure E = - ∑M sm.ln (sm), where sm is the
share of market m and the summation is over all markets M, which is generally 5. E
ranges from 0 (maximum concentration) to ln M (minimum concentration when market

13
shares are equal). As market concentration declines, E rises. We use an average of the
inside bid and ask size to measure market share.
The regression results (with robust standard errors) in Exhibit 5 show that, as
expected, the incidence of crosses rises with market fragmentation. The effect is highly
significant. While the volume and volatility coefficients are positive, they are not
significant. We checked that our results were robust to outliers using a least trimmed
squares estimator and found that they were. We also looked at the Herfindahl index
measure of concentration and got similar results.
--- Exhibit 6 ---
(e) Trading Costs and Arbitrage Opportunities
Since the value of crosses is one cent on average and crosses are fleeting,
arbitrage opportunities are unlikely to exist if trade execution costs are high. Exhibit 6
shows what it cost our sample firm to execute their trades. We suspect that other
institutions have similar transaction costs. The average costs in Exhibit 6, the sum of
fixed and variable costs, are segregated by common trade sizes and order route.
The firm executes their marketable orders either by directly removing liquidity in
a designated market center or by sending the orders to Knight Trading Group, the largest
market maker of Nasdaq stocks. Many smaller dealers often send their orders to Knight
for execution.12 Knight either fills these orders from their inventory or works the orders
in the open market. The advantage of going to Knight is that execution costs are cheaper.
The disadvantage is a delay to execution. The median execution time for orders sent to

14
Knight was 16 seconds whereas the firm claims that it rarely takes longer than a second if
they execute the order themselves (by directly removing liquidity in a designated
market).
Exhibit 6 shows the costs incurred with executing limit orders. Since the firm
places their limit orders in a range of financial markets, we present results aggregated for
all markets. Trading costs for some limit orders is negative because the rebate for
providing liquidity, on average, outweighed the cost of executing the trade.
(f) Possible Arbitrage Trading Strategies
We do not know the particular strategy used by our firm to exploit market crosses.
However, we believe that traders must open up their position by submitting a marketable
order to the market center first initiating the crossing price, since the mean (median)
duration of a cross is only three (one) second. If the trader were successful in capturing
the crossing price, then they could exit their position using several different strategies.
For example, a trader might first try to exit their position by placing an aggressively
placed limit order. Limit orders have the lowest transaction costs but take considerably
longer to execute. If the limit order were not filled in a few seconds, perhaps the second
option is to go to Knight with a marketable order. Transaction costs are much cheaper
through Knight. Finally, traders could directly remove liquidity on both trades.
The potential net profit on each cross scenario is a function of the cross price (the
difference between the opening best bid and the subsequent closing price), the trade size
and the cost of trading. Therefore, an appropriate way of estimating the potential profits
from capturing crossing prices is to simulate trading profits. We considered two simple

15
trading strategies. In both cases, we assume that trades are opened with a marketable
order sent to the market center first initiating the crossing price. Under trading strategy
A, we assume that trades are closed 3 seconds later with a marketable order. Under
trading strategy B, we assume that trades are also closed 3 seconds later using a limit
order (opposite side of the spread) at the inside ask. Of course, it is unreasonable to
assume that all market crosses could be captured since almost ¾ of 17,663 crosses in our
sample last for only one or two seconds. Therefore, we decided to confine our
simulations to crosses that lasted three or more seconds (4,617 episodes). Of course,
increased competition among arbitrage and other traders over time will reduce these
durations (and any associated trading profits) even further.13
In our simulations, market prices throughout the day are determined from the
intraday inside quote database. We used the firm’s average variable cost of execution of
marketable and limit orders in the prior year to estimate the variable costs of trading. In
addition, we applied the firm’s standard $0.50 per trade fixed cost to both the opening
and closing trades.
--- Exhibit 7---
(g) Simulated Profits
Exhibit 7 presents summary statistics on the simulated trading profits. The mean
and median net trading profits, under both trading strategies, are positive and statistically
different from zero. The total net trading profits for 4,617 market crosses lasting 3 or
more seconds in our sample is over $21,000 for trading strategy A and over $146,000 for
trading strategy B.

16
--- Exhibit 8 ---
Another strategy could be to exit trades through a designated market maker, such
as Knight. While this would lower the cost of executing, it would also delay execution
times and bring on additional risk. In Exhibit 8, we examine profitability assuming it
takes longer than three seconds to exit positions. Under both trading strategies,
performance steadily declines with closing duration. Trading strategy A becomes highly
unprofitable with longer holding times. This indicates that traders need to exit their
positions as quickly as possible in order to profit from market crosses.
Our analysis is based on what it cost one National Securities Dealer to execute
their trades. Of course, other market participants will pay varying rates and take varying
times to execute their trades. Current market pricing schemes allow for more active
trading firms to receive higher rebates when they provide liquidity and pay less to take
liquidity. What may be an arbitrage opportunity for one trader may not be for another.
Retail traders, who pay much higher trading fees than firms, would be less likely to take
advantage of crossed scenarios. For example, Ameritrade, a typical large U.S. retail
broker, charges their clients $10.99 per trade for market orders.14 Traders paying these
commissions would find it difficult to take advantage of crossed markets. In addition,
most retail traders typically do not have direct access to the markets, which significantly
delays execution times.

17
Conclusion
Recent U.S. market structure changes have led to increased competition and a
significant reduction in the bid-ask spread. Because Nasdaq listed stocks trade in
multiple trading venues, markets in these stocks are frequently locked or crossed during
the trading day. A locked market occurs when the best bid price, across all markets,
equals the best offer price in one or more of the markets. A crossed market occurs when
the national best bid price is greater than the best offer price in one or more of the
markets. While the recently adopted Regulation NMS discourages market participants
from locking and crossing the overall market, locks and crosses are difficult to prevent in
the current market environment.
Crossed markets are particularly interesting to study because they appear to
represent arbitrage opportunities. Our study examines whether or not this is the case. In
order to do so, we first consulted with a National Securities Dealer that runs an arbitrage
operation in order to profit from crossing prices. We were provided with a list of the
firm’s ten most actively traded stocks for the year, as well as what it cost the firm to
operate their proprietary trading desk. We then augmented these stocks with a sample of
ten large market capitalization stocks.
We find actively traded stocks are crossed approximately 0.5% of the trading day
in October 2003. The top 10 stocks traded by our firm were crossed less than the other
10 large cap Nasdaq stocks. However, crosses in the firm stocks were longer duration
and had greater size available to trade.
Crossed markets are often initiated by Nasdaq, they are more frequent when
market share is less concentrated, and they are fleeting in nature. Crossing prices last for

18
three seconds on average, although median duration is only one second. The average
crossed amount is usually one cent. However, we find adequate size (an average of about
2,000 shares on the offer side) was available for some traders to take advantage of market
crosses.
Based on our simulated trading analysis, we conclude that institutional traders,
who act fast and pay little in trading costs, should be able to profitably exploit the
arbitrage opportunities presented by market crosses. Retail traders, who try to exploit
crossed markets, are unlikely to cover their trading costs. Identifying arbitrage
opportunities in other markets and examining market crosses in international cross-listed
stocks are interesting topics for future research.
References
Barclay, Michael, J., Terrence Hendershott, and D. Timothy McCormick. “Competition among Trading Venues: Information and Trading on Electronic Communications Networks.” Journal of Finance, December 2003, pp. 2637-2665.
Bessembinder, Hendrik. “Trade Execution Costs and Market Quality after
Decimalization.” Journal of Financial and Quantitative Analysis, December 2003, pp. 747-777.
Cao, Charles, Eric Ghysels, and Frank Hatheway. “Price Discovery Without Trading:
Evidence from the Nasdaq Preopening.” Journal of Finance, June 2000, pp. 1339-1365.
Huang, Roger. “The Quality of ECN and Nasdaq Market-Maker Quotes.” Journal of
Finance, June 2002, pp. 1285-1319. Ip, Greg. “Role as Big Nasdaq Market Maker Helps Knight / Trimark’s Portfolio.” The
Wall Street Journal, March 3, 2000, p.A-1. Nasdaq Economic Research. “The Impact of Decimalization on the Nasdaq Stock
Market.” The Nasdaq Stock Market, June 11, 2001, report available online at: www.nasdaqtrader.com/trader/hottopics/decimalization/decfinrpt.pdf
19
Nasdaq Economic Research. “Results on the Introduction of Nasdaq’s Supermontage.” The Nasdaq Stock Market, February 4, 2003.
Schmerken, Ivy. “Nasdaq’s Battle Over Locked Crossed Markets.” Wall Street &
Technology Online, April 15, 2003, article available online at: www.wallstandtech.com/story/inDepth/WST20030415S0017
Security and Exchange Commission. “Proposed Regulation NMS.” SEC 2004 file no. S7-
10-04, document available online at: www.sec.gov/rules/proposed/34-49325.pdf
Shkilko, Andriy, V., Bonnie F. Van Ness, and Robert A. Van Ness. “Locked and Crossed
Markets on Nasdaq and the NYSE.” University of Mississippi Working Paper, May 2005.
20
Endnotes 1 Source: www.nasdaqnews.com
2 Source: www.nyse.com/pdfs/NYSEMarketQualityFeb2003.pdf
3 The SEC commissioners voted 3-2 to implement Regulation NMS. Overall, this regulation should help to reduce the number and duration of locks and crosses. For example, Regulation NMS calls for a cap on market access fees. As we discuss, market access fees increase the number of lock and cross scenarios because they are not the same for all market participants. In addition, Regulation NMS requires markets to route the orders they receive to a competing market if it is providing a better price. This should pick off locking and crossing quotes more quickly. 4 Some members of Congress are considering legislation to keep the rule from going into effect (http://online.wsj.com/article/SB111280765108399759-search.html). 5 The logistic regression results in Shkilko et al. [2005], examining the relationship between locks and crosses, quote updates and liquidity, are rather heterogeneous across markets. 6 ECNs are important markets for trading Nasdaq listed stocks. Both the quotes and trades in these markets are highly informative. See Huang [2002] and Barclay, Hendershott and McCormick [2003], inter alia. . 7 For example, the Nasdaq market center in April 2005 had the following pricing schedule. For liquidity providers, with a daily average of more than 20 million shares, the rebate is 0.25 cent per share. For liquidity providers, with a daily average between 2 and 20 million shares, the rebate is 0.22 per share. For all other liquidity providers, the rebate is 0.2 cents per share. Details of the tiered pricing schedules for traders taking liquidity can be found at: http://www.nasdaqtrader.com/Trader/News/2005/headtraderalerts/hta2005-020.stm. 8 Alternative Display Facility quotes mainly originated from the Instinet ECN, whereas the quotes on the Cincinnati Stock Exchange mainly originated from the Island ECN. The Boston Stock Exchange began trading Nasdaq listed stocks in December 2003. 9 We calculate the weighted average cross price because there may be multiple crossed markets. For example, suppose that initially the best bid is $24.20 (ADF) for 3,000 shares and the best offer is $24.21 (Cincinnati) for 4,000 shares. The next best offer (Nasdaq) is $24.22 for 2,000 shares. If Nasdaq raises its bid price to $24.23, the overall market is now crossed in two market centers, which we count as one crossed market episode. The size of the cross is 6,000 shares. We calculate the size weighted average cross price for this scenario as 1⅓ cents = (4000/6000) * 1 cent + (2000/6000) * 2 cent.

21
10 Nasdaq noted that during the week of March 29, 2004, markets for their 3,497 securities were locked or crossed an average of 509,018 times each day. The full letter is online at: http://www.sec.gov/rules/proposed/s71004/knight070504.pdf
11 If the incidence of crosses equals 0, we replace it with 0.000001 since the log of zero is not defined.
12 Larger dealers, such as Knight, will often pay for order flow or execute order flow relatively cheaply. Capturing order flow is important for firms like Knight, because it gives them an informational advantage, which they can use to generate trading profits (Ip [2000]).
13 We also simulate trading profits using longer cross duration times of 4 and 5 seconds. This reduces the number of crosses to 3,311 and 2,512 respectively. The results are qualitatively the same as those reported in Exhibits 7 and 8.
14 Source: www.ameritrade.com
22
Figure 1: The Average Change in the Best Bid and Best Ask in the 60 Seconds After an Initial Cross at Time t
0 5 10 15 20 25 30 35 40 45 50 55 60
-1.5
-1.0
-0.5
0.0
0.5
1.0
1.5
Seconds After Initial Cross (s)
Best Bid (t) - Best Ask(t + s)
Best Bid (t + s) - Best Bid (t)
Best Ask (t + s) - Best Ask (t)
Cents
23
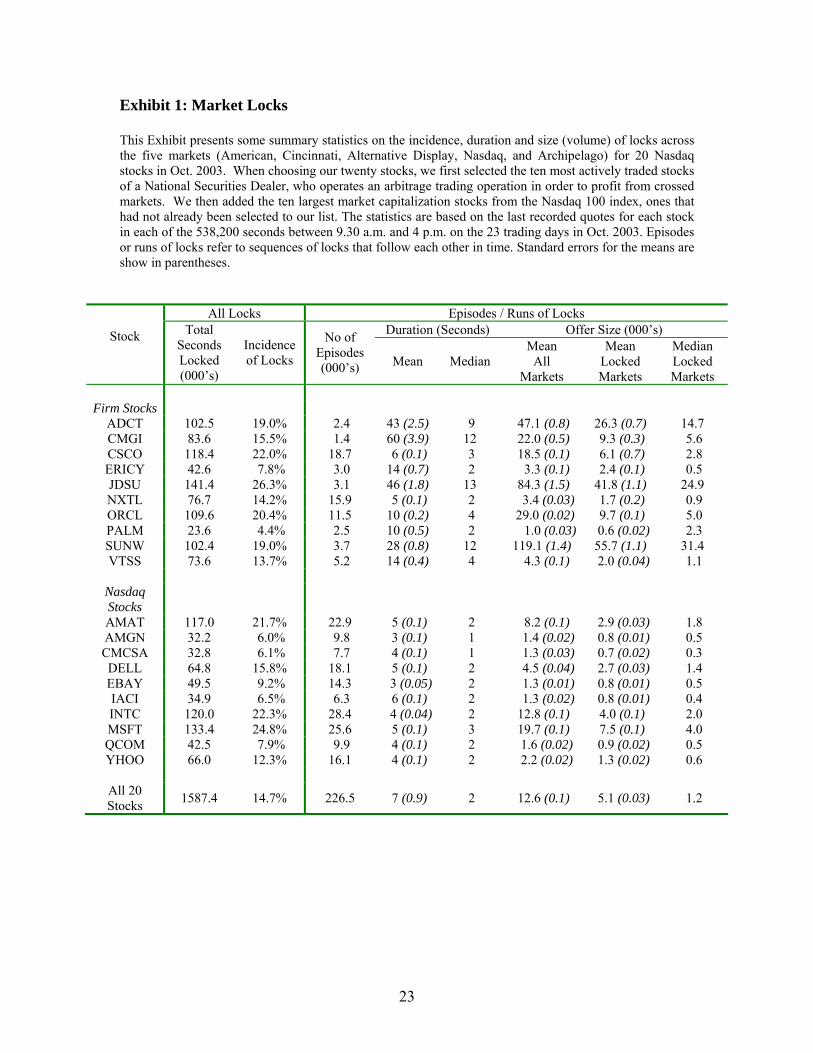
Exhibit 1: Market Locks This Exhibit presents some summary statistics on the incidence, duration and size (volume) of locks across the five markets (American, Cincinnati, Alternative Display, Nasdaq, and Archipelago) for 20 Nasdaq stocks in Oct. 2003. When choosing our twenty stocks, we first selected the ten most actively traded stocks of a National Securities Dealer, who operates an arbitrage trading operation in order to profit from crossed markets. We then added the ten largest market capitalization stocks from the Nasdaq 100 index, ones that had not already been selected to our list. The statistics are based on the last recorded quotes for each stock in each of the 538,200 seconds between 9.30 a.m. and 4 p.m. on the 23 trading days in Oct. 2003. Episodes or runs of locks refer to sequences of locks that follow each other in time. Standard errors for the means are show in parentheses.
All Locks Episodes / Runs of Locks Duration (Seconds) Offer Size (000’s) Stock
Total Seconds Locked (000’s)
Incidence of Locks
No of Episodes (000’s) Mean Median
Mean All
Markets
Mean Locked Markets
Median Locked Markets
Firm Stocks
ADCT 102.5 19.0% 2.4 43 (2.5) 9 47.1 (0.8) 26.3 (0.7) 14.7 CMGI 83.6 15.5% 1.4 60 (3.9) 12 22.0 (0.5) 9.3 (0.3) 5.6 CSCO 118.4 22.0% 18.7 6 (0.1) 3 18.5 (0.1) 6.1 (0.7) 2.8 ERICY 42.6 7.8% 3.0 14 (0.7) 2 3.3 (0.1) 2.4 (0.1) 0.5 JDSU 141.4 26.3% 3.1 46 (1.8) 13 84.3 (1.5) 41.8 (1.1) 24.9 NXTL 76.7 14.2% 15.9 5 (0.1) 2 3.4 (0.03) 1.7 (0.2) 0.9 ORCL 109.6 20.4% 11.5 10 (0.2) 4 29.0 (0.02) 9.7 (0.1) 5.0 PALM 23.6 4.4% 2.5 10 (0.5) 2 1.0 (0.03) 0.6 (0.02) 2.3 SUNW 102.4 19.0% 3.7 28 (0.8) 12 119.1 (1.4) 55.7 (1.1) 31.4 VTSS 73.6 13.7% 5.2 14 (0.4) 4 4.3 (0.1) 2.0 (0.04) 1.1
Nasdaq Stocks
AMAT 117.0 21.7% 22.9 5 (0.1) 2 8.2 (0.1) 2.9 (0.03) 1.8 AMGN 32.2 6.0% 9.8 3 (0.1) 1 1.4 (0.02) 0.8 (0.01) 0.5 CMCSA 32.8 6.1% 7.7 4 (0.1) 1 1.3 (0.03) 0.7 (0.02) 0.3 DELL 64.8 15.8% 18.1 5 (0.1) 2 4.5 (0.04) 2.7 (0.03) 1.4 EBAY 49.5 9.2% 14.3 3 (0.05) 2 1.3 (0.01) 0.8 (0.01) 0.5 IACI 34.9 6.5% 6.3 6 (0.1) 2 1.3 (0.02) 0.8 (0.01) 0.4 INTC 120.0 22.3% 28.4 4 (0.04) 2 12.8 (0.1) 4.0 (0.1) 2.0 MSFT 133.4 24.8% 25.6 5 (0.1) 3 19.7 (0.1) 7.5 (0.1) 4.0 QCOM 42.5 7.9% 9.9 4 (0.1) 2 1.6 (0.02) 0.9 (0.02) 0.5 YHOO 66.0 12.3% 16.1 4 (0.1) 2 2.2 (0.02) 1.3 (0.02) 0.6
All 20 Stocks 1587.4 14.7% 226.5 7 (0.9) 2 12.6 (0.1) 5.1 (0.03) 1.2

24
Exhibit 2: Market Crosses This Exhibit presents some summary statistics on the incidence, duration and size (volume) of crosses for 20 heavily traded Nasdaq stocks in Oct. 2003. See notes to Exhibit 1. Standard errors for the means are show in parentheses.
All Crosses Episodes / Runs of Crosses Duration (Seconds) Offer Size (000’s) Stock
Seconds Crossed (000’s)
Incidence of Crosses
No of Episodes (000’s)
Mean
Median
Mean All
Markets
Mean Crossed Markets
Median Crossed Markets
Firm Stocks
ADCT 0.7 0.1% 0.1 10 (2.3) 3 23.1 (3.0) 10.1(2.3) 4.1 CMGI 0.01 0.0% 0.01 2 (0.7) 1 10.5 (4.6) 4.2 (2.7) 1.2 CSCO 2.1 0.4% 0.6 4 (0.2) 2 15.9 (0.8) 3.4 (0.3) 0.9 ERICY 3.5 0.6% 0.4 9 (1.5) 2 4.6 (0.1) 3.8 (0.7) 0.6 JDSU 1.5 0.3% 0.1 17 (3.0) 8 44.6 (0.9) 18.0 (2.7) 5.5 NXTL 3.3 0.6% 1.3 2 (0.1) 1 3.1 (0.1) 1.4 (0.1) 0.6 ORCL 2.0 0.4% 0.3 6 (0.6) 2 21.1 (1.1) 6.0 (0.6) 1.5 PALM 1.1 0.2% 0.3 4 (0.4) 1 0.9 (0.1) 0.6 (0.1) 0.2 SUNW 1.1 0.2% 0.1 10 (1.4) 4 63.8 (5.5) 24.4 (3.7) 3.7 VTSS 0.7 0.1% 0.2 4 (0.4) 2 3.3 (0.4) 1.6 (0.3) 0.5
Nasdaq Stocks
AMAT 3.6 0.7% 1.0 4 (0.3) 2 8.0 (0.2) 2.2 (0.1) 1.0 AMGN 3.3 0.6% 1.6 2 (0.2) 1 1.5 (0.04) 0.9(0.04) 0.5 CMCSA 1.9 0.3% 0.8 2 (0.1) 1 1.4 (0.1) 0.7 (0.1) 0.3 DELL 5.7 1.1% 1.8 3 (0.2) 1 4.7 (0.1) 2.8 (0.1) 1.0 EBAY 5.4 1.0% 2.9 2 (0.1) 1 1.4 (0.03) 0.9 (0.03) 0.5 IACI 2.2 0.4% 0.8 3 (0.2) 1 1.3 (0.1) 0.8 (0.1) 0.3 INTC 3.4 0.6% 1.1 3 (0.2) 2 12.1 (0.5) 3.3 (0.4) 1.1 MSFT 5.2 1.0% 1.6 3 (0.1) 2 15.6 (0.4) 5.2 (0.2) 1.6 QCOM 2.2 0.4% 0.9 3 (0.1) 1 1.9 (0.1) 0.9 (0.1) 0.4 YHOO 4.3 0.8% 1.9 2 (0.1) 1 2.1 (0.1) 1.1 (0.1) 0.4
All 20 Stocks 53.1 0.5% 17.6 3 (0.1) 1 5.9 (0.1) 2.2 (0.1) 0.6

25
Exhibit 3: Distribution of Crossed Amounts (in Cents) This Exhibit shows the distribution of the weighted crossed amounts when prices are crossed. The crossed amounts (if any) in each of five market are weighted using the relative size at the inside ask in crossed markets as a weight. The sample size is 53.1 thousand, after a few anomalous observations were dropped.
Crossed Amounts (cents)
Mean 1.3 Standard Deviation 1.5
Median
25% Percentile
1
1 50% Percentile 1 75% Percentile 1 80% Percentile 1 90% Percentile 2 95% Percentile 3

26
Exhibit 4: The Incidence of All and New Crosses by Market This Exhibit shows the incidence of crosses in the five markets. New crosses refer to the first observation in a run of crosses respectively. The percentages sum across columns to more than 100%, since crosses can occur simultaneously in a number of markets.
American Cincinnati Alternative Display Nasdaq Archipelago Number
(000’s)
All Crosses 11.7% 15.5% 25.3% 45.6% 34.1% 53.1 New Crosses 7.3% 13.1% 22.3% 41.9% 35.9% 17.7

27
Exhibit 5: The Incidence of Crosses and the Degree of Market Fragmentation This Exhibit reports OLS regression results (with robust standard errors) examining the relationship between the incidence of crosses, volume, volatility and the degree of market fragmentation. The dependent variable is a logit transformation of the incidence of crosses i.e. logit p = ln (p / (1-p)) where p = incidence of crosses and ln denotes a natural log. Volume and volatility are both measured as deviations from their group means (the monthly mean for each stock) in order to eliminate fixed effects. Volatility is measured as the square of ln(phi/plo) where phi and plo are the daily high and low price respectively. We use an entropy measure E to measure market fragmentation. The entropy measure E = - ∑M sm.ln (sm) where sm is the share of market m and the summation is over all markets M, which is generally 5. E ranges from 0 (maximum concentration) to ln M (minimum concentration when market shares are equal). Market size is measured by the average of the inside bid and ask sizes. The number of observations is 460 (20 stocks by 23 trading days). Absolute t statistics, based on heteroscedastic robust standard errors, are shown in parentheses. The robustness of the OLS results to outliers has been checked using LMS (least median of squares) regressions.
Explanatory Variables I II III
Constant -15.06 (11.4)
-15.02 (11.0)
-15.02 (11.0)
Log Volume (dev. from group mean) - 0.47 (1.5)
0.36 (1.3)
Volatility (dev. from group mean) - - 26.58 (0.9)
Fragmentation (entropy E) 6.78 (7.3)
6.76 (7.3)
6.76 (8.4)
Mean of dependent variable 5.45 Standard deviation of dependent variable 2.20 Standard error 2.05 2.04 2.04 Adjusted R2 13.1% 13.6% 13.6% Ramsey Reset Test (P Value) 0.29 0.41 0.53

28
Exhibit 6: An Example of Actual Institutional Trading Costs in 2002-3 This Exhibit sets out some details of the trading costs incurred by our sample NSD firm. The sample is based on 1.3 million trades executed by the firm during the period June 2002 to May 2003. Trades are segregated by common trade sizes and order type. Marketable orders were executed by either sending the order directly to a market center or by routing the order to Knight Trading Group for execution.
Trading Costs Marketable Orders Trade
Size Sent to Market Sent to Knight All
Limit Orders
Mean
≤ 100 $1.23 $0.98 $1.17 $0.85
101-500 $2.37 $1.15 $1.83 $0.73 501-1000 $3.70 $1.26 $2.47 $0.58
1001-2000 $6.33 $1.38 $3.65 $0.29 2001-3000 $8.97 $1.73 $5.06 $0.09 3001-4000 $11.44 $2.22 $5.61 -$0.35
> 5000 $13.07 $3.55 $7.15 -$0.47
Median
≤ 100 $1.20 $1.00 $1.20 $0.90 101-500 $2.00 $1.00 $1.95 $1.00
501-1000 $3.00 $1.00 $2.00 $1.00 1001-2000 $5.00 $1.00 $2.00 $1.00 2001-3000 $7.00 $1.00 $2.50 $1.00 3001-4000 $9.00 $1.00 $3.00 $1.00
> 5000 $11.00 $1.00 $3.50 $1.00
All trade sizes Mean $4.92 $1.74 $3.59 $0.05
Median $2.80 $1.00 $1.70 $0.95 Std. dev. $6.09 $2.31 $5.03 $2.34

29
Exhibit 7: Simulated Trading Profits This Exhibit shows the simulated trading profits on all 4.6 thousand market crosses which lasted a minimum of 3 seconds (approximately 25% of all cross episodes) on our twenty stocks during October 2003. We assume a trader enters their position with a marketable order and then exits their position 3 seconds later. Trading strategy A assumes the position is closed with a marketable order while strategy B assumes the trade is closed with a limit order. NBBO market prices are compiled from the Nastraq and SIP databases. Trading costs are based on the costs set out in Exhibit 6. Trading Strategy A Trading Strategy B All 20 Stocks (4617 Crosses)
Mean profit $4.59* $31.69* Median profit $0.84* $2.09* 25th percentile -$14.48 -$8.71 75th percentile $20.21 $32.70 Total profits $21,171 $146,350 Number of profitable round-trips 53% 56%
10 Firm Stocks (1254 Crosses)
Mean profit $4.24* $52.14* Median profit $2.27* $4.41* 25th percentile -$18.01 -$10.51 75th percentile $39.22 $64.13 Total profits $5,322 $65,380 Number of profitable round-trips 56% 60%
Other 10 Nasdaq Stocks (3363 Crosses)
Mean profit $4.71* $24.08* Median profit $0.84* $2.09* 25th percentile -$13.32 -$8.36 75th percentile $16.52 $25.60 Total profits $15,849 $80,971 Number of profitable round-trips 52% 54%
* Indicates significance at the 1% level.

30
Exhibit 8: Total Trading Profits for Varying Exit Times This Exhibit shows how the total trading profits in Exhibit 7 vary with the duration of the trade. The closing times range from 3 to 19 seconds. .
Duration of Trade Trading Strategy A ($000’s)
Trading Strategy B ($000’s)
Close after (seconds) 3 $21.2 $146.4 4 -$4.6 $120.6 5 -$30.9 $94.3 6 -$51.0 $74.2 7 -$70.0 $55.2 8 -$80.1 $45.1 9 -$94.2 $31.0
10 -$103.3 $21.9 11 -$110.2 $15.0 12 -$116.9 $8.3 13 -$122.4 $2.7 14 -$128.0 -$2.9 15 -$129.7 -$4.6 16 -$133.8 -$8.7 17 -$137.3 -$12.1 18 -$146.6 -$21.5 19 -$147.9 -$22.7