cross-national comparison of monetary - chronic poverty
TRANSCRIPT

1
Cross-national comparison of monetary and multidimensional child poverty in theEuropean Union; puzzling with the few pieces that the EU-SILC provides1
In alphabetical order:
Geranda NottenGraduate School of Public and International Affairs, University of Ottawa
Keetie RoelenMaastricht Graduate School of Governance, Maastricht University
Version: 23 June 2010
WORK IN PROGRESS: CONTACT AUTHORS BEFORE CITING
1 Acknowledgements: We would like to thank Marie-Hélène L'Heureux, Jessica Breaugh and Julie Charestfor their contributions to this research project.
2
1. Introduction
Poverty is a complex phenomenon and the debate around its measurement is longstandingand on-going. This paper links up with two active strands of academic research within thearea of poverty measurement in the European context. Firstly, it addresses the tensionbetween and the extent to which monetary and multidimensional poverty approachescapture similar groups of individuals. The majority of research in this area points towardsa considerable degree of mismatch (Bradshaw & Finch, 2003; Perry, 2002; Richardson,Hoelscher, & Bradshaw, 2008; Wagle, 2009), which does not merely have implicationsfor the academic debate but also for the use of poverty approaches in the policy sphereand the formulation of policy responses (Roelen, Gassmann, & Neubourg de, 2009b;Ruggeri Laderchi, Saith, & Stewart, 2003). Secondly, recent years have witnessed awidespread acknowledgement in both academic and policy circles that children deserve aspecial focus in poverty measurement (Ben-Arieh, 2000; Minujin, A., Delamonica, E.,Gonzalez,E.and Al Davidziuk, 2005; Roelen, Gassmann, & Neubourg de, 2009b). TheEuropean Union (EU) has also acknowledged the need of having child specific indicatorsin monitoring poverty and social exclusion (Richardson et al., 2008) and is currently inthe process of developing, testing and comparing single indicators of child well-beingacross member states (European Commission, 2008).
In this paper, we aim to analyze the degree of overlap for groups of children captured bymonetary and multidimensional poverty measures at a micro-level and in a cross-countrycomparative context. The monetary child poverty approach is based on the relativemonetary poverty measure of 60% of median equivalent income. This is the so-called "at-risk-of-poverty" measure used in the European Union, also for children (Richardson etal., 2008). The multidimensional child poverty approach will be based on a set ofdeprivation indicators in areas such as financial well-being, housing, environment andaccess to basic services. In contrast to a number of recent cross-country comparativestudies on child poverty in rich countries that are based on a diverse set of informationsources (e.g. OECD, 2009; Richardson et al., 2008; UNICEF, 2007), this study uses asingle source of micro-data. This allows for an analysis at the micro-level and assessmentof poverty and deprivation outcomes of individual children rather than a macro analysisof average outcomes between countries. Only a micro-level perspective can inform aboutcumulative deprivation, i.e. the extent which children are simultaneously deprived inmultiple domains. Outcomes of child poverty measures are compared for a selection ofEuropean member states with comparable living standards: Germany, France, theNetherlands and the United Kingdom. The value-added of an empirical application incross-country comparative context is two-fold. From a methodological perspective, theanalysis of cross-national variations among countries with similar living standards helpsto better understand the potential and limitations of newly developed concepts and theirempirical implementation. From a policy perspective, the comparison of monetary andmultidimensional child poverty outcomes across EU member states is also extremelyrelevant: it identifies vulnerable groups in each member state and thus contributes to(re)thinking about (national) targeting practices and policy design of policy responses tochild poverty and comparable numbers foster the exchange of information betweenmember states.

3
The specific questions we aim to answer in this paper include the following: 1) To whatextent does a monetary poverty measure identify the same children as deprivationindicators in other domains? 2) What are the most common combinations of deprivationacross domains of well being for children? 3) What kind of factors are associated withidentifying a child to be i.) in monetary poverty, ii). domain deprived or iii). multipledeprived? For each question we also investigate whether these findings differsystematically across countries. Although a number of studies address the first question(Dekkers, 2003; Dewilde, 2008; Förster, 2005; Moisio, 2004; Whelan, Layte, Maitre, &Nolan, 2001; Whelan, Layte, & Maitre, 2004) they primarily use latent class andconsistent poverty models and do not specifically focus on child poverty. In contrast, thispaper employs count poverty models (Alkire & Foster, May 2008; Atkinson, 2003) andstudies child poverty in particular. Moreover, the second and third research questionsallow us to focus on gaining a deeper insight into the types of deprivations suffered bydifferent groups of children as well as the factors associated with deprivation.
The remainder of the paper is structured as follows: section 2 provides a review of theliterature on both the mismatch between poverty outcomes and child poverty in the EUcontext. The construction of the poverty measures applied in this paper is discussed insection 3 and includes issues pertaining to data, the conceptual framework, domains andindicators and poverty measures. Section 4 analyzes the poverty measures and tests theirrobustness; the research questions are answered in section 5. Finally, we drawconclusions and provide recommendations for further research.
2. Literature review
In this section, we discuss the body of research on those two issues within the povertymeasurement debate that form the core of this paper, namely the tension and mismatchbetween poverty indicators and the issue of child poverty. We focus on the EU context.
2.1 Mismatch between poverty indicators in the EU
The importance of the analysis of different poverty approaches and their degree ofoverlap or mismatch in terms of outcomes has been acknowledged and emphasized bymany scholars (see e.g. Klasen, 2000; Laderchi, 1997; Neubourg de, Roelen, &Gassmann, 2009; Sahn & Stifel, 2003). If different poverty approaches indeed capturedifferent groups in society as poor, the policy responses to reduce poverty might differconsiderably depending on the specific approach used. The misidentification of the pooris especially relevant in terms of targeting (e.g. Klasen, 2000; Sahn & Stifel, 2003) aswell as design (Laderchi, 1997). Within the EU context, a number of studies have beenundertaken to investigate these issues. Some of these have adopted a primarily theoreticalperspective for the development of multidimensional poverty measures in relation to theincome-based poverty measures (e.g. Ayala, Jurado, & Pérez-Mayo, 2009; Bossert,Chakravarty, & D'Ambrosio, 2009; Moisio, 2004; Pérez-Mayo, 2005) whilst others havefocused on the empirical outcomes and their implications of using different types ofpoverty measures (e.g. Bradshaw & Finch, 2003; Coromaldi & Zoli, 2007; Dekkers,

4
2003; Richardson et al., 2008; Whelan et al., 2001). Moreover, studies have eitherfocused on a specific country case (see e.g. Bradshaw & Finch, 2003; Coromaldi & Zoli,2007; Pérez-Mayo, 2005), or cross-country comparisons (see Bossert et al., 2009;Dekkers, 2003; Dewilde, 2004; D’Ambrosioa, Deutsch, & Sibler, 2009; Förster, 2005;Moisio, 2004; Nolan & Whelan, 2009; Whelan et al., 2001). The majority of these studiesconclude that monetary indicators versus alternative or multidimensional indicators donot identify the same groups of individuals as poor. (Bradshaw & Finch, 2003) found thatthe use of three different measures for poverty in the UK results in the identification ofdifferent groups of people defined as poor or socially excluded. (Coromaldi & Zoli, 2007)reach a similar conclusion in the case of Italy, stating that more comprehensive povertymeasures based on multiple domains of deprivation might lead to different resultscompared to analyses solely based on income-based poverty measures. Findings from(Whelan et al., 2001) suggest that there is limited association between certain alternativedomains of deprivation and income poverty and that a measure of combined deprivationis weakly associated with income poverty in the bottom deciles. In a comparative analysisof poverty in Belgium and Britain, (Dewilde, 2004) concludes that different povertymeasures identify different groups as poor. As such, the complementary use of bothmonetary indicators and indicators in other areas of deprivation is widely considered tobe of value-added and beneficial for our understanding of poverty in the EU (Nolan &Whelan, 2009).
Despite the range of evidence on the topic, the majority of empirical studies do not movebeyond the notion that the degree of overlap in poverty outcomes is limited and biasedtowards different groups in society. Little analysis has been undertaken to assess thetypes of cumulative deprivation or factors and dynamics underlying the mismatch ofpoverty outcomes. In a cross-country comparison of Belgium and Britain, (Dewilde,2004) finds that certain groups in society can be considered problematic, regardless of thepoverty measure used whilst other groups are only considered as such using one specificmeasure. (Dekkers, 2003) finds that living in certain household types increases ordecreases the probability to be multidimensionally or financially poor. Especially thoseindividuals living in single households with or without children are more prone to be pooraccording to both approaches, although the size of the effect differs across countries inthe EU. The profiling of consistent poverty by (Förster, 2005) for the enlarged EUsuggests that those with lower levels of educational attainment are more likely toexperience poverty in the income as well as multidimensional sphere. Nolan and Whelan(2009) seek to understand and explain the mismatch between monetary and non-monetarydeprivation indicators primarily by questioning the methods at hand and addressinglimitations inherent to data collection and the measurement of income and non-incomerelated deprivations. Although all studies establish a poverty profile and analyze whichgroups in society are more or less likely to be considered poor in either monetary ormultidimensional terms or both, they lack an investigation into the patterns of cumulativedeprivation and the underlying factors that make these differences occur.

5
2.2 Child poverty in Europe
The widespread acknowledgment that children deserve a special focus in the povertydebate (Ben-Arieh, 2000) has led to increased attention for child poverty in both theacademic as well as policy field. In recent years, a range of studies have been undertakenin the EU that focus particularly on children and provide a contribution to both thescientific and policy debate about child poverty (Bradshaw, Hoelscher, & Richardson,2007a; Bradshaw & Richardson, 2009; OECD, 2009; Richardson et al., 2008; TARKISocial Research Institute & Applica, 2010). These recent studies investigating childpoverty the EU and rich countries emphasize the need for a diversified picture on thebasis of a set of indicators, which includes measures of both material and non-materialdeprivation (e.g. OECD, 2009; Richardson et al., 2008). These conclusions, however, aredrawn on the basis of a macro analysis at country-level rather than at the micro-level. Themajority of studies focus primarily on the investigation of differences across countriesand identifying the best versus worst performers. The Child Well-being Index byBradshaw et al. (2007b) was developed to enable a ranking of EU countries and assesstheir relative performance with respect to a range of different domains of child well-being, thereby using a wide array of available data sources at the country-level. The samemethodology was also applied in the CEE/CIS context (Richardson et al., 2008) andupdated for the EU countries (Bradshaw & Richardson, 2009). OECD’s “Doing Betterfor Children” report (2009) employs a similar strategy and focuses on the country as theunit of analysis, using data that are collected at the country level but do not allow to makeany reference to individual children. TARKI & Applica (2010) do consider the issues ofchild well-being at a micro-level by using the EU-SILC data to analyze child poverty andwell-being on the basis of both monetary and non-monetary indicators but fail toinvestigate the degree or patterns of cumulative deprivation. In particular, this reportrepresents the political commitment from the EU to address the issue of child poverty andwell-being and the momentum the issue has gained in the European debate on povertyand social exclusion (TARKI Social Research Institute & Applica, 2010).
In this paper, we investigate the use of monetary and non-monetary child povertymeasures at the micro-level in a cross-country context from an empirical perspective. Ourmain focus is directed towards the application of these approaches to the data, theconcurrent empirical outcomes and how these relate to those found in other studies. Weaim to provide an insight into the extent to which child poverty measures and poverty riskcharacteristics differ systematically across domains and countries.
3. Constructing the multidimensional and monetary poverty measures
The construction of any poverty measure is a complex process that is inherently pathdependent and involves many choices, each of which influences the measured povertyoutcome. More often than not, these choices result from a trade off between conceptual,technical, normative and practical considerations (Alkire, 2008; Ravallion, 1994). Thestarting point for the development of any poverty approach is the identification of itsspecific purpose and rationale (Roelen, Gassmann, & Neubourg de, 2009b). In terms of

6
this research, our purpose is to construct and compare both monetary andmultidimensional measures of child deprivation that are academically sound and that arealso understandable and relevant for stakeholders using such measures in the policysphere.
Our analysis is thus first and foremost aimed at measuring child poverty and therefore thechild is the unit of analysis. This implies that we focus on the child population as opposedto the overall population (and more specifically: children in the age group 0-17 years).However, to enhance comparability between our estimates and those of non-child povertyfocused studies we also include some estimates made using individuals from all agegroups as the unit of analysis.2 Although our analysis will also involve the comparison ofpoverty outcomes between countries, the purpose of this cross-national comparativeperspective is not to rank countries in terms of child poverty outcomes (Bradshaw,Hoelscher, & Richardson, 2007b; as done in Bradshaw & Richardson, 2009; Richardsonet al., 2008) but to obtain a better understanding of the potential sources of variationbetween monetary and multidimensional child poverty measures. In that sense, countriesare not the unit of analysis.
In order to gain a better understanding of the mismatch between monetary andmultidimensional poverty measures in identifying vulnerable children it is essential tohave the information on all domains for each child available in a single dataset. Thisrequirement is fulfilled by the EU Community Statistics on Income and LivingConditions data. The EU-SILC is the key data source used for estimating and comparingthe degree of monetary poverty and social inclusion across member states in theEuropean Union. It is the only dataset that has cross nationally comparable information toestimate both monetary (i.e. income) poverty and a range of non-income deprivationindicators for every individual in the survey. It is thus also an interesting database toexplore the possibilities of constructing child-focused indicators of deprivation whichcould be used to evaluate and compare levels of child deprivation across member states.
Working with a single data source also requires us to determine the order of aggregationwhen constructing a multidimensional poverty measure. The reason is that such povertymeasures involve multiple indicators and multiple individuals and that one has toaggregate the information across individuals and across well-being domains to obtain apopulation measure of multidimensional poverty; one can thus first aggregate acrossdomains for the same individual and then across individuals or vice versa (Alkire, 2008;Bourguignon & Chakravarty, 2003). As very few poverty measures are path independent,the order of aggregation influences the poverty measure (Alkire & Santos, 2009). Sincechildren are the unit of analysis and we are interested in the degree to which deprivationacross domains overlaps at the level of the individual, we firstly summarize deprivation
2 This is possible because the indicators for the monetary and multidimensional poverty analyses aremeasured at the household level (with the exception of one indicator) and are thus likely to affect all itshousehold members (though not necessarily in the same way or to the same extent). The fact that theselected indicators are observed for children of all age groups in our sample also facilitates the constructionof one-dimensional and multidimensional child poverty indicators. Both issues are discussed at length insection 3.2 but at this point it should be noted that the availability of information for all child age bracketshas not been a key consideration in our search for child relevant indicators in the EU-SILC.

7
across domains for each child and then to child population levels. In fact, given thediversity of domains included in multidimensional approaches in the mismatch literature(as discussed in section 2), comparison of our results to those of other studies alsorequires analyzing the mismatch after the first stage of aggregation (i.e between domains)in order to explain differences in the mismatch between an income poverty measure and acomposite multidimensional poverty measure.
The remainder of this section is structured as follows: section 3.1 shortly introduces theEU-SILC data and explains the rationales behind our selection of countries while sections3.2 and 3.3 discuss the methodological choices concerning the construction of ourmultidimensional and monetary poverty measures.
3.1 Data
The EU-SILC dataset has been constructed with the aim of collecting timely andcomparable cross sectional and longitudinal multidimensional micro data on incomepoverty and social exclusion (European Commission, March 2009c). It was launched in2004 and contains cross-sectional as well as panel data; the most recent wave (2007)covers data from 24 EU Member States, Norway and Iceland. All current households andtheir members residing in the territories are part of the reference population. Thoseindividuals living in collective households and institutions as well as small parts ofnational territories are not included (European Commission, March 2009c). Variablesinclude both household and personal level indicators on income and a range of otherissues that allow for the construction of monetary and multidimensional poverty measuresincluding the EU's benchmark poverty indicators, so-called 'at-risk-of-poverty' rates(Marlier, Atkinson, Cantillon, & Nolan, 2007). In this paper we use the 2007 wave.
The analysis focuses on a subgroup of Member States having comparable livingstandards, namely Germany, France, the Netherlands and the United Kingdom.3 In spiteof this, there are quite some differences in the organization and structure of the societiesin these countries in areas such as demographics, the economy and labor market, socialpolicies and tax systems and it is reasonable to expect that these differences also play animportant role in varying child poverty outcomes between countries (e.g. Whelan &Maitre, 2010; Whelan, Nolan, & Maitre, June 2008). At this point we would like toemphasize that it is not the objective of this paper to explain why and how much of thedifferences in child poverty outcomes can be related to each of these potential country-specific factors. Another consideration driving the selection of countries has been thecomparability of the measured information across countries. The variables in the EU-SILC data are constructed ex post by harmonizing the information from the multi-
3 In addition to the above mentioned countries we also considered Denmark, Finland, Ireland, Spain andItaly but given the depth of the analysis we preferred to restrict the selection to four countries. Italy andSpain have a lower living standard than the selected countries. Denmark and Finland were excludedbecause the income information comes from administrative data. In comparison to survey data,administrative data tend to underestimate income at the lower income levels, which in turn can affect theoverlap between monetary and multidimensional poverty measures (Rendtel, Nordberg, Jäntti, Hanisch, &Basic, January 2004)

8
purpose national surveys that feed into the EU-SILC4; thus differences between variablesacross countries may also arise due to differences in the formulation of questions and datacollection processes in general. It has been our aim to minimize this potential source ofvariation; we established this selection of countries after comparison of the questionnairesand analysis of descriptive statistics for our (pre)selection of indicators. Table 3.1summarizes the sample statistics of each country.
Table 3.1 Sample statisticsDE FR NL UK
total total total totalhouseholds 14,153 10,498 10,219 9,275individuals 31,709 25,907 25,905 21,942children 0-17 6,185 6,314 6,948 4,927
3.2 Multidimensional poverty measure
The construction of the multidimensional poverty measure follows the genericconstruction process by Roelen et al. (2009b) and is discussed in four subsections: therationale and purpose, the conceptual framework of child poverty, the selection ofdomains, indicators and thresholds and finally the construction of a multidimensionalpoverty measure.
3.2.1 Rationale and purposeThe aim of this paper is to analyze the degree of overlap for groups of children capturedby monetary and multidimensional poverty measures at a micro-level and in a cross-country comparative context. More particularly, we aim to address questions pertaining tothe degree and patterns of cumulative deprivation and poverty, the differences betweengroups of children across and within countries and the factors underlying thosedifferences. The study will be firmly grounded in theory and based on previous researchbut take a primarily empirical approach. It aims to contribute to the scientific debateabout the measurement of child poverty and the use of different poverty measures as wellas to the policy discussion on how to identify poor and deprived children and adequatelyaddress their problems.
3.2.2 Conceptual framework
Our multidimensional child poverty concept combines two schools of thought, namelythat of child well-being and child well-becoming (Ben-Arieh, 2000; Fattore, Mason, &Watson, 2007; S. White, 2002). While the first school of thought departs from theperspective that childhood is a state in and of itself, the second perspective departs fromthe concern that children should be prepared for the future and adult life (Ben-Arieh,2000). Although these two paradigms have been largely considered in isolation from each
4 Germany joined the EU-SILC data in the 2005 round. Ex-post quality comparisons between the 2005rounds of Microcensus, GSOEP and EU-SILC data suggest the population groups such as very youngchildren (age 0-4), with low education levels and certain groups of foreign residents are underrepresented inthe EU-SILC (Hauser, 2008). At this point it is not clear to what extent these issues have been resolved inthe 2007 survey round.

9
other, this dichotomy is difficult to uphold in practice. Firstly, there is widespreadagreement that poverty during childhood has life-long adversary effects and damages thedevelopment of a child. For instance, Duncan and Brooks-Gunn (Duncan & Brooks-Gunn, 1997) state that certain events, environmental conditions and the contexts in whichchildren reside influence the skills and competencies that they acquire. Thus a denial ofchild well-being in the present hampers a child’s well-becoming in the future. Secondly,as the well-becoming paradigm views children as “becomings” that grow towardsadulthood the focus is on indicators that measure progress towards this future outcome(Fattore et al., 2007). However, the focus on child well-being now is not merelyjustifiable on the basis of its implications for the future but also because of its intrinsicimportance here and now (Ben-Arieh, 2000; Qvortrup, 1997). The intrinsic importance ofchild well-being also follows the concept of children’s rights (Ben-Arieh, 2000) asstipulated in the Convention of the Rights of the Child (UNHCHR, 1989). Qvortrup(1999) expresses the fear that a sole focus on child well-becoming “[… ] justifies any typeof life for children, provided the end result – that is, the adult person – exhibits positivevalues on a set of success criteria”. Thinking along the lines of a synergetic concept thatcombines the notions of well-becoming and well-being is not new. In his seminal workon the basic needs approach, Streeten (1984, pp. 976) already spelled out that “Theconsumption aspects and the investment aspects of human resource development thusreinforce each other”. Furthermore, policy makers and those responding to and dealingwith children have both their current well-being as well as their future well-becoming inmind ((Moore, Lippman, & Brown, 2004). In sum, the intrinsic value of child povertyand well-being as well as its future consequences calls for an interest in both present andfuture childhood (Qvortrup, 1997).
The adoption of a conceptual framework combining the notions of well-being and well-becoming also allows for the use of another, otherwise separated, conceptual pair inpoverty measurement. The division between opportunity- and outcome based povertyapproaches is one of such conceptual pairs (see Robeyns, 2003). The first approachfocuses on the capabilities, opportunities or instruments that an individual has to his orher disposal to create favourable outcomes (see Robeyns, 2003; Sen, 1999; Wagle, 2002).These instrumental approaches thus carry the notion of responsibility to turnopportunities into outcomes. The second type of approaches focuses on the situation as itis presents itself to the individual at a given point in time, representing an ex-post ratherthan ex-ante poverty approach (Thorbecke, 2008). With respect to the measurement ofchild poverty for policy purposes, a purely instrumental approach poses three keyproblems. Firstly, the degree to which instruments can be transformed into outcomes isdependent on different factors, one of them being age (Sen, 1999; Wagle, 2002). Childrenare highly dependent on their direct environment for the materialization of theiropportunities (H. White, Leavy, & Masters, 2003). Secondly, the use of a purelyinstrumental approach is problematic as policy makers are not merely interested in theinstruments that people have but also in the extent to which these instruments result inbetter outcomes. Thirdly, considering the high dependence of children on their directenvironment for the realization of favorable outcomes, this link is even more difficult toobserve and thus measure. Adopting a hybrid theoretical framework based on theconcepts of both well-being and well-becoming allows for the incorporation of
10
instrumental as well as outcome-based indicators, thereby overcoming conceptualshortcomings inherent to the exclusive adherence to a single concept and creating thepossibility to exploit the scarcely available data to the fullest.
Though largely a consequence of a limited availability of child-specific indicators in theEU-SILC data (as is explained in more detail in the next section), this child povertyanalysis uses similar indicators as those used by other, non-child focused,multidimensional poverty studies. It is important, however, to mention that a conceptualframework combining the notions of child well-being and well-becoming affects theinterpretation of these deprivation indicators (in comparison to adults) because theconsequences of deprivation are potentially more severe for children (as deprivationaffects current well-being and future well-becoming), society and, as emphasized byrights approaches, the high dependency of children on their environment also justifies alarger responsibility for governments to intervene.
3.2.3 Choice of domains, indicators and poverty thresholds
The selection of poverty domains and poverty indicators is an important next step in thedevelopment of multidimensional (child) poverty approaches (see Alkire, 2008; Roelen,Gassmann, & Neubourg de, 2009b; Roelen, Gassmann, & Neubourg de, 2009a). Thechoices made reflect implicit assumptions and value judgments, which should be made asexplicit as possible to prevent the outcomes of the poverty approach to be misunderstoodand misinterpreted (Roelen, Gassmann, & Neubourg de, 2009b). The selection ofdomains and indicators is an iterative process (Moore et al., 2004), which includes initialidentification, clarification and selection on the basis of expert opinions, participatoryprocesses, consensus documents and data assessment (Alkire, 2008).
The purpose of our analysis, and the selected conceptual framework (discussion insection 3.1 and 3.2.2), have implications for the scope of selection of domains andindicators. In the first place, our selection is grounded in the conceptual framework whichrequires that the selected domains and indicators should be informative in terms or childwell-being, child well-becoming or both. Secondly, our aim to compare the outcomes of amultidimensional and monetary approach to child poverty constrains the pool of potentialdomains and indicators to one micro-dataset (the EU-SILC).
In an ideal world, the choices of domains, indicators and poverty thresholds representseparate and consecutive methodological steps that researchers take when constructing ofa multidimensional poverty measure (Alkire & Santos, 2009). However, the practice ofworking with secondary data means that these choices are highly interdependent;particularly when the information is stored in ordinal variables. For instance, respondentsto the survey question “[Can] the household can afford a meal with meat, chicken or fish(or equivalent vegetarian) every second day” reflects a possible outcome that could resultfrom insufficient financial means (European Commission, March 2009a). Respondentscan either answer the question with “yes”, “no” or they can refuse to answer. In theextreme, this implies that the choice on whether or not to include this information meansthat one considers all three methodological steps simultaneously: the choice of domain

11
(financial means); the choice of indicator (capacity to afford meat, chicken or fish) andthe choice of threshold (deprived if household responds affirmative, deprivation in thesense of financial strain).
Table 3.2 domains and deprivation indicatorsDomains – Deprivation indicators
Housing conditionsDwelling has leaking roof, damp walls/floors/foundation, or rot in window frames or floorDwelling is not comfortably warm during winter timeDwelling is overcrowded
Neighborhood conditionsPollution, grime or other environmental problemsCrime violence or vandalism in the area
Access to basic servicesAccessibility of primary health care servicesAccessibility of compulsory school
Financial meansHousehold has payment arrears on mortgage/ rent, utility bills, installments/loan paymentsHousehold cannot afford a meal with meat, chicken, fish (or vegetarian equivalent) every second dayHousehold cannot afford paying for one week annual holiday away from homeHousehold cannot afford a computer for financial reasonsHousehold cannot afford a car for financial reasonsAbility to make ends meet (very difficult)
The selection of indicators in this paper has been guided by a number of principles andchecks. Given the inherent normative nature underlying any poverty concept a keyprinciple is that "an indicator should identify the essence of the problem and have a clearand accepted normative interpretation" (Atkinson et al., 2002, p. 21). This principlereflects they idea that poverty is generally considered a problem of and in our societiesand that policy, to some degree, is aimed at reducing this phenomenon and is evaluatedaccordingly. In practice this means, all other things being equal, that a reduction in apoverty indicator would be considered an improvement. The cross-national perspective ofour analysis and the role of policy within a European Union context5 in particular furtherdirect towards using a universal approach towards measuring poverty and deprivation inthese countries (Ruggeri Laderchi et al., 2003, p. 244). Universality, in this case, impliesthat an indicator should be relevant across the societies included in the povertycomparison. Our assessment on whether a potential indicator complies with theseprinciples (or not) is based on whether the indicator can be interpreted in the light of theConvention of the Rights of the Child (CRC) and whether the indicator has been used /considered by other scholars or authorities (Bradshaw, Hoelscher, & Richardson, 2007b;
5 This also reflects the EU approach to social indicators in general as "policies to achieve social inclusionare the responsibility of the member states, under the subsidiarity principle [and] social inclusion is to bepromoted through the method of open coordination" (Atkinson, Cantillon, Marlier, & Nolan, 2002, p. 20).Given that social policies can be very different, it is thus important to make cross-national comparisons onthe basis of common indicators or indicators that have been constructed using a common method.

12
Bradshaw & Richardson, 2009; European Commission, 2008; OECD, 2009; OECD,2009).6
In addition to the above discussed principles, the selection process of indicators was alsoinfluenced by a more practical consideration: the cross-national comparability of themeasured information. Comparability has been assessed by means of comparison of thecountries’ questionnaires (in their original language) and the analysis of descriptivestatistics of the variables used to construct indicators.
Table 3.2 presents the selected indicators within their respective domains while Table A1in the appendix lists the EU-SILC variables that were considered for inclusion in themultidimensional child poverty measure and Table A2 lists the exact definitions of thevarious indicators. The data allows for the identification of four domains: housingconditions, neighborhood conditions, access to basic services and financial means. Thedefinition of these domains is based on an intuitive grouping of indicators rather than theidentification of latent domains of poverty using tools such as factor analysis or latentclass modeling (see Dewilde, 2004; Whelan et al., 2001). We acknowledge the tensionbetween “[… ] the power of sophisticated methods [… ] and the transparency required toserve the needs of policy-makers and inform public debate” (Nolan & Whelan, 2009) butvalue the transparency of an intuitive approach for the policy debate over a purelyscientific and theoretical discussion, as also in reference to the rationale and purpose ofthis paper. Nevertheless, the domains identified on the basis of an intuitive approachoverlap with those considered contributing to greater social cohesion within the EuropeanUnion (Atkinson et al., 2002).7 Moreover, the importance of well-being in these domainsfor children has been widely recognized. The Convention on the Rights of the Child(CRC), among others, touches upon all the aforementioned domains and also pointstowards the dual role of children reflecting the well-being and well-becoming discourse(UNHCHR, 1989).8 On the one hand, children are citizens in their own right and on the
6 When discussing methods for selection of dimensions, Alkire and Santos (2009) label the first rationale as‘legitimacy’ while the second rationale reflects ‘convention’.7 The indicator in this study has considerable overlap with those used in other European studies (DeWilde,2004; Whelan, Layte and Nolan, 2001; Bradshaw & Richardson, 2009). The definition of domains differsbetween studies. DeWilde (2004) has similar indicators in financial strain domain but her latent variableanalysis for the UK and Belgium (1994-1999 panels) suggests that these indicators should be divided overtwo domains which she labels as 'limited financial means' and 'financial stress'. Using factor analysis,Whelan, Layte and Nolan, (2001, p.361) find five domains that seem to work for all countries in theEuropean Community Household Panel (1994-2000). Their two lifestyle domains overlap with ourfinancial strain domain and the authors sometimes also group both domains in one. Their environmentdomain overlaps with our neighborhood domain while our housing indicators are spread between theirhousing and environment domain. Bradshaw and Richardson (2009) use in part the same indicators anddata as this article (in addition to other data sources). These authors group monetary poverty, economicstrain and lack of consumer durables in one 'material domain'. They also group the housing andneighborhood indicators in one domain (labeled 'housing and environment').8 These domains are particularly touched upon in the CRC’s section that stipulates children’s rights tosurvival and development: “these are rights to the resources, skills and contributions necessary for thesurvival and full development of the child. They include rights to adequate food, shelter, clean water,formal education, primary health care, leisure and recreation, cultural activities and information about theirrights”. Retrieved on 28 January 2010 from UNICEF’s website on the Convention of the Rights of theChild (http://www.unicef.org/crc/index_30177.html).

13
other hand, they are dependant on their families (Bradshaw, Hoelscher, & Richardson,2007b). The CRC also places responsibility on (national) governments “to protect andassist families in fulfilling their essential role as nurturers of children” (UNHCHR, 1989,article 4).
Clearly, the tables show that the EU-SILC only covers a limited number of the pieces thatone would ideally want to include in a multidimensional analysis of child poverty. Whilethere is quite some information on housing conditions, material and financial resources,the information in well-being domains such as health, school, play and parental care ismuch more limited or not collected at all. Moreover, in its current format, the EU-SILCcontains very little information at the level of the child. There is some information onchild care and schooling for children in the age bracket 0-12 years (EuropeanCommission, March 2009c) but the potential indicators that could be constructed do notsatisfy the principle that the indicator has a clear and well-accepted normativeinterpretation.9 As a consequence, all selected indicators are measured at the householdlevel but this, however, does not imply that they are not relevant indicators of childpoverty (Gordon, Nandy, Pantazis, Pemberton, & Townsend, 2003). The requiredassumption is that household level conditions affect all individuals living in thehousehold, including children.10
Within the housing domain there are three indicators of inadequate shelter: overcrowding,inability to keep dwelling comfortably warm during winter and poor conditions of thehousehold's dwelling. The overcrowding indicator is based upon the number of rooms inthe dwelling and the age, number of and relationships between household members. Thelatter two indicators reflect the subjective assessment of the respondent answering thehousing questions of the survey (answer options: yes, no or refuses to answer). Given ourconcept to child poverty, these indicators can be interpreted as indicators of inadequateshelter reflecting an undesirable outcome in itself and, at the same time, these conditionscan play a more instrumental role affecting a child's health, privacy as well as her abilityto play and do homework. A number of other housing indicators were considered but notincluded for various reasons. The questions whether the dwelling has heating and airconditioning facilities were excluded because the absence of air conditioning is notconsidered a serious problem in all member states (thus conflicting the universalityprinciple) and the presence / absence of such facilities is only indirectly related towhether the temperature in dwelling can be kept at comfortable levels or not (thus notreflecting the essence of a problem). Other housing characteristics such as the availabilityof an indoor flushing toilet and bath or shower had very low to zero incidence ratessuggesting that such indicators have lost their salience as deprivation indicators in thesecountries. Finally, the indicator on whether the household has the financial means to keepthe dwelling adequately warm has not been included in this domain because the questionrefers to financial obstacles only.
9 The 2009 EU-SILC also includes a child module but the data for this survey round have not yet beenreleased.10 Of course, the ways in which and degree to which those conditions affect individual members of thehousehold can differ but this information problem cannot be resolved with these data.

14
The domain neighborhood condition captures a number of aspects in the physicalenvironment of children directly or indirectly affecting well-being aspects such assecurity, health (mentally and physically) and children's ability to play outside. Bothindicators are based on whether the respondent feels that neighborhood problems such ascrime or pollution are a problem for the household. A third indicator on whether thehousehold experiences problems with noise from the neighbors / street has been excludedbecause the incidence of the problem was rather high11 and raised the issue whether theindicator reflects an accepted normative interpretation of deprivation / poverty. From amore technical perspective and without further information it is also not possible to assesswhether the noise originates from poor housing (and should thus be included underhousing conditions) and/or noisy neighbors / streets.
The domain access to basic services captures the degree to which the household hasaccess to primary health care services (household members) and schooling (children incompulsory school going age). The concept accessibility refers to "physical and technicalaccess, and opening hours, but not in terms of quality, price and similar aspects"(European Commission, March 2009b, p. 13). Children in the household are deprived ineach of these indicators when the respondent indicated that access was very difficult ordifficult.12 From a child's rights perspective difficult access to these services is considereda violation of rights, thus an inacceptable outcome and one where the government alsohas a responsibility. From a child well-becoming perspective, difficult access can be seenas a potential obstacle to child development in terms of health and education.Notwithstanding, these indicators do not capture important aspects such as the quality ofthese services and / or the consequences of inadequate access. This is information thatone would want to include in a multidimensional analysis of child poverty but that is notavailable within the EU-SILC data. Within this domain we considered including anindicator on accessibility of transport (public transport and / or car) but the questionswere too different to ensure comparability across countries.
The domain financial means refers to the monetary resources of the household anddeprivation in this domain is defined as financial strain. Financial resources areinstrumental to a child's well-being or well-becoming and a lack thereof can affect manydomains. Each of the selected deprivation indicators in this domain expresses one way inwhich financial strain could manifest itself: inability to afford balanced nutrition (fish,meat or a vegetarian equivalent), inability to pay bills in time (utility, loans, rent,
11 Affecting between 18 and 31 % of the children in each of the countries: France: 18%, United Kingdom:20%, Germany: 25% and the Netherlands: 31%.12 There are four response categories: very easy, easy, difficult and very difficult. This is a household levelindicator: if the household has several children who are each going to different schools the indicator reflectsthe most difficult school to access. The sensitivity analysis for the use of different thresholds is reported inthe Appendix in Tables A4 and A5. Changing the threshold from 'difficult' to 'very difficult' will reducedeprivation rates to around 1% of the population; the declines in Germany are very large. One would expectthat a more austere threshold would also reduce domain level deprivation rates to some extent; for Germanyit could also affect the mismatch / overlap patterns. Missing values due to non-use of school services areassociated with household having only children of very young age or age 16 and 17 (thus children underand above compulsory school going age). We recoded these missing values as non-deprived. The agedistribution of missing values due to non-use is reported in Table A6 in the appendix.
15
mortgage), an inability to afford assets or engage in activities that are considered 'normal'in affluent societies (car, computer, one week holiday away from home) and the ability tomake ends meet.13 In addition to the above-mentioned indicators which are also used associal inclusion indicators in the European Union, the EU-SILC has more information onfinancial resources which we did not include for various reasons. For methodologicalreasons, the indicator on income poverty has explicitly been excluded from the financialmeans domain as we want to make a clear comparison between that the use of thatindicator, reflecting monetary poverty, and the multidimensional poverty indicator. Theindicator regarding the capacity to face unexpected financial expenses has been excludedbecause the phrasing of the question implicitly departs from the view that it is moredesirable to finance unforeseen expenses with savings than with debt.14 Though this maybe an interpretation that has general support in the European Union there are likely to begroups that rely on loans to cover unforeseen expenses but there is no correspondingquestion that provides information on household's perceived access to loans. Otherindicators that were initially identified but are not selected include the possession ofassets such as a washing machine or TV; the incidence of the population who are unableto afford such assets is very small to zero (i.e. the embedded threshold is too low to be ofrelevance in these countries). The inability to keep the house comfortably warm (forfinancial reasons) has also been excluded because of the high overlap with the housingindicator.
3.2.4 Construction multidimensional poverty measure
The previous section established the rationale for the choice and interpretation ofdeprivation indicators within their corresponding domains of child well-being and well-becoming (13 indicators covering 4 domains). In this section the focus is on how toaggregate this information from a single indicator level to a domain and multi-dimensional level to reflect poverty levels in a population. The construction of suchpoverty measures involves choosing an identification criterion (i.e. when is someone poorin a given domain and overall), setting weights (i.e. the contribution of a particulardomain to overall ill-being) and selecting poverty measures (i.e. what aspects of povertythe aggregate statistics convey) (see Alkire, 2008).
The debate concerning appropriate methods for the identification and quantification ofpoverty is one of all times (see e.g. Chakravarty, 2006; Dekkers, 2003; Dewilde, 2008).
13 Except for the ability to make ends meet, all financial strain indicators as based on questions requiring ayes / no response and thus the deprivation threshold is embedded in the question. As for the ability to makeends meet question, the respondent had 6 response categories ranging from very difficult to very easy andwe set the deprivation threshold at "difficult". The sensitivity analysis for the use of different thresholds isreported in the Appendix in Table A7. Changing the threshold from 'difficult' to 'very difficult' will reducedeprivation rates considerably for all countries; for the UK and France the difference between child andpopulation deprivation rates will be less pronounced. The more austere threshold would also reduce domainlevel deprivation rates to some extent.14 Incidence of children living in households that are unable to face unexpected financial expenses (ofapproximately 800-850 Euro) without lending: Germany (41%), France (39%), The Netherlands (23%) andthe United Kingdom (35%).

16
The choice of methodology for the measurement of multidimensional poverty in manystudies responds to the notion that setting thresholds to separate the poor from the non-poor is an inherently arbitrary one. Consequently, many scholars opt for methodologiesthat avoid the establishment of cut-off points by using latent class models or fuzzy sets(see e.g. Chakravarty, 2006; Dekkers, 2003; Dewilde, 2008; Duclos, Sahn, & Younger,2006). Within these models, the poverty frontier is considered to be a latent concept thatis unknown and unobservable (Dekkers, 2003; Duclos et al., 2006) but can beapproximated by the observable indicators. Poverty is an inherently ambiguous concept(Chakravarty, 2006) and it is widely acknowledged that the establishment of thresholdsand poverty lines, albeit at the level of the individual indicators or the aggregateindicator, is a normative process (Duclos et al., 2006) that is subject to value judgments(Alkire, 2008; Roelen, Gassmann, & Neubourg de, 2009b). Methods such as latent classmodels and fuzzy sets are not susceptible to this shortcoming as the distinction betweenpoverty and non-poverty is derived from underlying structures in the data. Although thisis a large advantage from a scientific perspective, it is a disadvantage when one considersthe ways in which the information stemming from multidimensional poverty analyses isused beyond academic circles. The use of latent class models might remove subjectivityand value judgments about the classification of poverty but it also introduces a loss ofintuitive understanding (Nolan & Whelan, 2009) and, more importantly, it does notresolve the fact that poverty intrinsically is a normative concept that attempts to capture asituation that is deemed as unacceptable by society itself. Not surprisingly, a review ofstudies on multidimensional poverty measurement used in the policy area indicates thatnone of these approaches are based on technically sophisticated methods such as latentclass models or fuzzy sets (see for instance Bradshaw & Richardson, 2009; EuropeanCommission, 2008; UNICEF, 2005). We therefore opt for an approach that classifies achild’s poverty status on the basis of observable indicators and the explicit definitionpoverty thresholds within and across domains of deprivation. We thereby follow the setof ‘counting’ approaches to multidimensional poverty measurement that has recentlybeen synthesized and further developed by (Alkire & Foster, May 2008).
Within Alkire and Foster's counting approach there are three ways to establish whether anindividual is poor in a multidimensional sense. On the extremes, the union approachdeems that a person is poor if he/she is poor in at least one domain while the intersectionapproach requires that a person is poor only if he/she is deprived in every domain. Thedual-cut off approach is a hybrid that consists of the establishment of a second thresholddetermining the minimum number of domains in which an individual should be deprivedin order to be considered poor in a multidimensional sense. Since the information in theEU-SILC at best only captures a handful of the domains deemed relevant for child well-being and well-becoming, this paper illustrates the results for the multidimensionalpoverty measures using all three approaches. The remainder of the analysis focuses onthe overlap between domains and the monetary poverty indicator. Further, since there areseveral deprivation indicators per domain it is also necessary to specify an identificationcriterion that establishes when a child is considered poor in a particular domain. In ouranalysis a child is domain deprived when he/she is found deprived according to at leastone indicator. The main rationale underlying this choice is that deprivation in a particular
17
domain can manifest itself in various ways and that a person deprived according to oneindicator may not necessarily be deprived according to another indicator.
The weights choice essentially involves making an assessment of the degree to which aparticular domain contributes to overall well-being. If one deems that each domain hasequal importance, this implies that each domain should have an equal weight indetermining the value of the poverty measure. If this is not the case, one should assesshow much more or less relevant this domain is. As our conceptual framework emphasizesthe difficulty of disentangling the effects of deprivation on current child well-being andfuture child well-becoming, we opt for equal weighting of domains.
Alkire and Foster (2008) adapted the widely used Foster Greer Thorbecke monetarypoverty indices (Foster, Greer, & Thorbecke, 1984) to the measurement ofmultidimensional poverty. These so-called Alkire Foster measures can be calculated fromordinal data while still capturing various aspects of multidimensional poverty includingthe multidimensional poverty rate (i.e. headcount rate), the breadth of poverty (i.e.headcount adjusted for the average number of domains in which people a deprived), thedepth of poverty (additionally taking into account the depth of deprivation in eachdimension) and inequality among the poor (attributing higher values to larger povertygaps)(Alkire & Santos, 2009, p. 148-149). We focus on the headcount and adjustedheadcount poverty measures. Being the most frequently used measure, the headcountmeasure allows comparison of our results regarding the mismatch between the monetaryand multidimensional poverty indicators to those of other studies. The adjusted headcountmeasure is a better measure because it is sensitive to the number of domains in whichpersons are deprived; it satisfies the dimensional monotonicity principle which states thatif an individual becomes deprived in one more domain, the multidimensional povertymeasure should increase.15
3.3 Monetary poverty measure
In market based economies monetary poverty measures capture an important componentof household’s financial means, namely their income. This paper uses the EuropeanUnion financial poverty indicator which is constructed comparing a household’s adultequivalent income to a relative poverty line that is set at 60% of national mediandisposable income (European Commission, January 2009). It is important to note that themonetary poverty indicator is based on a nationally specified poverty threshold while thethresholds for the multidimensional deprivation indicators are the same across all EUmember states (i.e. the reference community for establishing the poverty thresholds isdifferent).
Disposable household income includes income from wages and salary, earnings from selfemployment, capital, private transfers and a wide range of social protection benefits. Likeall variables in the EU-SILC data, the household income variables are harmonized
15 Both poverty measures satisfy a number of desirable properties (anonymity, replication invariance, focus,subgroup consistency and decomposability) but they do no not satisfy the monotonicity and transferprinciples (Alkire & Foster, May 2008).

18
through a series of post data collection methods. Eurostat considers that the incomevariable in this study are either fully comparable (The Netherlands) or largely comparableto other EU member states (United Kingdom, Germany and France). Table A3 in theappendix summarizes comparability issues for the countries in our study.
To arrive at equivalent adult income, household's disposable income is subsequentlyadjusted for the demographic composition of the household using the modified OECDequivalence scales.16 A household and all its members are considered ‘at-risk-of-poverty’if the household’s adult equivalent income falls below the poverty line; a child is poorwhen she lives in an income poor household. Although various aggregate measures forincome poverty exist, the nature of the multidimensional poverty indicators andunderlying data implies that we can only make a comparison on the basis of theheadcount poverty measure.
4. Poverty results and sensitivity analyses
This section discusses poverty estimates at indicator and domain levels and performs testsof their sensitivity. The latter is crucial for any poverty analysis as it tests the robustnessof results to key methodological choices. The analysis takes us through three levels ofaggregation; starting with indicator deprivation rates, followed by domain deprivationrates and ending with cumulative deprivation across domains. At every level we examinethree perspectives: comparison between deprivation indicators/domains, comparison ofdeprivation between countries and comparison of child deprivation to populationdeprivation. Only when confidence intervals are not overlapping, differences indeprivation are pointed out.17
Indicator level (Table 4.1)
Starting at the indicator level, a first observation is that deprivation rates differconsiderably across indicators.18 Indicators referring to the affordability of a holiday, theexperience of pollution or environmental problems and the presence of leaks or damp inthe house display relatively high deprivation rates (13-32 percent for children) whileindicators referring to the affordability of assets such as a computer or car areconsiderably lower (2-7 percent for children). Monetary poverty rates lie between thosetwo sets of indicators.
In terms of differences across countries, indicator deprivation rates tend to be the lowestfor the Netherlands and highest for Germany and France. Monetary poverty is highest inthe UK. A closer look into the patterns of indicator deprivations across indicators andacross countries shows considerable variation. For example, whilst the UK portrays the
16 The modified OECD equivalence scale gives a weight of 1 to the first adult in the household, a weight of0.5 to other members aged over 14 years and a weight of 0.3 for children under age 14.17 All point estimates and confidence intervals have been estimated taking the specific sampling design ofeach country into account (individual survey weights and primary sampling units).18 Tables A8 to A11 in the appendix report the pair wise correlations between all deprivation indicators atthe level of the child.

19
highest crime deprivation rates (28 percent for children) and the lowest deprivation ratewith respect to pollution (13 percent for children), this picture is completely opposite forGermany (12 versus 21 percent for children). Furthermore, the problem of being unableto afford a holiday is almost twice as high as crime deprivation in Germany and France,whilst crime presents a larger problem in the Netherlands than the ability to afford aholiday. Findings by TARKI and Applica (TARKI Social Research Institute & Applica,2010) also point to cross-country variation in deprivation rates when consideringovercrowding and the affordability of assets.
Comparing the total population to children, we also find a diversified picture withdifferent patterns across indicators and countries. This is in contrast to the widelyaccepted assumption that children are generally at a higher risk to be deprived than adultsare (see, for example, TARKI Social Research Institute & Applica, 2010)19. Whilstchildren across counties tend to be more disadvantaged in the overcrowding, arrears andmonetary poverty indicators, we can not observe such a systematic disadvantagedposition with respect to other indicators. In a number of cases the disadvantaged positionof children for specific indicators is different for different countries. For instance inFrance and the UK children have a higher risk of living in a household that experiencesdifficulties making ends meet, UK and German children have a higher risk of living inhouseholds that cannot afford a one week holiday and German children have a higher riskof living in a house with leaks/damp.
Domain level (Table 4.2 and 4.3)
Moving the analysis from the indicator to the domain level makes the picture slightlymore consistent. Child deprivation rates with respect to access to basic services arelowest in comparison to the other domains, ranging from 12 percent in the UK to 23percent in Germany. With the exception of the Netherlands, the financial strain domaindisplays the highest child deprivation rates, ranging from 22 percent in the Netherlands to41 percent in Germany and the UK. Monetary child poverty rates are considerably lowerfor all countries with lowest rates for the Netherlands and Germany closely followed byFrance and the highest rate for the UK. Monetary child poverty displays the lowestdeprivation rate in comparison to all other domains for Germany, hovers around thelowest domain deprivation rate of accessibility to services for France and the Netherlandsbut is considerably higher in the UK.
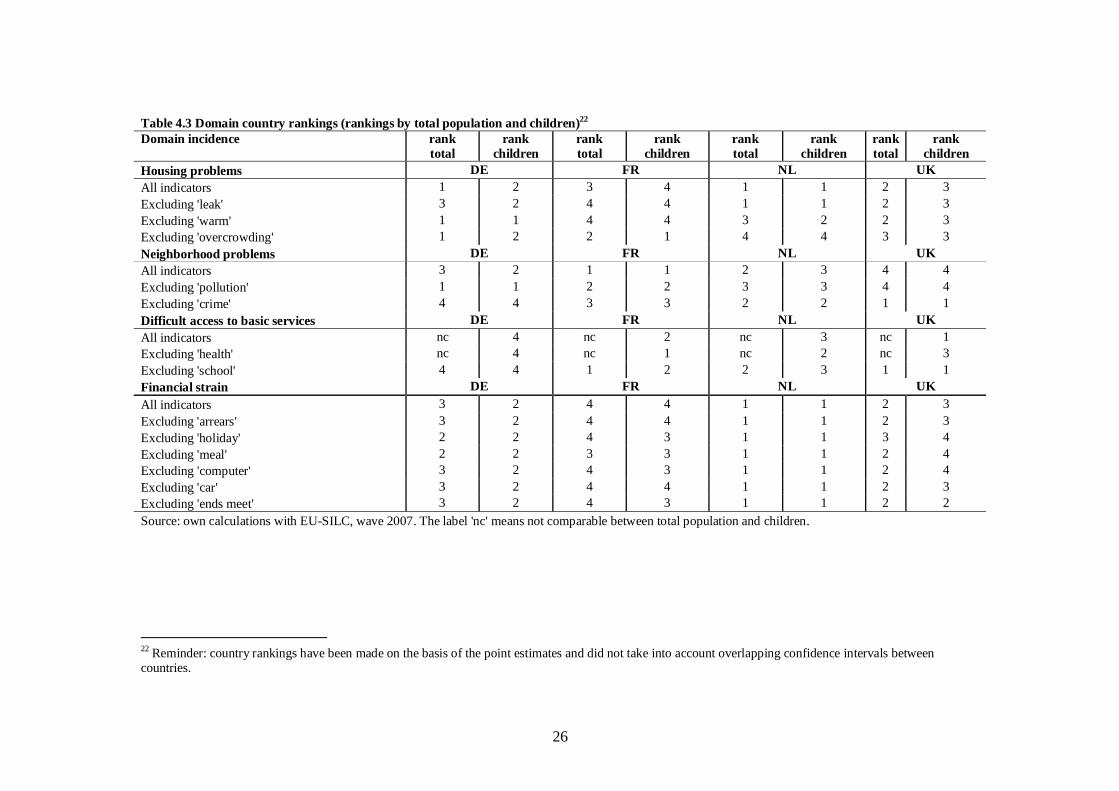
Country rankings across child deprivation domains are less consistent and do not pointtowards a specific country as best or worst performer. DeWilde (2008) already pointedout that the use of a broader set of indicators and domains, including both monetary andnon-monetary aspects, leads to conflicting patterns. Whilst one country might rank highwith respect one aspect, it might be amongst the worse performing countries concerninganother aspect. This finding is confirmed here. Confidence intervals are quite wideindicating that many of the differences in rates between countries are not statisticallysignificant, thereby limiting the scope of a robust ranking of countries. Estimates for thefinancial strain domain, however, clearly indicate that the Netherlands has the lowest
19 Reminder: check if the UNICEF, EU and OECD report make such claims.

20
deprivation rates, followed by Germany, the UK and France at roughly similar levels ofdeprivation. Whelan et al (June 2008) also found that countries with a Social Democraticwelfare regime, which represents the Netherlands, experience the smallest degree ofconsumption deprivation. The ranking of countries within the financial strain domain isalso remarkably robust to changes in the selection of deprivation indicators. By contrast,results are less robust in the neighborhood domain, where the UK ranks last when thecrime indicator is included but first when this indicator is disregarded. Finally, whendifferences in domain deprivation rates across countries are significant, they are alsoconsiderable. Whilst the child deprivation rate for the access to services domain is 12percent in the UK, it is almost twice as high in Germany at 23 percent. The financialstrain domain shows a similar discrepancy with a domain deprivation rate of 22 percentfor the Netherlands and levels that are almost twice as high in the UK and France.Finally, the inclusion or exclusion of a deprivation indicator in a domain has considerableinfluence on the consequent domain deprivation rate. The indicator referring to theaffordability of a holiday is most sensitive as its exclusion reduces domain deprivation forchildren by 10 percentage points in France, Germany and the UK20. Although we did notinvestigate this issue in our sensitivity analyses, the definition of domains also affectsdeprivation rates and country rankings. For instance, Bradshaw and Richardson defineone material deprivation domain that includes income poverty together with the financialstrain indicators. As a consequence of the inclusion of income poverty, the unfavorableposition of the UK is exacerbated in their country ranking (the UK performs much worsethan Germany and France while our studies shows that without income poverty France isthe worst performer in financial strain). A similar effect takes place in the housing andneighborhood dimensions which are grouped as one in Bradshaw and Richardson (2009).
In terms of the comparison between the total population and children, we find that thepicture now points more firmly to children as a disadvantaged group: children are morelikely to be deprived in the housing and financial strain domains. In the neighborhood andaccess to basic services domains higher point estimates for children typically havepartially overlapping confidence intervals for those of the population. These results arerelatively robust to changes in the definition of domains (i.e. inclusion or exclusion ofdeprivation indicators). This pattern is less strong in the Netherlands though; Dutchchildren are only more at risk according to two definitions of the housing domain. Thereis further an interesting cross-national pattern between monetary poverty and the housing/ financial strain domains. Dutch children are more at risk in terms of monetary povertybut not in the financial strain domain; British children are more at risk of monetarypoverty and in the housing and financial strain domain; French children have a slightlyhigher monetary poverty risk but clearly a higher deprivation risk in housing andfinancial strain domain; while German children have a lower monetary poverty risk but ahigher deprivation risk in housing and financial strain domains. This findingcomplements DeWilde's (2008)finding in the sense that when using a broader set of
20 The sensitivity of domain deprivation rates is highly dependent on the size of the indicator deprivationrates that are in-or excluded due to the use of the union approach as method of aggregation. The ex- orinclusion of indicators with high deprivation rates are likely to de- or increase domain deprivation rates,especially if indicators are weakly correlated.

21
domains than income poverty, conflicting patterns arise not only between countryrankings but also between population groups within a country.

22
Table 4.1A Indicator deprivation rates (in percentages, confidence intervals between brackets21)DE FR NL UK
total children 0-17
total children 0-17
total children 0-17
total children 0-17
% % % % % % % %Housing problemsleaks/damp present in house 13.0 16.1 14.2 15.7 18.3 20.1 14.7 17.3
[12.4,13.7] [14.7,17.6] [13.4,15.1] [14.2,17.4] [17.2,19.5] [18.2,22.2] [13.7,15.7] [15.5,19.2]unable to keep house warm 5.4 6.4 4.7 4.6 1.6 1.9 4.6 5.2
[5.0,5.8] [5.5,7.4] [4.1,5.3] [3.8,5.5] [1.3,2.1] [1.2,3.0] [4.0,5.3] [4.0,6.6]overcrowding 6.7 9.1 10.3 14.9 2.7 4.7 6.5 12.0
[6.2,7.2] [7.9,10.4] [9.2,11.6] [13.2,16.9] [2.2,3.4] [3.6,6.2] [5.6,7.4] [10.3,13.9]Neighborhood problemsexperienced pollution/environmentalproblems 21.7 20.9 16.6 15.4 13.8 13.4 13.1 13.1
[20.9,22.5] [19.3,22.5] [15.4,18.0] [13.6,17.4] [12.9,14.8] [11.9,15.0] [12.2,14.1] [11.6,14.6]experiencedcrime/violence/vandalism 12.2 12.3 16.4 15.5 17.7 17.7 27.1 28.3
[11.6,12.9] [11.1,13.7] [15.3,17.6] [13.9,17.3] [16.6,18.7] [16.1,19.5] [25.8,28.4] [26.3,30.4]Difficult access to basic servicesdifficult to access primary healthcare 11.3 12.5 5.9 7.6 9.0 8.8 6.3 4.7
[10.7,11.9] [11.2,13.9] [5.3,6.6] [6.5,8.9] [8.3,9.7] [7.7,10.1] [5.7,7.0] [3.7,5.8]difficult to access compulsoryschool nc 16.4 nc 6.8 nc 7.2 nc 8.1
[15.0,17.9] [5.8,7.9] [5.9,8.7] [6.8,9.7]Source: own calculations with EU-SILC, wave 2007. Standard errors are calculated taking into account the survey sampling design. The label 'nc' means notcomparable between total population and children.
21 Standard errors are calculated taking into account the survey sampling design.

23
Table 4.1B Indicator deprivation rates (in percentages, confidence intervals between brackets)DE FR NL UK
total children 0-17 total children0-17
total children0-17
total children0-17
% % % % % % % %Financial straincombined arrears indicator 6.0 7.7 9.3 12.9 4.3 5.1 8.5 14.0
[5.5,6.5] [6.7,8.9] [8.5,10.1] [11.4,14.4] [3.7,5.0] [4.1,6.4] [7.7,9.4] [12.3,15.9]not able to afford holiday 24.4 30.1 30.0 32.5 14.2 13.7 21.4 30.4
[23.5,25.2] [28.2,31.9] [28.8,31.2] [30.5,34.6] [13.2,15.3] [11.9,15.9] [20.2,22.6] [28.2,32.7]cannot afford meat etc every second day 10.4 11.2 6.2 6.4 1.5 1.1 3.9 4.8
[9.9,11.0] [9.9,12.5] [5.6,6.9] [5.4,7.6] [1.2,1.8] [0.8,1.6] [3.4,4.6] [3.8,6.0]cannot afford a computer 3.4 2.2 6.4 7.0 1.6 0.6 4.1 5.5
[3.2,3.8] [1.7,2.8] [5.8,7.0] [6.0,8.1] [1.2,2.0] [0.2,1.6] [3.6,4.6] [4.5,6.7]cannot afford a car 5.0 4.1 3.3 3.5 5.5 4.6 4.9 6.7
[4.7,5.4] [3.4,4.8] [2.6,4.0] [2.7,4.6] [4.7,6.3] [3.4,6.2] [4.2,5.6] [5.5,8.3]difficult to make ends meet 6.0 6.7 15.5 20.3 10.4 12.1 13.6 20.2
[5.6,6.5] [5.8,7.7] [14.6,16.5] [18.5,22.2] [9.5,11.4] [10.4,14.2] [12.7,14.7] [18.3,22.3]Monetary povertyincome poor 15.2 13.9 13.1 15.7 10.2 13.9 19.1 23.0
[14.5,15.9] [12.6,15.4] [12.3,14.1] [14.0,17.5] [9.1,11.4] [11.7,16.5] [18.1,20.2] [20.9,25.1]Source: own calculations with EU-SILC, wave 2007. Standard errors are calculated taking into account the survey sampling design.

24
Table 4.2A Domain incidence rates (in percentages, confidence intervals between brackets)Domain incidence total children
0-17total children
0-17total children
0-17total children
0-17Housing problems DE FR NL UKAll indicators 21.2 25.7 24.4 29.0 21.2 24.3 22.3 28.5
[20.4,22.0] [24.0,27.5] [23.2,25.6] [26.8,31.2] [20.0,22.5] [22.2,26.5] [21.1,23.6] [26.4,30.8]Excluding 'leak' 11.2 14.2 14.1 18.4 4.2 6.3 10.5 16.0
[10.6,11.9] [12.8,15.7] [12.9,15.3] [16.5,20.5] [3.6,5.0] [5.0,8.0] [9.5,11.6] [14.1,18.1]Excluding 'warm' 18.2 22.8 21.8 26.5 20.4 23.9 19.7 26.1
[17.5,19.0] [21.1,24.5] [20.7,23.0] [24.4,28.7] [19.3,21.7] [21.8,26.2] [18.5,20.9] [23.9,28.3]Excluding 'overcrowding' 16.5 19.7 17.3 18.7 19.1 20.7 17.7 20.6
[15.8,17.2] [18.2,21.3] [16.3,18.3] [17.1,20.5] [18.0,20.3] [18.7,22.8] [16.6,18.8] [18.7,22.6]Neighborhood problems DE FR NL UKAll indicators 27.4 26.4 27.2 25.3 27.3 26.7 34.0 35.2
[26.5,28.3] [24.6,28.1] [25.6,28.8] [23.1,27.7] [26.0,28.6] [24.7,28.7] [32.7,35.4] [33.0,37.3]Excluding 'pollution' 12.2 12.3 16.4 15.5 17.7 17.7 27.1 28.3
[11.6,12.9] [11.1,13.7] [15.3,17.6] [13.9,17.3] [16.6,18.7] [16.1,19.5] [25.8,28.4] [26.3,30.4]Excluding 'crime' 21.7 20.9 16.6 15.4 13.8 13.4 13.1 13.1
[20.9,22.5] [19.3,22.5] [15.4,18.0] [13.6,17.4] [12.9,14.8] [11.9,15.0] [12.2,14.1] [11.6,14.6]Difficult access tobasic services DE FR NL UK
All indicators nc 22.7 nc 13.6 nc 14.4 nc 12.0[21.1,24.5] [12.2,15.2] [12.8,16.2] [10.4,13.8]
Excluding 'health' nc 16.4 nc 6.8 nc 7.2 nc 8.1[15.0,17.9] [5.8,7.9] [5.9,8.7] [6.8,9.7]
Excluding 'school' 11.3 12.5 5.9 7.6 9.0 8.8 6.3 4.7[10.7,11.9] [11.2,13.9] [5.3,6.6] [6.5,8.9] [8.3,9.7] [7.7,10.1] [5.7,7.0] [3.7,5.8]
Source: own calculations with EU-SILC, wave 2007. Standard errors are calculated taking into account the survey sampling design.The label 'nc' means not comparable between total population and children.

25
Table 4.2A Domain incidence rates (in percentages, confidence intervals between brackets)Domain incidence total children
0-17total children
0-17total children
0-17total children
0-17Financial strain DE FR NL UKAll indicators 32.7 37.5 37.7 41.4 22.3 21.5 30.7 41.3
[31.8,33.6] [35.5,39.4] [36.4,38.9] [39.2,43.5] [21.0,23.6] [19.4,23.9] [29.4,32.0] [39.0,43.5]Excluding 'arrears' 31.0 35.8 36.1 39.8 20.9 19.9 28.9 38.8
[30.1,31.9] [33.9,37.7] [34.9,37.4] [37.7,42.0] [19.7,22.2] [17.8,22.2] [27.6,30.2] [36.5,41.0]Excluding 'holiday' 20.9 21.7 24.2 29.1 17.2 17.4 22.8 31.4
[20.1,21.7] [20.1,23.4] [23.1,25.4] [27.1,31.2] [16.1,18.4] [15.4,19.6] [21.6,24.0] [29.2,33.6]Excluding 'meal' 30.3 34.6 37.1 40.9 21.9 21.2 30.3 41.1
[29.4,31.2] [32.7,36.5] [35.8,38.3] [38.8,43.1] [20.7,23.2] [19.1,23.5] [29.0,31.7] [38.8,43.3]Excluding 'computer' 31.8 37.2 36.6 40.5 22.0 21.3 29.7 40.6
[30.9,32.8] [35.3,39.2] [35.4,37.8] [38.4,42.7] [20.7,23.2] [19.2,23.5] [28.4,31.0] [38.4,42.9]Excluding 'car' 31.5 36.8 37.2 41.0 20.3 20.8 29.8 40.7
[30.6,32.4] [34.9,38.8] [35.9,38.4] [38.9,43.2] [19.1,21.5] [18.7,23.1] [28.5,31.2] [38.5,43.0]Excluding 'ends meet' 31.9 36.5 35.7 38.6 19.1 17.8 27.0 36.5
[31.0,32.9] [34.6,38.4] [34.5,37.0] [36.5,40.7] [17.9,20.4] [15.7,20.0] [25.7,28.3] [34.2,38.9]Monetary poverty DE FR NL UKIncome poor 15.2 13.9 13.1 15.7 10.2 13.9 19.1 23.0
[14.5,15.9] [12.6,15.4] [12.3,14.1] [14.0,17.5] [9.1,11.4] [11.7,16.5] [18.1,20.2] [20.9,25.1]Source: own calculations with EU-SILC, wave 2007. Standard errors are calculated taking into account the survey sampling design.
26
Table 4.3 Domain country rankings (rankings by total population and children)22
Domain incidence ranktotal
rankchildren
ranktotal
rankchildren
ranktotal
rankchildren
ranktotal
rankchildren
Housing problems DE FR NL UKAll indicators 1 2 3 4 1 1 2 3Excluding 'leak' 3 2 4 4 1 1 2 3Excluding 'warm' 1 1 4 4 3 2 2 3Excluding 'overcrowding' 1 2 2 1 4 4 3 3Neighborhood problems DE FR NL UKAll indicators 3 2 1 1 2 3 4 4Excluding 'pollution' 1 1 2 2 3 3 4 4Excluding 'crime' 4 4 3 3 2 2 1 1Difficult access to basic services DE FR NL UKAll indicators nc 4 nc 2 nc 3 nc 1Excluding 'health' nc 4 nc 1 nc 2 nc 3Excluding 'school' 4 4 1 2 2 3 1 1Financial strain DE FR NL UKAll indicators 3 2 4 4 1 1 2 3Excluding 'arrears' 3 2 4 4 1 1 2 3Excluding 'holiday' 2 2 4 3 1 1 3 4Excluding 'meal' 2 2 3 3 1 1 2 4Excluding 'computer' 3 2 4 3 1 1 2 4Excluding 'car' 3 2 4 4 1 1 2 3Excluding 'ends meet' 3 2 4 3 1 1 2 2Source: own calculations with EU-SILC, wave 2007. The label 'nc' means not comparable between total population and children.
22 Reminder: country rankings have been made on the basis of the point estimates and did not take into account overlapping confidence intervals betweencountries.

27
(Aggregating) across domains (Figure 1, Table 4.4 and 4.5)
Figure 4.1 and Tables 4.4 and 4.5 present the domain score for children by country andthe number of domain deprivations in normal and cumulative percentages for both thetotal population and children. As such, it provides a first insight into the degree ofcumulative deprivations experienced by children. Cumulative deprivation rates far exceedthe levels of monetary poverty: monetary poverty ranges from 10 to 23 percent while 57to 69 percent of the total population and children suffer from at least one deprivation. Inline with the previous analyses, children in the Netherlands have the lowest deprivationlevels, whilst Germany, France and the UK follow similar patterns of deprivation (also ina cumulative sense).
A comparison between the total population and children indicates that children more atrisk of being deprived in at least one domain; in Germany and the UK children are alsomore at risk of multiple deprivations (confirming findings of TARKI Social ResearchInstitute & Applica, 2010).
Table 4.4 Number of domain deprivations (in percentages, confidence intervals between brackets)DE FR NL UK
Number ofdomaindeprivations total child total child total child total child
0 38.1 34.0 38.4 34.8 44.6 42.8 38.9 31.4[37.2,39.1] [32.1,35.8] [37.1,39.7] [32.8,37.0] [43.2,45.9] [40.6,45.0] [37.6,40.3] [29.5,33.4]
1 34.6 33.9 34.3 33.3 34.5 35.1 34.9 34.3[33.7,35.5] [32.0,35.8] [33.2,35.5] [31.4,35.3] [33.3,35.7] [33.0,37.3] [33.7,36.1] [32.2,36.4]
2 18.6 20.2 19.0 21.1 15.6 15.4 18.0 22.0[17.8,19.3] [18.7,21.8] [18.0,20.0] [19.3,23.0] [14.6,16.7] [13.8,17.3] [16.9,19.1] [20.1,24.0]
3 7.5 9.9 7.5 9.3 4.8 5.8 7.2 10.7[7.0,8.1] [8.8,11.2] [6.7,8.3] [8.0,10.7] [4.1,5.6] [4.5,7.4] [6.4,8.1] [9.1,12.4]
4 1.2 2.0 0.9 1.5 0.6 0.9 1.0 1.7[1.0,1.4] [1.5,2.8] [0.7,1.2] [1.0,2.1] [0.4,0.8] [0.5,1.5] [0.8,1.4] [1.1,2.6]
Source: own calculations with EU-SILC, wave 2007.
The cumulative percentages in Table 4.5 also allow for an insight into multidimensionalpoverty headcount ratios if we were to use count poverty (Alkire & Foster, May 2008;Atkinson, 2003) as a method of aggregation. The union approach, definingmultidimensional poverty by deprivation in at least one domain, would result inheadcount ratios ranging from 56 to 69 percent. The dual cut-off intersection method,defining multidimensional poverty on the basis of deprivation in at least two domains,would result in deprivation rates ranging from 21 percent in the Netherlands to 34 percentin the UK. Finally, the intersection method, defining someone to be poor when poor in alldomains, points towards headcount ratios of 2 percent in Germany to 0.6 percent in theNetherlands. These results do not only point to the large extent of multidimensionalpoverty if one were to aggregate across domains but also suggests that headcount ratesare highly sensitive to the specific aggregation threshold under consideration.

28
Figure 4.1: Number of domain deprivations (% of children)
Domain score by country
0
5
10
15
20
25
30
35
40
45
0 1 2 3 4
Domain score child
% o
f chi
ldre
n 0-
17
DEFRNLUK
Table 4.5 Number of domain deprivations (in cumulative percentages)DE FR NL UK
Number of domain deprivations total child total child total child total child1 61.9 66.0 61.6 65.2 55.5 57.2 61.0 68.62 27.3 32.1 27.3 31.9 21.0 22.1 26.1 34.33 8.7 11.9 8.3 10.8 5.4 6.7 8.2 12.34 1.2 2.0 0.9 1.5 0.6 0.9 1.0 1.7
Source: own calculations with EU-SILC, wave 2007.
Synthesis sensitivity analyses
The results at an indicator level point towards a diverse picture of child deprivationacross indicators, across countries and in terms of the deprivation risk of children relativeto the population as a whole. One can not identify indicators that display consistentlyhigh or low deprivation rates across all countries; one can not rank countries consistentlyon the basis of their performance with respect to the different indicators; or considerchildren as consistently disadvantaged.
The analysis at the domain level points towards a more consistent picture in terms ofdomain rankings but not with respect to country rankings. Access to basic servicesdisplays the lowest deprivation rates for all countries whilst financial strain poses thebiggest problem to all countries (except Netherlands where neighborhood deprivation islarger than that in financial strain). Country rankings across domains are less consistentand do not point to specific countries as best or worst performers. If any, the domain leveldeprivation rates for the UK tend to be on the higher side. Depending on the specific

29
domain, country rankings are more or less robust. Only in the financial strain domain arecountry rankings very robust to the inclusion or exclusion of financial strain indicators.The large degree of variation across country rankings has not been pointed out inprevious cross-national comparative studies, which rather attempt to group countries byperformance (see e.g. TARKI Social Research Institute & Applica, 2010) or socialwelfare regime (see e.g. Dewilde, 2008; Whelan & Maitre, 2010; Whelan et al., June2008).23 Once aggregating to domain and across domains, deprivation levels are muchhigher than monetary poverty rates. The above confirms the findings of Bossert et al(2009) who conclude that the ranking of countries changes when differentmultidimensional poverty measures are used.
In terms of the comparison between the total population and children, our results nowpicture more firmly to children as a disadvantaged group (at a domain level and whenaggregating across domains): children are more likely to be deprived in the housing andfinancial strain domains and are also more likely to be suffering from one or severaldeprivations. The Netherlands stands out as the country with the lowest levels ofcumulative deprivations whilst Germany, France and the UK follow similar patterns.
What are the implications of these results for the analysis of mismatch and overlappatterns in the next section? Given absolute levels of indicator and domain deprivationsand the large differences in magnitude compared to monetary poverty one would expectquite some mismatch between monetary poverty and other domains of deprivation. In theUK, the degree of overlap between monetary poverty and other domain deprivations islikely to be highest as deprivation levels in general are higher. But whether this meansthat people in the UK are also disproportionately more likely to be double deprived is apriori not clear and needs to be investigated further by comparing overlap patterns at thelevel of the individual.
5. Cross-national comparison of child poverty
In this section we analyze patterns of child poverty across domains from a national and across-national comparative country perspective contrasting our findings with those fromthe mismatch and child poverty literature. Section 5.1 concentrates on the comparisonbetween the traditional monetary poverty indicator and deprivation in other domains.Section 5.2 focuses on overlap patterns between all domains and the degree to whichthese patterns differ systematically between countries. Finally, section 5.3 examineswhich characteristics are associated with what type of domain deprivation and the degreeto which this differs between countries; we distinguish between individual, householdand neighborhood characteristics.
23 Bradshaw and Richardson (2009) study seven dimensions of well being and construct a composite indexof child well being from a cross-national perspective but they first aggregate deprivation indicators tocountry level before aggregating to domain level. They find that the country rankings of the compositeindex are quite robust to different weighting of the domains and that the Netherlands tends to performconsistently well across dimensions while the opposite holds for the UK. Nevertheless, they also find quitesome variation across country-domain rankings.

30
5.1 Monetary poverty and domain deprivation: (miss) identification
For a long time child poverty research in developed economies has been dominated bymonetary poverty indicators but this has been changing in the past decade; manycountries are now contemplating using non-monetary indicators of child poverty or arealready testing such indicators and this also holds for the European Union and its memberstates. The first aim of this paper is to find out to what extent a monetary poverty measureidentifies the same children as poor as deprivation measures in non-monetary domains?We are hereby interested in the degree of overlap as well as the degree of mismatchbetween these measures. From a policy perspective, both mismatch and overlap patternsin the identification of vulnerable children are of interest: mismatch patterns areimportant because they are an indication of the in- and exclusion errors in theidentification process while overlap patterns identify multi-domain deprived children andmay thus merit special attention from policy makers. Furthermore, even though thecountries in our selection have comparable average living standards, (relative) incomepoverty statistics show considerably large cross-national differences in poverty levels andtrends (see for instance (see for instance Notten & Neubourg de, 2007).24 Our second aimis to analyze whether the overlap between monetary and non-monetary poverty measuresalso differs systematically across the countries in our selection.
Table 5.1 summarizes the degree of mismatch and overlap between monetary and non-monetary poverty domains. The second column shows the percentage of the childpopulation that is income poor and / or deprived in the other domain: depending on thecountry and the domain this percentage varies between 27% and 49%. For most countriesthe percentages are highest for the financial strain domain and lowest for the accessdomain. As income is the main financial resource for most households in market-basedeconomies one would expect that income poverty and financial strain are positively andrather strongly related (after all, this is the reason why income poverty is used as anindicator for financial poverty). The UK consistently scores worst while the Netherlandshas the low(est) scores in three out of the four overlap domains with monetary poverty;the confidence intervals suggest that the lowest rank of the Netherlands is onlystatistically significant from Germany and France in the case of the financial strain –income poverty combination. These findings are consistent with those of the previoussection: as the UK has a considerably higher monetary poverty headcount than the othermember states and its domain deprivation rates also tend to be higher, one would thusalso expect a higher overlap.25
24 The degree of income dispersion at income levels between the median and poverty threshold (defined asa % of the median) are a key factor explaining poverty differences between countries with similar livingstandards.25 Even if income poverty and domain deprivations would not be correlated one would predict higher levelsof overlap in the UK. In case of positive correlations one would expect a higher overlap than in the case ofzero correlation.
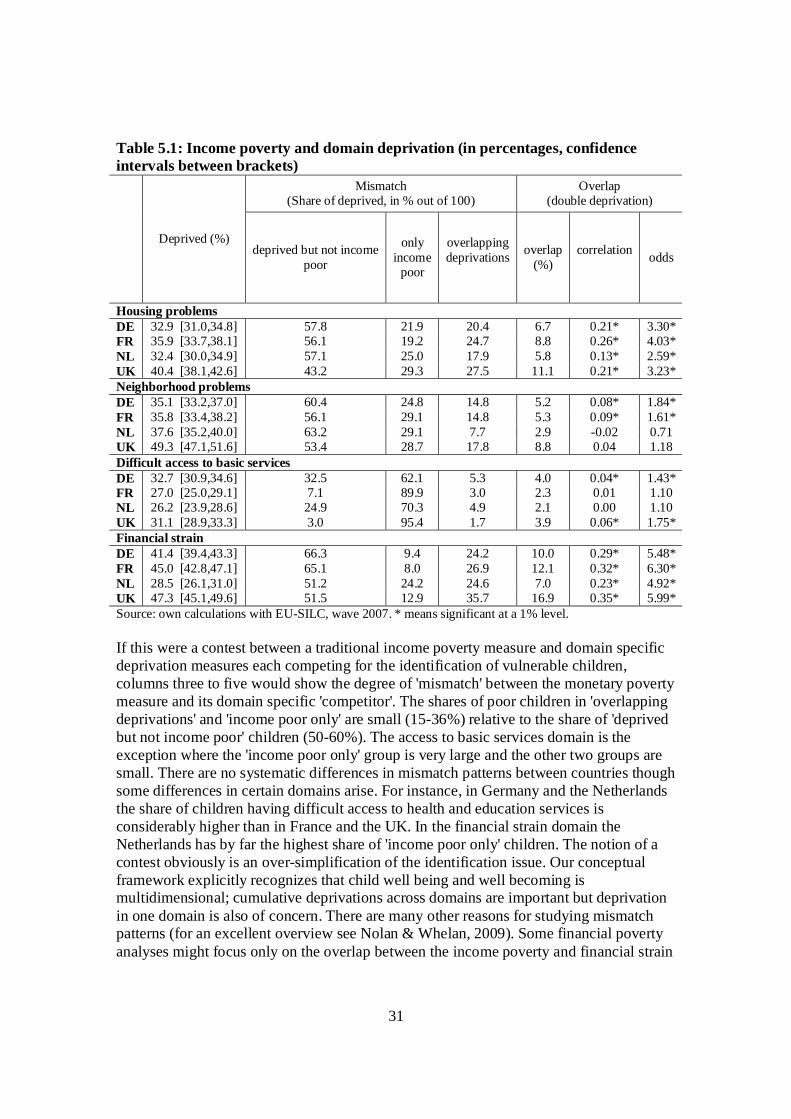
31
Table 5.1: Income poverty and domain deprivation (in percentages, confidenceintervals between brackets)
Mismatch(Share of deprived, in % out of 100)
Overlap(double deprivation)
Deprived (%)deprived but not income
poor
onlyincome
poor
overlappingdeprivations overlap
(%)correlation odds
Housing problemsDE 32.9 [31.0,34.8] 57.8 21.9 20.4 6.7 0.21* 3.30*FR 35.9 [33.7,38.1] 56.1 19.2 24.7 8.8 0.26* 4.03*NL 32.4 [30.0,34.9] 57.1 25.0 17.9 5.8 0.13* 2.59*UK 40.4 [38.1,42.6] 43.2 29.3 27.5 11.1 0.21* 3.23*Neighborhood problemsDE 35.1 [33.2,37.0] 60.4 24.8 14.8 5.2 0.08* 1.84*FR 35.8 [33.4,38.2] 56.1 29.1 14.8 5.3 0.09* 1.61*NL 37.6 [35.2,40.0] 63.2 29.1 7.7 2.9 -0.02 0.71UK 49.3 [47.1,51.6] 53.4 28.7 17.8 8.8 0.04 1.18Difficult access to basic servicesDE 32.7 [30.9,34.6] 32.5 62.1 5.3 4.0 0.04* 1.43*FR 27.0 [25.0,29.1] 7.1 89.9 3.0 2.3 0.01 1.10NL 26.2 [23.9,28.6] 24.9 70.3 4.9 2.1 0.00 1.10UK 31.1 [28.9,33.3] 3.0 95.4 1.7 3.9 0.06* 1.75*Financial strainDE 41.4 [39.4,43.3] 66.3 9.4 24.2 10.0 0.29* 5.48*FR 45.0 [42.8,47.1] 65.1 8.0 26.9 12.1 0.32* 6.30*NL 28.5 [26.1,31.0] 51.2 24.2 24.6 7.0 0.23* 4.92*UK 47.3 [45.1,49.6] 51.5 12.9 35.7 16.9 0.35* 5.99*Source: own calculations with EU-SILC, wave 2007. * means significant at a 1% level.
If this were a contest between a traditional income poverty measure and domain specificdeprivation measures each competing for the identification of vulnerable children,columns three to five would show the degree of 'mismatch' between the monetary povertymeasure and its domain specific 'competitor'. The shares of poor children in 'overlappingdeprivations' and 'income poor only' are small (15-36%) relative to the share of 'deprivedbut not income poor' children (50-60%). The access to basic services domain is theexception where the 'income poor only' group is very large and the other two groups aresmall. There are no systematic differences in mismatch patterns between countries thoughsome differences in certain domains arise. For instance, in Germany and the Netherlandsthe share of children having difficult access to health and education services isconsiderably higher than in France and the UK. In the financial strain domain theNetherlands has by far the highest share of 'income poor only' children. The notion of acontest obviously is an over-simplification of the identification issue. Our conceptualframework explicitly recognizes that child well being and well becoming ismultidimensional; cumulative deprivations across domains are important but deprivationin one domain is also of concern. There are many other reasons for studying mismatchpatterns (for an excellent overview see Nolan & Whelan, 2009). Some financial povertyanalyses might focus only on the overlap between the income poverty and financial strain

32
domain labelling individuals with 'overlapping deprivations' as 'consistent-poor' (Förster,2005; Nolan & Whelan, 2009). Mismatch patterns could help inform about the size ofspecific measurement errors, or to gauge the differences between objective and subjectiveindicators of deprivation. Moreover, depending on the policy domain one (set of)indicators could be more relevant: the neighbourhood and access domains are relevantfrom an urban planning perspective while the financial strain, housing and incomepoverty domains are more closely linked social (protection) policy. From a perspective ofchild deprivation, the mismatch columns in Table 5.1 clearly illustrate that using incomepoverty as a proxy for child deprivation in other domains would be a very crude tool, onethat would result in large errors of exclusion.
The last columns focus on the overlap group i.e. the children living in households that areboth income poor and domain deprived. The UK also has the highest share of doubledeprived in all income poverty – domain combinations (column six). The correlationbetween income poverty and domain deprivation is positive and statistically significant inthe financial strain and housing problems domains; in the other domains the correlation isalso positive but much lower and in half of the cases not statistically different from zero(column seven). 26 The last column shows the odds ratio which indicates how much morelikely an income poor child is to be deprived in the other domain in comparison to non-income poor child: a ratio of two indicates that an income poor child is twice as likely asa non-income poor child to be deprived in that other domain. In line with the correlationcoefficients, the odds ratios are highest for the housing problems and financial straindomains. The odds ratios for the Netherlands are again lowest but those for the UK arenot systematically higher than those of the other countries. Thus, even though relativelymore children in UK are deprived and relatively more children are double deprived; theodds ratios suggest that income poor UK children do not have higher odds to be doubledeprived than their counterparts France and Germany (i.e. being income poor does notput UK children at a larger disadvantage of also being domain deprived). In the nextsection we discuss this issue further, also incorporating the overlap between otherdomains.
While this paper focuses on children, our findings broadly confirm those of studiesanalyzing the population as a whole.27 Whelan et al (2001), Bradshaw and Finch (2003),Foster (2005) and Coromaldi & Zoli (2007) find that the mismatch between incomepoverty and multidimensional poverty measures is large and that the group of 'consistentpoor' comprises only a small share of the poor. These patterns also do not vary muchbetween European countries of comparable living standards, though Foster (2005) findsthat poorer countries tend to have a larger share of consistent poor than richer countries.
26 Table A11 in the appendix summarizes the three dimensional overlap patterns between income povertyand the financial strain and housing domains. While around half of the children are not deprived in any ofthese dimensions in Germany (51%), France (49%) and the UK (46%) this is more common for Dutchchildren (68%). In the former countries one in every four or five children suffers from double or tripledeprivations (DE: 21%, FR: 23%, UK: 25%) while only one in 14 Dutch children suffers from multipledeprivations (NL: 7%).27 These studies are based on data from the predecessor of the EU-SILC, the ECHP, and focus on theoverlap between income poverty and a set of non-monetary deprivation indicators (notably those we usedin the housing, neighborhood and financial resources dimensions).

33
Country rankings or 'league tables' are also relatively robust to the use of income povertyof consistent poverty: "Broadly speaking, the rank ordering of countries remains similarto relative income lines, but the degree of overlap between income and deprivation isgreater in countries with higher income poverty rates, so the disparities across countriesare generally sharper" (Nolan & Whelan, 2009, p. 23). Our study confirms thisobservation: though Germany and France switch ranks from income poverty to consistentdeprivation the differences between the UK and other become sharper (6th column Table5.1). Our study complements the above findings in the sense that a similar observationholds for populations groups with above average deprivation rates: such groups (i.e.children) also having higher rates of overlapping deprivations.28
5.2 Overlap between domain deprivations
Be it from a well being or well becoming perspective, children suffering from cumulativedeprivations across domains are a group of special concern to research and policycommunities. The aim of this section is to find out which combinations of deprivation arecommon across domains of well being for children and whether these patterns of overlapdiffer systematically between countries. We thus broaden our focus to overlap patternsacross domains but, for reasons of continuity and comparability, we include incomepoverty as a separate domain in the analysis. Of special interest is the cross-nationalrelationship between levels of overlap and odds ratios that was identified in the previoussection: despite considerable differences in the levels overlap will odds ratios be similaracross countries? For each domain combination and country, Table 5.2 shows the levelsof overlap in percentages and the odds ratio which have been estimated by means of abivariate logistic regression. The confidence intervals are indicated below each estimatein squared brackets and have been estimated taking account of the specific multi-stagesampling design of each national survey.
Levels of overlap are higher for the domain combinations with financial strain. TheNetherlands has the lowest levels of overlap across all domains while the ranking of theother countries varies by the domain combination. The confidence intervals suggest thatnot all country rankings would pass a statistical significance test: though in most domaincombinations a partial ranking can be made, the overlap levels between the housing andaccess to basic services domains suggests that there is no ranking possible betweencountries. The Netherlands has the lowest overlap levels in four domain combinations(housing-financial strain, neighbourhood-financial strain, neighbourhood-incomepoverty, financial strain-income poverty). The UK has the highest overlap levels in fourdomain combinations (housing-neighbourhood, housing-income poverty, neighbourhood-income poverty, financial strain-income poverty) while Germany has the highest overlaplevels in two domain combinations (neighbourhood-access to basic services, financialstrain-access to basic services). For the other domain combinations the confidenceintervals of the UK, Germany and France overlap.
28 Reminder: this is a valid point and builds on our observation in section 4 but we need to include a tablelike that of 5.1 for the population as a whole to make this point more convincing.

34
The odds ratios are highest for the domain combinations between housing, financialstrain and income poverty (ranging from 2.59 to 6.30), smaller for combinations with theneighbourhood domain (in general significantly higher than one but smaller than oraround two) and small for the access to basic services domain (in general not significant,sometimes significant but smaller than one or around two). In comparison to a non-deprived child, a child deprived in one domain thus has a higher chance of being deprivedin the other domain as well. Deprivation is 'contagious' across domains and this holds forall countries in our study. However, as the confidence intervals of the odds ratios overlapfor every country, there appears to be no difference in the 'degree of contagion' betweencountries.29 Thus, even though a Dutch child is less likely to be double deprived than aUK child, once deprived in one domain a Dutch child has an equally high risk ofdeprivation in another domain.30
These results complement those of the macro perspective taken by studies such as that ofBradshaw and Richardson (2009) that compare national averages in child well beingdomains between (27) countries. Since we compare overlap at the level of the child weare thus able to look at the individuals behind national-averages of domain scores. Usingvarious data sources (among which the EU-SILC), Bradshaw and Richardson (2009)compare child well being across seven well being domains31 and construct a compositechild well being index. The Netherlands are performing best in terms of child well beingwhile the UK performs badly (in the lower half of the 27 country ranking and well belowGermany and France). The ranking of these four countries in their study also tends to bereflected in the domain specific country rankings and are thus consistent with ourfindings. What our research adds is that, despite higher average deprivation levels in theUK, the likelihood of being deprived in yet another domain is similar to that of countrieswith lower average deprivation levels.
29 With on exception: The Netherlands has the lowest odds for the income poverty – neighbourhoodcombination.30 Reminder: in statistical jargon this is the difference between the probability of deprivation and theconditional probability of deprivation (conditional on the state of deprivation in another dimension). Isthere a statistical explanation for this result? If not, what 'real' factors could explain this (welfare state:universal or broader coverage of social programs versus more welfare / targeted coverage, other?)?31 These dimensions are health, subjective well being, personal relationships, material resources, education,behavior and risks and housing and environment.

35
Table 5.2: Overlap between domain deprivations (in percentages, confidence intervals betweenbrackets)
NeighborhoodProblems
Difficult accessto basic services
Financialstrain
Incomepoverty
Overlap(%)
Odds Overlap(%)
Odds Overlap(%)
Odds Overlap(%)
Odds
Housing problemsDE 9.5 2.02* 7.1 1.45* 15.9 4.00* 6.7 3.30*
[8.4,10.8] [1.66,2.46] [6.2,8.3] [1.18,1.79] [14.5,17.4] [3.29,4.85] [5.8,7.8] [2.61,4.19]FR 10.5 2.14* 4.7 1.33 19.4 4.53* 8.8 4.03*
[9.0,12.2] [1.74,2.64] [3.7,5.8] [1.00,1.77] [17.6,21.3] [3.69,5.56] [7.5,10.3] [3.07,5.28]NL 8.5 1.71* 3.9 1.17 9.1 3.02* 5.8 2.59*
[7.2,10.0] [1.33,2.19] [2.9,5.2] [0.82,1.66] [7.4,11.1] [2.29,4.00] [4.3,7.7] [1.71,3.93]UK 11.4 1.34* 5.3 2.17* 18.2 3.70* 11.1 3.23*
[10.0,13.0] [1.09,1.66] [4.0,6.8] [1.56,3.01] [16.2,20.4] [2.99,4.57] [9.5,13.1] [2.54,4.12]Neighborhood problemsDE 6.5 1.17 12.4 1.72* 5.2 1.84*
[5.5,7.7] [0.93,1.46] [11.1,13.8] [1.43,2.07] [4.3,6.3] [1.43,2.36]FR 3.8 1.14 13.3 1.83* 5.3 1.61*
[3.1,4.6] [0.87,1.51] [11.7,15.0] [1.51,2.22] [4.4,6.3] [1.23,2.11]NL 4.4 1.24 7.9 1.83* 2.9 0.71
[3.6,5.3] [0.94,1.64] [6.6,9.4] [1.41,2.38] [2.1,4.1] [0.46,1.09]UK 5.7 1.80* 16.5 1.44* 8.8 1.18
[4.6,7.0] [1.32,2.46] [14.8,18.4] [1.19,1.74] [7.5,10.2] [0.94,1.50]Difficult access to basic servicesDE 10.7 1.67* 4.0 1.43*
[9.5,12.0] [1.38,2.03] [3.2,5.0] [1.09,1.89]FR 6.3 1.24 2.3 1.10
[5.2,7.5] [0.96,1.61] [1.6,3.2] [0.75,1.63]NL 4.4 1.78* 2.1 1.10
[3.4,5.9] [1.26,2.52] [1.2,3.8] [0.58,2.07]UK 7.0 2.17* 3.9 1.75*
[5.6,8.6] [1.61,2.92] [2.8,5.4] [1.18,2.57]Financial strainDE 10.0 5.48*
[8.9,11.3] [4.28,7.03]FR 12.1 6.30*
[10.6,13.8] [4.73,8.39]NL 7.0 4.92*
[5.3,9.0] [3.26,7.43]UK 16.9 5.99*
[15.0,18.9] [4.64,7.73]Source: own calculations with EU-SILC, wave 2007. * means significant at a 1% level.
36
5.3 Profile: Comparing 'at risk of deprivation' characteristics between domains
In this section we use logistic regression techniques to explore which characteristics areassociated with identifying a child to be i) in income poverty, ii) domain deprived or iii)multiple deprived. As part of the analysis we also investigate to what extent these factorsdiffer across countries. These so-called poverty profiles give a 'face' to deprived childrenand may serve as an entry point into more thorough investigations into the reasons forand dynamics of deprivation.
In each regression, the domain deprivation indicator is the binary dependent variablewhich is regressed on a set of explanatory variables ranging from child, household toenvironment characteristics. We also estimate an ordered logistic regression model on thesame explanatory variables using the cumulative number of deprivations as a dependentvariable. Children are the unit of analysis and the models are estimated for each countryseparately. The results displayed in this section are only preliminary; a number ofpotentially relevant explanatory characteristics have not yet been included and the resultsrequire further robustness checks especially in terms of model and variable specification.
The child specific characteristics are gender and age variables (years and squared years).Included as household characteristics are household size (and squared size), householddemographic composition, tenure status of dwelling (owned or rented) and the so-calledwork intensity status of the household. The work intensity status of a householdsummarizes the work status over the past year for all work age household members (aged18 to 64). It is obtained by computing the ratio of worked months over workable months,averaged over all work age household members and subsequently categorized in fourcategories (WI=0, 0<WI<0.5, 0.5 WI<1, WI=1). The environment characteristic takesinto account the population density of the local area in which the household lives (dense,intermediate and thin). The definition local area corresponds to that of wards in the UKand municipality in France and Germany; this variable is not available for theNetherlands. In further analyses we will include a number of variables summarizing keycharacteristics of the children's parents; among those considered are employment status,education level, age, country of birth, citizenship, marital status. Table A12 in theappendix summarizes the population shares of the characteristics32.
Tables A13 to A17 summarize the results for the income poverty, financial strain,housing, neighborhood and access to basic services domains; Table A18 summarizes theresults for the number of deprivations. We focus our analysis on a number of aspects:which variables are associated with a high risk of deprivation i) across domains and ii)across countries? Are the parameter values in some countries consistently higher than inothers? Which variables are only associated with a high risk in one domain? Regardingthe first question, the high risk variables that recur across domains and countries are
32 A few categories have very low population share (the category 'other' under household types, thecategory 'thinly populated' for the UK under level of urbanization); though included in the estimations wedo not focus on these groups in the analysis. The work intensity category between zero and 0.5 is alsorather small but we include this category in our analysis as the parameter estimates are consistent with theother lower work intensity categories.

37
single parenthood, low work intensity and rented housing. In the Netherlands theparameter estimates for rented housing are consistently higher than those in othercountries in three out of five domains (income poverty, financial strain and access tobasic services). In France, the parameter estimates for low work intensity households areconsistently higher than those in the other countries in four out of five domains (exceptthe neighborhood domain).
Despite these commonalities we also observe quite some difference in high risk factorsand / or their magnitude across domains and countries. Differences in high risk factorsacross domains could point towards differences in the comparative (dis)advantage ofcharacteristics vis-à-vis deprivation in particular domains. For instance, living in an urbanarea makes it likely that there is easy access to basic services while the downside couldbe higher rates of crime or environmental degradation. Differences between countries canpotentially be explained by national differences in the labor markets, demographics andwelfare states (including tax system, provision of public goods and social protectionpolicy).33 At this point we only identify these differences; it is beyond the scope of thispaper to further investigate the underlying reasons.
For the income poverty domain, the household size variables are significant whilehousehold size does not appear to be recurring as a significant variable in other domains.It is likely that this difference can be linked to the equivalence scales used to adjusthousehold income for differences in household size and demographic composition. Inthat same domain, we can see that higher magnitudes of the high risk factors associatedwith income poverty: low work intensity in France; rented housing in the Netherlands;and single parenthood in the United Kingdom (i.e. the confidence intervals for theparameter estimates do not overlap).
In addition to the recurring high risk factors, the factor 'two adult – two child families' is alow risk factor in the financial deprivation domain. Lower population densities are a highrisk factor in Germany and France but a low risk factor in the UK. For France anycategory below full work intensity is a high risk factor but not in the other countries. Forthe Netherlands and the UK rented housing is a high risk factor but not for the othercountries.
In the housing domain, the risk factors 'low work intensity' and 'single parenthood' arehigher in magnitude for France and Germany than those in other countries.
In the neighborhood domain overall fewer explanatory variables are statisticallysignificant and except for the population density dummies and different variables aresignificant across countries. Not surprisingly, an increased population density isassociated with a higher risk of neighborhood problems.
33 Cross-national differences in high risk factors can also result from differences regarding data collectionand the construction of variables. As explained in section three, in our country and indicator selectionprocess we have put considerable effort in attempting to minimize the impact of these factors.

38
In the access to basic services domain there is again quite some difference betweencountries in the significance of high risk factors; while rented housing is a high risk factorfor the Netherlands and the UK, intermediate and low population densities and lowerwork intensity are high risk factors for Germany and France. The child age variables aresignificant now but this is likely to be a construct of the deprivation definition of theaccess to education variable which is only available for children in school going age.
The comparison of tables A13 to A17 leads us to identify a number of recurring riskfactors across domains (single parenthood, low work intensity and rented housing). Alogical next step in the analysis is to check whether these factors are also associated withmultiple deprivations. The analysis in this and previous sections (section 5.2 onoverlapping deprivations) suggests that this is likely to be the case. Table A18summarizes the results for the ordered logistic regression where the dependent variable isthe sum of deprivation in the financial strain, housing and neighborhood domains.Though potentially four categories are available, we merge the categories of two andthree deprivations due to a low population share of the three deprivation category. Theaccess to basic services domain has been excluded because the patterns of overlappingdeprivations suggest that this domain is least related to domain deprivation in otherdomains. Though having large overlaps with the other three domains, income poverty hasbeen excluded because it is a resource-based welfare indicator while the other deprivationvariables are outcome-based. The results confirm that single parenthood, low workintensity and rented housing are also high risk factors associated with cumulativedeprivations and this also holds across countries. There are now also a few significantlow risk characteristics: in comparison to two adults with a single child, familiesconsisting of two adults and several children are less at risk of multiple deprivations.Lower population density now also appears as a low risk factor.
There are differences in (magnitude of) high risk characteristics across countries: whilehouseholds consisting of two adults and three or more children are at higher risk ofmultiple deprivations in Germany, the opposite holds for France. While lower workintensity household are more at risk of multiple deprivations in France and Germany, themagnitude of high risk is lower for the Netherlands and the UK. In the latter twocountries, rented housing is a high risk factor with a larger magnitude.
Our results can be linked to those found in the poverty mismatch literature. These studiesfind that, in comparison to other parts of the population, households with children aremore likely to be multidimensional poor than income poor (Bradshaw & Finch, 2003;Dewilde, 2004). It is important to note though that our focus is on the child populationwhile the others focus on the population as a whole. Drawing from Whelan et al(November 2003), Nolan and Whelan (2009) first emphasize the weak relation theyfound between deprivation in current consumption and income on the one hand andhousing and neighborhood domains on the other hand. Nevertheless they also find that"factors such as age, household composition, urban/rural location and tenure status havebeen found to play an important role in predicting [deprivation in] housing andneighborhood-related dimensions" (2009, p. 20). We also find that these factors areimportant (the age of adult members is not yet included in our analysis) but our findings

39
suggest that household composition (notably single parents) and tenure status recur ashigh risk factors across all domains. The higher (cumulative) deprivation risk of singleparents is also confirmed by other studies (Bradshaw & Finch, 2003; Dewilde, 2004).Low work intensity is also confirmed as a recurring risk factor in other studies thoughthese studies look at slightly different variables such as labor force participation andunemployment (Bradshaw & Finch, 2003; Dewilde, 2004; Förster, 2005).
Forster (2005) finds that unemployment and lower education [of adults] are the twostrongest risk factors that appear to hold for all countries (the EU-15 and Czech Republic,Hungary and Slovenia). "For all the other characteristics, results are more diverse.Especially, gender and age characteristics [of adults] often have no significant effect, orthe effects have opposite signs" (2005, p. 43). Other studies find that the share of retiredindividuals is higher under income poverty than under a multidimensional povertymeasure indicating that this group is only at high risk of income poverty (Bradshaw &Finch, 2003; Dewilde, 2004). DeWilde (2004) finds that single elderly are the exceptionwho are also more at risk of multidimensional deprivation. Though we have not yetincluded variables such as adult education and the elderly are not the focus of this study,our findings complement those in the literature in the sense that some high risk povertycharacteristics are not consistently high risk across domains.
From a cross-national comparative perspective, Bradshaw and Richardson(2009) find thatcross-national differences in "child well being is associated with (income) inequality" (p.29) and that higher child well being is associated with higher in-kind spending (in a non-linear fashion) but this relationship is much less stronger for cash spending (p. 30).Further investigation is needed to assess whether the differences in high risk factorsbetween countries we find can be linked to such causes as income inequality or publicspending.
6. Conclusion
This paper aimed to investigate the degree to which monetary poverty and non-monetarydeprivation measures identify different groups of vulnerable children and the degree towhich children suffer from multiple deprivations across well being domains. A furtheraim has been to investigate whether these findings differ systematically across countrieswith similar living standards. These research questions were formulated in the context ofan EU level search for child-focused indicators of well being and an academic literaturethat either focuses on mismatch / overlap patterns for the population as a whole (therebymissing a child-specific focus) or studies cross-national differences in multidimensionalchild poverty based on national averages (thereby missing cross-national differences inmultiple deprivations at the level of the child).
After a careful process this paper selected 13 deprivation indicators of child well beingand child well becoming that are grouped under 4 domains (financial strain, housing,neighborhood and access to basic services) and studied in 4 countries (Germany, France,the Netherlands and UK). The 'at-risk-of-poverty' indicator of the European Union wasselected as a monetary poverty indicator and is based on a relative threshold set at 60% of

40
(national) medium income. The empirical analysis is based on the 2007 wave of the EU-SILC data. Robustness checks were performed on the indicator level, domain level andaggregating across domains. Instead of comparing a monetary poverty index to a multi-domain index of deprivation, the analysis of mismatch and overlap patterns focused onthe comparison of domains.
A number of findings stand out. Firstly, the Netherlands most often ends up as bestperformer while the UK most often ends up as worst performer with France and Germanyin the middle. In spite of this, we find considerable variation in country rankings acrossdomains and that the domain rankings are sensitive to the inclusion or exclusion ofdeprivation indicators. The exception is the financial strain domain where the countryrankings are very robust.
Secondly, at an indicator level there is no consistent evidence of children being more atrisk of deprivation than the population as a whole. This picture changes, however, asaggregation proceeds from an indicator level to a domain level and across domains:children become disproportionately more at risk. Thus, our research confirms that ofcross-national studies that take a macro perspective at multidimensional poverty (in theaggregate children are at higher risk) but it qualifies it in the sense that this is notnecessarily the case at an indicator level.
Thirdly, the analysis of mismatch between monetary poverty and domain leveldeprivation broadly confirms the findings in the literature: mismatch patterns are large,differ in size across domains but are rather consistent across countries. The analysis ofoverlap between domains further confirms that countries with higher levels of domaindeprivation also have higher levels of overlapping deprivation rates (Nolan & Whelan,2009). Our study further complements this literature in the sense that a similarobservation also holds for population groups within countries. A key contribution of ouranalysis is that higher levels of double deprivation do not necessarily translate intosignificantly higher odds of double deprivation. Thus, an income deprived child in theUK is equally likely to be also deprived in another domain as an income deprived child inthe Netherlands. This finding holds across other domains.
Fourthly, the analysis of factors associated with a high risk of deprivation shows thatthere are a number of high risk factors that recur across domains and countries; singleparenthood, low work intensity and rented housing. The ordered logit regression furthersuggests that families consisting of two adults and several children are less at risk ofmultiple deprivations (in comparison to two adults with a single child). However, in anumber of cases, the magnitude of these recurring high risk factors is systematicallyhigher in one country than in another country (rented housing in the Netherlands, lowwork intensity in France). For other factors we observe quite some differences in highrisk factors and / or their magnitude across domains and countries. Our analysis of highrisk factors is only preliminary; a number of potentially relevant explanatorycharacteristics have not yet been included and the results require further robustnesschecks especially in terms of model and variable specification. Regarding the recurrent

41
high risk factors, our child-focused findings are consistent with those found bypopulation-focused studies.
More generally, the sensitivity analyses emphasize that indicator and domain deprivationrates as well as consecutive country / population group rankings are very sensitive todeprivation thresholds and the inclusion or exclusion of deprivation indicators from adomain. Consistency in rankings seems to be the exception rather than the rule. This isrelevant both from a methodological and policy perspective. In a methodological sense,our study contributes to a better understanding of the adaptation of the typical monetarypoverty measurement tool kit to a multidimensional one. Given the nature of informationused in multidimensional poverty analyses (i.e. many categorical and binary variables), itis unlikely that stochastic dominance analyses will reveal a population group / countrythat (weakly) performs best / worst in a multidimensional sense. Focusing on stochasticdominance in only a few combinations of domains seems more promising. (Alkire, 2002)
In the context of the search for child-focused poverty indicators in the EU our studycontributes in a number of aspects. Our sensitivity analyses suggest that one should bevery careful aggregating indicators to domain and multidimensional levels. From apolitical and policy perspective this could be even counterproductive: countries performwell in one deprivation aspect and worse in another; some population groups are betteroff in one country than another; and, there are many potential reasons for such findings(economic, social, policy and data). The richness of common indicators lies in itsdiversity and, in that respect, our study cautions against the construction of a compositeindex of child well being. A more promising way of taking multidimensionality intoaccount would be, where possible, to develop common indicators that take the 'breadth' ofchild deprivations into account (across indicators and/or domains). Children sufferingfrom multiple deprivations represent a group that (ought to) have the attention of policymakers. This is important both from a child well being and child well becomingperspective and it may contribute to detecting and fixing gaps in social policy.

42
References
Alkire, S. (2002). Dimensions of human development. World Development, 30(2), 181-205.
Alkire, S. (2008). Choosing dimensions: The capability approach and multidimensionalpoverty. In N. Kakwani, & J. Silber (Eds.), The many dimensions of poverty (). NewYork: Palgrave-Macmillan.
Alkire, S., & Foster, J. (May 2008). Counting and multidimensional povertymeasurement. OPHI Working Paper Series, Working paper no. 7 Retrieved fromhttp://www.ophi.org.uk./subindex.php?id=publications0#wp
Alkire, S., & Santos, M. E. (2009). Poverty and inequality measurement. In S. Deneulin,& L. Shahani (Eds.), An introduction to the human development and capabilityapproach, freedom and agency () Earthscan.
Atkinson, A. B. (2003). Multidimensional deprivation: Contrasting social welfare andcounting approaches. Journal of Economic Inequality, 1, 51-65.
Atkinson, A. B., Cantillon, B., Marlier, E., & Nolan, B. (2002). Social indicators: TheEU and social inclusion. Oxford; New York: Oxford University Press.
Ayala, L., Jurado, A., & Pérez-Mayo, J. (2009). Income poverty and multidimensionaldeprivation: Lessons from cross-regional analysis No. ECINEQ WP 2009 –106)Society for the Study or Economic Inequality. Retrieved from www.ecineq.org
Ben-Arieh, A. (2000). Beyond welfare: Measuring and monitoring the state of children -new trends and domains. Social Indicators Research, 52, 235-257.
Bossert, W., Chakravarty, S. R., & D'Ambrosio, C. (2009). Multidimensional poverty andmaterial deprivation
Bourguignon, F., & Chakravarty, S. R. (2003).The measurement of multidimensional poverty. Journal of Economic Inequality, 1,25-49.
Bradshaw, J., & Finch, N. (2003). Overlaps in dimensions of poverty. Journal of SocialPolicy, 32(4), 513-525.
Bradshaw, J., Hoelscher, P., & Richardson, D. (2007a). Comparing child well-being inOECD countries: Concepts and methods’. Innocenti Working Paper, (2006-03)
Bradshaw, J., Hoelscher, P., & Richardson, D. (2007b). An index of child well-being inthe european union. Social Indicators Research, 80, 133-177.

43
Bradshaw, J., & Richardson, D. (2009). An index of child well-being in europe. ChildIndicators Research, 2(3)
Chakravarty, S. R. (2006). An axiomatic approach to multidimensional povertymeasurement via fuzzy sets. In A. Lemmi, & G. Betti (Eds.), Fuzzy set approach tomultidimensional poverty measurement () Springer US.
Coromaldi, M., & Zoli, M. (2007). A multidimensional poverty analysis: Evidence fromitalian data. Journal of Economic Literature,
D’Ambrosioa, C., Deutsch, J., & Sibler, J. (2009). Multidimensional approaches topoverty measurement: An empirical analysis of poverty in belgium, france, germany,italy and spain, based on the european panel. Applied Economics, , 1-11.
Dekkers, G. (2003). Financial and multidimensional poverty in the european countries:Can the former be used as a proxy for the latter? No. No. 2003-13)
Dewilde, C. (2004). The multidimensional measurement of poverty in belgium andbritain: A categorical approach. Social Indicators Research, 68, 331-369.
Dewilde, C. (2008). Individual and institutional determinants of multidimensionalpoverty. Social Indicators Research, 86, 233-256.
Duclos, J., Sahn, D., & Younger, S. D. (2006). Robust multidimensional povertycomparisons. The Economic Journal, 116, 943-968.
Duncan, G., & Brooks-Gunn, J. (1997). Consequences of growing up poor. New York:Russell Sage Foundation.
European Commission. (2007). Joint report on social protection and social inclusion,.Brussels:
European Commission. (2008). Child poverty and well-being in the EU : Current statusand way forward, Directorate-general for employment, social affairs and equalopportunities, the social protection committee
European Commission. (January 2009). Algorithms to compute indicators in thestreamlined social inclusion portfolio based on EU-SILC and adopted under theopen method of coordination, eurostat, directorate F: Social statistics andinformation society, unit F-3: Living conditions and social protection statistics
European Commission. (March 2009a). Description of EU-SILC user database variables:Cross-section and longitudinal, eurostat, directorate F: Social statistics andinformation society, unit F-3: Living conditions and social protection statistics

44
European Commission. (March 2009b). Description of secondary target variables,module 2007, housing conditions, eurostat, directorate F: Social statistics andinformation society, unit F-3: Living conditions and social protection statistics
European Commission. (March 2009c). EU-SILC user database description, eurostat,directorate F: Social statistics and information society, unit F-3: Living conditionsand social protection statistics
European Commission. (October 2009). Comparative intermediate EU quality report2007 No. v5)
Fattore, T., Mason, J., & Watson, E. (2007). Children's conceptualisation(s) of their well-being. Social Indicators Research, 80, 5-29.
Förster, M. (2005). Comparing poverty in the enlarged EU. Journal of ComparativePolicy Analysis: Research and Practice, 7(1), 29-48.
Foster, J., Greer, J., & Thorbecke, E. (1984). A class of decomposable poverty measures.Econometrica, 52(3), pp. 761-766.
Gordon, D., Nandy, S., Pantazis, C., Pemberton, S., & Townsend, P. (2003). Childpoverty in the developing world. Bristol: Policy Press.
Hauser, R. (2008). Problems of the german contribution to EU-SILC A researchperspective, comparing EU-SILC, microcensus and SOEP
Klasen, S. (2000). Measuring poverty and deprivation in south africa. Review of Incomeand Wealth, 46(1), 33-58.
Laderchi, C. R. (1997). Poverty and its many dimensions: The role of income as anindicator. Oxford Development Studies, 25(3), 345.
Marlier, E., Atkinson, A. B., Cantillon, B., & Nolan, B. (2007). The EU and socialinclusion: Facing the challenges. Bristol: The Policy Press.
Minujin, A., Delamonica, E., Gonzalez,E.and Al Davidziuk. (2005). Children living inpoverty: A review of child poverty definitions, measurements and policies. UnicefConference Children and Poverty: Global Context, Local Solutions, New York.
Moisio, P. (2004). A latent class application to the multidimensional measurement ofpoverty. Quality and Quantity, 38, 703-717.
Moore, K. A., Lippman, L., & Brown, B. (2004). Indicators for child-well-being: Thepromise for positive youth development. The ANNALS of the American Academy ofPolitical and Social Science, 591(1), 125-145.

45
Neubourg de, C., Roelen, K., & Gassmann, F. (2009). Making poverty analyses richer -multidimensional poverty research for policy design. In K. Boyser de, C. Dewilde,D. Dierckx & J. Friedrichs (Eds.), Between the social and the spatial - exploringmultiple dimensions of poverty and social exclusion () Ashgate Publishing.
Nolan, B., & Whelan, C. T. (2009). Using non-monetary deprivation indicators toanalyse poverty and social exclusion in rich countries: Lessons from europe? No.WP09/11)The Economic and Social Research Institute, Dublin.
Notten, G., & Neubourg de, C. (2007). The policy relevance of absolute and relativepoverty headcounts: What’s in a number? MGSoG Working Paper, 2007/006,Maastricht Graduate School of Governance, Maastricht University, Maastricht.
OECD. (2009). Doing better for children, Organization for Economic Co-operation andDevelopment.
Pérez-Mayo, J. (2005). Identifying depreviation profiles in spain: A new approach.Applied Economics, 37, 943-955.
Perry, B. (2002). The mismatch between income measures and direct outcome measuresof poverty. Social Policy Journal of New Zealand, 19
Qvortrup, J. (1997). Indicators of childhood and intergenerational dimension. In A. Ben-Arieh, & H. Wintersberger (Eds.), Monitoring and measuring the state of children -beyond survival (pp. 101-112). Vienna: European Centre for Social Welfare Policyand Research.
Qvortrup, J. (1999). The meaning of child's standard of living. In A. B. Andrews, & N.Hevener Kaufman (Eds.), Implementing the UN convention on the rights of thechild: A standard of living adequate for development () Praeger Publishers.
Ravallion, M. (1994). Poverty comparisons Harwood Academic Press.
Rendtel, U., Nordberg, L., Jäntti, M., Hanisch, J., & Basic, E. (January 2004). Report onquality of income data, the change from input harmonization to ex-postharmonization in the national samples of the european community household panel –implications on data quality. Chintex Working Paper, 21
Richardson, D., Hoelscher, P., & Bradshaw, J. (2008). Child well-being in central andeastern european countries (CEE) and the commonwealth of independent states(CIS). Child Indicators Research,
Robeyns, I. (2003). The capability approach: An interdisciplinary introduction.Unpublished manuscript.

46
Roelen, K., Gassmann, F., & Neubourg de, C. (2009a). False positives or hiddendimensions – what can monetary and multidimensional measurement tell us aboutchild poverty? Unpublished manuscript.
Roelen, K., Gassmann, F., & Neubourg de, C. (2009b). The importance of choice anddefinition for the measurement of child Poverty— the caseof vietnam. Child Indicators Research,
Ruggeri Laderchi, C., Saith, R., & Stewart, F. (2003). Does it matter that we do not agreeon the definition of poverty? A comparison of four approaches. Oxford DevelopmentStudies, 31(3), 243-274.
Sahn, D., & Stifel, D. (2003). Exploring alternative measures of welfare in the absence ofexpenditure data. Review of Income and Wealth, 49(4), 463-489.
Sen, A. (1999). Development as freedom Oxford University Press.
Streeten, P. (1984). Basic needs: Some unsettled questions. World Development, 12(9),973-978.
TARKI Social Research Institute, & Applica. (2010). Study on child poverty and childwell-being in the EU. Budapest; Brissels: European Community Programme forEmployment and Social Solidarity (2007-2013).
Thorbecke, E. (2008). Multidimensional poverty: Conceptual and measurement issues. InN. Kakwani, & J. Silber (Eds.), The many dimensions of poverty (). New York:Palgrave Macmillan.
Convention on the Rights of the Child, General Assembly resolution 44/25 (UNHCHR1989).
UNICEF. (2005). Child poverty in rich countries No. 6). Florence:
UNICEF. (2007). Child poverty in perspective: An overview of child well-being in richcountries 2007.
Wagle, U. (2002). Rethinking poverty: Definition and measurement. International SocialScience Journal, 54(171), 155-165.
Wagle, U. (2009). Capability deprivation and income poverty in the united states, 1994and 2004: Measurement outcomes and demographic profiles. Social IndicatorsResearch, DOI 10.1007/s11205-009-9446-5
Whelan, C. T., Layte, R., Maitre, B., & Nolan, B. (2001). Income, deprivation andeconomic strain: An analysis of the european community household panel.17(4)

47
Whelan, C. T., Layte, R., & Maitre, B. (2004). Understanding the mismatch betweenincome poverty and deprivation: A dynamic comparative analysis. EuropeanSociological Review, 20(4), 287-302.
Whelan, C. T., & Maitre, B. (2010). Poverty in ireland in comparative europeanperspective. Social Indicators Research, 95, 91-110.
Whelan, C. T., Maitre, B., Gannon, B., Nolan, B., Watson, D., & Williams, J. (November2003). Monitoring poverty trends in ireland: Results from the 2001 living in irelandsurvey. Dublin: ESRI.
Whelan, C. T., Nolan, B., & Maitre, B. (June 2008). Measuring material deprivation inthe enlarged EU. Economic and Social Research Institute, Working Paper 249
White, H., Leavy, J., & Masters, A. (2003). Comparative perspectives on child poverty:A review of poverty measures. Journal of Human Development, 4(3), 379-396.
White, S. (2002). Being, becoming and relationship: Conceptual challenges of a childrights approach in development. Journal of International Development, 14(1095-1104)

48
Appendices
Table A1: Preliminary and final selection of indicators for multidimensional poverty analysis (Y/N)Variable name Code Age Y/N1
Personal file – labor information (child care)Education at compulsory school RL020 0-<12 NAge at the data of interview RX010 all YSex RB090 all YSpouse/Partner ID RB240 all YHousehold file – housingNumber of rooms available to household HH030 all YLeaking roof, damp walls/floors/foundation, or rot in window frames orfloor
HH040 all Y
Ability to keep home adequately warm HH050 all NHousehold file – social exclusionArrears on mortgage or rent payments HS010 all YArrears on utility bills HS020 all YArrears on hire purchase installments or other loan payments HS030 all YCapacity to afford paying a week annual holiday away from home HS040 all YCapacity to afford a meal with meat, chicken, fish (or vegetarianequivalent) every second day
HS050 all Y
Capacity to face unexpected financial expenses HS060 all NDo you have a telephone (including mobile phone)? HS070 all NDo you have a color TV? HS080 all NDo you have a computer? HS090 all YDo you have a washing machine? HS100 all NDo you have a car? HS110 all YAbility to make ends meet HS120 all YNoise from neighbors or from the street HS170 all YPollution, grime or other environmental problems HS180 all YCrime violence or vandalism in the area HS190 all YHousehold file - income (total household income)Equivalent disposable income HX090 all NSpecial module 2007 – housing conditionsShortage of space in dwelling MH010 all NDwelling comfortably warm during winter time MH050 all YDwelling comfortably cool during summer time MH070 all NAccessibility of public transport MH120 all NAccessibility of primary health care services MH130 all YAccessibility of compulsory school MH140 school age Y1 Variables labeled with 'N' were part of our preliminary selection of variables while those with 'Y' andmarked in grey are included in the final selection. The reasons for inclusion are described in more detail insection 3.2.Source: Description of EU-SILC User Database Variables (European Commission, March 2009a) andDescription of secondary target variables (European Commission, March 2009b).

49
Table A2: List of final domains and indicators with exact definitionsDomain Indicators Definition Indicator
nameHousing(housingdepr1)
Whether the respondent feelsthe dwelling has a problemwith a leaking roof, dampwalls/floors/foundation, or rotin window frames or floor
deprived if answered "yes" leak
Whether the dwelling can bekept comfortably warm duringwinter time
deprived if answered "no" warm
Whether the dwelling isovercrowded
A dwelling is overcrowded if atleast one of the followingconditions does not apply: onefamily room, one room for eachcouple, one room for twochildren under the age of 12, oneroom for two boys / girls if bothchildren are aged 12-17; tworooms are required for twochildren of different sex in theage group 12-17 years and oneroom for any other adult member.
overcrowding
Environment(environmentdepr1)
Whether pollution, grime orother environmental problemsconstitute a problem for thehousehold
deprived if answered "yes" pollution
Whether crime, violence orvandalism constitutes aproblem in the area
deprived if answered "yes" crime
Access and mobility(mobilitydepr)
Accessibility of primaryhealth care services
deprivation is constituted by“very difficult" or "difficult" toaccess
health
Accessibility of compulsoryschool
deprivation is constituted by“very difficult" or "difficult" toaccess
school
Financial strain(financedepr1)
Whether the household haspayment arrears
deprivation is constituted bydeprivation with respect to eitherarrears on mortgage, utility billsor installments
arrears
Capacity to afford paying forone week annual holiday awayfrom home
deprived if answered "no" holiday
Capacity to afford a meal withmeat, chicken, fish (orvegetarian equivalent) everysecond day
deprived if answered "no" meal
Whether the household couldafford a computer?
deprived if answered "no" computer
Whether the household couldafford a car?
deprived if answered "no" car
Whether the household is ableto make ends meet
deprivation is constituted by“very difficult or difficult tomake ends meet”
endsmeet

50
Table A3: Disposable income comparabilityCountry Basic concepts and definitions Household income components Individual income componentsUK • Income reference period and Reference period for
taxes on income contribution are centred aroundinterview date (as opposed to previous year);
• Reference period for taxes on wealth is the financialyear (Apr 05- Mar 06; Apr07-Mar 08) (as opposed toprevious calendar year)
• Total disposable household income(largely comparable);
• Other non-cash employee income(not comparable)
France • Total disposable household income(fully comparable)
• Regular inter-household cash transfersreceived (largely comparable);
• Regular inter-household transfers paid(largely comparable)
• Cash or near-cash employeeincome (largely comparable);
• Income from private use ofcompany car (not collected)
Netherlands • Fully comparable, but reference period for taxes onwealth is non-applicable.
• Most of the components included inthe disposable income definition are‘largely comparable’. The totaldisposable household income is saidto be ‘largely comparable’.
• Unemployment benefits (largelycomparable)
• Other non-cash employee income(N/A)
Germany • Total disposable household income(fully comparable)
• Income from rental of property orland (largely comparable);
• Interest, dividends, profit from capitalinvestment in incorporated business(largely comparable);
• Other non-cash employee income(largely comparable)
• Cash profits or losses from self-employment; unemploymentbenefits (largely comparable)
Notes: Since the 2007 round national statistics bureaus are obliged to provide information a number of new income components such as imputed rent, interestpaid on mortgage, the value of goods from own consumption, employer's social insurance contributions and non-cash employee income other than a companycar. It is expected that these income components will be included in an improved disposable household income definition but momentarily the calculation ofincome remains unchanged for the 2007 operation.Source: European Commission (January 2009; October 2009).

51
Sensitivity analysis: indicator thresholds
Access and mobility domain
Accessibility of primary health care servicesThe primary health care services refer to the general practitioner, a primary health centre,a casualty department or similar, where first-aid treatment could be received. (With greatdifficulty, with some difficulty, easily, very easily)
Threshold 1: deprived if With great difficulty, not deprived if othersThreshold 2: deprived if With great difficulty or with some difficulty, not deprived ifothers
Table A4 Sensitivity analysis - Access to primary health careAccessibility of primary healthcare services Threshold 1 Threshold 2
total children 0-17 total children 0-17DE 1.5 1.6 11.3 12.6FR 1.2 1.6 5.9 7.6NL 1.6 1.4 9.0 8.7UK 1.2 0.6 6.3 4.6Source: own calculations with EU-SILC, wave 2007.
Accessibility of compulsory schoolThe accessibility is assessed in relation to the school actually attended by the children ofthe household. If more than one child in the household is in compulsory school, therespondent should refer to the one with the most difficulty. This variable only concernschildren whose age corresponds to the compulsory school attendance in the country, andnot the other children even if the majority of them go to school.
Threshold 1: deprived if With great difficulty, not deprived if othersThreshold 2: deprived if With great difficulty or with some difficulty, not deprived ifothers
Table A5 Sensitivity analysis - Access to compulsory schoolAccessibility of compulsoryschool Threshold 1 Threshold 2
total children 0-17 total children 0-17DE 1.4 2.2 10.3 16.4FR 1.0 2.1 3.3 6.8NL 0.8 1.7 3.3 7.2UK 0.5 1.3 3.6 8.1Source: own calculations with EU-SILC, wave 2007.

52
Table A6 Non-use compulsory school by age groupmissing values due to
non-use% of missing values due tonon-use for all children 0-17
15.4
age group0-4 74,85-9 5,410-14 1,215-17 18,6Source: own calculations with EU-SILC, wave 2007.
Sensitivity analysis – indicator Ability to make ends meetThe household respondent’s assessment of the level of difficulty experienced by thehousehold in making ends meet. A household may have different source of income andmore than one household member may contribute to it. Thinking of the household’s totalmonthly income, the idea is with which level of difficulty the household is able to pay itsusual expenses. (With great difficulty, with difficulty, with some difficulty, fairly easily,easily, very easily)
Threshold 1: deprived if With great difficulty, not deprived if othersThreshold 2: deprived if With great difficulty or with difficulty, not deprived if othersThreshold 2: deprived if With great difficulty, with difficulty or with some difficulty, notdeprived if others
Table A7 Sensitivity analysis – Ability to make ends meetAbility to makeends meet Threshold 1 Threshold 2 Threshold 3
total children 0-17 total children 0-
17 total children 0-17
DE 2.0 2.4 6.0 6.7 18.1 20.5FR 2.9 4.0 15.5 20.2 52.7 55.9NL 2.7 3.7 10.4 12.3 23.7 28.4UK 4.9 7.3 13.6 20.1 39.3 51.4Source: own calculations with EU-SILC, wave 2007.

53
Correlation between indicators within a domain (children 0-17 years)
The correlations between indicator deprivation rates within a domain are an indicator forthe degree to which children are likely to be 'multiple domain deprived' (i.e. breadth ofdeprivation within a domain). In most cases correlations are positive with values rangingfrom 0.1-0.5, in some cases the correlations are insignificant; domain deprivation is apuzzle with many facets of which we observe a few. If correlation is very high betweentwo deprivation indicators one would consider excluding one of them but this is not thecase for our set of indicators. We further observe that pair wise correlations varyconsiderably across countries and domains. The highest correlations are found in thefinancial strain domain, notably between 'holiday' & 'ends meet' indicators, ranging from0.25 to 0.42 and between 'arrears' & 'ends meet' ranging between 0.23 and 0.43. Notably,the correlation between 'computer' & 'car', 'leak' & 'warm', 'pollution' & 'crime' and'health' & 'education' indicators is remarkably higher in Germany than in other countries.The larger association between indicators in Germany suggests that the overlap betweenindicator deprivations is larger than in other countries and that those living in Germanyface a higher risk of experiencing cumulative deprivations within a domain (we do notfurther analyze this issue in this paper).
Table A8: Housing problems: correlation between indicatorsunable to keep house warm overcrowding
DE leaks/damp present in house 0.186* 0.091*unable to keep house warm x 0.101*
FR leaks/damp present in house 0.136* 0.145*unable to keep house warm x 0.083*
NL leaks/damp present in house 0.120* -0.006unable to keep house warm x 0.035*
UK leaks/damp present in house 0.106* 0.093*unable to keep house warm x 0.090*
Source: own calculations with EU-SILC, wave 2007.
Table A9: Environment problems: correlation between indicatorsexperienced crime/violence/vandalism
DE experienced pollution/environmental problems 0.332*FR experienced pollution/environmental problems 0.256*NL experienced pollution/environmental problems 0.129*UK experienced pollution/environmental problems 0.156*Source: own calculations with EU-SILC, wave 2007.
Table A10: Difficult access to basic services: correlation between indicatorsdifficult to access compulsory school
DE difficult to access primary health care 0.335*FR difficult to access primary health care 0.046*NL difficult to access primary health care 0.137*UK difficult to access primary health care 0.080*Source: own calculations with EU-SILC, wave 2007.

54
Table A11: Financial strain: correlation between indicatorscannotafford
holiday
cannot affordmeat etc every
second daycannot afforda computer
cannotafford a
car
cannotmake ends
meetDE combined arrears 0.246* 0.186* 0.084* 0.173* 0.251*
cannot affordholiday x 0.313* 0.159* 0.202* 0.292*
cannot afford meatetc every secondday
x 0.182* 0.186* 0.278*
cannot afford acomputer x 0.306* 0.113*
cannot afford a car x 0.142*FR combined arrears 0.330* 0.257* 0.229* 0.192* 0.430*
cannot affordholiday x 0.276* 0.265* 0.188* 0.499*
cannot afford meatetc every secondday
x 0.214* 0.163* 0.327*
cannot afford acomputer x 0.214* 0.303*
cannot afford a car x 0.192*NL combined arrears 0.301* 0.093* 0.119* 0.177* 0.235*
cannot affordholiday x 0.144* 0.103* 0.299* 0.462*
cannot afford meatetc every secondday
x -0.005 0.124* 0.144*
cannot afford acomputer x 0.113* 0.095*
cannot afford a car x 0.263*UK combined arrears 0.376* 0.206* 0.197* 0.215* 0.346*
cannot affordholiday x 0.279* 0.244* 0.286* 0.423*
cannot afford meatetc every secondday
x 0.131* 0.174* 0.218*
cannot afford acomputer x 0.216* 0.173*
cannot afford a car x 0.206*Source: own calculations with EU-SILC, wave 2007.

55
Table A11: Combinations of deprivations between highest correlation domains (unweighted, childrenage 0-17 years)Combinations of deprivations:A = income poorB = housing problemsC = financial strain
%
DE FR NL UKA 3 3 2 5B 9 8 14 9C 17 17 8 15AB 1 1 1 2AC 4 4 1 7BC 10 11 4 8ABC 6 7 1 8Not deprived in A, B and C 51 49 68 46Total 100 100 100 100Source: own calculations with EU-SILC, wave 2007.
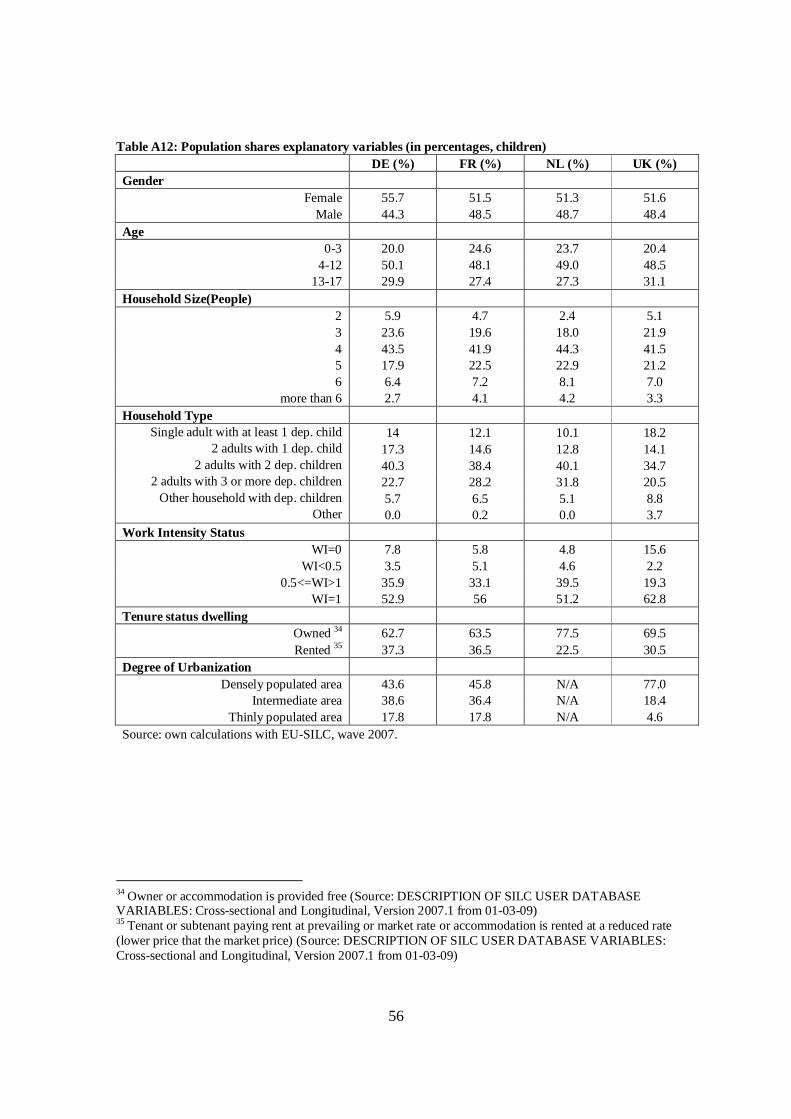
56
Table A12: Population shares explanatory variables (in percentages, children)DE (%) FR (%) NL (%) UK (%)
GenderFemale 55.7 51.5 51.3 51.6
Male 44.3 48.5 48.7 48.4Age
0-3 20.0 24.6 23.7 20.44-12 50.1 48.1 49.0 48.5
13-17 29.9 27.4 27.3 31.1Household Size(People)
2 5.9 4.7 2.4 5.13 23.6 19.6 18.0 21.94 43.5 41.9 44.3 41.55 17.9 22.5 22.9 21.26 6.4 7.2 8.1 7.0
more than 6 2.7 4.1 4.2 3.3Household Type
Single adult with at least 1 dep. child 14 12.1 10.1 18.22 adults with 1 dep. child 17.3 14.6 12.8 14.1
2 adults with 2 dep. children 40.3 38.4 40.1 34.72 adults with 3 or more dep. children 22.7 28.2 31.8 20.5
Other household with dep. children 5.7 6.5 5.1 8.8Other 0.0 0.2 0.0 3.7
Work Intensity StatusWI=0 7.8 5.8 4.8 15.6
WI<0.5 3.5 5.1 4.6 2.20.5<=WI>1 35.9 33.1 39.5 19.3
WI=1 52.9 56 51.2 62.8Tenure status dwelling
Owned 34 62.7 63.5 77.5 69.5Rented 35 37.3 36.5 22.5 30.5
Degree of UrbanizationDensely populated area 43.6 45.8 N/A 77.0
Intermediate area 38.6 36.4 N/A 18.4Thinly populated area 17.8 17.8 N/A 4.6
Source: own calculations with EU-SILC, wave 2007.
34 Owner or accommodation is provided free (Source: DESCRIPTION OF SILC USER DATABASEVARIABLES: Cross-sectional and Longitudinal, Version 2007.1 from 01-03-09)35 Tenant or subtenant paying rent at prevailing or market rate or accommodation is rented at a reduced rate(lower price that the market price) (Source: DESCRIPTION OF SILC USER DATABASE VARIABLES:Cross-sectional and Longitudinal, Version 2007.1 from 01-03-09)

57
Table A13/5.3: Profile for income poverty (Y=1 is income poor)DE FR NL UK
Female 0.750** 0.932 1.035 1.045[0.788,1.102] [0.832,1.287] [0.883,1.236]
Age 0.983 1.041 0.932 0.95[0.920,1.051] [0.977,1.110] [0.860,1.009] [0.888,1.017]
Age squared 1.002 1.001 1.003 1.004*[0.999,1.006] [0.997,1.004] [0.998,1.008] [1.000,1.008]
Household size 1.872* 2.802*** 6.022*** 0.931[1.109,3.160] [2.011,3.903] [3.044,11.912] [0.650,1.335]
Household sizesquared 0.938* 0.954*** 0.913** 1.044**
[0.885,0.994] [0.934,0.976] [0.861,0.967] [1.011,1.079]Single adult with dep.child(ren) 2.982*** 1.525* 3.874*** 4.290***
[2.188,4.066] [1.010,2.304] [2.212,6.786] [3.060,6.014]Two adults, two dep.children 0.679* 0.728 0.355*** 1.061
[0.490,0.941] [0.501,1.057] [0.202,0.625] [0.745,1.512]Two adults, three ormore dep. children 0.933 0.481** 0.441* 1.172
[0.583,1.492] [0.292,0.793] [0.217,0.896] [0.746,1.840]Other household withdep. children 0.617 0.301*** 0.064*** 0.236***
[0.361,1.054] [0.172,0.526] [0.020,0.204] [0.127,0.439]Work intensity(WI=0) 11.327*** 40.478*** 6.452*** 9.096***
[8.707,14.736] [29.262,55.993] [3.891,10.696] [7.245,11.420]Work intensity(0>WI<0.5) 6.829*** 11.323*** 3.053*** 12.807***
[4.698,9.925] [8.266,15.511] [2.049,4.548] [7.366,22.264]Work intensity(0.5 WI<1) 2.163*** 3.207*** 2.068*** 3.962***
[1.762,2.656] [2.616,3.931] [1.615,2.647] [3.200,4.905]Rented dwelling 2.017*** 2.560*** 5.656*** 2.237***
[1.668,2.439] [2.134,3.071] [4.408,7.258] [1.855,2.698]Intermediatepopulated area 1.202 1.155 na 0.731**
[0.988,1.462] [0.952,1.401] [0.581,0.920]Thinly populated area 1.611*** 1.496** na 0.685
[1.268,2.046] [1.173,1.908] [0.451,1.040]Number ofobservations 6096 6311 6945 4786
P-value 0 0 0 0Pseudo R-Square 0.2138 0.2969 0.2319 0.2864BIC 3865.739 3946.788 2546.564 3712.217Notes: logistic regression (robust, odds ratios reported), significance levels: * 10%, ** 5% and *** 1%,omitted classes: two adults - one dep. child, work intensity (WI=1), owns dwelling, densely populatedarea). Small population shares (<5%) in following characteristics: 'other household with dep. children'(NL), 'work intensity (WI=0)' (NL), 'work intensity (0>WI<0.5)' (DE, NL, UK) and 'thinly populated area'(UK).Source: own calculations with EU-SILC, wave 2007.

58
Table A14/5.4: Profile for financial strain (Y=1 is deprived)DE FR NL UK
Female 0.961 1.005 0.848* 1.084[0.856,1.079] [0.895,1.128] [0.729,0.986] [0.943,1.246]
Age 1.035 0.952* 0.977 0.942*[0.988,1.085] [0.911,0.995] [0.923,1.034] [0.890,0.997]
Age squared 0.998 1.003* 1.002 1.002[0.996,1.001] [1.000,1.005] [0.998,1.005] [0.999,1.005]
Household size 1.11 1.643*** 1.871* 0.955[0.719,1.712] [1.264,2.134] [1.093,3.202] [0.655,1.391]
Household size squared 1.01 0.969*** 0.947* 1.033[0.964,1.058] [0.952,0.987] [0.901,0.995] [0.999,1.068]
Single adult with dep.child(ren) 2.907*** 3.024*** 3.690*** 4.217***
[2.314,3.652] [2.350,3.892] [2.661,5.116] [3.202,5.553]Two adults, two dep.children 0.723** 0.664*** 0.682* 0.989
[0.574,0.912] [0.522,0.845] [0.486,0.956] [0.740,1.322]Two adults, three ormore dep. children 0.934 0.685* 0.669 1.094
[0.665,1.312] [0.485,0.968] [0.413,1.083] [0.736,1.624]Other household withdep. children 1.133 0.738 0.78 1.125
[0.777,1.651] [0.505,1.079] [0.452,1.348] [0.733,1.726]Work intensity (WI=0) 7.352*** 10.287*** 4.454*** 2.441***
[5.593,9.665] [7.301,14.494] [2.927,6.780] [1.950,3.054]Work intensity(0>WI<0.5) 2.696*** 5.774*** 2.856*** 2.755***
[1.952,3.723] [4.345,7.673] [1.999,4.081] [1.639,4.630]Work intensity(0.5 WI<1) 1.543*** 2.536*** 1.683*** 1.346**
[1.355,1.756] [2.225,2.890] [1.430,1.981] [1.127,1.608]Rented dwelling 2.644*** 3.294*** 6.166*** 6.286***
[2.320,3.014] [2.897,3.745] [5.185,7.333] [5.336,7.405]Intermediate populatedarea 1.455*** 1.196** na 0.744**
[1.275,1.661] [1.048,1.365] [0.619,0.894]Thinly populated area 2.051*** 1.846*** na 0.677*
[1.733,2.428] [1.567,2.176] [0.500,0.918]Number of observations 6096 6311 6945 4786P-value 0 0 0 0Pseudo R-Square 0.1488 0.1861 0.1953 0.2407BIC 6953.563 7029.779 4815.619 5005.938Notes: logistic regression (robust, odds ratios reported), significance levels: * 10%, ** 5% and *** 1%,omitted classes: two adults - one dep. child, work intensity (WI=1), owns dwelling, densely populatedarea). Small population shares (<5%) in following characteristics: 'other household with dep. children'(NL), 'work intensity (WI=0)' (NL), 'work intensity (0>WI<0.5)' (DE, NL, UK) and 'thinly populated area'(UK).Source: own calculations with EU-SILC, wave 2007.

59
Table A15/5.5: Profile for housing problems (Y=1 is deprived)DE FR NL UK
Female 1.031 1.04 0.998 0.929[0.910,1.168] [0.916,1.180] [0.885,1.127] [0.807,1.068]
Age 0.971 0.950* 0.963 0.944*[0.924,1.020] [0.905,0.997] [0.921,1.008] [0.893,0.999]
Age squared 1.001 1.003* 1.002 1.002[0.998,1.003] [1.000,1.006] [0.999,1.004] [0.999,1.005]
Household size 1.092 1.26 1.266 1.068[0.748,1.595] [0.863,1.841] [0.778,2.059] [0.755,1.512]
Household size squared 1.002 1.03 0.998 1.040*[0.962,1.043] [0.995,1.066] [0.955,1.043] [1.006,1.074]
Single adult with dep.child(ren) 2.714*** 1.920*** 1.149 1.276
[2.137,3.448] [1.466,2.514] [0.851,1.552] [0.965,1.687]Two adults, two dep.children 0.842 0.652** 0.804 0.543***
[0.658,1.078] [0.493,0.864] [0.599,1.078] [0.409,0.720]Two adults, three or moredep. children 1.702** 0.792 0.906 0.864
[1.211,2.392] [0.549,1.144] [0.597,1.376] [0.606,1.231]Other household withdep. children 1.429 0.998 1.413 1.187
[0.966,2.112] [0.665,1.500] [0.882,2.265] [0.810,1.740]Work intensity (WI=0) 2.379*** 2.890*** 2.134*** 1.542***
[1.899,2.980] [2.185,3.824] [1.483,3.071] [1.262,1.885]Work intensity(0>WI<0.5) 2.546*** 2.646*** 1.383* 1.517
[1.821,3.560] [2.022,3.464] [1.001,1.910] [0.892,2.578]Work intensity(0.5 WI<1) 1.215** 1.614*** 1.204** 1.337**
[1.051,1.406] [1.394,1.869] [1.057,1.373] [1.112,1.608]Rented dwelling 3.011*** 3.601*** 2.834*** 3.090***
[2.620,3.460] [3.134,4.137] [2.398,3.350] [2.611,3.656]Intermediate populatedarea 0.945 0.664*** na 0.922
[0.818,1.091] [0.575,0.766] [0.763,1.113]Thinly populated area 1.108 0.788* na 0.896
[0.928,1.323] [0.657,0.946] [0.656,1.224]Number of observations 6096 6311 6945 4786P-value 0 0 0 0Pseudo R-Square 0.1263 0.1996 0.0445 0.1443BIC 6173.368 6119.082 6770.717 4956.269Notes: logistic regression (robust, odds ratios reported), significance levels: * 10%, ** 5% and *** 1%,omitted classes: two adults - one dep. child, work intensity (WI=1), owns dwelling, densely populatedarea). Small population shares (<5%) in following characteristics: 'other household with dep. children'(NL), 'work intensity (WI=0)' (NL), 'work intensity (0>WI<0.5)' (DE, NL, UK) and 'thinly populated area'(UK).Source: own calculations with EU-SILC, wave 2007.

60
Table A16/5.6: Profile for neighborhood problems (Y=1 is deprived)DE FR NL UK
Female 0.973 1.103 0.964 0.96[0.865,1.095] [0.981,1.240] [0.864,1.075] [0.851,1.082]
Age 1.032 1.048* 1.025 1.031[0.985,1.081] [1.002,1.096] [0.984,1.069] [0.980,1.083]
Age squared 0.999 0.999 0.999 1[0.996,1.001] [0.996,1.001] [0.996,1.001] [0.997,1.003]
Household size 1.104 1.330* 1.267 0.672**[0.744,1.636] [1.049,1.686] [0.788,2.038] [0.530,0.853]
Household size squared 0.97 0.980* 0.97 1.031**[0.930,1.011] [0.964,0.997] [0.929,1.013] [1.012,1.051]
Single adult with dep.child(ren) 1.073 1.107 1.091 0.83
[0.850,1.353] [0.867,1.414] [0.838,1.419] [0.656,1.049]Two adults, two dep.children 1.097 0.882 0.807 1.219
[0.871,1.382] [0.695,1.119] [0.619,1.051] [0.965,1.540]Two adults, three or moredep. children 1.502* 0.739 0.725 1.368
[1.067,2.114] [0.530,1.030] [0.492,1.068] [0.999,1.874]Other household withdep. children 1.687** 0.737 1.026 1.405
[1.148,2.480] [0.500,1.085] [0.666,1.581] [0.988,1.998]Work intensity (WI=0) 1.514*** 1.635*** 1.382 1.143
[1.205,1.902] [1.281,2.087] [0.972,1.966] [0.940,1.389]Work intensity(0>WI<0.5) 1.564** 1.109 0.788 0.625
[1.128,2.170] [0.845,1.456] [0.571,1.089] [0.379,1.031]Work intensity(0.5 WI<1) 1.176* 1.265*** 1.262*** 1.065
[1.026,1.348] [1.103,1.450] [1.123,1.419] [0.905,1.253]Rented dwelling 1.436*** 1.631*** 1.548*** 1.564***
[1.256,1.641] [1.432,1.856] [1.320,1.814] [1.345,1.817]Intermediate populatedarea 0.475*** 0.487*** na 0.532***
[0.416,0.543] [0.427,0.555] [0.452,0.627]Thinly populated area 0.292*** 0.307*** na 0.417***
[0.241,0.355] [0.252,0.372] [0.304,0.572]Number of observations 6096 6311 6945 4786P-value 0 0 0 0Pseudo R-Square 0.0529 0.0614 0.0134 0.026BIC 6764.247 6886.225 7902.103 6230.228Notes: logistic regression (robust, odds ratios reported), significance levels: * 10%, ** 5% and *** 1%,omitted classes: two adults - one dep. child, work intensity (WI=1), owns dwelling, densely populatedarea). Small population shares (<5%) in following characteristics: 'other household with dep. children'(NL), 'work intensity (WI=0)' (NL), 'work intensity (0>WI<0.5)' (DE, NL, UK) and 'thinly populated area'(UK).Source: own calculations with EU-SILC, wave 2007.

61
Table A17/5.7: Profile for access to basic services (Y=1 is deprived)DE FR NL UK
Female 1.052 1.128 1.006 0.977[0.932,1.187] [0.975,1.306] [0.877,1.154] [0.818,1.167]
Age 1.088** 1.006 1.117*** 1.129**[1.034,1.144] [0.950,1.065] [1.055,1.183] [1.037,1.228]
Age squared 0.997* 1.002 0.997 0.997[0.994,0.999] [0.999,1.005] [0.994,1.000] [0.992,1.001]
Household size 1.275 1.173 0.746 0.842[0.841,1.932] [0.874,1.575] [0.426,1.305] [0.611,1.161]
Household size squared 0.961 0.989 1.021 1.028[0.921,1.004] [0.970,1.009] [0.969,1.077] [0.999,1.057]
Single adult with dep.child(ren) 1.085 0.996 1.158 1.304
[0.850,1.386] [0.716,1.388] [0.818,1.639] [0.889,1.912]Two adults, two dep.children 0.978 1.033 1.451* 1.228
[0.770,1.241] [0.759,1.406] [1.033,2.038] [0.842,1.791]Two adults, three or moredep. children 1.471* 1.107 1.475 1.795*
[1.045,2.069] [0.724,1.693] [0.912,2.385] [1.145,2.815]Other household withdep. children 1.126 1.617* 1.501 1.138
[0.764,1.660] [1.033,2.531] [0.897,2.510] [0.690,1.875]Work intensity (WI=0) 1.454** 1.402* 0.954 1.308
[1.140,1.853] [1.012,1.941] [0.598,1.521] [0.997,1.716]Work intensity(0>WI<0.5) 1.706** 1.051 1.488* 0.837
[1.216,2.392] [0.740,1.494] [1.057,2.094] [0.436,1.608]Work intensity(0.5 WI<1) 1.171* 1.260** 0.934 1.144
[1.019,1.345] [1.068,1.486] [0.802,1.086] [0.908,1.442]Rented dwelling 0.811** 0.94 1.349** 1.300*
[0.701,0.939] [0.790,1.118] [1.098,1.658] [1.049,1.611]Intermediate populatedarea 1.669*** 1.261** na 0.781*
[1.450,1.922] [1.066,1.491] [0.616,0.991]Thinly populated area 2.346*** 1.350** na 0.824
[1.990,2.767] [1.099,1.657] [0.535,1.269]Number of observations 6096 6297 6945 4786P-value 0 0 0 0Pseudo R-Square 0.028 0.0174 0.0195 0.034BIC 6546.218 5015.641 5655.699 3535.783Notes: logistic regression (robust, odds ratios reported), significance levels: * 10%, ** 5% and *** 1%,omitted classes: two adults - one dep. child, work intensity (WI=1), owns dwelling, densely populatedarea). Small population shares (<5%) in following characteristics: 'other household with dep. children'(NL), 'work intensity (WI=0)' (NL), 'work intensity (0>WI<0.5)' (DE, NL, UK) and 'thinly populated area'(UK).Source: own calculations with EU-SILC, wave 2007.

62
Table A18/5.8: Profile for multiple deprivations in domains financial strain, housing andneighborhood (Y=1 is not deprived, Y=2 is one deprivation, Y=3 is two or three deprivations)
DE FR NL UKFemale 0.979 1.072 0.93 0.971
[0.888,1.080] [0.972,1.183] [0.847,1.022] [0.869,1.085]Age 1.018 0.977 0.983 0.977
[0.978,1.059] [0.941,1.014] [0.948,1.018] [0.932,1.023]Age squared 0.999 1.002 1.001 1.001
[0.997,1.001] [1.000,1.004] [0.999,1.003] [0.998,1.003]Household size 0.854 1.998*** 1.579 0.834
[0.628,1.161] [1.586,2.519] [0.986,2.528] [0.611,1.138]Household size squared 1.023 0.966*** 0.967 1.049**
[0.993,1.054] [0.950,0.982] [0.928,1.008] [1.019,1.081]Single adult with dep.child(ren) 2.398*** 2.178*** 1.924*** 1.806***
[1.982,2.901] [1.758,2.698] [1.506,2.459] [1.456,2.241]Two adults, two dep.children 0.924 0.604*** 0.689** 0.800*
[0.762,1.121] [0.492,0.741] [0.535,0.887] [0.643,0.995]Two adults, three or moredep. children 1.465** 0.578*** 0.685* 1.034
[1.108,1.938] [0.430,0.778] [0.472,0.995] [0.765,1.399]Other household withdep. children 1.532** 0.654* 1.056 1.202
[1.114,2.106] [0.467,0.917] [0.692,1.612] [0.861,1.679]Work intensity (WI=0) 4.481*** 5.777*** 2.779*** 1.730***
[3.586,5.599] [4.422,7.549] [2.039,3.788] [1.451,2.064]Work intensity(0>WI<0.5) 2.845*** 3.793*** 1.597*** 1.569
[2.072,3.906] [2.941,4.890] [1.226,2.081] [0.978,2.515]Work intensity(0.5 WI<1) 1.382*** 2.059*** 1.394*** 1.315***
[1.238,1.542] [1.839,2.306] [1.259,1.543] [1.131,1.529]Rented dwelling 2.884*** 3.452*** 4.080*** 4.712***
[2.572,3.234] [3.069,3.883] [3.477,4.788] [4.076,5.447]Intermediate populatedarea 0.847** 0.669*** 0.598***
[0.759,0.947] [0.598,0.748] [0.516,0.693]Thinly populated area 0.915 0.817** 0.576***
[0.796,1.051] [0.712,0.937] [0.445,0.745]Number of observations 6096 6311 6947 4786P-value 0 0 0 0Pseudo R-Square 0.1019 0.1389 0.0625 0.1251BIC 11889.097 11904.741 12609.651 9321.839Notes: ordered logistic regression (robust, odds ratios reported), significance levels: * 10%, ** 5% and ***1%, omitted classes: two adults - one dep. child, work intensity (WI=1), owns dwelling, densely populatedarea). Small population shares (<5%) in following characteristics: 'other household with dep. children'(NL), 'work intensity (WI=0)' (NL), 'work intensity (0>WI<0.5)' (DE, NL, UK) and 'thinly populated area'(UK).Source: own calculations with EU-SILC, wave 2007.