cross-national comparison of income and...
TRANSCRIPT
CROSS-NATIONAL COMPARISON OF INCOME AND WEALTH
STATUS IN RETIREMENT: FIRST RESULTS FROM THE
LUXEMBOURG WEALTH STUDY (LWS)
Eva Sierminska, Andrea Brandolini, and Timothy M. Smeeding*
CRR WP 2007-3
Released: February 2007 Draft Submitted: November 2006
Center for Retirement Research at Boston College Hovey House
140 Commonwealth Avenue Chestnut Hill, MA 02467
Tel: 617-552-1762 Fax: 617-552-0191 http://www.bc.edu/crr
* Eva Sierminska is a research associate and the Wealth Project (LWS) Director at the Luxembourg Income Study. Andrea Brandolini is an economist at the Bank of Italy. Timothy M. Smeeding is the Director of the Center for Policy Research at Syracuse University. The research reported herein was supported in part by the by the LIS and LWS member countries. An earlier version was presented to the 8th Annual Joint Conference of the Retirement Research Consortium “Pathways to a Secure Retirement” on August 10-11, 2006 in Washington, DC. The research reported herein was performed pursuant to a grant from the U.S. Social Security Administration (SSA) funded as part of the Retirement Research Consortium. The findings and conclusions are solely those of the authors and do not represent the views of SSA, any agency of the Federal Government, The Luxembourg Income Study, the Bank of Italy, Syracuse University, or Boston College. The opinions and conclusions are solely those of the authors and should not be construed as representing the opinions of our employers or sponsors. We thank James P. Smith, Janet Gornick and Axel Borsch-Supan for comments, and Kati Foley, Karen Cimilluca, and Mary Santy for data and manuscript preparation. Please send comments to Smeeding at [email protected]. © 2007, by Eva Sierminska, Andrea Brandolini, and Timothy M. Smeeding. All rights reserved. Short sections of text, not to exceed two paragraphs, may be quoted without explicit permission provided that full credit, including © notice, is given to the source.

About the Center for Retirement Research The Center for Retirement Research at Boston College, part of a consortium that includes parallel centers at the University of Michigan and the National Bureau of Economic Research, was established in 1998 through a grant from the Social Security Administration. The Center’s mission is to produce first-class research and forge a strong link between the academic community and decision makers in the public and private sectors around an issue of critical importance to the nation’s future. To achieve this mission, the Center sponsors a wide variety of research projects, transmits new findings to a broad audience, trains new scholars, and broadens access to valuable data sources.
Center for Retirement Research at Boston College Hovey House
140 Commonwealth Avenue Chestnut Hill, MA 02467
phone: 617-552-1762 fax: 617-552-0191 e-mail: [email protected]
www.bc.edu/crr
Affiliated Institutions: American Enterprise Institute
The Brookings Institution Center for Strategic and International Studies
Massachusetts Institute of Technology Syracuse University
Urban Institute

Abstract
This paper provides a first glance at the role of income and wealth in comparing
economic security of older persons in the United States in cross-national perspective. We
compare our elders to those in six other rich OECD countries (Canada, Finland,
Germany, Italy, Sweden, and the United Kingdom). These countries have diverse social
policy systems, with respect to both social insurance and public assistance; and they have
very different patterns of private wealth holding. The paper is based on a new source of
wealth micro data, known as the Luxembourg Wealth Study (LWS).
In this paper, we first develop a comparable definition of wealth and net worth
across nations and then focus our efforts on the inter-country variation in the composition
of income and asset packages for those 65 and over, with respect to the main sources in
each package. We examine the structure of income and wealth holdings and their joint
distribution; income and asset poverty of the elderly; the importance of home ownership
in providing security for the elderly; differences in wealth by education; and we provide
an initial glimpse at wealth and income inequality in a comparative perspective. We
conclude by comparing the risks associated with private assets to those associated with
under-funded public pension systems.

I. Older Persons in Comparative Perspective
Considerable progress has been made in reducing poverty and economic
insecurity among individuals ages 65 and older in most rich countries over the past fifty
years. Older persons are increasingly able to live long and relatively healthy lives free of
poverty in relatively secure social and economic situations, and are increasingly less
likely to share accommodations with their adult children or to rely on them for direct
economic support in old age. Indeed most resource transfers between generations now go
from elders to children and not vice versa as was more or less the case in the United
States before 1960 (Engelhardt and Gruber 2004; Engelhardt, Gruber, and Perry 2005;
Clark, et al. 2004; Smeeding 1999). Still older persons’ income poverty has not been
eradicated, especially in the English-speaking nations; and women’s poverty status in old
age is still a major concern in most rich societies (See Gornick, et al, 2006). Indeed even
when wealth and income are taken into account in the US, lowly educated, nonworking,
single older persons seem to be deprived (Haveman, et al., 2006). However, how does the
U.S. experience compare to that of other nations?
So far, most of what we know about elder poverty and well-being in cross-
national context has been derived from the Luxembourg Income Study (LIS) data (e.g.,
see: Smeeding-Sandstrom 2005; Keese 2006; Brown and Prus 2006) from micro
simulation of incomes (Dang, et al. 2006) or from harmonized household longitudinal
panel data (Burkhauser, et al. 2005). In order to most effectively design a system to
further reduce poverty and increase economic security, we need to know more about how
older persons live and what other sources of economic support they might have, over and
above their annual incomes.
In this paper, we sharpen and focus on sources of economic well-being for the
elderly by considering both income and wealth, using the newly available Luxembourg
Wealth Study (LWS) database. We extend prior cross-national analyses of older persons’
economic well-being by assessing both income and wealth in a harmonized fashion
across a number of rich OECD nations. Earlier studies have been limited to only two or
three nations (e.g., Banks, Blundell and Smith 2003; Kapteyn and Panis 2003). We
investigate the multiple income streams on which elderly persons rely and compare that

2
to the level and structure of their wealth holdings. We conceptualize the income support
system as having four legs: earnings, capital income, private transfers, and public
transfers. We capture wealth mostly as a stock (in what we call “wealth packages”),
although wealth clearly constitutes a potential income and consumption stream as well.1
In order to effectively make this first comparison using both types of resources in
the space made available, we have to sketch out our methodology and focus on just a few
comparisons. And so, we address several core research questions: How do older persons’
income packages — and their wealth portfolios — vary across countries on average and
in particular for lower income older persons, where resources are measured in both
absolute and relative terms? How does well-being vary across countries focusing on the
joint distribution between income and wealth? To what extent is low income and low
education (one proxy for permanent incomes) paired with limited wealth, and does that
vary across countries? We will also compare income and asset poverty and both
combined to see how likely elders are to experience low-income and meager financial
assets. And finally, we will examine how these patterns of within-country disparity in
income and wealth vary cross-nationally.
We also want to begin to address some policy questions. To what extent do the
pension systems in other countries, where we find larger social retirement schemes,
embody policy features that are advantageous for asset accumulation? Is there evidence
that these features contribute to variation in the economic well-being of the elderly? And
in closing, what can we say about the economic security of elders in the future once the
contributions of income and wealth are both taken into account?
Indeed this is exploratory work. Future research will focus in on any number of
additional issues. LWS allows one to investigate how health status affects wealth holding
and poverty in old age. While consumption is closely linked to both income and assets in
old age (e.g., Hurd and Rohwedder 2006), we have not yet derived comparable measures
of consumption to go along with our measures of income and assets. We do not assess
how needs — e.g., for health care finance — are changing along with assets and incomes 1 We also capture some wealth directly as flows, via the “capital income” component of the income package, but as elders increasingly consume from their accumulated assets, interest rent dividends and capital gains do not capture the full value of assets for economic well being. We also do not measure the rental equivalent value (imputed income) from owner occupied homes in this paper, though it is discussed in the poverty section of the paper.
3
in the various countries in this paper. Further questions related to gender, age breaks
above age 65, race, minority status, ethnicity, and geographic location should also be
addressed in future work.2
II. Brief Literature Review
Although several literatures cross-cut issues related to older persons economic
well-being in comparative perspective, we focus our scan of the literature in two areas:
the newer cross-national literature on wealth holding including housing wealth especially,
and the research on older person’s poverty. In both cases, we concentrate almost solely
on cross-national research.
Wealth in Cross-National Perspective
New studies of comparative wealth holdings — many in the form of singular
components, such as owner occupied housing and pensions, are just beginning to emerge
over the past 5-7 years (Chiuri and Japelli, 2006; Apgar and Di, 2005; Banks, Blundell
and Smith, 2003; Kapteyn and Panis 2003). Many of these have been limited because of
unavailability of comparable data, or have been limited to two or three countries where
each author harmonizes his own data for purposes of making a particular comparison. It
should be noted that many of the new and emerging “cohort studies” of older persons
(HRS, ELSA, SHARE) will also help fill this comparative data void, but for one or two
specific cohorts only. Moreover, the SHARE data is not yet ready for comparisons to the
results presented here because household weights and data cleaning have not yet been
released. The comparison we do have between the SCF and the HRS data show a close
correspondence (Juster, et. al., 1999). Comparisons with ELSA and SCG have not yet
been made.
Housing wealth is by far the most studied of these components (Chiuri and Japelli
2006; Apgar and Di 2005; Doling, et al. 2004; Claus and Scobie 2001; Banks et al. 2005).
While housing is the most widely held real asset in many countries, its effects on other
consumption or on additional wealth accumulations are less generalizable (Apgar and Di
2 In so far as we know, only one other paper (also in draft form) has begun to look into this general topic using the LWS data, focusing on women age 60 and over (Gornick, et al. 2006).

4
2005). In the United States, reverse annuity mortgages and home equity loans are just
now beginning to be used by “home rich but cash poor” elders to access their savings.
Even then, this access is not terribly widespread, occurring to less than 10 percent of
United States elders in the early 2000’s (Fisher, et al. 2006; Copeland, 2006; see also
Mitchell and Pigot, 2004 on Japan; and Hurst and Stafford 2004, on the United States).
At the same time, Apgar and Di (2005) report that low-income (bottom 20 percent of
elders ranked by income) United States units which own their own homes outright, may
still end up spending 25 percent or more on housing due to property taxes, utilities, and
upkeep. Thus, ownership is not without direct costs even when the mortgage has been
paid off. Indeed one could examine housing vs. income poverty and their joint
distribution in cross-national context. The effects of housing on other consumption vary
(Carroll 2004; Case, et al. 2001) with MPC’s of 2-8 percent. Similar amounts are found
by Catte, et al .2004 for a wider range of OECD nations. The effects of housing wealth on
consumption are smaller than those of financial wealth in some studies (Barrel and Davis
2004), but the results vary with the methods used (see Sierminska and Takhtamanova
2006, for an overview). Others have made forays on the extent of financial wealth
holdings and their effect on consumption, claiming that the propensity to hold stocks in
the United States is more widespread than in other rich nations (Dvornak and Kohler
2003) and therefore has a larger effect on spending.
Evidence of home owning and maintenance of housing wealth has been studied
by many analysts in specific countries (e.g., Venti and Wise 2001; and Fisher, et al. 2006,
for the United States; Crossley and Ostrovsky 2003, for Canada; Ermisch and Jenkins
1999, in the United Kingdom; Tatsiramos 2004 for six European nations; and finally
Chiuri and Japelli 2006, more generally using the LIS data). They find that housing is
held long into retirement with the exception of two nations (Finland and Canada) where
the transition from owning to renting takes place later in life. In most other nations, rules
of housing finance, borrowing, and other national idiosyncrasies have large effects on
renting vs. owning across the life cycle (e.g., see Chen 2006; Chiuri and Japelli 2003;
Ortalo–Magne and Rady 2005; Martins and Villanueva 2006).

5
Poverty and Income in Cross-National Perspective
Despite major progress in recent decades, significant pockets of poverty remain
among the elderly. The relatively precarious economic position of the elderly in the
United States as measured by their incomes (Shaw and Lee 2005; Dang, et al. 2006) is
even more evident when we look at cross-national comparative data. Poverty outcomes
are markedly better in Canada and in Scandinavian-Nordic countries, than in the United
States (Smeeding and Sandstrom 2005; Brown and Prus 2006).
A number of researchers have used the Luxembourg Income Study (LIS) data to
analyze broader range income disparities among elders, (Smeeding 2003; Doring,
Hauser, Rolf and Tibitanzl 1994; Hutton and Whiteford 1992; Smeeding, Torrey, and
Rainwater 1993; Stapf-Fine 1994; Siegenthaler 1996; Smeeding and Saunders 1999).
Many of these papers examine the income portfolio of elders (men, women, and couples),
and find a balanced package of private or occupational pensions, retirement savings,
earnings, and public transfers only at higher income levels. At median and below median
income ranges, social retirement pensions or income tested public transfers dominate the
income sources of elderly units in every nation.
Another body of literature assesses income trajectories and transitions during
older years — although not necessarily with a focus on poverty alone. For example,
drawing on the Cross-National Equivalent File, Burkhauser, et al (2005) studied the
economic well-being of elders in the United States, compared to those in the United
Kingdom, Canada, and Germany. They concluded that, despite diverse social welfare
systems, the change in economic well-being in old age is actually remarkably similar
across these countries.
In most cross-national research on older person’s well-being, income is the main
indicator. But in all of these studies wealth is rarely mentioned, though Smeeding (2003)
capitalizes interest rent and dividend flows to estimate financial wealth, and he
differentiates between homeowners and renters in some comparisons. And the literature
on elder consumption across countries is more limited and less well established (see
Sierminska and Garner 2002). While recent papers suggest that consumption among older
women is both higher than income and more equally distributed in the United States, we
have no such estimates for other countries on a comparable basis (Johnson et al. 2005).

6
In summary, there is a large gap to be filled by papers using the LWS data. This
paper is just the tip of a large iceberg of research which will contribute to better
understanding the joint effects of income and wealth on well being at older ages.
III. Data, Variables, Methods, and Measurement Issues. 3
Data
The empirical work for these analyses is based on data associated with the
Luxembourg Income Study (LIS). LIS is a cross-national archive of harmonized cross-
sectional micro-datasets from across the industrialized countries. For over twenty years,
LIS has collected and harmonized datasets containing income data at the household- and
person-level; these datasets also include extensive demographic and labor market data.
Currently, the LIS database includes over 140 datasets, from thirty countries, covering
the period 1967 to 2002.4
All of the data used in this paper are from the Luxembourg Wealth Study (LWS)
— a new project that is under development within the larger LIS project. The LWS
database contains harmonized wealth micro-datasets from ten rich countries. These
wealth datasets also include comparable income data, and we use both components in this
paper. The LWS project is still in its pilot phase. The first release of the database will be
finalized during 2007 and then made available for public access. Access will be via LIS's
remote-access system, as with the LIS income datasets.5
In this paper, we include seven countries, each with a LWS dataset from the
period 1999-2002. These countries include the United States, Canada, and the United
Kingdom; two continental European countries, Italy and Germany; and two Nordic
countries, Finland and Sweden. We chose these seven in order to include countries with
3 Additional details are contained in the notes to the tables themselves and in a methodological appendix. 4 See www.lisproject.org for a detailed description of the Luxembourg Income Study (LIS), including both the original LIS datasets and the new LWS datasets. See also the first methodological paper from LWS , Sierminska, et. al. (2006a) 5 Preliminary analyses reveal that poverty rates and income packages based on the income data from these new LWS data itself are very similar to those produced in the LIS data; the cross-national rankings are the same and measures of poverty and inequality are very large. See Niskanen, 2006 for a comparison.

7
diverse economic outcomes and widely varying social and economic systems. The
original datasets that the LWS project harmonized include; for the United States, the
Survey of Consumer Finances (SCF) 2001; for Canada, the Survey of Financial Security
(1999); for the United Kingdom., the British Household Panel Study (BHPS) 2000; for
Italy, the Survey of Household Income and Wealth (SHIW) 2002; for Germany, the
Socio-Economic Panel Study (German SOEP) 2002; for Finland, the Household Wealth
Survey (1998); and for Sweden, the Wealth Survey 2002 (Sierminska, et. al. 2006a). We
do not use the Austria, Cyprus or Norway LWS data in this paper. We also refer to the
second United States LWS dataset, the PSID, in some places, but we rely on the SCF for
most of the analyses in this paper.
Income and Wealth “Packages” — The Aggregate Indicators and Their
Components
Our main income variable used in the income and wealth poverty analyses — is
household disposable personal income (DPI). DPI is defined as the sum of total revenues
from earnings, capital income, private transfers, public transfers (social insurance and
public social assistance) — net of taxes and social security contributions.6
In the LWS data, these income sources—the four legs of the income stool, as it
were — are defined as follows. First, earnings include wages and salaries, as well as
income from self-employment activities. Second, capital income includes interests and
dividends, rental income, income from savings plans (including annuities from life
insurance and private individual retirement accounts), royalties and other property
income.7 Third, private transfers include occupational and other pensions (e.g., pensions
of unknown type or foreign pensions), alimony, regular transfers from other
households/charity/private institutions, and other incomes not elsewhere classifiable.8
6 Imputed rents and irregular incomes such as one-time lump sums and capital gains and losses are not included in DPI. 7 Capital income does not include capital gains/losses, which are both excluded from the concept of DPI. See Niskanen (2006) on the exact definitions of disposable income in LIS and LWS. 8 Private transfers do not include irregular incomes such as lottery winnings or any other lump-sums, which are excluded from the concept of DPI.

8
Fourth, public transfers include social insurance (including some universal benefits such
as social retirement pensions, unemployment insurance, disability benefits, and family
allowances), as well as public social assistance, which includes income-tested and
means-tested cash and near-cash public income transfers.9
The counterpart of DPI, with respect to wealth, is the concept of net worth that
consists of financial assets and non-financial assets — net of total debt. Financial assets
include deposit accounts, stocks, bonds, and mutual funds. Non-financial assets are
broken into two parts: (owned) principal residence and other investment real estate.
Finally, total debt refers to all outstanding loans, both home-secured and non-home
secured. We do not include pension wealth which has not been realized in the form of a
pension flow or converted to accessible financial assets. Finally, business assets are not
included as they are comparable for only a much smaller number of nations (see
methodological note at the end of the paper and at http://www.lisproject.org/lws.htm).
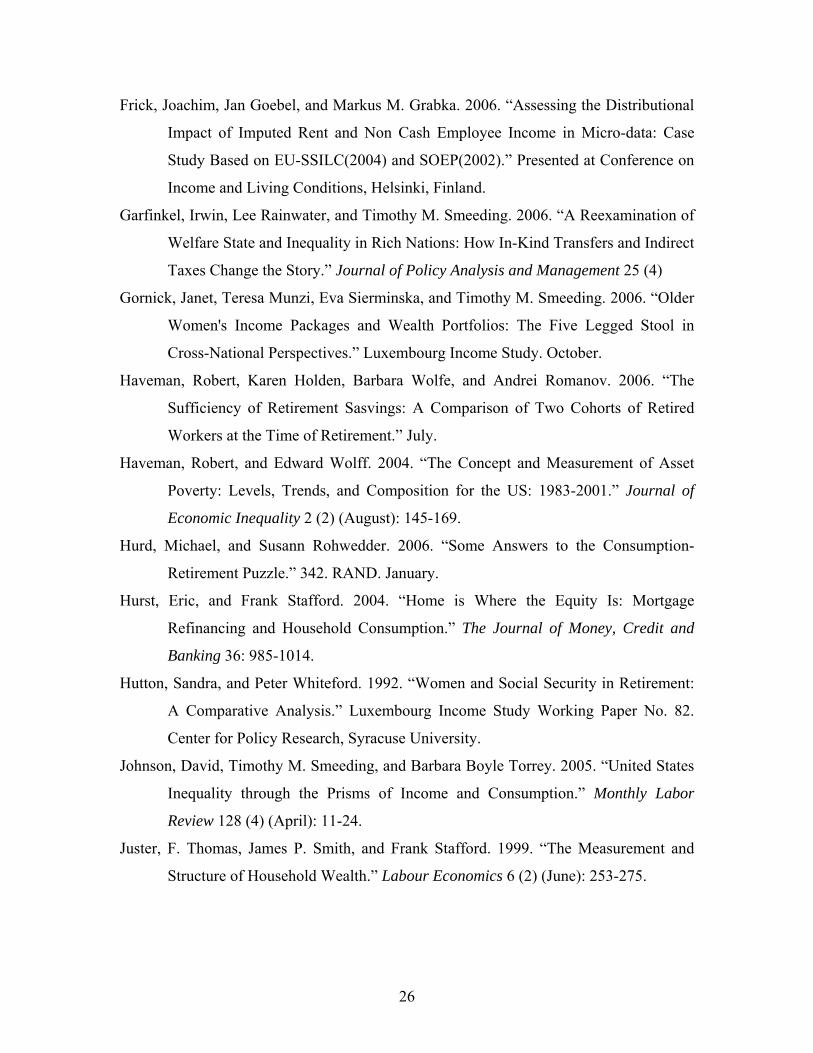
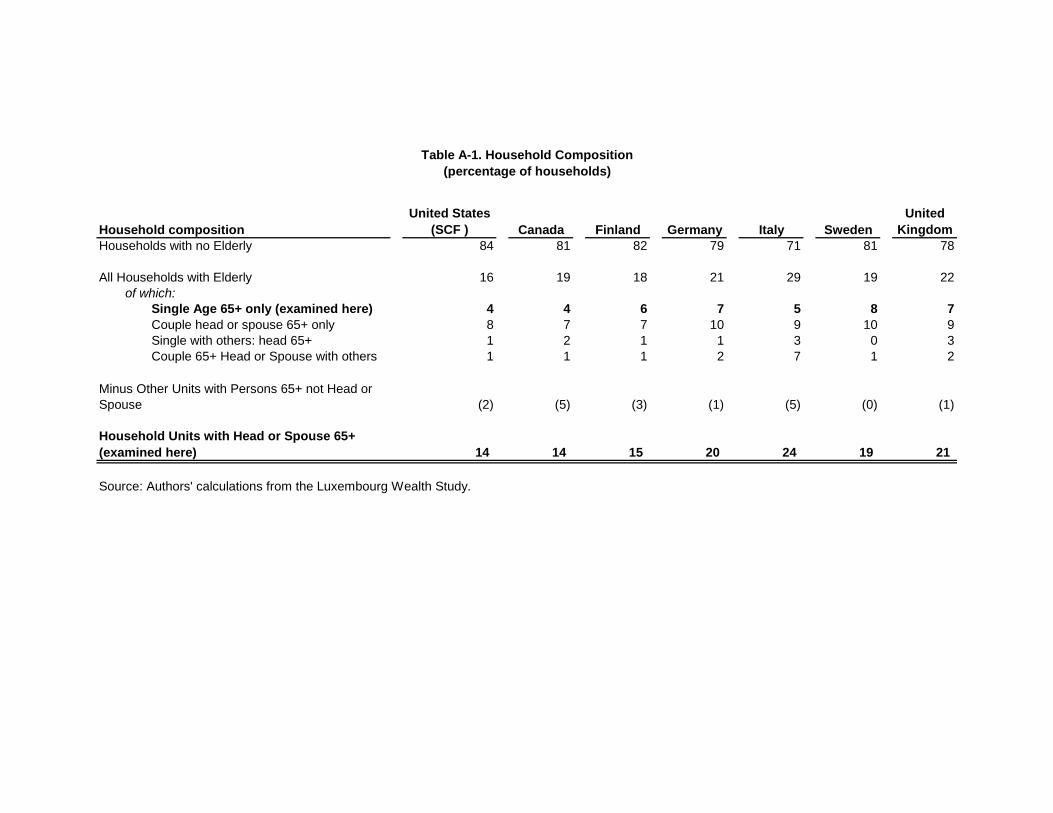
Analyzing the Economic Well-Being of the Elderly: Units of Analysis
In analyzing economic well-being, we limit ourselves to all units with a head or a
spouse aged 65 or over. We ignore differentials in holdings among individuals within
households (e.g., between spouses) because many sources of income and wealth cannot
be disaggregated within households. We analyze only two types of households: all that
include elderly persons (i.e., persons age 65 and older) as either the head or the spouse;
and single individuals living alone who are age 65 or over as a subset of the larger group.
These households may or may not contain additional persons (Appendix Table A-1 and
methodological note).
In all of these countries the majority of the members of these households are a
couple, either married or cohabiting, although some are elderly female heads living
without a spouse/partner but with other persons, and some live entirely alone.10 The unit
of analysis is the household, or all the individuals within such households, which includes
9 Our income measure does not include health care benefits in-kind, even we know that they are large (Garfinkel, Rainwater and Smeeding 2006), nor does it contain in-kind housing benefits in the form of imputed rent. It does include the cash value of having allowances, food stamps, and heating allowances. 10 This scheme does not explicitly capture one group of elderly: those who are part of extended households and who are neither the head nor the spouse of the head.
9
some non elderly persons in multigenerational units. Since assets are recorded on a
household level, we implicitly assume full sharing of all resources among members of the
household. We exclude other households with an elderly person, where neither head nor
spouse are age 65 plus. These are most likely low income or frail elders living with adult
children, where we assume that the majority of assets in the household belong to the
younger generations and not the elders.
The fraction of households which are included in our analyses, ranges from 14
percent in the United States and Canada to 24 percent in Italy (where in the latter there
are a number of elders living in multigenerational households). The rest of the countries
include 14-21 percent of all households. The decision to exclude households where elders
are living with younger generations mainly affects Canada and Italy where 5 percent of
all households are excluded from our analyses. Between 4 and 8 percent of households
are single elders living alone.
Equivalizing Income and Wealth, and Other Data Adjustments
As is standard in research on income, we “equivalize” the income data—meaning,
we adjusted each household's income to account for household size. Incomes are
equivalized as follows: adjusted income equals unadjusted income divided by the square
root of household size. Although there is a large literature on income equivalency scales,
there is much less consensus about how to equivalize wealth (Sierminska and Smeeding
2005). In most of our analyses, we use the same method for wealth as we did for
income—in a few places we compare outcomes where wealth is not equivalized.
Incomes were bottom-coded at 1 percent of the mean equivalized DPI and top-
coded at 10 times the median unequivalized amount. The wealth variables are not
bottom-coded or top-coded and as a result wealth variables (net worth in particular) can
contain negative and zero values. Because the top and bottom ends of these wealth
distributions may differ across countries, depending on the quality of the wealth survey
and the sampling practices among the richest portions of the population, we rely mainly
on medians, not means. All observations with missing or zero disposable income or
missing net worth were dropped from the sample. Furthermore, when we report actual
currency amounts, all amounts are expressed as United States dollars, adjusted by
10
purchasing power parities (PPPs), using the 2002 OECD individual consumption by
households PPPs. Amounts referring to years prior to 2002 were deflated using each
country's CPI.
Poverty Measurement—Income and Wealth
For purposes of international comparisons, poverty is usually captured in relative
terms.11 When analyzing income, most cross-national studies define the poverty threshold
as one-half of national median (equivalized) income. In this study, we use 50 percent of
median household income (of the whole population) to establish our national relative
poverty lines. The 50 percent line is closest to the Canadian Low Income Cut Off (LICO)
standards. It is above the ratio of the official United States poverty line to median
American household cash income which was about 30-35 percent in 2000 and 2002
(Smeeding 2006) and below that used in the European Union where the poverty line is set
at 60 percent of median income.12
While there is considerable agreement on the appropriate measurement of income
poverty in cross-national context, there is no such consensus on asset or wealth poverty
measures. For this paper, we have chosen a poverty definition of households with
financial assets below one quarter of adjusted median household incomes (or one-half of
the poverty line) for the whole population. Thus, households without enough financial
assets to support themselves for six months at a poverty line income level are deemed
asset poor. We do not explore other measures here, e.g. those based on wealth alone
(such as financial assets less than half of median liquid assets, or net worth less than half
of median net worth). In future work we intend to explore various measures that might
capture absolute as well as relative wealth poverty. 13
11 For a discussion of the merits of using relative versus absolute poverty in cross-national research, see Kenworthy 2004; Smeeding, Rainwater and Burtless 2001. 12 While we use only the 50 percent definition in this paper, others -- including the United Kingdom and the European Union -- have calculated poverty rates for elders based on 60 percent of the median income (Atkinson et al. 2002; Bradshaw 2003). In other papers we use both the 40 and 50 percent cutoffs, e.g., Gornick et. al. 2006. 13 Haveman and Wolff (2004) and Caner and Wolff (2003) have analyzed absolute wealth poverty ―but for the United States only. Haveman and Wolff (2004) defined “a household with insufficient assets to enable it to meet basic needs (United States official poverty line) for a period of time (three months) to be

11
IV. Results
We begin by presenting a set of basic results followed by discussion in section V.
Descriptive statistics are followed by deeper analyses of income and wealth for poor and
non-poor units, housing values, the relationship between education and net wealth, and
the joint distribution of income and wealth. Readers should keep in mind that wealth
values, e.g., for homes vs. financial wealth, may be sensitive to the year and date at which
data are recorded.
Openers: Asset Participation and Wealth Holding
Patterns of asset holding and portfolio composition among older household units
are more similar in terms of prevalence than in level or composition (Table 1).14
Excluding Germany (due to its bottom code for financial assets), only Italian elder
households are 75 percent likely to hold some form of financial assets. In other nations
financial asset holdings range from 82 percent (United Kingdom) to 95 percent (United
sates). Almost all of those with such assets hold deposit (savings or checking) accounts.
Stock ownership is far less prevalent, except for Finland, Sweden, and then the United
States. The Swedish households are most likely to hold stocks, bonds and mutual funds,
perhaps as a holdover from the “third tier” of their universal defined contribution
retirement accounts (Sunden 2006). While financial asset holdings are widespread, they
account for over 40 percent of household portfolios only in Sweden and the United
States, where financial wealth is 44 percent of the total wealth portfolio (Table 1, Panel
B). While the Swedish and the Finnish households are more likely to hold stocks than are
United States elder households, they are of lesser value relative to other assets than in the
United States.
Non financial assets figure heavily in the asset position of all elderly households,
especially when looking at ones principal residence. German and Swedish households are
least likely to own their own homes. United States elders are most likely to do so. In
asset poor.” They primarily have used a definition of liquid assets and we have chosen a similar time frame, three months, but a higher base poverty cutoff. 14 Simply stated, ownership is one way to consider non financial assets, another is valuation.

12
Finland, a full third owns other residences—most likely summer or vacation homes, a
pattern also prevalent in the United States and Italy. Only in the United Kingdom do less
than 10 percent of elderly headed households own other real estate.
Non-financial assets make up the major part of all elder portfolios, adding up to
83 percent or more of the total value of assets in Finland, Italy, and Germany, but less
than 60 percent in the United States. Despite its widely acknowledged role in elder
wealth holding, the value of an own home for United States elderly is still only 35
percent of their total portfolio, but 55 percent or more in all other nations. Finland leads
in the importance of the aggregate value of other real estate, but the United States is not
far behind.
Debt holding among elderly households is most likely to be found in the United
States (49 percent), Sweden (39 percent), and Canada (32 percent), we suspect for tax
reasons, but also depends on the availability of these loans to the elderly. The majority of
elder debt is held in the form of home loans and in the aggregate, debt values are 5
percent or less of the elder total wealth portfolio.
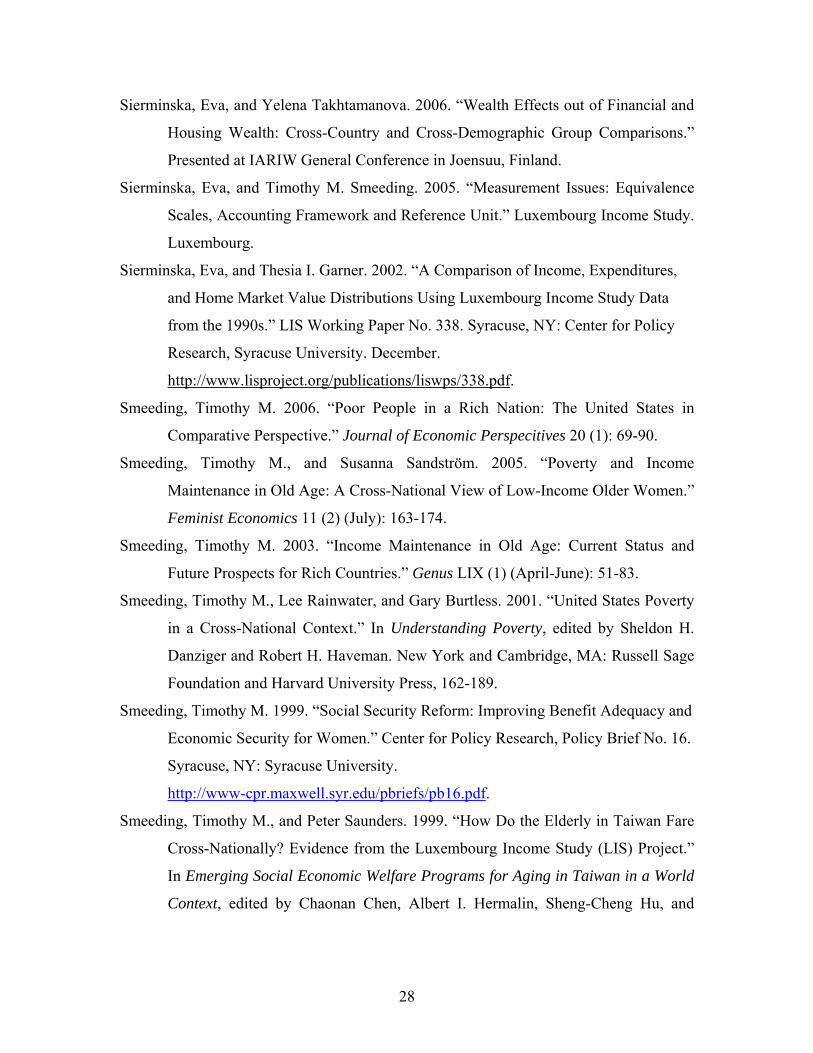
Magnitudes, Values, and Composition: Income and Wealth
Median adjusted incomes for elder households (in 2002 PPP adjusted dollars) are
remarkable similar in the countries we study (Table 2). In Finland and Sweden, they have
the lowest relative incomes, but the variance across nations is relatively small. In income
terms the elders are 10-15 percent less well off at the median compared to the whole
population; and single elders typically have incomes 2/3 the value of the entire
population. The PPP values of these incomes for the median unit are roughly the same,
varying only from about $13,800-20,043 for all households and from $ 10,600-14,900 for
singles. The United States is at the top of these rankings, as it should be since its GDP per
person is 20-25 percent larger than that in the other nations compared here. Note that the
overall median incomes (last two columns of Panel A), on which income and wealth
poverty rates are based later in the paper, are also quite compressed. Excluding Italy, this
suggest that the relative poverty measures we use are not very different from any absolute
poverty measure which are also based on median incomes, e.g. using the overall average
13
adjusted income per equivalent adult of $19,061 as a basis for calculating absolute
poverty.
Whether mean or median incomes are used similar conclusions can be drawn
(Table A-2). For example, the elders are about 10 percent less well-off at the mean
compared to the whole population. Finland and Sweden once again, have the lowest
relative incomes and the variance across nations is smaller than before. Single elderly
households fare only a few percentage points better when the measure is based on mean
rather than the median. The range of income values based is slightly broader using the
mean, as it varies from $16,561-$28,028 for all elderly households, and $11,536-$21,521
for singles. When these values are compared as a percentage of the average there are
virtually no differences in the country rankings based on the two measures.
In contrast to median incomes, median wealth holdings vary by a much greater
degree. Of course, owing to the life cycle, net worth is much larger for elders than it is for
the average household, with two exceptions: Germany, where homeownership and home
values are relatively low for single elders15 and Italy where there are more
multigenerational households. For elderly households, the United States is the wealthiest
nation in both relative and absolute terms. Some of this difference may be due to the high
wealth sub-sample in the United States SCF survey.16 (Repeating this exercise using
means yields similar results (Table A-2 Panel B). Italy and the United Kingdom are next
most rich, while the Swedish and Finnish households have the lowest asset values for
elders. Single elder Germans are by far the least well-off in net worth terms, followed by
the Swedes.
The data on net worth for the entire population presented in the final column of
the table paint a very different picture. The median net wealth holdings of all households
are very different than those of elders. Italian real estate and United Kingdom wealth
holdings make them the richest, while the United States is now below the average nations
median and not much different from Canada or Germany. These results suggest that we
15 Much of the difference between Germany and the others might be explained by the vestiges of World War II and its effects on the German housing stock. 16 For instance, these results do not change at all using median PSID values (which are not shown but which are very close to median SCF values) for these same wealth measures.

14
might find very different life cycle wealth portfolios across these nations (see Sierminska,
Brandolini and Smeeding 2006a).
The components of income and wealth are shown in Table 3. The contrasts in
income packages are large. Earnings are largest in the United States and Canada where
retirement ages are latest and larger fractions work at older ages. Declared income from
assets is also much larger in the United States (23 percent) than in other nations, with
Finland second (15 percent). Private transfers — mainly occupational pensions ― are
largest in Finland, where there is some question as whether to count such pensions as
private or public due to their mandatory employment related nature, and in Canada and
the United Kingdom. Combined social insurance and social assistance is smaller in the
United States (and Finland) than in other nations — 27 percent vs. 65-69 percent in
Sweden and Germany. In terms of the 4 legged stool metaphor — the income legs are the
most even in the United States the United Kingdom and Canada, while other nations rely
to a greater extent on public transfers. The legs of the stool are very different — shorter
or longer — in other nations.
Wealth packages are simply presented in the middle and bottom of Table 3 using
the same categories as in Table1. Here we contrast average equivalized values (Panel B
— similar to unequivalized values in Table 1) with medians (Panel C). The differences
between these snapshots are largely due to differences in wealth distributions across and
within nations. Indeed, the “average” values in Panel B are very similar to the “averages”
in Table 1. The “median” household estimates in Panel C are sometimes very different.
For instance, while home values are 35 percent of average total assets of the U.S. elderly,
households make up 70 percent of the portfolio for the “average” (median) American
household. Owned homes are the major asset for the ‘average’ or ‘middle’ household
everywhere but Sweden and at the median in Germany (Panel C) a result of low
homeownership in these nations. Financial assets are therefore more prevalent in Sweden
and Germany than in other nations. Debt, mainly housing debt, is much larger for the
average older American or Canadian household than in other nations, especially Italy and
Finland where we expect that most elders’ homes are owned outright.

15
Home Ownership and Value
We take a closer look at home (principal residence) values in Table 4, for elders
and for all households (Panel A), and among the income poor (Panel B). As we expected,
owning homes is important and owning them debt free is highly prevalent for elders in all
of these nations. Interestingly, amongst owners, United States elders are least likely to
own their equity outright. While the United States elders are most likely to own a home,
equity in these homes is not of the highest value, whether we adjust for the numbers
living in each household (equivalized values) or not. While fewer German or British
elderly households own their own homes, they are of higher equity values than in the
United States. The values of homes in Sweden and Finland are much less (and the homes
are also somewhat smaller, we expect). Homeownership patterns are similar among
single elderly, and while home values are less, outright ownership is slightly more
prevalent for this group. These patterns are similar to those found elsewhere in the
literature (e.g., see Chiuri and Japelli 2006 for the same countries using the LIS data; and
Fisher, et al. 2006 for the United States alone).
Home ownership amongst poor elders (those with incomes less than half the
median in Panel B) is usually lower, but still substantial. Outright ownership is high,
especially in nations which provide mortgage relief to low income elder owners (Finland,
Italy). Home equity for poor owners is lower than for the entire elder population, but is
still an asset of considerable value, especially in the United Kingdom and Germany,
whether we use equivalized or unequivalized values.
Financial Assets
Patterns of financial wealth holdings are also examined in Table 5, with median
values given for both those with positive wealth holdings and for all elders. Values for all
households (aged or not) are also given and all values are equivalized. Even among those
with positive holdings only, median values are modest among elders. Elders in the US,
Germany, and Sweden who hold financial assets hold just over $20,000 in financial
wealth at the median. In all other nations, holdings are less — under $10,000 in Canada,
Finland, and Italy. Moreover these holdings are not very different for single elders than

16
for all elders. Counting the zeros by averaging over all units reduces median values even
further, especially in countries with fewer positive wealth holders.17
Among the elderly poor, liquid asset holding is both relatively and absolutely
small in all nations, except Sweden and Germany.18 In all the rest of these countries, low
income or poor households — elderly, single elderly, and all households, have little in the
way of financial assets. It is surprising to find high levels of liquid assets among the elder
households, poor and non-poor, in the most generous social retirement spending nation,
Sweden. It appears that while home ownership may be important to low income elders in
most nations, liquid assets are not very important or plentiful across nations whose social
security and income maintenance systems differ substantially. Some of these differences
may be traced to their treatment of liquid assets for targeted benefit eligibility or other
“means tested” programs, including long-term care for the frail aged.
Income and Asset Poverty
Both incomes and assets provide consumption support to low-income elders.
High-income poverty needs to be considered in light of other sources of consumption
support from assets, especially from liquid assets. The 50 percent of median poverty line
is high by United States standards, as the United States poverty line is now down to about
30 percent of median income (Smeeding 2006, Appendix Table 1); and so the 50 percent
of median line provides higher income poverty rates than do United States standards. Of
course, both the 30 and 50 percent lines are below the EU’s 60 percent of median poverty
measure.
United States leads in the elder income poverty, with a rate of 23 percent (Figure
1, sum of Income Poor and Income and Asset Poor), compared to income poverty rates of
11 percent or below for all but United Kingdom elders. The LWS income poverty rates
are consistent with earlier LIS papers using the LIS income data (Smeeding and
Sandström 2005; Niskanen 2006). Asset poverty (equivalized liquid assets less than 25
17 There is some concern about response notes for financial assets in these surveys, but all datasets are adjusted for item non reporting using imputation 18 The German data is collected only for those who have liquid assets in excess of $2,500 Euros. Thus the true median value for all wealth holders is probably not zero and the per cent holding financial assets is higher.

17
percent of equivalized median income) is lowest in Sweden, followed by the United
States, and is 40 percent or more in all other nations.
Combining these concepts, we find the worst off, those both income and asset
poor, are below 10 percent in all nations, except for the United States where the income
and asset poverty rate is a little over 15 percent. Accounting for liquid assets reduces
poverty by the most in the United States (from 23.2 to 15.4 percent), but also in the
United Kingdom and Sweden. It has little effect in other nations. Clearly liquid asset
holdings in the United States at the median (Table 5) are greater than in the EU where
greater reliance on the public sector for income support and security (Table 3) makes
owning financial assets less important for economic security in old age. This is not to
deny the political risk of lower future social retirement benefits in nations such as
Germany and Italy (Burtless 2004; Shoven and Slavov 2006). But still in the end,
counting both income and assets, the United States has the highest fraction of at risk older
persons counting both income and assets.
Among the income and asset poor, homeownership among the elderly is nearly as
prevalent (Table 6) as among the income poor only. The single elderly do not fare as
well, particularly in Canada and Germany, where less than 30 percent of the income and
asset poor own a home. Median home values for the income and asset poor elderly are
smaller than for all households, whereas the median income poor elderly had a higher
home value than the median household. Except for the US and Canada almost all of the
elderly own their homes outright.
In future analyses one may want to impute a rental value for owned homes to
measure the benefit to low income elder of living “rent free” .However, do not forget that
there are also real costs to owning which have to be reckoned with: property taxes,
utilities, and upkeep. If United States low income elders, who own their own homes
outright, end up spending 25 percent or more on these other housing costs, these need to
also be kept in mind when making such estimates (Apgar and Di, 2005). For a very good
beginning attempt at valuing imputed rent in a European context, see Frick, et. al. (2006).
18
Net Worth and Education
We now take a quick look at asset holdings by educational status, as a proxy for
permanent income and long-term health status. We employ a simple cross-national
convention (see methodological note) to break elder households into three groups
according to the highest level of education achieved by an elder head or spouse. In the
United States this roughly equates to less than high school (low education); high school
grad and some secondary education but no secondary degree (middle); and at least one
tertiary education degree (high). We examine both the value of assets (Figures 2) and
home ownership and value (Figure 3).
Except for Italy, net worth rises with level education. The slopes are steepest in
the United States and the United Kingdom, and the variance in asset values increases
with education. Virtually, all lowly educated elders in these countries have a median
value of net worth of about $50,000, but higher educated elders have median values that
run from $240,000 in the United States down to $100,000 in Sweden. Italy, where home
values are the major source of net worth, shows median net worth values of $195,000 to
210,000 for higher and medium education, suggesting there is not much wealth return to
higher education amongst these elder cohorts. The patterns of financial assets are
similarly sloped, but at a much lower level and Italy is no longer an outlier. In all nations,
the median lowly educated elder household has about $10,000 or less in financial assets;
the median medium educated elder household has $22,000 or less. Only at higher
education levels do we see a big spread and there the United States has a median value of
almost $70,000 while the next highest nation is at $32,000. One question for future
research is why the Swedish pattern looks so different from the others, both because of
the higher level for lowly educated and the relatively modest accumulation for higher
educated elder adults.
Homeownership is the most universal asset as we have seen, and the gradient in
the education relationship is fairly flat at the top of Figure 3a. Indeed only Germany
stands out as a nation that has an entirely different level of ownership at all education
levels for this cohort of elders. The steepest slope is in the United Kingdom where only
61 percent of those in lowly educated households are living in an owned home, compared
to 89 percent of those in highly educated households, and this slope is likely the
19
consequence of low cost public or ‘council housing’ for low-income households in the
United Kingdom. Interestingly, the lines are reversed at the bottom of the Figure, with
Germany having the highest value owned housing at each education level, followed by
the United Kingdom and Italy.19 The United States which has the steepest slope in home
values is in the middle of the pack when it comes to values for owned homes amongst
these elder cohorts.
Income and Net Worth Inequality
The literature on economic well-being suggests that the relationship between
income and wealth is complicated in the United States (Juster, Smith and Stafford 1999;
Venti and Wise 2000). Income and wealth inequality to say the least do not go hand-in-
hand and often high income and low wealth, or vice versa, is evident. We now look at
this phenomenon from a cross-national perspective. Economic theory and aggregate
savings evidence suggest that median wealth rises when calculated within each adjusted
disposable income quartile, and indeed this is the case (Figure 4). The United Kingdom
and United States have steep income wealth profiles; Canada and Sweden have much
flatter profiles, and the other nations are found in the middle. Indeed, high income Brits
have higher net worth on average than do high income Americans, but both nations well
to do hold twice as much as in Canada, Finland, or Sweden.
These calculations still ignore the variance within each income or wealth quartile.
While we could plot the variance in wealth by income quartile in many ways, we have
decided to examine the income position of elderly households within three wealth groups:
the top and bottom quartiles separately, and middle two wealth quartiles together (Figure
5). While 67-82 percent of high wealth households are found in the top income quartile,
11-28 percent of high-wealth holders are also found in the bottom income quartile
(Figure 5a). And while few low-wealth elders (6 percent or less) are found in the top
income quartile, only between 25 and 38 percent of low-wealth quartile households,
excluding Sweden, are also found in the lowest income quartile (Figure 5b). Moreover, a
higher fraction of middle two quartile wealth holders are found in the lowest income
19 Again we speculate that the effect of World War II on the housing stock in Germany has much to do with the patterns we observe amongst this cohort of elders.

20
quartile than in the highest income quartile in every nation except Germany (Figure 5c).
Thus while high-income, high-wealth households exhibit the highest level of “state
dependence,” the correlation between income and wealth status is much less clear for
other income and wealth quartiles.
V. Discussion
This paper has provided the first, albeit brief and partial, ‘first glance’ at the joint
asset and income position of older Americans in cross-national perspective. The data and
definitions that we use need to be compared to other sources of similar data, such as those
derived form the SHARE, HRS and other cohort data bases, as soon as they are ready for
comparison. Still, in contrast to the well-known studies of income poverty and
distribution, the LWS database allows us to also investigate asset holdings and asset
poverty for elders (and other groups) in ten countries. Here we have selected seven
countries for our initial foray. While much more pointed, directed, and well-hypothesized
research papers will follow, we have attempted here to separate “signal” from “noise” as
best we can and to find interesting patterns for future exploration in cross-national
research
The four legs on the American income stool are shaped quite differently from
those in other countries. United States elderly households on average rely much less on
public social retirement pensions and much more on earnings and asset accumulations
than do their counterparts elsewhere. While they are on average wealthier than their
counterparts in other rich countries, and have less liquid asset poverty, U.S. elders also
have the highest variance in these financial assets (-or ‘beware of the mean’- and median
to quote Quinn 1987). Thus low-income American elder households are also wealth
disadvantaged with respect to liquid assets, though a substantial fraction own their own
homes, again with varying values.
Wealth is correlated with education, but home ownership is more or less universal
among most elder households in all nations, save Germany. The value of these homes is
an issue that deserves much more attention as homes both provide a growing store of
value as an investment, and a flow of below-market-cost housing services (Fisher, et. al.,
21
2006). While issues related to the maintenance cost of owned housing( property taxes,
utilities and other non-mortgage cost) and fungibility of housing wealth in comparative
context need to be resolved, owned homes are probably the most important sources of
wealth for most elder households in all the nations we study.
There is still much to be investigated here. A fuller picture of the nexus between
assets and incomes is needed. Older women can be investigated separately (e.g., see
Gornick et. al. 2006), and also the wealth gap between those who are members of
ethnic/racial minorities and those who are not could be explored. We also want to take
account of some of the elderly’s major needs, especially their financial needs related to
healthcare, where the United States places a very large absolute, relative, and
comparative burden on its elders in terms of out-of-pocket payments, self-insurance, and
co-payments, for both acute and long-term health care (Smeeding 2003). Still, the picture
that we have sketched here is highly relevant to policy issues.
Clearly, relative reliance on private versus public income sources varies across
these countries. While private sources — earnings and assets — are more prevalent in the
United States, especially among “middle income” elder households, and while this self-
reliance may be commendable, it is also not universal. In so far as we can see, the private
legs of the stool (earnings, private pensions, income from assets) are much more likely to
vary both across and within countries than are the public sources.
While we recognize the risks associated with defined-contribution (unfunded)
social retirement programs (Shoven and Slavov 2006), this “public leg” is so far more
stable, more reliable, and more inflation-, injury-, and “bad labor market”- protected, than
are the private legs of the stool. And in cases where social retirement pensions are being
scaled back, the cuts are very progressive, mainly affecting the well to do elders and not
this remaining on the lowest tier plans (Keese 2006). Indeed the country with the
strongest public leg, Sweden, seems to perform better in fighting poverty and in shoring
up liquid assets than does the United States.20
Many current old-age pension reform proposals, both in the United States and in
other countries, could be better designed to meet the needs of the most vulnerable elders, 20 One item that has clearly emerged is the difference between Sweden and other nations in terms of liquid assets and their relatively flat distribution and more universal spread in that country compared to the others.

22
especially older women living alone and those who are separated or divorced (Liebman,
McGuineas and Samwick 2005; Favreault, Sammartino, and Steuerle 2002; Favreault and
Steuerle 2006: Smeeding 1999). Indeed, the economic vulnerability of low-income
elderly, especially older women might be increased if the U.S. moves toward partial
privatization, because such a system would likely be less redistributive toward retirees
with low lifetime earnings compared to the current system (Engelhardt and Gruber 2004).
On the other hand a more universal “add on” defined contribution public pension system
might leave a very high fraction of United States elders looking more like their Swedish
counterparts in terms of widespread and substantial liquid asset holding at some future
point.
Some policy implications shine through even after first efforts with new cross-
sectional data. Governments in rich countries ought to provide a safety net for the elderly,
with adequate and well-maintained minimum social security benefits (as is done in
Canada) to ameliorate income and asset vulnerability. For instance, loosening asset limits
and providing more adequate benefits in the SSI program would go a long ways toward
bringing economic security and a steady reliable flow of cash income to elderly near the
bottom of the income and wealth distributions in the United States (Clark et. al. 2004;
Smeeding 2003).
Finally, promoting greater levels of home ownership can provide additional real
economic support in old age. As home values increase among the old, we need to identify
better and more reliable methods, such as reverse-annuity mortgages or borrowing
against the value of their own homes, so that cash-poor but housing-rich older Americans
can access these assets to meet their everyday needs. These arrangements are not going to
be enough to help the income and asset poor in the United States today, simply because
their home equity is too low (Table 6). But they may well help the next generation of
older Americans cope with longer lives and low savings. While such financial devices are
beginning to make headway in the United States (see Copeland, 2006), they are still not
widespread. And they have made hardly any progress in the other rich nations studied
here.

23
References Apgar, William C., and Zhu Xiao Di. 2005. “Housing Wealth and Retirement Savings:
Enhancing Financial Wealth for Older Americans.” W05-8. Joint Center for
Housing Studies, Harvard University.
Atkinson, Anthony B., Bea Cantillon, Eric Marlier, and Brian Nolan. 2002. Social
Indicators: The EU and Social Inclusion. Oxford: Oxford University Press.
Banks, James, Richard Blundell, Zoe Oldfield, and James P. Smith. 2005. “House Price
Volatility and Housing Ownership Over the Life Cycle.” Discussion Paper 04-09.
University College London February 2005.
Banks, James, Richard Blundell, and James P. Smith. 2003. “Understanding Differences
in Household Financial Wealth between the United States and Great Britain.”
Journal of Human Resources 38 (2): 241-279.
Barrell, Ray, and E Philip Davis. 2004. “Consumption, Financial and Real Wealth in the
G-5.” Discussion Paper number 232. National Institute of Economic and Social
Research. May, 2004.
Bradshaw, Jonathan. 2003. “Using Indicators at the National Level: Child Poverty in the
United Kingdom.” Unpublished manuscript. Social Policy Research Unit.
University of York, Heslington, York, United Kingdom. November.
Brown, Robert L., and Steven G. Prus. 2006. “Income Inequality over the Later-life
Course: A Comparative Analysis of Seven OECD Countries.” Luxembourg
Income Study Working Paper No. 435.
Burkhauser, Richard V., Philip Giles, Dean R. Lillard, and Johannes Schwarze. 2005.
“After Death Do Us Part: An Analysis of the Economic Well being of Widows in
Four Countries.” Journal of Gerontology 60B (5) (September): S246-S328.
Burtless, Gary. 2004. “The Age Profile of Income and the Burden of Unfunded Transfers
in Four Countries: Evidence from the Luxembourg Income Study.” LIS Working
Paper 394.
Caner, Asena, and Edward N. Wolff. 2004. “Asset Poverty in the United States, 1984-99:
Evidence from the Panel Study of Income Dynamics.” Review of Income and
Wealth 50 (4) (December): 493-518.

24
Carroll, Christopher. 2004. “Housing Wealth and Consumption Expenditure.” Presented
at the Academic Consultants' Meeting of the Board of Governors of the Federal
Reserve System.
Case, Karl E, John M. Quigley, and Robert J Shiller. 2001. “Comparing Wealth Effects:
The Stock Market versus the Housing Market.” 8606. National Bureau of
Economic Research.
Catte, Pietro, Nathalie Girouard, Robert Price, and Christopher Andre. 2004. “Housing
Markets, Wealth and the Business Cycle.” 394. OECD Working Paper.
December.
Chen, Kaiji. 2006. “The Welfare Implications of Social Security for Homeowners.”
Univerisity of Oslo. March.
Chiuri, Maria Concetta, and Tullio Jappelli. 2003. “Financial Market Imperfections and
Howm Ownership: A Comparative Study.” European Economic Review 47: 857-
875.
Churi, Maria Concetta, and Tullio Jappelli. 2006. “Do the Elderly Reduce Housing
Equity? An International Comparison.” Centre for Studies in Economics and
Finance (CSEF) Working Paper No. 158. Salerno, Italy: Department of
Economics and Statistics, University of Salarno. May.
http://www.dise.unisa.it/WP/wp158.pdf.
Clark, Robert L., Richard V. Burkhauser, Marilyn Moon, Joseph F. Quinn, and Timothy
M. Smeeding. 2004. The Economics of an Aging Society. Oxford, UK: Blackwell
Publishing.
Claus, Iris, and Grant Schobie. 2001. “Household Net Wealth: An International
Comparison.” Working Paper 2001/19. The Treasury of New Zealand,
Wellington.
Copeland, Craig. 2006. “Debt of the Elderly and Near Elderly, 1992-2004.” Employee
Benefit Research Institute 27 (9) (September)
Crossley, Thomas, and Yuri Ostrovsky. 2003. “A Synthetic Cohort Analysis of Canadian
Housing Careers.” Social and Economic Dimensions of an Aging Population
Research Paper, 107. McMaster University.

25
Dang, Thai-Thanh, Herwig Immervoll, Daniela Mantovani, and Holly Sutherland. 2006.
“An Age Perspective on Economic Well-being and Social Protection in Nine
OECD Countries.” OECD Social, Employment and Migration Working Paper, 34.
Paris. June.
Doling, John, Marja Elsinga, Peter Boelhouwer, and Janet Ford. 2004. “Playing Snakes
and Ladders: The Gains and Losses for Homeowners.” Presented at ENHR
Conference, Cambridge, England.
Doring, Diether, Richard Hauser, G. Rolf, and Rank Tibitanzl. 1994. “Old Age Security
of Women in the Twelve EC Countries.” Journal of European Social Policy 4 (1):
1-18.
Dvornal, Nikola, and Marion Kohler. 2003. “Housing, Wealth, Stock Market Wealth and
Consumption: A Panel Analysis for Australia.” Economic Research Department
Discussion Paper 2003-07.
Engelhardt, Gary V., Jonathan Gruber, and Cynthia D. Perry. 2005. “Social Security and
Elderly Living Arrangements: Evidence from the Social Security Notch.” Journal
of Human Resources 40 (2) (Spring): 354-372.
Engelhardt, Gary V., and Jonathan Gruber. 2004. “Social Security and the Evolution of
Elderly Poverty.” NBER Working Paper No. w10466. Cambridge, MA: National
Bureau of Economic Research. May.
Ermisch, John, and Stephen Jenkins. 1999. “Retirement and Housing Adjustments in
Later Life: Evidence for the British Households Panel Study Survey.” Labour
Economics 6: 311-333.
Favreault, Melissa, and C. Eugene Steuerle. 2006. “New Approach to Social Security
Auxiliary Benefits.” Presented at RRC Conferene, Washington, DC.
Favreault, Melissa, Frank Sammartino, and C. Eugene Steuerle. 2002. “Social Security
and the Family: Addressing Unmet Needs in an Underfunded System.”
Washington, DC: Urban Institute Press.
Fisher, Jonathan, David Johnson, Joseph Marchand, Timothy M. Smeeding, and Barbara
Boyle Torrey. 2006. “No Place Like Home: Older Adults, Housing, and Life-
Cycle.” Journal of Gerontology: Social Sciences.
26
Frick, Joachim, Jan Goebel, and Markus M. Grabka. 2006. “Assessing the Distributional
Impact of Imputed Rent and Non Cash Employee Income in Micro-data: Case
Study Based on EU-SSILC(2004) and SOEP(2002).” Presented at Conference on
Income and Living Conditions, Helsinki, Finland.
Garfinkel, Irwin, Lee Rainwater, and Timothy M. Smeeding. 2006. “A Reexamination of
Welfare State and Inequality in Rich Nations: How In-Kind Transfers and Indirect
Taxes Change the Story.” Journal of Policy Analysis and Management 25 (4)
Gornick, Janet, Teresa Munzi, Eva Sierminska, and Timothy M. Smeeding. 2006. “Older
Women's Income Packages and Wealth Portfolios: The Five Legged Stool in
Cross-National Perspectives.” Luxembourg Income Study. October.
Haveman, Robert, Karen Holden, Barbara Wolfe, and Andrei Romanov. 2006. “The
Sufficiency of Retirement Sasvings: A Comparison of Two Cohorts of Retired
Workers at the Time of Retirement.” July.
Haveman, Robert, and Edward Wolff. 2004. “The Concept and Measurement of Asset
Poverty: Levels, Trends, and Composition for the US: 1983-2001.” Journal of
Economic Inequality 2 (2) (August): 145-169.
Hurd, Michael, and Susann Rohwedder. 2006. “Some Answers to the Consumption-
Retirement Puzzle.” 342. RAND. January.
Hurst, Eric, and Frank Stafford. 2004. “Home is Where the Equity Is: Mortgage
Refinancing and Household Consumption.” The Journal of Money, Credit and
Banking 36: 985-1014.
Hutton, Sandra, and Peter Whiteford. 1992. “Women and Social Security in Retirement:
A Comparative Analysis.” Luxembourg Income Study Working Paper No. 82.
Center for Policy Research, Syracuse University.
Johnson, David, Timothy M. Smeeding, and Barbara Boyle Torrey. 2005. “United States
Inequality through the Prisms of Income and Consumption.” Monthly Labor
Review 128 (4) (April): 11-24.
Juster, F. Thomas, James P. Smith, and Frank Stafford. 1999. “The Measurement and
Structure of Household Wealth.” Labour Economics 6 (2) (June): 253-275.

27
Kapteyn, Arie, and Constantijn Panis. 2003. “The Size and Composition of Wealth
Holdings in the United States, Italy, and the Netherlands.” NBER Working Paper
Series, 10182. Cambridge, MA. December.
Keese, Mark. 2006. “Live Longer, Work Longer.” OECD, Paris: OECD.
Kenworthy, Lane. 2004. “Egalitarian Capitalism.” Russell Sage Foundation, New York.
Martins, Nuno, and Ernesto Villanueva. 2006. “Does Limited Access to Mortgage Debt
Explain Why Young Adults Live with Their Parents?” Banco de Espana Research
Paper No. WP-0628.
Mitchell, Olivia S., and John Piggott. 2004. “Unlocking Housing Equity in Japan.”
NBER, W10340. Cambridge, MA: NBER. March.
Niskanen, Emilia. 2006. “The Luxembourg Wealth Study: Technical Report on LWS
Income Variables.” LIS.Luxembourg. April.
Ortalo-Magne, Francois, and Sven Rady. 2005. “Housing Market Dynamics: On the
Contribution of Income Shocks and Credit Constraints.”University of Wisconsin.
Quinn, Joseph. 1987. “The Economic Status of the Elderly: Beware the Mean.” Review of
Income and Wealth 33 (1) (March): 63-82.
Shaw, Lois, and Sunhwa Lee. 2005. “Gender and Aging: Cross-National Contrasts:
Growing Old in the US: Gender and Income Adequacy.” Feminist Economics 11
(2): 174-186.
Shoven, John, and Sita Slavov. 2006. “Political Risks Versus Market Risk in Social
Security.” NBER, 02135. Cambridge, MA. March.
Siegenthaler, Jurg K. 1996. “Poverty among Single Elderly Women under Different
Systems of Old-Age Security: A Comparative Review.” Social Security Bulletin
59 (3): 31-44.
Sierminska, Eva, A. Brandolini, and Timothy M. Smeeding. 2006. “Comparing Wealth
Distribution Across Rich Countries: First Results for the Luxembourg Wealth
Study (LWS).” Luxembourg Wealth Study, no. 1.
Sierminska, Eva, A. Brandolini, and Timothy M. Smeeding. 2006. “The Luxembourg
Wealth Study - A Cross-Country Database for Household Wealth Research.”
Journal of Economic Inequality 4 (3): 323-332.
28
Sierminska, Eva, and Yelena Takhtamanova. 2006. “Wealth Effects out of Financial and
Housing Wealth: Cross-Country and Cross-Demographic Group Comparisons.”
Presented at IARIW General Conference in Joensuu, Finland.
Sierminska, Eva, and Timothy M. Smeeding. 2005. “Measurement Issues: Equivalence
Scales, Accounting Framework and Reference Unit.” Luxembourg Income Study.
Luxembourg.
Sierminska, Eva, and Thesia I. Garner. 2002. “A Comparison of Income, Expenditures,
and Home Market Value Distributions Using Luxembourg Income Study Data
from the 1990s.” LIS Working Paper No. 338. Syracuse, NY: Center for Policy
Research, Syracuse University. December.
http://www.lisproject.org/publications/liswps/338.pdf.
Smeeding, Timothy M. 2006. “Poor People in a Rich Nation: The United States in
Comparative Perspective.” Journal of Economic Perspecitives 20 (1): 69-90.
Smeeding, Timothy M., and Susanna Sandström. 2005. “Poverty and Income
Maintenance in Old Age: A Cross-National View of Low-Income Older Women.”
Feminist Economics 11 (2) (July): 163-174.
Smeeding, Timothy M. 2003. “Income Maintenance in Old Age: Current Status and
Future Prospects for Rich Countries.” Genus LIX (1) (April-June): 51-83.
Smeeding, Timothy M., Lee Rainwater, and Gary Burtless. 2001. “United States Poverty
in a Cross-National Context.” In Understanding Poverty, edited by Sheldon H.
Danziger and Robert H. Haveman. New York and Cambridge, MA: Russell Sage
Foundation and Harvard University Press, 162-189.
Smeeding, Timothy M. 1999. “Social Security Reform: Improving Benefit Adequacy and
Economic Security for Women.” Center for Policy Research, Policy Brief No. 16.
Syracuse, NY: Syracuse University.
http://www-cpr.maxwell.syr.edu/pbriefs/pb16.pdf.
Smeeding, Timothy M., and Peter Saunders. 1999. “How Do the Elderly in Taiwan Fare
Cross-Nationally? Evidence from the Luxembourg Income Study (LIS) Project.”
In Emerging Social Economic Welfare Programs for Aging in Taiwan in a World
Context, edited by Chaonan Chen, Albert I. Hermalin, Sheng-Cheng Hu, and

29
James P. Smith. Taipei, Taiwan: Institute of Economics, Academia Sinica, 205-
237.
Smeeding, Timothy M., Barbara B.Torrey, and Lee Rainwater. 1993. “Going to
Extremes: An International Perspective on the Economic Status of the U.S.
Aged.” Luxembourg Income Study Working Paper No. 87. Syracuse, NY:
Syracuse University. May.
Stapf-Fine, Heinz. 1994. “Old Age Poverty in Selected Countries of the European
Community - Are Women Disproportionably Affected?” Luxembourg Income
Study Working Paper No. 105. Center for Policy Research, Syracuse University.
Sunden, Annika. 2006. “The Swedish Experience with Pension Reform.” Oxford Review
of Economic Policy 22 (1): 133-148.
Tatsiramos, Konstantinos. 2004. “Residential Mobility and the Housing Adjustment of
The Elderly: Evidence from the ECHP for 6 European Countries.” European
University Institute. Florence.
Venti, Steven F., and David A. Wise. 2001. “Aging and Housing Equity: Another Look.”
NBER Working Paper No. 8608. Cambridge, MA: National Bureau of Economic
Research. November. http://papers.nber.org/papers/W8608.
Venti, Steven F., and David A. Wise. 2000. “Choice Chance and Wealth Dispersion at
Retirement.” NBER Working Paper No. W7521. Cambridge, MA: National
Bureau of Economic Research. February.

30
Methodological notes Sample: All observations with missing or zero DPI or missing NW1 were dropped from the sample. Household types (see Table A-1):
1. “single” consist of one-person households comprised of a person 65 or over 2. “elderly couples” consist of two-person households comprised by a couple with (at least)
one person aged 65 or over (the other person - could be younger than 65) 3. “other households with an elderly person as head/spouse” consist of households of two-
persons headed by a person aged 65 or over without partner, or by households of more than two persons where the head or the spouse is aged 65 or more
4. “all other households” consist of households of any size where neither the head nor the spouse is aged 65 or more (note that there could be people aged 65 or more in the household, if they are not head or spouse)
“All households with elderly persons as head/spouse” including household types 1, 2 and 3 above, are examined in this paper. We also separately examine household type 1 above in some tables Definition of disposable income: disposable income is the LIS-DPI variable of the LWS datasets (i.e. cash and noncash income next or direct taxes, without imputed rents, one-time lump sums and capital gains and losses). In all cases incomes are adjusted by E=0.5 where ADI=unadjusted income (I) divided by household size (S) to the power E .Incomes were bottom coded at 1% of the mean equivalized DPI and top coded at ten times the median unequivalized DPI.
Definition of net worth income: net worth is the NW1 variable of the LWS datasets (see www.lisproject.org/lws.html ). It includes financial assets (deposit accounts, stocks, bonds and mutual funds) and non-financial assets (principal residence and investment real estate). Financial assets exclude life insurance and unrealized pension assets, and non-financial assets exclude business assets, business debt, vehicles, durables, and/or collectibles. In all cases expect where noted, wealth variables are adjusted by the same E=0.5 equivalence scale where ADI=unadjusted wealth (I) divided by household size (S) to the power E. Wealth variables are NOT bottom coded and top coded.
Real dollar values: for income and wealth are expressed in PPP terms using the 2002 OECD individual consumption PPPs (amounts referring to years prior to 2002 were inflated using OECD CPI indices within each country ) Education Coding:
a. LOW includes no education, pre-primary, primary, lower secondary, compulsory and initial vocational education
b. MEDIUM includes upper secondary general education, basic vocational education, post-secondary education
c. HIGH includes specialized vocational education, university/college education and (post)-doctorate and equivalent degrees
The grouping follows the LIS Standardized Education Recoding method, which follows ISCED.
United States United Household composition (SCF ) Canada Finland Germany Italy Sweden KingdomHouseholds with no Elderly 84 81 82 79 71 81 78
All Households with Elderly 16 19 18 21 29 19 22of which:
Single Age 65+ only (examined here) 4 4 6 7 5 8Couple head or spouse 65+ only 8 7 7 10 9 10Single with others: head 65+ 1 2 1 1 3 0Couple 65+ Head or Spouse with others 1 1 1 2 7 1
Minus Other Units with Persons 65+ not Head or Spouse (2) (5) (3) (1) (5) (0)
Household Units with Head or Spouse 65+ (examined here) 14 14 15 20 24 19 21
Source: Authors' calculations from the Luxembourg Wealth Study.
7932
(1)
Table A-1. Household Composition(percentage of households)

30
A. Income Well-Being Across Countries
Mean Equivalized DPI as a Percentage of Mean DPI of
All Households Mean Equivalized DPI in 2002
AllHouseholds All Households
with an Single with an Elderly Elderly Person Elderly Person as Single Elderly All
Country (yr) as Head/Spouse Persons Head/Spouse Persons HouseholdsUnited States (SCF) (00) 96 74 28,028 (140) 21,521 (140) 29,193 (131)Canada (98) 95 72 22,527 (113) 17,035 (111) 23,676 (107)Finland (98) 87 61 16,561 (83) 11,536 (75) 18,959 (85)Germany (01) 91 77 19,502 (98) 16,388 (107) 21,385 (96)Italy (01) 92 68 16,963 (85) 12,452 (81) 18,413 (83)Sweden (02) 83 63 16,950 (85) 12,942 (84) 20,406 (92)United Kingdom (00) 82 67 19,210 (96) 15,640 (102) 23,507 (106)
Simple Average 90 69 19,963 (100) 15,359 (100) 22,220 (100)
B. Net Worth Well-Being Across Countries
Mean Equivalized DPI as a Percentage of Mean DPI of
All Households Mean Equivalized DPI in 2002
All Households All Households with an Elderly Single with an Elderly
Person as Elderly Person as Single Elderly Country (yr) Head/Spouse Persons Head/Spouse Persons All HouseholdsUnited States (SCF) (01) 234 153 313,934 (219) 205,916 (190) 134,227 (158)Canada (99) 173 182 101,300 (71) 106,394 (98) 58,548 (69)Finland (98) 157 126 84,642 (59) 67,918 (63) 53,816 (63)Germany (02) 160 107 140,536 (98) 94,537 (87) 88,097 (104)Italy (02) 116 93 138,886 (97) 111,477 (103) 119,719 (141)Sweden (02) 179 129 79,289 (55) 57,211 (53) 44,372 (52)United Kingdom (00) 149 119 144,634 (101) 114,812 (106) 96,811 (114)
Simple Average 167 130 143,317 (100) 108,324 (100) 85,084 (100)Source: Authors' calculations from the Luxembourg Wealth Study.
Notes:1 DPI is the sum of total revenues from earnings, capital income, private transfers, public social insurance and public social assistance -- net of taxes and social security contributions. Incomes were bottom-coded at 1% of the mean equivalized DPI and top-coded at 10 times the median unequivalized. 2 Net worth consists of financial assets and non-financial assets -- net of total debt. No bottom- or top-coding were applied. 3 Both income and wealth are equivalized; adjusted = unadjusted / square root of household size.4 All observations with missing or zero disposable income or missing net worth were dropped from the sample.5 Assets can be valued at time of interview of end of year.
Table A-2. Mean Income and Net Worth in Households Containing Elderly Persons

31
A. Asset Participation
United United Wealth components States Canada Finland Germany Italy Sweden Kingdom
Financial assets 95 93 91 62 2 75 86 82
Deposit accounts 95 93 89 n.a. 75 74 77 Stocks 23 10 33 n.a. 7 41 n.a. Mutual funds 21 14 3 n.a. 9 59 n.a. Bonds 17 17 4 n.a. 16 28 n.a.
Non-financial assets 84 76 81 55 78 64 70
5 Principal residence 83 74 77 52 77 58 69 Investment real estate 24 20 33 15 22 18 6
Total debt 49 32 14 13 9 39 21of which:
4 Home secured debt 27 15 5 10 3 n.a. 8
B. Portfolio Composition6
United United Wealth components States Canada Finland Germany Italy Sweden Kingdom
Financial assets 44 33 17 14 2 17 41 26
Deposit accounts 12 17 11 n.a. 10 17 13 Stocks 18 8 5 n.a. 1 8 n.a. Mutual funds 9 6 0 n.a. 3 13 n.a. Bonds 4 3 1 n.a. 3 3 n.a.
Non-financial assets 56 67 83 86 83 59 74
5 Principal residence 35 55 59 65 65 57 69 Investment real estate 21 12 23 20 18 12 5
Total assets 100 100 100 100 100 100 100
Total debt 6 5 1 6 1 11of which:
4 Home secured debt 5 4 1 4 0 n.a. 1
Total net worth 94 95 99 94 99 89 98Source: Authors' calculations from the Luxembourg Wealth Study, Beta-version (June 29th, 2006).Notes: 1 Elderly are those where head or spouse are 65+ years of age. 2 Germany records liquid assets and non-housing debt only when they exceed 2,500 per year. There is no further breakdown by type.3 Only savings or deposit accounts separately identified.4 In Sweden, home secured debt (is not separated from other loans).5 The self-assessed current value of the home is reported except for Sweden, where the tax value is reported inflated by a regional constant.6 Portfolio composition is based on unequivalized values of wealth.
2
Table 1. Asset participation and Portfolio Composition in Households with Elderly Persons' as Head or Spouse1
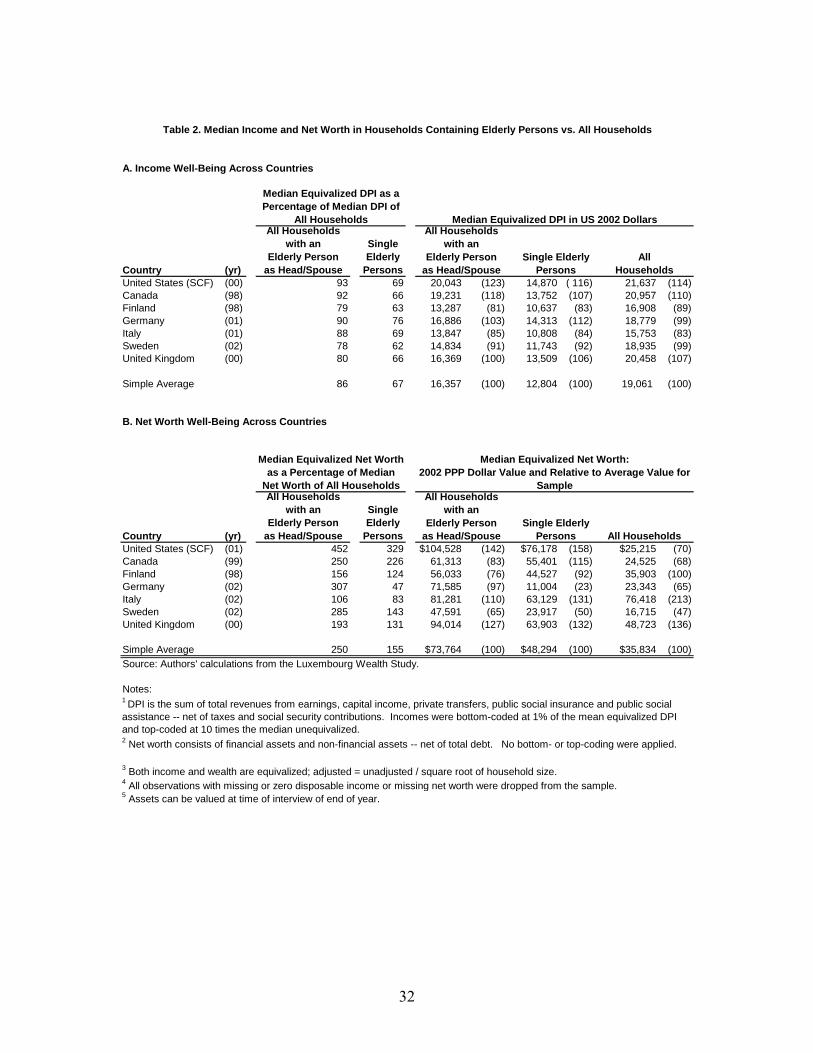
32
A. Income Well-Being Across Countries
Median Equivalized DPI as a Percentage of Median DPI of
All HouseholdsAll Households
Median Equivalized DPI in US 2002 DollarsAll Households
with an Single with anElderly Person Elderly Elderly Person Single Elderly All
Country (yr) as Head/Spouse PersonsUnited States (SCF) (00) 93 69
as Head/Spouse Persons Households20,043 (123) 14,870 ( 116) 21,637 (114)
Canada (98) 92 66 19,231 (118) 13,752 (107) 20,957 (110)Finland (98) 79 63 13,287 (81) 10,637 (83) 16,908 (89)Germany (01) 90 76 16,886 (103) 14,313 (112) 18,779 (99)Italy (01) 88 69 13,847 (85) 10,808 (84) 15,753 (83)Sweden (02) 78 62 14,834 (91) 11,743 (92) 18,935 (99)United Kingdom (00) 80 66 16,369 (100) 13,509 (106) 20,458 (107)
Simple Average 86 67 16,357 (100) 12,804 (100) 19,061 (100)
B. Net Worth Well-Being Across Countries
Median Equivalized Net Worth Median Equivalized Net Worth:as a Percentage of Median 2002 PPP Dollar Value and Relative to Average Value for
Net Worth of All HouseholdsAll Households
SampleAll Households
with an Single with anElderly Person Elderly Elderly Person Single Elderly
Country (yr) as Head/Spouse PersonsUnited States (SCF) (01) 452 329
as Head/Spouse Persons All Households$104,528 (142) $76,178 (158) $25,215 (70)
Canada (99) 250 226 61,313 (83) 55,401 (115) 24,525 (68)Finland (98) 156 124 56,033 (76) 44,527 (92) 35,903 (100)Germany (02) 307 47 71,585 (97) 11,004 (23) 23,343 (65)Italy (02) 106 83 81,281 (110) 63,129 (131) 76,418 (213)Sweden (02) 285 143 47,591 (65) 23,917 (50) 16,715 (47)United Kingdom (00) 193 131 94,014 (127) 63,903 (132) 48,723 (136)
Simple Average 250 155 $73,764 (100) $48,294 (100) $35,834 (100)Source: Authors' calculations from the Luxembourg Wealth Study.
Notes:1 DPI is the sum of total revenues from earnings, capital income, private transfers, public social insurance and public social assistance -- net of taxes and social security contributions. Incomes were bottom-coded at 1% of the mean equivalized DPI and top-coded at 10 times the median unequivalized. 2 Net worth consists of financial assets and non-financial assets -- net of total debt. No bottom- or top-coding were applied.
3 Both income and wealth are equivalized; adjusted = unadjusted / square root of household size.4 All observations with missing or zero disposable income or missing net worth were dropped from the sample.5 Assets can be valued at time of interview of end of year.
Table 2. Median Income and Net Worth in Households Containing Elderly Persons vs. All Households

33
Panel A. Income Packages (ratio of means)1
All HouseholdsUnited States United
(SCF) Canada Finland Germany Italy2 Sweden KingdomEarnings 34 34 9 16 26 11 18Capital Income 23 9 15 10 6 10 12Private Transfers 17 22 57 5 12 14 24Public Social Assistance 27 35 19 69 56 65 46TOTAL 100 100 100 100 100 100 100
Panel B. Wealth Packages (ratio of overall means)3
All HouseholdsUnited States United
(SCF) Canada Finland Germany Italy Sweden KingdomFinancial Assets4 44 30 17 14 17 41 26Principal Residence 35 58 59 66 65 47 69Investment Real Estate 21 12 23 20 18 12 5Total Assets 100 100 100 100 100 100 100(Debt) 6 10 1 6 1 11 2(Net Worth) 94 90 99 94 99 89 98
Panel C. Wealth Packages for median household (ratio of means in middle of distribution)5
All HouseholdsUnited States United
(SCF) Canada Finland Germany Italy Sweden KingdomFinancial Assets4 24 18 12 53 10 51 26Principal Residence 70 76 82 44 84 41 73Investment Real Estate 6 6 7 4 6 8Total Assets 100 100 100 100 100 100 100(Debt) 12 20 2 5 2 11 6(Net Worth) 88 80 98 95 98 89 94Source: Authors' calculations from the Luxembourg Wealth Study.
Notes:1 Earnings include both wages and salaries and income from self-employment activities. Capital income includes interests and dividends, rental income, income from savings plans (including annuities from life insurance and private pensions), royalties and other property income. Private transfers include occupational and other pensions (e.g., pensions of unknown type or foreign pensions), alimony, regular transfers from other households/charity/private institutions, and other incomes not elsewhere classifiable. Public transfers include social insurance (including some universal benefits such as demo-grant pensions and family allowances) as well as public social assistance, which includes means-tested cash and near-cash public income transfers.2 Italy is net of taxes.3 Ratio of means is the ratio of the respective population means for each item.4 Financial assets include deposit accounts, stocks, bonds, and mutual funds. Non-financial assets include (owned) principal residence and investment real estate. Finally, total debt refers to all outstanding loans, both home-secured and non-home secured. 5 Median household is defined as having equivalized total assets between 40 to 60 percent of the distribution of all households. The ratio of means is the ratio of the respective means of the median household.
1
Table 3. Older Person's Income and Wealth Components:All Households with Elderly Persons as Head/Spouse
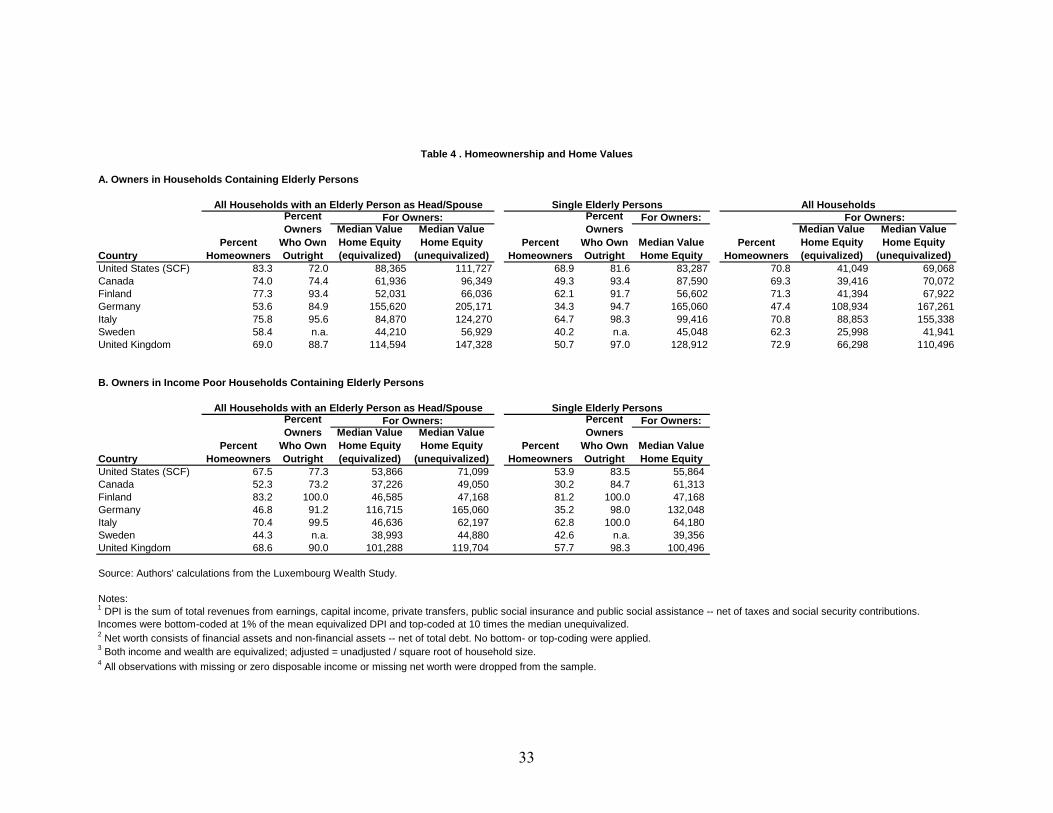
33
A. Owners in Households Containing Elderly Persons
All Households with an Elderly Person as Head/Spouse Single Elderly Persons All Households Percent For Owners: Percent For Owners: For Owners:Owners Median Value Median Value Owners Median Value Median Value
Percent Who Own Home Equity Home Equity Percent Who Own Median Value Percent Home Equity Home Equity Country Homeowners Outright (equivalized) (unequivalized) Homeowners Outright Home Equity Homeowners (equivalized) (unequivalized)United States (SCF) 83.3 72.0 88,365 111,727 68.9 81.6 83,287 70.8 41,049 69,068Canada 74.0 74.4 61,936 96,349 49.3 93.4 87,590 69.3 39,416 70,072Finland 77.3 93.4 52,031 66,036 62.1 91.7 56,602 71.3 41,394 67,922Germany 53.6 84.9 155,620 205,171 34.3 94.7 165,060 47.4 108,934 167,261Italy 75.8 95.6 84,870 124,270 64.7 98.3 99,416 70.8 88,853 155,338Sweden 58.4 n.a. 44,210 56,929 40.2 n.a. 45,048 62.3 25,998 41,941United Kingdom 69.0 88.7 114,594 147,328 50.7 97.0 128,912 72.9 66,298 110,496
B. Owners in Income Poor Households Containing Elderly Persons
All Households with an Elderly Person as Head/Spouse Single Elderly PersonsPercent For Owners: Percent For Owners:Owners Median Value Median Value Owners
Percent Who Own Home Equity Home Equity Percent Who Own Median Value Country Homeowners Outright (equivalized) (unequivalized) Homeowners Outright Home Equity United States (SCF) 67.5 77.3 53,866 71,099 53.9 83.5 55,864Canada 52.3 73.2 37,226 49,050 30.2 84.7 61,313Finland 83.2 100.0 46,585 47,168 81.2 100.0 47,168Germany 46.8 91.2 116,715 165,060 35.2 98.0 132,048Italy 70.4 99.5 46,636 62,197 62.8 100.0 64,180Sweden 44.3 n.a. 38,993 44,880 42.6 n.a. 39,356United Kingdom 68.6 90.0 101,288 119,704 57.7 98.3 100,496
Source: Authors' calculations from the Luxembourg Wealth Study.
Notes:1 DPI is the sum of total revenues from earnings, capital income, private transfers, public social insurance and public social assistance -- net of taxes and social security contributions. Incomes were bottom-coded at 1% of the mean equivalized DPI and top-coded at 10 times the median unequivalized. 2 Net worth consists of financial assets and non-financial assets -- net of total debt. No bottom- or top-coding were applied. 3 Both income and wealth are equivalized; adjusted = unadjusted / square root of household size.4 All observations with missing or zero disposable income or missing net worth were dropped from the sample.
Table 4 . Homeownership and Home Values

34
A. Households Containing Elderly Person as Head or Spouse and Households of All Ages
All Households with an Households of Elderly Person as Single Elderly Persons All Ages
Percent Median Percent Median Median with Median Value with Median Value Median Value
Financial Value for All Financial Value for All Value for AllCountry Assets ($ 2002) ($ 2002) Assets ($ 2002) ($ 2002) ($ 2002) ($ 2002)United States (SCF) 94.9 22,336 16,678 91.9 12,544 10,157 4398 3,321Canada 90.3 6,255 5,110 93.4 10,730 8,759 2,168 1,548Finland 91.1 4,686 3,694 88.9 3,396 2,830 2,723 2,316
3Germany 61.8 22,008 6,239 52.0 22,006 3,429 14,096 0Italy 75.3 8,968 5,022 67.4 8,699 3,728 7,143 5,022Sweden 85.7 21,061 15,702 76.9 15,958 8,764 6943 4,209United Kingdom 82.4 14,975 9,506 75.6 9,208 4,788 5954 3,131
2B. Income Poor Households Containing Elderly Persons as Head or Spouse and Households of All Ages
All Households with an Households of Elderly Person as Single Elderly Persons All Ages
Percent Median Percent Median Median with Median Value with Median Value Value
Financial Value for All Financial Value for All Median for AllCountry Assets ($ 2002) ($ 2002) Assets ($ 2002) ($ 2002) ($ 2002) ($ 2002)United States (SCF) 83.6 2,285 1,239 79.9 2,133 813 396 124Canada 76.0 1,517 540 86.8 1,664 920 310 114Finland 89.9 3,019 2,830 88.7 2,830 1,887 585 453
3Germany 28.7 11,004 0 34.7 11,006 0 6,353 0Italy 33.0 3,954 0 36.1 4,393 0 2,779 0Sweden 77.5 18,081 11,714 79.8 17,088 11,873 4,453 528United Kingdom 65.7 5,525 1,551 60.8 5,525 921 2,653 68Source: Authors' calculations from the Luxembourg Wealth Study.Notes: 1All values for financial wealth are equivalized using the square root (E=.5) equivalence scale.2The income poverty rate is defined as the percentage of persons living in households whose adjusted DPI is lower than 50% of the median DPI.3 Germany records liquid assets and non-housing debt only when they exceed 2,500 per year.
Table 5. Financial Asset Holdings1 for the Elderly and for All Households

34
All Households with an Elderly Person as Head/Spouse Single Elderly Persons
Percent Percent Owners Median Value Median Value Owners % of Singles
Percent Who Own Home Equity Home Equity Percent Who Own Median Value Income and Country Homeowners Outright (equivalized) (unequivalized) Homeowners Outright Home Equity Asset PoorUnited States (SCF) 59.5 68.0 38,089 54,848 43.3 76.0 55,864 22.1Canada 45.1 63.2 24,774 43,795 18.6 84.0 41,605 7.4Finland 73.7 (1) 100(1) 46,585 46,585 73.7 (1) 100(1) 46,585 10.7Germany 44.6 90.9 117,582 166,286 28.9 98.1 165,060 12.1Italy 69.1 99.7 37,281 62,135 63.0 100.0 62,135 13.4Sweden 41.6 n.a 38,993 44,880 42.9 n.a 39,356 5.0United Kingdom 61.8 87.1 97,605 110,496 53 97.1 101,288 15.4
Source: Authors' calculations from the Luxembourg Wealth Study.
Notes:
1 DPI is the sum of total revenues from earnings, capital income, private transfers, public social insurance and public social assistance -- net of taxes and social security contributions. Incomes were bottom-coded at 1% of the mean equivalized DPI and top-coded at 10 times the median unequivalized. 2 Net worth consists of financial assets and non-financial assets -- net of total debt. No bottom- or top-coding were applied. 3 Both income and wealth are equivalized; adjusted = unadjusted / square root of household size.4 All observations with missing or zero disposable income or missing net worth were dropped from the sample.
Table 6 . Homeownership and Home Values for Income and Asset Poor Owners in Households Containing Elderly Persons

34
Source: Authors' calculations from the Luxembourg Wealth Study.
5Neither are the fraction who are neither income nor asset poor.
Notes: 1Percent of all persons living in units containing an elderly person who are poor. Totals may not add to 100 due to rounding.2Income and asset poor are the fraction meeting both income and wealth povery criteria.3Income poor are those with disposable incomes less than 50 percent of overal median disposable income.4Asset poor are those with financial assets less than 25 percent of median financial assets.
15.43.9 3.9 8.3 9.8 9.6
7.8
4.6
5.3
20.546.4 49.2 36.8 33.9
27.4
30.5
56.348.4 44.7
52.3 54.365.4
54.5
2.71.3
2.2 2.5 1.9
0%
10%
20%
30%
40%
50%
60%
70%
80%
90%
100%
United States Canada Finland Germany Italy Sweden UnitedKingdom
Perc
ent P
oor1
Income and Asset Poor Income Poor Only Asset Poor Only Neither 2 3 4 5
Figure 1. Older Persons' Income and Asset Poverty

36
Figure 3. Homeownership, Home Values, and Education
A. Homeownership by Education Level of Head of Household for Older Households
B. Median Housing Equity for Homeowners by Education Level of Head of Household for Older
Source: Authors' calculations from the Luxembourg Wealth Study.
0
10
20
30
40
50
60
70
80
90
100
low medium high
United States Canada Finland GermanyItaly Sweden United Kingdom
-
50,000
100,000
150,000
200,000
250,000
low medium high
United States Canada Finland GermanyItaly Sweden United Kingdom
Figure 2. Net Worth, Financial Assets and Education
A. Median Net Worth by Education Level of Head of Household for Older Households
B. Median Financial Assets by Education Level of Head of Household for Older Households
Source: Authors' calculations from the Luxembourg Wealth Study.
-
50,000
100,000
150,000
200,000
250,000
300,000
low medium high
United States (SCF) Canada FinlandGermany Italy SwedenUnited Kingdom
-
10,000
20,000
30,000
40,000
50,000
60,000
70,000
80,000
low medium high
United States (SCF) Canada FinlandGermany Italy SwedenUnited Kingdom

37
Source: Authors' calculations from the Luxembourg Wealth Study.
0.0
50.0
100.0
150.0
200.0
250.0
300.0
350.0
1 2 3
DPI quartiles
,000
$
United States (SCF) Canada Finland Germany Italy Sweden United Kingdom
Figure 4. New Worth Medians by Quartiles of DPI(in thousands, 2002 USD)
4

38
Note: All values of income and wealth are equivalized.Source: Authors' calculations from the Luxembourg Wealth Study.
A. Top Net Worth Quartile Distribution by DPI Quartiles
B. Bottom Net Worth Quartile Distribution by DPI Quartiles
C. Middle Two Net Worth Quartile Distribution by DPI Quartiles
-5
5
15
25
35
45
55
65
75
85
1 2 3 4DPI Quartiles
%
-5
5
15
25
35
45
55
65
75
85
1 2 3 4DPI Quartiles
%
-5
5
15
25
35
45
55
65
75
85
1 2 3 4DPI Quartiles
%
United States (SCF) Canada FinlandGermany Italy SwedenUnited Kingdom
Figure 5. The Income Quartile Position with Top, Bottom and Middle Wealth Quartiles
RECENT WORKING PAPERS FROM THE CENTER FOR RETIREMENT RESEARCH AT BOSTON COLLEGE
Saving and Demographic Change: The Global Dimension Barry Bosworth and Gabriel Chodorow-Reich, February 2007 The Repeal of the Retirement Earnings Test and the Labor Supply of Older Men Gary V. Engelhardt and Anil Kumar, February 2007 Persistence in Labor Supply and the Response to the Social Security Earnings Test Leora Friedberg and Anthony Webb, December 2006 Annuitized Wealth and Consumption at Older Ages Barbara A. Butrica and Gordon B.T. Mermin, December 2006 Risk and Reward of International Investing for U.S. Retirement Savers: Historical Evidence Gary Burtless, December 2006 State Age Protection Laws and the Age Discrimination in Employment Act Joanna Lahey, November 2006 Age, Women, and Hiring: An Experimental Study Joanna Lahey, November 2006 Optimal Retirement Asset Decumulation Strategies: The Impact of Housing Wealth Anthony Webb, Robert Triest, and Wei Sun, November 2006 The Impact of Aggregate Mortality Rise on Defined Benefit Pension Plans Irena Dushi, Leora Friedberg, and Anthony Webb, November 2006 Health Care Costs, Taxes, and the Retirement Decision: Conceptual Issues and Illustrative Simulations Rudolph G. Penner and Richard W. Johnson, November 2006 Why Do Boomers Plan to Work So Long? Gordon B.T. Mermin, Richard W. Johnson, and Dan Murphy, November 2006
All working papers are available on the Center for Retirement Research website (http://www.bc.edu/crr) and can be requested by e-mail ([email protected]) or phone (617-552-1762).